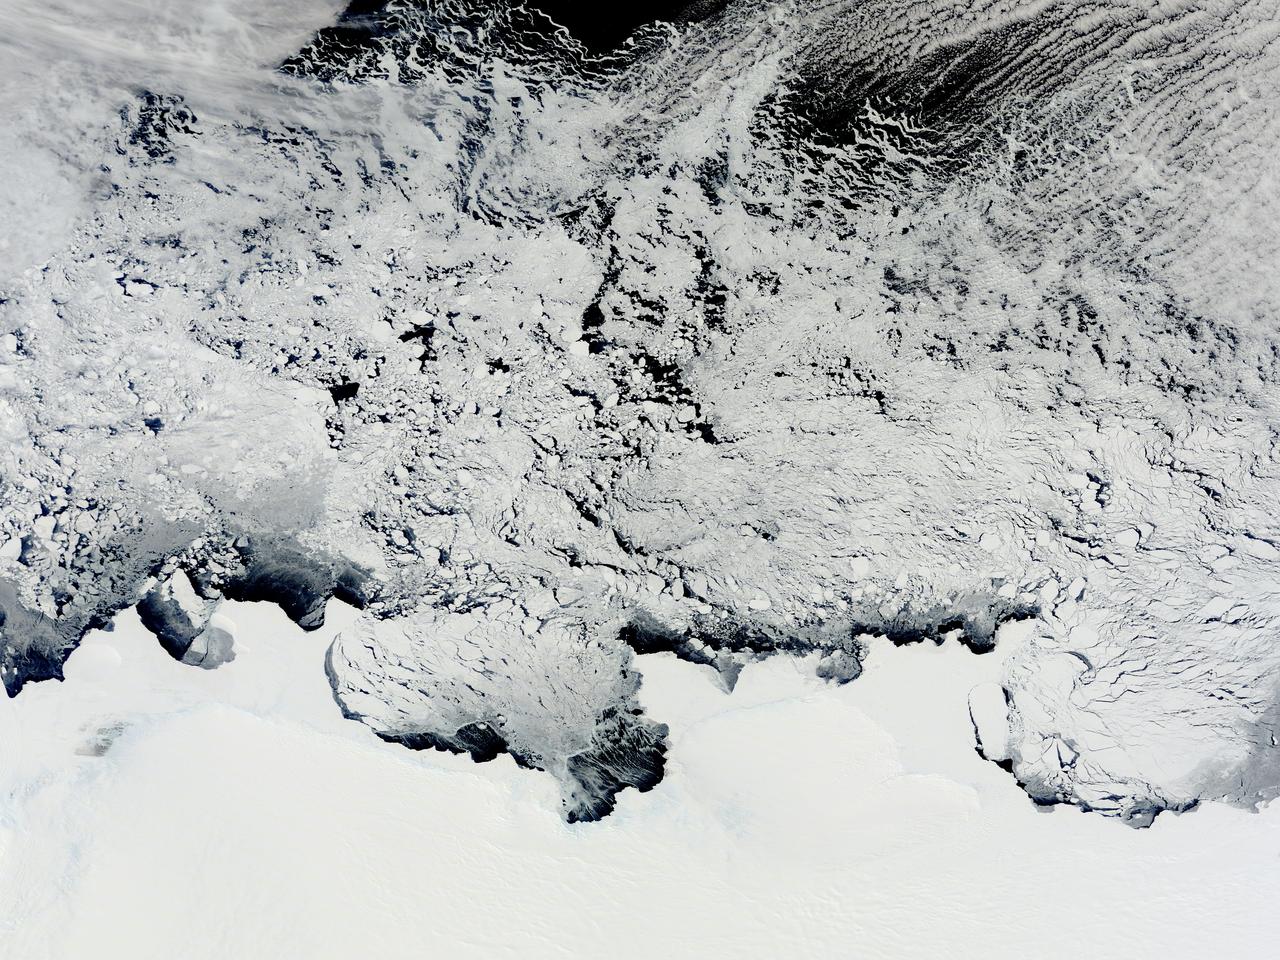
NASA image acquired November 2, 2011 The Moderate Resolution Imaging Spectroradiometer (MODIS) instrument on NASA's Terra satellite captured this image of the Knox, Budd Law Dome, and Sabrina Coasts, Antarctica on November 2, 2011 at 01:40 UTC (Nov. 1 at 9:40 p.m. EDT). Operation Ice Bridge is exploring Antarctic ice, and more information can be found at <a href="http://www.nasa.gov/icebridge" rel="nofollow">www.nasa.gov/icebridge</a>. Image Credit: NASA Goddard MODIS Rapid Response Team <b><a href="http://www.nasa.gov/audience/formedia/features/MP_Photo_Guidelines.html" rel="nofollow">NASA image use policy.</a></b> <b><a href="http://www.nasa.gov/centers/goddard/home/index.html" rel="nofollow">NASA Goddard Space Flight Center</a></b> enables NASA’s mission through four scientific endeavors: Earth Science, Heliophysics, Solar System Exploration, and Astrophysics. Goddard plays a leading role in NASA’s accomplishments by contributing compelling scientific knowledge to advance the Agency’s mission. <b>Follow us on <a href="http://twitter.com/NASA_GoddardPix" rel="nofollow">Twitter</a></b> <b>Like us on <a href="http://www.facebook.com/pages/Greenbelt-MD/NASA-Goddard/395013845897?ref=tsd" rel="nofollow">Facebook</a></b> <b>Find us on <a href="http://instagrid.me/nasagoddard/?vm=grid" rel="nofollow">Instagram</a></b>
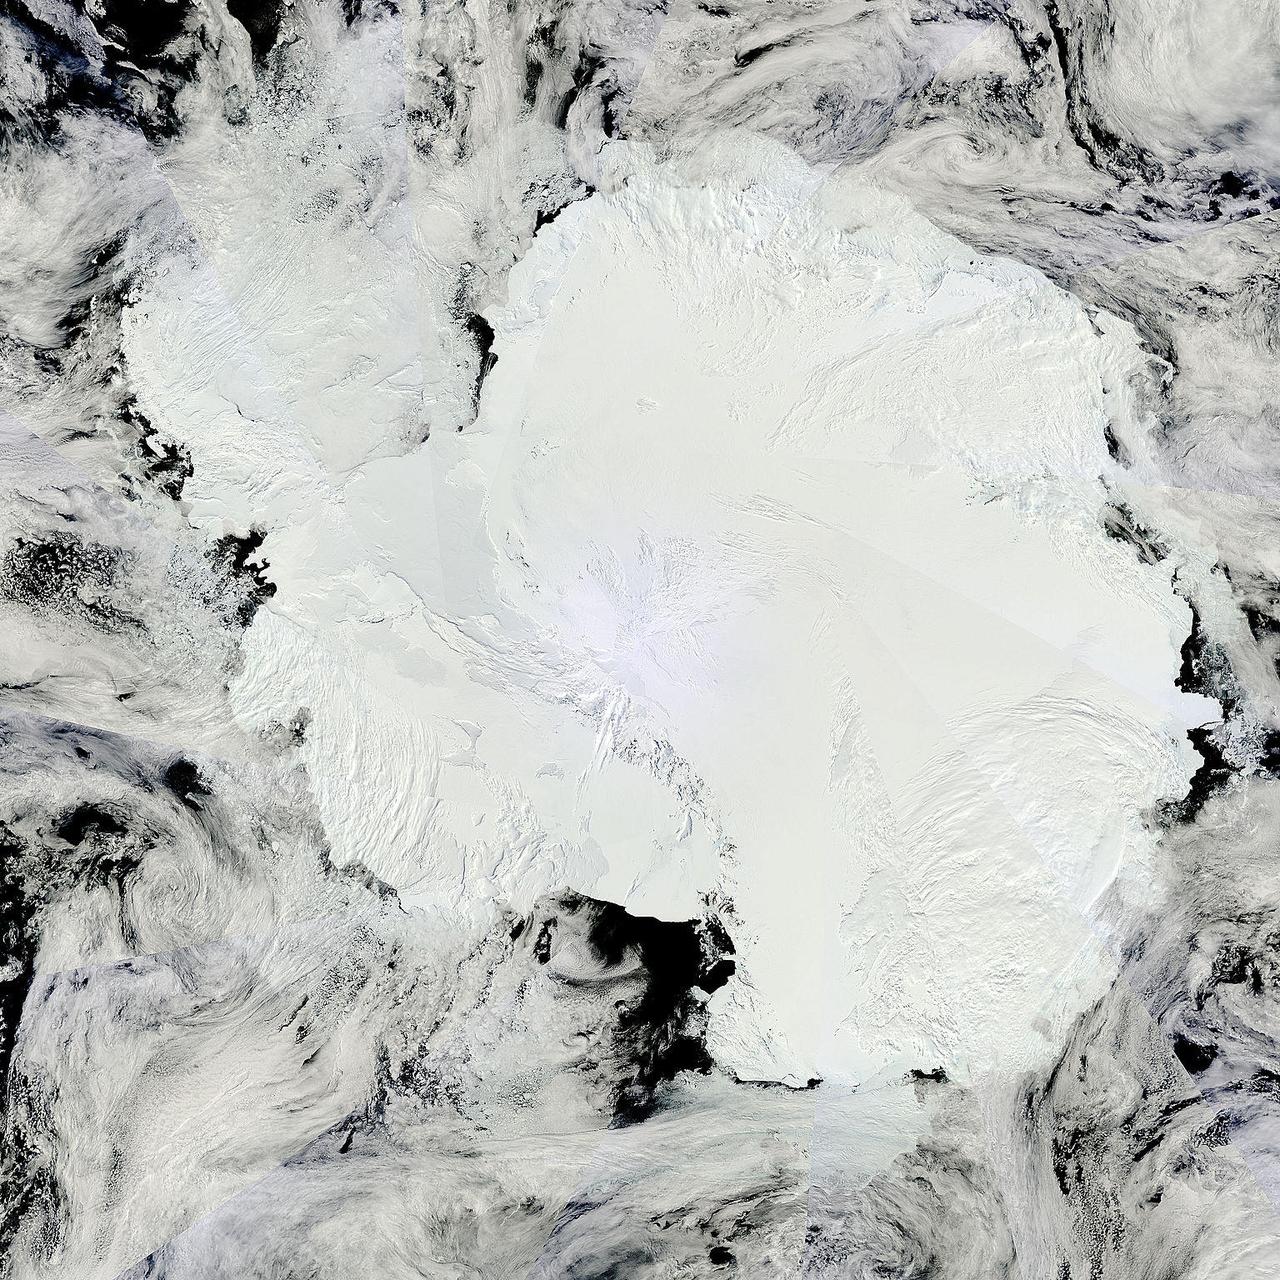
Antarctica is the coldest, driest and windiest place on Earth – and, during the austral summer, it is also the sunniest. Due to the tilt of the Earth’s axis in relation of the sun, the frozen land south of the Antarctic Circle receives six months of daylight in summertime, and six months of darkness in winter. The long hours of sunshine allow for excellent imagery of the region from space. This true-color mosaic of Antarctica was created from images acquired by multiple passes of the Moderate Resolution Imaging Spectroradiometer (MODIS) aboard the Terra satellite on December 16, 2013. Because Terra is in a polar orbit, it passes over each pole approximately 14 times a day, and acquires an image on each pass. To create a mosaic, the data that are closest to the center of each swath – where edge distortion is minimized – are used to create a complete view of the region. The MODIS Rapid Response system generates complete mosaic images of Antarctica every day in austral late spring, summer and early fall. Because the light is poor in austral late fall, winter and early spring, MODIS images are not created during that period. A mosaic of Antarctica can be found for any given day at NASA’s Project Antarctica at <a href="http://rapidfire.sci.gsfc.nasa.gov/subsets/?project=antarctica" rel="nofollow">rapidfire.sci.gsfc.nasa.gov/subsets/?project=antarctica</a> Credit: NASA/GSFC/Jeff Schmaltz/MODIS Land Rapid Response Team <b><a href="http://www.nasa.gov/audience/formedia/features/MP_Photo_Guidelines.html" rel="nofollow">NASA image use policy.</a></b> <b><a href="http://www.nasa.gov/centers/goddard/home/index.html" rel="nofollow">NASA Goddard Space Flight Center</a></b> enables NASA’s mission through four scientific endeavors: Earth Science, Heliophysics, Solar System Exploration, and Astrophysics. Goddard plays a leading role in NASA’s accomplishments by contributing compelling scientific knowledge to advance the Agency’s mission. <b>Follow us on <a href="http://twitter.com/NASA_GoddardPix" rel="nofollow">Twitter</a></b> <b>Like us on <a href="http://www.facebook.com/pages/Greenbelt-MD/NASA-Goddard/395013845897?ref=tsd" rel="nofollow">Facebook</a></b> <b>Find us on <a href="http://instagram.com/nasagoddard?vm=grid" rel="nofollow">Instagram</a></b>
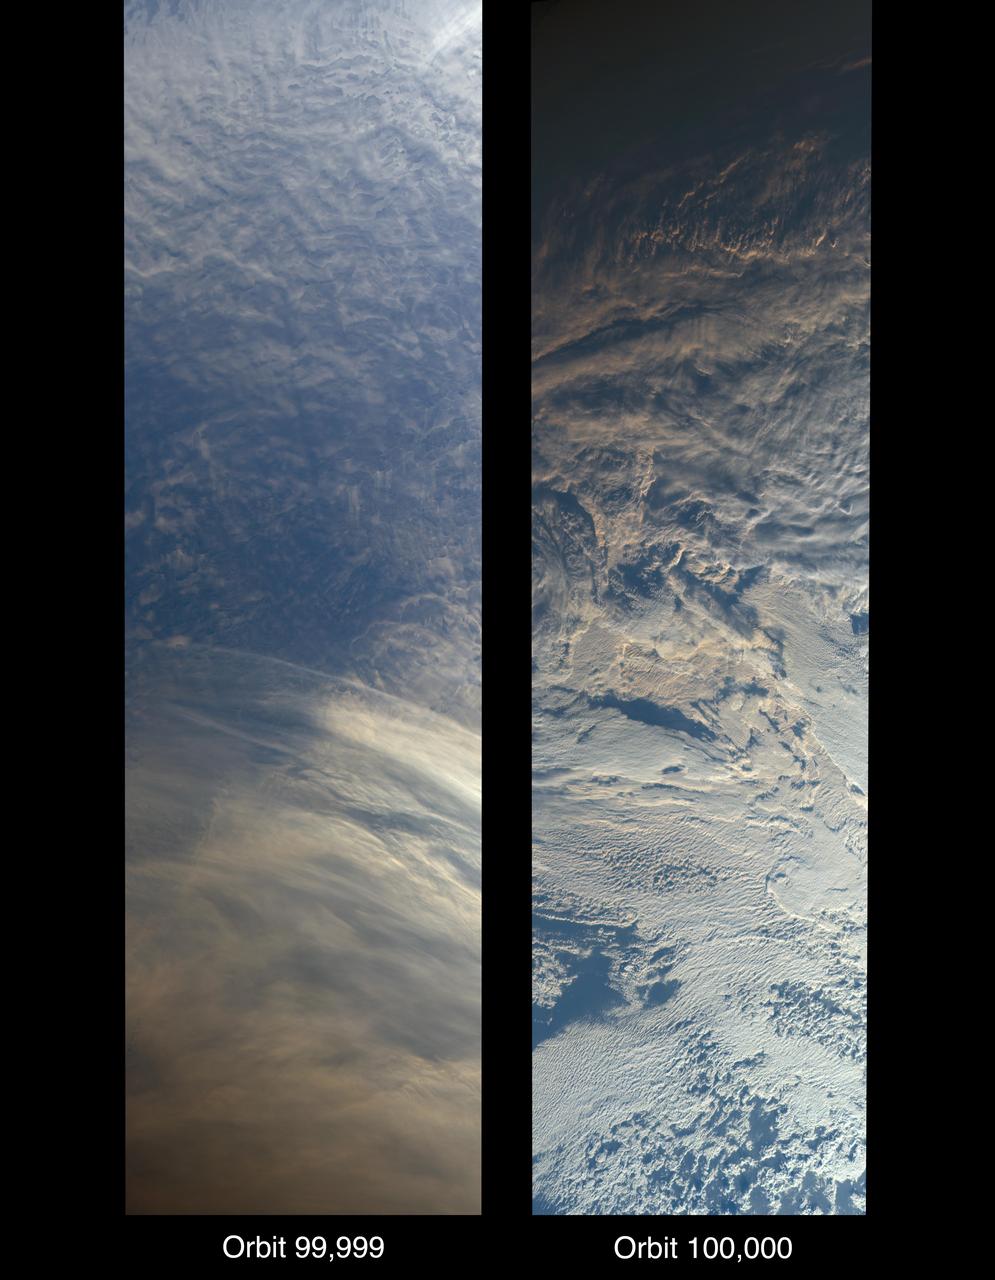
On Oct. 6, 2018, NASA's Terra satellite became one of a handful of NASA satellite ever to complete 100,000 orbits. Launched in 1999, Terra and its five scientific instruments were originally slated to last six years. More than 18 years later, the Multi-angle Imaging SpectroRadiometer (MISR), built by NASA's Jet Propulsion Laboratory in Pasadena, California, and other instruments on Terra are still collecting data and are expected to continue into the 2020s, limited only by the amount of fuel in the spacecraft. MISR carries nine cameras that view the sunlit Earth simultaneously at widely spaced angles, providing global coverage with high spatial detail. The left image shows dusk falling over snowy Queen Maud Land, Antarctica, at the end of orbit 99,999, as captured by MISR's 70-degree backward-looking camera. On the right is MISR's first view from orbit 100,000, taken by its 70-degree forward-looking camera as sunrise illuminated clouds over the Kara Sea, north of Siberia. Over the years, researchers have used MISR's observations to construct a variety of global data sets that have advanced our understanding of Earth. These include the heights of clouds and wildfire smoke, the amounts of dangerous pollutants in the atmosphere, the movements of global wind systems, and the health of vegetation. The instrument remains as healthy as it was in 1999. https://photojournal.jpl.nasa.gov/catalog/PIA22836
A rift in Antarctica's Larsen C ice shelf has grown to 110 miles (175 km) long, making it inevitable that an iceberg larger than Rhode Island will soon calve from the ice shelf. Larsen C is the fourth largest ice shelf in Antarctica, with an area of almost 20,000 square miles (50,000 square kilometers). The calving event will remove approximately 10 percent of the ice shelf's mass, according to the Project for Impact of Melt on Ice Shelf Dynamics and Stability (MIDAS), a UK-based team studying the ice shelf. Only 12 miles (20 km) of ice now separates the end of the rift from the ocean. The rift has grown at least 30 miles (50 km) in length since August, but appears to be slowing recently as Antarctica returns to polar winter. Project MIDAS reports that the calving event might destabilize the ice shelf, which could result in a collapse similar to what occurred to the Larsen B ice shelf in 2002. The Multi-angle Imaging SpectroRadiometer (MISR) instrument aboard NASA's Terra satellite captured views of Larsen C on August 22, 2016, when the rift was 80 miles (130 km) in length; December 8, 2016, when the rift was approximately 90 miles (145 km) long; and April 6, 2017. The MISR instrument has nine cameras, which view the Earth at different angles. The overview image, from December 8, shows the entire Antarctic Peninsula -- home to Larsen A, B, and C ice shelves -- in natural color (similar to how it would appear to the human eye) from MISR's vertical-viewing camera. Combining information from several MISR cameras pointed at different angles gives information about the texture of the ice. The accompanying GIF depicts the inset area shown on the larger image and displays data from all three dates in false color. These multiangular views -- composited from MISR's 46-degree backward-pointing camera, the nadir (vertical-viewing) camera, and the 46-degree forward-pointing camera -- represent variations in ice texture as changes in color, such that areas of rough ice appear orange and smooth ice appears blue. The Larsen C shelf is on the left in the GIF, bordered by the Weddell Sea on the upper right. The ice within the rift is orange, indicating movement, and the end of the rift can be tracked across the shelf between images. In addition, between December and April, the rift widened, pushing the future iceberg away from the shelf at its southern end. These data were acquired during Terra orbits 88717, 90290 and 92023. https://photojournal.jpl.nasa.gov/catalog/PIA21581

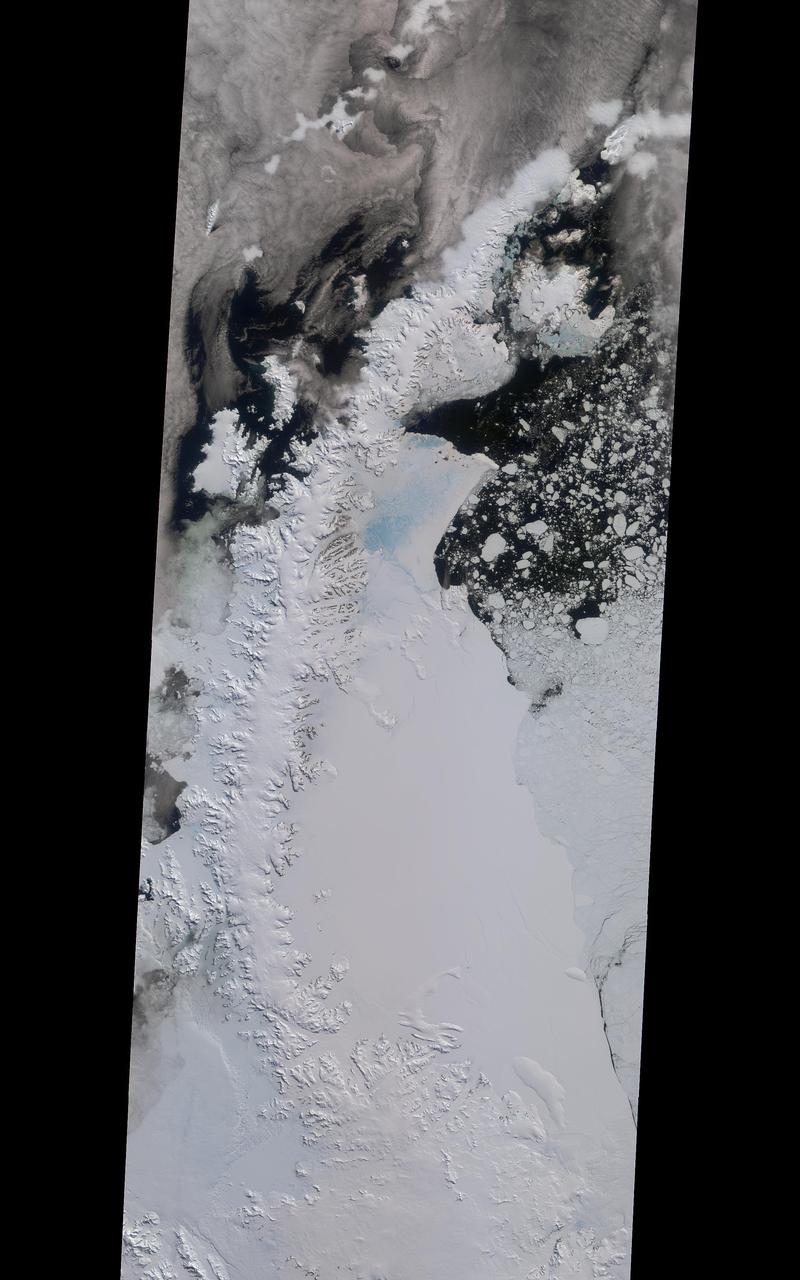
On April 5, 2015, the Moderate Resolution Imaging Spectroradiometer (MODIS) on NASA’s Terra satellite acquired this natural-color image of sea ice off the coast of East Antarctica’s Princess Astrid Coast. White areas close to the continent are sea ice, while white areas in the northeast corner of the image are clouds. One way to better distinguish ice from clouds is with false-color imagery. In the false-color view of the scene here, ice is blue and clouds are white. The image was acquired after Antarctic sea ice had passed its annual minimum extent (reached on February 20, 2015), and had resumed expansion toward its maximum extent (usually reached in September). Credit: NASA image by Jeff Schmaltz, LANCE/EOSDIS Rapid Response. Caption by Kathryn Hansen via NASA's Earth Observatory Read more: <a href="http://www.nasa.gov/content/sea-ice-off-east-antarcticas-princess-astrid-coast/" rel="nofollow">www.nasa.gov/content/sea-ice-off-east-antarcticas-princes...</a> <b><a href="http://www.nasa.gov/audience/formedia/features/MP_Photo_Guidelines.html" rel="nofollow">NASA image use policy.</a></b> <b><a href="http://www.nasa.gov/centers/goddard/home/index.html" rel="nofollow">NASA Goddard Space Flight Center</a></b> enables NASA’s mission through four scientific endeavors: Earth Science, Heliophysics, Solar System Exploration, and Astrophysics. Goddard plays a leading role in NASA’s accomplishments by contributing compelling scientific knowledge to advance the Agency’s mission. <b>Follow us on <a href="http://twitter.com/NASAGoddardPix" rel="nofollow">Twitter</a></b> <b>Like us on <a href="http://www.facebook.com/pages/Greenbelt-MD/NASA-Goddard/395013845897?ref=tsd" rel="nofollow">Facebook</a></b> <b>Find us on <a href="http://instagrid.me/nasagoddard/?vm=grid" rel="nofollow">Instagram</a></b>
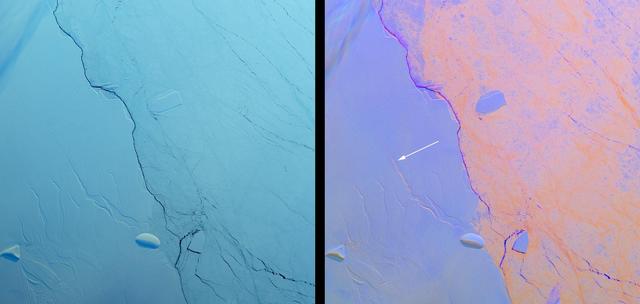
Project MIDAS, a United Kingdom-based group that studies the Larsen Ice Shelf in Antarctica, reported Aug. 18, 2016, that a large crack in the Larsen C shelf has grown by another 13 miles (22 kilometers) in the past six months. The crack is now more than 80 miles (130 kilometers) long. Larsen C is the fourth largest ice shelf in Antarctica, with an area of about 19,300 square miles (50,000 square kilometers), greater than the size of Maryland. Computer modeling by Project MIDAS predicts that the crack will continue to grow and eventually cause between nine and twelve percent of the ice shelf to collapse, resulting in the loss of 2,300 square miles (6,000 square kilometers) of ice -- more than the area of Delaware. This follows the collapse of the Larsen B shelf in 2002 and the Larsen A shelf in 1995, which removed about 1,255 square miles (3,250 square kilometers) and 580 square miles (1,500 square kilometers) of ice, respectively. The Multiangle Imaging SpectroRadiometer (MISR) instrument aboard NASA's Terra satellite flew over Larsen C on Aug. 22, 2016. The MISR instrument views Earth with nine cameras pointed at different angles, which provides information about the texture of the surface. On the left is a natural-color image of the shelf from MISR's vertical-viewing camera. Antarctica is slowly emerging from its polar night, and the low light gives the scene a bluish tint. The Larsen C shelf is on the left, while thinner sea ice is present on the right. A variety of cracks are visible in the Larsen C shelf, all appearing roughly the same. The image is about 130 by 135 miles (210 by 220 kilometers) in size. On the right is a composite image made by combining data from MISR's 46-degree backward-pointing camera (plotted as blue), the vertical-pointing camera (plotted as green), and the 46-degree forward-pointing camera (plotted as red). This has the effect of highlighting surface roughness; smooth surfaces appear as blue-purple, while rough surfaces appear as orange. Clouds near the upper left appear multi-hued because their elevation above the surface causes the different angular views to be slightly displaced. In this composite, the difference between the rough sea ice and the smoother ice shelf is immediately apparent. An examination of the cracks in the ice shelf shows that the large crack Project MIDAS is tracking (indicated by an arrow) is orange in color, demonstrating that it is actively growing. These data were acquired during Terra orbit 88717 http://photojournal.jpl.nasa.gov/catalog/PIA20894

A view looking over the payload – the instruments that fly under a balloon – while the BARREL balloon inflates. The orange parachute lies on the ground in front of the payload, while most of the balloon length can be seen stretched along the ground toward the part being inflated. Credit: NASA/Goddard/BARREL Read more: <a href="http://www.nasa.gov/content/goddard/nasas-barrel-returns-successful-from-antarctica" rel="nofollow">www.nasa.gov/content/goddard/nasas-barrel-returns-success...</a> -- Three months, 20 balloons, and one very successful campaign. The team for NASA's BARREL – short for Balloon Array for Radiation belt Relativistic Electron Losses -- mission returned from Antarctica in March 2014. BARREL's job is to help unravel the mysterious Van Allen belts, two gigantic donuts of radiation that surround Earth, which can shrink and swell in response to incoming energy and particles from the sun and sometimes expose satellites to harsh radiation. While in Antarctica, the team launched 20 balloons carrying instruments that sense charged particles that are scattered into the atmosphere from the belts, spiraling down the magnetic fields near the South Pole. Each balloon traveled around the pole for up to three weeks. The team will coordinate the BARREL data with observations from NASA's two Van Allen Probes to better understand how occurrences in the belts relate to bursts of particles funneling down toward Earth. BARREL team members will be on hand at the USA Science and Engineering Festival in DC on April 26 and 27, 2014 for the exhibit Space Balloons: Exploring the Extremes of Space Weather. <b><a href="http://www.nasa.gov/audience/formedia/features/MP_Photo_Guidelines.html" rel="nofollow">NASA image use policy.</a></b><b><a href="http://www.nasa.gov/centers/goddard/home/index.html" rel="nofollow">NASA Goddard Space Flight Center</a></b> enables NASA’s mission through four scientific endeavors: Earth Science, Heliophysics, Solar System Exploration, and Astrophysics. Goddard plays a leading role in NASA’s accomplishments by contributing compelling scientific knowledge to advance the Agency’s mission.<b>Follow us on <a href="http://twitter.com/NASAGoddardPix" rel="nofollow">Twitter</a></b><b>Like us on <a href="http://www.facebook.com/pages/Greenbelt-MD/NASA-Goddard/395013845897?ref=tsd" rel="nofollow">Facebook</a></b><b>Find us on <a href="http://instagram.com/nasagoddard?vm=grid" rel="nofollow">Instagram</a></b>
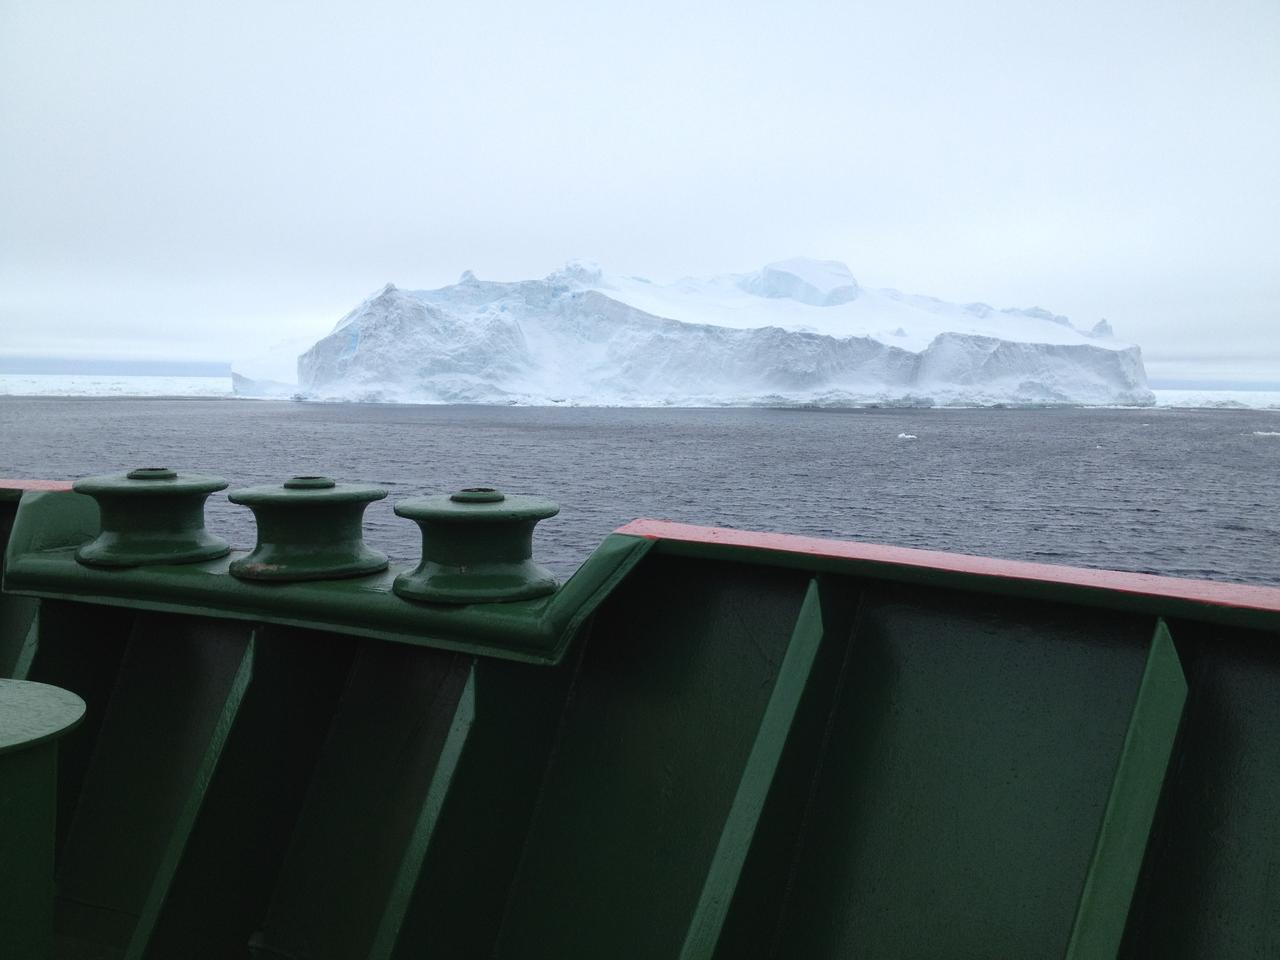
An iceberg as viewed from the bow of the RRS Ernest Shackleton a few days before the BARREL team reached Halley Research Station in Antarctica. This research vessel regularly carries scientists and supplies to Halley. Credit: NASA --- In Antarctica in January, 2013 – the summer at the South Pole – scientists launched 20 balloons up into the air to study an enduring mystery of space weather: when the giant radiation belts surrounding Earth lose material, where do the extra particles actually go? The mission is called BARREL (Balloon Array for Radiation belt Relativistic Electron Losses) and it is led by physicist Robyn Millan of Dartmouth College in Hanover, NH. Millan provided photographs from the team’s time in Antarctica. The team launched a balloon every day or two into the circumpolar winds that circulate around the pole. Each balloon floated for anywhere from 3 to 40 days, measuring X-rays produced by fast-moving electrons high up in the atmosphere. BARREL works hand in hand with another NASA mission called the Van Allen Probes, which travels through the Van Allen radiation belts surrounding Earth. The belts wax and wane over time in response to incoming energy and material from the sun, sometimes intensifying the radiation through which satellites must travel. Scientists wish to understand this process better, and even provide forecasts of this space weather, in order to protect our spacecraft. As the Van Allen Probes were observing what was happening in the belts, BARREL tracked electrons that precipitated out of the belts and hurtled down Earth’s magnetic field lines toward the poles. By comparing data, scientists will be able to track how what’s happening in the belts correlates to the loss of particles – information that can help us understand this mysterious, dynamic region that can impact spacecraft. Having launched balloons in early 2013, the team is back at home building the next set of payloads. They will launch 20 more balloons in 2014. <b><a href="http://www.nasa.gov/audience/formedia/features/MP_Photo_Guidelines.html" rel="nofollow">NASA image use policy.</a></b> <b><a href="http://www.nasa.gov/centers/goddard/home/index.html" rel="nofollow">NASA Goddard Space Flight Center</a></b> enables NASA’s mission through four scientific endeavors: Earth Science, Heliophysics, Solar System Exploration, and Astrophysics. Goddard plays a leading role in NASA’s accomplishments by contributing compelling scientific knowledge to advance the Agency’s mission. <b>Follow us on <a href="http://twitter.com/NASA_GoddardPix" rel="nofollow">Twitter</a></b> <b>Like us on <a href="http://www.facebook.com/pages/Greenbelt-MD/NASA-Goddard/395013845897?ref=tsd" rel="nofollow">Facebook</a></b> <b>Find us on <a href="http://instagram.com/nasagoddard?vm=grid" rel="nofollow">Instagram</a></b>
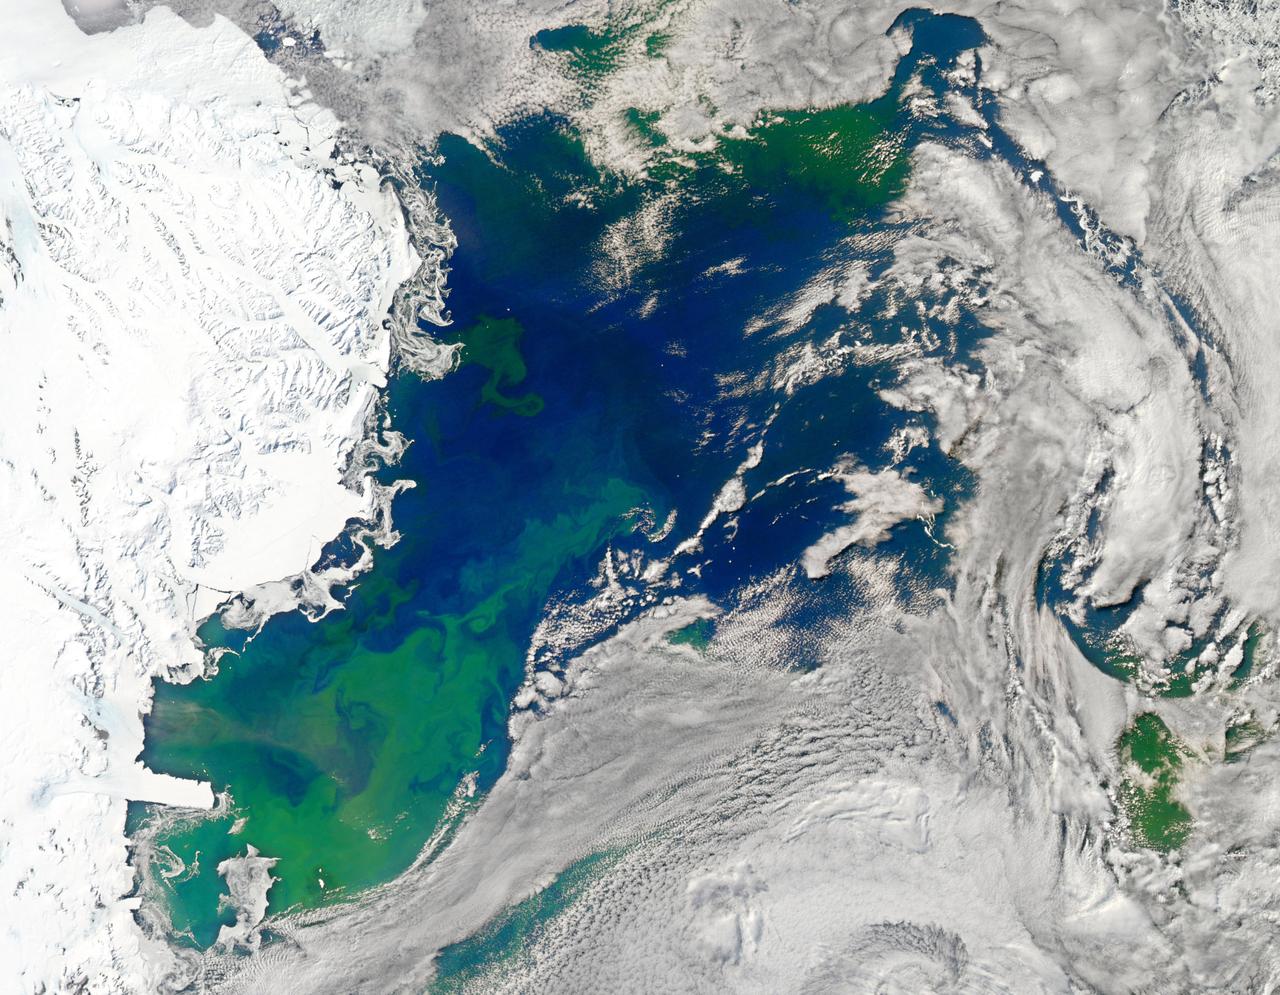
NASA image acquired January 22, 2011 To view the full image go to: <a href="http://www.flickr.com/photos/gsfc/5397636843">www.flickr.com/photos/gsfc/5397636843</a> Every southern spring and summer, after the Sun has risen into its 24-hour circuit around the skies of Antarctica, the Ross Sea bursts with life. Floating, microscopic plants, known as phytoplankton, soak up the sunlight and the nutrients stirring in the Southern Ocean and grow into prodigious blooms. Those blooms become a great banquet for krill, fish, penguins, whales, and other marine species who carve out a living in the cool waters of the far south. This true-color image captures such a bloom in the Ross Sea on January 22, 2011, as viewed by the Moderate Resolution Imaging Spectroradiometer (MODIS) on NASA’s Aqua satellite. Bright greens of plant-life have replaced the deep blues of open ocean water. The Ross Sea is a relatively shallow bay in the Antarctic coastline and due south from New Zealand. As the spring weather thaws the sea ice around Antarctica, areas of open water surrounded by ice—polynyas—open up on the continental shelf. In this open water, sunlight provides the fuel and various current systems provide nutrients from deeper waters to form blooms that can stretch 100 to 200 kilometers (60 to 120 miles). These blooms are among the largest in extent and abundance in the world. Scientists have hypothesized that the Modified Circumpolar Deep Water is the engine behind the blooms, stirring up just the right mix of trace metals and minerals from the deep to sustain plankton growth. This month, researchers aboard the U.S. icebreaking ship Nathaniel B. Palmer are cruising in the Ross Sea in search of the signatures of this current system. NASA image courtesy Norman Kuring, Ocean Color Team at NASA Goddard Space Flight Center. Caption by Mike Carlowicz, with information from Hugh Powell, COSEE-NOW. Instrument: Aqua - MODIS For more info go to: <a href="http://earthobservatory.nasa.gov/IOTD/view.php?id=48949" rel="nofollow">earthobservatory.nasa.gov/IOTD/view.php?id=48949</a> Credit: <b><a href="http://www.earthobservatory.nasa.gov/" rel="nofollow"> NASA Earth Observatory</a></b> <b><a href="http://www.nasa.gov/centers/goddard/home/index.html" rel="nofollow">NASA Goddard Space Flight Center</a></b> enables NASA’s mission through four scientific endeavors: Earth Science, Heliophysics, Solar System Exploration, and Astrophysics. Goddard plays a leading role in NASA’s accomplishments by contributing compelling scientific knowledge to advance the Agency’s mission. <b>Follow us on <a href="http://twitter.com/NASA_GoddardPix" rel="nofollow">Twitter</a></b> <b>Join us on <a href="http://www.facebook.com/pages/Greenbelt-MD/NASA-Goddard/395013845897?ref=tsd" rel="nofollow">Facebook</a></b>
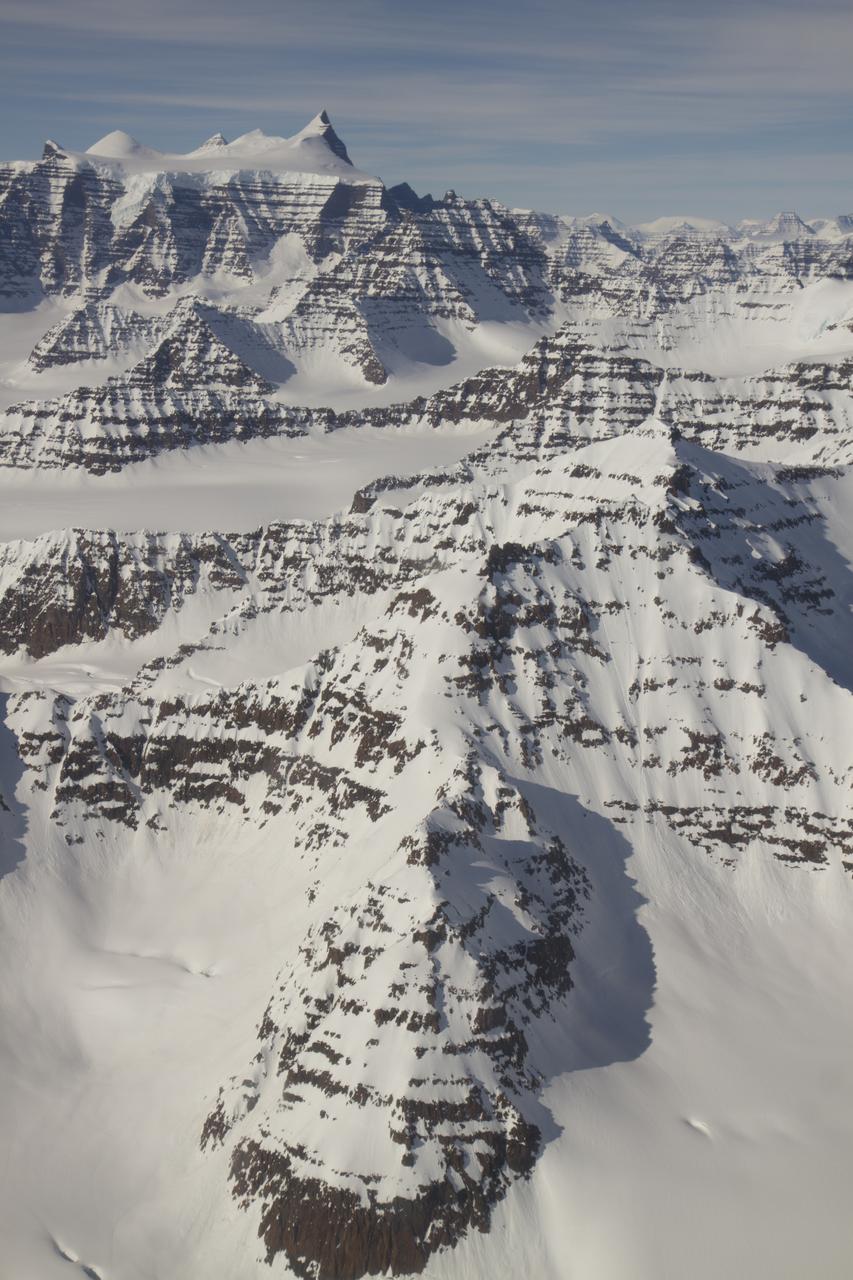
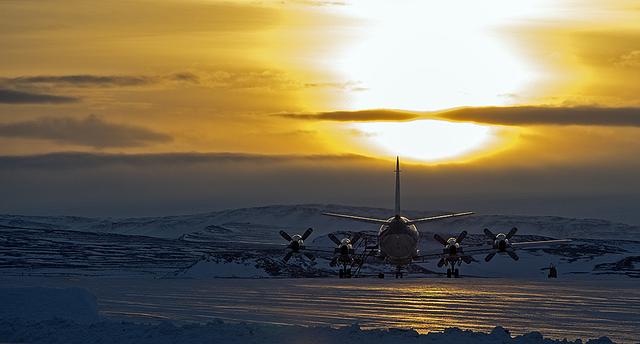
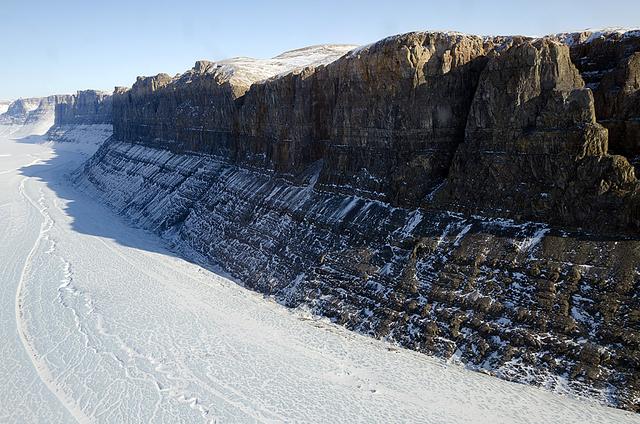
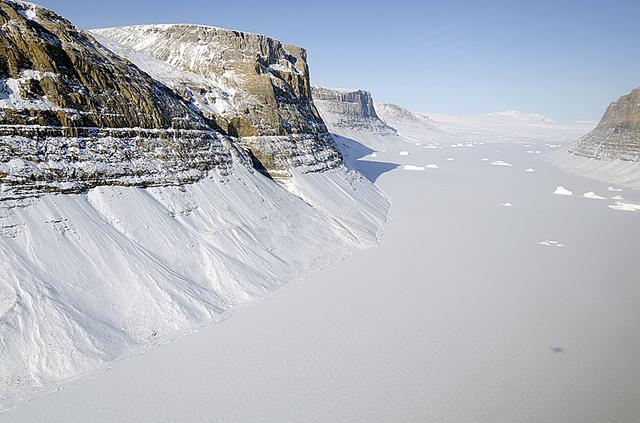
A wider view of mountains showing the distinctive geology of the Geikie Plateau region in eastern Greenland, as seen from NASA's P-3B aircraft on April 16, 2012. Credit: NASA/GSFC/Jefferson Beck =========== IceBridge, a six-year NASA mission, is the largest airborne survey of Earth's polar ice ever flown. It will yield an unprecedented three-dimensional view of Arctic and Antarctic ice sheets, ice shelves and sea ice. These flights will provide a yearly, multi-instrument look at the behavior of the rapidly changing features of the Greenland and Antarctic ice. Data collected during IceBridge will help scientists bridge the gap in polar observations between NASA's Ice, Cloud and Land Elevation Satellite (ICESat) -- in orbit since 2003 -- and ICESat-2, planned for early 2016. ICESat stopped collecting science data in 2009, making IceBridge critical for ensuring a continuous series of observations. IceBridge will use airborne instruments to map Arctic and Antarctic areas once a year. IceBridge flights are conducted in March-May over Greenland and in October-November over Antarctica. Other smaller airborne surveys around the world are also part of the IceBridge campaign. To read more about IceBridge - Arctic 2012 go to: <a href="http://www.nasa.gov/mission_pages/icebridge/index.html" rel="nofollow">www.nasa.gov/mission_pages/icebridge/index.html</a> <b><a href="http://www.nasa.gov/audience/formedia/features/MP_Photo_Guidelines.html" rel="nofollow">NASA image use policy.</a></b> <b><a href="http://www.nasa.gov/centers/goddard/home/index.html" rel="nofollow">NASA Goddard Space Flight Center</a></b> enables NASA’s mission through four scientific endeavors: Earth Science, Heliophysics, Solar System Exploration, and Astrophysics. Goddard plays a leading role in NASA’s accomplishments by contributing compelling scientific knowledge to advance the Agency’s mission. <b>Follow us on <a href="http://twitter.com/NASA_GoddardPix" rel="nofollow">Twitter</a></b> <b>Like us on <a href="http://www.facebook.com/pages/Greenbelt-MD/NASA-Goddard/395013845897?ref=tsd" rel="nofollow">Facebook</a></b> <b>Find us on <a href="http://instagrid.me/nasagoddard/?vm=grid" rel="nofollow">Instagram</a></b>
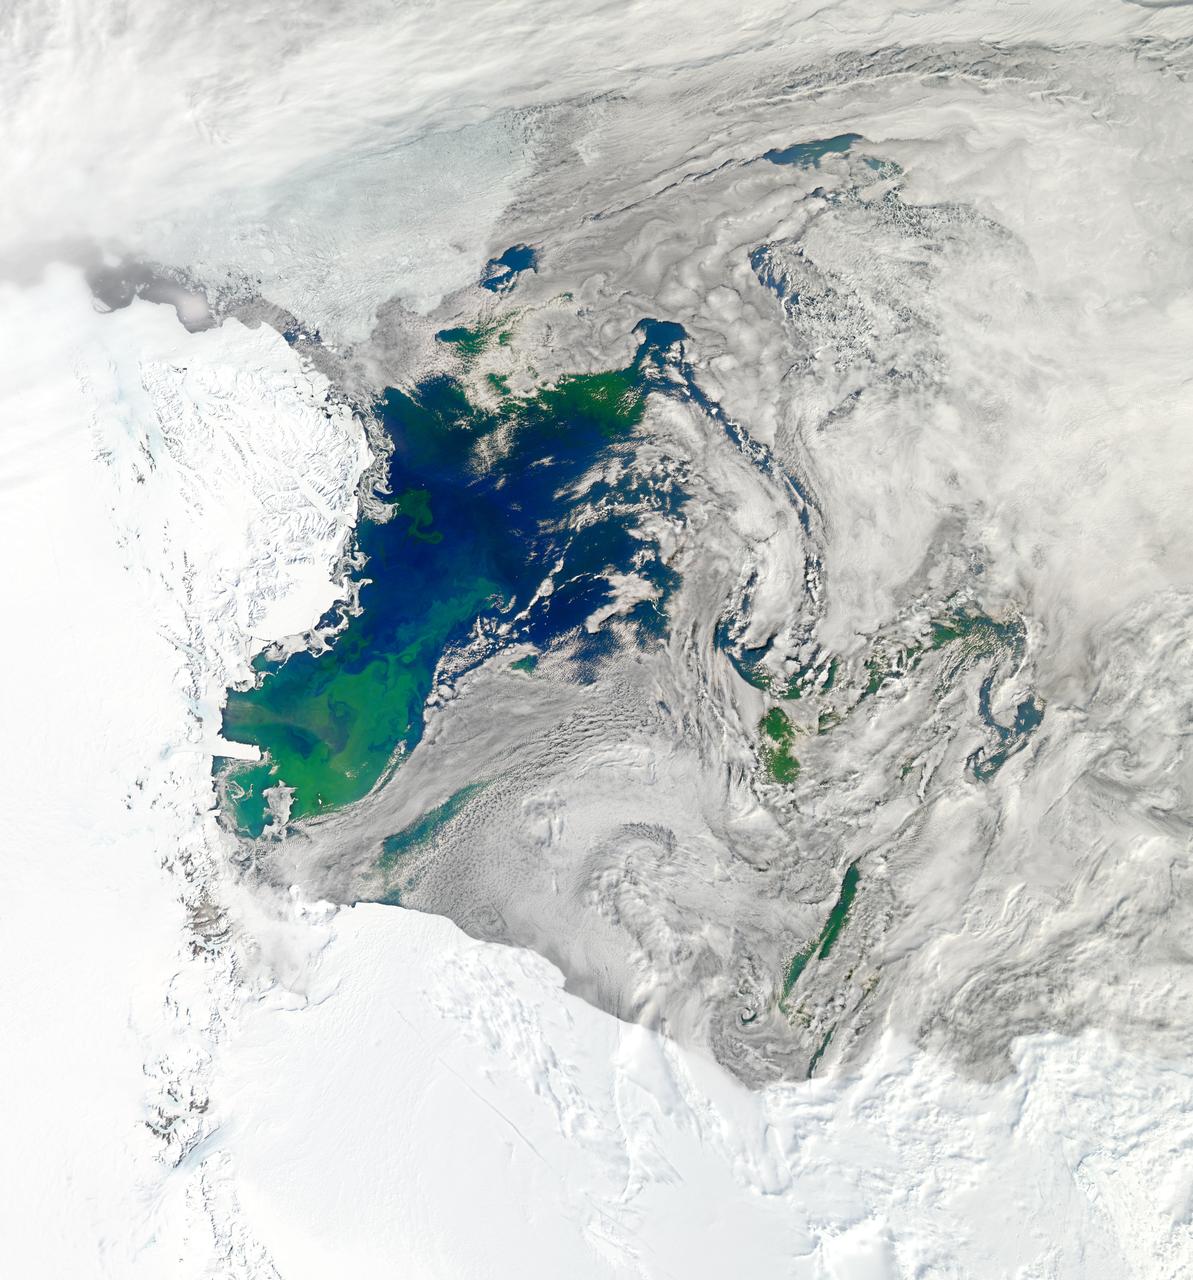
NASA image acquired January 22, 2011 To see a detail of this image go to: <a href="http://www.flickr.com/photos/gsfc/5398237910">www.flickr.com/photos/gsfc/5398237910</a> Every southern spring and summer, after the Sun has risen into its 24-hour circuit around the skies of Antarctica, the Ross Sea bursts with life. Floating, microscopic plants, known as phytoplankton, soak up the sunlight and the nutrients stirring in the Southern Ocean and grow into prodigious blooms. Those blooms become a great banquet for krill, fish, penguins, whales, and other marine species who carve out a living in the cool waters of the far south. This true-color image captures such a bloom in the Ross Sea on January 22, 2011, as viewed by the Moderate Resolution Imaging Spectroradiometer (MODIS) on NASA’s Aqua satellite. Bright greens of plant-life have replaced the deep blues of open ocean water. The Ross Sea is a relatively shallow bay in the Antarctic coastline and due south from New Zealand. As the spring weather thaws the sea ice around Antarctica, areas of open water surrounded by ice—polynyas—open up on the continental shelf. In this open water, sunlight provides the fuel and various current systems provide nutrients from deeper waters to form blooms that can stretch 100 to 200 kilometers (60 to 120 miles). These blooms are among the largest in extent and abundance in the world. Scientists have hypothesized that the Modified Circumpolar Deep Water is the engine behind the blooms, stirring up just the right mix of trace metals and minerals from the deep to sustain plankton growth. This month, researchers aboard the U.S. icebreaking ship Nathaniel B. Palmer are cruising in the Ross Sea in search of the signatures of this current system. NASA image courtesy Norman Kuring, Ocean Color Team at NASA Goddard Space Flight Center. Caption by Mike Carlowicz, with information from Hugh Powell, COSEE-NOW. Instrument: Aqua - MODIS Credit: <b><a href="http://www.earthobservatory.nasa.gov/" rel="nofollow"> NASA Earth Observatory</a></b> <a href="http://earthobservatory.nasa.gov/IOTD/view.php?id=48949" rel="nofollow">earthobservatory.nasa.gov/IOTD/view.php?id=48949</a> <b><a href="http://www.nasa.gov/centers/goddard/home/index.html" rel="nofollow">NASA Goddard Space Flight Center</a></b> enables NASA’s mission through four scientific endeavors: Earth Science, Heliophysics, Solar System Exploration, and Astrophysics. Goddard plays a leading role in NASA’s accomplishments by contributing compelling scientific knowledge to advance the Agency’s mission. <b>Follow us on <a href="http://twitter.com/NASA_GoddardPix" rel="nofollow">Twitter</a></b> <b>Join us on <a href="http://www.facebook.com/pages/Greenbelt-MD/NASA-Goddard/395013845897?ref=tsd" rel="nofollow">Facebook</a></b>
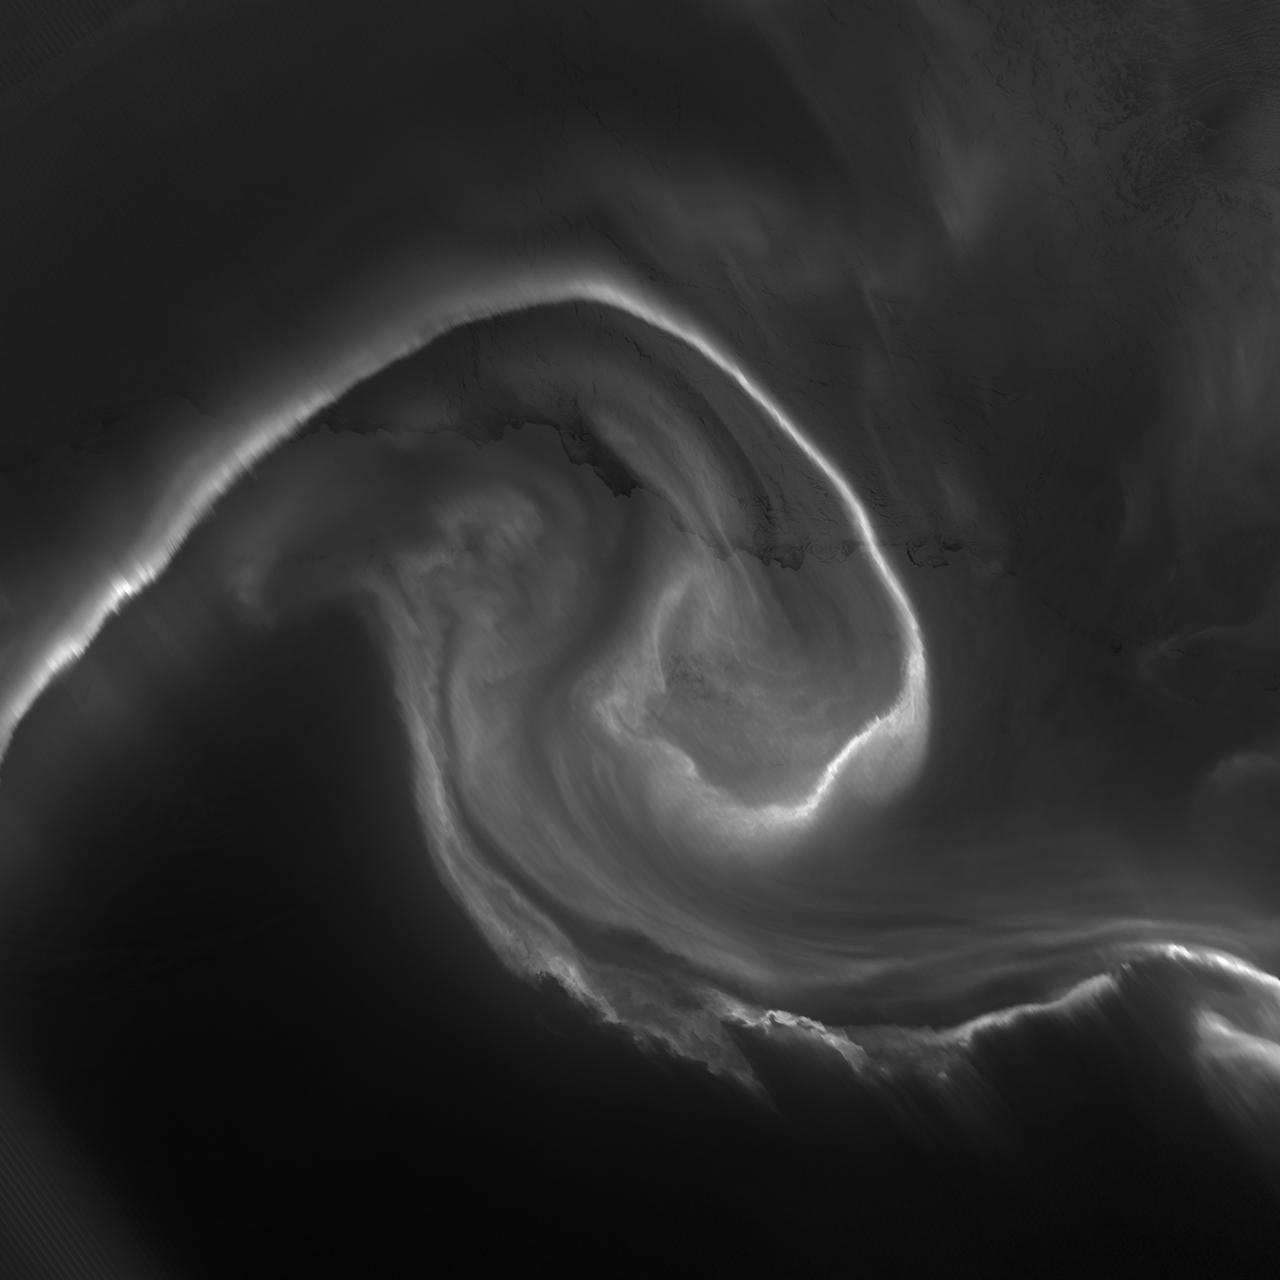
NASA acquired July 15, 2012 On July 15, 2012, the Visible Infrared Imaging Radiometer Suite (VIIRS) on the Suomi NPP satellite captured this nighttime view of the aurora australis, or “southern lights,” over Antartica’s Queen Maud Land and the Princess Ragnhild Coast. The image was captured by the VIIRS “day-night band,” which detects light in a range of wavelengths from green to near-infrared and uses filtering techniques to observe signals such as city lights, auroras, wildfires, and reflected moonlight. In the case of the image above, the sensor detected the visible auroral light emissions as energetic particles rained down from Earth’s magnetosphere and into the gases of the upper atmosphere. The slightly jagged appearance of the auroral lines is a function of the rapid dance of the energetic particles at the same time that the satellite is moving and the VIIRS sensor is scanning. The yellow box in the top image depicts the area shown in the lower close-up image. Light from the aurora was bright enough to illuminate the ice edge between the ice shelf and the Southern Ocean. At the time, Antarctica was locked in midwinter darkness and the Moon was a waning crescent that provided little light. NASA Earth Observatory image by Jesse Allen and Robert Simmon, using VIIRS Day-Night Band data from the Suomi National Polar-orbiting Partnership. Suomi NPP is the result of a partnership between NASA, the National Oceanic and Atmospheric Administration, and the Department of Defense. Caption by Mike Carlowicz. Instrument: Suomi NPP - VIIRS Credit: <b><a href="http://www.earthobservatory.nasa.gov/" rel="nofollow"> NASA Earth Observatory</a></b> <b>Click here to view all of the <a href="http://earthobservatory.nasa.gov/Features/NightLights/" rel="nofollow"> Earth at Night 2012 images </a></b> <b>Click here to <a href="http://earthobservatory.nasa.gov/NaturalHazards/view.php?id=79750" rel="nofollow"> read more </a> about this image </b> <b><a href="http://www.nasa.gov/audience/formedia/features/MP_Photo_Guidelines.html" rel="nofollow">NASA image use policy.</a></b> <b><a href="http://www.nasa.gov/centers/goddard/home/index.html" rel="nofollow">NASA Goddard Space Flight Center</a></b> enables NASA’s mission through four scientific endeavors: Earth Science, Heliophysics, Solar System Exploration, and Astrophysics. Goddard plays a leading role in NASA’s accomplishments by contributing compelling scientific knowledge to advance the Agency’s mission. <b>Follow us on <a href="http://twitter.com/NASA_GoddardPix" rel="nofollow">Twitter</a></b> <b>Like us on <a href="http://www.facebook.com/pages/Greenbelt-MD/NASA-Goddard/395013845897?ref=tsd" rel="nofollow">Facebook</a></b> <b>Find us on <a href="http://instagram.com/nasagoddard?vm=grid" rel="nofollow">Instagram</a></b>
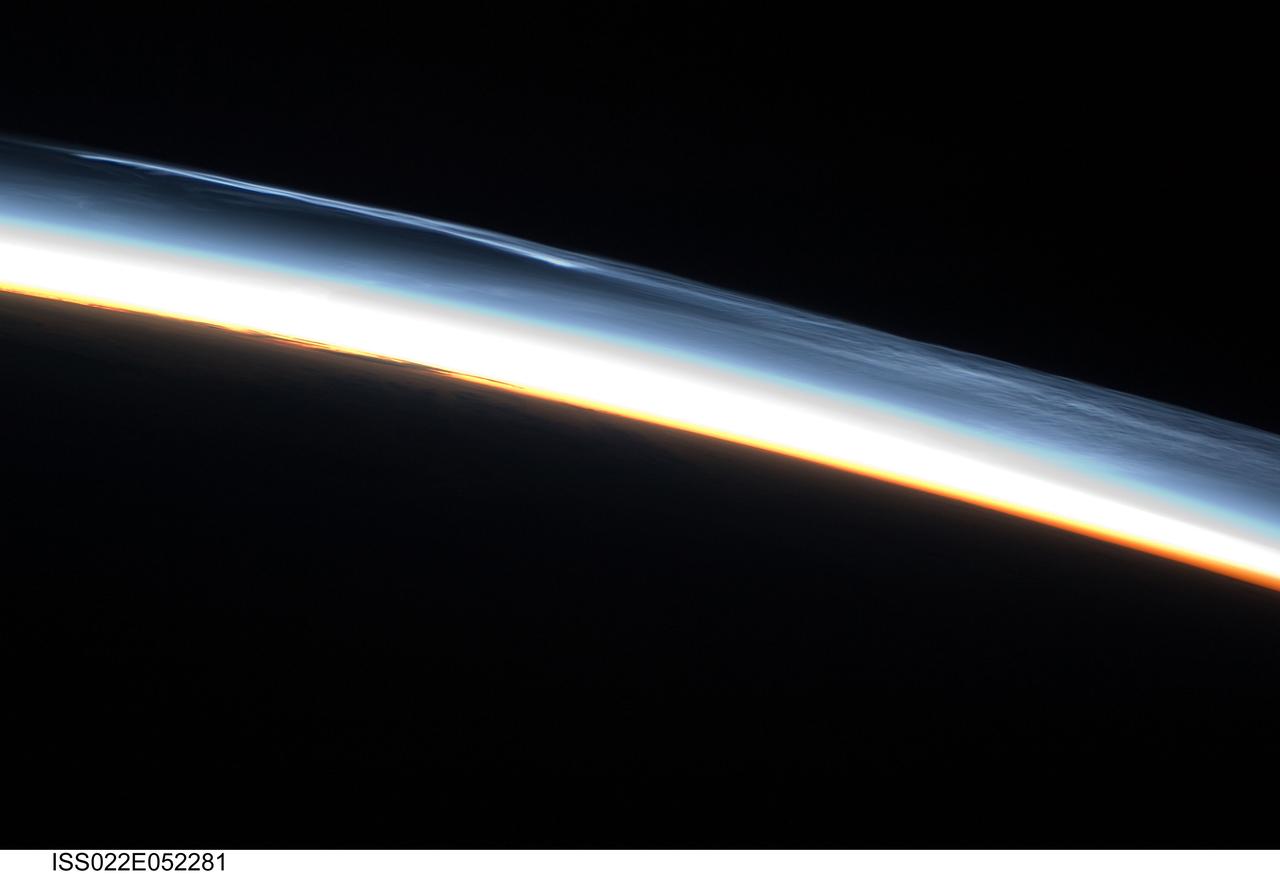
ISS022-E-052281 (30 Jan. 2010) --- Polar mesospheric clouds over the Southern Hemisphere are featured in this image photographed by an Expedition 22 crew member on the International Space Station. This striking view shows polar mesospheric clouds (PMC) over the polar region of the Southern Hemisphere. These clouds occur over the high latitudes of both northern and southern hemispheres during their respective summer months at very high altitudes of approximately 76?85 kilometers. When present they are visible during twilight, when the clouds are illuminated by the sun while the ground surface below is in darkness. The International Space Station (ISS) orbit extends from latitude 52 North to latitude 52 South; combined with the highly oblique views through Earth?s atmosphere possible with hand-held imagery, the ISS is an ideal platform for documenting these transient, high altitude phenomena. Another NASA mission, the Aeronomy of Ice in the Mesosphere or AIM satellite, is dedicated to the study of PMC and is providing daily information about their formation, distribution, and variability. Polar mesospheric clouds are also known as noctilucent or night-shining clouds ? a property that is clearly visible in this photograph. The PMC exhibit thin, wispy light blue forms that contrast with the darkness of space above (upper right). Lower levels of cloud are strongly illuminated by the sun and appear light orange to white. Clouds closest to Earth?s surface are reddish-orange (center). The image was taken approximately 38 minutes after midnight Greenwich Mean Time (GMT) while the ISS was located over the southern Atlantic Ocean. At this time of year, the sun never sets over Antarctica but rather defines an arc across the local horizon, allowing PMC to be observed near local midnight.
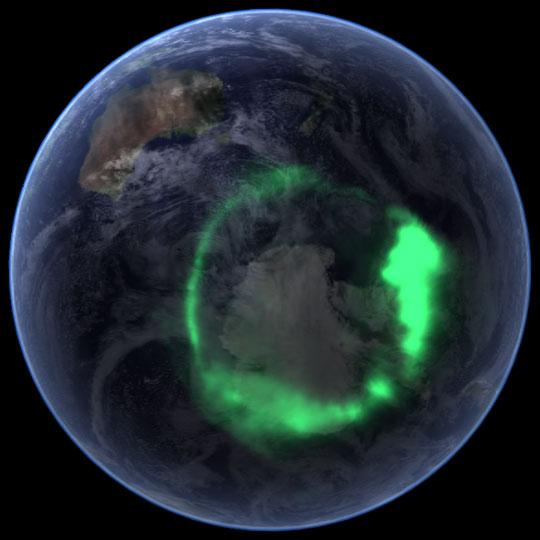
NASA file image acquired September 11, 2005 <b>To view a video of this event go here: <a href="http://www.flickr.com/photos/gsfc/6257608714">www.flickr.com/photos/gsfc/6257608714</a></b> From space, the aurora is a crown of light that circles each of Earth’s poles. The IMAGE satellite captured this view of the aurora australis (southern lights) on September 11, 2005, four days after a record-setting solar flare sent plasma—an ionized gas of protons and electrons—flying towards the Earth. The ring of light that the solar storm generated over Antarctica glows green in the ultraviolet part of the spectrum, shown in this image. The IMAGE observations of the aurora are overlaid onto NASA’s satellite-based Blue Marble image. From the Earth’s surface, the ring would appear as a curtain of light shimmering across the night sky. Like all solar storms, the September storm distorted the shape of the magnetic field that surrounds the Earth. Without buffeting from the solar wind (charged particles like protons and electrons that are ejected from the Sun), the Earth’s magnetic field would look something like a plump doughnut, with the North and South poles forming the slender hole in the center. In reality, the nearly constant solar winds flatten the space side of the “doughnut” into a long tail. The amount of distortion changes when solar storms, such as the flare on September 7, send stronger winds towards the Earth. Changes to the magnetic field release fast-moving particles, which flow with charged particles from the Sun towards the center of the “doughnut” at the Earth’s poles. As the particles sink into the atmosphere, they collide with oxygen and nitrogen, lighting the sky with Nature’s version of neon lights, the aurora. Though scientists knew that the aurora were caused by charged particles from the Sun and their interaction with the Earth’s magnetic field, they had no way to measure the interaction until NASA launched the Imager for Magnetopause-to-Aurora Global Exploration (IMAGE) satellite in 2000. The satellite’s mission was to collect data that would allow scientists to study the structure and dynamics of the Earth’s magnetic field for the first time. Designed to operate for two years, IMAGE sent its last data to Earth in December 2005 after a highly successful five-year mission. Since 2000, IMAGE has provided insight into how the Earth’s powerful magnetic field protects the planet from solar winds. Without the shield the magnetic field provides, the upper atmosphere would evaporate into space under the influence of solar winds. IMAGE has shown scientists what sort of changes the magnetic field undertakes as it diverts solar winds from the Earth. For a summary of the discoveries that IMAGE has made possible, see IMAGE Discovers. Instrument: IMAGE Credit: <a href="http://svs.gsfc.nasa.gov/index.html" rel="nofollow">NASA/Goddard Space Flight Center Scientific Visualization Studio</a> <b><a href="http://www.nasa.gov/audience/formedia/features/MP_Photo_Guidelines.html" rel="nofollow">NASA image use policy.</a></b> <b><a href="http://www.nasa.gov/centers/goddard/home/index.html" rel="nofollow">NASA Goddard Space Flight Center</a></b> enables NASA’s mission through four scientific endeavors: Earth Science, Heliophysics, Solar System Exploration, and Astrophysics. Goddard plays a leading role in NASA’s accomplishments by contributing compelling scientific knowledge to advance the Agency’s mission. <b>Follow us on <a href="http://twitter.com/NASAGoddardPix" rel="nofollow">Twitter</a></b> <b>Like us on <a href="http://www.facebook.com/pages/Greenbelt-MD/NASA-Goddard/395013845897?ref=tsd" rel="nofollow">Facebook</a></b> <b>Find us on <a href="http://instagrid.me/nasagoddard/?vm=grid" rel="nofollow">Instagram</a></b>
The P-3B is waiting outside the hangar at Thule Air Base with the Greenland Ice sheet in the background. Today, NASA's IceBridge, Arctic 2013 mission will collect data across the Arctic Ocean between Greenland and Alaska. -- IceBridge, a six-year NASA mission, is the largest airborne survey of Earth's polar ice ever flown. It will yield an unprecedented three-dimensional view of Arctic and Antarctic ice sheets, ice shelves and sea ice. These flights will provide a yearly, multi-instrument look at the behavior of the rapidly changing features of the Greenland and Antarctic ice. Data collected during IceBridge will help scientists bridge the gap in polar observations between NASA's Ice, Cloud and Land Elevation Satellite (ICESat) -- in orbit since 2003 -- and ICESat-2, planned for early 2016. ICESat stopped collecting science data in 2009, making IceBridge critical for ensuring a continuous series of observations. IceBridge will use airborne instruments to map Arctic and Antarctic areas once a year. IceBridge flights are conducted in March-May over Greenland and in October-November over Antarctica. Other smaller airborne surveys around the world are also part of the IceBridge campaign. Credit: NASA/Goddard/Michael Studinger <b><a href="http://www.nasa.gov/audience/formedia/features/MP_Photo_Guidelines.html" rel="nofollow">NASA image use policy.</a></b> <b><a href="http://www.nasa.gov/centers/goddard/home/index.html" rel="nofollow">NASA Goddard Space Flight Center</a></b> enables NASA’s mission through four scientific endeavors: Earth Science, Heliophysics, Solar System Exploration, and Astrophysics. Goddard plays a leading role in NASA’s accomplishments by contributing compelling scientific knowledge to advance the Agency’s mission. <b>Follow us on <a href="http://twitter.com/NASA_GoddardPix" rel="nofollow">Twitter</a></b> <b>Like us on <a href="http://www.facebook.com/pages/Greenbelt-MD/NASA-Goddard/395013845897?ref=tsd" rel="nofollow">Facebook</a></b> <b>Find us on <a href="http://instagram.com/nasagoddard?vm=grid" rel="nofollow">Instagram</a></b>
A northern Greenland glacier as seen by NASA's P-3B aircraft on May 3, 2012. Credit: Michael Studinger/NASA =========== IceBridge, a six-year NASA mission, is the largest airborne survey of Earth's polar ice ever flown. It will yield an unprecedented three-dimensional view of Arctic and Antarctic ice sheets, ice shelves and sea ice. These flights will provide a yearly, multi-instrument look at the behavior of the rapidly changing features of the Greenland and Antarctic ice. Data collected during IceBridge will help scientists bridge the gap in polar observations between NASA's Ice, Cloud and Land Elevation Satellite (ICESat) -- in orbit since 2003 -- and ICESat-2, planned for early 2016. ICESat stopped collecting science data in 2009, making IceBridge critical for ensuring a continuous series of observations. IceBridge will use airborne instruments to map Arctic and Antarctic areas once a year. IceBridge flights are conducted in March-May over Greenland and in October-November over Antarctica. Other smaller airborne surveys around the world are also part of the IceBridge campaign. To read more about IceBridge - Arctic 2012 go to: <a href="http://www.nasa.gov/mission_pages/icebridge/index.html" rel="nofollow">www.nasa.gov/mission_pages/icebridge/index.html</a> <b><a href="http://www.nasa.gov/audience/formedia/features/MP_Photo_Guidelines.html" rel="nofollow">NASA image use policy.</a></b> <b><a href="http://www.nasa.gov/centers/goddard/home/index.html" rel="nofollow">NASA Goddard Space Flight Center</a></b> enables NASA’s mission through four scientific endeavors: Earth Science, Heliophysics, Solar System Exploration, and Astrophysics. Goddard plays a leading role in NASA’s accomplishments by contributing compelling scientific knowledge to advance the Agency’s mission. <b>Follow us on <a href="http://twitter.com/NASA_GoddardPix" rel="nofollow">Twitter</a></b> <b>Like us on <a href="http://www.facebook.com/pages/Greenbelt-MD/NASA-Goddard/395013845897?ref=tsd" rel="nofollow">Facebook</a></b> <b>Find us on <a href="http://instagrid.me/nasagoddard/?vm=grid" rel="nofollow">Instagram</a></b>
A glacial canyon in northern Greenland as seen by NASA's P-3B aircraft on May 3, 2012. Credit: Michael Studinger/NASA =========== IceBridge, a six-year NASA mission, is the largest airborne survey of Earth's polar ice ever flown. It will yield an unprecedented three-dimensional view of Arctic and Antarctic ice sheets, ice shelves and sea ice. These flights will provide a yearly, multi-instrument look at the behavior of the rapidly changing features of the Greenland and Antarctic ice. Data collected during IceBridge will help scientists bridge the gap in polar observations between NASA's Ice, Cloud and Land Elevation Satellite (ICESat) -- in orbit since 2003 -- and ICESat-2, planned for early 2016. ICESat stopped collecting science data in 2009, making IceBridge critical for ensuring a continuous series of observations. IceBridge will use airborne instruments to map Arctic and Antarctic areas once a year. IceBridge flights are conducted in March-May over Greenland and in October-November over Antarctica. Other smaller airborne surveys around the world are also part of the IceBridge campaign. To read more about IceBridge - Arctic 2012 go to: <a href="http://www.nasa.gov/mission_pages/icebridge/index.html" rel="nofollow">www.nasa.gov/mission_pages/icebridge/index.html</a> <b><a href="http://www.nasa.gov/audience/formedia/features/MP_Photo_Guidelines.html" rel="nofollow">NASA image use policy.</a></b> <b><a href="http://www.nasa.gov/centers/goddard/home/index.html" rel="nofollow">NASA Goddard Space Flight Center</a></b> enables NASA’s mission through four scientific endeavors: Earth Science, Heliophysics, Solar System Exploration, and Astrophysics. Goddard plays a leading role in NASA’s accomplishments by contributing compelling scientific knowledge to advance the Agency’s mission. <b>Follow us on <a href="http://twitter.com/NASA_GoddardPix" rel="nofollow">Twitter</a></b> <b>Like us on <a href="http://www.facebook.com/pages/Greenbelt-MD/NASA-Goddard/395013845897?ref=tsd" rel="nofollow">Facebook</a></b> <b>Find us on <a href="http://instagrid.me/nasagoddard/?vm=grid" rel="nofollow">Instagram</a></b>
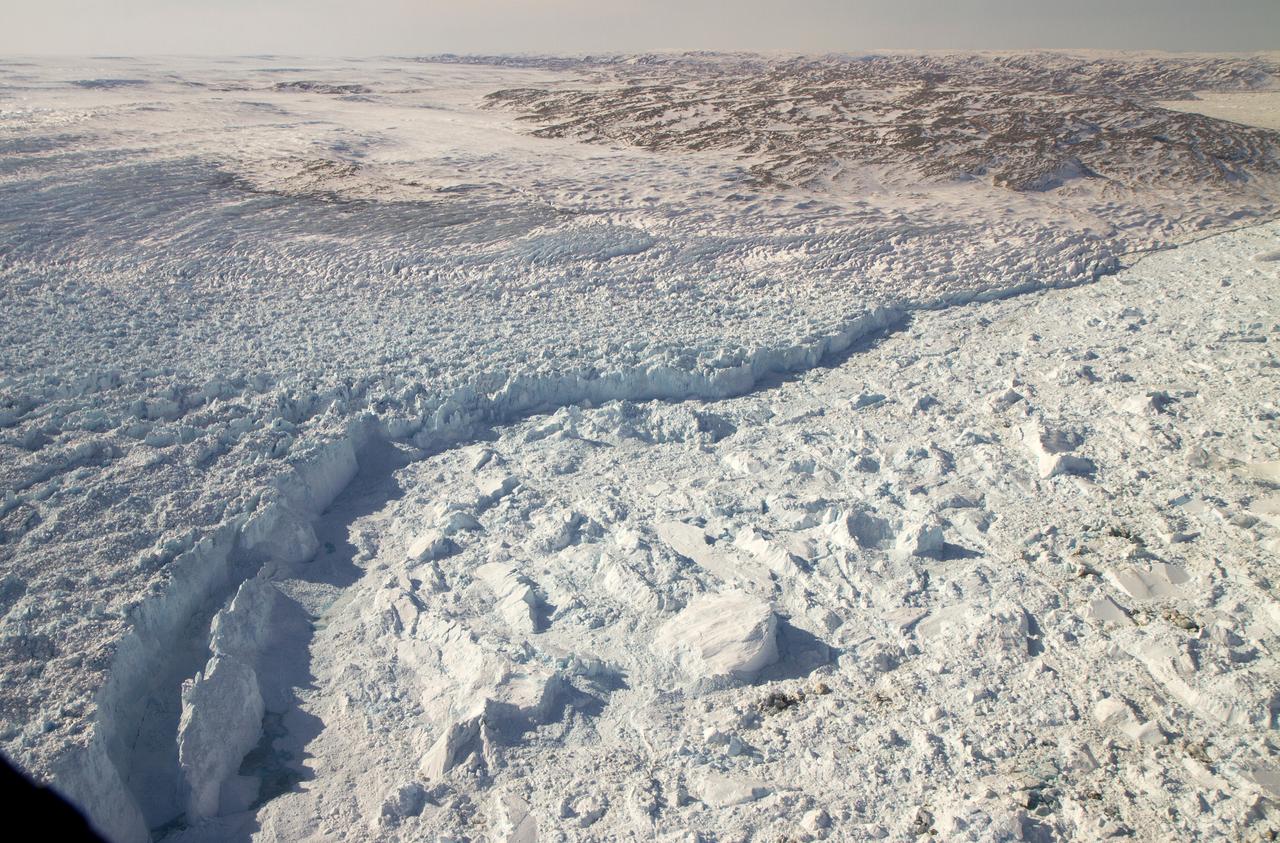
The calving front of the Jakobshavn Glacier in western Greenland, as seen from NASA's P-3B aircraft on April 21, 2012. Credit: NASA/GSFC/Jefferson Beck =========== IceBridge, a six-year NASA mission, is the largest airborne survey of Earth's polar ice ever flown. It will yield an unprecedented three-dimensional view of Arctic and Antarctic ice sheets, ice shelves and sea ice. These flights will provide a yearly, multi-instrument look at the behavior of the rapidly changing features of the Greenland and Antarctic ice. Data collected during IceBridge will help scientists bridge the gap in polar observations between NASA's Ice, Cloud and Land Elevation Satellite (ICESat) -- in orbit since 2003 -- and ICESat-2, planned for early 2016. ICESat stopped collecting science data in 2009, making IceBridge critical for ensuring a continuous series of observations. IceBridge will use airborne instruments to map Arctic and Antarctic areas once a year. IceBridge flights are conducted in March-May over Greenland and in October-November over Antarctica. Other smaller airborne surveys around the world are also part of the IceBridge campaign. To read more about IceBridge - Arctic 2012 go to: <a href="http://www.nasa.gov/mission_pages/icebridge/index.html" rel="nofollow">www.nasa.gov/mission_pages/icebridge/index.html</a> <b><a href="http://www.nasa.gov/audience/formedia/features/MP_Photo_Guidelines.html" rel="nofollow">NASA image use policy.</a></b> <b><a href="http://www.nasa.gov/centers/goddard/home/index.html" rel="nofollow">NASA Goddard Space Flight Center</a></b> enables NASA’s mission through four scientific endeavors: Earth Science, Heliophysics, Solar System Exploration, and Astrophysics. Goddard plays a leading role in NASA’s accomplishments by contributing compelling scientific knowledge to advance the Agency’s mission. <b>Follow us on <a href="http://twitter.com/NASA_GoddardPix" rel="nofollow">Twitter</a></b> <b>Like us on <a href="http://www.facebook.com/pages/Greenbelt-MD/NASA-Goddard/395013845897?ref=tsd" rel="nofollow">Facebook</a></b> <b>Find us on <a href="http://instagrid.me/nasagoddard/?vm=grid" rel="nofollow">Instagram</a></b>
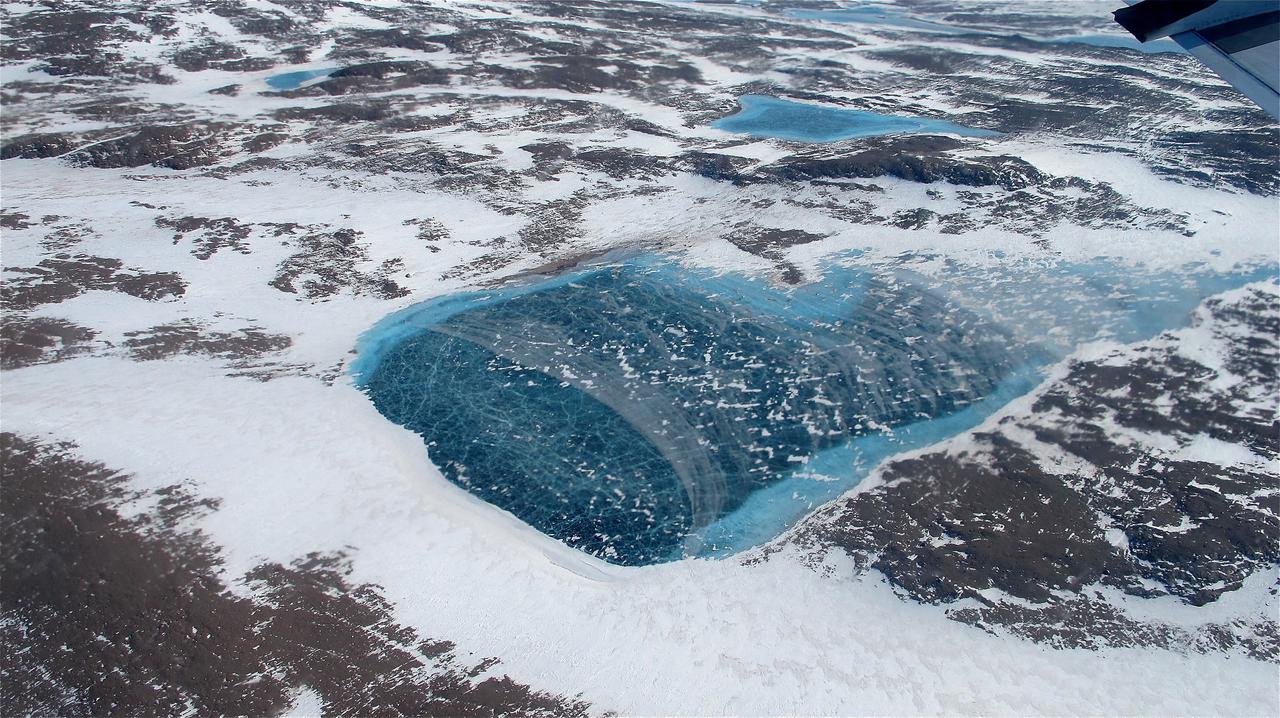
Frozen meltwater lake along the northeast Greenland coast, as seen from NASA's P-3B aircraft on May 7, 2012. Credit: NASA/Jim Yungel =========== IceBridge, a six-year NASA mission, is the largest airborne survey of Earth's polar ice ever flown. It will yield an unprecedented three-dimensional view of Arctic and Antarctic ice sheets, ice shelves and sea ice. These flights will provide a yearly, multi-instrument look at the behavior of the rapidly changing features of the Greenland and Antarctic ice. Data collected during IceBridge will help scientists bridge the gap in polar observations between NASA's Ice, Cloud and Land Elevation Satellite (ICESat) -- in orbit since 2003 -- and ICESat-2, planned for early 2016. ICESat stopped collecting science data in 2009, making IceBridge critical for ensuring a continuous series of observations. IceBridge will use airborne instruments to map Arctic and Antarctic areas once a year. IceBridge flights are conducted in March-May over Greenland and in October-November over Antarctica. Other smaller airborne surveys around the world are also part of the IceBridge campaign. To read more about IceBridge - Arctic 2012 go to: <a href="http://www.nasa.gov/mission_pages/icebridge/index.html" rel="nofollow">www.nasa.gov/mission_pages/icebridge/index.html</a> <b><a href="http://www.nasa.gov/audience/formedia/features/MP_Photo_Guidelines.html" rel="nofollow">NASA image use policy.</a></b> <b><a href="http://www.nasa.gov/centers/goddard/home/index.html" rel="nofollow">NASA Goddard Space Flight Center</a></b> enables NASA’s mission through four scientific endeavors: Earth Science, Heliophysics, Solar System Exploration, and Astrophysics. Goddard plays a leading role in NASA’s accomplishments by contributing compelling scientific knowledge to advance the Agency’s mission. <b>Follow us on <a href="http://twitter.com/NASA_GoddardPix" rel="nofollow">Twitter</a></b> <b>Like us on <a href="http://www.facebook.com/pages/Greenbelt-MD/NASA-Goddard/395013845897?ref=tsd" rel="nofollow">Facebook</a></b> <b>Find us on <a href="http://instagrid.me/nasagoddard/?vm=grid" rel="nofollow">Instagram</a></b>
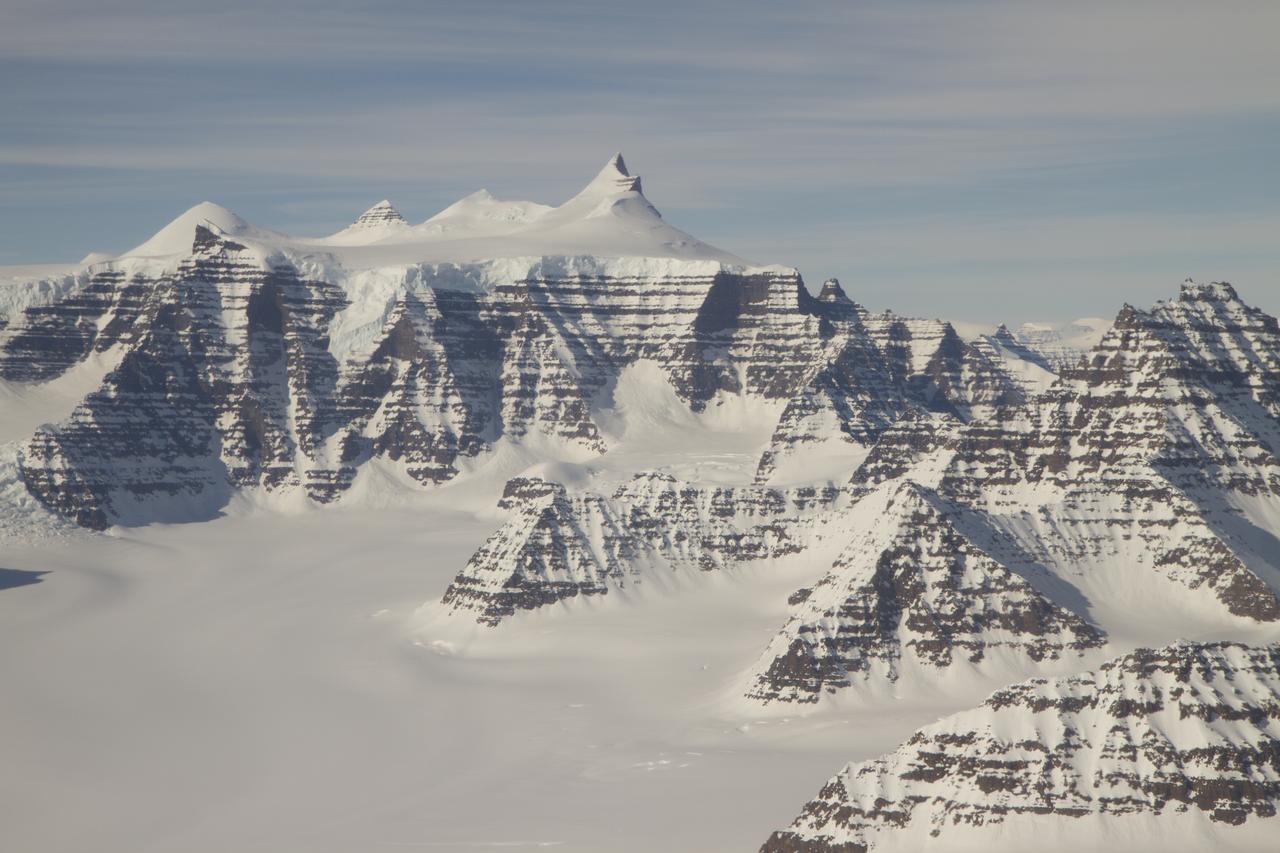
Mountain ridges showing the distinctive geology of the Geikie Plateau region in eastern Greenland, as seen from NASA's P-3B aircraft on April 16, 2012. Credit: NASA/GSFC/Jefferson Beck =========== IceBridge, a six-year NASA mission, is the largest airborne survey of Earth's polar ice ever flown. It will yield an unprecedented three-dimensional view of Arctic and Antarctic ice sheets, ice shelves and sea ice. These flights will provide a yearly, multi-instrument look at the behavior of the rapidly changing features of the Greenland and Antarctic ice. Data collected during IceBridge will help scientists bridge the gap in polar observations between NASA's Ice, Cloud and Land Elevation Satellite (ICESat) -- in orbit since 2003 -- and ICESat-2, planned for early 2016. ICESat stopped collecting science data in 2009, making IceBridge critical for ensuring a continuous series of observations. IceBridge will use airborne instruments to map Arctic and Antarctic areas once a year. IceBridge flights are conducted in March-May over Greenland and in October-November over Antarctica. Other smaller airborne surveys around the world are also part of the IceBridge campaign. To read more about IceBridge - Arctic 2012 go to: <a href="http://www.nasa.gov/mission_pages/icebridge/index.html" rel="nofollow">www.nasa.gov/mission_pages/icebridge/index.html</a> <b><a href="http://www.nasa.gov/audience/formedia/features/MP_Photo_Guidelines.html" rel="nofollow">NASA image use policy.</a></b> <b><a href="http://www.nasa.gov/centers/goddard/home/index.html" rel="nofollow">NASA Goddard Space Flight Center</a></b> enables NASA’s mission through four scientific endeavors: Earth Science, Heliophysics, Solar System Exploration, and Astrophysics. Goddard plays a leading role in NASA’s accomplishments by contributing compelling scientific knowledge to advance the Agency’s mission. <b>Follow us on <a href="http://twitter.com/NASA_GoddardPix" rel="nofollow">Twitter</a></b> <b>Like us on <a href="http://www.facebook.com/pages/Greenbelt-MD/NASA-Goddard/395013845897?ref=tsd" rel="nofollow">Facebook</a></b> <b>Find us on <a href="http://instagrid.me/nasagoddard/?vm=grid" rel="nofollow">Instagram</a></b>
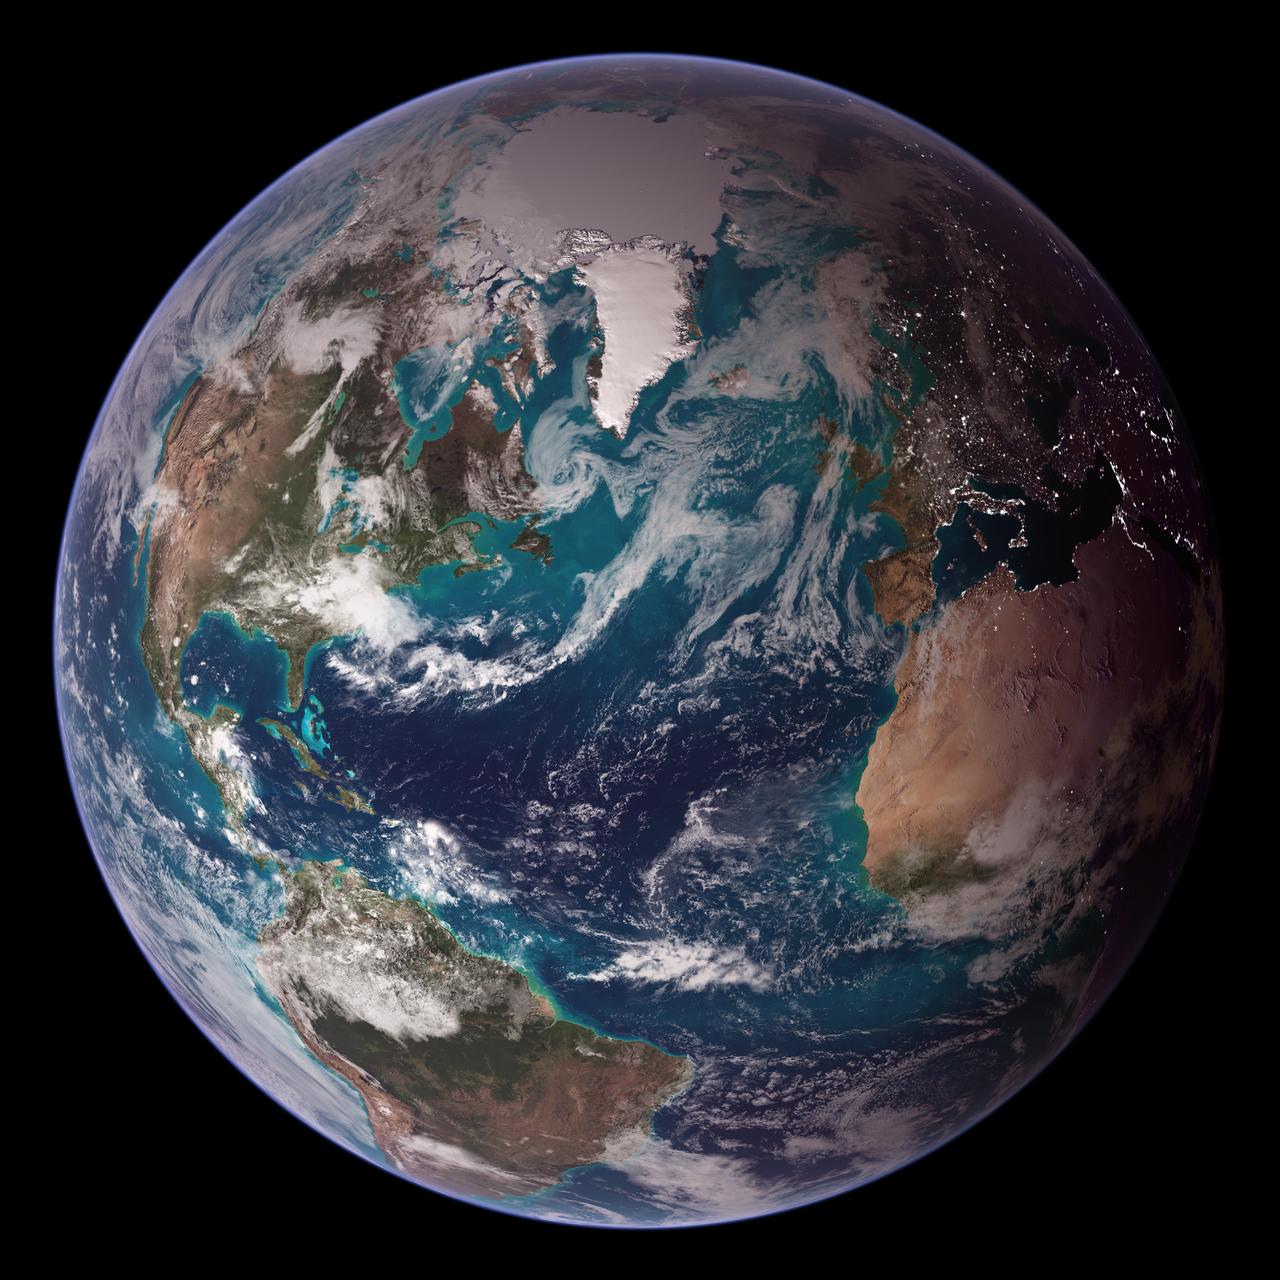
<b>RELEASE DATE: OCTOBER 9, 2007</b> <b>Credit: NASA/Goddard Space Flight Center/Reto Stöckli</b> A day’s clouds. The shape and texture of the land. The living ocean. City lights as a beacon of human presence across the globe. This amazingly beautiful view of Earth from space is a fusion of science and art, a showcase for the remote-sensing technology that makes such views possible, and a testament to the passion and creativity of the scientists who devote their careers to understanding how land, ocean, and atmosphere—even life itself—interact to generate Earth’s unique (as far as we know!) life-sustaining environment. Drawing on data from multiple satellite missions (not all collected at the same time), a team of NASA scientists and graphic artists created layers of global data for everything from the land surface, to polar sea ice, to the light reflected by the chlorophyll in the billions of microscopic plants that grow in the ocean. They wrapped these layers around a globe, set it against a black background, and simulated the hazy edge of the Earth’s atmosphere (the limb) that appears in astronaut photography of the Earth. The land surface layer is based on photo-like surface reflectance observations (reflected sunlight) measured by the Moderate Resolution Imaging Spectroradiometer (MODIS) on NASA’s Terra satellite in July 2004. The sea ice layer near the poles comes from Terra MODIS observations of daytime sea ice observed between August 28 and September 6, 2001. The ocean layer is a composite. In shallow water areas, the layer shows surface reflectances observed by Terra MODIS in July 2004. In the open ocean, the photo-like layer is overlaid with observations of the average ocean chlorophyll content for 2004. NASA’s Aqua MODIS collected the chlorophyll data. The cloud layer shows a single-day snapshot of clouds observed by Terra MODIS across the planet on July 29, 2001. City lights on Earth’s night side are visualized from data collected by the Defense Meteorological Satellite Program mission between 1994–1995. The topography layer is based on radar data collected by the Space Shuttle Endeavour during an 11-day mission in February of 2000. Topography over Antarctica comes from the Radarsat Antarctic Mapping Project, version 2. Most of the data layers in this visualization are available as monthly composites as part of NASA’s Blue Marble Next Generation image collection. The images in the collection appear in cylindrical projection (rectangular maps), and they are available at 500-meter resolution. The large images provided above are the full-size versions of these globes. In their hope that these images will inspire people to appreciate the beauty of our home planet and to learn about the Earth system, the developers of these images encourage readers to re-use and re-publish the images freely. NASA images by Reto Stöckli, based on data from NASA and NOAA. To learn the history of the Blue Marble go here: <a href="http://earthobservatory.nasa.gov/Features/BlueMarble/BlueMarble_history.php" rel="nofollow">earthobservatory.nasa.gov/Features/BlueMarble/BlueMarble_...</a> To learn more about the Blue Marble go here: <a href="http://earthobservatory.nasa.gov/IOTD/view.php?id=8108" rel="nofollow">earthobservatory.nasa.gov/IOTD/view.php?id=8108</a> <b><a href="http://www.nasa.gov/centers/goddard/home/index.html" rel="nofollow">NASA Goddard Space Flight Center</a></b> is home to the nation's largest organization of combined scientists, engineers and technologists that build spacecraft, instruments and new technology to study the Earth, the sun, our solar system, and the universe. <b>Follow us on <a href="http://twitter.com/NASA_GoddardPix" rel="nofollow">Twitter</a></b> <b>Join us on <a href="http://www.facebook.com/pages/Greenbelt-MD/NASA-Goddard/395013845897?ref=tsd" rel="nofollow">Facebook</a><b> </b></b>
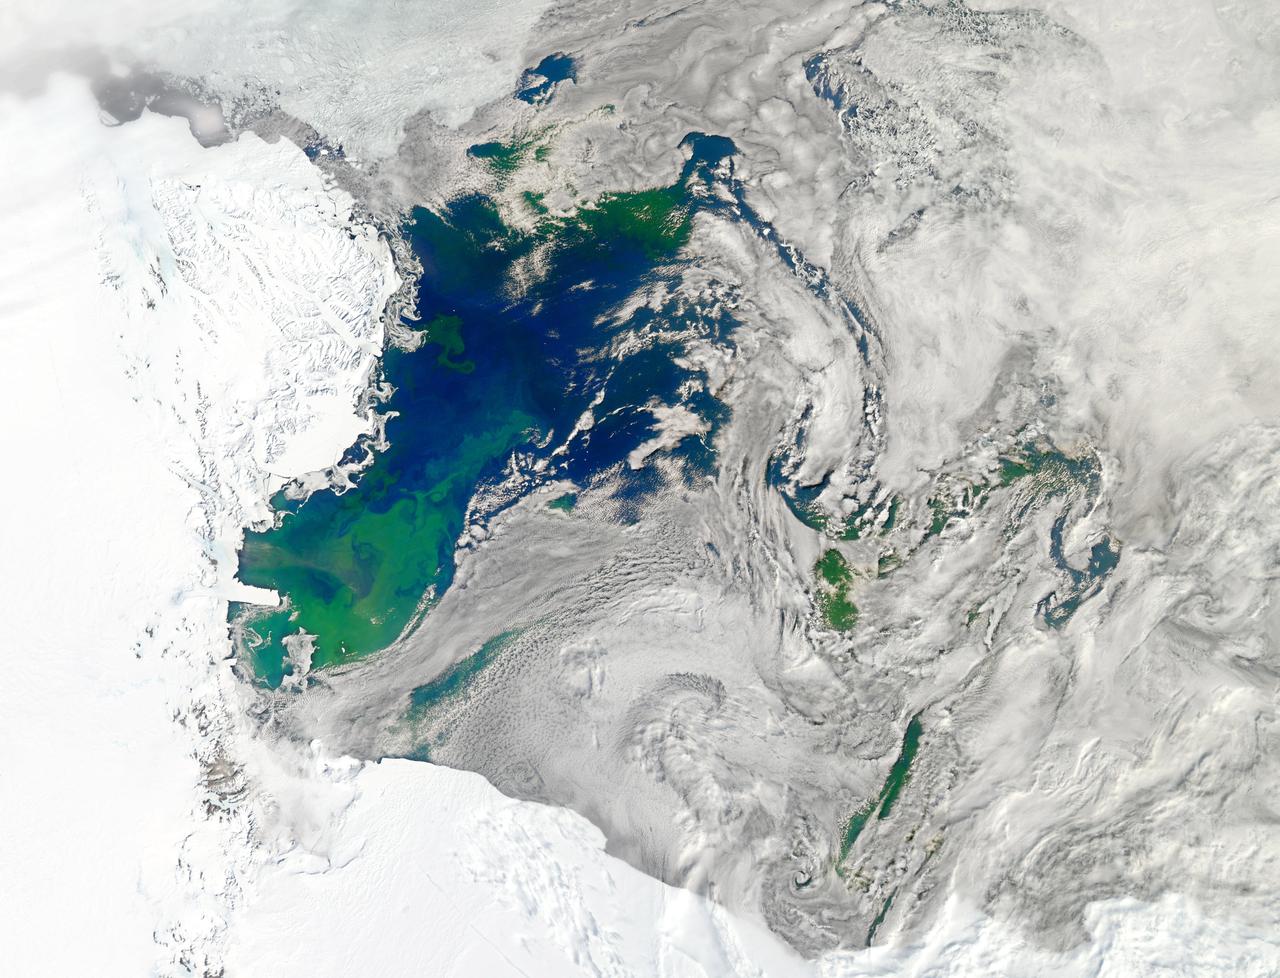
NASA image acquired January 22, 2011 Every southern spring and summer, after the Sun has risen into its 24-hour circuit around the skies of Antarctica, the Ross Sea bursts with life. Floating, microscopic plants, known as phytoplankton, soak up the sunlight and the nutrients stirring in the Southern Ocean and grow into prodigious blooms. Those blooms become a great banquet for krill, fish, penguins, whales, and other marine species who carve out a living in the cool waters of the far south. This true-color image captures such a bloom in the Ross Sea on January 22, 2011, as viewed by the Moderate Resolution Imaging Spectroradiometer (MODIS) on NASA’s Aqua satellite. Bright greens of plant-life have replaced the deep blues of open ocean water. The Ross Sea is a relatively shallow bay in the Antarctic coastline and due south from New Zealand. As the spring weather thaws the sea ice around Antarctica, areas of open water surrounded by ice—polynyas—open up on the continental shelf. In this open water, sunlight provides the fuel and various current systems provide nutrients from deeper waters to form blooms that can stretch 100 to 200 kilometers (60 to 120 miles). These blooms are among the largest in extent and abundance in the world. Scientists have hypothesized that the Modified Circumpolar Deep Water is the engine behind the blooms, stirring up just the right mix of trace metals and minerals from the deep to sustain plankton growth. This month, researchers aboard the U.S. icebreaking ship Nathaniel B. Palmer are cruising in the Ross Sea in search of the signatures of this current system. NASA image courtesy Norman Kuring, Ocean Color Team at NASA Goddard Space Flight Center. Caption by Mike Carlowicz, with information from Hugh Powell, COSEE-NOW. Instrument: Aqua - MODIS Go here to download the full high res file: <a href="http://earthobservatory.nasa.gov/IOTD/view.php?id=48949" rel="nofollow">earthobservatory.nasa.gov/IOTD/view.php?id=48949</a> Credit: <b><a href="http://www.earthobservatory.nasa.gov/" rel="nofollow"> NASA Earth Observatory</a></b> <b><a href="http://www.nasa.gov/audience/formedia/features/MP_Photo_Guidelines.html" rel="nofollow">NASA image use policy.</a></b> <b><a href="http://www.nasa.gov/centers/goddard/home/index.html" rel="nofollow">NASA Goddard Space Flight Center</a></b> enables NASA’s mission through four scientific endeavors: Earth Science, Heliophysics, Solar System Exploration, and Astrophysics. Goddard plays a leading role in NASA’s accomplishments by contributing compelling scientific knowledge to advance the Agency’s mission. <b>Follow us on <a href="http://twitter.com/NASA_GoddardPix" rel="nofollow">Twitter</a></b> <b>Like us on <a href="http://www.facebook.com/pages/Greenbelt-MD/NASA-Goddard/395013845897?ref=tsd" rel="nofollow">Facebook</a></b> <b>Find us on <a href="http://instagrid.me/nasagoddard/?vm=grid" rel="nofollow">Instagram</a></b>
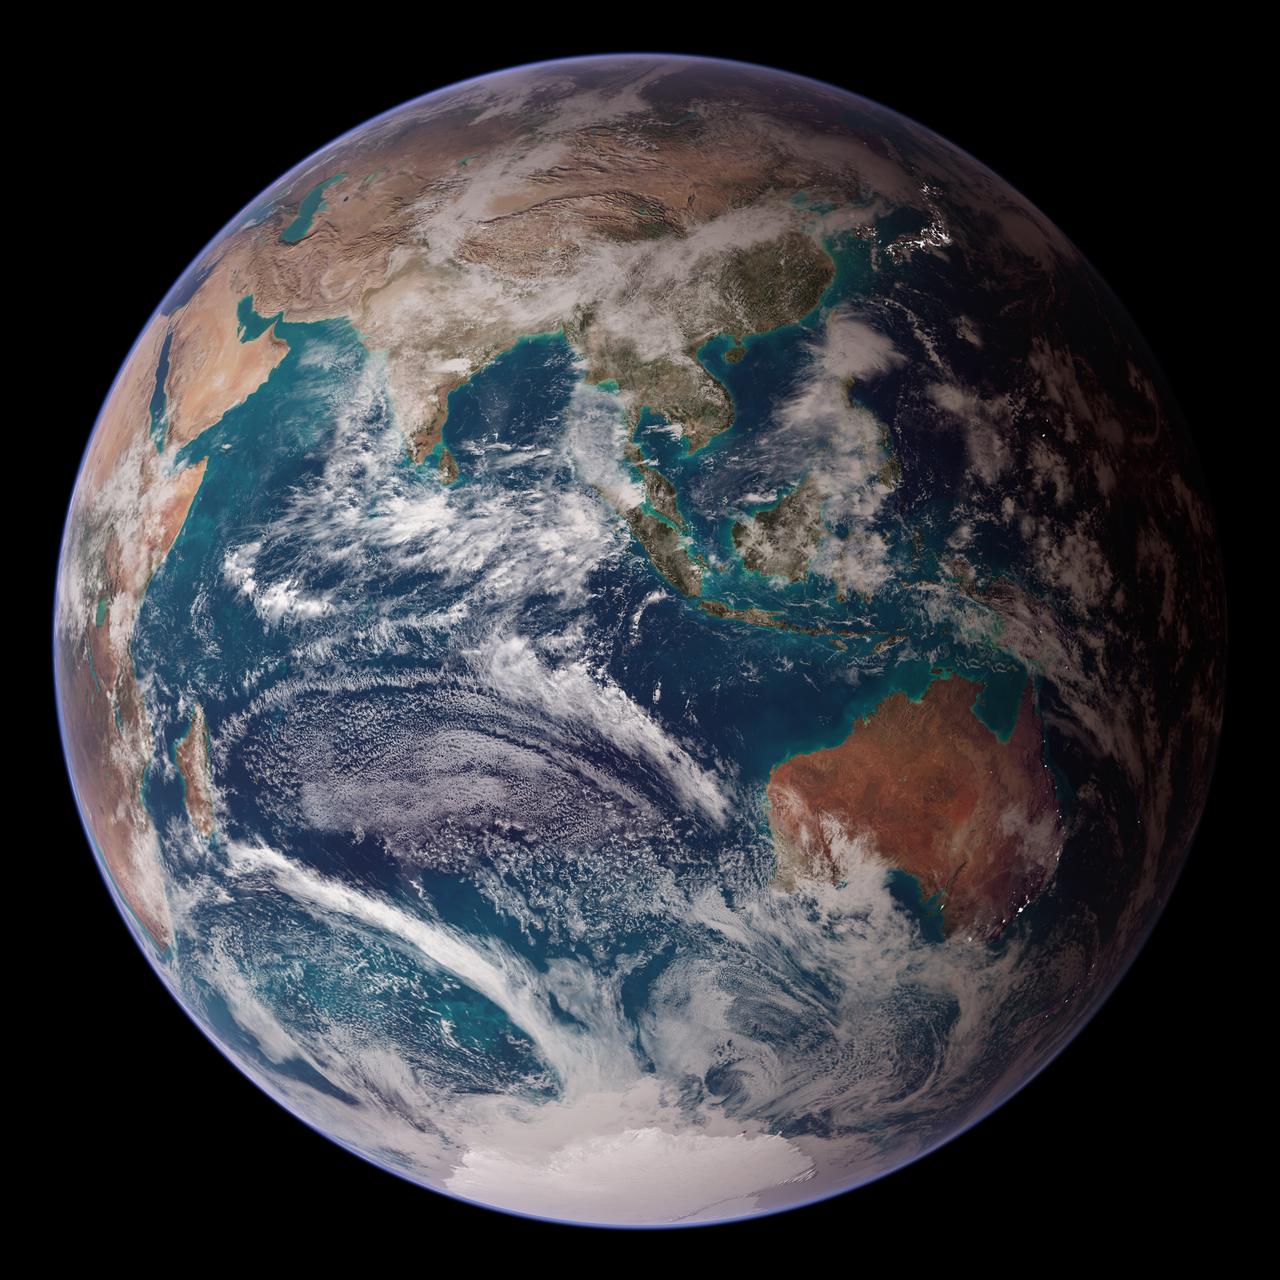
<b>RELEASE DATE: OCTOBER 9, 2007</b> <b>Credit: NASA/Goddard Space Flight Center/Reto Stöckli</b> A day’s clouds. The shape and texture of the land. The living ocean. City lights as a beacon of human presence across the globe. This amazingly beautiful view of Earth from space is a fusion of science and art, a showcase for the remote-sensing technology that makes such views possible, and a testament to the passion and creativity of the scientists who devote their careers to understanding how land, ocean, and atmosphere—even life itself—interact to generate Earth’s unique (as far as we know!) life-sustaining environment. Drawing on data from multiple satellite missions (not all collected at the same time), a team of NASA scientists and graphic artists created layers of global data for everything from the land surface, to polar sea ice, to the light reflected by the chlorophyll in the billions of microscopic plants that grow in the ocean. They wrapped these layers around a globe, set it against a black background, and simulated the hazy edge of the Earth’s atmosphere (the limb) that appears in astronaut photography of the Earth. The land surface layer is based on photo-like surface reflectance observations (reflected sunlight) measured by the Moderate Resolution Imaging Spectroradiometer (MODIS) on NASA’s Terra satellite in July 2004. The sea ice layer near the poles comes from Terra MODIS observations of daytime sea ice observed between August 28 and September 6, 2001. The ocean layer is a composite. In shallow water areas, the layer shows surface reflectances observed by Terra MODIS in July 2004. In the open ocean, the photo-like layer is overlaid with observations of the average ocean chlorophyll content for 2004. NASA’s Aqua MODIS collected the chlorophyll data. The cloud layer shows a single-day snapshot of clouds observed by Terra MODIS across the planet on July 29, 2001. City lights on Earth’s night side are visualized from data collected by the Defense Meteorological Satellite Program mission between 1994–1995. The topography layer is based on radar data collected by the Space Shuttle Endeavour during an 11-day mission in February of 2000. Topography over Antarctica comes from the Radarsat Antarctic Mapping Project, version 2. Most of the data layers in this visualization are available as monthly composites as part of NASA’s Blue Marble Next Generation image collection. The images in the collection appear in cylindrical projection (rectangular maps), and they are available at 500-meter resolution. The large images provided above are the full-size versions of these globes. In their hope that these images will inspire people to appreciate the beauty of our home planet and to learn about the Earth system, the developers of these images encourage readers to re-use and re-publish the images freely. NASA images by Reto Stöckli, based on data from NASA and NOAA. To learn the history of the Blue Marble go here: <a href="http://earthobservatory.nasa.gov/Features/BlueMarble/BlueMarble_history.php" rel="nofollow">earthobservatory.nasa.gov/Features/BlueMarble/BlueMarble_...</a> To learn more about the Blue Marble go here: <a href="http://earthobservatory.nasa.gov/IOTD/view.php?id=8108" rel="nofollow">earthobservatory.nasa.gov/IOTD/view.php?id=8108</a> To learn more about NASA's Goddard Space Flight Center go here: <a href="http://www.nasa.gov/centers/goddard/home/index.html" rel="nofollow">www.nasa.gov/centers/goddard/home/index.html</a> <b><a href="http://www.nasa.gov/centers/goddard/home/index.html" rel="nofollow">NASA Goddard Space Flight Center</a></b> is home to the nation's largest organization of combined scientists, engineers and technologists that build spacecraft, instruments and new technology to study the Earth, the sun, our solar system, and the universe. <b><a href="http://www.nasa.gov/centers/goddard/home/index.html" rel="nofollow">NASA Goddard Space Flight Center</a></b> is home to the nation's largest organization of combined scientists, engineers and technologists that build spacecraft, instruments and new technology to study the Earth, the sun, our solar system, and the universe. <b>Follow us on <a href="http://twitter.com/NASA_GoddardPix" rel="nofollow">Twitter</a></b> <b>Join us on <a href="http://www.facebook.com/pages/Greenbelt-MD/NASA-Goddard/395013845897?ref=tsd" rel="nofollow">Facebook</a><b> </b></b>