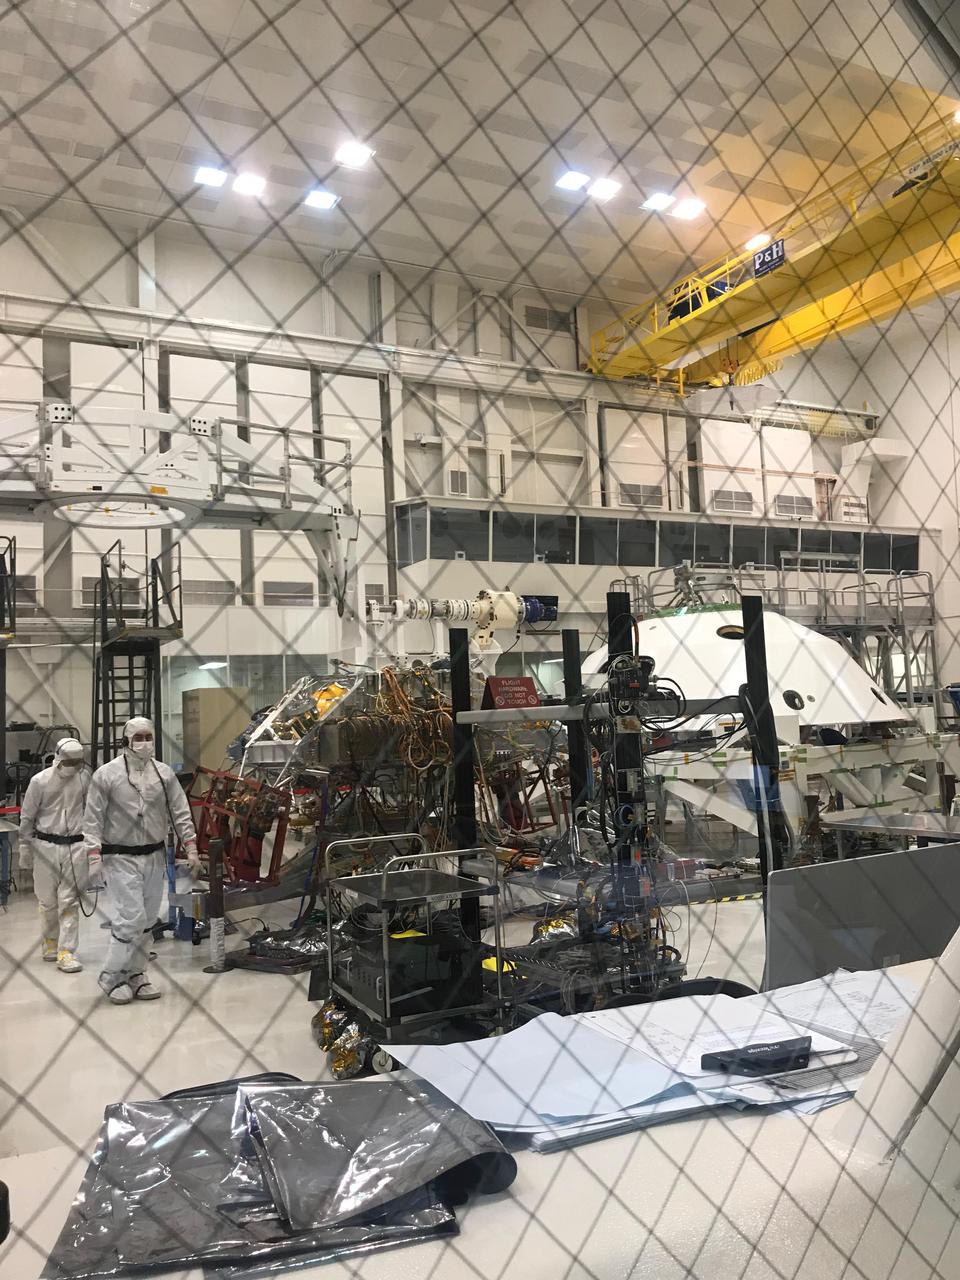
Technicians working Mars 2020's System's Test 1 approach their workstation in the Spacecraft Assembly Facility at NASA's Jet Propulsion Laboratory in Pasadena, Calif. Over two weeks in January 2019, 72 engineers and technicians assigned to the 2020 mission took over the High Bay 1 cleanroom in JPL's Spacecraft Assembly Facility to put the software and electrical systems aboard the mission's cruise, entry capsule, descent stage and rover through their paces. https://photojournal.jpl.nasa.gov/catalog/PIA23097

Federica Polverari, post doctorate researcher at the Jet Propulsion Laboratory, in front of NASA's Beechcraft B-200 Super King Air, N801NA, in N248 in support of NASA’s Sub-Mesoscale Ocean Dynamics Experiment, or S-MODE, mission.
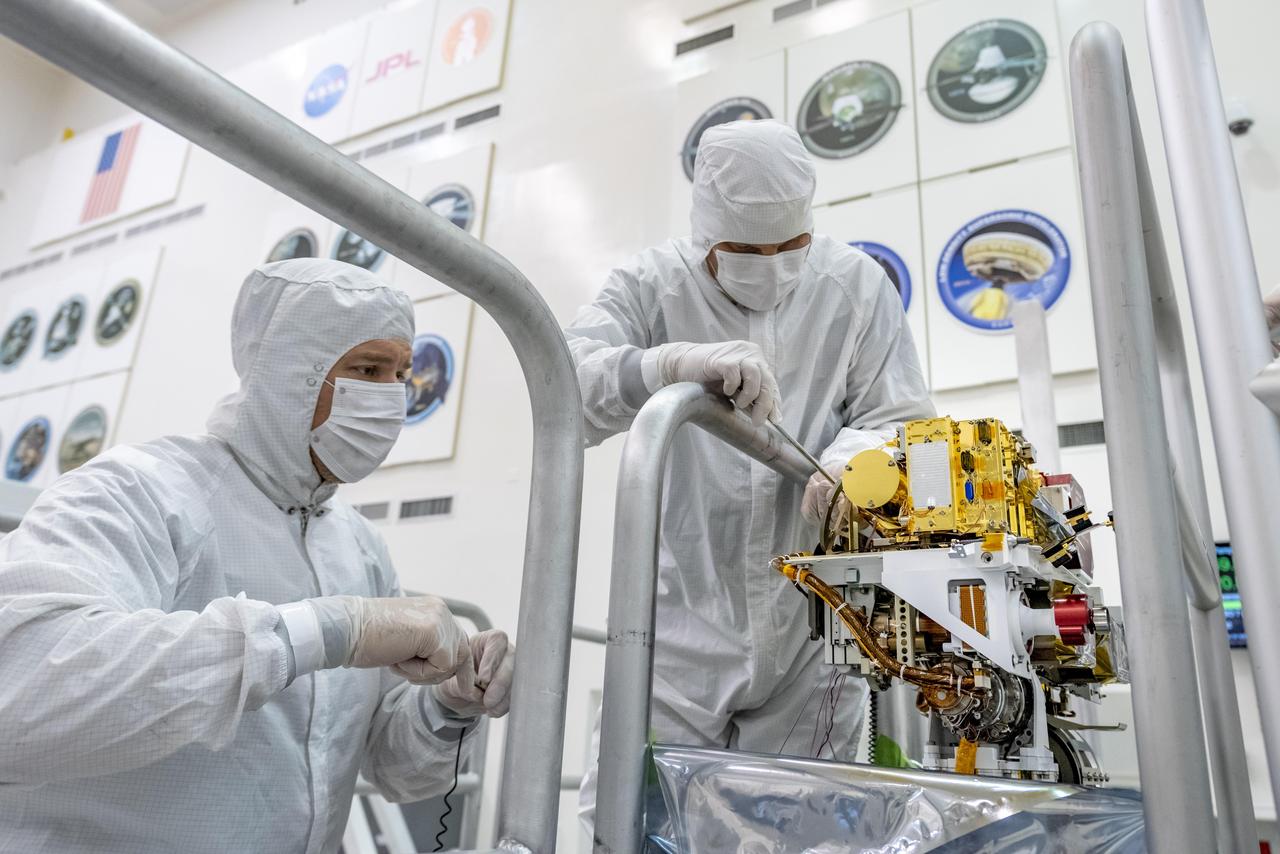
Engineers install the SuperCam instrument on Mars 2020's rover. This image was taken on June 25, 2019, in the Spacecraft Assembly Facility at NASA's Jet Propulsion Laboratory, Pasadena, California. https://photojournal.jpl.nasa.gov/catalog/PIA23307
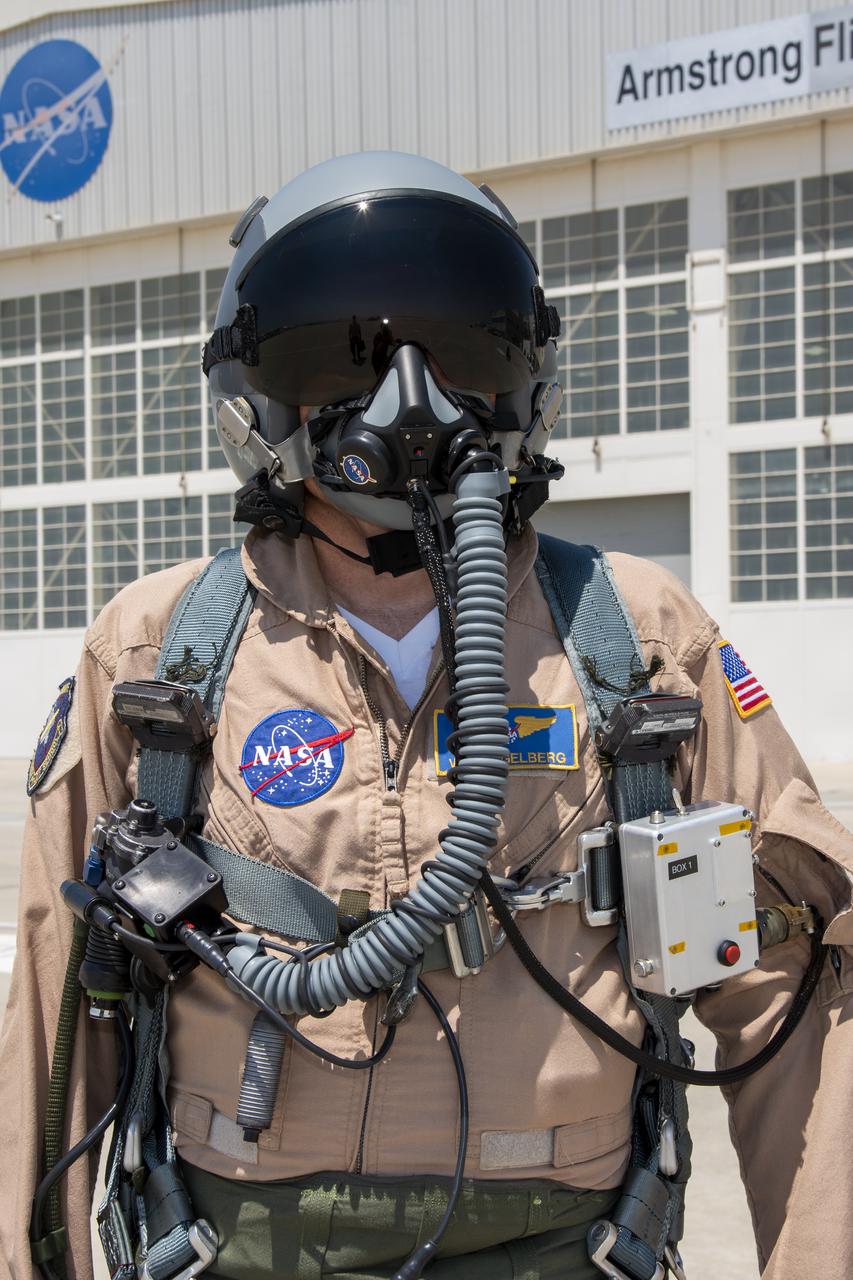
NASA research pilot Wayne Ringelberg wears a U.S. Air Force configuration of the NASA Jet Propulsion Laboratory in California prototype mask, which uses laser sensors to determine levels of carbon dioxide and water exhaled inside the mask. This prototype was tested in conjunction with the current VigilOX system, which measures the pilot’s oxygen concentration, breathing pressures and flow rates. This and the U.S. Navy configuration was used in the Pilot Breathing Assessment program at NASA’s Armstrong Flight Research Center in California.
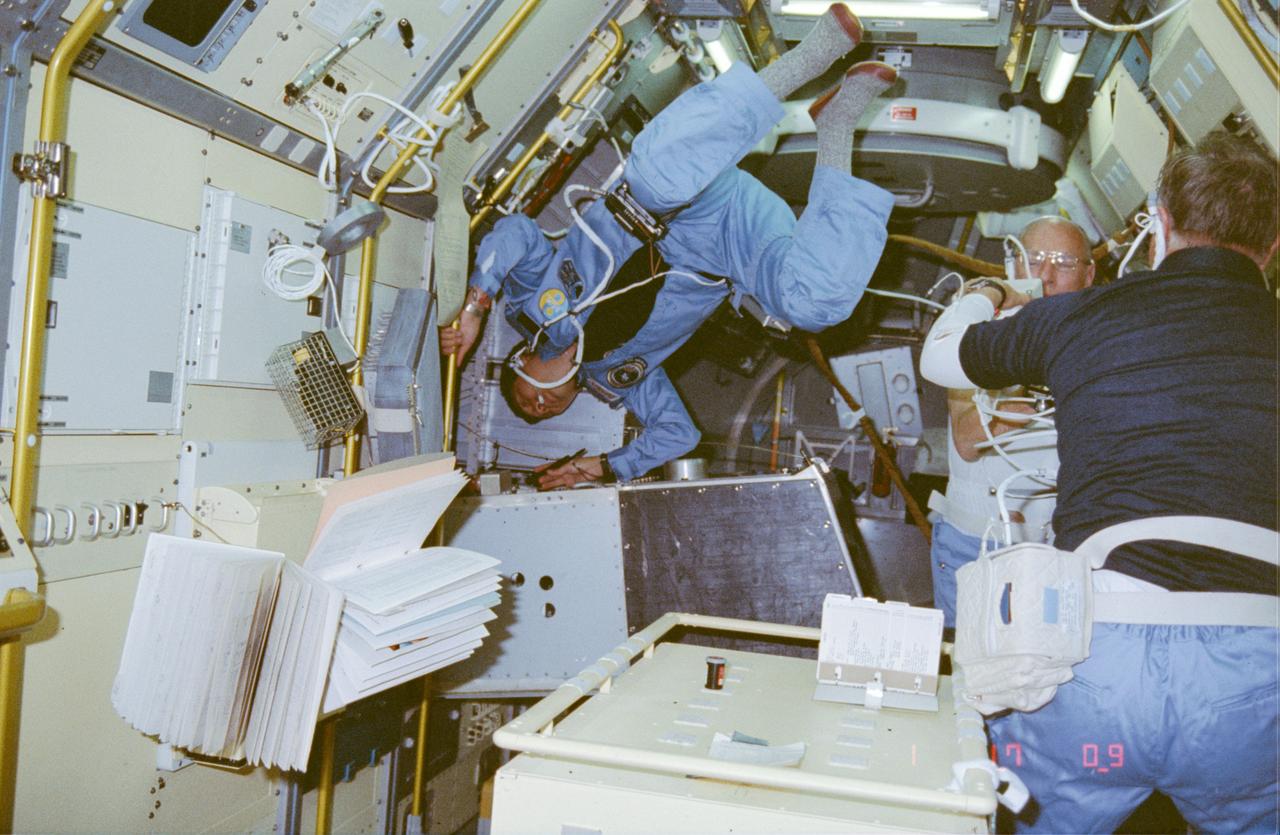
51B-03-035 (29 April-6 May 1985) --- Payload specialist Taylor G. Wang performs a repair task on the Drop Dynamics Module (DDM) in the Science Module aboard the Earth-orbiting Space Shuttle Challenger. The photo was taken with a 35mm camera. Dr. Wang is principal investigator for the first time-to-fly experiment, developed by his team at NASA?s Jet Propulsion Laboratory (JPL), Pasadena, California. This photo was among the first to be released by NASA upon return to Earth by the Spacelab 3 crew.

Jill Seubert, deputy principal investigator, from NASA’s Jet Propulsion Laboratory in Pasadena, California, explains the payload during a NASA prelaunch technology TV broadcast for the Space Test Program-2 (STP-2) mission at the agency’s Kennedy Space Center in Florida on June 23, 2019. The new space clock could improve how we navigate on the Moon, to Mars and beyond. The space clock is one of four NASA payloads scheduled to launch on a SpaceX Falcon Heavy rocket from Launch Complex 39A beginning at 11:30 p.m. EDT on June 24, 2019. STP-2 is managed by the U.S. Air Force Space and Missile Systems Center.

Jill Seubert, deputy principal investigator, from NASA’s Jet Propulsion Laboratory in Pasadena, California, explains the payload during a NASA prelaunch technology TV broadcast for the Space Test Program-2 (STP-2) mission at the agency’s Kennedy Space Center in Florida on June 23, 2019. The new space clock could improve how we navigate on the Moon, to Mars and beyond. The space clock is one of four NASA payloads scheduled to launch on a SpaceX Falcon Heavy rocket from Launch Complex 39A beginning at 11:30 p.m. EDT on June 24, 2019. STP-2 is managed by the U.S. Air Force Space and Missile Systems Center.
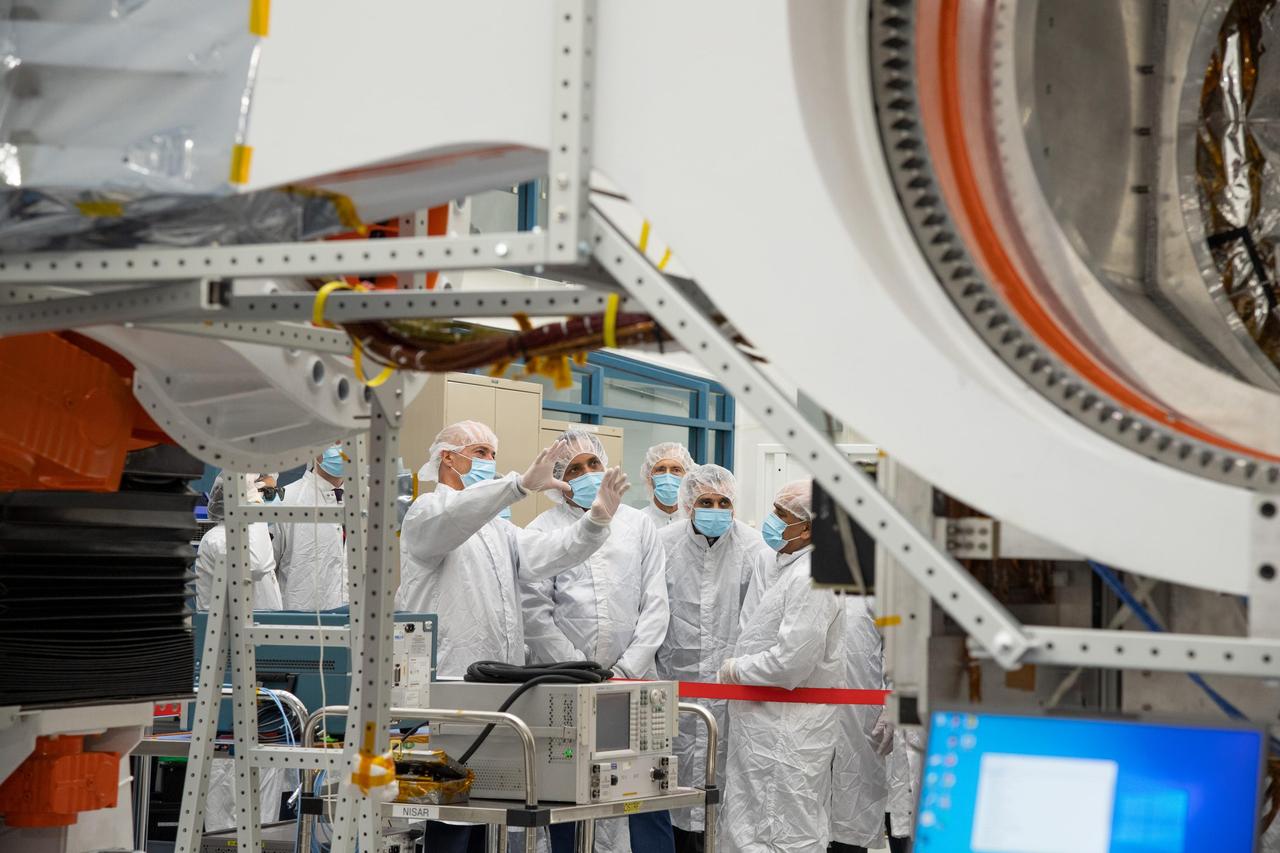
The NISAR mission is a collaboration between NASA and the Indian Space Research Organization (ISRO) that will use two kinds of synthetic aperture radar (SAR) to track subtle changes in Earth's surface: S-band SAR and L-band SAR. (The "S" and "L" denote the wavelength of their signal.) On March 19, 2021, the assembly, test, and launch team at NASA's Jet Propulsion Laboratory in Southern California received the S-band SAR from its partner in India. NISAR, short for NASA-ISRO SAR, will spot warning signs of imminent volcanic eruptions, help to monitor groundwater supplies, track the melt rate of ice sheets tied to sea level rise, and observe shifts in the distribution of vegetation around the world. Movie available at https://photojournal.jpl.nasa.gov/catalog/PIA24137
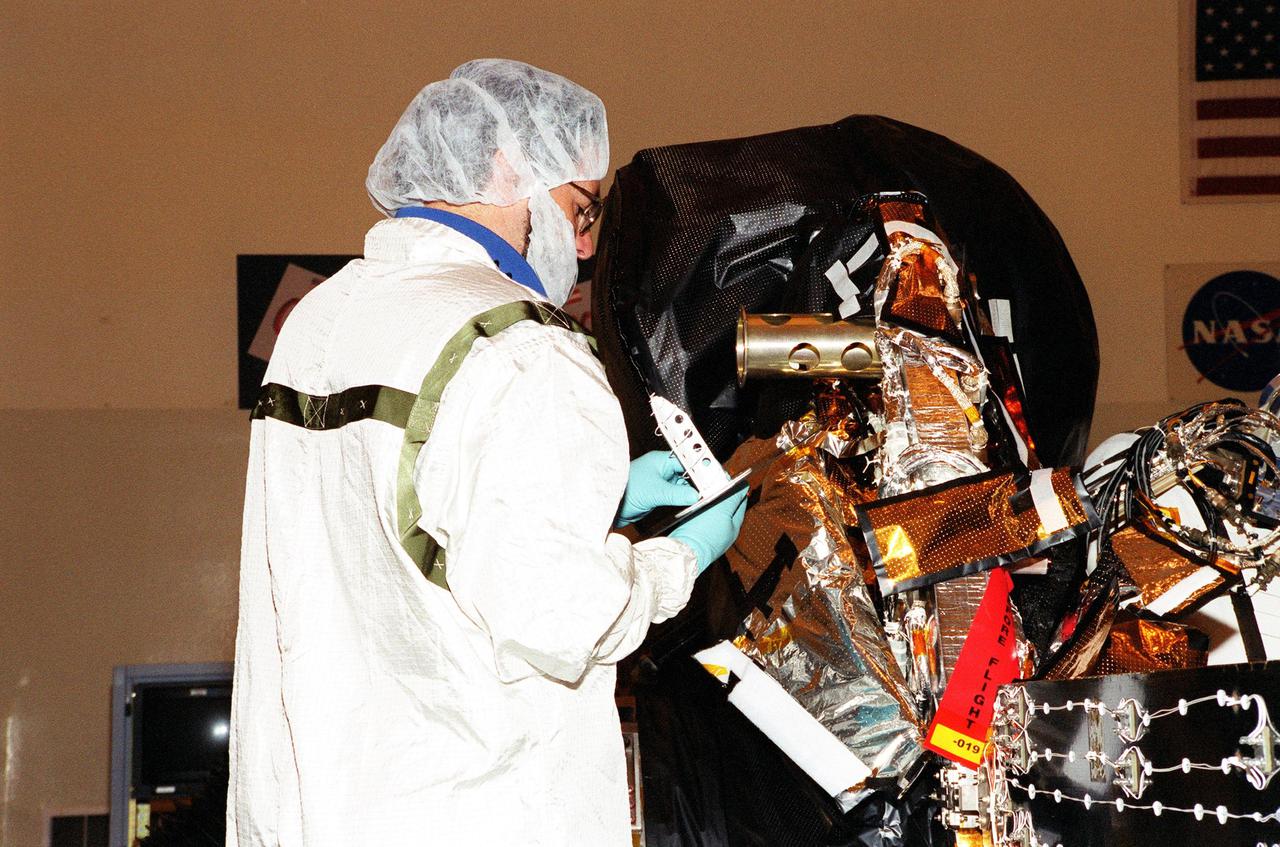
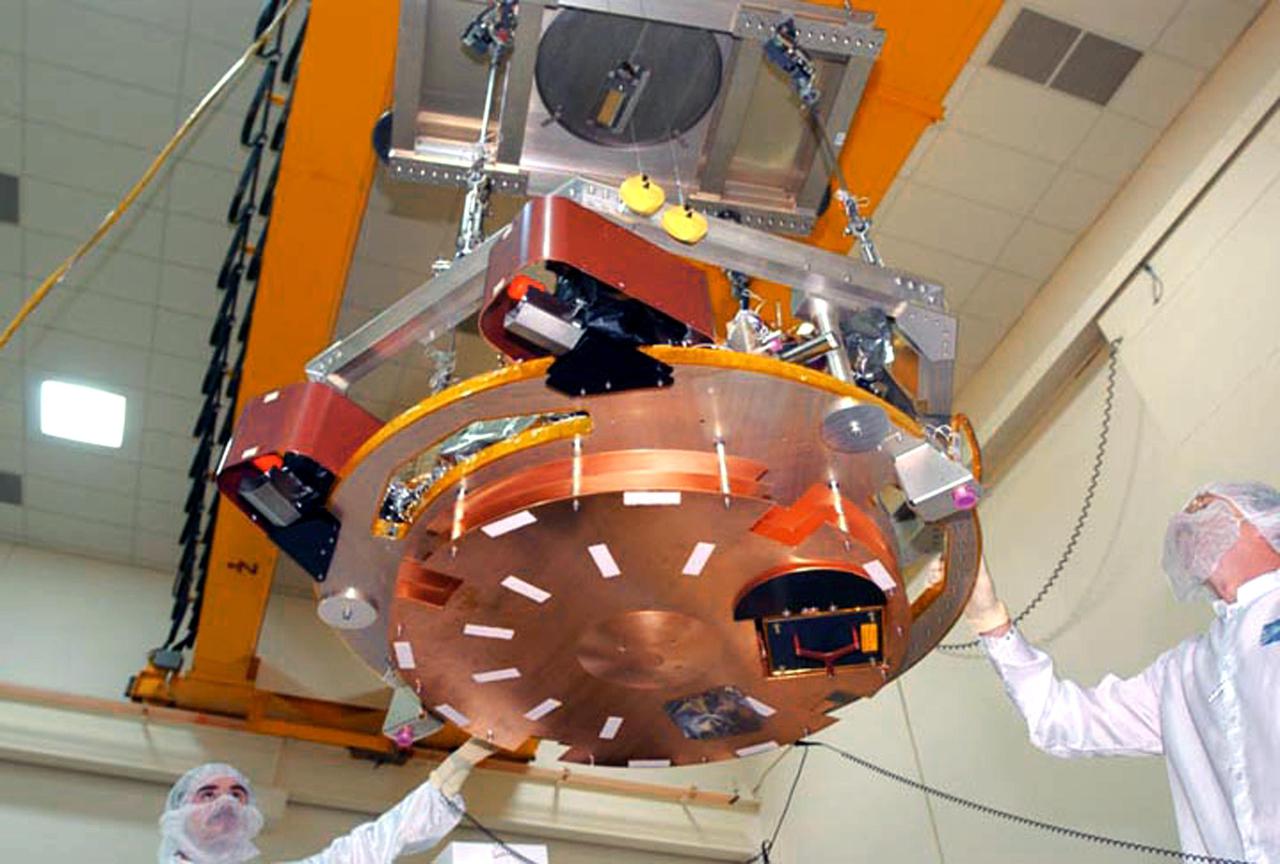
KENNEDY SPACE CENTER, Fla. -- An S-band medium gain antenna is installed on NASA's Genesis spacecraft in the Payload Hazardous Servicing Facility in KSC's industrial area. The spacecraft is undergoing final preparations for its launch aboard a Boeing Delta II rocket on July 30 at 12:36 p.m. EDT. Genesis will capture samples of the ions and elements in the solar wind and return them to Earth for scientists to use to determine the exact composition of the Sun and the solar system's origin. NASA's Genesis project is managed by the Jet Propulsion Laboratory in Pasadena, Calif. Lockheed Martin Astronautics built the Genesis spacecraft for NASA in Denver, Colo
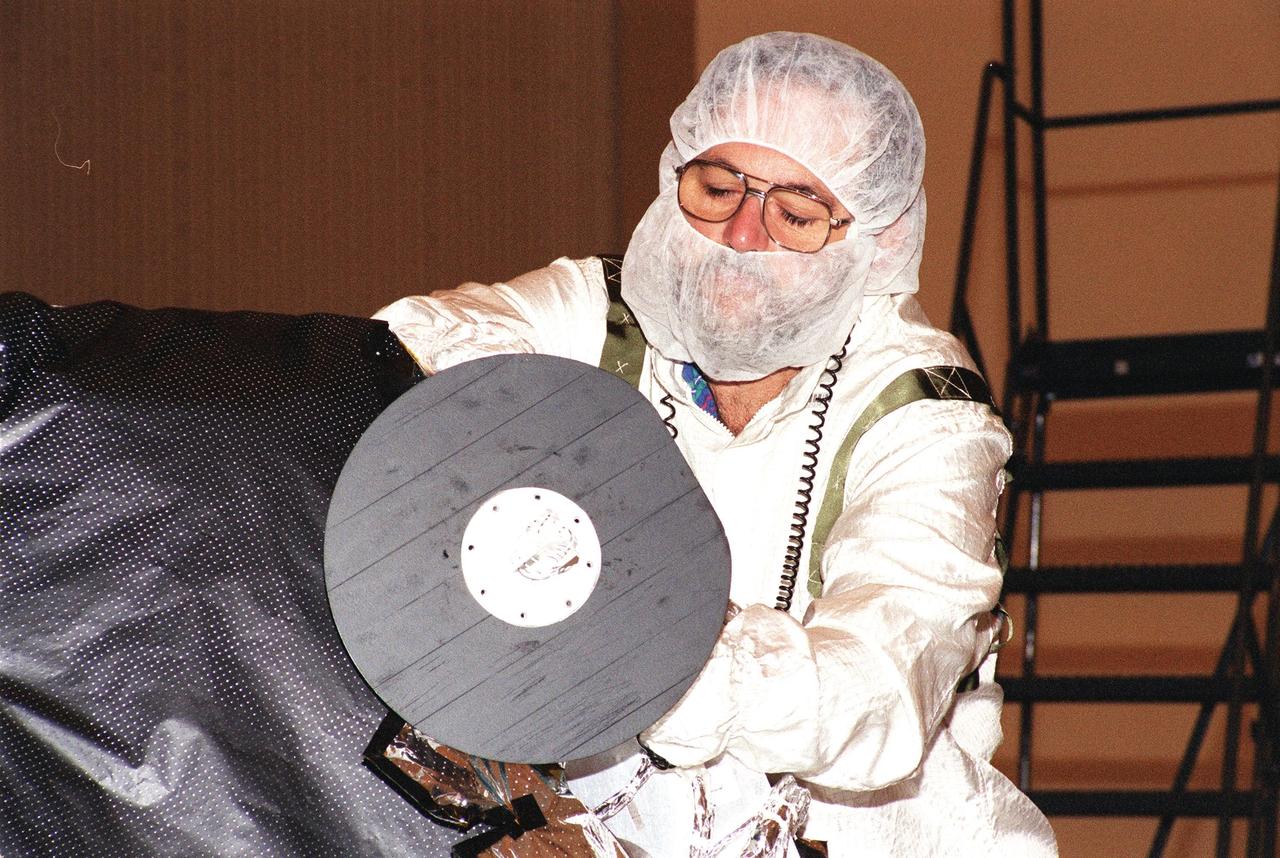
KENNEDY SPACE CENTER, Fla. -- An S-band medium gain antenna is installed on NASA's Genesis spacecraft in the Payload Hazardous Servicing Facility in KSC's industrial area. The spacecraft is undergoing final preparations for its launch aboard a Boeing Delta II rocket on July 30 at 12:36 p.m. EDT. Genesis will capture samples of the ions and elements in the solar wind and return them to Earth for scientists to use to determine the exact composition of the Sun and the solar system's origin. NASA's Genesis project is managed by the Jet Propulsion Laboratory in Pasadena, Calif. Lockheed Martin Astronautics built the Genesis spacecraft for NASA in Denver, Colo
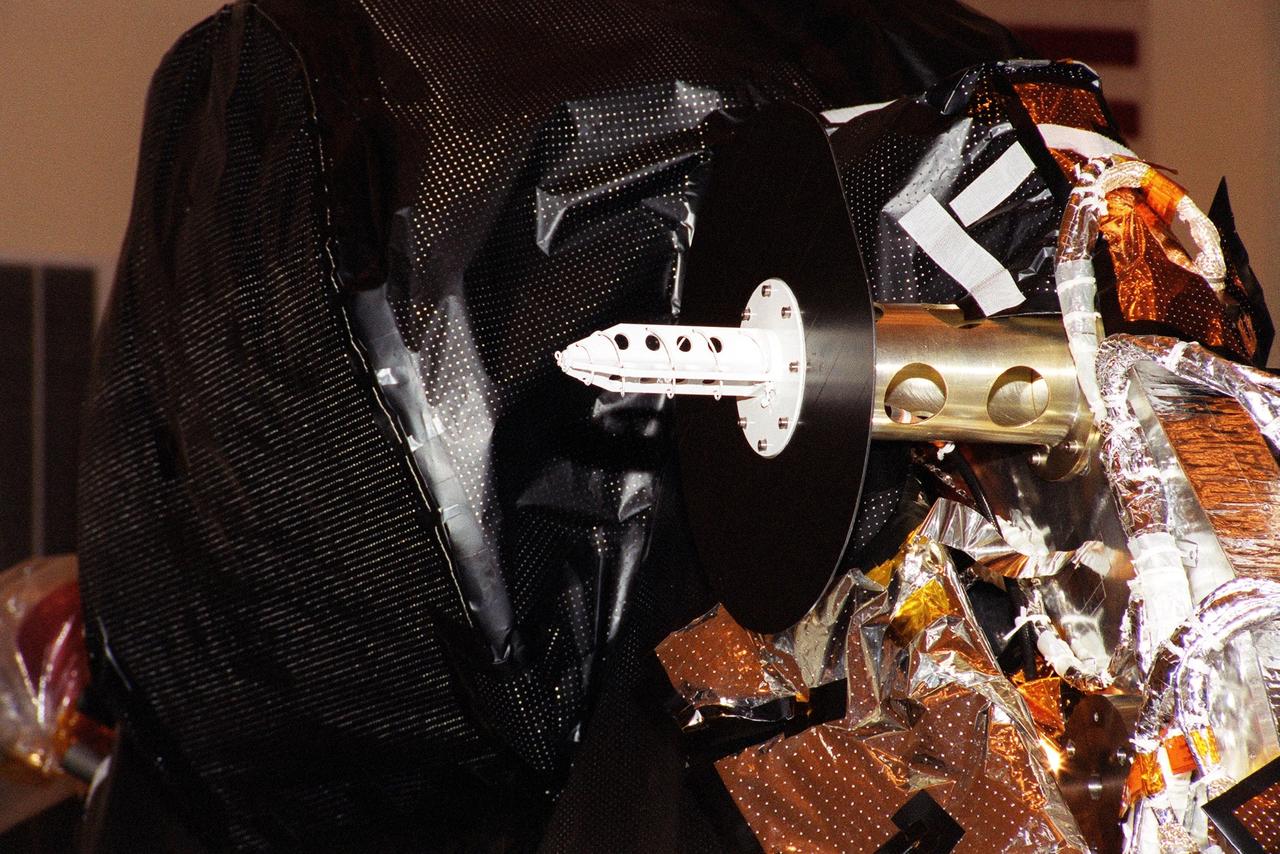
KENNEDY SPACE CENTER, Fla. -- An S-band medium gain antenna is installed on NASA's Genesis spacecraft in the Payload Hazardous Servicing Facility in KSC's industrial area. The spacecraft is undergoing final preparations for its launch aboard a Boeing Delta II rocket on July 30 at 12:36 p.m. EDT. Genesis will capture samples of the ions and elements in the solar wind and return them to Earth for scientists to use to determine the exact composition of the Sun and the solar system's origin. NASA's Genesis project is managed by the Jet Propulsion Laboratory in Pasadena, Calif. Lockheed Martin Astronautics built the Genesis spacecraft for NASA in Denver, Colo
On March 20, 2021, members of the NISAR mission at NASA's Jet Propulsion Laboratory in Southern California received the S-band synthetic aperture radar (SAR) from their partner in India. Together with the L-band SAR provided by JPL, the two radars serve as the beating heart of the mission (the "S" and "L" denote the wavelength of the signal they transmit). A collaboration between NASA and the Indian Space Research Organization (ISRO), NISAR (short for NASA-ISRO SAR) will use SAR to track subtle changes in Earth's surface. In doing so, it will spot warning signs of imminent volcanic eruptions, help to monitor groundwater supplies, track the melt rate of ice sheets tied to sea level rise, and observe shifts in the distribution of vegetation around the world. https://photojournal.jpl.nasa.gov/catalog/PIA24138
JET PROPULSION LABORATORY, CALIF. - The impactor of the Deep Impact spacecraft, suspended by an overhead crane, undergoes inspection in the Fischer Assembly building at Ball Aerospace in Boulder, Colo. Deep Impact will probe beneath the surface of Comet Tempel 1 on July 4, 2005, when the comet is 83 million miles from Earth, and reveal the secrets of its interior. After releasing a 3- by 3-foot projectile (impactor) to crash onto the surface, Deep Impact’s flyby spacecraft will collect pictures and data of how the crater forms, measuring the crater’s depth and diameter, as well as the composition of the interior of the crater and any material thrown out, and determining the changes in natural outgassing produced by the impact. The impactor will separate from the flyby spacecraft 24 hours before it impacts the surface of Tempel 1's nucleus. The impactor delivers 19 Gigajoules (that's 4.8 tons of TNT) of kinetic energy to excavate the crater. This kinetic energy is generated by the combination of the mass of the impactor and its velocity when it impacts. To accomplish this feat, the impactor uses a high-precision star tracker, the Impactor Target Sensor (ITS), and Auto-Navigation algorithms developed by Jet Propulsion Laboratory to guide it to the target. Deep Impact is a NASA Discovery mission. Launch of Deep Impact is scheduled for Jan. 12 from Launch Pad 17-B, Cape Canaveral Air Force Station, Fla.
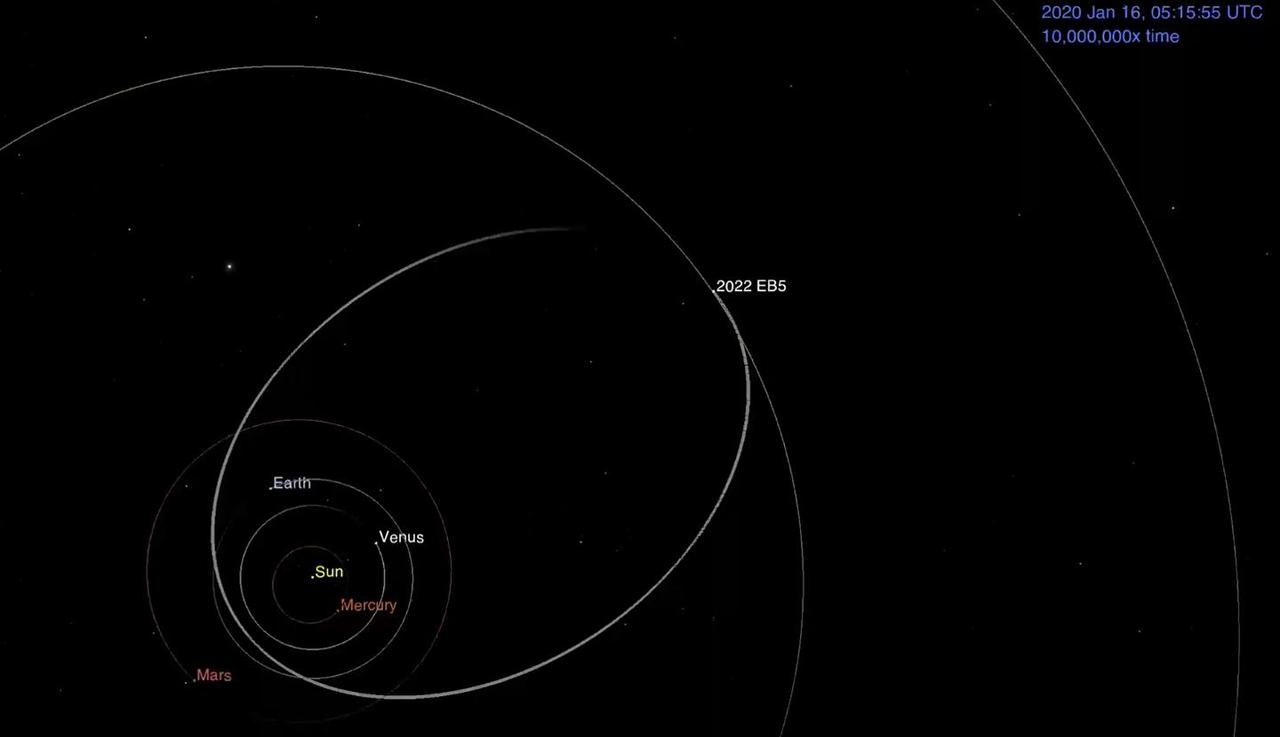
This animation shows asteroid 2022 EB5's predicted orbit around the Sun before impacting into the Earth's atmosphere on March 11, 2022. The asteroid – estimated to be about 6 ½ feet (2 meters) wide – was discovered two hours before impact. Using NASA's Scout impact hazard assessment system, members of the Center for Near Earth Object Studies (CNEOS) – which is managed by NASA's Jet Propulsion Laboratory in Southern California – accurately predicted where and when the asteroid would harmlessly break up in Earth's atmosphere. Infrasound sensors, which can detect low frequency sound waves as they travel through the atmosphere, confirmed the impact occurred over the Norwegian Sea, southwest of Norway's Jan Mayen island. Animation available at https://photojournal.jpl.nasa.gov/catalog/PIA24568
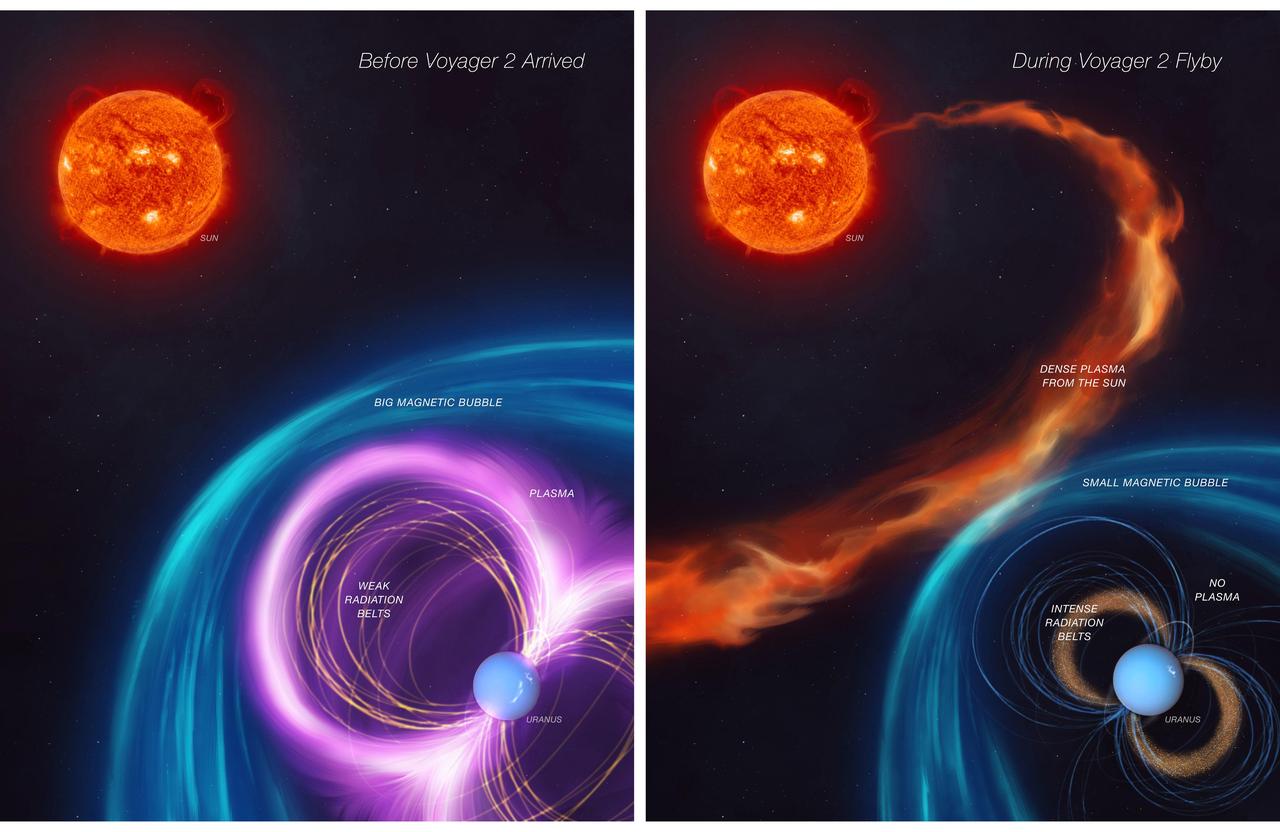
When NASA's Voyager 2 spacecraft flew by Uranus in 1986, it provided scientists' first – and, so far, only – close glimpse of this outer planet. Scientists were confronted by a mystery: The energized particles around the planet defied their understanding of how magnetic fields work to trap particle radiation. The first panel of this artist's concept depicts how Uranus's magnetosphere (its protective bubble) was behaving before Voyager 2's flyby. The second panel shows that an unusual kind of solar weather was happening at the same time as the spacecraft's flyby, giving scientists a skewed view of Uranus's magnetosphere. The work, led by a scientist at NASA's Jet Propulsion Laboratory and described in a paper published in Nature Astronomy in November 2024, contributes to scientists' understanding of this enigmatic planet. It also opens the door to the possibility that Uranus' five major moons may be active. https://photojournal.jpl.nasa.gov/catalog/PIA26069
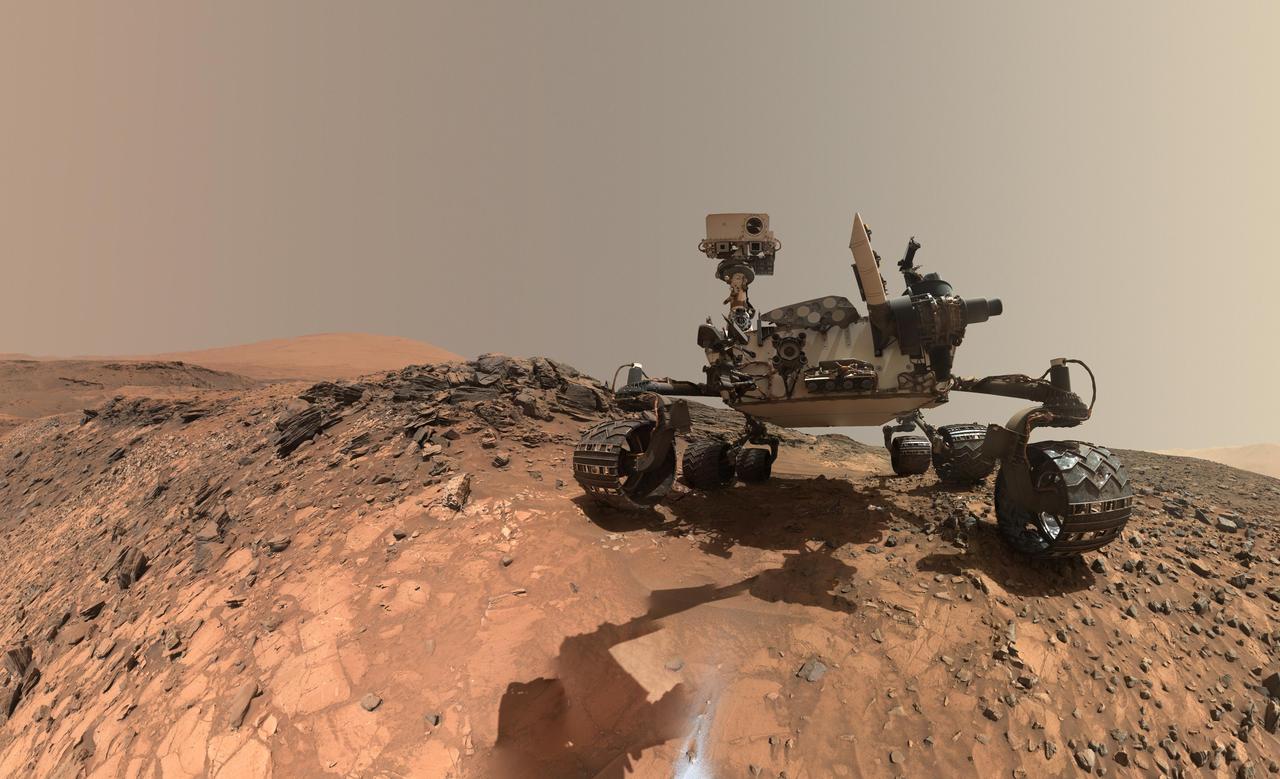
This low-angle self-portrait of NASA's Curiosity Mars rover shows the vehicle at the site from which it reached down to drill into a rock target called "Buckskin" on lower Mount Sharp. The selfie combines several component images taken by Curiosity's Mars Hand Lens Imager (MAHLI) on Aug. 5, 2015, during the 1,065th Martian day, or sol, of the rover's work on Mars. For scale, the rover's wheels are 20 inches (50 centimeters) in diameter and about 16 inches (40 centimeters) wide. This view is a portion of a larger panorama available at PIA19807. A close look reveals a small rock stuck onto Curiosity's left middle wheel (on the right in this head-on view). The rock had been seen previously during periodic monitoring of wheel condition about three weeks earlier, in the MAHLI raw image at http://mars.nasa.gov/msl/multimedia/raw/?rawid=1046MH0002640000400290E01_DXXX&s=1046. MAHLI is mounted at the end of the rover's robotic arm. For this self-portrait, the rover team positioned the camera lower in relation to the rover body than for any previous full self-portrait of Curiosity. This yielded a view that includes the rover's "belly," as in a partial self-portrait (/catalog/PIA16137) taken about five weeks after Curiosity's August 2012 landing inside Mars' Gale Crater. The selfie at Buckskin does not include the rover's robotic arm beyond a portion of the upper arm held nearly vertical from the shoulder joint. With the wrist motions and turret rotations used in pointing the camera for the component images, the arm was positioned out of the shot in the frames or portions of frames used in this mosaic. This process was used previously in acquiring and assembling Curiosity self-portraits taken at sample-collection sites "Rocknest" (PIA16468), "John Klein" (PIA16937), "Windjana" (PIA18390) and "Mojave" (PIA19142). MAHLI was built by Malin Space Science Systems, San Diego. NASA's Jet Propulsion Laboratory, a division of the California Institute of Technology in Pasadena, manages the Mars Science Laboratory Project for the NASA Science Mission Directorate, Washington. JPL designed and built the project's Curiosity rover. MAHLI was built by Malin Space Science Systems, San Diego. NASA's Jet Propulsion Laboratory, a division of the California Institute of Technology in Pasadena, manages the Mars Science Laboratory Project for the NASA Science Mission Directorate, Washington. JPL designed and built the project's Curiosity rover. http://photojournal.jpl.nasa.gov/catalog/PIA19808
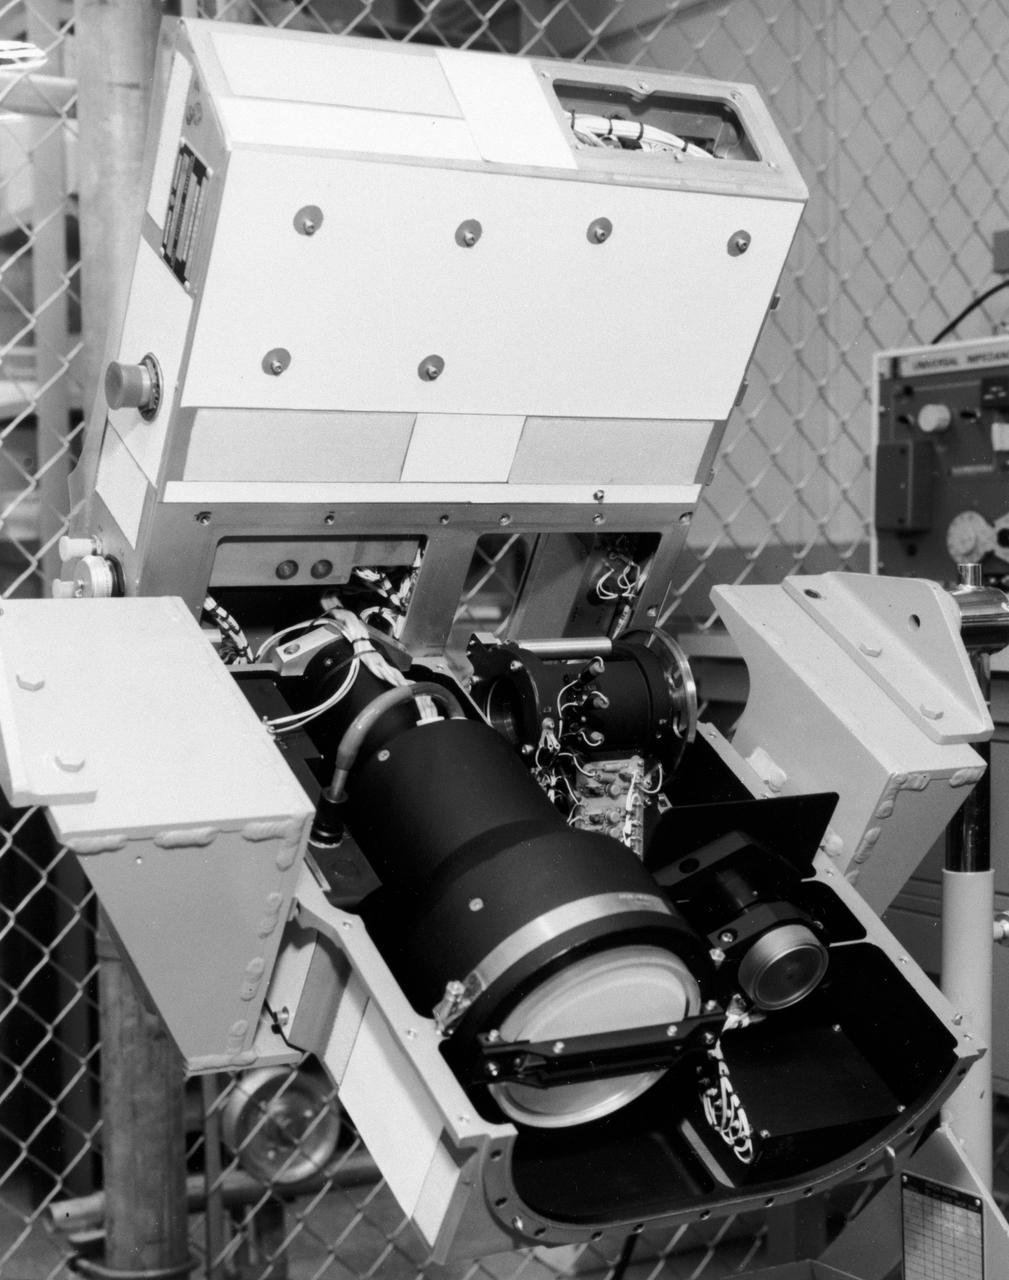
S72-49482 (November 1972) --- The Optical Recorder of the Lunar Sounder Experiment (S-209) which will be mounted in the SIM bay of the Apollo 17 Service Module. The three functional parts of the Lunar Sounder are the optical recorder, the coherent synthetic aperture radar, and the antennas, a retractable dipole for HF and a yagi for VHF. The Lunar Sounder will probe three-quarters of a mile below the moon's surface from the orbiting Apollo 17 spacecraft. Electronic data recorded on film will be retrieved by the crew during trans-Earth EVA. Geologic information on the lunar interior obtained by the sounder will permit scientific investigation of underground rock layers, lava flow patterns, rille (canyon) structures, mascon properties, and any areas containing water. A prototype lunar sounder has been flight tested in aircraft over selected Earth sites to confirm the equipment design and develop scientific analysis techniques. The Lunar Sounder Experiment was developed by North American Rockwell's (NR) Space Division for NASA's Manned Spacecraft Center to provide data for a scientific investigation team with representatives from the Jet Propulsion Laboratory, University of Utah, University of Michigan, U.S. Geological Survey, and NASA Ames Research Center.
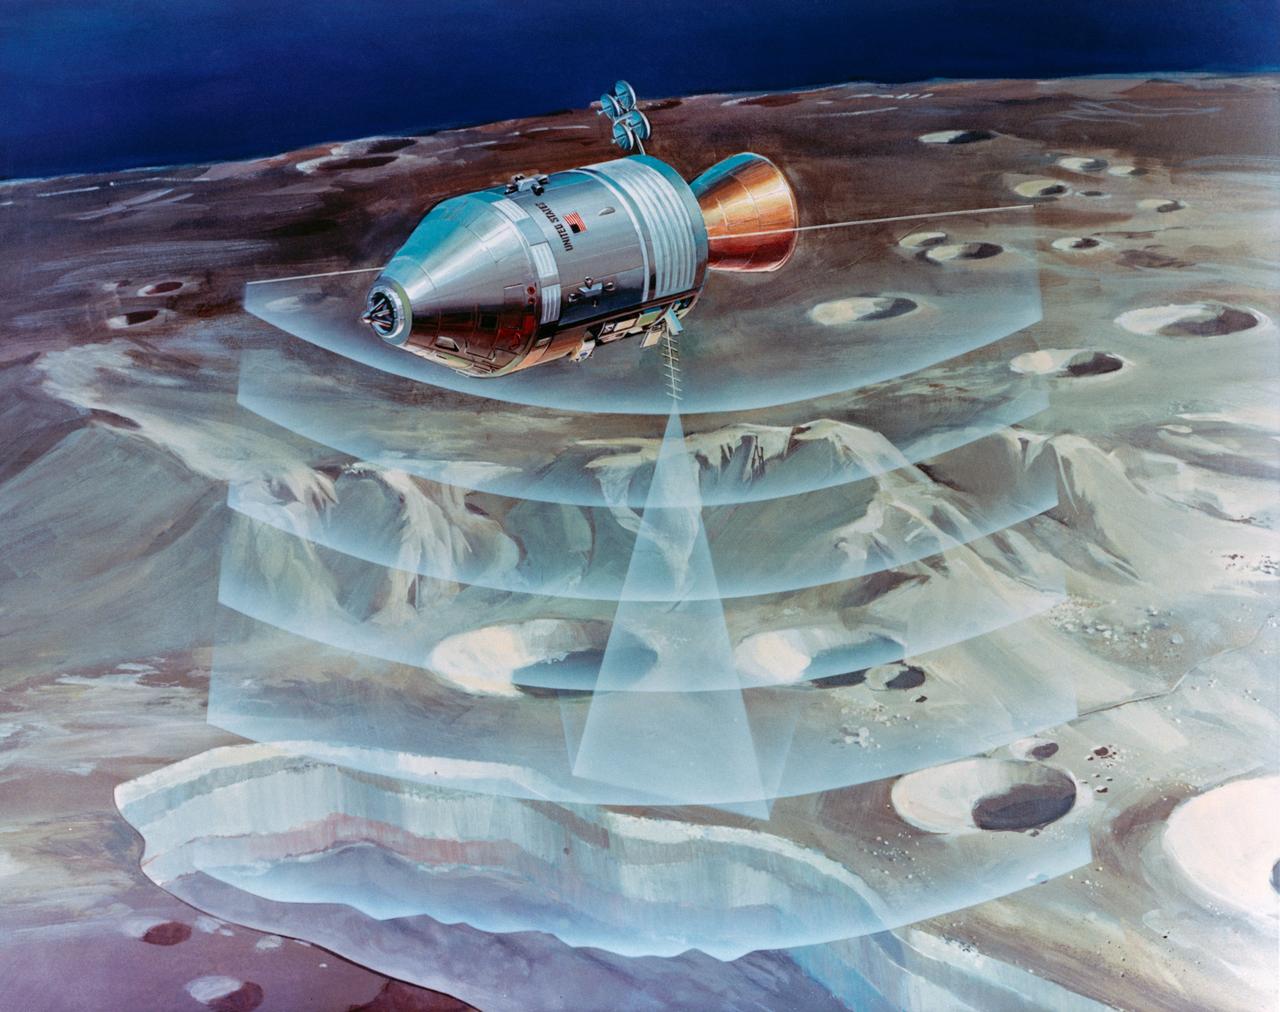
S72-53472 (November 1972) --- An artist's concept illustrating how radar beams of the Apollo 17 lunar sounder experiment will probe three-quarters of a mile below the moon's surface from the orbiting spacecraft. The Lunar Sounder will be mounted in the SIM bay of the Apollo 17 Service Module. Electronic data recorded on film will be retrieved by the crew during trans-Earth EVA. Geologic information on the lunar interior obtained by the sounder will permit scientific investigation of underground rock layers, lava flow patterns, rille (canyon) structures, mascon properties, and any areas containing water. A prototype lunar sounder has been flight tested in aircraft over selected Earth sites to confirm the equipment design and develop scientific analysis techniques. The Lunar Sounder Experiment (S-209) was developed by North American Rockwell's (NR) Space Division for NASA's Manned Spacecraft Center to provide data for a scientific investigation team with representatives from the Jet Propulsion Laboratory, University of Utah, University of Michigan, U.S. Geological Survey, and NASA Ames Research Center.
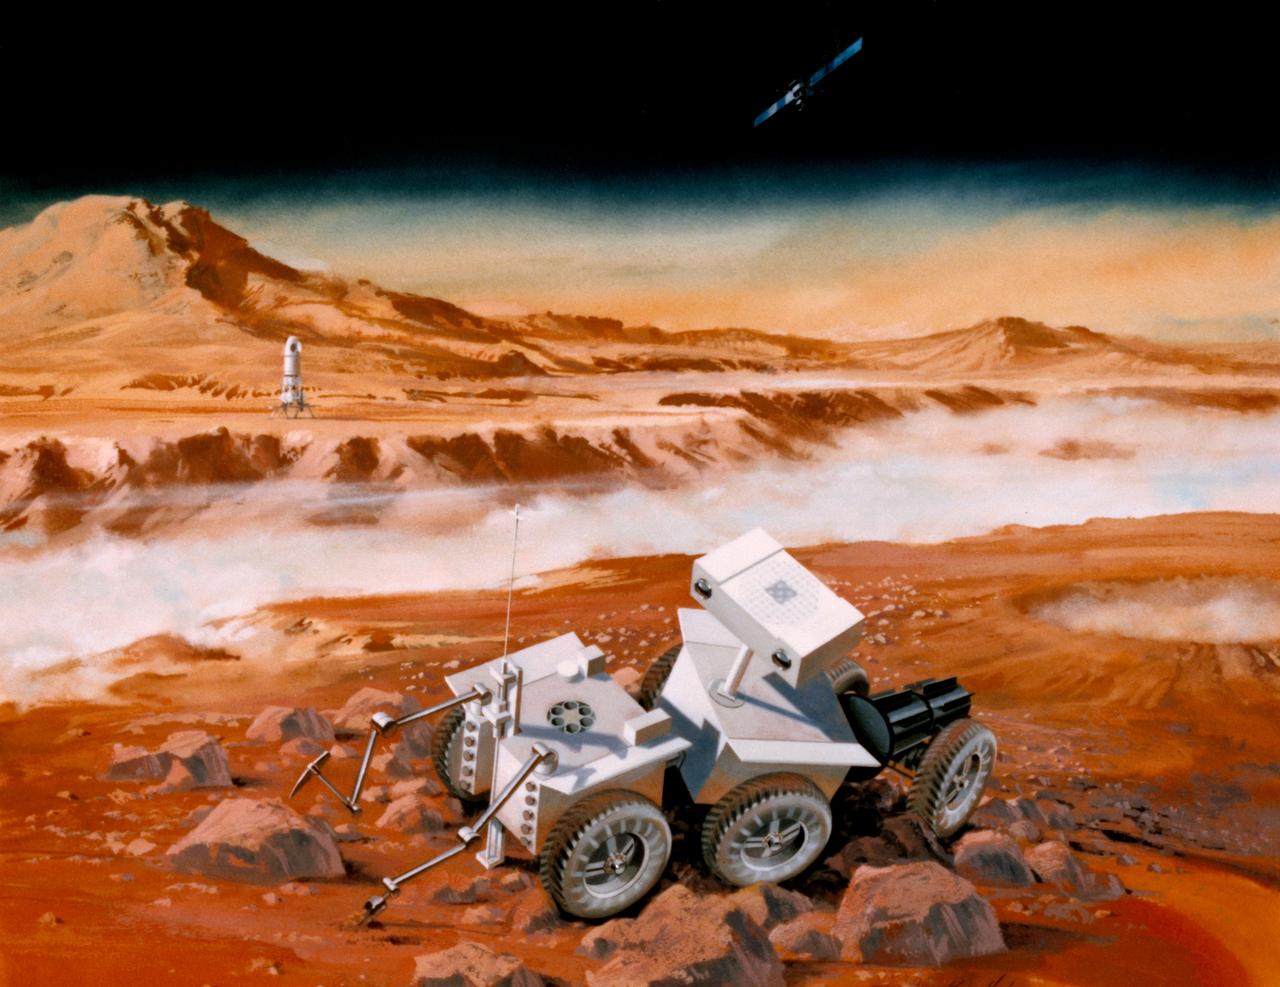
S87-35313 (15 May 1987)--- This artist's rendering illustrates a Mars Sample Return mission under study at Jet Propulsion Laboratory (JPL) and the NASA Johnson Space Center (JSC). As currently envisioned, the spacecraft would be launched in the mid to late 1990's into Earth-orbit by a space shuttle, released from the shuttle's cargo bay and propelled toward Mars by an upper-stage engine. A lander (left background) would separate from an orbiting vehicle (upper right) and descend to the planet's surface. The lander's payload would include a robotic rover (foreground), which would spend a year moving about the Martian terrain collecting scientifically significant rock and soil samples. The rover would then return to the lander and transfer its samples to a small rocket that would carry them into orbit and rendezvous with the orbiter for a return to Earth. As depicted here the rover consists of three two-wheeled cabs, and is fitted with a stereo camera vision system and tool-equipped arms for sample collection. The Mars Sample Return studies are funded by NASA's Office of Space Science and Applications.
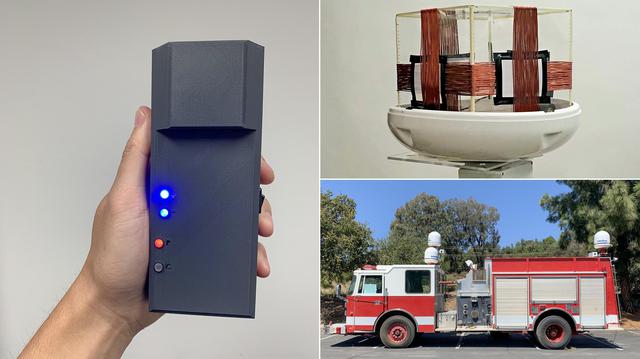
To help locate and track firefighters inside buildings, where other positioning technologies fail, NASA's Jet Propulsion Laboratory and the Department of Homeland Security Science and Technology Directorate (S&T) are developing POINTER. Short for Precision Outdoor and Indoor Navigation and Tracking for Emergency Responders, the system began taking shape in 2014 and is being matured for use by fire departments nationwide. The POINTER system is composed of three parts: a receiver, transmitter, and base station. The receiver (left) has been shrunk from the size of a backpack to the size of a large smartphone, and further development will miniaturize it so it can be easily clipped to a belt buckle. The transmitter (top right) is a system of coils that generate the magnetoquasistatic fields, which — unlike the radio waves used by GPS and radio-frequency identification — are able to pass through construction materials to interact with the receiver, enabling fire crews to track the location and orientation of firefighters. To test the system, transmitters have been attached to an out-of-service firetruck (lower right). Through 2021, POINTER will undergo field tests and a commercial version of POINTER will be made available to fire departments in 2022. https://photojournal.jpl.nasa.gov/catalog/PIA24562
KENNEDY SPACE CENTER, FLA. - At Ball Aerospace in Boulder, Colo., the impactor on the Deep Impact spacecraft is tested. Deep Impact will probe beneath the surface of Comet Tempel 1 on July 4, 2005, when the comet is 83 million miles from Earth, and reveal the secrets of its interior. After releasing a 3- by 3-foot projectile (impactor) to crash onto the surface, Deep Impact’s flyby spacecraft will collect pictures and data of how the crater forms, measuring the crater’s depth and diameter, as well as the composition of the interior of the crater and any material thrown out, and determining the changes in natural outgassing produced by the impact. The impactor will separate from the flyby spacecraft 24 hours before it impacts the surface of Tempel 1's nucleus. The impactor delivers 19 Gigajoules (that's 4.8 tons of TNT) of kinetic energy to excavate the crater. This kinetic energy is generated by the combination of the mass of the impactor and its velocity when it impacts. To accomplish this feat, the impactor uses a high-precision star tracker, the Impactor Target Sensor (ITS), and Auto-Navigation algorithms developed by Jet Propulsion Laboratory to guide it to the target. Deep Impact is a NASA Discovery mission. Launch of Deep Impact is scheduled for Jan. 12 from Launch Pad 17-B, Cape Canaveral Air Force Station, Fla.

In a conference room at NASA's Jet Propulsion Laboratory in Southern California, members of the Voyager mission team gathered April 20, 2024, to find out if an issue on Voyager 1 had been partially resolved. Just after 6:40 a.m., a cheer went up around the room as the group heard back from the spacecraft: It was returning engineering data for the first time since November 2023. Nearly two full days earlier, the team had sent a series of commands to move a section of software code used by the flight data subsystem (FDS) computer to a new location. The physical location where the code was previously stored has been damaged, causing the mission to go five months without receiving science or engineering data. But the commands were a success, and the team received data about the health and status of the spacecraft, prompting celebration. The commands were sent on April 18, 2024. Due to Voyager 1's distance from Earth – over 15 billion miles or 24 billion kilometers – a radio signal takes about 22 ½ hours to travel to the spacecraft, and 22 ½ hours to return to Earth. https://photojournal.jpl.nasa.gov/catalog/PIA26275
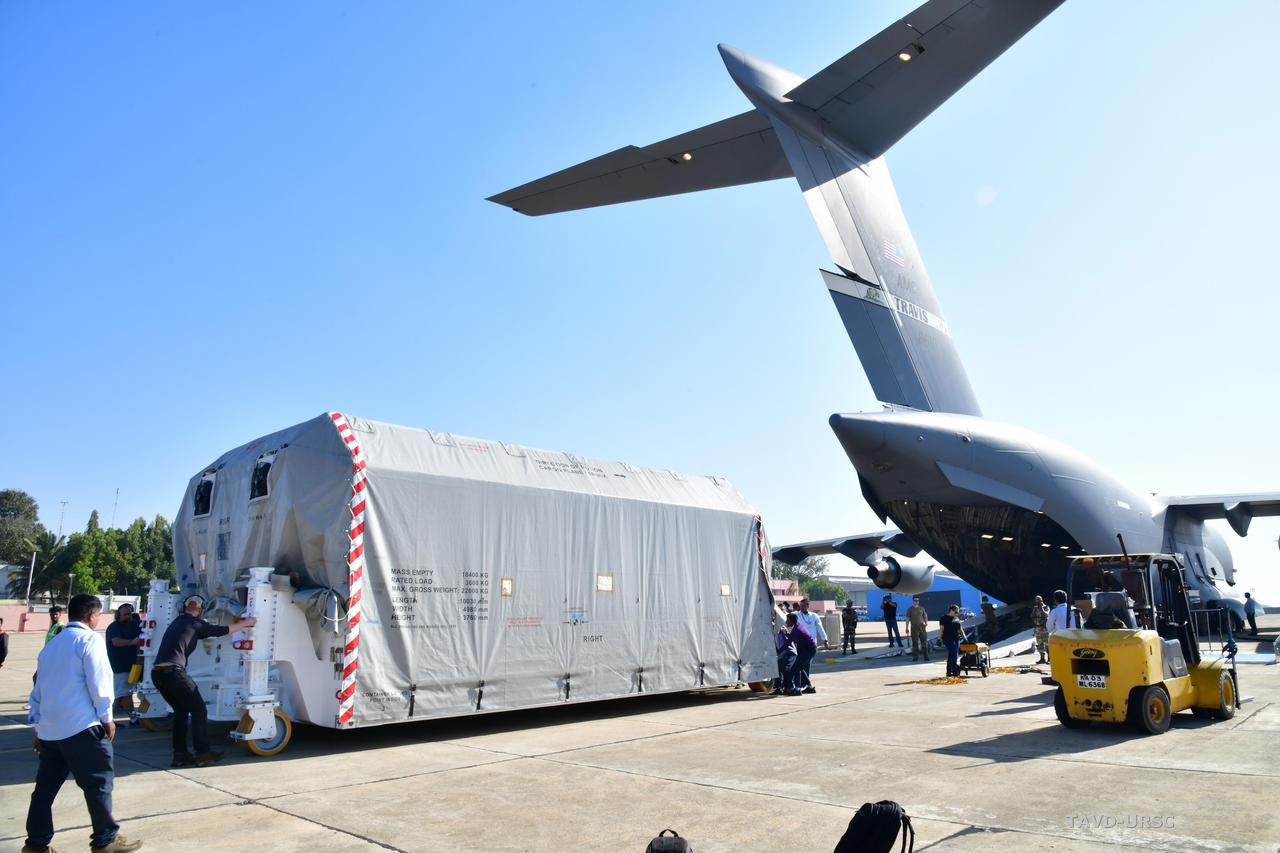
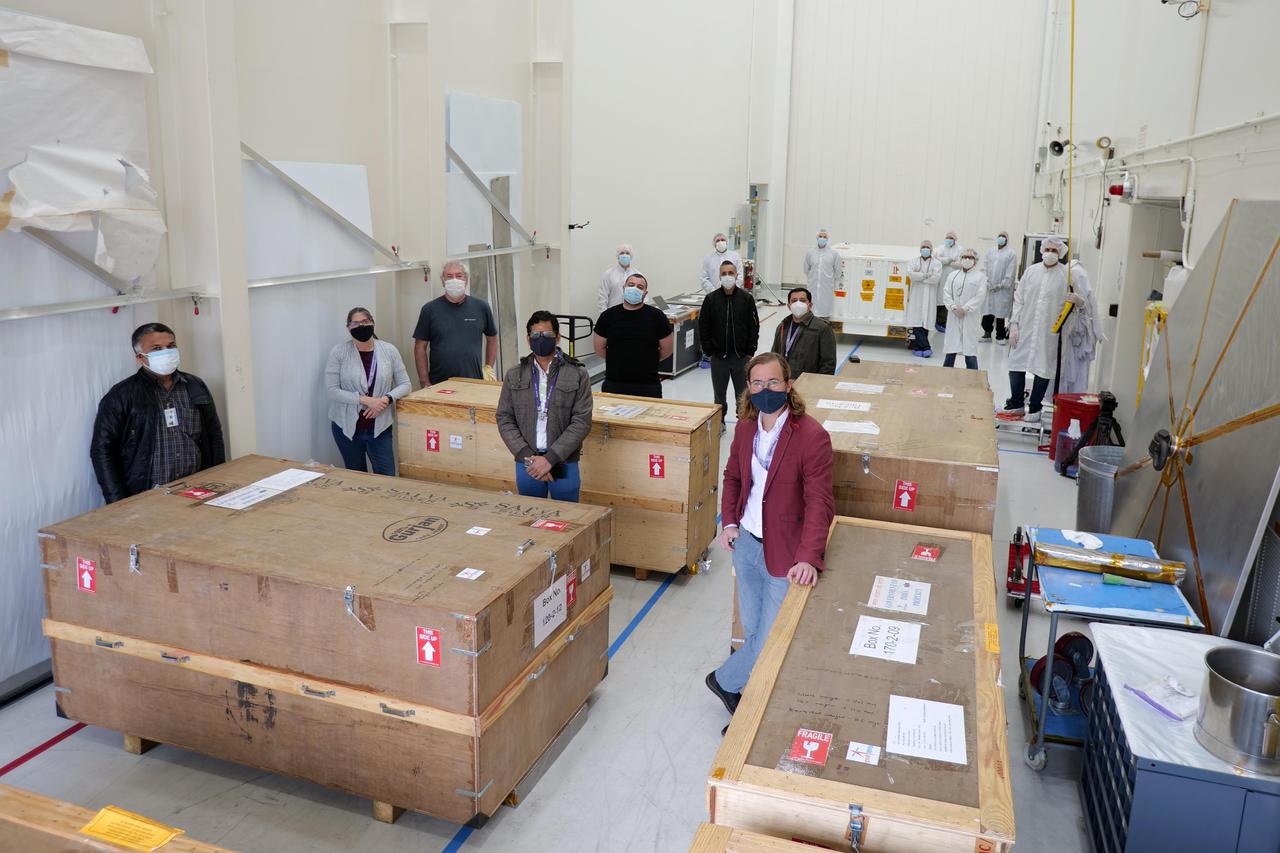
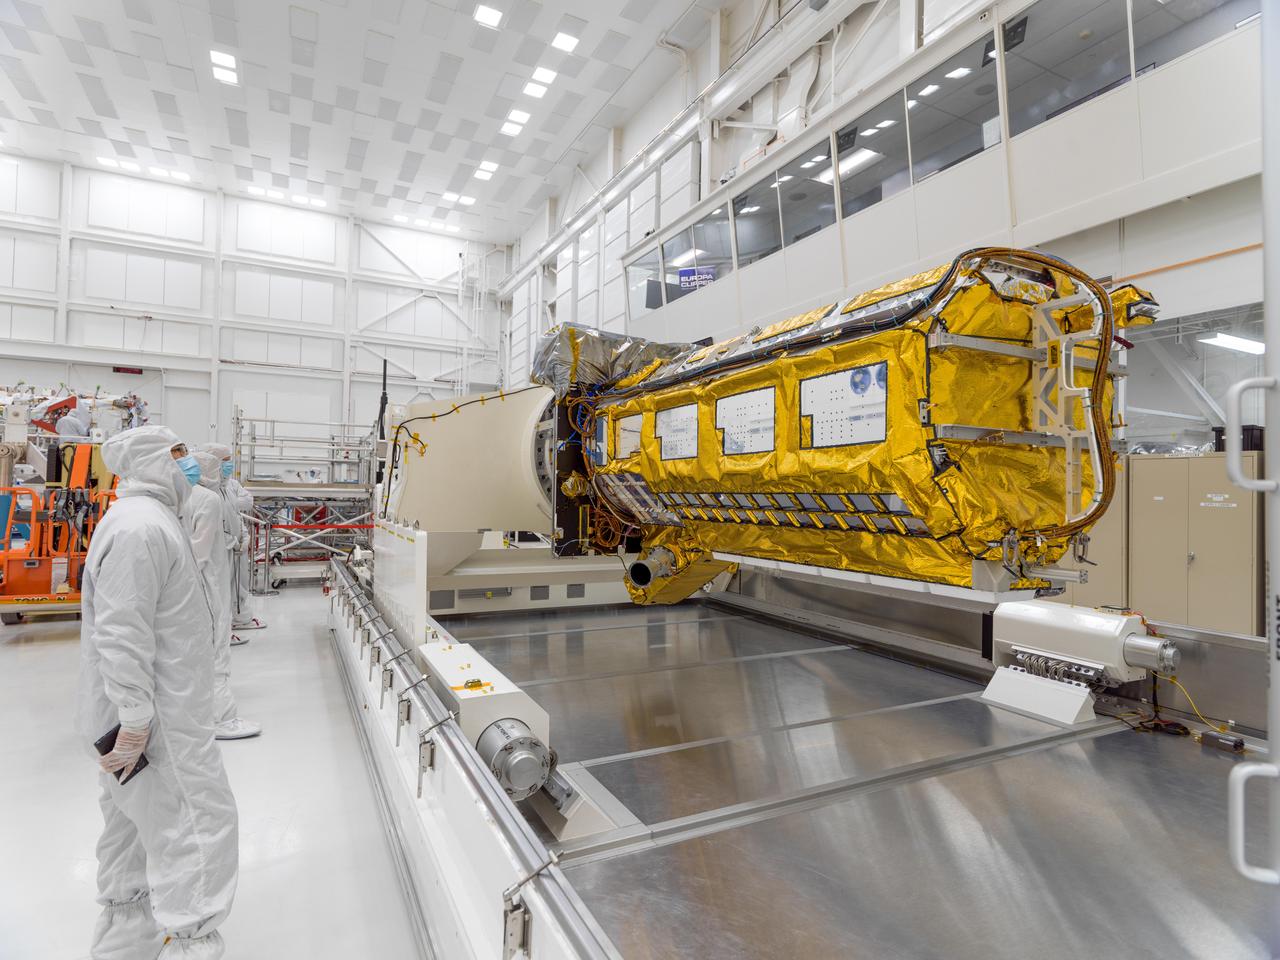
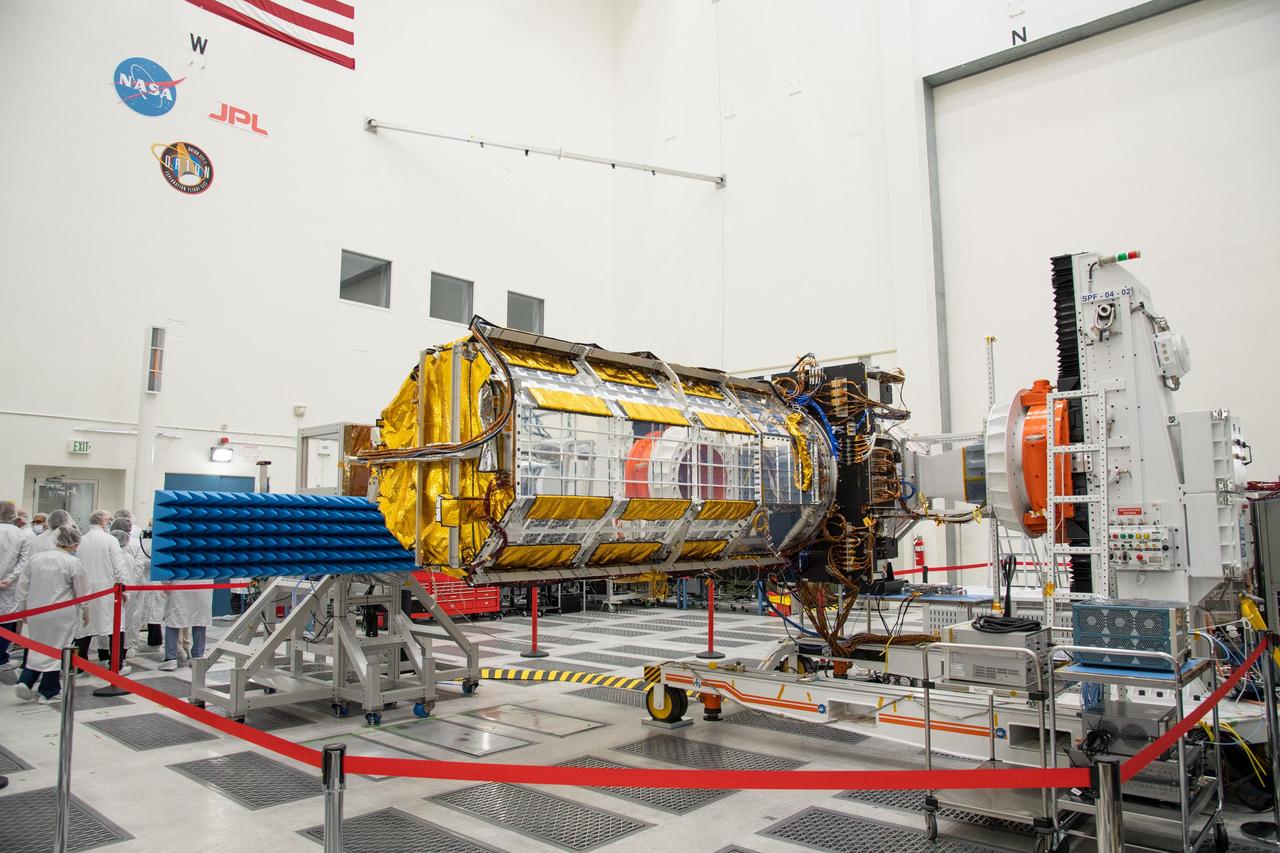
The NASA-ISRO Synthetic Aperture Radar (NISAR) science instrument payload, housed in a specially designed shipping container, sits at Hindustan Aeronautics Limited Airport in Bengaluru, India. The payload left NASA's Jet Propulsion Laboratory in Southern California on Feb. 28, and departed the United States on March 3 aboard a U.S. Air Force cargo plane, arriving in Bengaluru on March 6. From there it was transported to the Indian Space Research Organisation's U R Rao Satellite Centre, where it will be integrated with the satellite body, or bus, and undergo further testing leading up to launch in 2024. The NISAR mission – a joint effort between NASA and the Indian Space Research Organisation – will observe nearly all the planet's land and ice surfaces twice every 12 days, measuring movements in extremely fine detail. It will also survey forests and agricultural regions to understand carbon exchange between plants and the atmosphere. NISAR's science payload will be the most advanced radar system ever launched as part of a NASA mission, and it will feature the largest-ever radar antenna of its kind: a drum-shaped, wire mesh reflector nearly 40 feet (12 meters) in diameter that will extend from a 30-foot (9-meter) boom. The mission's science instruments consist of L- and S-band radar, so named to indicate the wavelengths of their signals. ISRO built the S-band radar, which it shipped to JPL in March 2021. Engineers spent much of the last two years integrating the instrument with the JPL-built L-band system, then conducting tests to verify they work well together. JPL, which is managed for NASA by Caltech in Pasadena, leads the U.S. component of NISAR. In addition to the L-band radar, NASA is also providing the radar reflector antenna, the deployable boom, a high-rate communication subsystem for science data, GPS receivers, a solid-state recorder, and payload data subsystem. In addition to the S-band radar, ISRO is providing the spacecraft bus, the launch vehicle, and associated launch services and satellite mission operations. https://photojournal.jpl.nasa.gov/catalog/PIA25570
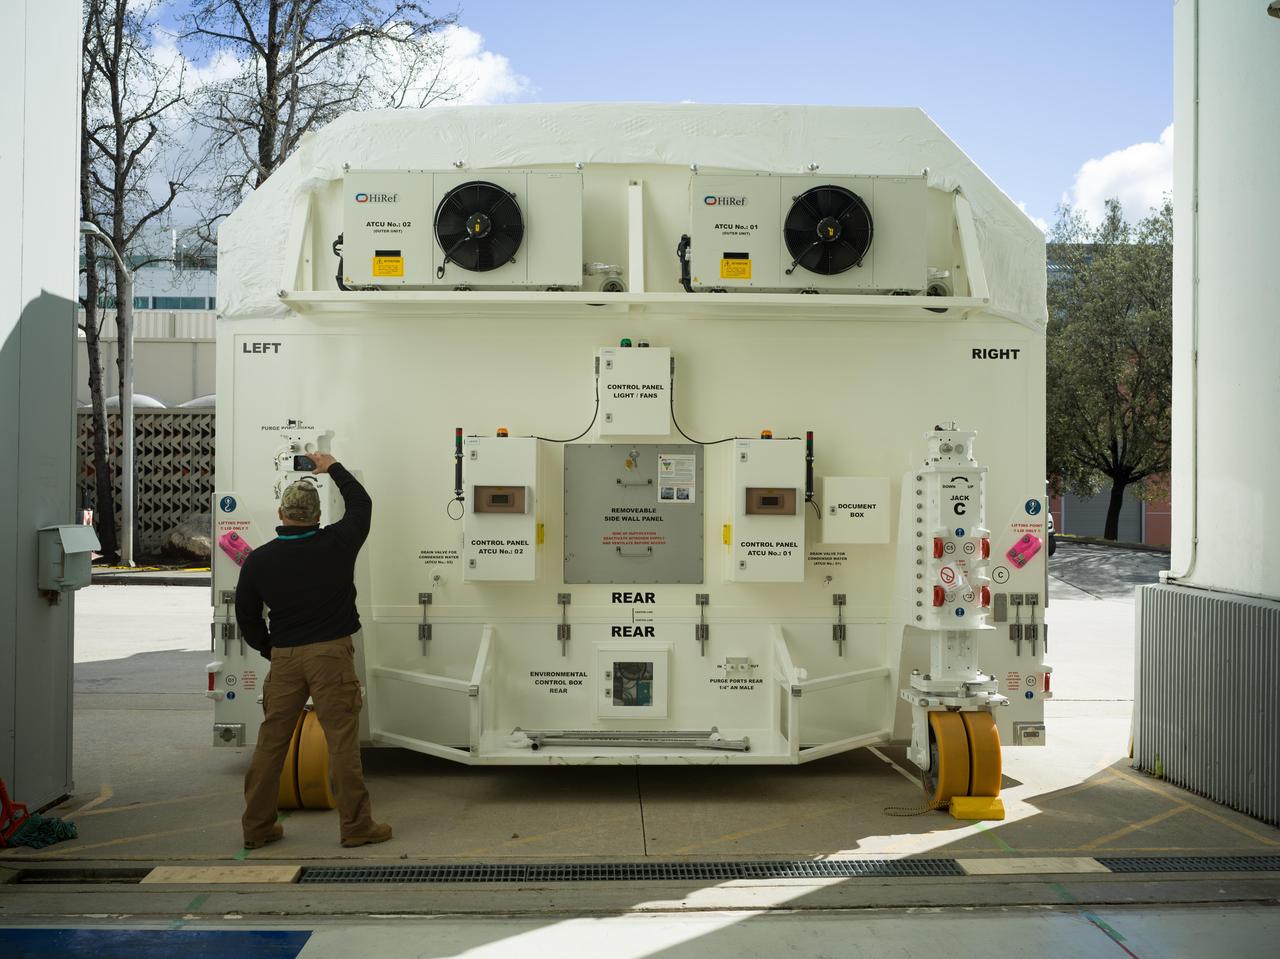
A specially designed, climate-controlled shipping container holding the NASA-ISRO Synthetic Aperture Radar (NISAR) science instrument payload sits outside an airlock at the Spacecraft Assembly Facility at NASA's Jet Propulsion Laboratory on Feb. 26, 2023. The payload was shipped to Bengaluru, India, on March 3, arriving on March 6. There it will be integrated with the satellite body, or bus, and undergo further testing leading up to launch in 2024. The NISAR mission – a joint effort between NASA and the Indian Space Research Organisation – will observe nearly all the planet's land and ice surfaces twice every 12 days, measuring movements in extremely fine detail. It will also survey forests and agricultural regions to understand carbon exchange between plants and the atmosphere. NISAR's science payload will be the most advanced radar system ever launched as part of a NASA mission, and it will feature the largest-ever radar antenna of its kind: a drum-shaped, wire mesh reflector nearly 40 feet (12 meters) in diameter that will extend from a 30-foot (9-meter) boom. The mission's science instruments consist of L- and S-band radar, so named to indicate the wavelengths of their signals. ISRO built the S-band radar, which it shipped to JPL in March 2021. Engineers spent much of the last two years integrating the instrument with the JPL-built L-band system, then conducting tests to verify they work well together. JPL, which is managed for NASA by Caltech in Pasadena, leads the U.S. component of NISAR. In addition to the L-band radar, NASA is also providing the radar reflector antenna, the deployable boom, a high-rate communication subsystem for science data, GPS receivers, a solid-state recorder, and payload data subsystem. In addition to the S-band radar, ISRO is providing the spacecraft bus, the launch vehicle, and associated launch services and satellite mission operations. https://photojournal.jpl.nasa.gov/catalog/PIA25568
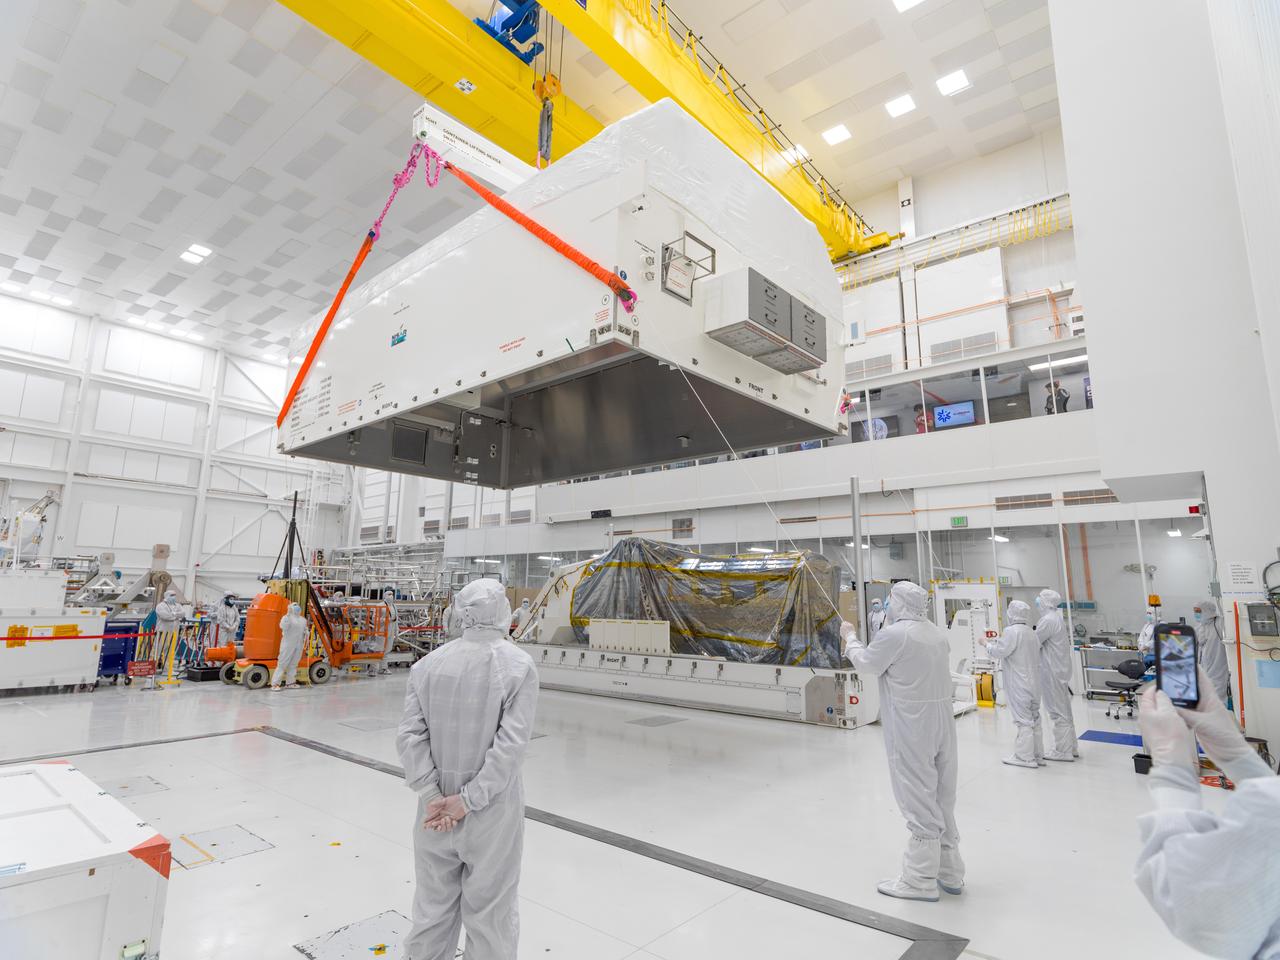
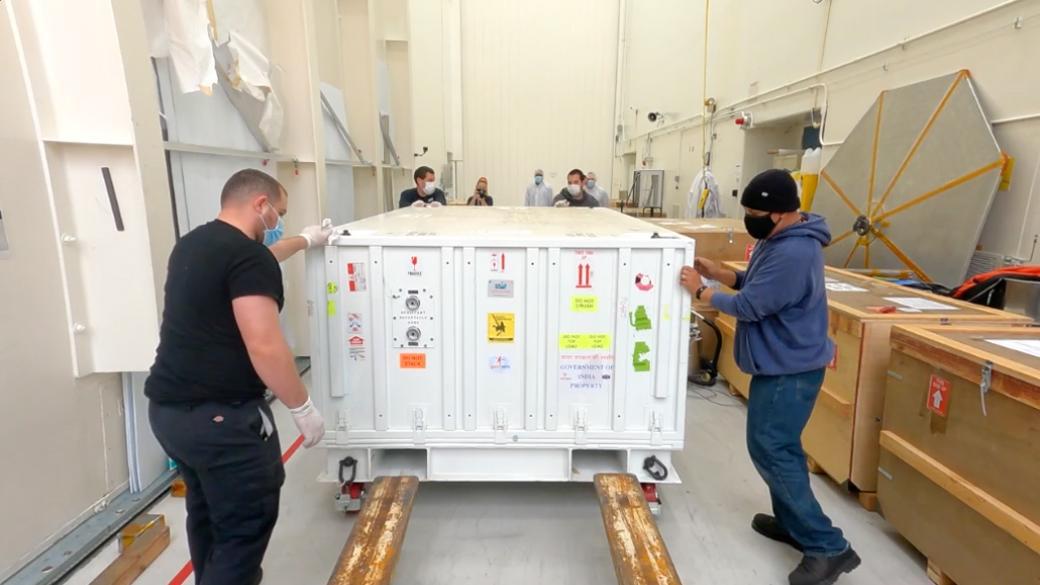
In a clean room at NASA's Jet Propulsion Laboratory on Feb. 23, 2023, engineers and technicians use a crane to prepare to seal a specially designed, climate-controlled shipping container holding the NASA-ISRO Synthetic Aperture Radar (NISAR) science instrument payload. The payload was then shipped to Bengaluru, India, on March 3, arriving on March 6. There it will be integrated with the satellite body, or bus, and undergo further testing leading up to launch in 2024. The NISAR mission – a joint effort between NASA and the Indian Space Research Organisation – will observe nearly all the planet's land and ice surfaces twice every 12 days, measuring movements in extremely fine detail. It will also survey forests and agricultural regions to understand carbon exchange between plants and the atmosphere. NISAR's science payload will be the most advanced radar system ever launched as part of a NASA mission, and it will feature the largest-ever radar antenna of its kind: a drum-shaped, wire mesh reflector nearly 40 feet (12 meters) in diameter that will extend from a 30-foot (9-meter) boom. The mission's science instruments consist of L- and S-band radar, so named to indicate the wavelengths of their signals. ISRO built the S-band radar, which it shipped to JPL in March 2021. Engineers spent much of the last two years integrating the instrument with the JPL-built L-band system, then conducting tests to verify they work well together. JPL, which is managed for NASA by Caltech in Pasadena, leads the U.S. component of NISAR. In addition to the L-band radar, NASA is also providing the radar reflector antenna, the deployable boom, a high-rate communication subsystem for science data, GPS receivers, a solid-state recorder, and payload data subsystem. In addition to the S-band radar, ISRO is providing the spacecraft bus, the launch vehicle, and associated launch services and satellite mission operations. https://photojournal.jpl.nasa.gov/catalog/PIA25567
The NASA-ISRO Synthetic Aperture Radar (NISAR) science instrument payload sits in its specially designed, climate-controlled shipping container in a clean room at NASA's Jet Propulsion Laboratory on Feb. 23, 2023. Engineers and technicians used a crane to lift the payload and mount it vertically onto a stage at the far end of the container before tilting it horizontally. The payload was then shipped to Bengaluru, India, on March 3, arriving on March 6. There it will be integrated with the satellite body, or bus, and undergo further testing leading up to launch in 2024. The NISAR mission – a joint effort between NASA and the Indian Space Research Organisation – will observe nearly all the planet's land and ice surfaces twice every 12 days, measuring movements in extremely fine detail. It will also survey forests and agricultural regions to understand carbon exchange between plants and the atmosphere. NISAR's science payload will be the most advanced radar system ever launched as part of a NASA mission, and it will feature the largest-ever radar antenna of its kind: a drum-shaped, wire mesh reflector nearly 40 feet (12 meters) in diameter that will extend from a 30-foot (9-meter) boom. The mission's science instruments consist of L- and S-band radar, so named to indicate the wavelengths of their signals. ISRO built the S-band radar, which it shipped to JPL in March 2021. Engineers spent much of the last two years integrating the instrument with the JPL-built L-band system, then conducting tests to verify they work well together. JPL, which is managed for NASA by Caltech in Pasadena, leads the U.S. component of NISAR. In addition to the L-band radar, NASA is also providing the radar reflector antenna, the deployable boom, a high-rate communication subsystem for science data, GPS receivers, a solid-state recorder, and payload data subsystem. In addition to the S-band radar, ISRO is providing the spacecraft bus, the launch vehicle, and associated launch services and satellite mission operations. https://photojournal.jpl.nasa.gov/catalog/PIA25566
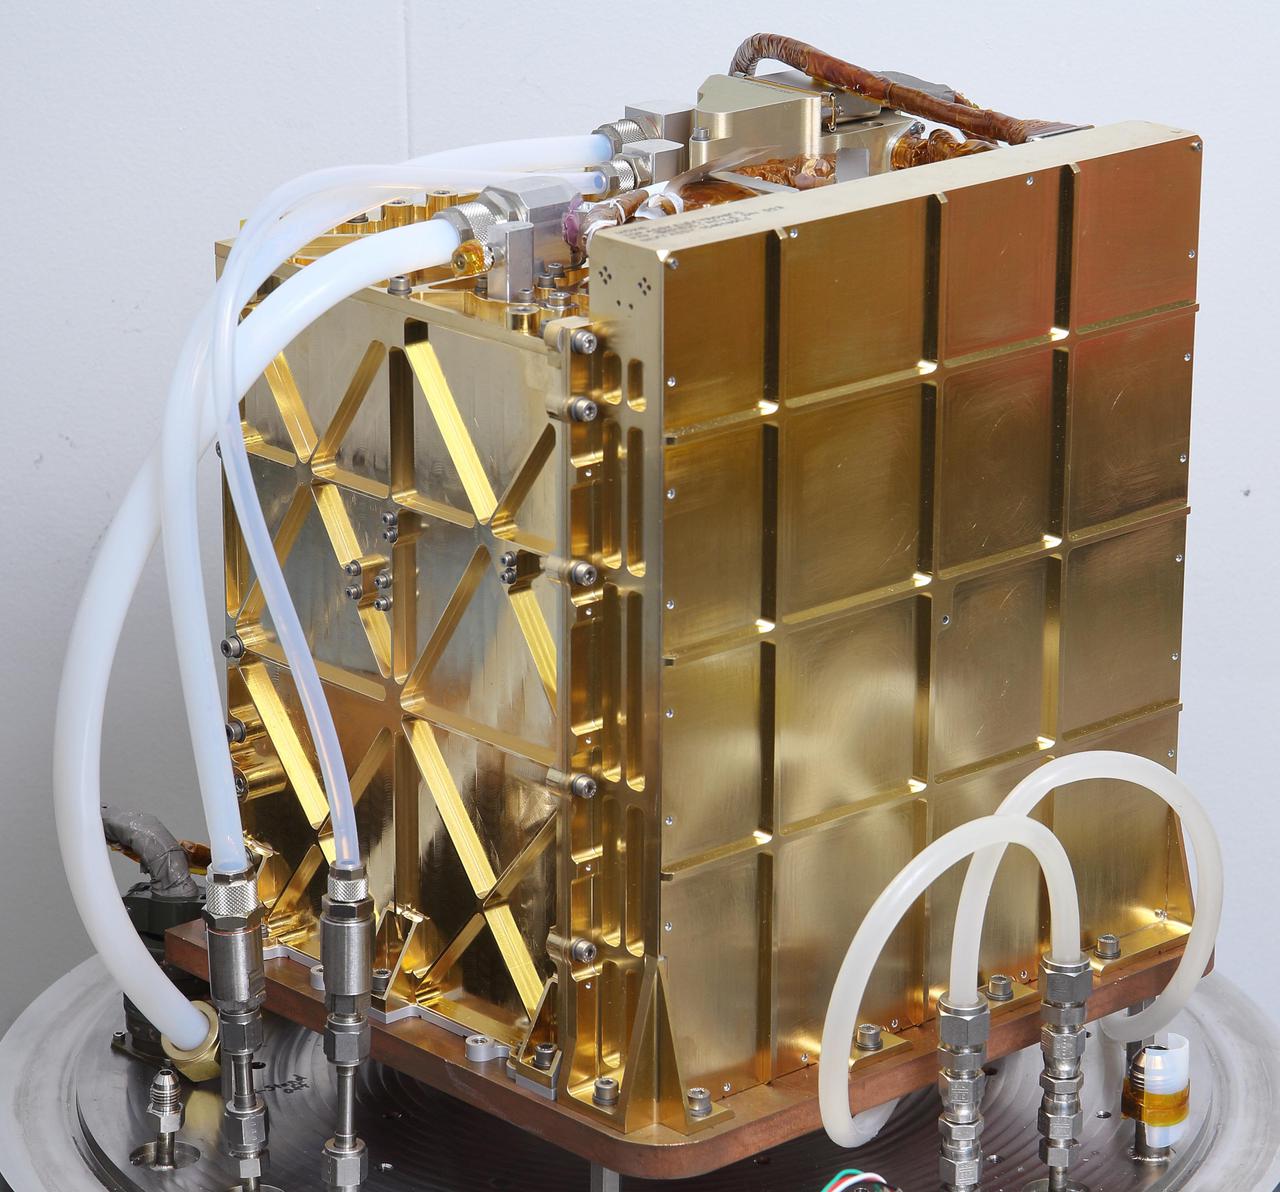
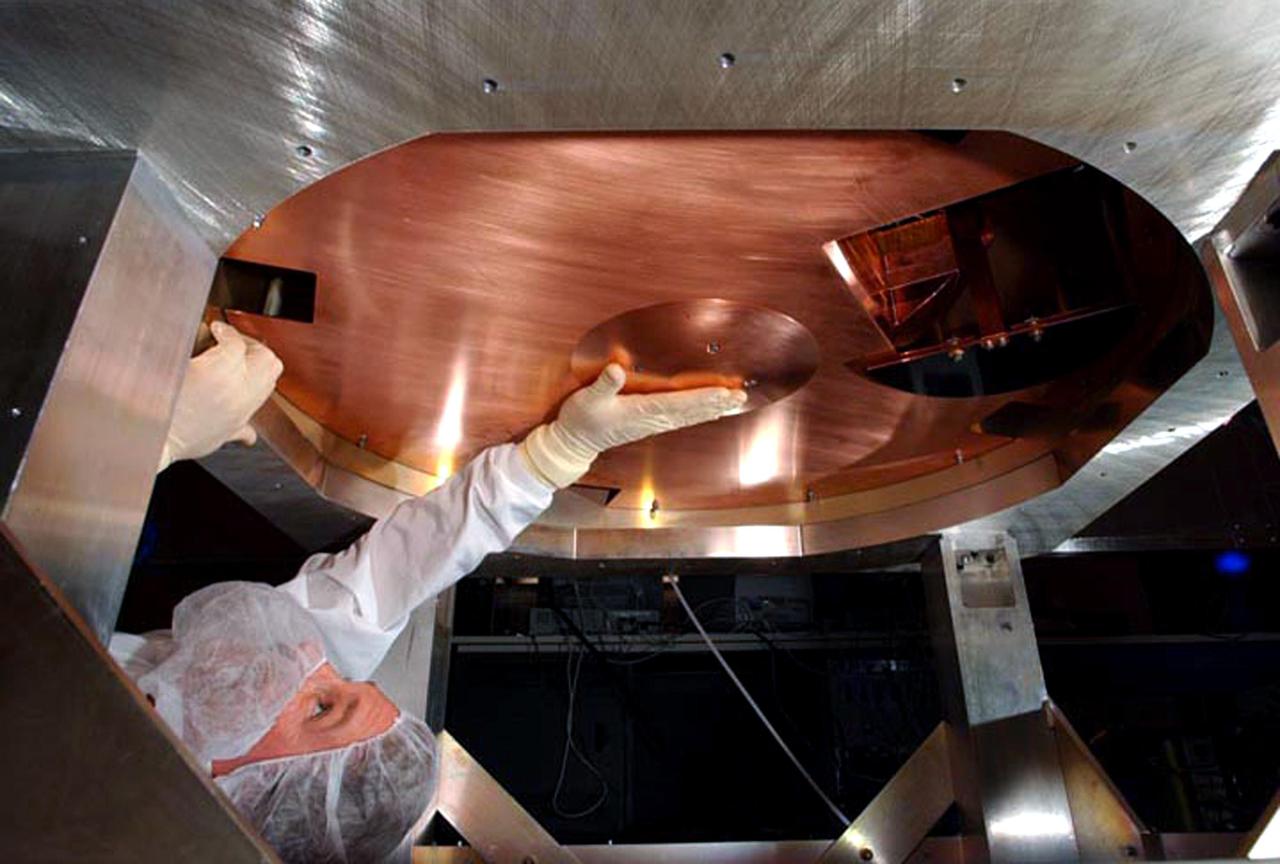
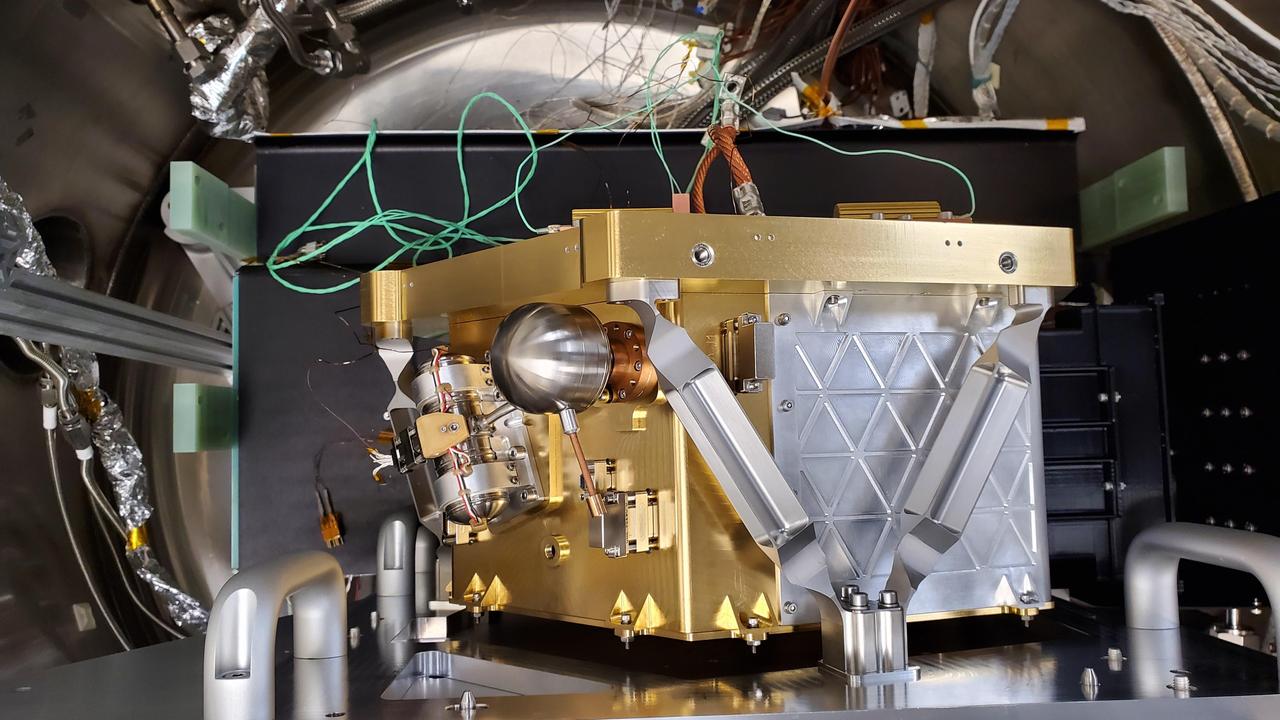
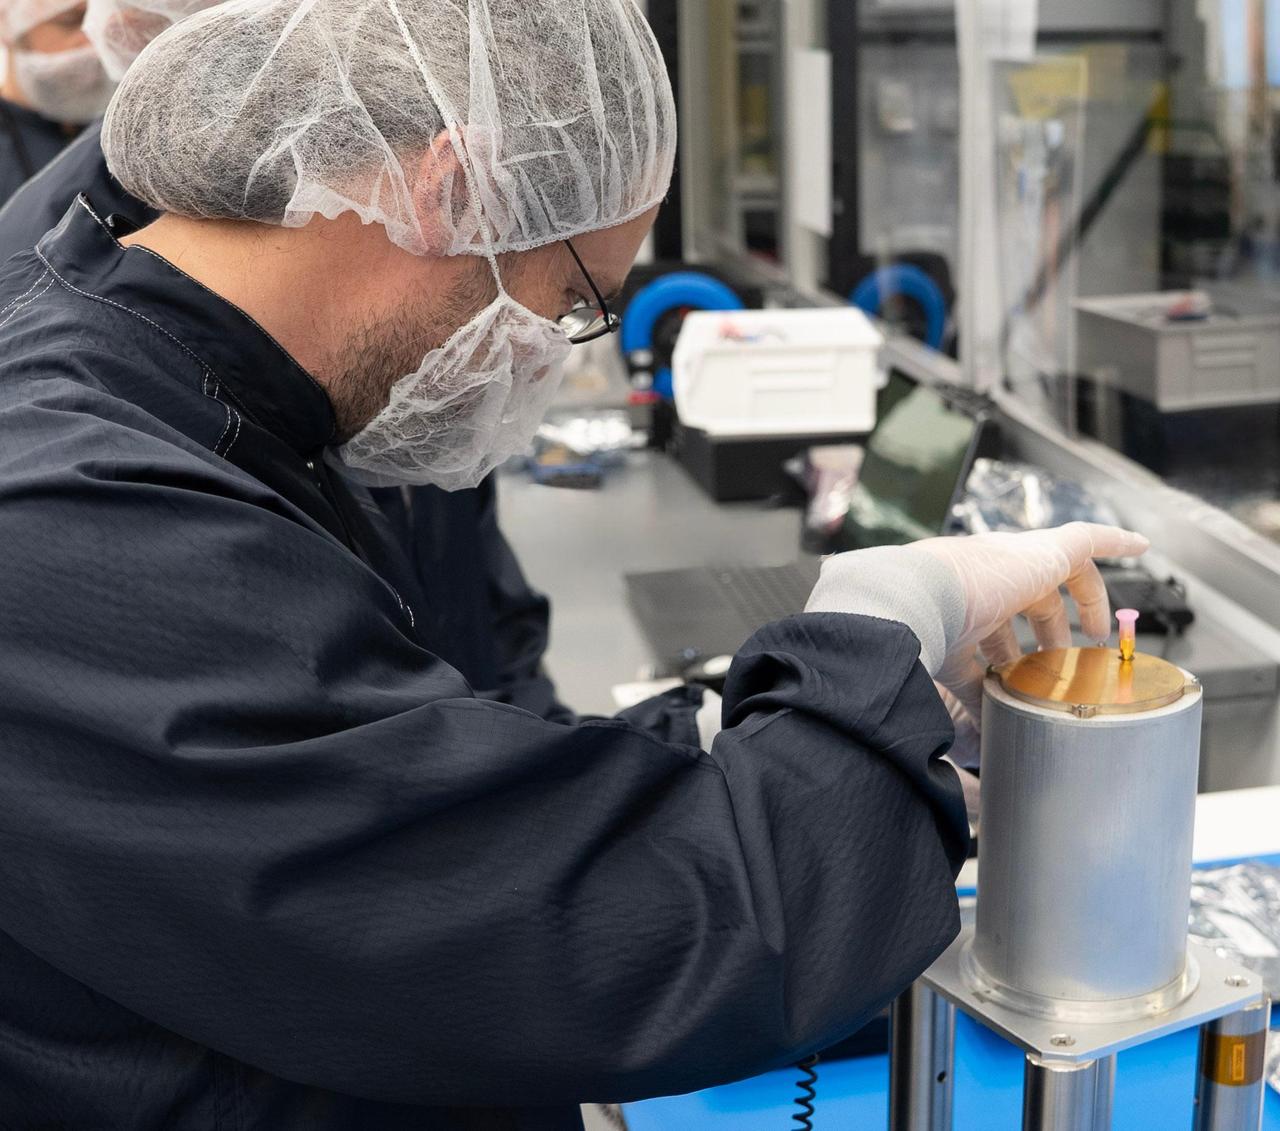
The engineering model (EM), an almost identical twin of MOXIE, is used for testing in the lab at NASA's Jet Propulsion Laboratory in Pasadena, California. Inside this gold-plated aluminum box is the Solid Oxide Electrolysis unit, or SOXE, the heart of MOXIE. Using an electrochemical process called electrolysis, SOXE takes in the carbon dioxide gas and splits it into carbon monoxide and oxygen, which is measured for purity, filtered, and then released back into the Mars atmosphere. Tubes to take in the Mars atmosphere and vent oxygen and carbon monoxide produced by the EM are connected at the top of the EM. The electronics needed to run this complex machine are housed inside the larger sidewall seen on the right. https://photojournal.jpl.nasa.gov/catalog/PIA24201
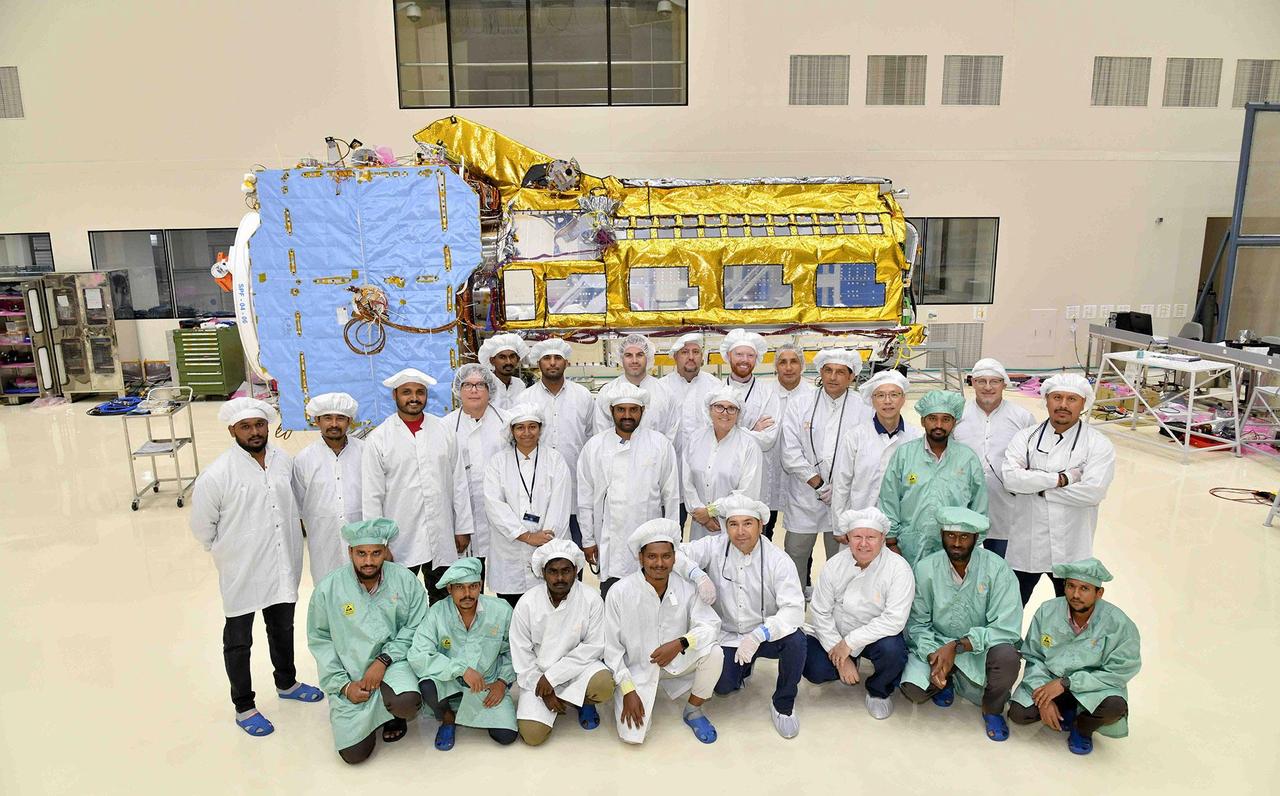
A team of engineers and technicians from the Indian Space Research Organisation and NASA's Jet Propulsion Laboratory in Southern California pose in June at ISRO's U R Rao Satellite Centre (URSC) in Bengaluru, India, after working together to combine the two main components of the NISAR (NASA-ISRO Synthetic Aperture Radar) satellite. Set to launch in early 2024 from the Satish Dhawan Space Centre in Sriharikota, India, NISAR is being jointly developed by NASA and ISRO to observe movements of Earth's land and ice surfaces in extremely fine detail. As NISAR observes nearly every part of Earth at least once every 12 days, the satellite will help scientists understand, among other observables, the dynamics of forests, wetlands, and agricultural lands. The radar instrument payload, partially wrapped in gold-colored thermal blanketing, arrived from JPL in March and consists of L- and S-band radar systems, so named to indicate the wavelengths of their signals. Both sensors can see through clouds and collect data day and night. The bus, which is shown in blue blanketing and includes components and systems developed by both ISRO and JPL, was built at URSC and will provide power, navigation, pointing control, and communications for the mission. The team combined the payload and the bus with the help of a crane. NISAR is an equal collaboration between NASA and ISRO and marks the first time the two agencies have cooperated on hardware development for an Earth-observing mission. JPL, which is managed for NASA by Caltech in Pasadena, leads the U.S. component of the project and is providing the mission's L-band SAR. NASA is also providing the radar reflector antenna, the deployable boom, a high-rate communication subsystem for science data, GPS receivers, a solid-state recorder, and payload data subsystem. URSC, which is leading the ISRO component of the mission, is providing the spacecraft bus, the S-band SAR electronics, the launch vehicle, and associated launch services and satellite mission operations. https://photojournal.jpl.nasa.gov/catalog/PIA25867
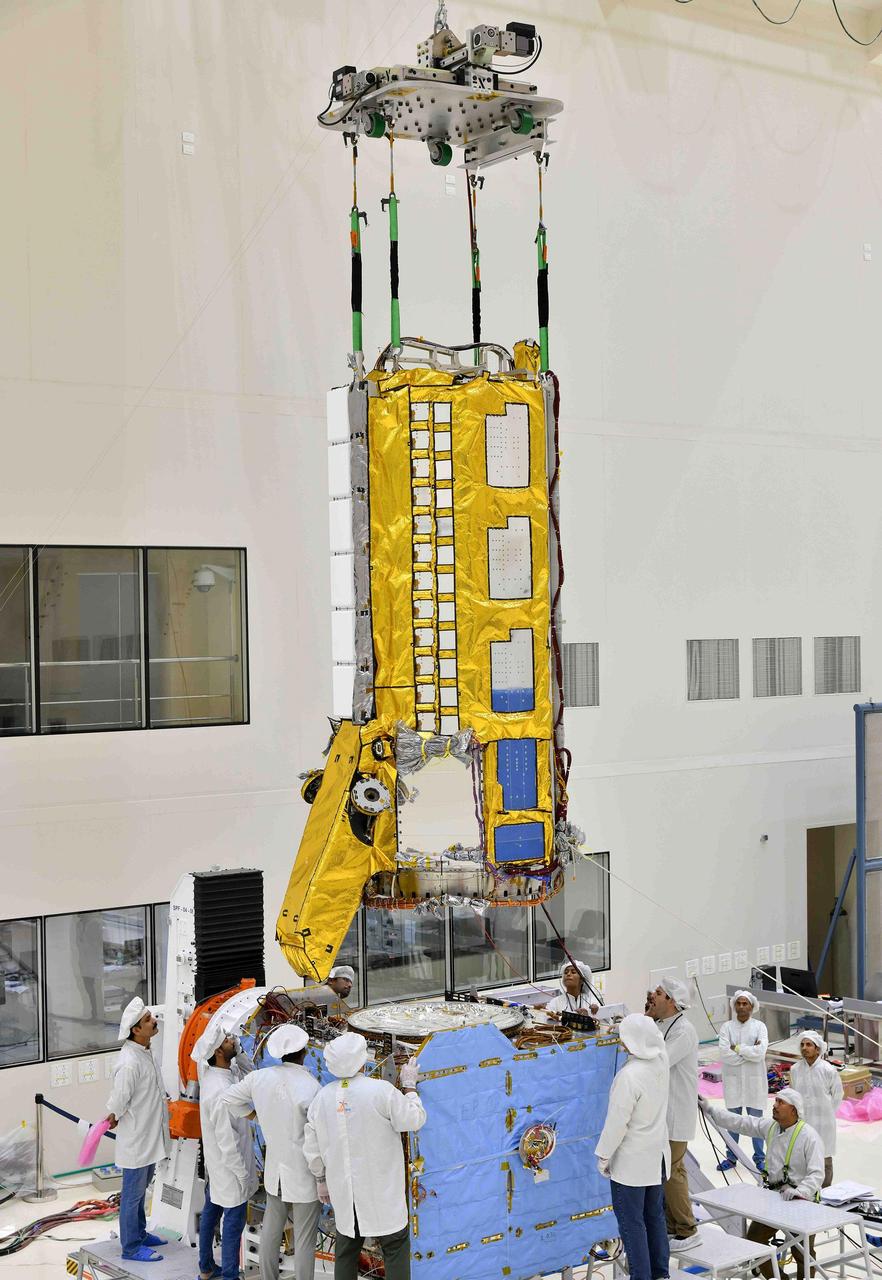
Engineers from NASA's Jet Propulsion Laboratory in Southern California and the Indian Space Research Organisation (ISRO), working in a clean room facility at ISRO's U R Rao Satellite Centre (URSC) in Bengaluru, India, in mid-June 2023, use a crane to align the radar instrument payload for the NISAR (NASA-ISRO Synthetic Aperture Radar) mission above the satellite's spacecraft bus so that the two components can be combined. Set to launch in early 2024 from the Satish Dhawan Space Centre in Sriharikota, India, NISAR is being jointly developed by NASA and ISRO to observe movements of Earth's land and ice surfaces in extremely fine detail. As NISAR observes nearly every part of Earth at least once every 12 days, the satellite will help scientists understand, among other observables, the dynamics of forests, wetlands, and agricultural lands. The radar instrument payload, partially wrapped in gold-colored thermal blanketing, arrived from JPL in March and consists of L- and S-band radar systems, so named to indicate the wavelengths of their signals. Both sensors can see through clouds and collect data day and night. The bus, which is shown in blue blanketing and includes components and systems developed by both ISRO and JPL, was built at URSC and will provide power, navigation, pointing control, and communications for the mission. NISAR is an equal collaboration between NASA and ISRO and marks the first time the two agencies have cooperated on hardware development for an Earth-observing mission. JPL, which is managed for NASA by Caltech in Pasadena, leads the U.S. component of the project and is providing the mission's L-band SAR. NASA is also providing the radar reflector antenna, the deployable boom, a high-rate communication subsystem for science data, GPS receivers, a solid-state recorder, and payload data subsystem. URSC, which is leading the ISRO component of the mission, is providing the spacecraft bus, the S-band SAR electronics, the launch vehicle, and associated launch services and satellite mission operations. https://photojournal.jpl.nasa.gov/catalog/PIA25866
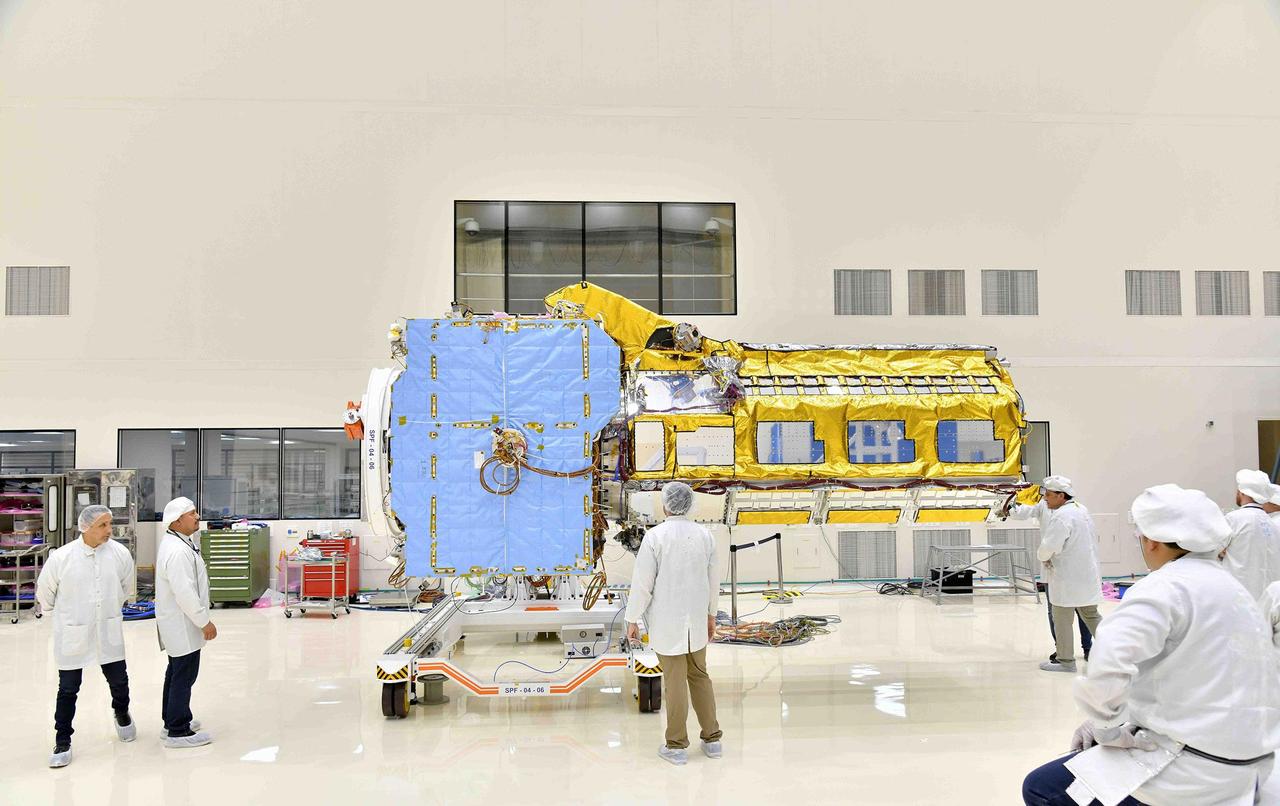
The NISAR (NASA-ISRO Synthetic Aperture Radar) satellite sits in a clean room facility at U R Rao Satellite Centre (URSC) in Bengaluru, India, in mid-June 2023, shortly after engineers from NASA's Jet Propulsion Laboratory in Southern California and the Indian Space Research Organisation joined its two main components, the radar instrument payload and the spacecraft bus. Set to launch in early 2024 from the Satish Dhawan Space Centre in Sriharikota, India, NISAR is being jointly developed by NASA and ISRO to observe movements of Earth's land and ice surfaces in extremely fine detail. As NISAR observes nearly every part of Earth at least once every 12 days, the satellite will help scientists understand, among other observables, the dynamics of forests, wetlands, and agricultural lands. The radar instrument payload, partially wrapped in gold-colored thermal blanketing, arrived from JPL in March and consists of L- and S-band radar systems, so named to indicate the wavelengths of their signals. Both sensors can see through clouds and collect data day and night. The bus, which is shown in blue blanketing and includes components and systems developed by both ISRO and JPL, was built at URSC and will provide power, navigation, pointing control, and communications for the mission. NISAR is an equal collaboration between NASA and ISRO and marks the first time the two agencies have cooperated on hardware development for an Earth-observing mission. JPL, which is managed for NASA by Caltech in Pasadena, leads the U.S. component of the project and is providing the mission's L-band SAR. NASA is also providing the radar reflector antenna, the deployable boom, a high-rate communication subsystem for science data, GPS receivers, a solid-state recorder, and payload data subsystem. URSC, which is leading the ISRO component of the mission, is providing the spacecraft bus, the S-band SAR electronics, the launch vehicle, and associated launch services and satellite mission operations. https://photojournal.jpl.nasa.gov/catalog/PIA25865
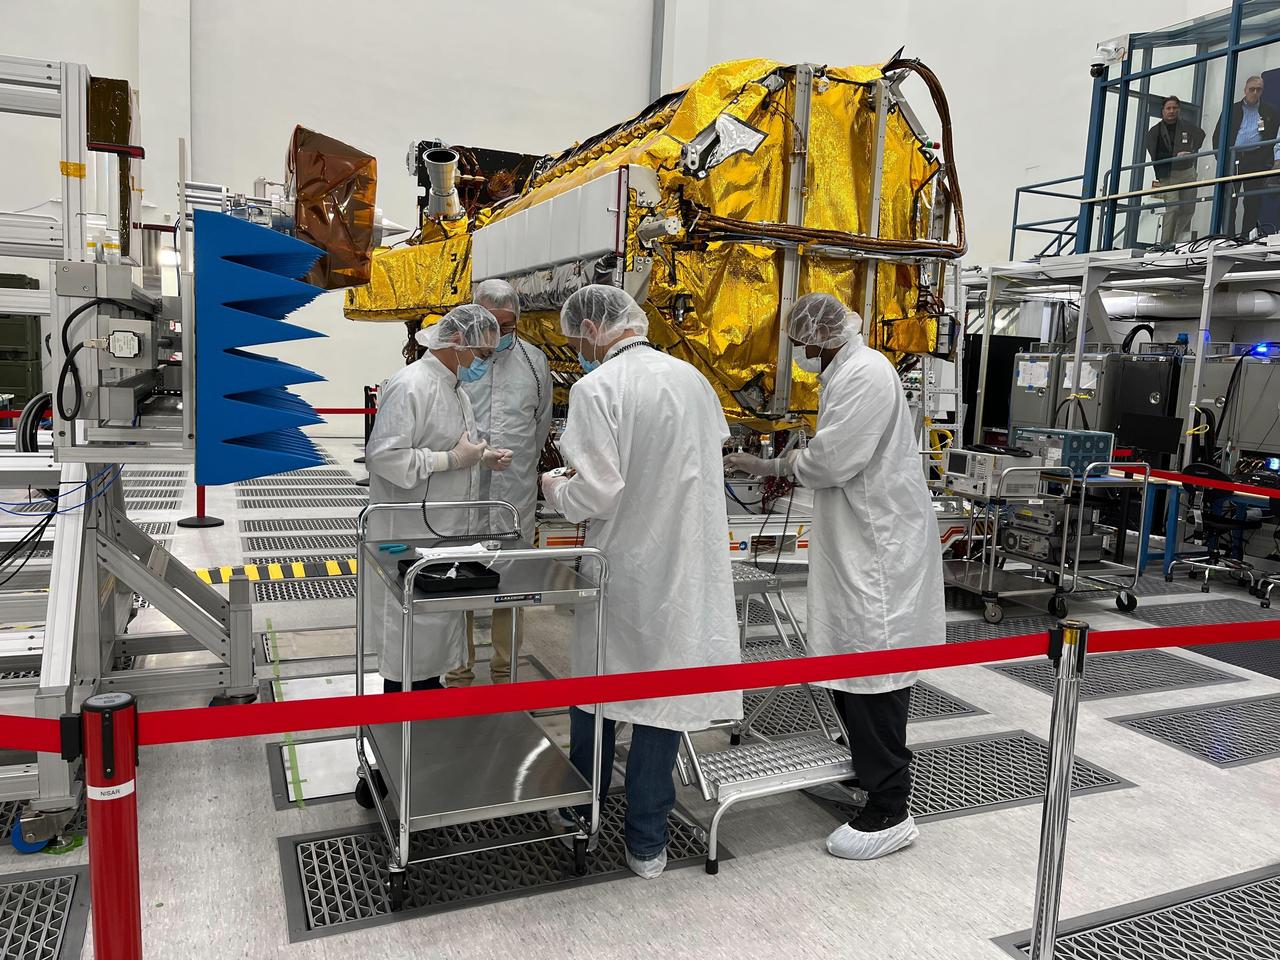
Engineers and technicians from NASA's Jet Propulsion Laboratory work on the NASA-ISRO Synthetic Aperture Radar (NISAR) science instrument payload in a clean room at JPL on Feb. 3, 2023. The payload is scheduled to ship to India in March 2023. The NISAR mission – a joint effort between NASA and ISRO – will measure changes to Earth's land ice surfaces down to fractions of an inch. Data collected by this satellite will help researchers monitor a wide range of changes critical to life on Earth in unprecedented detail. This includes spotting warning signs of imminent volcanic eruptions, helping to monitor groundwater supplies, tracking the melt rate of ice sheets tied to sea level rise, and observing shifts in the distribution of vegetation around the world. The data will inform humanity's responses to urgent challenges posed by natural disasters and climate change, and help communities prepare for and manage hazards. There are two instruments on the satellite that will send and receive radar signals to and from Earth's surface to make the mission's measurements. An L-band synthetic aperture radar (SAR), which uses a signal wavelength of around 9 inches (24 centimeters), and an S-band SAR with a signal wavelength of nearly 5 inches (12 centimeters). Both will bounce their microwave signal off of the planet's surface and record how long it takes the signal to make one roundtrip, as well as the strength of that return signal. This enables the researchers to calculate the distance from the spacecraft to Earth's surface and thereby determine how the land or ice is changing. An antenna reflector nearly 40 feet (12 meters) in diameter, supported by a deployable boom, will focus the microwave signals sent and received by the SARs. JPL, which is managed for NASA by Caltech in Pasadena, leads the U.S. component of NISAR and is providing the mission's L-band SAR instrument. NASA is also providing the radar reflector antenna, the deployable boom, a high-rate communication subsystem for science data, GPS receivers, a solid-state recorder, and payload data subsystem. ISRO is providing the spacecraft bus, the S-band SAR, the launch vehicle, and associated launch services and satellite mission operations. https://photojournal.jpl.nasa.gov/catalog/PIA25771
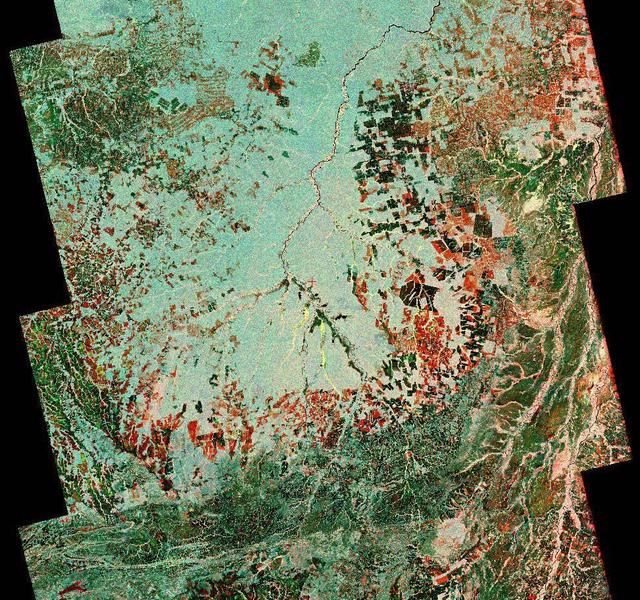
To show the kind of imagery that data from the NISAR (NASA-ISRO Synthetic Aperture Radar) satellite mission will produce, researchers pointed to this composite image of a portion of the so-called "arc of deforestation," a region on the southeast edge of the Amazonian jungle in Brazil where forests are being cleared at a fast pace through human activity. This three-color image shows change to the land cover in the Xingu River basin between 1996 (red) and 2007 (blue/green), using data from the Japanese L-band SAR satellites JERS-1 and ALOS-1, respectively. Black indicates areas converted from rainforest to agricultural land prior to 1996, and red shows the additional areas that had been cleared by 2007. NISAR will offer detailed insights into how the planet's forest ecosystems are changing over time, which will help researchers understand regional and global dynamics of deforestation and study the role of wooded areas in the global carbon cycle. NISAR could also help improve accounting of forest loss and growth, as countries that rely on logging try to shift toward more sustainable practices. NISAR is a joint mission of the U.S. and Indian space agencies. When in orbit, its sophisticated L- and S-band radar systems will scan nearly all of Earth's land and ice surfaces twice every 12 days with exquisite precision. Scheduled to launch in early 2024, NISAR is an equal collaboration between NASA and the Indian Space Research Organisation and marks the first time the two agencies have cooperated on hardware development for an Earth-observing mission. NASA's Jet Propulsion Laboratory, which is managed for the agency by Caltech in Pasadena, leads the U.S. component of the project and is providing the mission's L-band SAR. NASA is also providing the radar reflector antenna, the deployable boom, a high-rate communication subsystem for science data, GPS receivers, a solid-state recorder, and payload data subsystem. ISRO's U R Rao Satellite Centre in Bengaluru, which is leading the ISRO component of the mission, is providing the spacecraft bus, the S-band SAR electronics, the launch vehicle, and associated launch services and satellite mission operations. https://photojournal.jpl.nasa.gov/catalog/PIA26111

To show the kind of imagery that data from the NISAR (NASA-ISRO Synthetic Aperture Radar) satellite mission will be used to produce, researchers pointed to a 2013 image of flooding extent in the Pacaya-Samaria National Reserve that used data from the Uninhabited Aerial Vehicle Synthetic Aperture Radar (UAVSAR), an airborne system. In the image of this flood-prone area of the Amazonian jungle in Peru, black indicates open water, grayish-green is tropical forest, dark green is low-lying or floating vegetation, and red and pink are two different types of flooded vegetation. NISAR will offer detailed insights into the flooding patterns of the planet's wetland ecosystems, which will help researchers understand how these areas are being affected by climate change and human activity and the role they play in the global carbon cycle. NISAR is a joint mission of the U.S. and Indian space agencies. When in orbit, its sophisticated L- and S-band radar systems will scan nearly all of Earth's land and ice surfaces twice every 12 days with exquisite precision. Scheduled to launch in early 2024, NISAR is an equal collaboration between NASA and the Indian Space Research Organisation and marks the first time the two agencies have cooperated on hardware development for an Earth-observing mission. NASA's Jet Propulsion Laboratory, which is managed for the agency by Caltech in Pasadena, leads the U.S. component of the project and is providing the mission's L-band SAR. NASA is also providing the radar reflector antenna, the deployable boom, a high-rate communication subsystem for science data, GPS receivers, a solid-state recorder, and payload data subsystem. ISRO's U R Rao Satellite Centre in Bengaluru, which is leading the ISRO component of the mission, is providing the spacecraft bus, the S-band SAR electronics, the launch vehicle, and associated launch services and satellite mission operations. https://photojournal.jpl.nasa.gov/catalog/PIA26112

New imagery from the Hubble Space Telescope is revealing details never before seen on Jupiter. Hubble’s new Jupiter maps were used to create this Ultra HD animation. These new maps and spinning globes of Jupiter were made from observations performed with NASA’s Hubble Space Telescope. They are the first products to come from a program to study the solar system’s outer planets – Jupiter, Uranus, Neptune and, later, Saturn – each year using Hubble. The observations are designed to capture a broad range of features, including winds, clouds, storms and atmospheric chemistry. These annual studies will help current and future scientists see how these giant worlds change over time. Scientists at NASA’s Goddard Space Flight Center, the Jet Propulsion Laboratory, and the University of California at Berkeley produced two global maps of Jupiter from the observations, which were made using Hubble’s high-performance Wide Field Camera 3. The two maps represent nearly back-to-back rotations of the planet, making it possible to determine the speeds of Jupiter’s winds. Already, the images have revealed a rare wave just north of the planet’s equator and a unique filament-like feature in the core of the Great Red Spot that had not been seen previously. In addition, the new images confirm that the Great Red Spot continues to shrink and become more circular, as it has been doing for years. The long axis of this characteristic storm is about 150 miles (240 kilometers) shorter now than it was in 2014. Recently, the storm had been shrinking at a faster-than-usual rate, but the latest change is consistent with the long-term trend. Read more: <a href="http://www.nasa.gov/press-release/goddard/hubble-s-planetary-portrait-captures-new-changes-in-jupiter-s-great-red-spot" rel="nofollow">www.nasa.gov/press-release/goddard/hubble-s-planetary-por...</a> Credits: NASA/ESA/Goddard/UCBerkeley/JPL-Caltech/STScI <b><a href="http://www.nasa.gov/audience/formedia/features/MP_Photo_Guidelines.html" rel="nofollow">NASA image use policy.</a></b> <b><a href="http://www.nasa.gov/centers/goddard/home/index.html" rel="nofollow">NASA Goddard Space Flight Center</a></b> enables NASA’s mission through four scientific endeavors: Earth Science, Heliophysics, Solar System Exploration, and Astrophysics. Goddard plays a leading role in NASA’s accomplishments by contributing compelling scientific knowledge to advance the Agency’s mission. <b>Follow us on <a href="http://twitter.com/NASAGoddardPix" rel="nofollow">Twitter</a></b> <b>Like us on <a href="http://www.facebook.com/pages/Greenbelt-MD/NASA-Goddard/395013845897?ref=tsd" rel="nofollow">Facebook</a></b> <b>Find us on <a href="http://instagrid.me/nasagoddard/?vm=grid" rel="nofollow">Instagram</a></b>
NASA's NISAR Project Manager Phil Barela (with hands raised) speaks with Indian Space Research Organisation Chairman S. Somanath about the NASA-ISRO Synthetic Aperture Radar (NISAR) science instrument payload in a clean room at NASA's Jet Propulsion Laboratory in Southern California on Feb. 3, 2023. Somanath was among a group of visitors to the facility that included officials from NASA, ISRO, and the Indian Embassy. The NISAR mission – a joint effort between NASA and ISRO – will measure changes to Earth's land ice surfaces down to fractions of an inch. Data collected by this satellite will help researchers monitor a wide range of changes critical to life on Earth in unprecedented detail. This includes spotting warning signs of imminent volcanic eruptions, helping to monitor groundwater supplies, tracking the melt rate of ice sheets tied to sea level rise, and observing shifts in the distribution of vegetation around the world. The data will inform humanity's responses to urgent challenges posed by natural disasters and climate change, and help communities prepare for and manage hazards. There are two instruments on the satellite that will send and receive radar signals to and from Earth's surface to make the mission's measurements. An L-band synthetic aperture radar (SAR), which uses a signal wavelength of around 9 inches (24 centimeters), and an S-band SAR with a signal wavelength of nearly 5 inches (12 centimeters). Both will bounce their microwave signal off of the planet's surface and record how long it takes the signal to make one roundtrip, as well as the strength of that return signal. This enables the researchers to calculate the distance from the spacecraft to Earth's surface and thereby determine how the land or ice is changing. An antenna reflector nearly 40 feet (12 meters) in diameter, supported by a deployable boom, will focus the microwave signals sent and received by the SARs. JPL, which is managed for NASA by Caltech in Pasadena, leads the U.S. component of NISAR and is providing the mission's L-band SAR instrument. NASA is also providing the radar reflector antenna, the deployable boom, a high-rate communication subsystem for science data, GPS receivers, a solid-state recorder, and payload data subsystem. ISRO is providing the spacecraft bus, the S-band SAR, the launch vehicle, and associated launch services and satellite mission operations. https://photojournal.jpl.nasa.gov/catalog/PIA25598

This image from March 2, 1959 shows engineers from NASA's Jet Propulsion Laboratory checking NASA's Pioneer 4 spacecraft, the gold-and-black-colored cone sitting atop the white fourth-stage motor of the Juno II launch vehicle in Florida. Launched on March 3, 1959, NASA's Pioneer 4 was the first American mission to escape Earth orbit and the second of two early attempts by the United States to send a spacecraft to the Moon. The spacecraft achieved its primary objective — to put itself on a trajectory from Earth to the Moon. While it flew farther away from the Moon than expected and didn't take the images of the Moon as intended, Pioneer 4 did provide extensive and valuable data on Earth's radiation belt and the tracking of space objects. After 82 hours of transmissions from Pioneer 4's tiny radio and 655,000 miles (1.05 million kilometers) of travel — the farthest tracking distance for a human-made object at the time — contact is lost on March 6, 1959. Pioneer 4 is still in orbit around the Sun. The mission was carried out while JPL was transitioning from being part of the Army Ballistic Missile Agency to NASA. It marked the end of the U.S. Army's pioneering space program and the beginning of NASA's lunar program. JPL, in Pasadena, California, was responsible for mission design and management for both agencies. More information about Pioneer 4 can be found at: https://solarsystem.nasa.gov/missions/pioneer-4/in-depth/ https://photojournal.jpl.nasa.gov/catalog/PIA23497

VANDENBERG AIR FORCE BASE, Calif. – A prelaunch news conference is held on North Vandenberg Air Force Base to present the latest information about the Ocean Surface Topography Mission, or OSTM/Jason 2. Seated from left are the moderator George Diller; Steve Neeck, OSTM/Jason 2 program executive; Omar Baez, NASA launch director at NASA's Kennedy Space Center; Kris Walsh, director of NASA and commercial programs for, United Launch Alliance; Parag Vaze, OSTM/Jason 2 project manager at the NASA's Jet Propulsion Laboratory; and Capt. Andrew M. Frey, launch weather officer with the 30th Weather Squadron. The OSTM/Jason 2 satellite will embark on a globe-circling voyage to continue charting sea level, a vital indicator of global climate change. The mission will return a vast amount of new data that will improve weather, climate and ocean forecasts. OSTM/Jason 2's expected lifetime of at least three years will extend into the next decade the continuous record of these data started in 1992 by NASA and the French space agency Centre National d'Etudes Spatiales, or CNES, with the TOPEX/Poseidon mission. The data collection was continued by the two agencies on Jason-1 in 2001. The launch window extends from 12:46 a.m. to 12:55 a.m. PDT. The satellite will be placed in an 830-mile-high orbit at an inclination of 66 degrees after separating from the Delta II 55 minutes after liftoff. Photo credit: Photograph by Carleton Bailie for United Launch Alliance
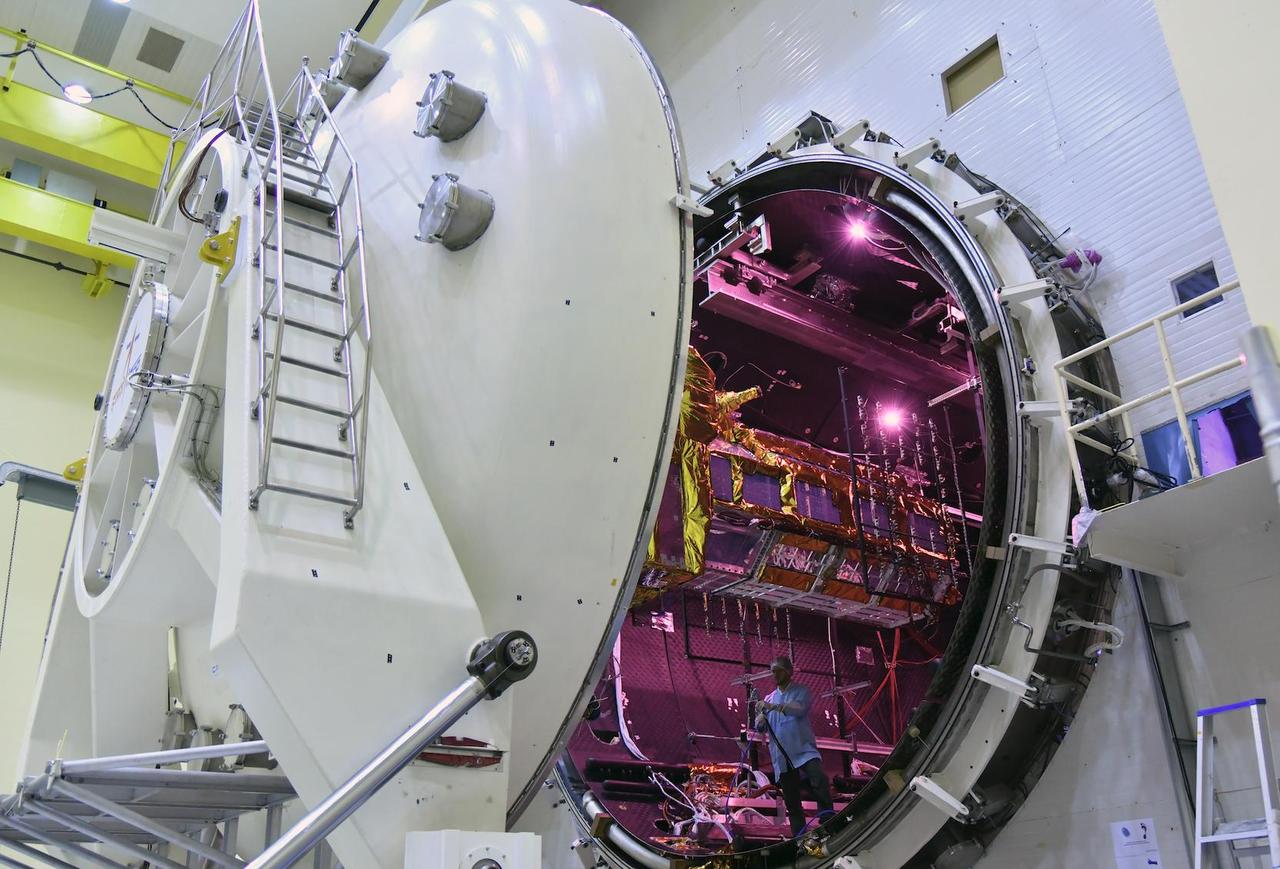
The NISAR satellite, partially covered in gold-hued thermal blanketing, enters the thermal vacuum chamber at the Indian Space Research Organisation's Satellite Integration and Test Establishment (ISITE) in Bengaluru, India, on Oct. 19, 2023. Short for NASA-ISRO Synthetic Aperture Radar, NISAR was bound for a 21-day trial aimed at evaluating its ability to function in the extreme temperatures and the vacuum of space. The satellite emerged from the chamber on Nov. 13, having met all requirements of the test. Teams from ISRO and NASA's Jet Propulsion Laboratory worked around the clock, evaluating the performance of the satellite's thermal systems and its two primary science instrument systems – the L-band and S-band radars – under the most extreme temperature conditions they will experience in space. During the three-week period, engineers and technicians lowered the pressure inside the chamber to an infinitesimal fraction of the normal pressure at sea level. They also subjected the satellite to an 80-hour "cold soak" at 14 degrees Fahrenheit (minus 10 degrees Celsius), followed by an equally lengthy "hot soak" at up to 122 F (50 C). This simulates the temperature swings the spacecraft will experience as it is exposed to sunlight and darkness in orbit. After further tests, the satellite will be transported about 220 miles (350 kilometers) eastward to Satish Dhawan Space Centre, where it will be inserted into its launch faring, mounted atop ISRO's Geosynchronous Satellite Launch Vehicle Mark II rocket, and sent into low-Earth orbit. NISAR is the first space-hardware collaboration between NASA and ISRO on an Earth-observing mission. Scheduled to launch in early 2024, the satellite will scan nearly all of the planet's land and ice twice every 12 days, monitoring the motion of those surfaces down to fractions of an inch. It will also track other processes, including the dynamics of forests, wetlands, and agricultural lands. https://photojournal.jpl.nasa.gov/catalog/PIA26114
The High-resolution Volatiles and Minerals Moon Mapper (HVM³), seen here, is one of two instruments that will be carried aboard NASA's Lunar Trailblazer. Launching in 2023, the small spacecraft – measuring only 11.5 feet (3.5 meters) wide with its solar panels fully deployed – will detect and map water on the Moon's surface to determine its abundance, location, form, and how it changes over time. HVM³ recently completed a significant milestone in a clean room at NASA's Jet Propulsion Laboratory in Southern California. The high-resolution spectrometer measures the infrared light (with wavelengths from 0.6 to 3.6 microns in size) that is absorbed by water. To make sure the instrument is properly aligned, the Trailblazer team cooled HVM3 down to temperatures it will experience in space and made tiny physical adjustments to make sure all the wavelengths of incoming light arrive at the correct locations on the instrument's detector. Figure A shows several members of the Trailblazer team surrounding the instrument – minus its radiator and electronics – mounted on HVM³'s optical bench assembly while undergoing cold alignment. The assembly was placed inside a thermal vacuum chamber and brought to a cold focal plane operating temperature of about minus 240 degrees Fahrenheit (minus 155 degrees Celsius). The team then measured light of different wavelengths across all of the detector's pixels. Based on the data recorded, the team calculated the small adjustments that needed to be made, took the instrument out of the chamber and made those changes, placed it back into the chamber, and then repeated the steps iteratively until HVM³ was in perfect alignment. With this important step complete, a radiator will next be installed to ensure the instrument maintains optimal operating temperatures while Trailblazer is in orbit around the Moon. Then, vibration tests will be carried out to make sure the spectrometer will stay in alignment after the extreme shaking of launch. Lunar Trailblazer was selected to be part of NASA's SIMPLEx (Small Innovative Missions for Planetary Exploration) program in 2019. The mission is led by Caltech in Pasadena, California, and managed by JPL. https://photojournal.jpl.nasa.gov/catalog/PIA25252

New imagery from the Hubble Space Telescope is revealing details never before seen on Jupiter. Hubble’s new Jupiter maps were used to create this Ultra HD animation. These new maps and spinning globes of Jupiter were made from observations performed with NASA’s Hubble Space Telescope. They are the first products to come from a program to study the solar system’s outer planets – Jupiter, Uranus, Neptune and, later, Saturn – each year using Hubble. The observations are designed to capture a broad range of features, including winds, clouds, storms and atmospheric chemistry. These annual studies will help current and future scientists see how these giant worlds change over time. Scientists at NASA’s Goddard Space Flight Center, the Jet Propulsion Laboratory, and the University of California at Berkeley produced two global maps of Jupiter from the observations, which were made using Hubble’s high-performance Wide Field Camera 3. The two maps represent nearly back-to-back rotations of the planet, making it possible to determine the speeds of Jupiter’s winds. Already, the images have revealed a rare wave just north of the planet’s equator and a unique filament-like feature in the core of the Great Red Spot that had not been seen previously. In addition, the new images confirm that the Great Red Spot continues to shrink and become more circular, as it has been doing for years. The long axis of this characteristic storm is about 150 miles (240 kilometers) shorter now than it was in 2014. Recently, the storm had been shrinking at a faster-than-usual rate, but the latest change is consistent with the long-term trend. Read more:http://www.nasa.gov/press-release/goddard/hubble-s-planetary-portrait-captures-new-changes-in-jupiter-s-great-red-spot Credits: NASA/ESA/Goddard/UCBerkeley/JPL-Caltech/STScI <b><a href="http://www.nasa.gov/audience/formedia/features/MP_Photo_Guidelines.html" rel="nofollow">NASA image use policy.</a></b> <b><a href="http://www.nasa.gov/centers/goddard/home/index.html" rel="nofollow">NASA Goddard Space Flight Center</a></b> enables NASA’s mission through four scientific endeavors: Earth Science, Heliophysics, Solar System Exploration, and Astrophysics. Goddard plays a leading role in NASA’s accomplishments by contributing compelling scientific knowledge to advance the Agency’s mission. <b>Follow us on <a href="http://twitter.com/NASAGoddardPix" rel="nofollow">Twitter</a></b> <b>Like us on <a href="http://www.facebook.com/pages/Greenbelt-MD/NASA-Goddard/395013845897?ref=tsd" rel="nofollow">Facebook</a></b> <b>Find us on <a href="http://instagrid.me/nasagoddard/?vm=grid" rel="nofollow">Instagram</a></b>
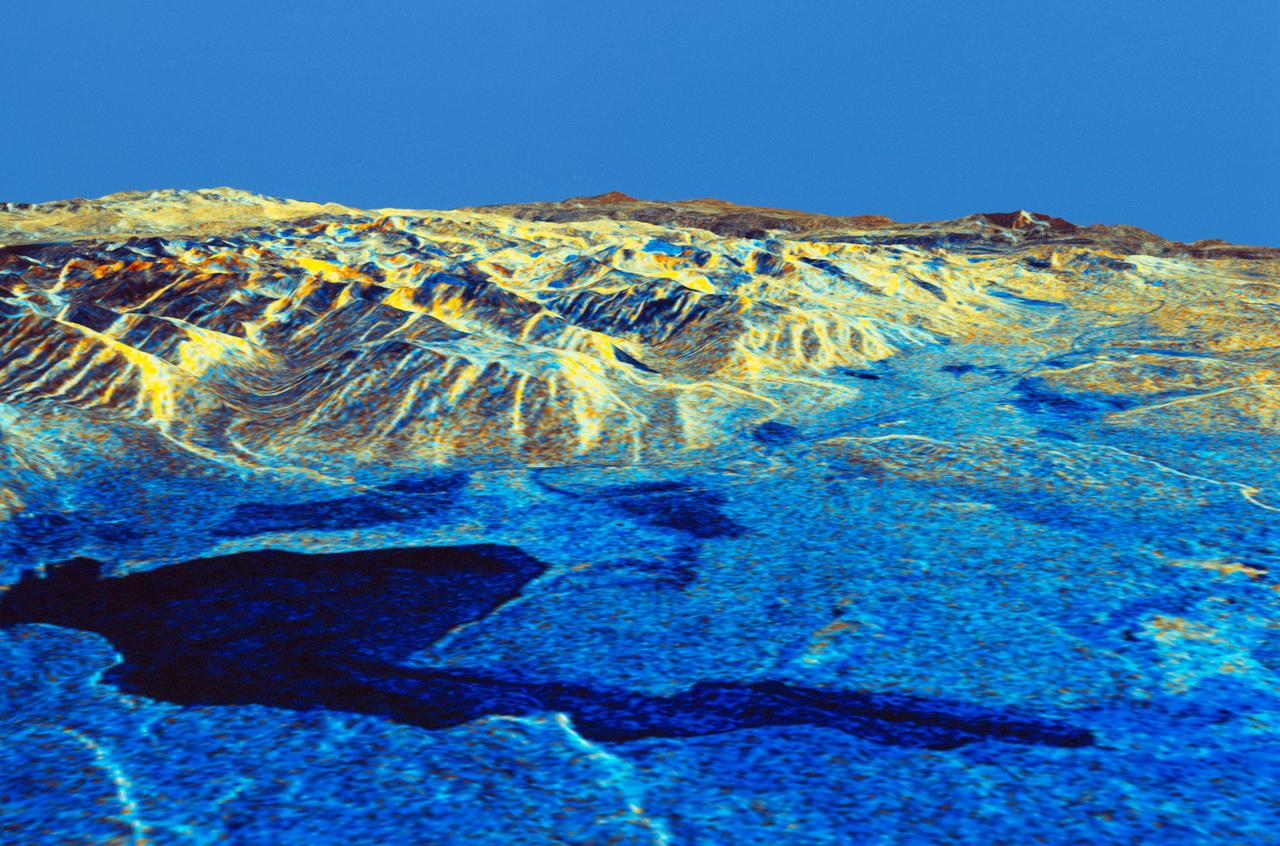
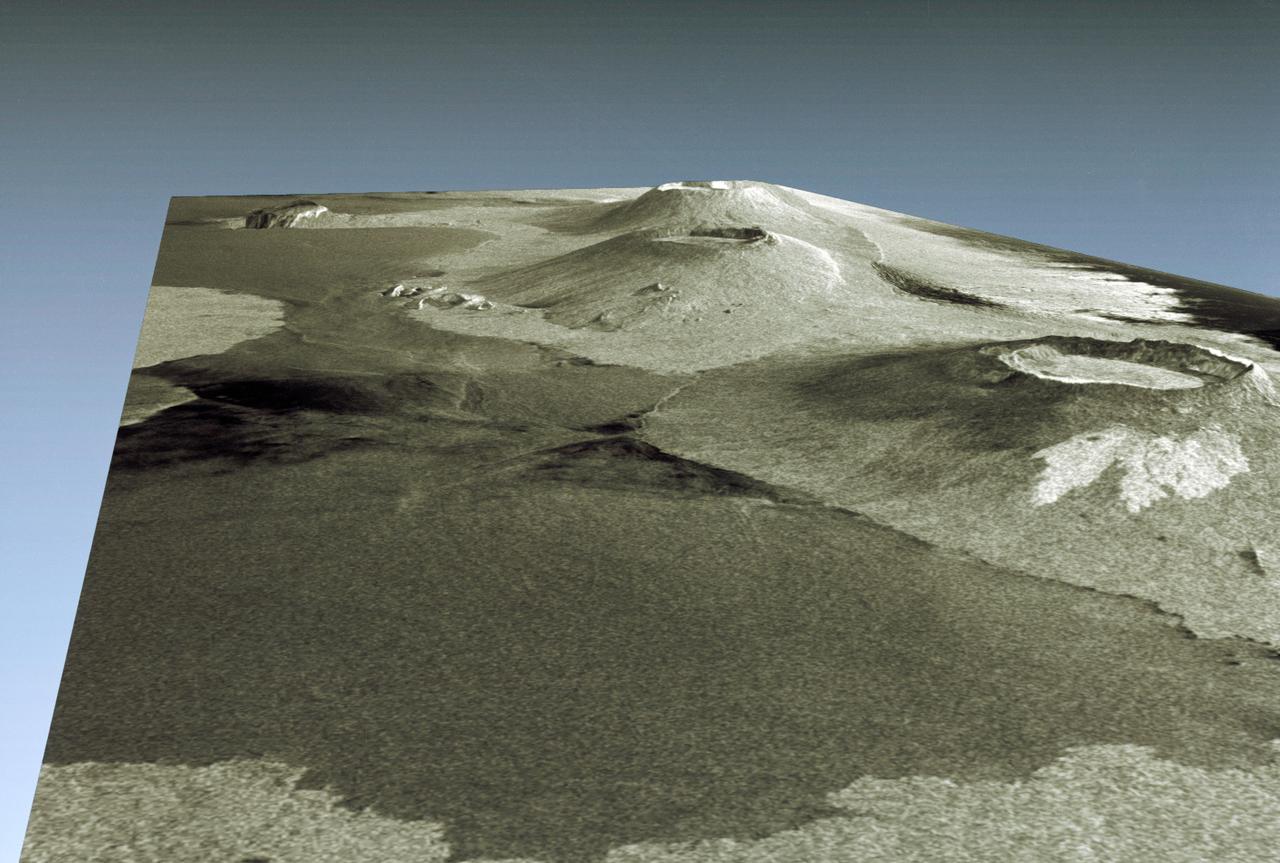
STS059-S-084 (17 April 1994) --- This is a three-dimensional perspective of Mammoth Mountain, California. This view was constructed by overlaying a SIR-C radar image on a U.S. Geological Survey digital elevation map. Vertical exaggeration is 2x. The image is centered at 37.6 degrees north, 119.0 degrees west. It was acquired from the Spaceborne Imaging Radar-C and X-Band Synthetic Aperture Radar (SIR-C/X-SAR) onboard the Space Shuttle Endeavour on its 67th orbit, April 13, 1994. In this color representation, red is C-Band HV-polarization, green is C-Band VV-polarization and blue is the ratio of C-Band VV to C-Band HV. Blue areas are smooth and yellow areas are rock outcrops with varying amounts of snow and vegetation. Crowley Lake is in the foreground and Highway 395 crosses in the middle of the image. Mammoth Mountain is shown in the upper right. SIR-C/X-SAR is part of NASA's Mission to Planet Earth (MTPE). SIR-C/X-SAR radars illuminate Earth with microwaves allowing detailed observations at any time, regardless of weather or sunlight conditions. SIR-C/X-SAR uses three microwave wavelengths: L-Band (24 cm), C-Band (6 cm), and X-Band (3 cm). The multi-frequency data will be used by the international scientific community to better understand the global environment and how it is changing. The SIR-C/X-SAR data, complemented by aircraft and ground studies, will give scientists clearer insights into those environmental changes which are caused by nature and those changes which are induced by human activity. SIR-C was developed by NASA's Jet Propulsion Laboratory (JPL). X-SAR was developed by the Dornire and Alenia Spazio Companies for the German Space Agency, Deutsche Agentur fuer Raumfahrtangelegenheiten (DARA), and the Italian Space Agency, Agenzia Spaziale Italiana (ASI). JPL Photo ID: P-43933
Officials from NASA, the Indian Space Research Organisation, and the Indian Embassy, grouped at left, visit a clean room at NASA's Jet Propulsion Laboratory in Southern California on Feb. 3, 2023, to view the scientific instrument payload for the NASA-ISRO Synthetic Aperture Radar (NISAR) mission. The payload is scheduled to be shipped to India in March 2023. The NISAR mission – a joint effort between NASA and ISRO – will measure changes to Earth's land ice surfaces down to fractions of an inch. Data collected by this satellite will help researchers monitor a wide range of changes critical to life on Earth in unprecedented detail. This includes spotting warning signs of imminent volcanic eruptions, helping to monitor groundwater supplies, tracking the melt rate of ice sheets tied to sea level rise, and observing shifts in the distribution of vegetation around the world. The data will inform humanity's responses to urgent challenges posed by natural disasters and climate change, and help communities prepare for and manage hazards. There are two instruments on the satellite that will send and receive radar signals to and from Earth's surface to make the mission's measurements. An L-band synthetic aperture radar (SAR), which uses a signal wavelength of around 9 inches (24 centimeters), and an S-band SAR with a signal wavelength of nearly 5 inches (12 centimeters). Both will bounce their microwave signal off of the planet's surface and record how long it takes the signal to make one roundtrip, as well as the strength of that return signal. This enables the researchers to calculate the distance from the spacecraft to Earth's surface and thereby determine how the land or ice is changing. An antenna reflector nearly 40 feet (12 meters) in diameter, supported by a deployable boom, will focus the microwave signals sent and received by the SARs. JPL, which is managed for NASA by Caltech in Pasadena, leads the U.S. component of NISAR and is providing the mission's L-band SAR instrument. NASA is also providing the radar reflector antenna, the deployable boom, a high-rate communication subsystem for science data, GPS receivers, a solid-state recorder, and payload data subsystem. ISRO is providing the spacecraft bus, the S-band SAR, the launch vehicle, and associated launch services and satellite mission operations. https://photojournal.jpl.nasa.gov/catalog/PIA25599
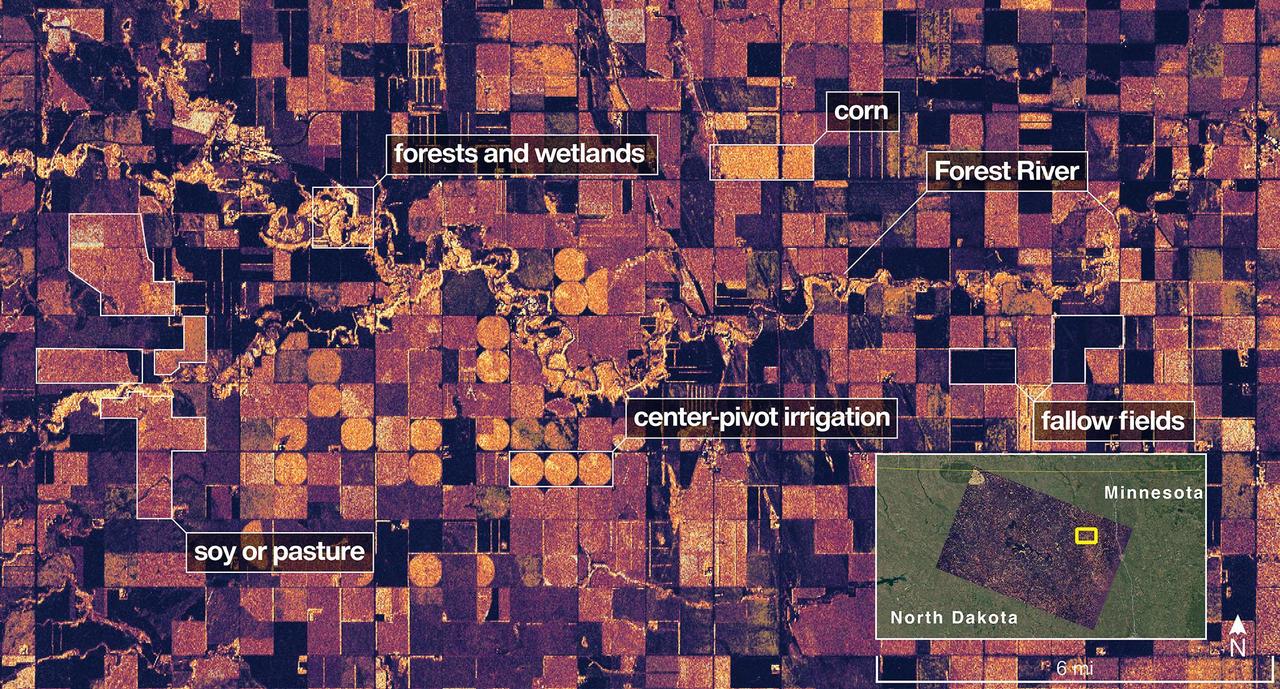
The NISAR (NASA-ISRO Synthetic Aperture Radar) Earth-observing radar satellite's L-band synthetic aperture radar (SAR) system captured an image of a portion of northeastern North Dakota straddling Grand Forks and Walsh counties on Aug. 23, 2025. Produced by scientists on the NISAR science team, the image shows forests and wetlands on the banks of the Forest River meandering through the middle of the frame from west to east and farmland to the north and south. The darker agricultural plots are fallow fields, while the lighter colors represent the presence of pasture or crops, such as soybean and corn. Circular patterns indicate the use of center-pivot irrigation. The satellite is a joint effort between NASA and the Indian Space Research Organisation (ISRO) and is the first satellite to combine L-band and S-band radar systems. The satellite's L-band system, provided by NASA's Jet Propulsion Laboratory in Southern California, uses a 10-inch (25-centimeter) wavelength that enables its signal to penetrate forest canopies and measure soil moisture as well as motion of ice surfaces and land down to fractions of an inch – a key measurement in understanding how the land surface moves before, during, and after earthquakes, volcanic eruptions, and landslides. The NISAR S-band radar, provided by ISRO's Space Applications Centre, uses a 4-inch (10-centimeter) microwave signal that's more sensitive to small vegetation, which makes it effective at monitoring certain types of agriculture and grassland ecosystems. Data used to create the image was collected during NISAR's commissioning phase, when the spacecraft's systems and instruments are powered on and tested. The NISAR mission will begin science operations in November, roughly 90 days after its July 30, 2025, launch from Satish Dhawan Space Centre on India's southeastern coast. Observations from NISAR will benefit humanity by helping researchers around the world better understand changes in our planet's surface, including its ice sheets, glaciers, and sea ice. It also will capture changes in forest and wetland ecosystems and track movement and deformation of our planet's crust by phenomena such as earthquakes, landslides, and volcanic activity. The global and rapid coverage from NISAR will provide unprecedented support for disaster response, producing data to assist in mitigating and assessing damage, with observations before and after catastrophic events available in short time frames. https://photojournal.jpl.nasa.gov/catalog/PIA26615
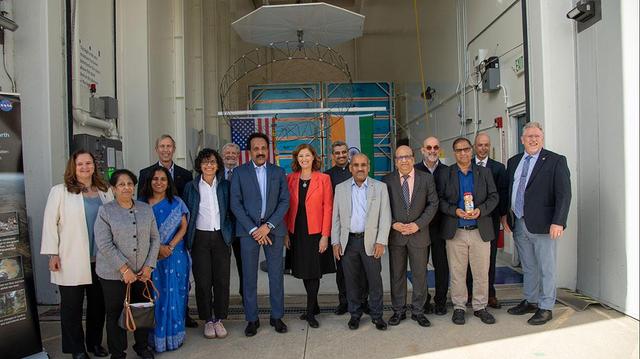
Officials from NASA, the Indian Space Research Organization (ISRO), and the Embassy of India hold a send-off ceremony for the NASA-ISRO Synthetic Aperture Radar (NISAR) science instrument payload on Feb. 3, 2023, outside a clean room at NASA's Jet Propulsion Laboratory in Southern California. The payload is scheduled to be shipped to India in March. Pictured left to right: Karen St. Germain, director, Earth Science Division, NASA; Mitra Dutta, NISAR program executive, NASA; Sripriya Ranganathan, ambassador and deputy chief of mission, Indian Embassy; Larry James, deputy director, JPL; Bhavya Lal, associate administrator for technology, policy, and strategy, NASA; Jim Graf, director, Earth Science and Technology Directorate, JPL; S. Somanath, chairman, ISRO; Laurie Leshin, director, JPL; Krunal Joshi, counselor, space and ISRO technical liaison officer, Indian Embassy; M. Sankaran, director, U R Rao Satellite Centre, ISRO; Shantanu Bhatawdekar, scientific secretary, ISRO; Paul Rosen, NISAR project scientist, JPL; CV Shrikant, NISAR project director, ISRO; Phil Barela, NISAR project manager, JPL; and Gerald Bawden, NISAR program scientist, NASA. NISAR – a joint effort between NASA and ISRO – will measure changes to Earth's land ice surfaces down to fractions of an inch. Data collected by this satellite will help researchers monitor a wide range of changes critical to life on Earth in unprecedented detail. This includes spotting warning signs of imminent volcanic eruptions, helping to monitor groundwater supplies, tracking the melt rate of ice sheets tied to sea level rise, and observing shifts in the distribution of vegetation around the world. The data will inform humanity's responses to urgent challenges posed by natural disasters and climate change, and help communities prepare for and manage hazards. There are two instruments on the satellite that will send and receive radar signals to and from Earth's surface to make the mission's measurements. An L-band synthetic aperture radar (SAR), which uses a signal wavelength of around 9 inches (24 centimeters), and an S-band SAR with a signal wavelength of nearly 5 inches (12 centimeters). Both will bounce their microwave signal off of the planet's surface and record how long it takes the signal to make one roundtrip, as well as the strength of that return signal. This enables the researchers to calculate the distance from the spacecraft to Earth's surface and thereby determine how the land or ice is changing. An antenna reflector nearly 40 feet (12 meters) in diameter, supported by a deployable boom, will focus the microwave signals sent and received by the SARs. JPL, which is managed for NASA by Caltech in Pasadena, leads the U.S. component of NISAR and is providing the mission's L-band SAR instrument. NASA is also providing the radar reflector antenna, the deployable boom, a high-rate communication subsystem for science data, GPS receivers, a solid-state recorder, and payload data subsystem. ISRO is providing the spacecraft bus, the S-band SAR, the launch vehicle, and associated launch services and satellite mission operations. https://photojournal.jpl.nasa.gov/catalog/PIA25600
Engineer Emmanuel Decrossas of NASA's Jet Propulsion Laboratory in Southern California makes an adjustment to an antenna's connector, part of a NASA telecommunications payload called User Terminal, at Firefly Aerospace's facility in Cedar Park, Texas, in August 2025. Figure A (https://photojournal.jpl.nasa.gov/figures/PIA26596_figA.jpg) shows members of the team from JPL and NASA (dark blue) and Firefly (white) with the User Terminal antenna, radio, and other components on the bench behind them. Managed by JPL, the User Terminal will test a new, low-cost lunar communications system that future missions to the Moon's far side could use to transfer data to and from Earth via lunar relay satellite. The User Terminal payload will be installed atop Firefly's Blue Ghost Mission 2 lunar lander, which is slated to launch to the Moon's far side in 2026 under NASA's CLPS (Commercial Lunar Payload Services) initiative. NASA's Apollo missions brought large and powerful telecommunications systems to the lunar near-side surface to communicate directly with Earth. But spacecraft on the far side will not have that option because only the near side of the Moon is visible to Earth. Sending messages between the Moon and Earth via a relay orbiter enables communication with the lunar far side and improves it at the Moon's poles. The User Terminal will for the first time test such a setup for NASA by using a compact, lightweight software defined radio, antenna, and related hardware to communicate with a satellite that Blue Ghost Mission 2 is delivering to lunar orbit: ESA's (the European Space Agency's) Lunar Pathfinder. The User Terminal radio and antenna installed on the Blue Ghost lander will be used to commission Lunar Pathfinder, sending test data back and forth. After the lander ceases operations as planned at the end of a single lunar day (about 14 Earth days), a separate User Terminal radio and antenna installed on LuSEE-Night – another payload on the lander – will send LuSEE-Night's data to Lunar Pathfinder, which will relay the information to a commercial network of ground stations on Earth. LuSEE-Night is a radio telescope that expected to operate for at least 1½ years; it is a joint effort by NASA, the U.S. Department of Energy, and University of California, Berkeley's Space Sciences Laboratory. Additionally, User Terminal will be able to communicate with another satellite that's being delivered to lunar orbit by Blue Ghost Mission 2: Firefly's own Elytra Dark orbital vehicle. The hardware on the lander is only part of the User Terminal project, which was also designed to implement a new S-band two-way protocol, or standard, for short-range space communications between entities on the lunar surface (such as rovers and landers) and lunar orbiters, enabling reliable data transfer between them. The standard is a new version of a space communications protocol called Proximity-1 that was initially developed more than two decades ago for use at Mars by an international standard body called the Consultative Committee for Space Data Systems (CCSDS), of which NASA is a member agency. The User Terminal team made recommendations to CCSDS on the development of the new lunar S-band standard, which was specified in 2024. The new standard will enable lunar orbiters and surface spacecraft from various entities – NASA and other civil space agencies as well as industry and academia – to communicate with each other, a concept known as interoperability. At Mars, NASA rovers communicate with various Red Planet orbiters using the Ultra-High Frequency (UHF) radio band version of the Proximity-1 standard. On the Moon's far side, use of UHF is reserved for radio astronomy science; so a new lunar standard was needed using a different frequency range, S-band, as were more efficient modulation and coding schemes to better fit the available frequency spectrum specified by the new standard. User Terminal is funded by NASA's Exploration Science Strategy and Integration Office, part of the agency's Science Mission Directorate, which manages the CLPS initiative. JPL manages the project and supported development of the new S-band radio standard and the payload in coordination with Vulcan Wireless in Carlsbad, California, which built the radio. Caltech in Pasadena manages JPL for NASA. https://photojournal.jpl.nasa.gov/catalog/PIA26596

STS059-S-074 (15 April 1994) --- This color composite C-Band and L-Band image of the Kilauea volcano on the big island of Hawaii was acquired by the Spaceborne Imaging Radar-C and X-Band Synthetic Aperture Radar (SIR-C/X-SAR) flying on the Space Shuttle Endeavour. The city of Hilo can be seen at the top. The image shows the different types of lava flows around the crater Pu'u O'o. Ash deposits which erupted in 1790 from the summit of Kilauea volcano show up as dark in this image, and fine details associated with lava flows which erupted in 1919 and 1974 can be seen to the south of the summit in an area called the Ka'u Desert. In addition, the other historic lava flows created in 1881 and 1984 from Mauna Loa volcano (out of view to the left of this image) can easily be seen despite the fact that the surrounding area is covered by forest. Such information will be used to map the extent of such flows, which can pose a hazard to the subdivisions of Hilo. Highway 11 is the linear feature running from Hilo to the Kilauea volcano. The Kilauea volcano has been almost continuously active for more than the last 11 years. Field teams that were on the ground specifically to support these radar observations report that there was vigorous surface activity about 400 meters (one-quarter mile) inland from the coast. A moving lava flow about 200 meters (660 feet) in length was observed at the time of the Shuttle over flight, raising the possibility that subsequent images taken during this mission will show changes in the landscape. SIR-C/X-SAR is part of NASA's Mission to Planet Earth (MTPE). SIR-C/X-SAR radars illuminate Earth with microwaves allowing detailed observations at any time, regardless of weather or sunlight conditions. SIR-C/X-SAR uses three microwave wavelengths: L-Band (24 cm), C-Band (6 cm), and X-Band (3 cm). The multi-frequency data will be used by the international scientific community to better understand the global environment and how it is changing. The SIR-C/X-SAR data, complemented by aircraft and ground studies, will give scientists clearer insights into those environmental changes which are caused by nature and those changes which are induced by human activity. SIR-C was developed by NASA's Jet Propulsion Laboratory (JPL). X-SAR was developed by the Dornire and Alenia Spazio Companies for the German Space Agency, Deutsche Agentur fuer Raumfahrtangelegenheiten (DARA), and the Italian Space Agency, Agenzia Spaziale Italiana (ASI). JPL Photo ID: P-43918
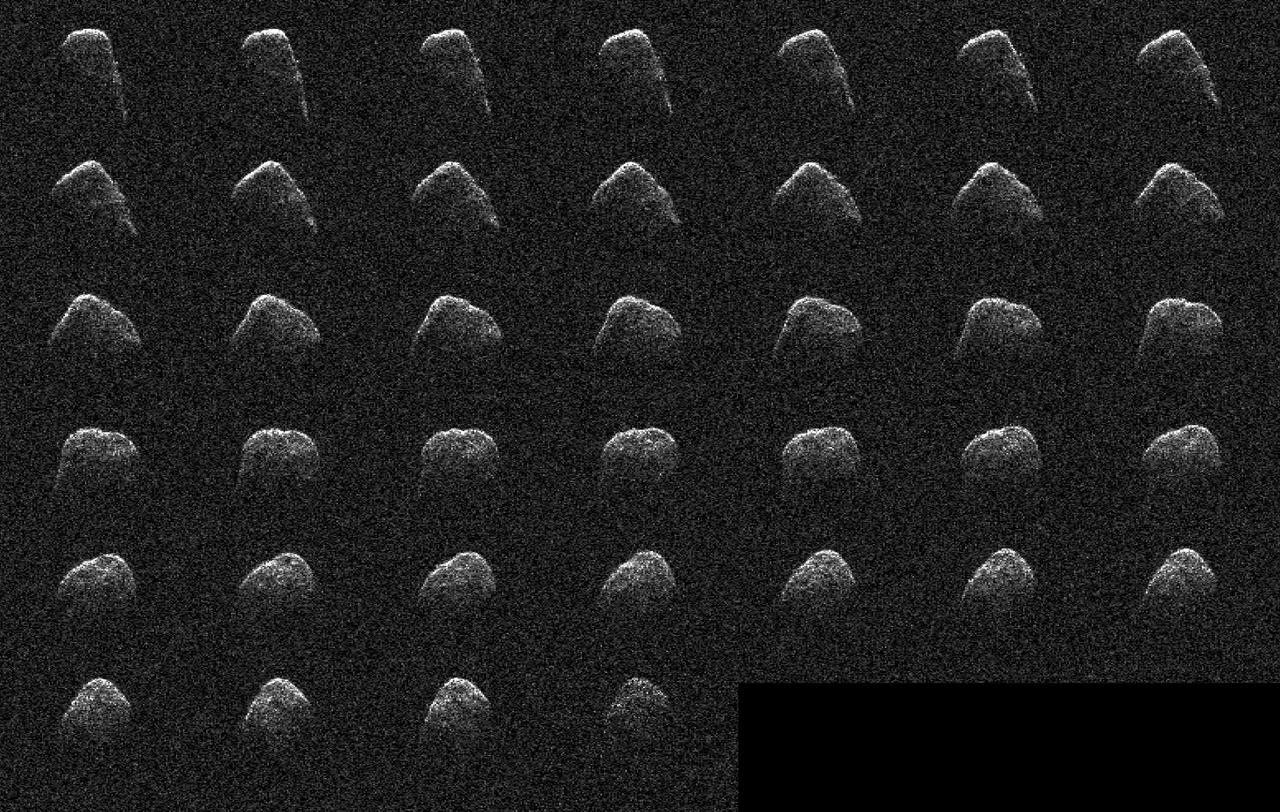
These images and animation represent NASA radar observations of 4660 Nereus on Dec. 10, 2021, before the asteroid's close approach on Dec. 11, when it came within 2.5 million miles (4 million kilometers) of Earth. Using the 70-meter radio antenna at the Deep Space Network's Goldstone Deep Space Communications Complex near Barstow, California, scientists from NASA's Jet Propulsion Laboratory acquired the most detailed radar images of the nearly 1,100-foot-wide (330-meter-wide) near-Earth asteroid since its discovery almost four decades earlier. Nereus' orbit is very well known and the asteroid does not pose a threat to Earth. During the asteroid's close approach, an image resolution of about 12.3 feet (3.75 meters) per pixel was possible, revealing surface features such as potential boulders and craters, plus ridges and other topography. Asteroid Nereus' previous approach in 2002 was near enough to Earth to reveal the asteroid's size and overall shape, but too distant to show surface features. The new observations will also help scientists better understand the asteroid's shape and rotation while providing them new data to further refine its orbital path around the Sun. Nereus belongs to the relatively rare E-type asteroid family that exhibits very unusual radar scattering properties. It's thought that this may be caused by asteroids of this type having particularly rough terrain. Also, E-type asteroids are optically bright, sometimes reflecting as much as 50% of the sunlight that hits their surface. Typical S-type asteroids reflect about 15%, whereas dark C-type asteroids reflect only a few percent. It's thought that E-class asteroids may be the source of very rare Aubrite meteorites and are composed of comparatively bright material. The 2021 close approach was the best opportunity for radar imaging of Nereus until 2060, when the asteroid will approach within 750,000 miles (1.2 million kilometers) of Earth, only three times the Earth-Moon distance. At that time, Nereus will be an easy target for small telescopes and possibly even powerful binoculars. Nereus – named after a sea god from Greek mythology – was discovered in 1982 by Eleanor "Glo" Helin as part of the JPL Palomar Planet-Crossing Asteroid Survey. Movie available at https://photojournal.jpl.nasa.gov/catalog/PIA24566
STS059-S-085 (18 April 1994) --- This is a three-dimensional perspective view of part of Isla Isabela in the western Galapagos Islands. It was taken by the L-Band radar in HH polarization from the Spaceborne Imaging Radar-C and X-Band Synthetic Aperture Radar (SIR-C/X-SAR) on the 40th orbit of the Space Shuttle Endeavour. This view was constructed by overlaying a SIR-C radar image on a U.S. Geological Survey digital elevation map. The image is centered at about .5 degrees south latitude and 91 degrees west longitude, and covers an area of 75 by 60 kilometers. The radar incidence angle at the center of the image is about 20 degrees. The western Galapagos Islands, which lie about 1200 kilometers west of Ecuador in the eastern Pacific, have six active volcanoes similar to the volcanoes found in Hawaii. Since the time of Charles Darwin's visit to the area in 1835, there have been over 60 recorded eruptions on these volcanoes. This SIR-C/X-SAR image of Alcedo and Sierra Negra volcanoes shows the rougher lava flows as bright features, while ash deposits and smooth pahoehoe lava flows appear dark. The Galapagos Islands are one of the SIR-C/X-SAR supersites and data of this area will be taken several times during the flight to allow scientists to conduct topographic change studies and to search for different lava flow types, ash deposits and fault lines. SIR-C/X-SAR is part of NASA's Mission to Planet Earth (MTPE). SIR-C/X-SAR radars illuminate Earth with microwaves allowing detailed observations at any time, regardless of weather or sunlight conditions. SIR-C/X-SAR uses three microwave wavelengths: L-Band (24 cm), C-Band (6 cm), and X-Band (3 cm). The multi-frequency data will be used by the international scientific community to better understand the global environment and how it is changing. The SIR-C/X-SAR data, complemented by aircraft and ground studies, will give scientists clearer insights into those environmental changes which are caused by nature and those changes which are induced by human activity. SIR-C was developed by NASA's Jet Propulsion Laboratory (JPL). X-SAR was developed by the Dornire and Alenia Spazio Companies for the German Space Agency, Deutsche Agentur fuer Raumfahrtangelegenheiten (DARA), and the Italian Space Agency, Agenzia Spaziale Italiana (ASI). JPL Photo ID: P-43938

STS059-S-068 (13 April 1994) --- This false-color L-Band image of the Manaus region of Brazil was acquired by the Spaceborne Imaging Radar-C and X-Band Synthetic Aperture Radar (SIR-C/X-SAR) aboard the Space Shuttle Endeavour on orbit 46 of the mission. The area shown is approximately 8 kilometers by 40 kilometers (5 by 25 miles). At the top of the image are the Solimoes and Rio Negro Rivers just before they combine at Manaus to form the Amazon River. The image is centered at about 3 degrees south latitude, and 61 degrees west longitude. The false colors are created by displaying three L-Band polarization channels; red areas correspond to high backscatter at HH polarization, while green areas exhibit high backscatter at HV polarization. Blue areas show low returns at VV polarization; hence the bright blue colors of the smooth river surfaces. Using this color scheme, green areas in the image are heavily forested, while blue areas are either cleared forest or open water. The yellow and red areas are flooded forest. Between Rio Solimoes and Rio Negro a road can be seen running from some cleared areas (visible as blue rectangles north of Rio Solimoes) north towards a tributary of Rio Negro. SIR-C/X-SAR is part of NASA's Mission to Planet Earth (MTPE). SIR-C/X-SAR radars illuminate Earth with microwaves allowing detailed observations at any time, regardless of weather or sunlight conditions. SIR-C/X-SAR uses three microwave wavelengths: L-Band (24 cm), C-Band (6 cm), and X-Band (3 cm). The multi-frequency data will be used by the international scientific community to better understand the global environment and how it is changing. The SIR-C/X-SAR data, complemented by aircraft and ground studies, will give scientists clearer insights into those environmental changes which are caused by nature and those changes which are induced by human activity. SIR-C was developed by NASA's Jet Propulsion Laboratory (JPL). X-SAR was developed by the Dornire and Alenia Spazio Companies for the German Space Agency, Deutsche Agentur fuer Raumfahrtangelegenheiten (DARA), and the Italian Space Agency, Agenzia Spaziale Italiana (ASI). JPL Photo ID: P-43895

STS068-S-055 (7 October 1994) --- This is a false-color L-Band image of an area near Glasgow, Missouri, centered at about 39.2 degrees north latitude and 92.8 degrees west longitude. The image was acquired using the L-Band radar channel (horizontally transmitted and received and horizontally transmitted and vertically received) polarization's combined. The data were acquired by the Spaceborne Imaging Radar-C/X-Band Synthetic Aperture Radar (SIR-C/X-SAR) aboard the Space Shuttle Endeavour on orbit 50 on October 3, 1994. The area shown is approximately 37 by 25 kilometers (23 by 16 miles). The radar data, coupled with pre-flood aerial photography and satellite data and post-flood topographic and field data, are being used to evaluate changes associated with levee breaks in land forms, where deposits formed during the widespread flooding in 1993 along the Missouri and Mississippi Rivers. The distinct radar scattering properties of farmland, sand fields and scoured areas will be used to inventory flood plains along the Missouri River and determine the processes by which these areas return to preflood conditions. The image shows one such levee break near Glasgow, Missouri. In the upper center of the radar image, below the bend of the river, is a region covered by several meters of sand, shown as dark regions. West (left) of the dark areas, a gap in the levee tree canopy shows the area where the levee failed. Radar data such as these can help scientists more accurately assess the potential for future flooding in this region and how that might impact surrounding communities. Spaceborne Imaging Radar-C/X-Band Synthetic Aperture Radar (SIR-C/X-SAR) is part of NASA's Mission to Planet Earth. The radars illuminate Earth with microwaves, allowing detailed observations at any time, regardless of weather or sunlight conditions. SIR-C/X-SAR uses the three microwave wavelengths: the L-Band (24 centimeters), C-Band (6 centimeters) and X-Band (3 centimeters). The multi-frequency data will be used by the international scientific community to better understand the global environment and how it is changing. The SIR-C/X-SAR data, complemented by aircraft and ground studies, will give scientists clearer insights into those environmental changes which are caused by nature and those changes which are induced by human activity. SIR-C was developed by NASA's Jet Propulsion Laboratory (JPL). X-SAR was developed by the Dornier and Alenia Spazio companies for the German space agency, Deutsche Agentur fuer Raumfahrtangelegenheiten (DARA), and the Italian space agency, Agenzia Spaziale Italiana (ASI), with the Deutsche Forschungsanstalt fuer Luft und Raumfahrt e.v. (DLR), the major partner in science, operations and data processing of X-SAR. (P-44734)
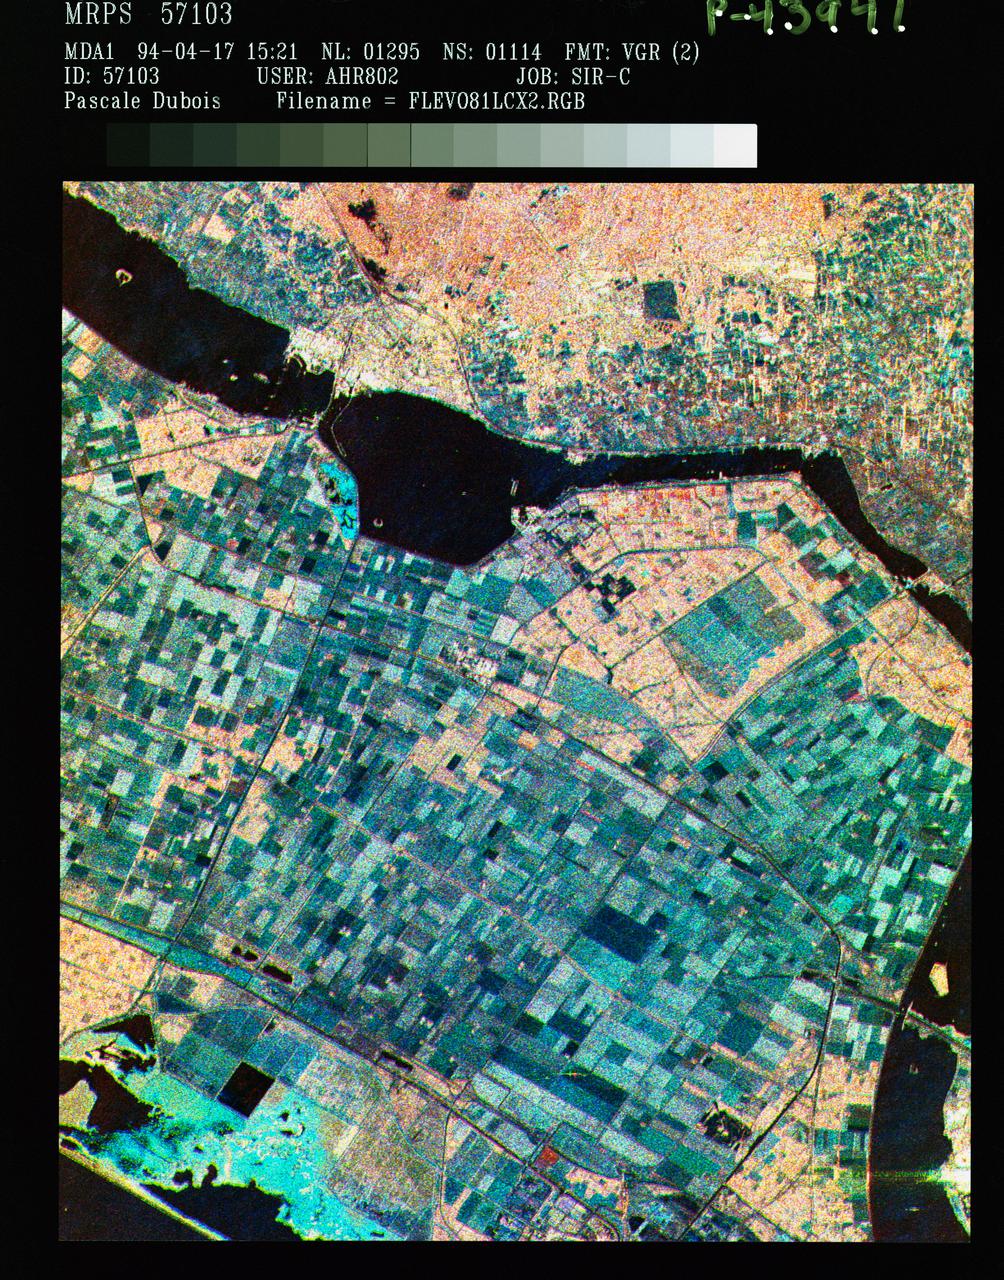
STS059-S-086 (18 April 1994) --- This is a three-frequency false-color image of Flevoland, the Netherlands, centered at 52.4 degrees north latitude, and 5.4 degrees east longitude. This image was acquired by the Spaceborne Imaging Radar-C and X-Band Synthetic Aperture Radar (SIR-C/X-SAR) aboard the Space Shuttle Endeavour on April 14, 1994. It was produced by combining data from the X-Band, C-Band and L-Band radar's. The area shown is approximately 25 by 28 kilometers (15 1/2 by 17 1/2 miles). Flevoland, which fills the lower two-thirds of the image, is a very flat area that is made up of reclaimed land that is used for agriculture and forestry. At the top of the image, across the canal from Flevoland, is an older forest shown in red; the city of Harderwijk is shown in white on the shore of the canal. At this time of the year, the agricultural fields are bare soil, and they show up in this images in blue. The changes in the brightness of the blue areas are equal to the changes in roughness. The dark blue areas are water and the small dots in the canal are boats. This SIR-C/X-SAR supersite is being used for both calibration and agricultural studies. Several soil and crop ground-truth studies will be conducted during the Shuttle flight. In addition, about 10 calibration devices and 10 corner reflectors have been deployed to calibrate and monitor the radar signal. One of these transponders can be seen as a bright star in the lower right quadrant of the image. This false-color image was made using L-Band total power in the red channel, C-Band total power in the green channel, and X-Band VV polarization in the blue channel. SIR-C/X-SAR is part of NASA's Mission to Planet Earth (MTPE). SIR-C/X-SAR radars illuminate Earth with microwaves allowing detailed observations at any time, regardless of weather or sunlight conditions. SIR-C/X-SAR uses three microwave wavelengths: L-Band (24 cm), C-Band (6 cm), and X-Band (3 cm). The multi-frequency data will be used by the international scientific community to better understand the global environment and how it is changing. The SIR-C/X-SAR data, complemented by aircraft and ground studies, will give scientists clearer insights into those environmental changes which are caused by nature and those changes which are induced by human activity. SIR-C was developed by NASA's Jet Propulsion Laboratory (JPL). X-SAR was developed by the Dornire and Alenia Spazio Companies for the German Space Agency, Deutsche Agentur fuer Raumfahrtangelegenheiten (DARA), and the Italian Space Agency, Agenzia Spaziale Italiana (ASI). JPL Photo ID: P-43941
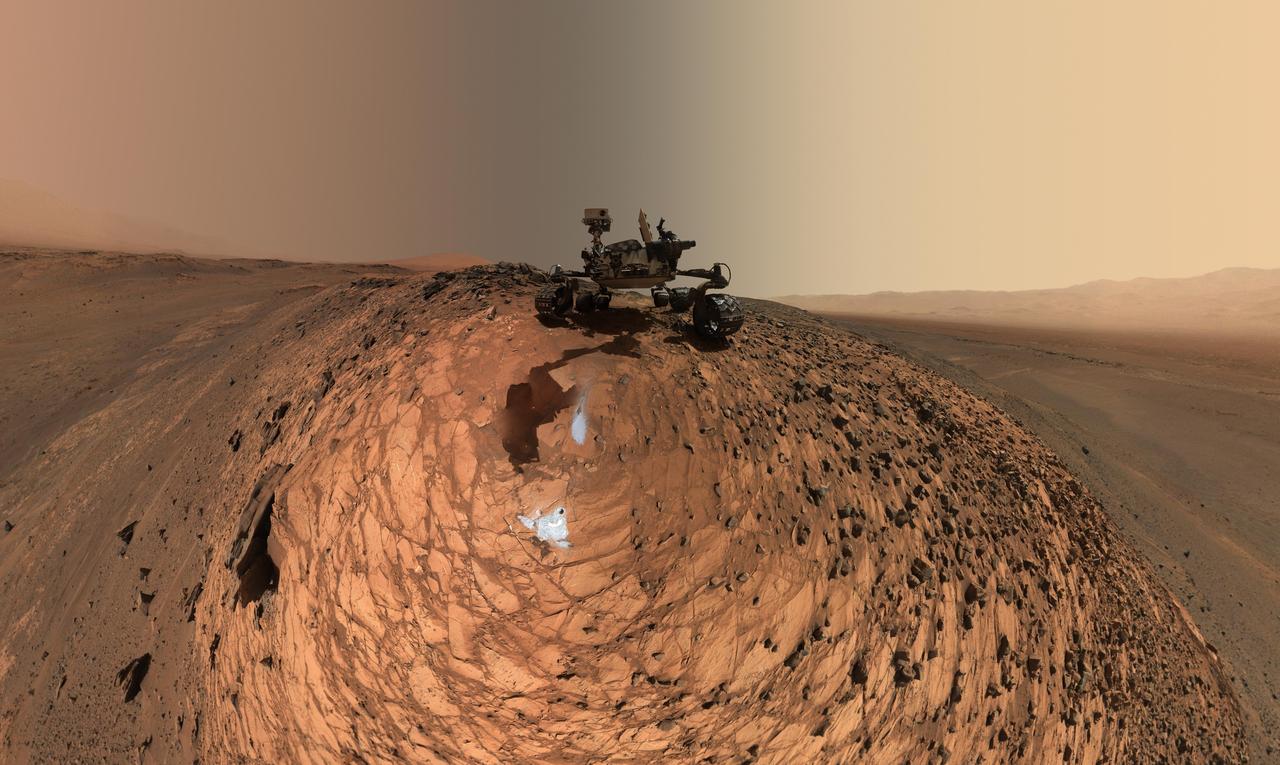
This low-angle self-portrait of NASA's Curiosity Mars rover shows the vehicle above the "Buckskin" rock target, where the mission collected its seventh drilled sample. The site is in the "Marias Pass" area of lower Mount Sharp. The scene combines dozens of images taken by Curiosity's Mars Hand Lens Imager (MAHLI) on Aug. 5, 2015, during the 1,065th Martian day, or sol, of the rover's work on Mars. The 92 component images are among MAHLI Sol 1065 raw images at http://mars.nasa.gov/msl/multimedia/raw/?s=1065&camera=MAHLI. For scale, the rover's wheels are 20 inches (50 centimeters) in diameter and about 16 inches (40 centimeters) wide. Curiosity drilled the hole at Buckskin during Sol 1060 (July 30, 2015). Two patches of pale, powdered rock material pulled from Buckskin are visible in this scene, in front of the rover. The patch closer to the rover is where the sample-handling mechanism on Curiosity's robotic arm dumped collected material that did not pass through a sieve in the mechanism. Sieved sample material was delivered to laboratory instruments inside the rover. The patch farther in front of the rover, roughly triangular in shape, shows where fresh tailings spread downhill from the drilling process. The drilled hole, 0.63 inch (1.6 centimeters) in diameter, is at the upper point of the tailings. The rover is facing northeast, looking out over the plains from the crest of a 20-foot (6-meter) hill that it climbed to reach the Marias Pass area. The upper levels of Mount Sharp are visible behind the rover, while Gale Crater's northern rim dominates the horizon on the left and right of the mosaic. A portion of this selfie cropped tighter around the rover is at PIA19808. Another version of the wide view, presented in a projection that shows the horizon as a circle, is at PIA19806. MAHLI is mounted at the end of the rover's robotic arm. For this self-portrait, the rover team positioned the camera lower in relation to the rover body than for any previous full self-portrait of Curiosity. This yielded a view that includes the rover's "belly," as in a partial self-portrait (PIA16137) taken about five weeks after Curiosity's August 2012 landing inside Mars' Gale Crater. Before sending Curiosity the arm-positioning commands for this Buckskin belly panorama, the team previewed the low-angle sequence of camera pointings on a test rover in California. A mosaic from that test is at PIA19810. This selfie at Buckskin does not include the rover's robotic arm beyond a portion of the upper arm held nearly vertical from the shoulder joint. Shadows from the rest of the arm and the turret of tools at the end of the arm are visible on the ground. With the wrist motions and turret rotations used in pointing the camera for the component images, the arm was positioned out of the shot in the frames or portions of frames used in this mosaic. This process was used previously in acquiring and assembling Curiosity self-portraits taken at sample-collection sites "Rocknest" (PIA16468), "John Klein" (PIA16937), "Windjana" (PIA18390) and "Mojave" (PIA19142). MAHLI was built by Malin Space Science Systems, San Diego. NASA's Jet Propulsion Laboratory, a division of the California Institute of Technology in Pasadena, manages the Mars Science Laboratory Project for the NASA Science Mission Directorate, Washington. JPL designed and built the project's Curiosity rover. http://photojournal.jpl.nasa.gov/catalog/PIA19807
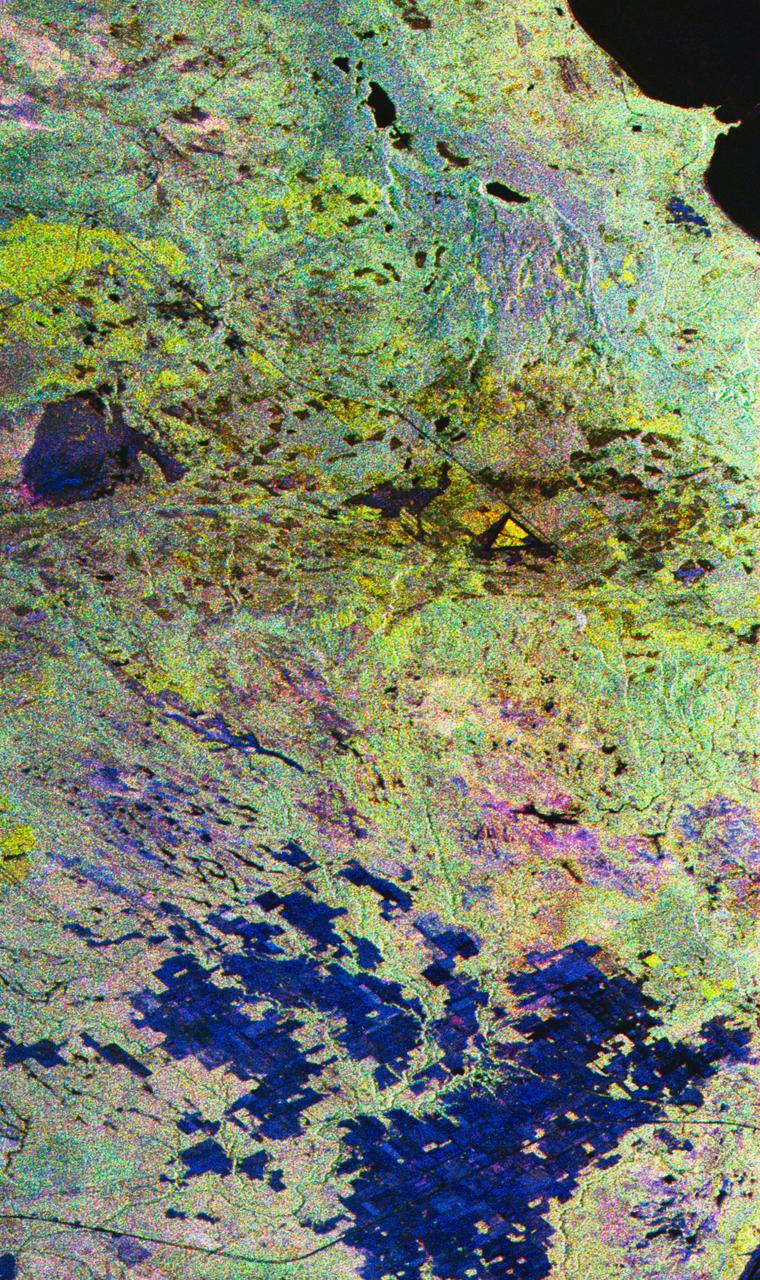
STS059-S-027 (10 April 1994) --- This image is a false-color composite of Raco, Michigan, centered at 46.39 degrees north latitude, 84.88 degrees east longitude. This image was acquired by the Spaceborne Imaging Radar-C and X-Band Synthetic Aperture Radar (SIR-C/X-SAR) aboard the Space Shuttle Endeavour on its 6th orbit and during the first full-capacity test of the instrument. This image was produced using both L-Band and C-Band data. The area shown is approximately 20 kilometers by 50 kilometers. Raco is located at the eastern end of Michigan's upper peninsula, west of Sault Ste. Marie and south of Whitefish Bay on Lake Superior. The site is located at the boundary between the boreal forests and the northern temperate forests, a transitional zone that is expected to be ecologically sensitive to anticipated global changes resulting from climatic warming. On any given day, there is a 60 percent chance that this area will be obscured to some extent by cloud cover which makes it difficult to image using optical sensors. In this color representation (Red=LHH, Green=LHV, Blue=CHH), darker areas in the image are smooth surfaces such as frozen lakes and other non-forested areas. The colors are related to the types of trees and the brightness is related to the amount of plant material covering the surface, called forest biomass. Accurate information about land-cover is important to area resource managers and for use in regional- to global-scale scientific models used to understand global change. SIR-C/X-SAR radars illuminate Earth with microwaves allowing detailed observations at any time, regardless of weather or sunlight conditions. SIR-C/X-SAR uses three microwave wavelengths: L-Band (24 cm), C-Band (6 cm), and X-Band (3 cm). The multi-frequency data will be used by the international scientific community to better understand the global environment and how it is changing. The SIR-C/X-SAR data, complemented by aircraft and ground studies, will give scientists clearer insights into those environmental changes which are caused by nature and those changes which are induced by human activity. SIR-C was developed by NASA's Jet Propulsion Laboratory (JPL). X-SAR was developed by the Dornire and Alenia Spazio Companies for the German Space Agency, Deutsche Agentur fuer Raumfahrtangelegenheiten (DARA), and the Italian Space Agency, Agenzia Spaziale Italiana (ASI). JPL Photo ID: P-43882
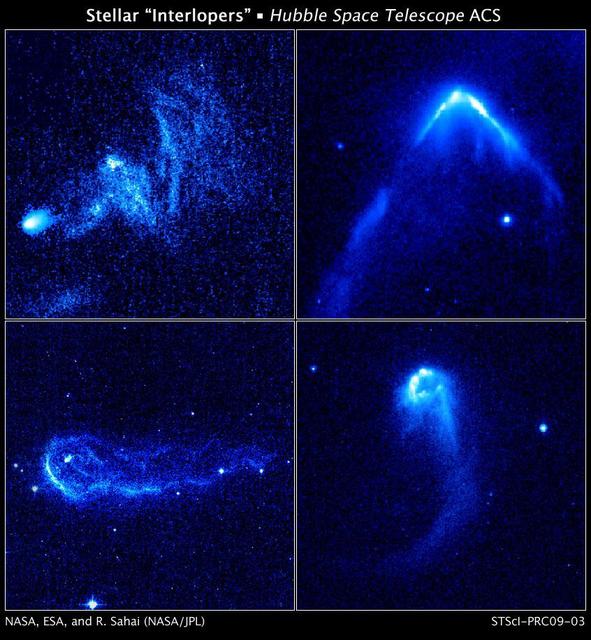
Stellar Interlopers Caught Speeding Through Space

This image from NASA's James Webb Space Telescope reveals at least 17 concentric dust rings emanating from a pair of stars orbiting one another. Located just over 5,000 light-years from Earth, the system is known as Wolf-Rayet 140 because one of the stars is a Wolf-Rayet star. The other is an O-type star, one of the most massive star types known. Each ring was created when the two stars came close together and their stellar winds (streams of gas they blow into space) collided, compressing the gas and forming dust. A ring is produced once per orbit, every 7.93 years. A Wolf-Rayet star is an O-type star born with at least 25 times more mass than our Sun that is nearing the end of its life, when it will likely collapse directly to black hole, or explode as a supernova. These delays between periods of dust production create the unique ring pattern. Some Wolf-Rayet binaries in which the stars are close enough together and have circular orbits produce dust continuously, often forming a pinwheel pattern. WR 140's rings are also referred to as shells because they are not perfectly circular and are thicker and wider than they appear in the image. The rings appear brighter in some areas but are almost invisible in others, rather than forming a perfect "bullseye" pattern. That's because production of dust is variable as the stars get close to one another, and because Webb views the system at an angle and is not looking directly at the orbital plane of the stars. One of the densest regions of dust production creates the bright feature appearing at 2 o'clock. The image was taken by the Mid-Infrared Instrument (MIRI), now managed by the agency's Goddard Space Flight Center. MIRI was developed through a 50-50 partnership between NASA and ESA (European Space Agency). The Jet Propulsion Laboratory in Southern California led the effort for NASA, and a multinational consortium of European astronomical institutes contributed for ESA. Webb's science instruments detect infrared light, a range of wavelengths emitted by warm objects and invisible to the human eye. MIRI detects the longest infrared wavelengths, which means it can often see cooler objects – including these dust rings – than the other three Webb instruments can. The filters used to take this image were the F770W (7.7 micrometers, shown as blue), F1500W (15 micrometers, shown as green), and F2100W (21 micrometers, shown as red). The observations were done under Webb's early release observation (ERO) program number 1349. The most common element found in stars, hydrogen, can't form dust on its own. But Wolf-Rayet stars in their later stages have blown away all of their hydrogen, so they eject elements typically found deep in a star's interior, like carbon, which can form dust. Data from MIRI's Medium Resolution Spectrometer (MRS) shows that the dust made by WR 140 is likely made of a class of molecules called polycyclic aromatic hydrocarbons (PAHs), which are a type of organic carbon-rich compounds that are thought to enrich the carbon content throughout the Universe. Initial processing of the Webb WR 140 data included eight bright "spikes" of light emanating from the center of the image. These are not features of the system, but so-called artifacts of the telescope itself. They were removed from the image, in order to give viewers an unobscured view of the source object. https://photojournal.jpl.nasa.gov/catalog/PIA25432
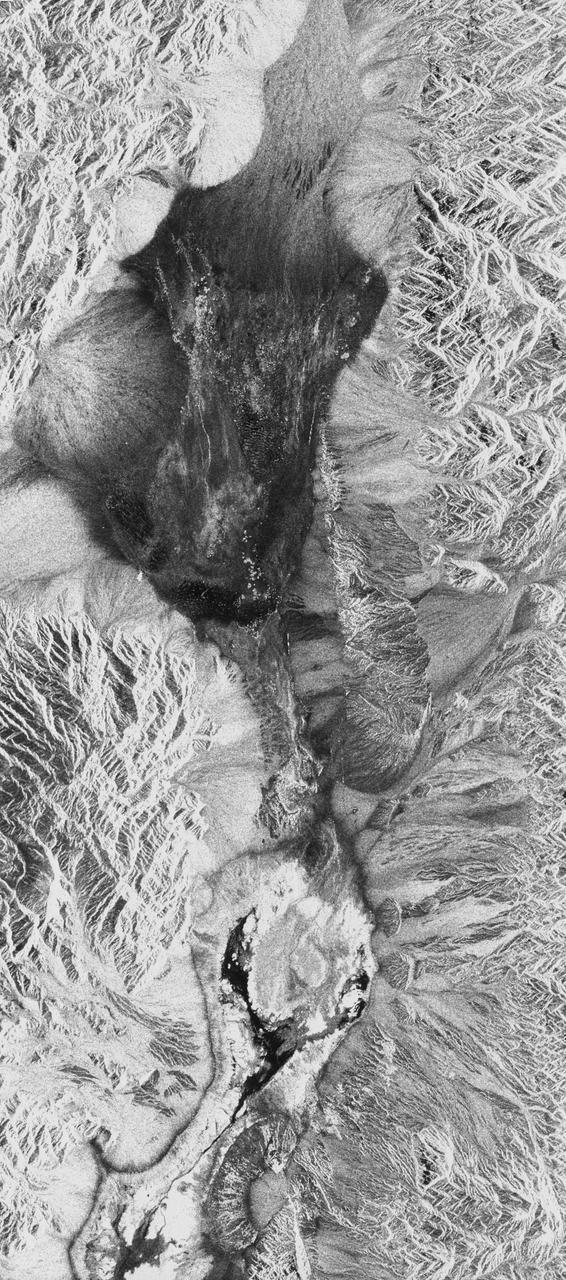
STS059-S-026 (11 April 1994) --- This is an image of Death Valley, California, centered at 36.629 degrees north latitude, 117.069 degrees west longitude. The image shows Furnace Creek alluvial fan and Furnace Creek Ranch at the far right, and the sand dunes near Stove Pipe Wells at the center. The dark fork-shaped feature between Furnace Creek fan and the dunes is a smooth flood-plain which encloses Cottonball Basin. The SIR-C/X-SAR supersite is an area of extensive field investigations and has been visited by both Space Radar Lab astronaut crews. Elevations in the Valley range from 70 meters below sea level, the lowest in the United States, to more than 3300 meters above sea level. Scientists are using SIR-C/X-SAR data from Death Valley to help answer a number of different questions about the Earth's geology. One question concerns how alluvial fans are formed and change through time under the influence of climatic changes and earthquakes. Alluvial fans are gravel deposits that wash down from the mountains over time. They are visible in the image as circular, fan-shaped bright areas extending into the darker valley floor from the mountains. Information about the alluvial fans help scientists study Earth's ancient climate. Scientists know the fans are bulit up through climatic and tectonic processes and they will use the SIR-C/X-SAR data to understand the nature and rates of weathering processes on the fans, soil formation, and the transport of sand and dust by the wind. SIR-C/X-SAR's sensitivity to centimeter-scale (or inch-scale) roughness provides detailed maps of surface texture. Such information can be used to study the occurrence and movement of dust storms and sand dunes. the goal of these studies is to gain a better understanding of the record of past climatic changes and the effects of those changes on a sensitive environment. This may lead to a better ability to predict future response of the land to different potential global cimate-change scenarios. Death Valley is also one of the primary calibration sites for SIR-C/X-SAR. The bright dots near the center of the image are corner reflectors that have been set-up to calibrate the radar as the Shuttle passes overhead. Thirty triangular-shaped reflectors (they look like aluminum pyramids) have been deployed by the calibration team from JPL over a 40 kilometer by 40 kilometer area in and around Death Valley. The calibration team will also deploy transponders (electronic reflectors) and recievers to measure the radar signals from SIR-C/X-SAR on the ground. Spaceborne Imaging Radar-C and X-Synthetic Aperture Radar (SIR-C/X-SAR) is part of NASA's Mission to Planet Earth (MTPE). The radars illuminate Earth with microwaves allowing detailed observations at any time, regardless of weather or sunlight conditions. SIR-C/X-SAR uses three microwave wavelengths: L-Band (24 cm), C-Band (6 cm), and X-Band (3 cm). The multi-frequency data will be used by the international scientific community to better understand the global environment and how it is changing. The SIR-C/X-SAR data, complemented by aircraft and ground studies, will give scientists clearer insights into those environmental changes which are caused by nature and those changes which are induced by human activity. SIR-C was develpoed by NASA's Jet Propulsion Laboratory (JPL). X-SAR was developed by the Dornire and Alenia Spazio Companies for the German Space Agency, Deutsche Agentur fuer Raumfahrtangelegenheiten (DARA), and the Italian Space Agency, Agenzia Spaziale Italiana (ASI). JPL Photo ID: P-43883
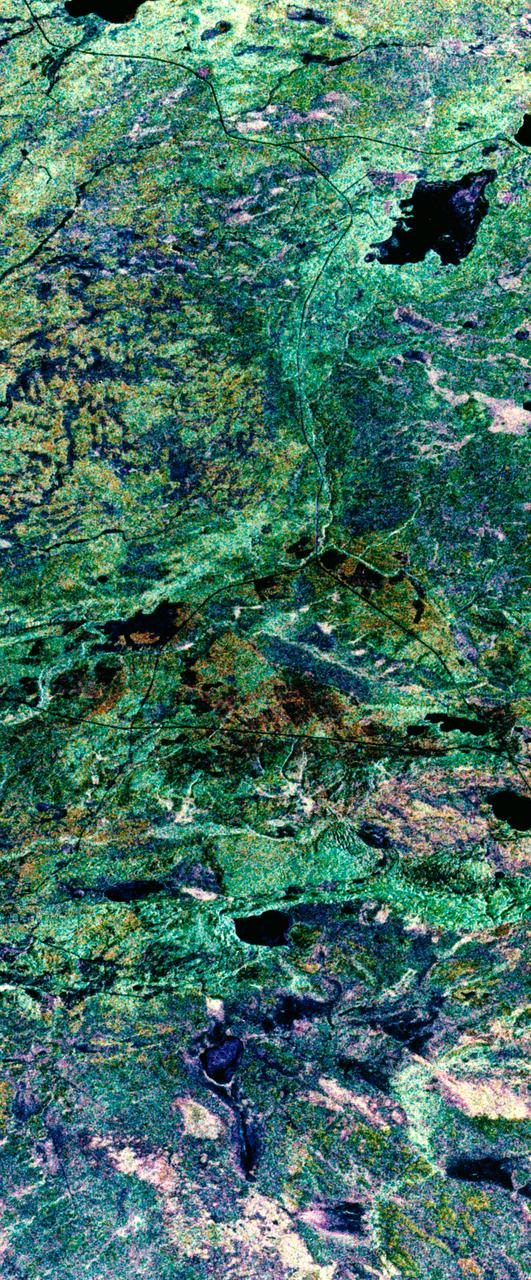
STS059-S-039 (11 April 1994) --- This is a false-color composite of Prince Albert, Canada, centered at 53.91 north latitude and 104.69 west longitude. This image was acquired by the Spaceborne Imaging Radar-C and X-Band Synthetic Aperture Radar (SIR-C/X-SAR) aboard the Space Shuttle Endeavour on its 20th orbit. The area is located 40 kilometers (25 miles) north and 30 kilometers (20 miles) east of the town of Prince Albert in the Saskatchewan province of Canada. The image covers the area east of the Candle Lake, between gravel surface Highways 120 and 106 and west of 106. The area in the middle of the image covers the entire Nipawin (Narrow Hills) provincial park. The look angle of the radar is 30 degrees and the size of the image is approximately 20 kilometers by 50 kilometers (12 by 30 miles). The image was produced by using only the L-Band. The three polarization channels HH, HV and VV are illustrated by red, green and blue respectively. The changes in the intensity of each color are related to various surface conditions such as variations in forest stands, frozen or thawed condition of the surface, disturbances (fire and deforestation), and areas of re-growth. Most of the dark areas in the image are the ice-covered lakes in the region. The dark area on the top right corner of the image is the White Gull Lake north of the intersection of Highway 120 and 913. The right middle part of the image shows Lake Ispuchaw and Lower Fishing Lake. The deforested areas are also shown by dark areas in the image. Since most of the logging practice at the Prince Albert area is around the major highways, the deforested areas can be easily detected as small geometrically shaped dark regions along the roads. At the time of the SIR-C/X-SAR overpass, a major part of the forest is either frozen or undergoing the spring thaw. The L-Band HH shows a high return in the jack pine forest. The reddish areas in the image are old jack pine forest, 12-17 meters (40-55 feet) in height and 60-75 years old. The orange-greenish areas are young jack pine trees, 3-5 meters (10-16 feet) in height and 11-16 years old. The green areas are due to the relative high intensity of the HV channel which is strongly correlated with the amount of biomass. L-Band HV channel shows the biomass variations over the entire region. Most of the green areas, when compared to the forest cover maps are identified as black spruce trees. The dark blue and dark purple colors show recently harvested or re-growth areas respectively. SIR-C/X-SAR is part of NASA's Mission to Planet Earth (MTPE). SIR-C/X-SAR radars illuminate Earth with microwaves allowing detailed observations at any time, regardless of weather or sunlight conditions. SIR-C/X-SAR uses three microwave wavelengths: L-Band (24 cm), C-Band (6 cm), and X-Band (3 cm). The multi-frequency data will be used by the international scientific community to better understand the global environment and how it is changing. The SIR-C/X-SAR data, complemented by aircraft and ground studies, will give scientists clearer insights into those environmental changes which are caused by nature and those changes which are induced by human activity. SIR-C was developed by NASA's Jet Propulsion Laboratory (JPL). X-SAR was developed by the Dornire and Alenia Spazio Companies for the German Space Agency, Deutsche Agentur fuer Raumfahrtangelegenheiten (DARA), and the Italian Space Agency, Agenzia Spaziale Italiana (ASI). JPL Photo ID: P-43886
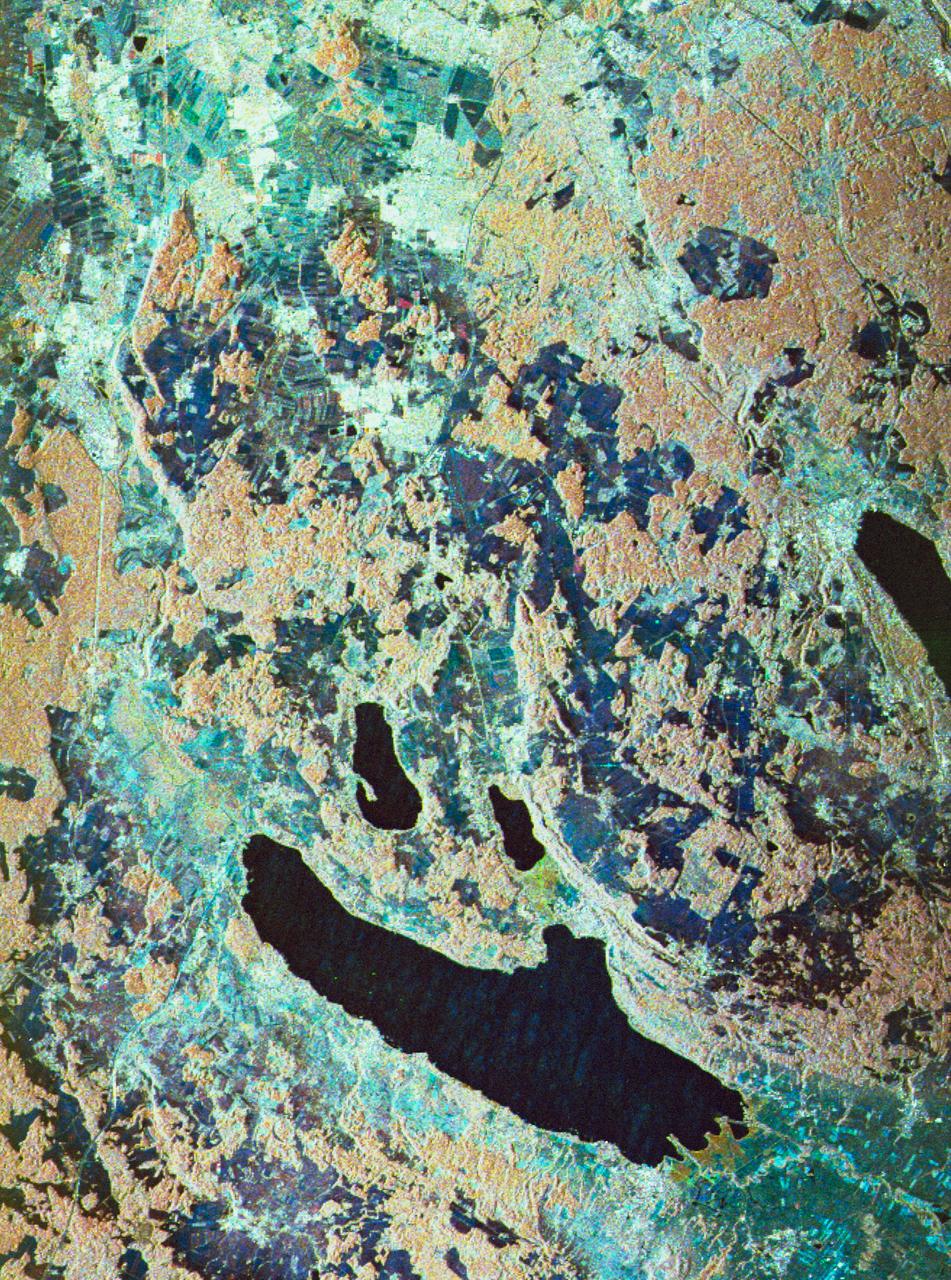
STS059-S-080 (18 April 1994) --- This is a false-color three frequency image of the Oberpfaffenhofen supersite, an area just south-west of Munich in southern Germany. The colors show the different conditions that the three radars (X-Band, C-Band and L-Band) can see on the ground. The image covers a 27 by 36 kilometer area. The center of the site is 48.09 degrees north and 11.29 degrees east. The image was acquired by the Spaceborne Imaging Radar-C and X-Band Synthetic Aperture Radar (SIR-C/X-SAR) onboard the Space Shuttle Endeavour on April 11, 1994. The dark area on the left is Lake Ammersee. The two smaller lakes are the Woerthsee and the Pilsensee. On the bottom is the tip of the Starnbergersee. The city of Munich is located just beyond the right of the image. The Oberpfaffenhofen supersite is the major test site for SIR-C/X-SAR calibration and scientific investigations concerning agriculture, forestry, hydrology and geology. This color composite image is a three frequency overlay. L-Band total power was assigned red, the C-Band total power is shown in green and the X-Band VV polarization appears blue. The colors on the image stress the differences between the L-Band, C-Band, X-Band images. If the three radar antennas were getting an equal response from objects on the ground, this image would appear in black and white. However, in this image, the blue areas corresponds to area for which the X-Band backscatter is relatively higher than the backscatter at L and C-Bands. This behavior is characteristic of grasslands, clear cuts and shorter vegetation. Similarly, the forested areas have a reddish tint (L-Band). The green areas seen near both the Ammersee and the Pilsensee lakes indicate marshy areas. The agricultural fields in the upper right hand corner appear mostly in blue and green (X-Band and C-Band). The white areas are mostly urban areas, while the smooth surfaces of the lakes appear very dark. SIR-C/X-SAR is part of NASA's Mission to Planet Earth (MTPE). SIR-C/X-SAR radars illuminate Earth with microwaves allowing detailed observations at any time, regardless of weather or sunlight conditions. SIR-C/X-SAR uses three microwave wavelengths: L-Band (24 cm), C-Band (6 cm), and X-Band (3 cm). The multi-frequency data will be used by the international scientific community to better understand the global environment and how it is changing. The SIR-C/X-SAR data, complemented by aircraft and ground studies, will give scientists clearer insights into those environmental changes which are caused by nature and those changes which are induced by human activity. SIR-C was developed by NASA's Jet Propulsion Laboratory (JPL). X-SAR was developed by the Dornire and Alenia Spazio Companies for the German Space Agency, Deutsche Agentur fuer Raumfahrtangelegenheiten (DARA), and the Italian Space Agency, Agenzia Spaziale Italiana (ASI). JPL Photo ID: P-43930
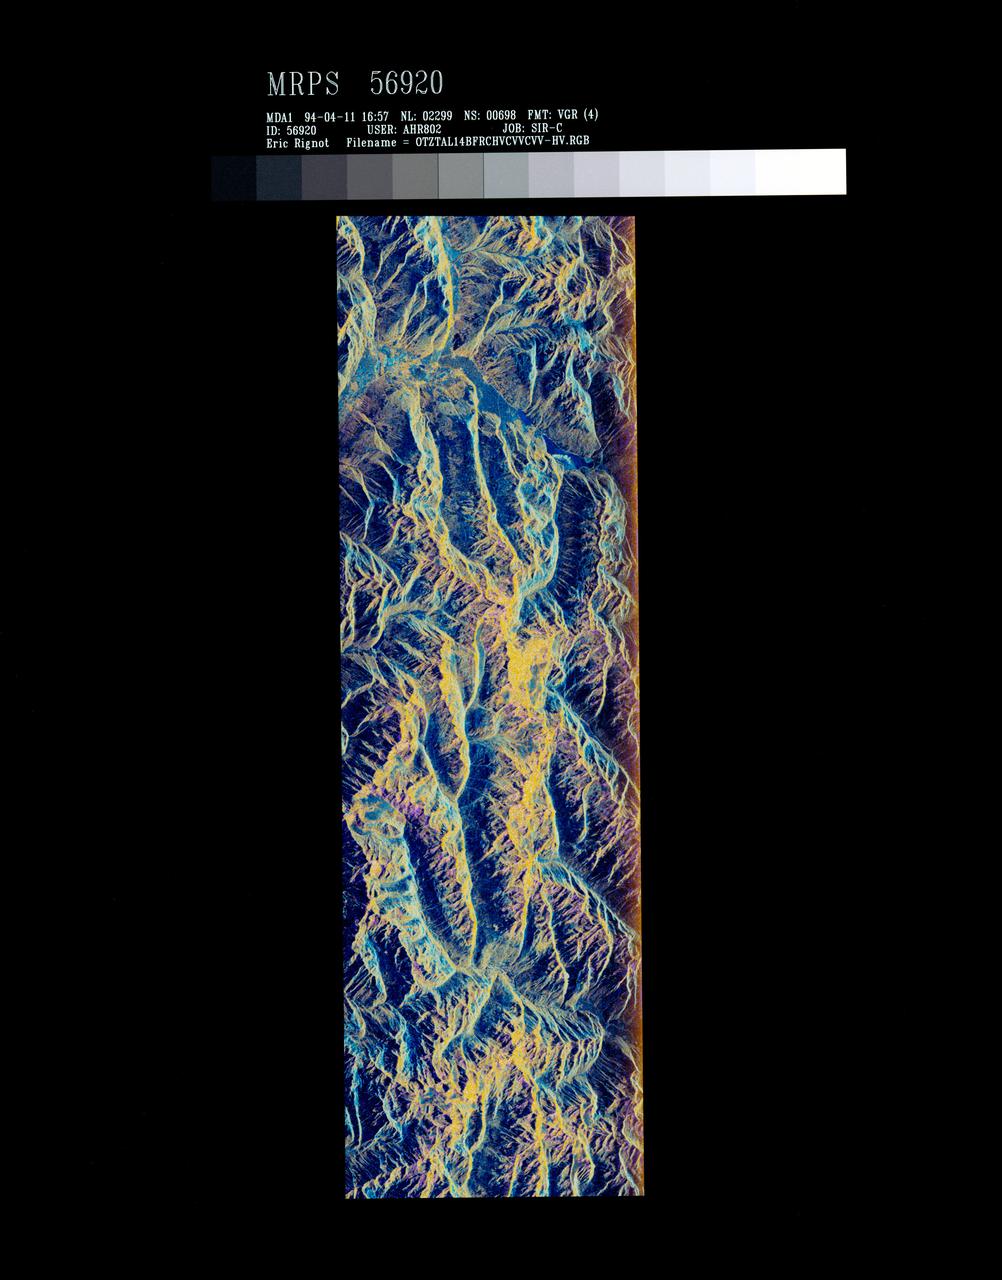
STS059-S-072 (13 April 1994) --- This image is a false-color composite of Oetztal, Austria located in the Central Alps, centered at 46.8 degrees north latitude, and 10.70 degrees east longitude, at the border between Switzerland (top), Italy (left) and Austria (right and bottom). The area shown is 50 kilometers (30 miles) south of Innsbruck, Austria. This image was acquired by the Spaceborne Imaging Radar-C and X-Band Synthetic Aperture Radar (SIR-C/X-SAR) aboard the Space Shuttle Endeavour on its 14th orbit. Oetztal is a SIR-C/X-SAR hydrology supersite. Approximately one quarter of this image is covered by glaciers, the largest of which, Gepatschferner, is visible as a triangular yellow patch in the center of the scene. The summits of the main peaks reach elevations between 3,500 and 3,768 meters (11,500 and 12,362 feet) above sea level. The tongues of the glaciers are descending from elevated plateaus down into narrow valleys which were formed during the last ice age. This color image was produced in C-Band using multi-polarization information (Red=CHV, Green=CVV, Blue=CVV/CHV). The blue areas are lakes (Gepatsch Dam at center right; Lake Muta at top right) and glacier ice. The yellow areas are slopes facing the radar and areas of dry snow. Purple corresponds to slopes facing away from the radar. Yellow in the valley bottom corresponds to tree covered areas. There is 30 to 50 centimeters (12 to 20 inches) of dry, fresh snow on the glaciers, and about 10 centimeters (4 inches) in the valley at the city of Vent, Austria (center). At these data were taken, the weather was cold, with snow and thick fog. The entire area would appear white to an optical sensor because it is all covered under a winter snowpack. Researchers are interested in Oetztal because knowing how glaciers shrink and grow over time is an important indication of climatic change. SIR-C/X-SAR is part of NASA's Mission to Planet Earth (MTPE). SIR-C/X-SAR radars illuminate Earth with microwaves allowing detailed observations at any time, regardless of weather or sunlight conditions. SIR-C/X-SAR uses three microwave wavelengths: L-Band (24 cm), C-Band (6 cm), and X-Band (3 cm). The multi-frequency data will be used by the international scientific community to better understand the global environment and how it is changing. The SIR-C/X-SAR data, complemented by aircraft and ground studies, will give scientists clearer insights into those environmental changes which are caused by nature and those changes which are induced by human activity. SIR-C was developed by NASA's Jet Propulsion Laboratory (JPL). X-SAR was developed by the Dornire and Alenia Spazio Companies for the German Space Agency, Deutsche Agentur fuer Raumfahrtangelegenheiten (DARA), and the Italian Space Agency, Agenzia Spaziale Italiana (ASI). JPL Photo ID: P-43890
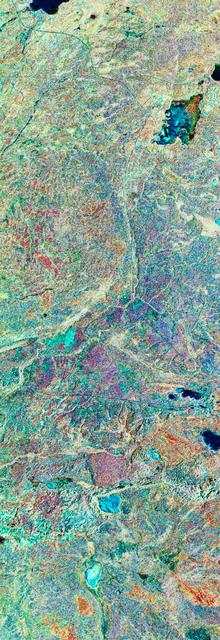
STS059-S-079 (18 April 1994) --- This is a false-color, three frequency image of Prince Albert, Canada, centered at 53.91 north latitude and 104.69 west longitude. It was produced using data from the X-Band, C-Band and L-Band radars that comprise the Spaceborne Imaging Radar-C and X-Band Synthetic Aperture Radar (SIR-C/X-SAR). SIR-C/X-SAR acquired this image on the 20th orbit of the Space Shuttle Endeavour. The area is located 40 kilometers north and 30 kilometers east of the town of Prince Albert in the Saskatchewan province of Canada. The image covers the area east of the Candle Lake, between gravel surface Highways 120 and 106 and west of 106. The area in the middle of the image covers the entire Nipawin (Narrow Hills) provincial park. The look angle of the radar is 30 degrees and the size of the image is approximately 20 by 50 kilometers. The red, green, and blue colors represent L-Band total power, C-Band total power, and XVV respectively. The changes in the intensity of each color are related to various surface conditions such as frozen or thawed forest, fire, deforestation and areas of regrowth. Most of the dark blue areas in the image are the ice covered lakes. The dark area on the top right corner of the image is the White Gull Lake north of the intersection of Highway 120 and 913. The right middle part of the image shows Lake Ispuchaw and Lower Fishing Lake. The deforested areas are shown by light blue in the image. Since most of the logging practice at the Prince Albert area is around the major highways, the deforested areas can be easily detected as small geometrically shaped dark regions along the roads. At the time these data were taken, a major part of the forest was either frozen or undergoing the spring thaw. In such conditions, due to low volume of water in the vegetation, a deeper layer of the canopy is imaged by the radar, revealing valuable information about the type of trees, the amount of vegetation biomass and the condition of the surface. As the frequency increases, the penetration depth in the canopy decreases. Over forest canopies, the X-Band radar contains information about the top of the canopy. Whereas, C-Band and L-Band radar returns show contributions from the crown and trunk areas respectively. The bright areas in the image are dense mixed aspen and old jackpine forests where the return from all three bands is high. The reddish area corresponds to more sparse old jack pine (12 to 17 meters in height and 60 to 75 years old) where the L-Band signal penetrates deeper in the canopy and dominates C-Band and X-Band returns. Comparison of the image with the forest cover map of the area indicates that the three band radar can be used to classify various stands. SIR-C/X-SAR is part of NASA's Mission to Planet Earth (MTPE). SIR-C/X-SAR radars illuminate Earth with microwaves allowing detailed observations at any time, regardless of weather or sunlight conditions. SIR-C/X-SAR uses three microwave wavelengths: L-Band (24 cm), C-Band (6 cm), and X-Band (3 cm). The multi-frequency data will be used by the international scientific community to better understand the global environment and how it is changing. The SIR-C/X-SAR data, complemented by aircraft and ground studies, will give scientists clearer insights into those environmental changes which are caused by nature and those changes which are induced by human activity. SIR-C was developed by NASA's Jet Propulsion Laboratory (JPL). X-SAR was developed by the Dornire and Alenia Spazio Companies for the German Space Agency, Deutsche Agentur fuer Raumfahrtangelegenheiten (DARA), and the Italian Space Agency, Agenzia Spaziale Italiana (ASI). JPL Photo ID: P-43929