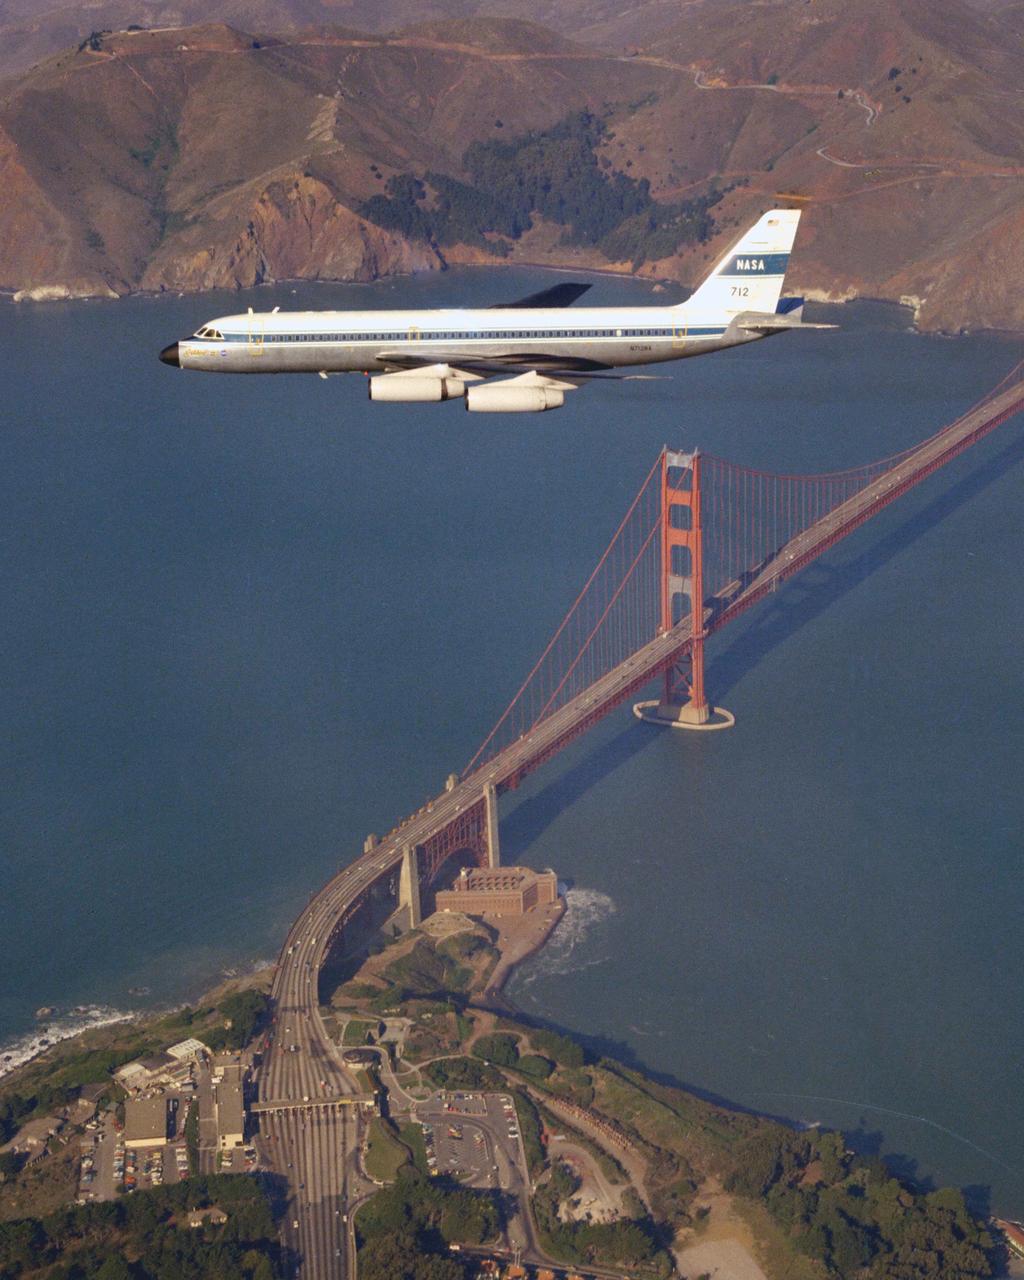
CV-990 (NASA-712) Galileo II aircraft in flight over the San Francisco's Golden Gate Bridge. A digital navigation, guidance and autopilot system tested on Galileo 1 and Galileo II in 1975 looked at the feasibility of energy-management approach concepts for an unpowered vehicle. Flight tests carried out by pilot Fred Drinkwater with technical direction by Fred Edwards and John D Foster along with significant input from Gordon Hardy on the pilot's system interface. Note: Used in publication in Flight Research at Ames; 57 Years of Development and Validation of Aeronautical Technology NASA SP-1998-3300 fig 95 ref 99
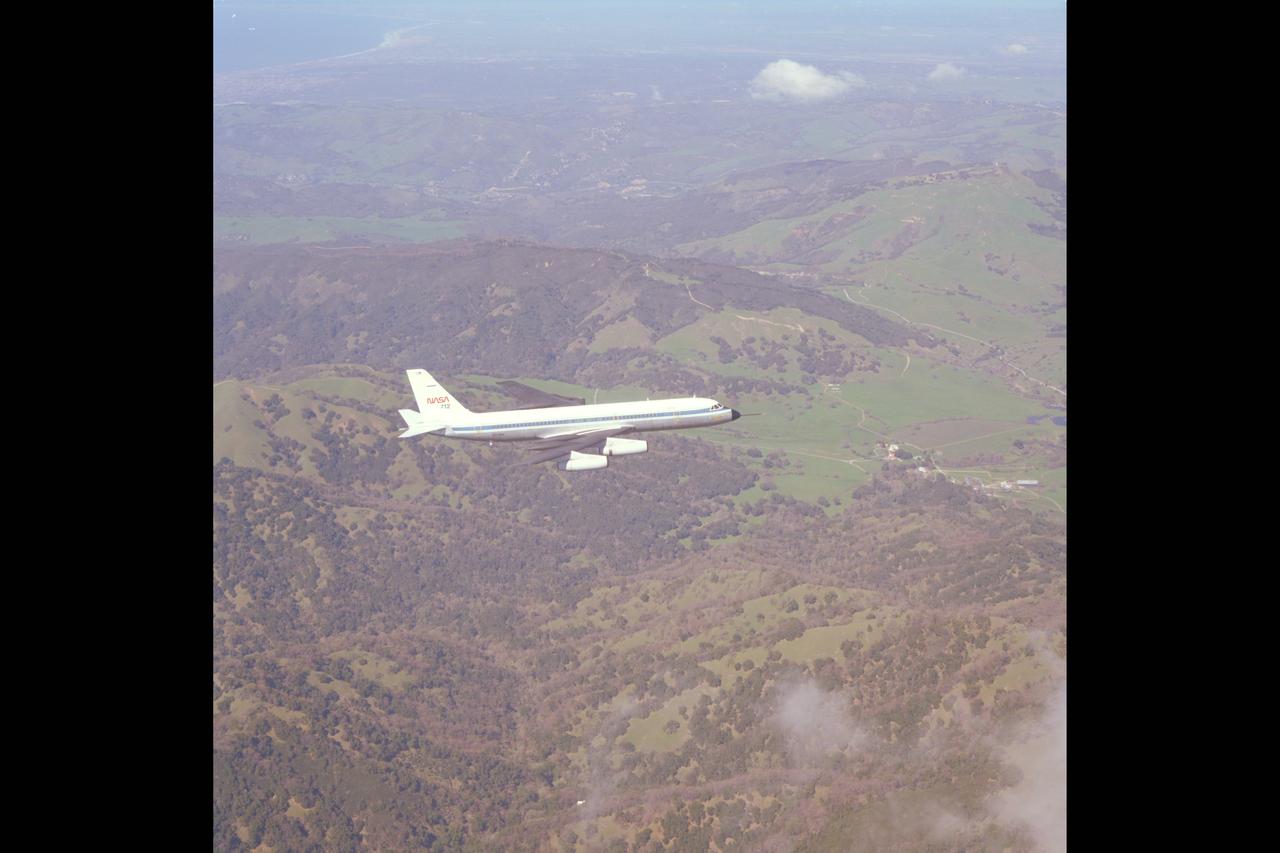
CV-990 (NASA-712) air to air view of flight up California coastline
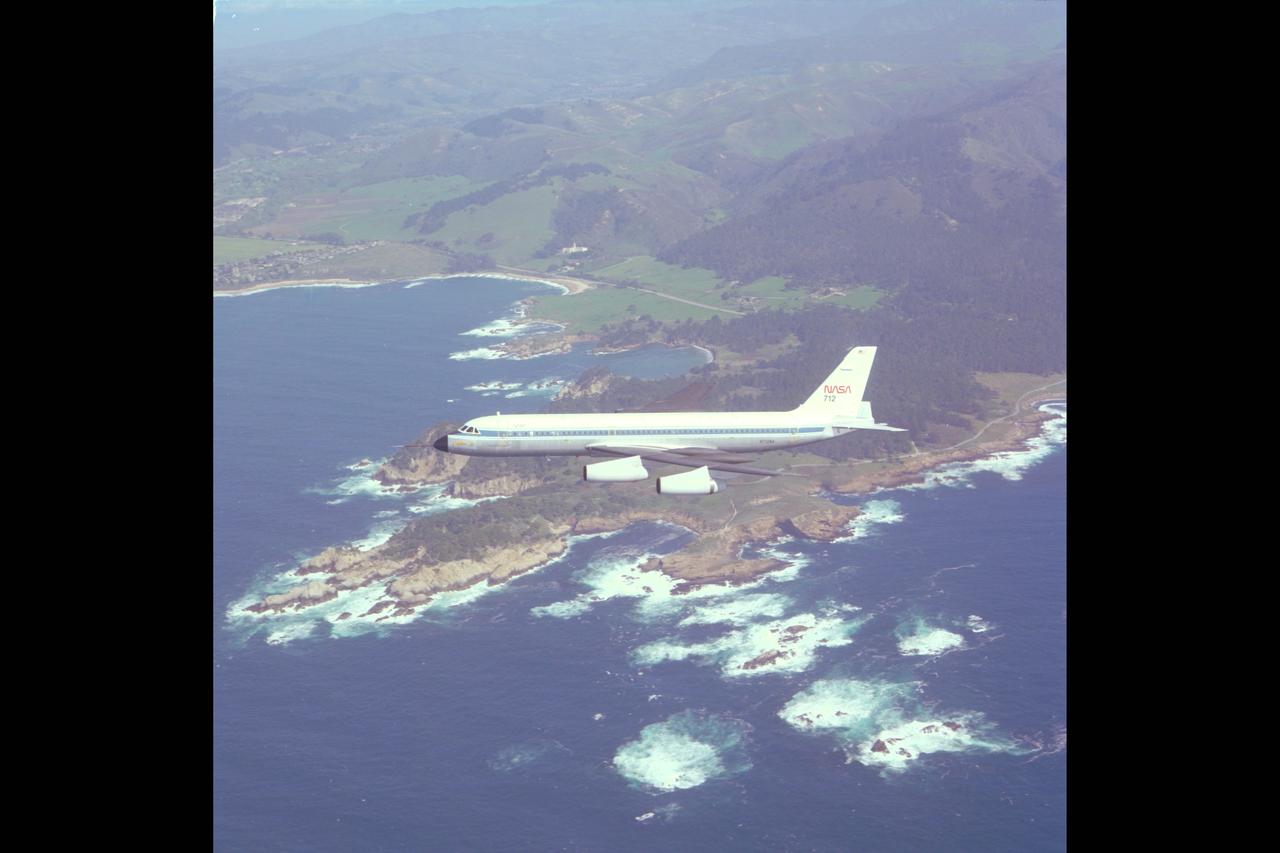
CV-990 (NASA-712) air to air view of flight up California coastline
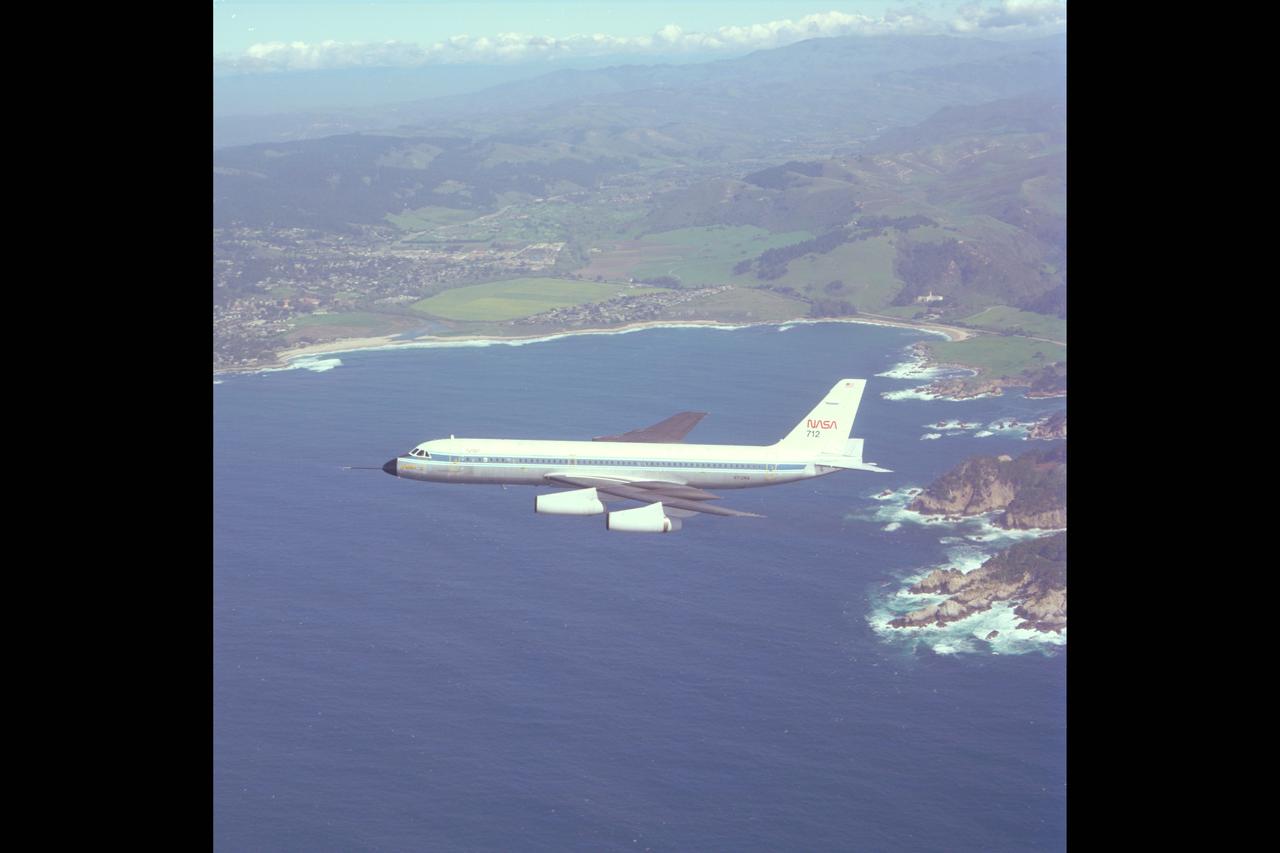
CV-990 (NASA-712) air to air view of flight up California coastline
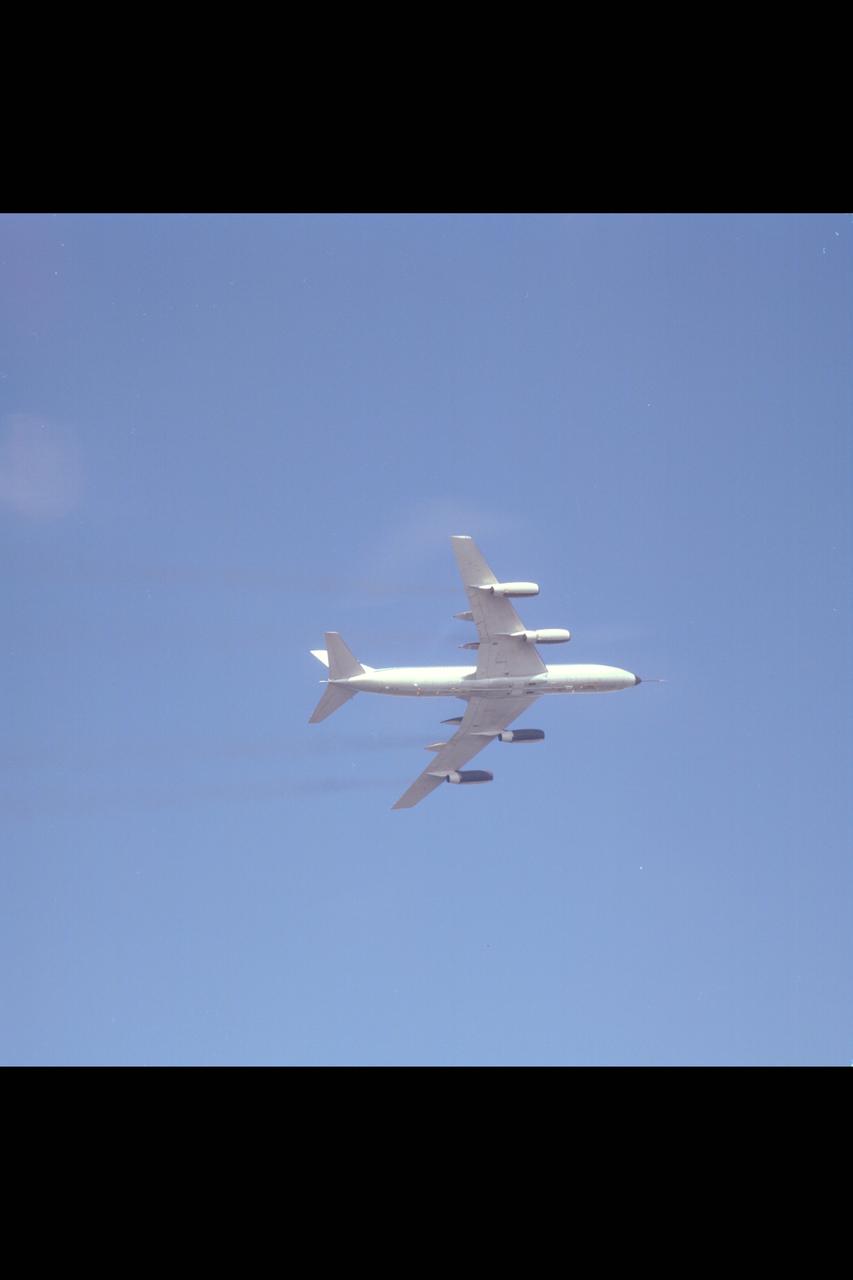
CV-990 (NASA-712) air to air view of underside of aircraft during banked turn during flight up California coastline
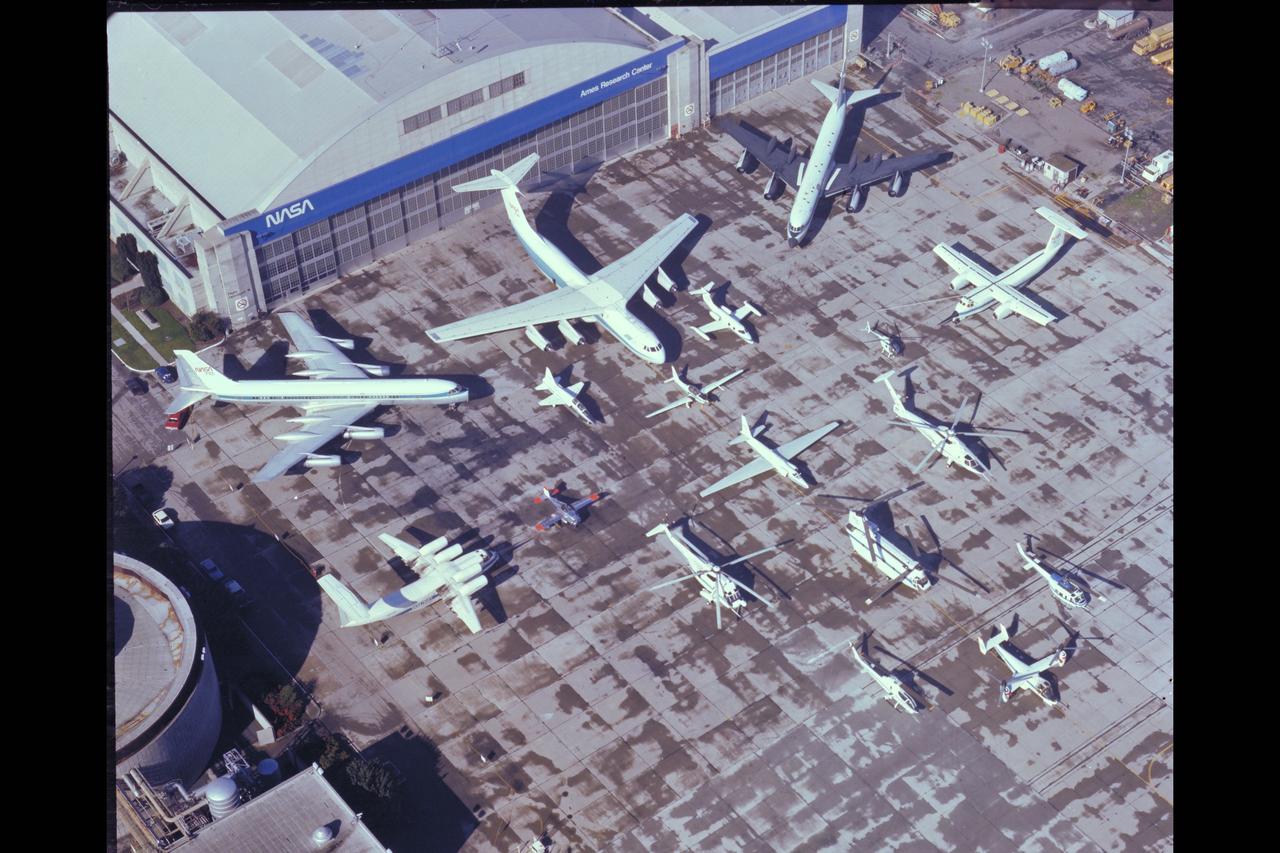
NASA Aircraft on ramp (Aerial view) Sides: (L) QSRA (R) C-8A AWJSRA - Back to Front: CV-990 (711) C-141 KAO, CV-990 (712) Galileo, T-38, YO-3A, Lear Jet, X-14, U-2, OH-6, CH-47, SH-3G, RSRA, AH-1G, XV-15, UH-1H
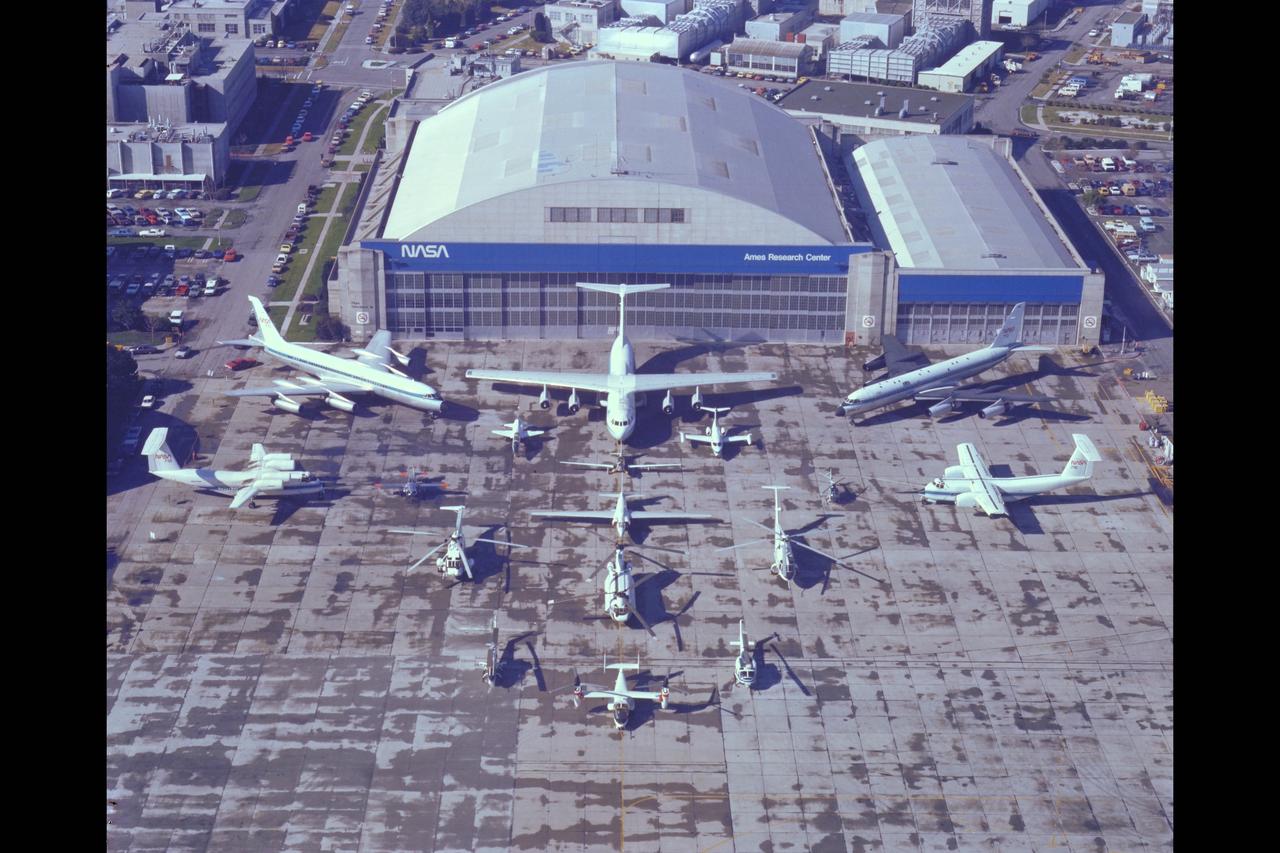
NASA Aircraft on ramp (Aerial view) Sides: (L) QSRA (R) C-8A AWJSRA - Back to Front: CV-990 (711) C-141 KAO, CV-990 (712) Galileo, T-38, YO-3A, Lear Jet, X-14, U-2, OH-6, CH-47, SH-3G, RSRA, AH-1G, XV-15, UH-1H
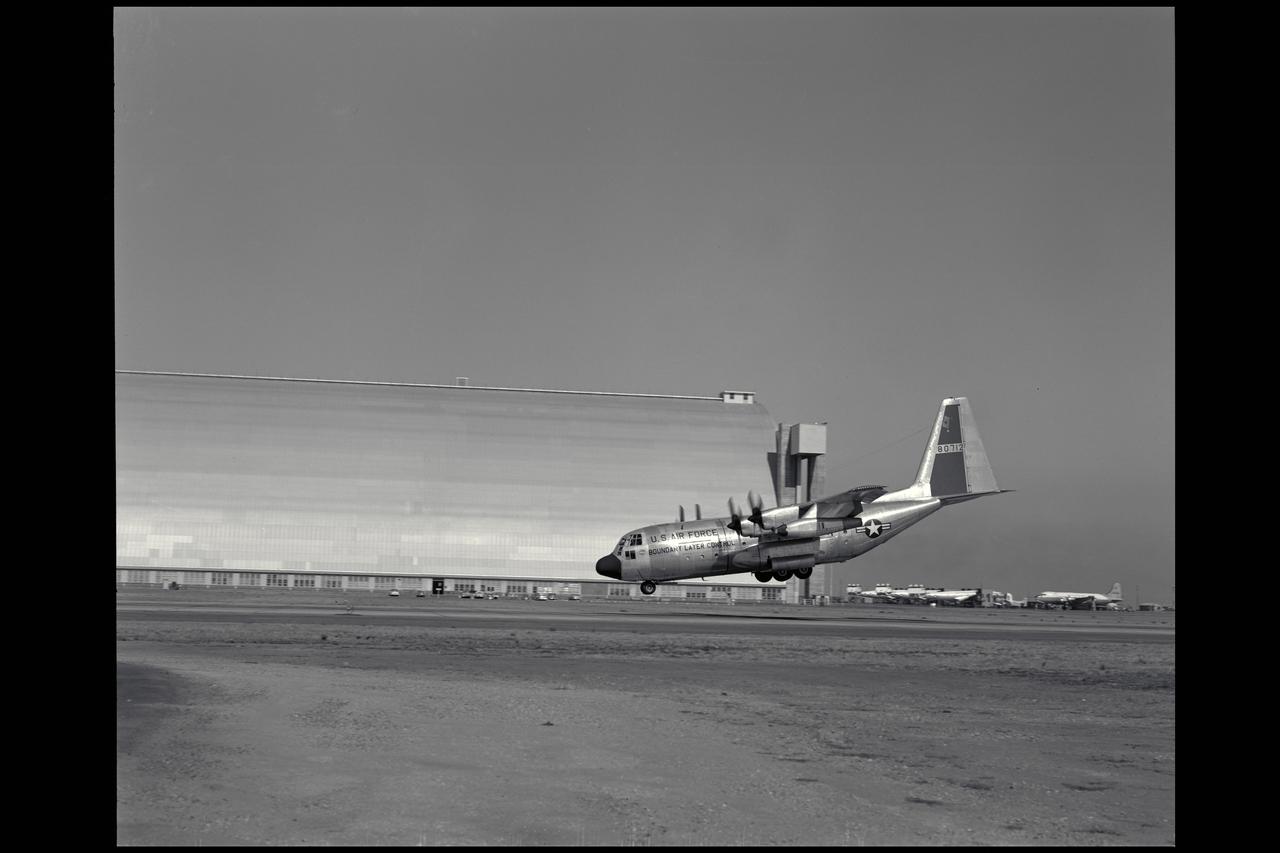
Lockheed NC-130B (AF58-712) Aircraft. A Study of STOL Operational Techniques; landing approach. Nose-low pitch attitude of the aircraft was required in wave-off (or go-around) at 85 knots with flaps 70 degrees. An increase in stall-speed margin could be required to produce a more positive climb angle. (Nov 1962) Note: Used in publication in Flight Research at Ames; 57 Years of Development and Validation of Aeronautical Technology NASA SP-1998-3300 fig. 104; 60yrs at Ames, Atmosphere of Freedom NASA SP-2000-4314
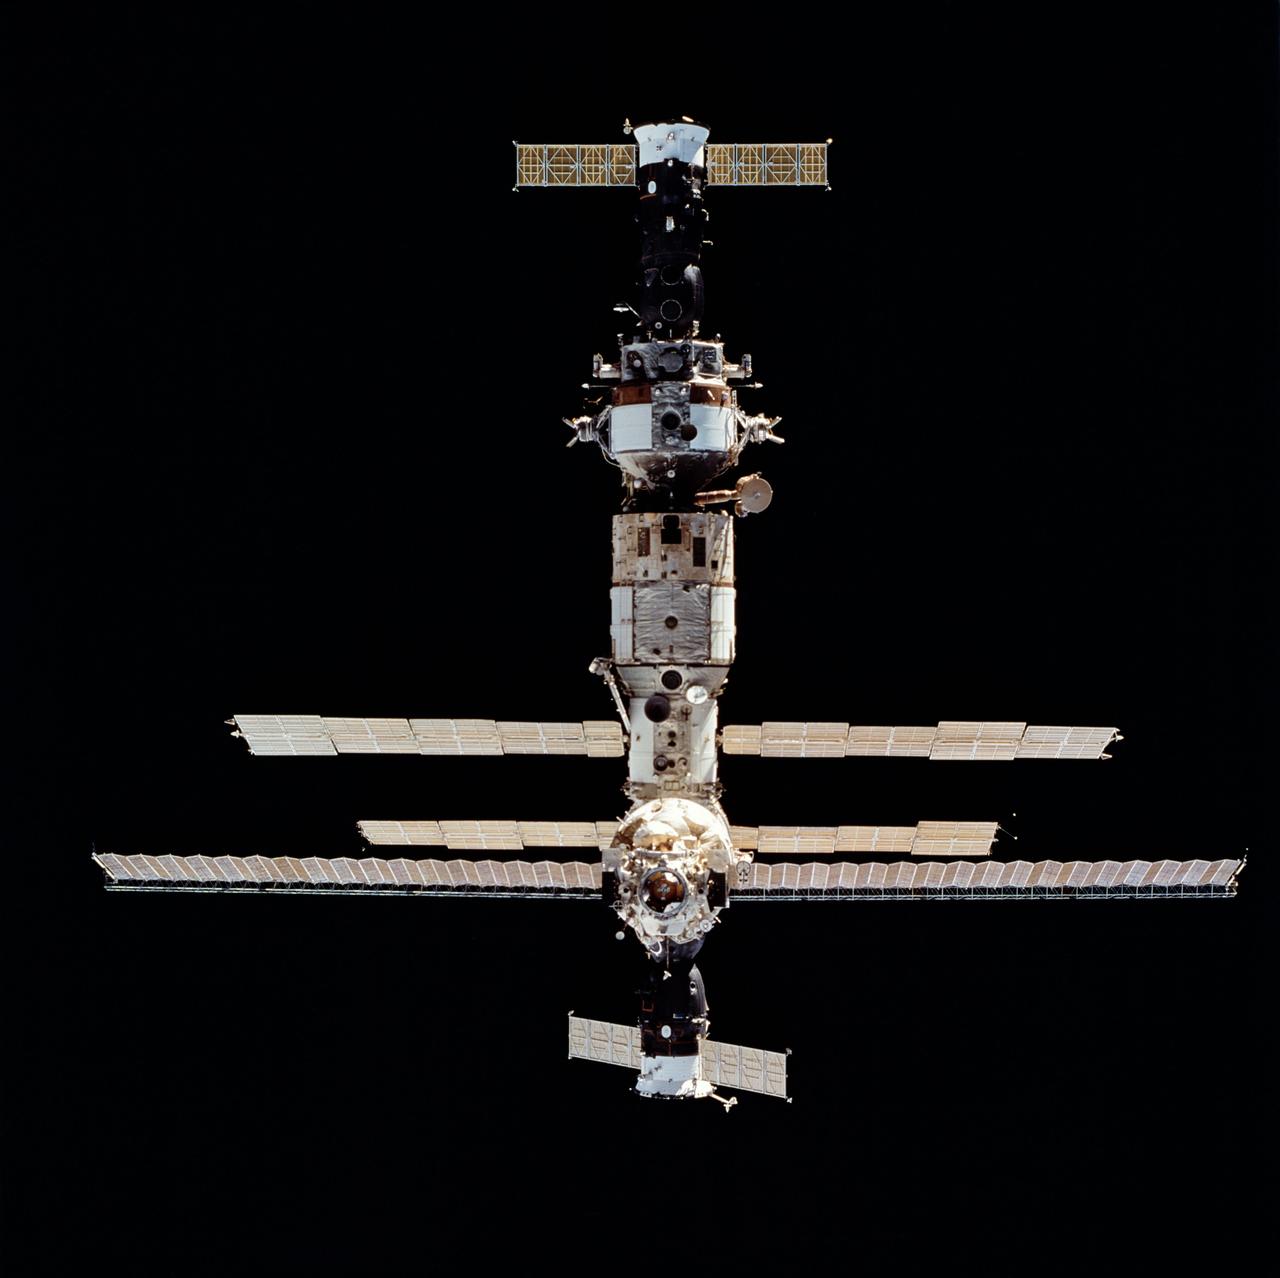
STS063-712-068 (6 Feb 1995) --- Russia's Mir Space Station during rendezvous operations with the Space Shuttle Discovery. Docked at bottom (nearest portion where longest solar array panel is visible) is a Soyuz space vehicle. On the opposite end is a Progress spacecraft. This is one of 16 still photographs released by the NASA Johnson Space Center (JSC) Public Affairs Office (PAO) on February 14, 1995. Onboard the Space Shuttle Discovery were astronauts James D. Wetherbee, mission commander; Eileen M. Collins, pilot; Bernard A. Harris, Jr., payload commander; mission specialists C. Michael Foale, Janice E. Voss, and cosmonaut Vladimir G. Titov.
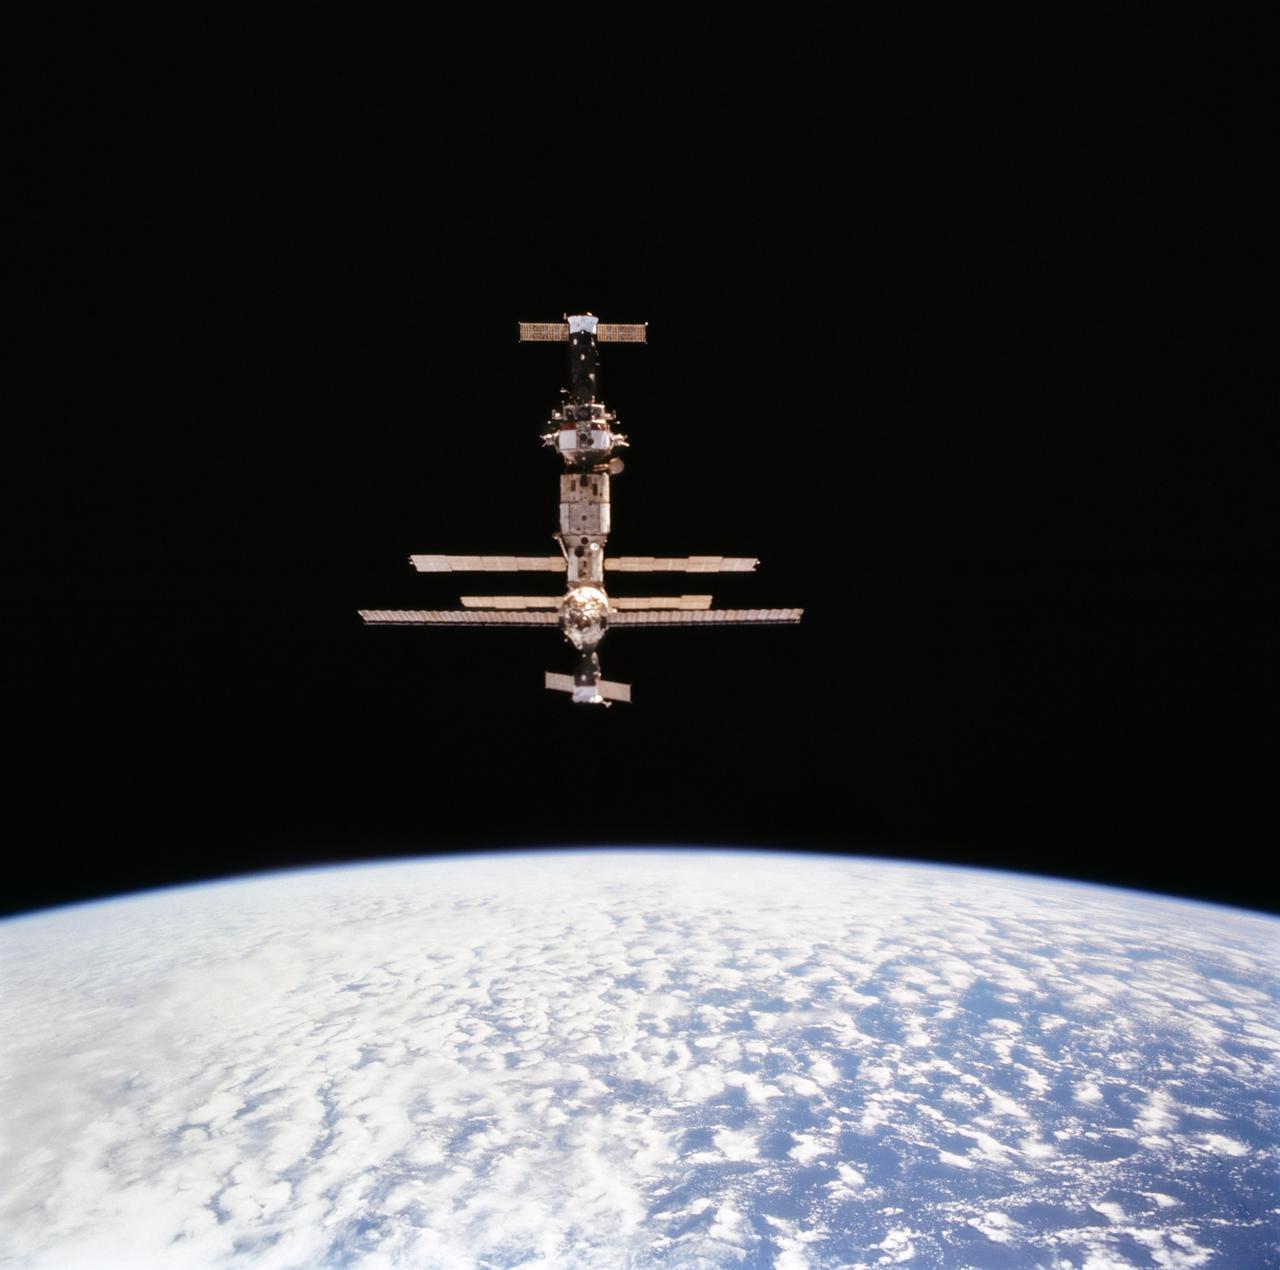
STS063-712-072 (6 Feb 1995) --- Russia's Mir Space Station over the blue and white Earth during initial approach for rendezvous operations with the Space Shuttle Discovery. Docked at bottom (nearest portion where longest solar array panel is visible) is a Soyuz space vehicle. On the opposite end is a Progress spacecraft. This is one of 16 still photographs released by the NASA Johnson Space Center (JSC) Public Affairs Office (PAO) on February 14, 1995. Onboard the Space Shuttle Discovery were astronauts James D. Wetherbee, mission commander; Eileen M. Collins, pilot; Bernard A. Harris Jr., payload commander; mission specialists C. Michael Foale, Janice E. Voss, and cosmonaut Vladimir G. Titov.
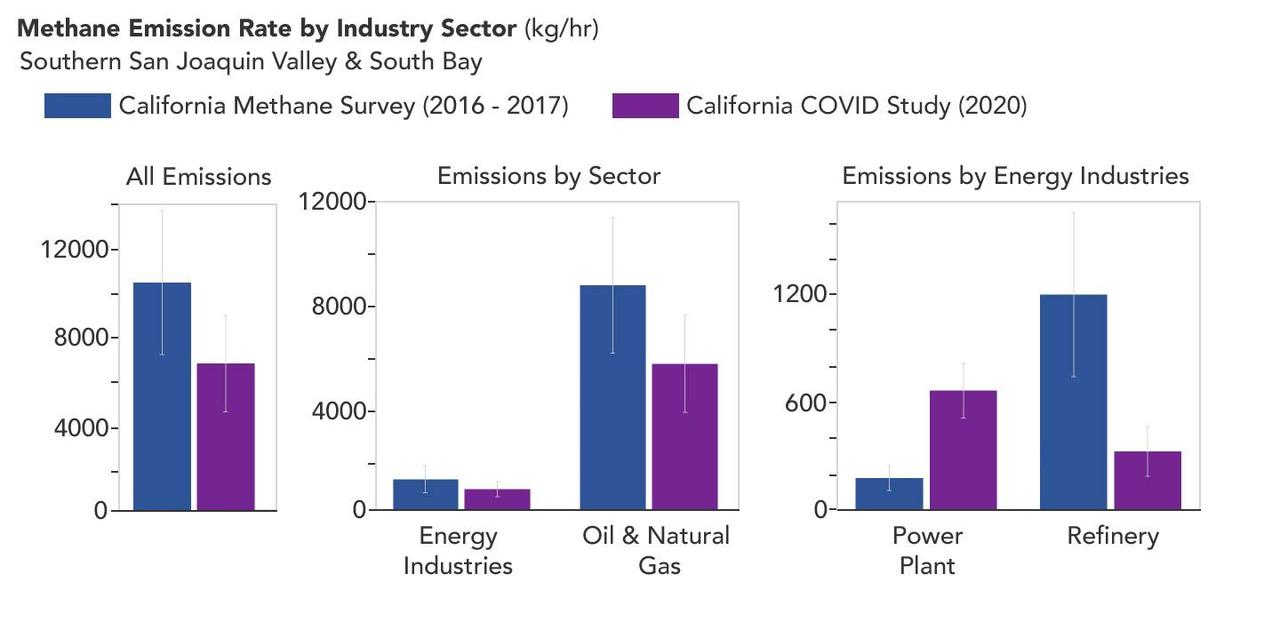
A March 2023 study by researchers at NASA's Jet Propulsion Laboratory in Southern California compared emissions from a belt of oil refineries across the South Bay area of Los Angeles during the first summer of the COVID-19 pandemic to those observed three years earlier. Using data from a NASA airborne instrument, researchers saw that most of the facilities they identified as methane sources in 2016-17 were no longer emitting the greenhouse gas in 2020, leading to a 73% reduction in measured emissions. The study uses measurements made by an imaging spectrometer called AVIRIS-NG (Airborne Visible/Infrared Imaging Spectrometer-Next Generation). Attached to the bottom of an aircraft, the instrument can detect greenhouse gas emissions from individual facilities or even pieces of equipment by looking at how the gases absorb sunlight. In 2016 and 2017, AVIRIS-NG was flown over 22,000 square miles (57,000 square kilometers) of the state as part of the California Methane Survey. From July to September 2020, researchers retraced some of those flight paths over refineries and power plants in Los Angeles County and over oil fields in central California's San Joaquin Valley. The flights were funded by NASA's Earth Science Division, the California Air Resources Board, and the California Energy Commission. The 2020 surveys over Los Angeles identified only 11 plumes from five refinery sources, with a total emissions rate of about 712 pounds (323 kilograms) methane per hour. The 2016 and 2017 flights had found 48 plumes from 33 sources, with a total emissions rate of roughly 2,639 pounds (1,197 kilograms) methane per hour. The drop correlates with an 18% decrease in monthly production in Southern California refineries between the two flight campaigns, the scientists noted, citing data from the California Energy Commission. The study also found that emissions from oil fields in and around the city of Bakersfield in central California fell 34.2%, correlating with a 24.2% drop in oil production. Reduced production during the pandemic due to lower demand for fuel and lower gas prices could have led to the drop in methane emissions, as oil fields and refineries emitted less methane as part of operations. However, researchers said, improved equipment maintenance and mitigation efforts at those facilities between 2016 and 2020 can't be ruled out as a factor. https://photojournal.jpl.nasa.gov/catalog/PIA25864