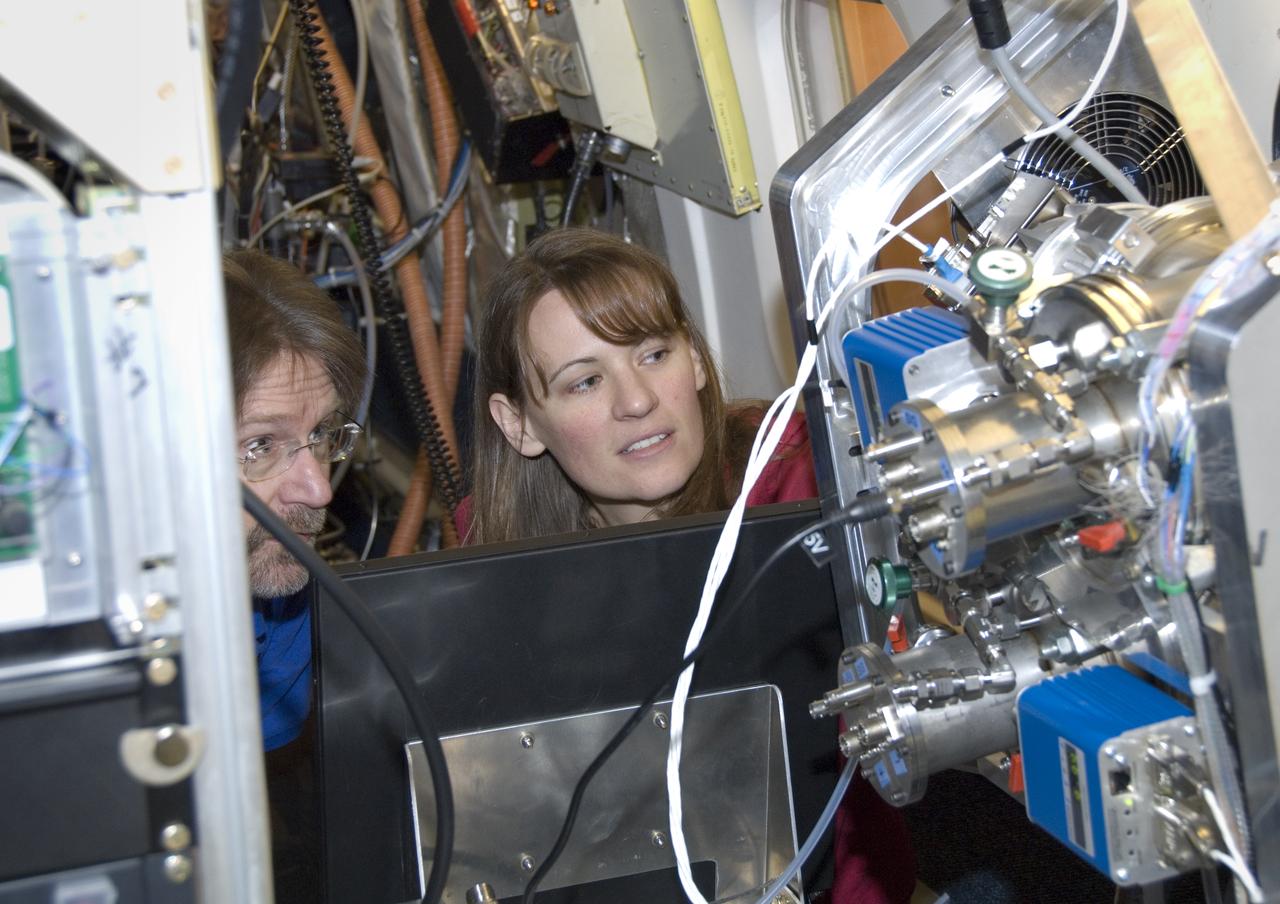
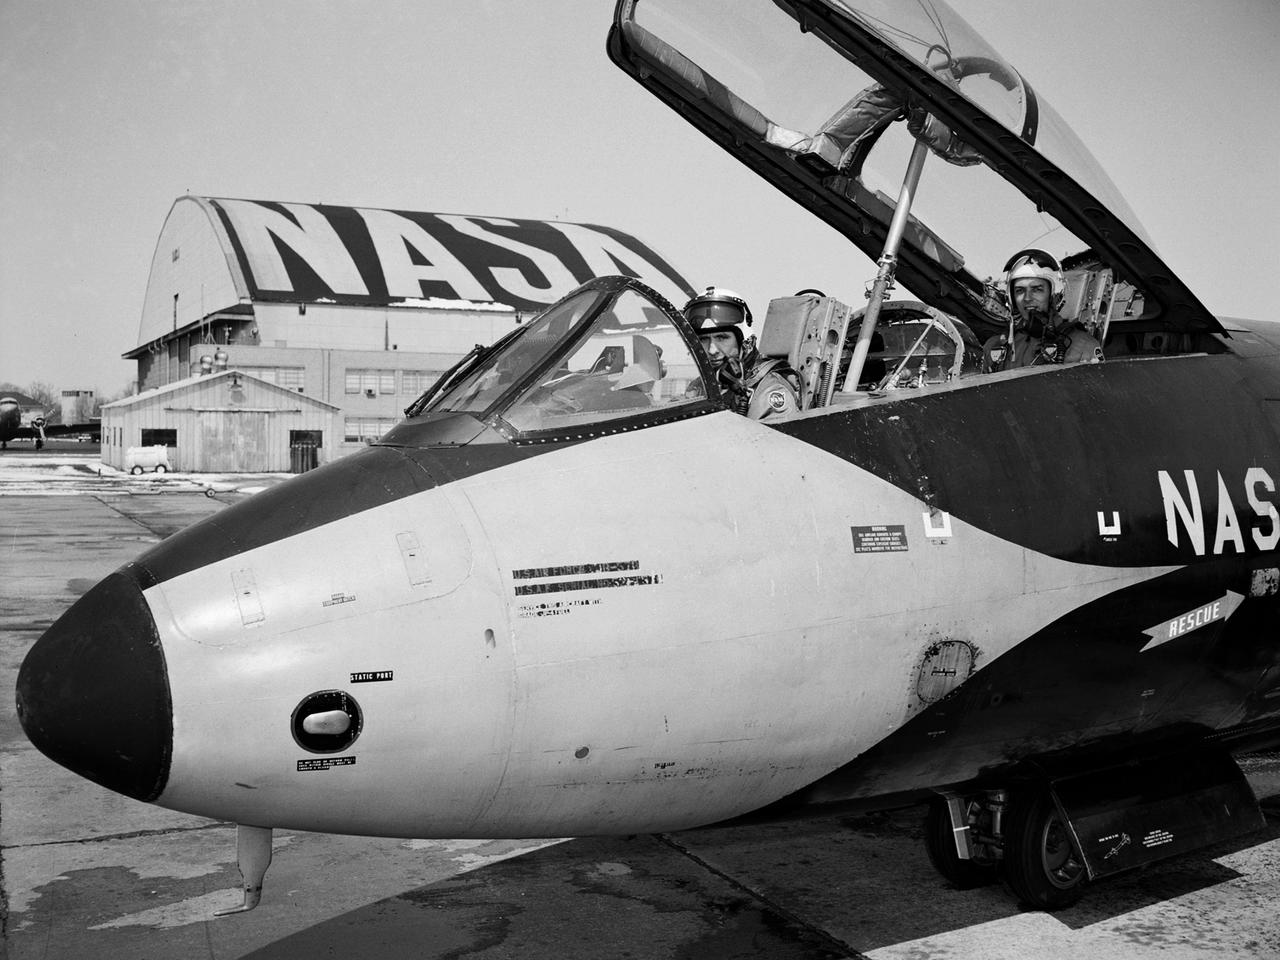
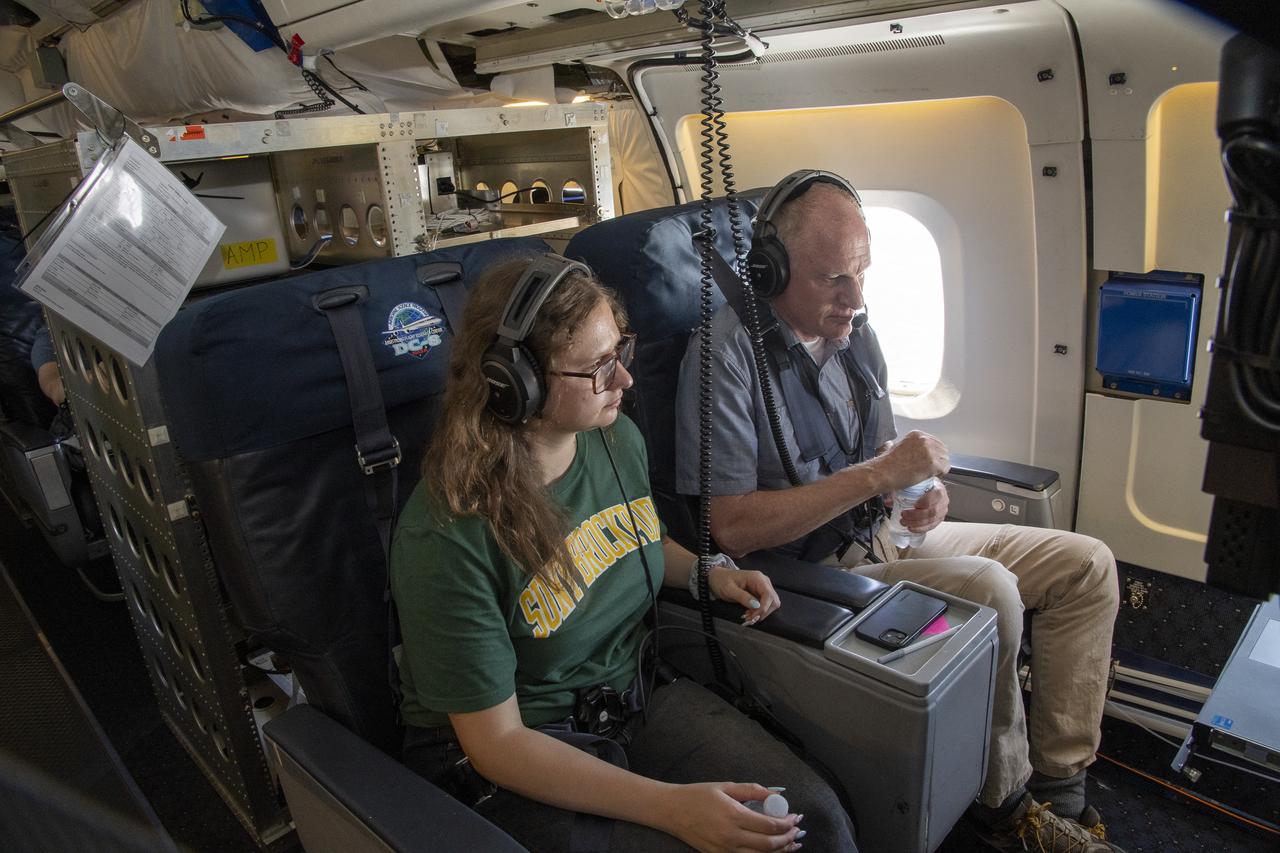
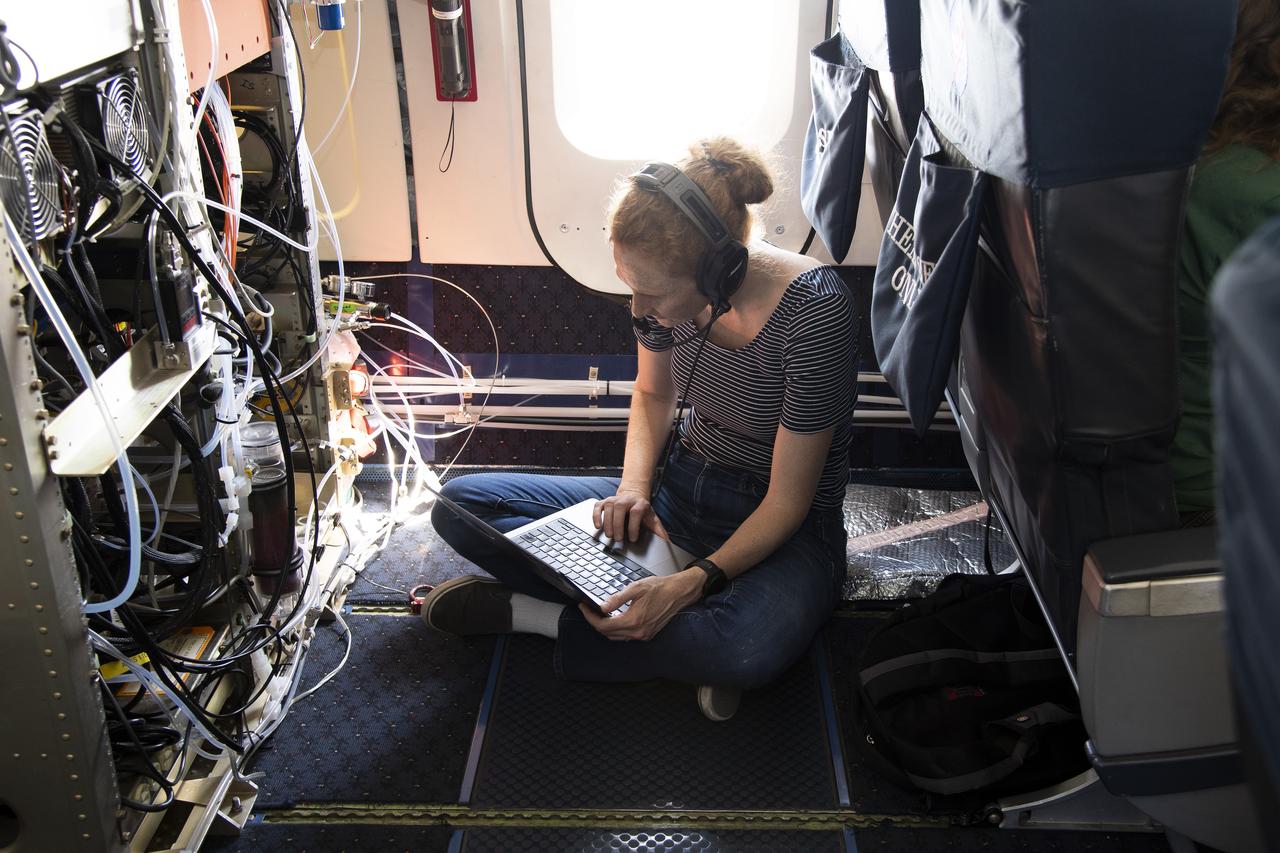
Climate researchers from the National Center for Atmospheric Research (NCAR) and several universities install and perform functional checkouts of a variety of sensitive atmospheric instruments on NASA's DC-8 airborne laboratory prior to beginning the ARCTAS mission.
Climate researchers from the National Center for Atmospheric Research (NCAR) and several universities install and perform functional checkouts of a variety of sensitive atmospheric instruments on NASA's DC-8 airborne laboratory prior to beginning the ARCTAS mission.
Climate researchers from the National Center for Atmospheric Research (NCAR) and several universities install and perform functional checkouts of a variety of sensitive atmospheric instruments on NASA's DC-8 airborne laboratory prior to beginning the ARCTAS mission.

Climate researchers from the National Center for Atmospheric Research (NCAR) and several universities install and perform functional checkouts of a variety of sensitive atmospheric instruments on NASA's DC-8 airborne laboratory prior to beginning the ARCTAS mission.
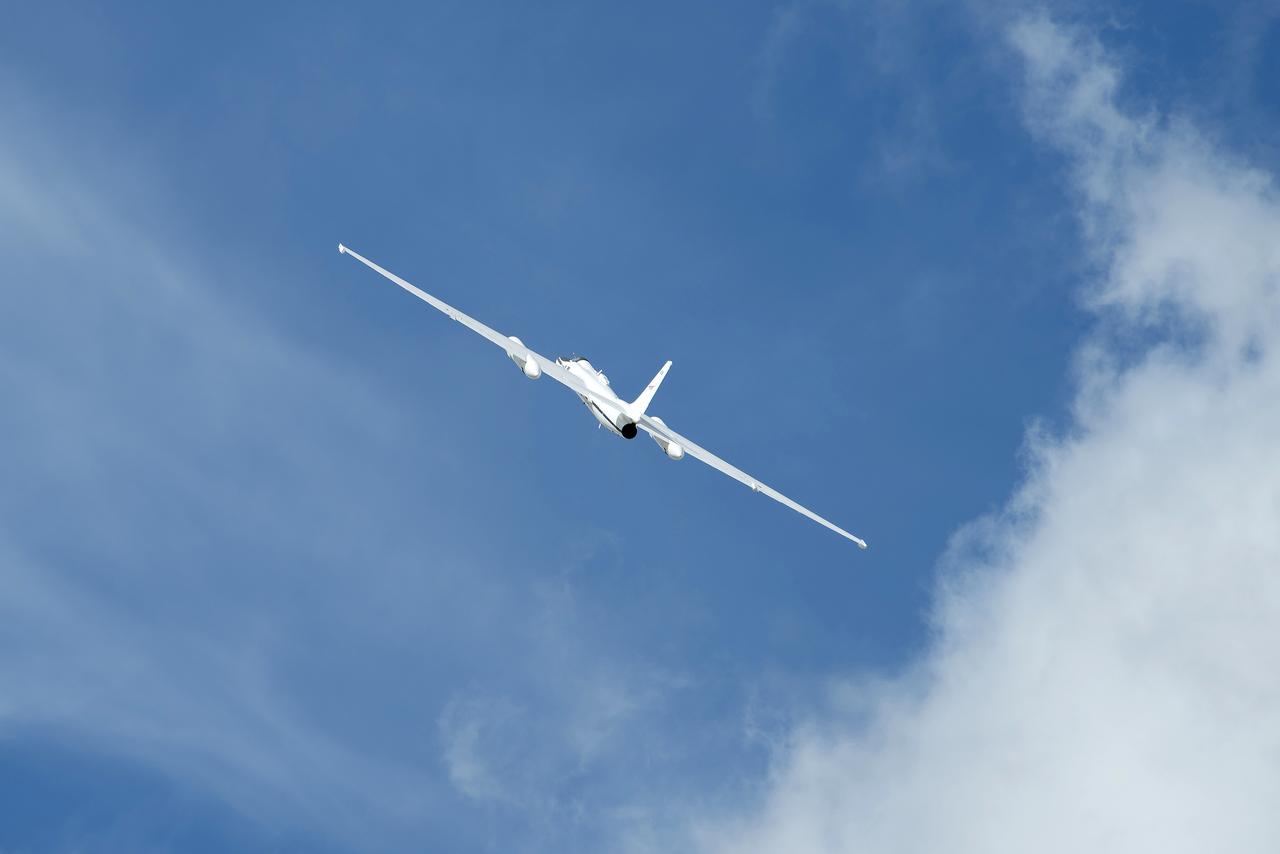
A NASA remotely piloted Global Hawk aircraft completes a flight in February 2015 to support the National Oceanic and Atmospheric Administration’s El Niño Rapid Response field campaign. The mission, called the Sensing Hazards Operational Unmanned Technology, gathered El Niño storm data over the Pacific Ocean. The flight originated from NASA’s Armstrong Flight Research Center in Edwards, California.
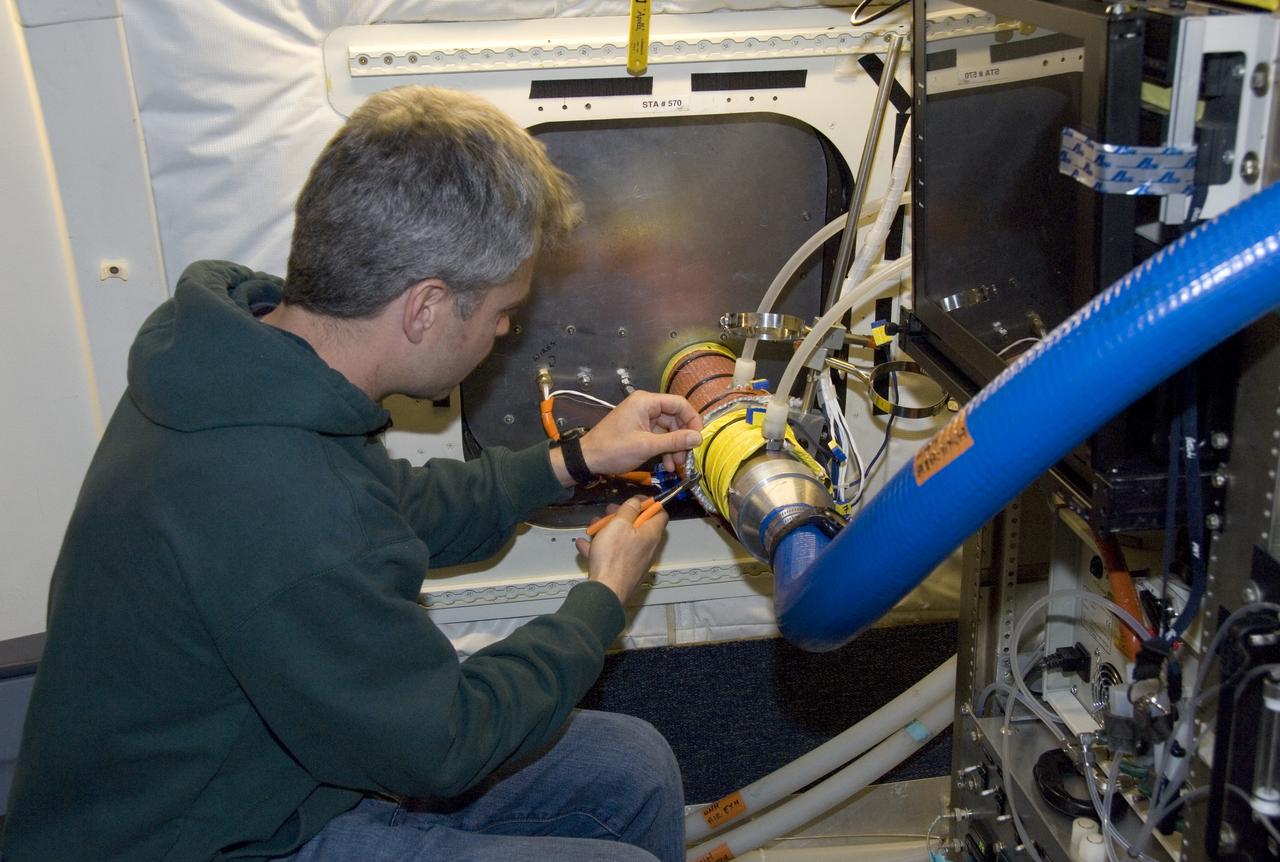
Climate researchers from the National Center for Atmospheric Research (NCAR) and several universities install and perform functional checkouts of a variety of sensitive atmospheric instruments on NASA's DC-8 airborne laboratory prior to beginning the ARCTAS mission.

Climate researchers from the National Center for Atmospheric Research (NCAR) and several universities install and perform functional checkouts of a variety of sensitive atmospheric instruments on NASA's DC-8 airborne laboratory prior to beginning the ARCTAS mission.
KENNEDY SPACE CENTER, FLA. - Justin Manley, of the National Oceanic and Atmospheric Administration, is a member of the research team conducting underwater acoustic research in the Launch Complex 39 turn basin near Launch Pad 39A. Several government agencies, including NASA, NOAA, the Navy, the Coast Guard, and the Florida Fish and Wildlife Commission are involved in the testing. The research involves demonstrations of passive and active sensor technologies, with applications in fields ranging from marine biological research to homeland security. The work is also serving as a pilot project to assess the cooperation between the agencies involved. Equipment under development includes a passive acoustic monitor developed by NASA’s Jet Propulsion Laboratory, and mobile robotic sensors from the Navy’s Mobile Diving and Salvage Unit.
A C-20 based at NASA’s Armstrong Flight Research Center in Edwards, California, departs to use its Uninhabited Aerial Vehicle Synthetic Aperture Radar to support the Marine Oil Spill Thickness mission. Thousands of gallons of oil seep through cracks in the ocean floor and rise to the surface just off the coast of Santa Barbara. It’s one of the largest naturally occurring oil seeps and serves as a laboratory for NASA and the National Oceanic and Atmospheric Administration to test automated oil spill detection, oil extent mapping, and oil thickness characterization.
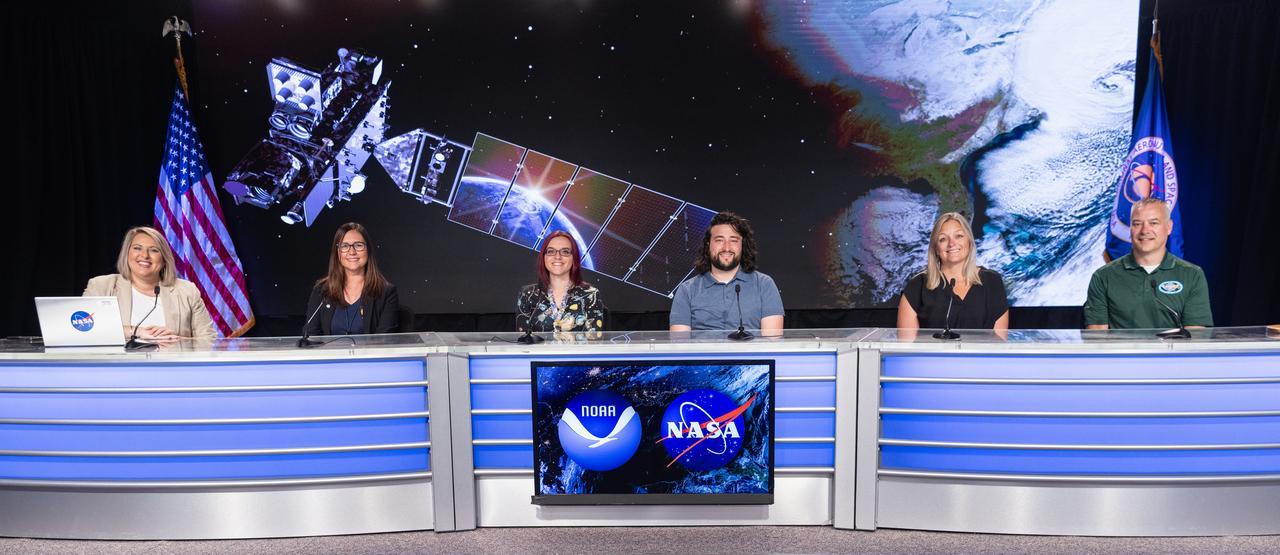
In the Kennedy Space Center's Press Site auditorium, Jim Roberts, a scientist with the Earth System Research Laboratory's Office of Atmospheric Research for NOAA, left, and Kristin Calhoun, a research scientist with NOAA's National Severe Storms Laboratory, speak to members of the media at a mission briefing on National Oceanic and Atmospheric Administration's, or NOAA's, Geostationary Operational Environmental Satellite, or GOES-S. The spacecraft is the second satellite in a series of next-generation NOAA weather satellites. It will launch to a geostationary position over the U.S. to provide images of storms and help predict weather forecasts, severe weather outlooks, watches, warnings, lightning conditions and longer-term forecasting. GOES-S is slated to lift off at 5:02 p.m. EST on March 1, 2018 aboard a United Launch Alliance Atlas V rocket.
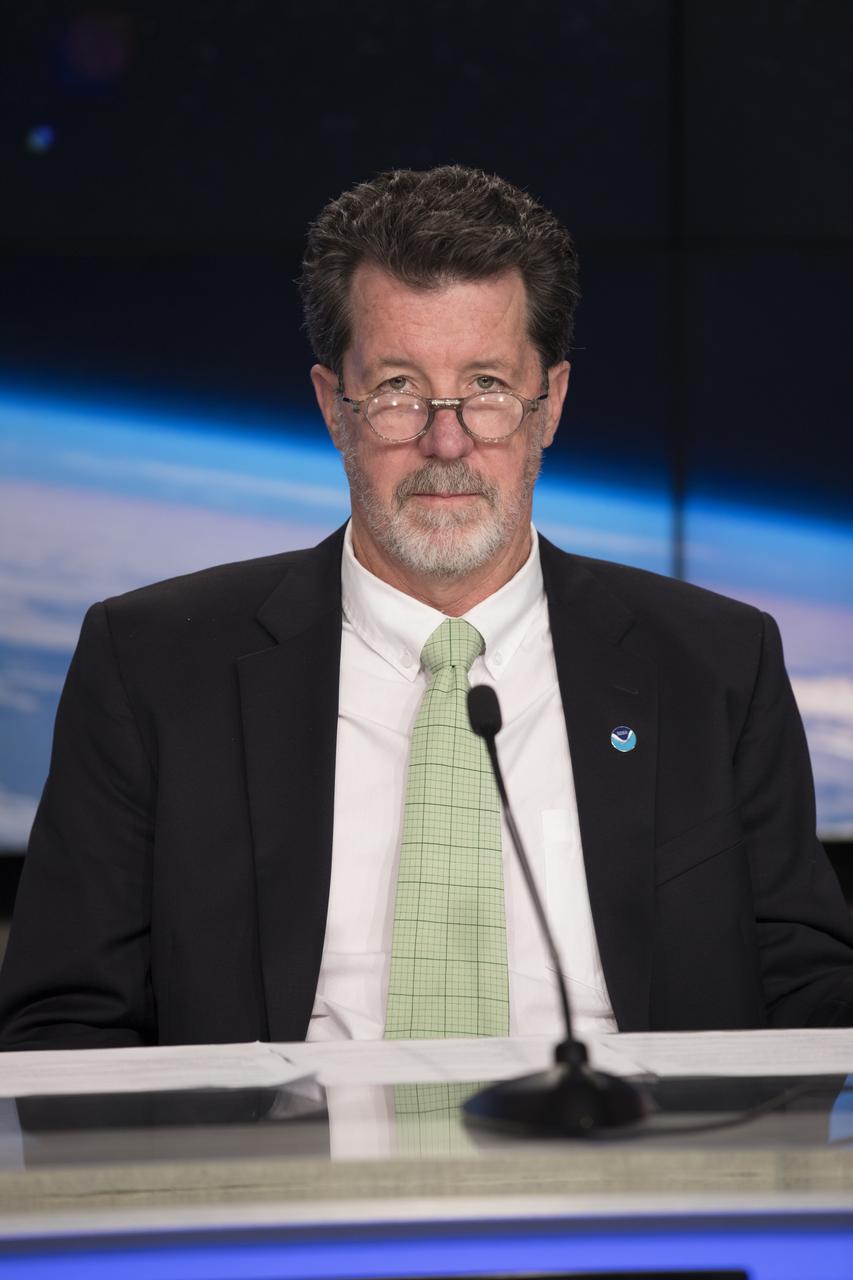
In the Kennedy Space Center's Press Site auditorium, Jim Roberts, a scientist with the Earth System Research Laboratory's Office of Atmospheric Research for NOAA, speaks to members of the media at a mission briefing on National Oceanic and Atmospheric Administration's, or NOAA's, Geostationary Operational Environmental Satellite, or GOES-S. The spacecraft is the second satellite in a series of next-generation NOAA weather satellites. It will launch to a geostationary position over the U.S. to provide images of storms and help predict weather forecasts, severe weather outlooks, watches, warnings, lightning conditions and longer-term forecasting. GOES-S is slated to lift off at 5:02 p.m. EST on March 1, 2018 aboard a United Launch Alliance Atlas V rocket.
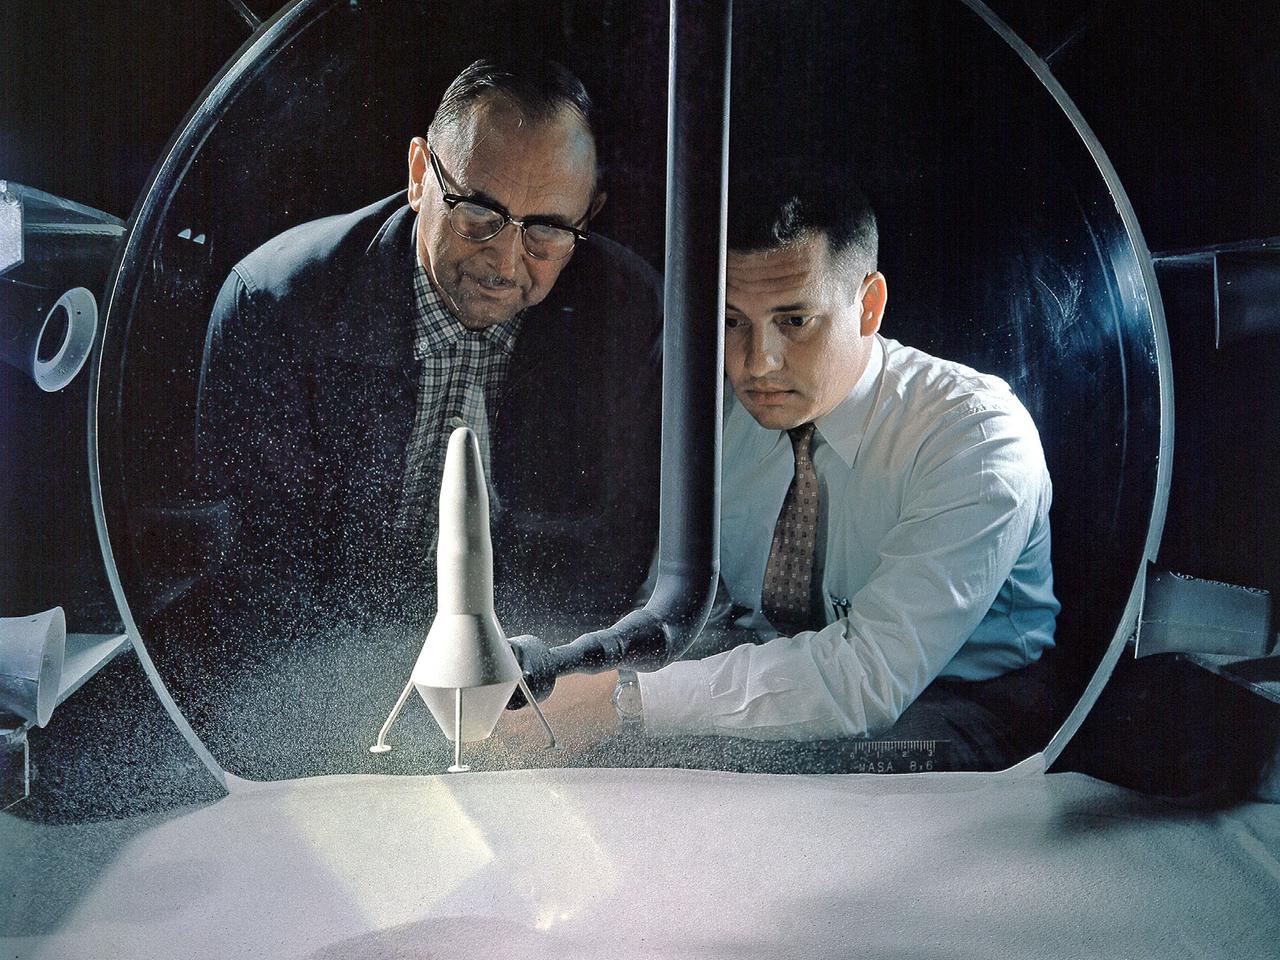
NASA Researchers view a demonstration of the moon dust simulator in the 8- by 6-Foot Supersonic Wind Tunnel facility at the National Aeronautics and Space Administration (NASA) Lewis Research Center. The researchers were studying the effect of the lunar lander’s retrorockets on the loose dust on the lunar surface. There was some concern that the retrorockets would kick up so much dust that the crew would lose the ability to see. They also did not know how the dust’s behavior would be affected by the space atmosphere. This small vacuum tank was built for very preliminary investigations into this matter. The pipe entering the top of the tank supplied the airflow to the lander model, which was affixed to the pipe. The researchers altered the vacuum levels and speed of the airflow.
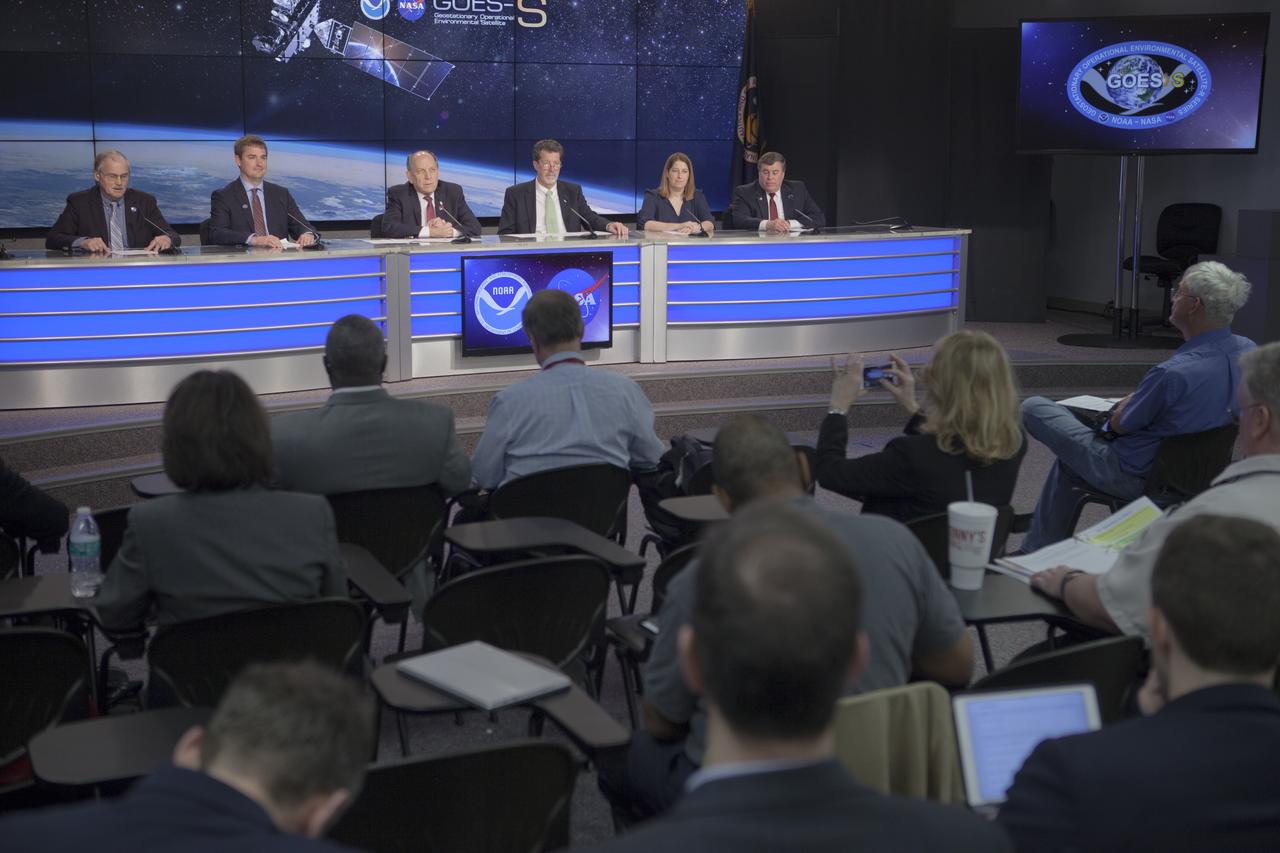
In the Kennedy Space Center's Press Site auditorium, members of the media participate in a mission briefing on National Oceanic and Atmospheric Administration's, or NOAA's, Geostationary Operational Environmental Satellite, or GOES-S. Briefing participants from left are: Steve Cole of NASA Communications; Dan Lindsey, GOES-R senior scientific advisor for NOAA; Louis Uccellini, director of the National Weather Service for NOAA; Jim Roberts, a scientist with the Earth System Research Laboratory's Office of Atmospheric Research for NOAA; Kristin Calhoun, a research scientist with NOAA's National Severe Storms Laboratory, and George Morrow, deputy director of NASA's Goddard Space Flight Center in Greenbelt, Maryland. GOES-S is the second satellite in a series of next-generation NOAA weather satellites. It will launch to a geostationary position over the U.S. to provide images of storms and help predict weather forecasts, severe weather outlooks, watches, warnings, lightning conditions and longer-term forecasting. GOES-S is slated to lift off at 5:02 p.m. EST on March 1, 2018 aboard a United Launch Alliance Atlas V rocket.
KENNEDY SPACE CENTER, FLA. - Dr. Paul Hintze (left) explains to Center Director Jim Kennedy a project he is working at the KSC Beach Corrosion Test Site. Hitze is doing post-graduate work for the National Research Council. The test facility site was established in the 1960s and has provided more than 30 years of historical information on the long-term performance of many materials in use at KSC and other locations around the world. Located 100 feet from the Atlantic Ocean approximately 1 mile south of the Space Shuttle launch sites, the test facility includes an atmospheric exposure site, a flowing seawater exposure site, and an on-site electrochemistry laboratory and monitoring station. The beach laboratory is used to conduct real-time corrosion experiments and provides for the remote monitoring of surrounding weather conditions. The newly added flowing seawater immersion facility provides for the immersion testing of materials and devices under controlled conditions.
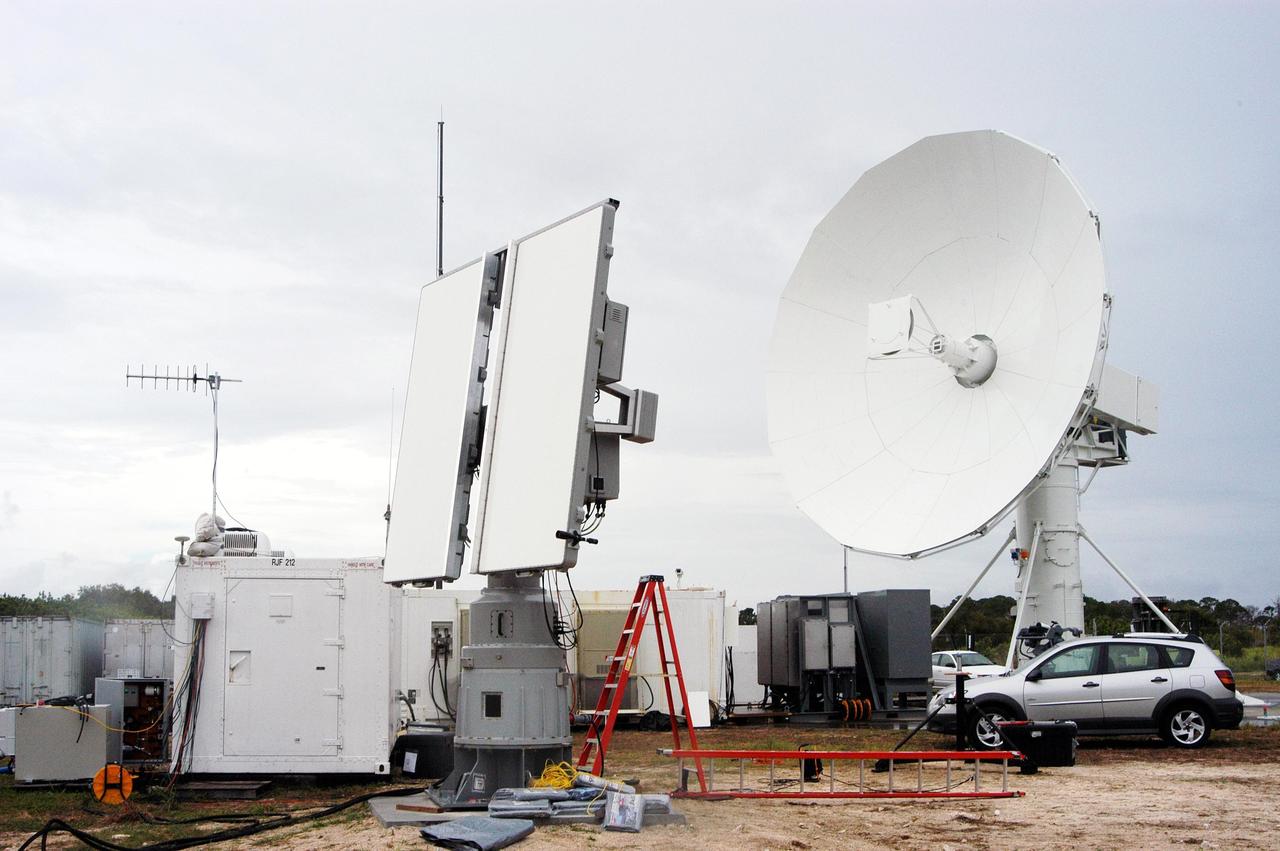
KENNEDY SPACE CENTER, FLA. - An X-band (left) and a C-band radar antenna are prepared to observe the MESSENGER (Mercury Surface, Space Environment, Geochemistry and Ranging) launch. The antennas are on loan to KSC from the USNS Pathfinder, a U.S. Navy instrumentation ship. They have been installed at site north of Haulover Canal where the National Center for Atmospheric Research previously had a radar for thunderstorm research. NASA is evaluating the pair of radars for their ability to observe possible debris coming from the Space Shuttle during launch, part of NASA’s initiative to return the Space Shuttle to flight.
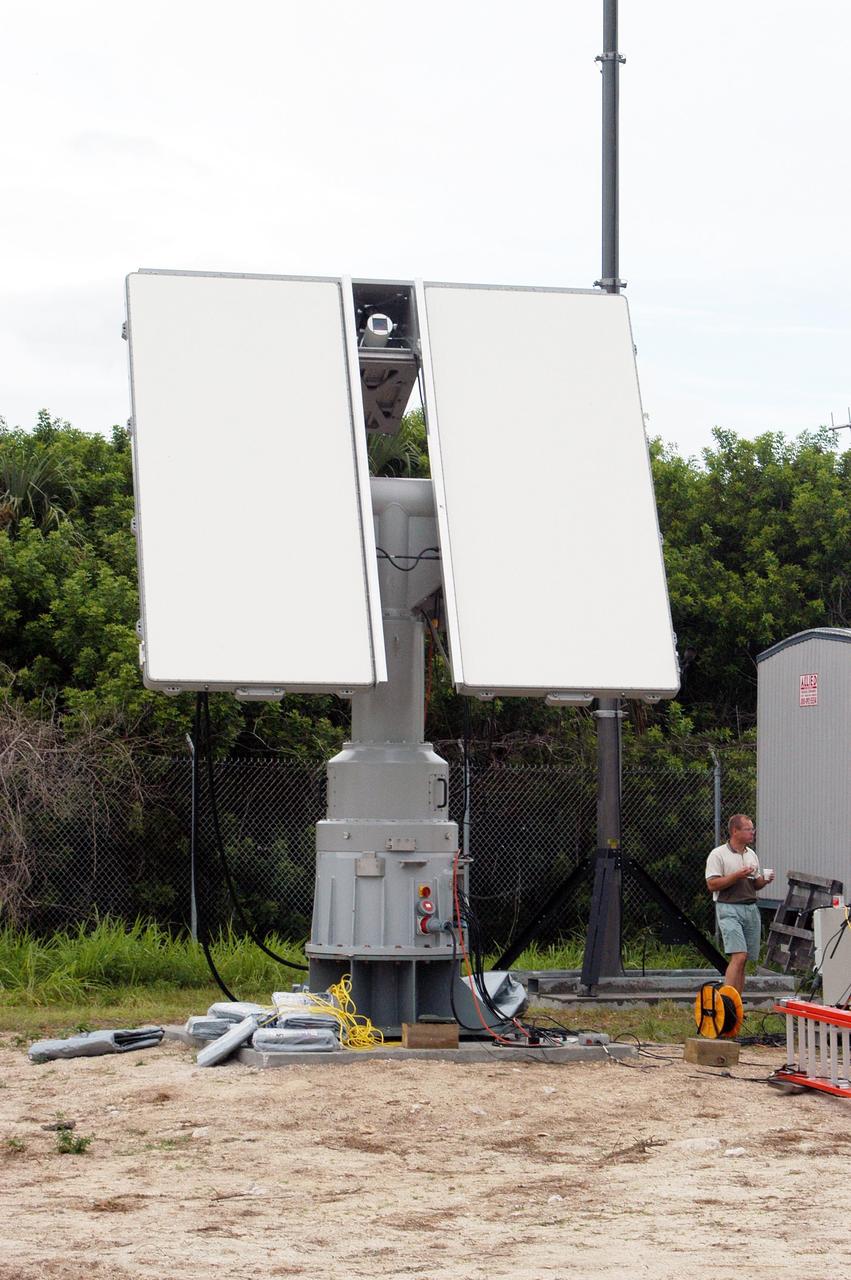
KENNEDY SPACE CENTER, FLA. - An X-band radar antenna is in place to observe the MESSENGER (Mercury Surface, Space Environment, Geochemistry and Ranging) launch. This antenna and a C-band radar antenna are on loan to KSC from the USNS Pathfinder, a U.S. Navy instrumentation ship. They have been installed at site north of Haulover Canal where the National Center for Atmospheric Research previously had a radar for thunderstorm research. NASA is evaluating the pair of radars for their ability to observe possible debris coming from the Space Shuttle during launch, part of NASA’s initiative to return the Space Shuttle to flight.
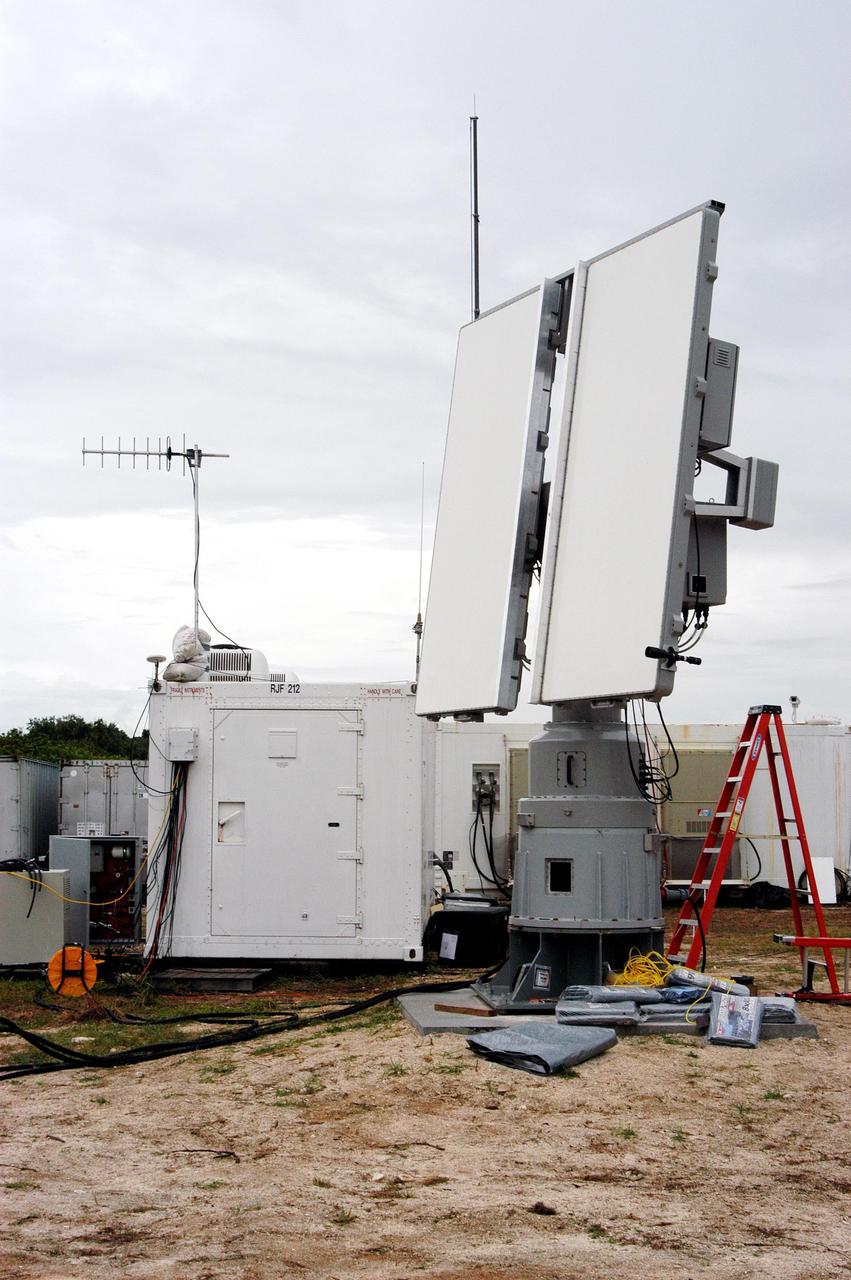
KENNEDY SPACE CENTER, FLA. - An X-band radar antenna is prepared to observe the MESSENGER (Mercury Surface, Space Environment, Geochemistry and Ranging) launch. This antenna and a C-band radar antenna are on loan to KSC from the USNS Pathfinder, a U.S. Navy instrumentation ship. They have been installed at site north of Haulover Canal where the National Center for Atmospheric Research previously had a radar for thunderstorm research. NASA is evaluating the pair of radars for their ability to observe possible debris coming from the Space Shuttle during launch, part of NASA’s initiative to return the Space Shuttle to flight.
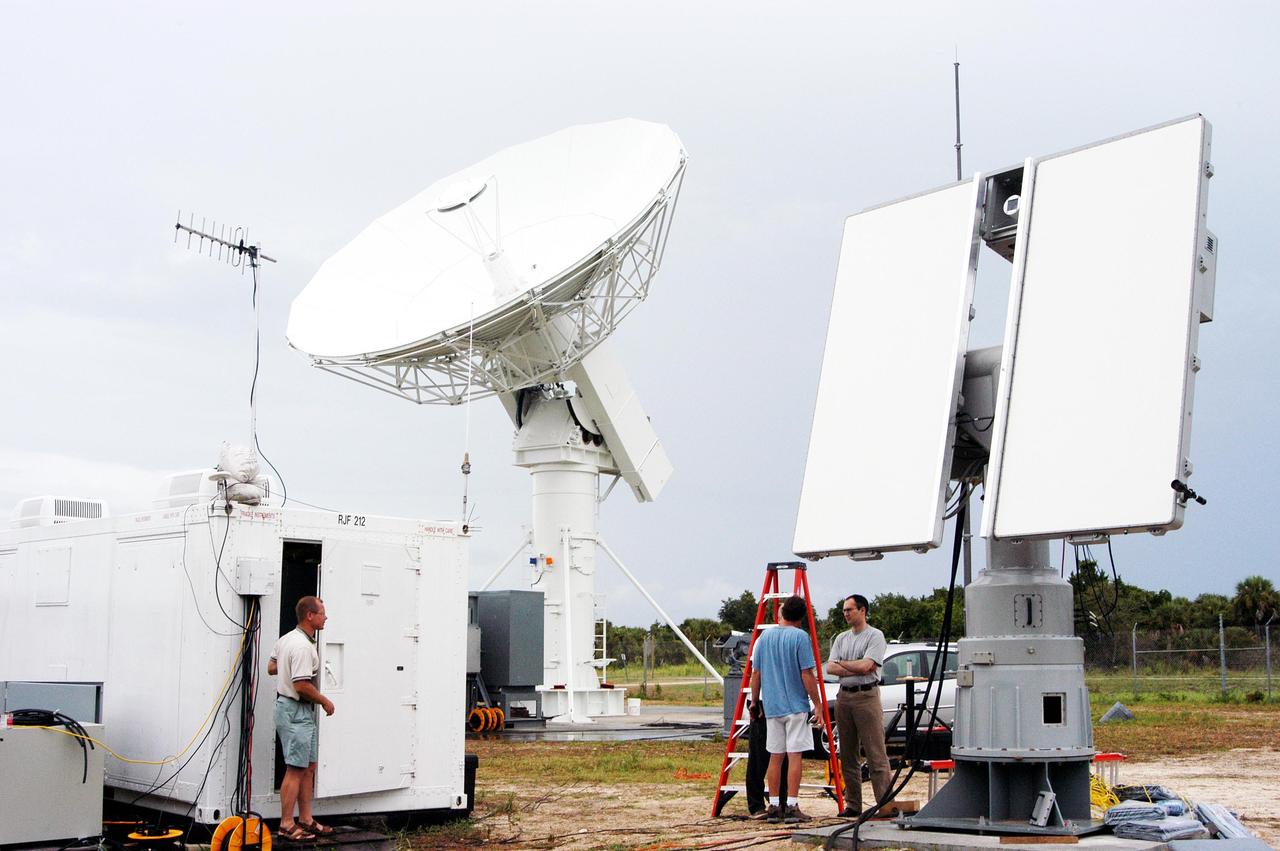
KENNEDY SPACE CENTER, FLA. - A C-band (left) and an X-band radar antenna are positioned to observe the MESSENGER (Mercury Surface, Space Environment, Geochemistry and Ranging) launch. The antennas are on loan to KSC from the USNS Pathfinder, a U.S. Navy instrumentation ship. They have been installed at site north of Haulover Canal where the National Center for Atmospheric Research previously had a radar for thunderstorm research. NASA is evaluating the pair of radars for their ability to observe possible debris coming from the Space Shuttle during launch, part of NASA’s initiative to return the Space Shuttle to flight.
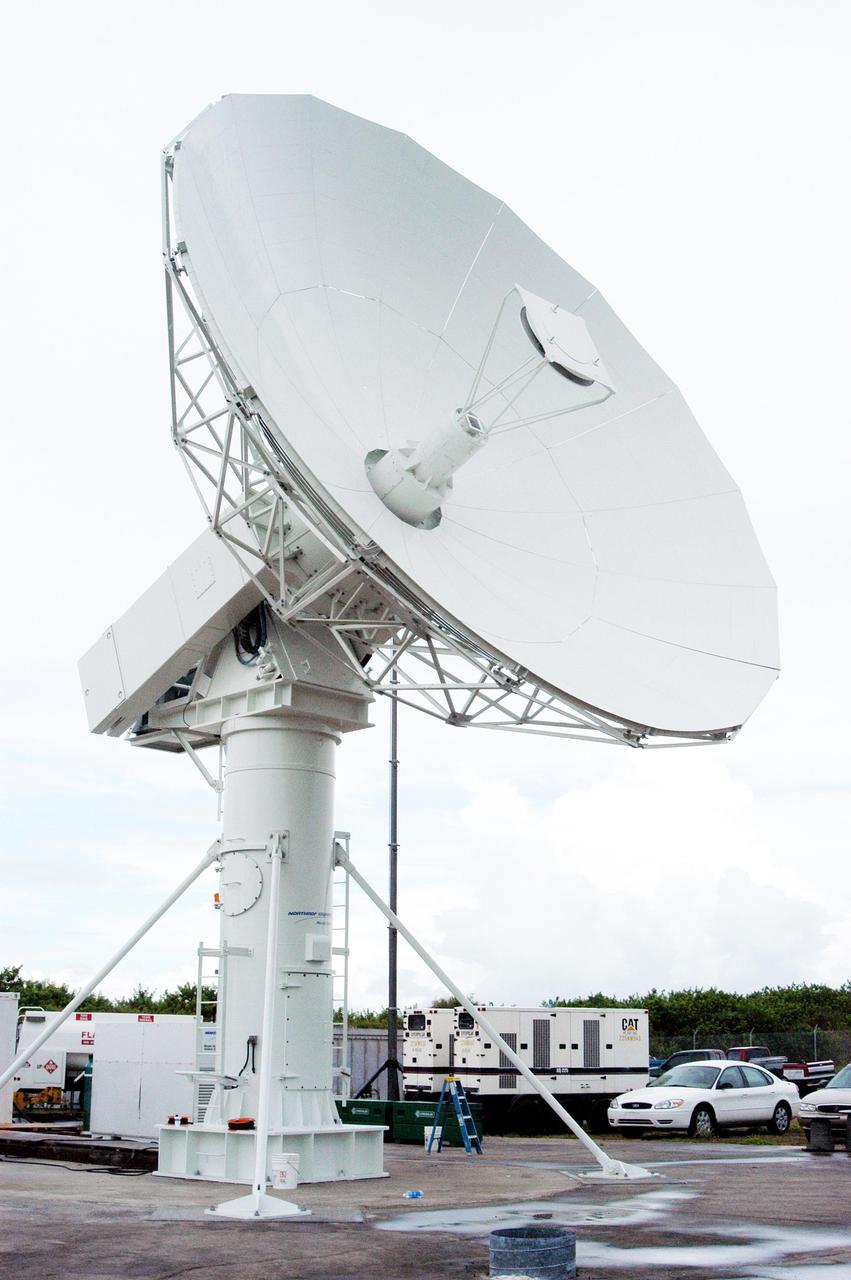
KENNEDY SPACE CENTER, FLA. - A C-band radar antenna stands ready to observe the MESSENGER (Mercury Surface, Space Environment, Geochemistry and Ranging) launch. This antenna and an X-band radar antenna are on loan to KSC from the USNS Pathfinder, a U.S. Navy instrumentation ship. They have been installed at site north of Haulover Canal where the National Center for Atmospheric Research previously had a radar for thunderstorm research. NASA is evaluating the pair of radars for their ability to observe possible debris coming from the Space Shuttle during launch, part of NASA’s initiative to return the Space Shuttle to flight.
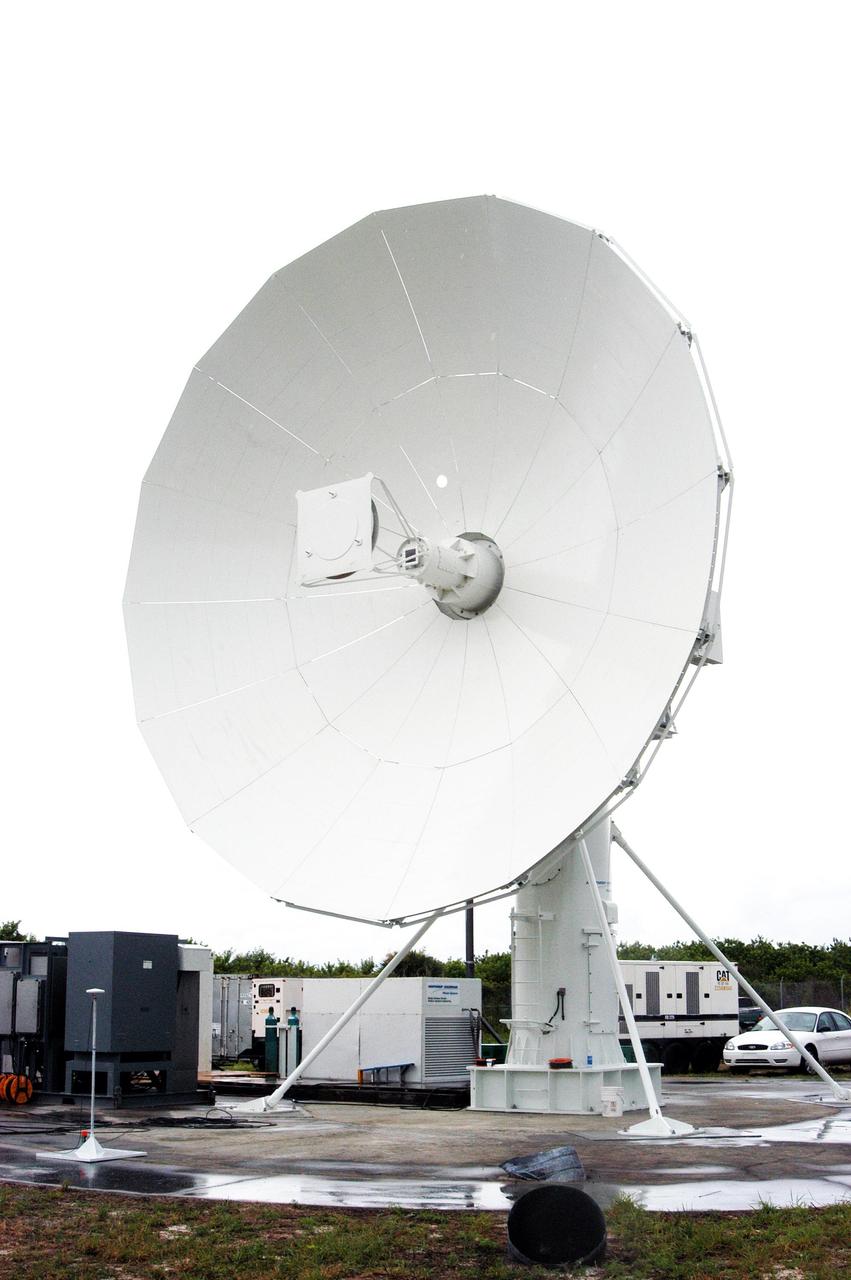
KENNEDY SPACE CENTER, FLA. - A C-band radar antenna is prepared to observe the MESSENGER (Mercury Surface, Space Environment, Geochemistry and Ranging) launch. This antenna and an X-band radar antenna are on loan to KSC from the USNS Pathfinder, a U.S. Navy instrumentation ship. They have been installed at site north of Haulover Canal where the National Center for Atmospheric Research previously had a radar for thunderstorm research. NASA is evaluating the pair of radars for their ability to observe possible debris coming from the Space Shuttle during launch, part of NASA’s initiative to return the Space Shuttle to flight.

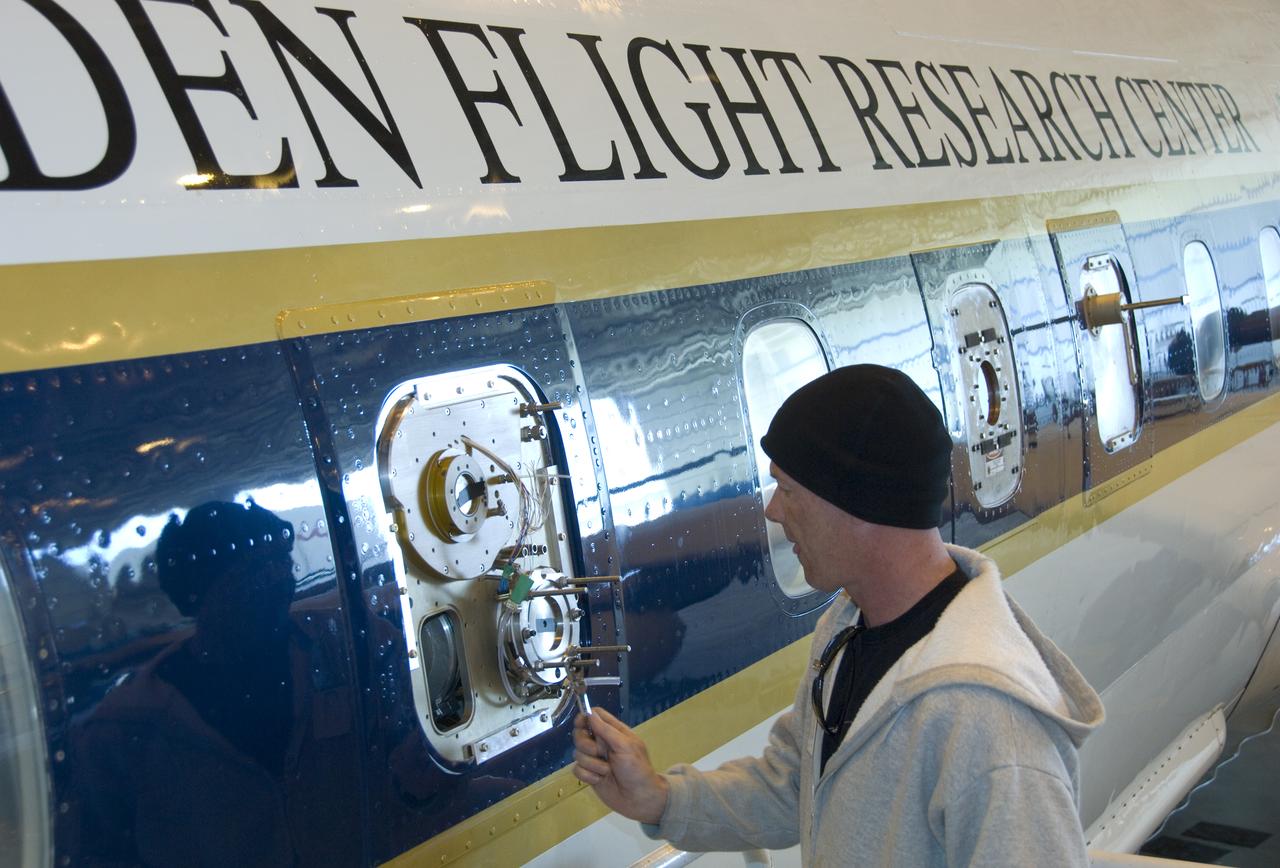
NASA's Dryden Flight Research Center marked its 60th anniversary as the aerospace agency's lead center for atmospheric flight research and operations in 2006. In connection with that milestone, hundreds of the center's staff and retirees gathered in nearby Lancaster, Calif., in November 2006 to reflect on the center's challenges and celebrate its accomplishments over its six decades of advancing the state-of-the-art in aerospace technology. The center had its beginning in 1946 when a few engineers from the National Advisory Committee for Aeronautics' Langley Memorial Aeronautical Laboratory were detailed to Muroc Army Air Base (now Edwards Air Force Base) in Southern California's high desert to support the joint Army Air Force / NACA / Bell Aircraft XS-1 research airplane program. Since that inauspicious beginning, the center has been at the forefront of many of the advances in aerospace technology by validating advanced concepts through actual in-flight research and testing. Dryden is uniquely situated to take advantage of the excellent year-round flying weather, remote area, and visibility to test some of the nation�s most exciting aerospace vehicles. Today, NASA Dryden is NASA's premier flight research and test organization, continuing to push the envelope in the validation of high-risk aerospace technology and space exploration concepts, and in conducting airborne environmental and space science missions in the 21st century.

In the Kennedy Space Center's Press Site auditorium, Kristin Calhoun, a research scientist with NOAA's National Severe Storms Laboratory, speaks to members of the media at a mission briefing on National Oceanic and Atmospheric Administration's, or NOAA's, Geostationary Operational Environmental Satellite, or GOES-S. The spacecraft is the second satellite in a series of next-generation NOAA weather satellites. It will launch to a geostationary position over the U.S. to provide images of storms and help predict weather forecasts, severe weather outlooks, watches, warnings, lightning conditions and longer-term forecasting. GOES-S is slated to lift off at 5:02 p.m. EST on March 1, 2018 aboard a United Launch Alliance Atlas V rocket.
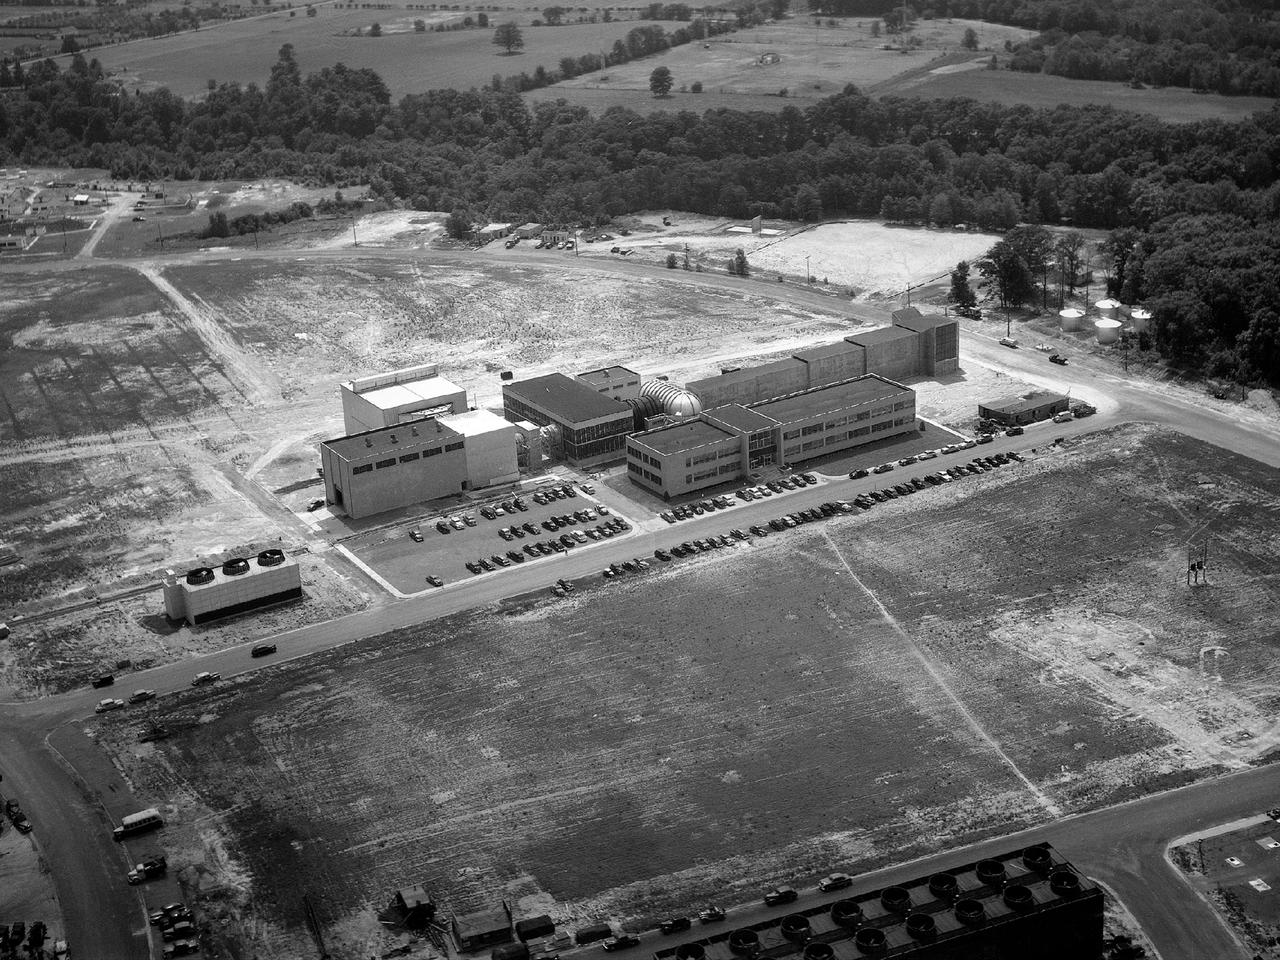
The National Space Science and Technology Center (NSSTC), located in Huntsville, Alabama, is a laboratory for cutting-edge research in selected scientific and engineering disciplines. The major objectives of the NSSTC are to provide multiple fields of expertise coming together to solve solutions to science and technology problems, and gaining recognition as a world-class science research organization. The center, opened in August 2000, focuses on space science, Earth sciences, information technology, optics and energy technology, biotechnology and materials science, and supports NASA's mission of advancing and communicating scientific knowledge using the environment of space for research. In addition to providing basic and applied research, NSSTC, with its student participation, also fosters the next generation of scientists and engineers. NSSTC is a collaborated effort between NASA and the state of Alabama through the Space Science and Technology alliance, a group of six universities including the Universities of Alabama in Huntsville (UAH),Tuscaloosa (UA), and Birmingham (UAB); the University of South Alabama in Mobile (USA);Alabama Agricultural and Mechanical University (AM) in Huntsville; and Auburn University (AU) in Auburn. Participating federal agencies include NASA, Marshall Space Flight Center, the National Oceanic and Atmospheric Administration, the Department of Defense, the National Science Foundation, and the Department of Energy. Industries involved include the Space Science Research Center, the Global Hydrology and Climate Center, the Information Technology Research Center, the Optics and Energy Technology Center, the Propulsion Research Center, the Biotechnology Research Center, and the Materials Science Research Center. This photo shows the completed center with the additional arnex (right of building) that added an additional 80,000 square feet (7,432 square meters) to the already existent NSSTC, nearly doubling the size of the core facility. At full capacity, the NSSTC tops 200,000 square feet (18,580 square meters) and houses approximately 550 employees.
The National Space Science and Technology Center (NSSTC), located in Huntsville, Alabama, is a laboratory for cutting-edge research in selected scientific and engineering disciplines. The major objectives of the NSSTC are to provide multiple fields of expertise coming together to solve solutions to science and technology problems, and gaining recognition as a world-class science research organization. The center, opened in August 2000, focuses on space science, Earth sciences, information technology, optics and energy technology, biotechnology and materials science, and supports NASA's mission of advancing and communicating scientific knowledge using the environment of space for research. In addition to providing basic and applied research, NSSTC, with its student participation, also fosters the next generation of scientists and engineers. NSSTC is a collaborated effort between NASA and the state of Alabama through the Space Science and Technology alliance, a group of six universities including the Universities of Alabama in Huntsville (UAH),Tuscaloosa (UA), and Birmingham (UAB); the University of South Alabama in Mobile (USA); Alabama Agricultural and Mechanical University (AM) in Huntsville; and Auburn University (AU) in Auburn. Participating federal agencies include NASA, Marshall Space Flight Center, the National Oceanic and Atmospheric Administration, the Department of Defense, the National Science Foundation, and the Department of Energy. Industries involved include the Space Science Research Center, the Global Hydrology and Climate Center, the Information Technology Research Center, the Optics and Energy Technology Center, the Propulsion Research Center, the Biotechnology Research Center, and the Materials Science Research Center. An arnex, scheduled for completion by summer 2002, will add an additional 80,000 square feet (7,432 square meters) to NSSTC nearly doubling the size of the core facility. At full capacity, the completed NSSTC will top 200,000 square feet (18,580 square meters) and house approximately 550 employees.
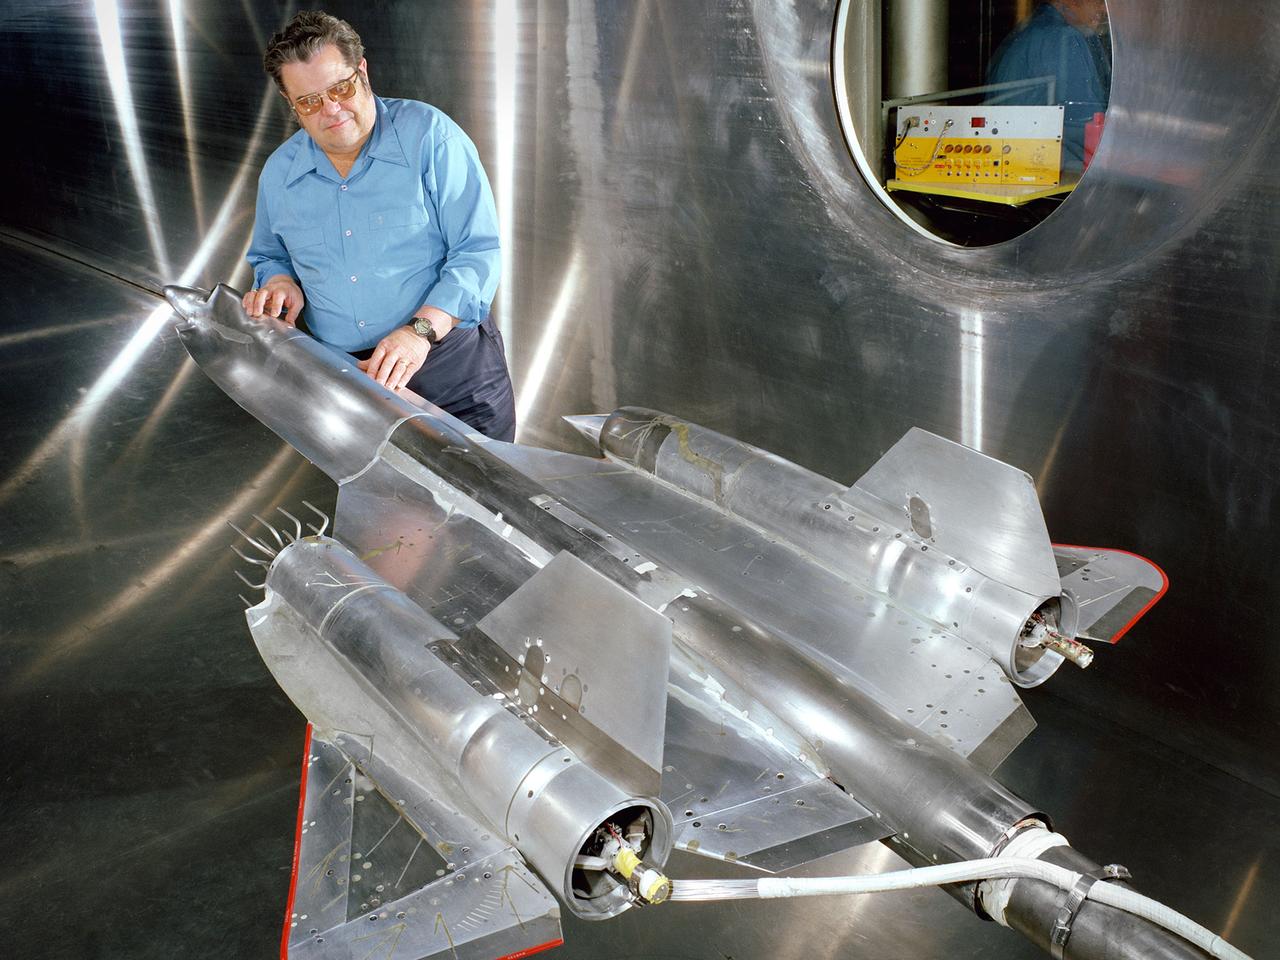
Robert Cubbison examines a model of the Lockheed YF-12 Blackbird in the test section of the 10- by 10-Foot Supersonic Wind Tunnel at the National Aeronautics and Space Administration (NASA) Lewis Research Center. The YF-12 was an experimental fighter version of Lockheed’s A-12 reconnaissance aircraft which had been developed into the renowned SR-71 Blackbird. NASA possessed two YF-12s at its Dryden Flight Research Center which could be used by researchers at all the NASA centers. During its nine-year life, the Dryden’s YF-12 research program logged 297 flights with approximately 450 flight hours. Lewis researchers were studying the YF-12’s inlet airflow in the 10- by 10-foot wind tunnel in late 1977. The advanced supersonic cruise aircraft of the time used mixed-compression inlets. These types of inlets were prone to flameout during atmospheric disturbances. Researchers at Lewis and Dryden developed a program to study these flameouts by artificially introducing flow disturbances. Testing at Dryden with a specially-equipped YF-12 aircraft yielded limited results. Lewis’ tests in the 10- by 10 were unsuccessful at inducing upstream disturbances. The researchers used two methods—a falling plate and a servo-driven wing.

Dakota Smith, satellite analyst and communicator, NOAA’s Cooperative Institute for Research in the Atmosphere, participates in a social panel on Monday, June 24, 2024, at NASA’s Kennedy Space Center in Florida to discuss National Oceanic and Atmospheric Administration (NOAA) GOES-U (Geostationary Operational Environmental Satellite U) mission. The GOES-U satellite is the final addition to GOES-R series, which serves a critical role in providing continuous coverage of the Western Hemisphere, including monitoring tropical systems in the eastern Pacific and Atlantic oceans. The two-hour launch window opens at 5:16 p.m. EDT Tuesday, June 25, for the satellite’s launch on a SpaceX Falcon Heavy rocket from Launch Complex 39A at NASA’s Kennedy Space Center in Florida.
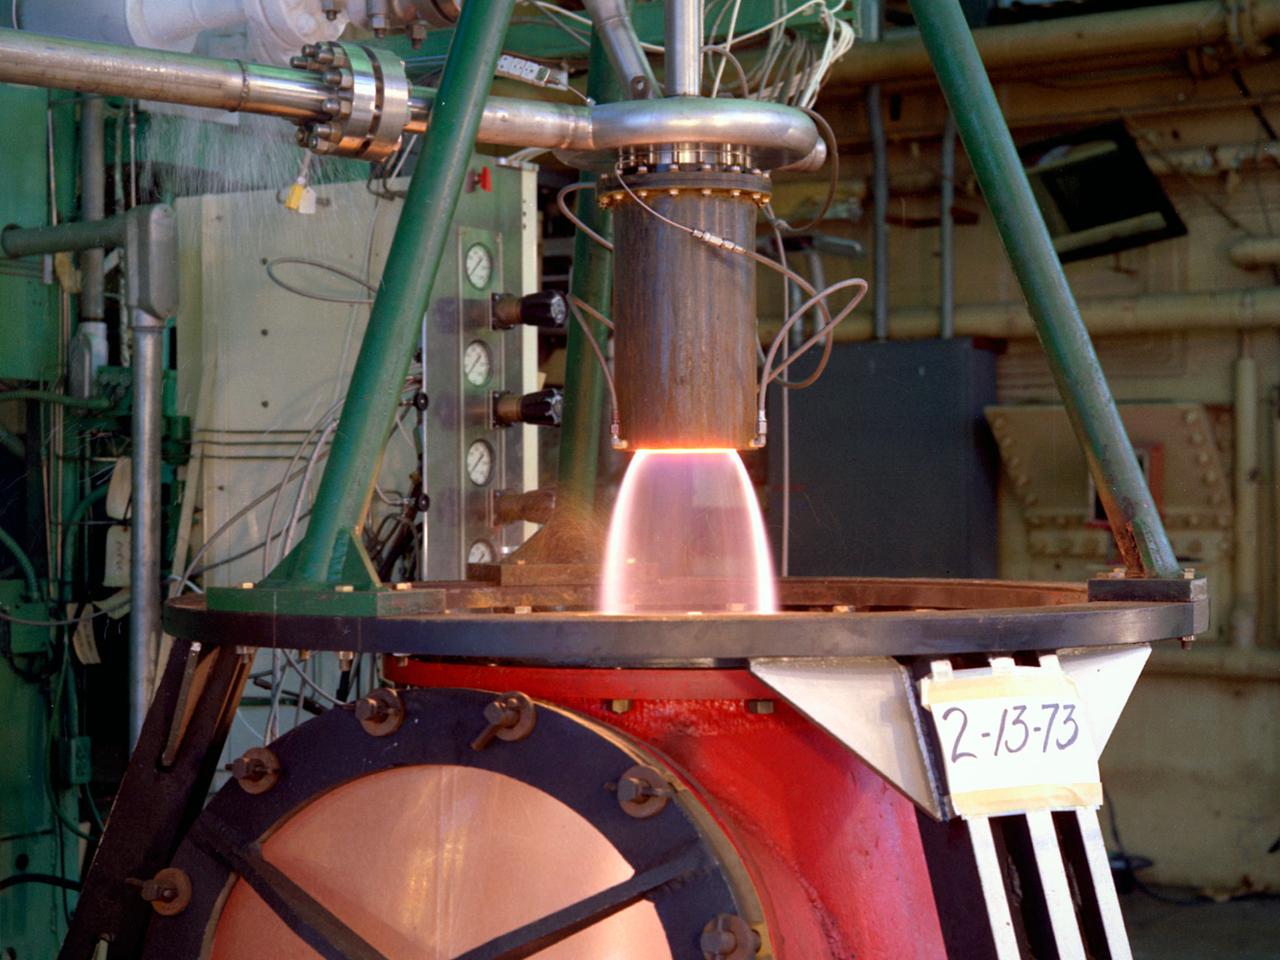
The thrust stand in the Rocket Engine Test Facility at the National Aeronautics and Space Administration (NASA) Lewis Research Center in Cleveland, Ohio. The Rocket Engine Test Facility was constructed in the mid-1950s to expand upon the smaller test cells built a decade before at the Rocket Laboratory. The $2.5-million Rocket Engine Test Facility could test larger hydrogen-fluorine and hydrogen-oxygen rocket thrust chambers with thrust levels up to 20,000 pounds. Test Stand A, seen in this photograph, was designed to fire vertically mounted rocket engines downward. The exhaust passed through an exhaust gas scrubber and muffler before being vented into the atmosphere. Lewis researchers in the early 1970s used the Rocket Engine Test Facility to perform basic research that could be utilized by designers of the Space Shuttle Main Engines. A new electronic ignition system and timer were installed at the facility for these tests. Lewis researchers demonstrated the benefits of ceramic thermal coatings for the engine’s thrust chamber and determined the optimal composite material for the coatings. They compared the thermal-coated thrust chamber to traditional unlined high-temperature thrust chambers. There were more than 17,000 different configurations tested on this stand between 1973 and 1976. The Rocket Engine Test Facility was later designated a National Historic Landmark for its role in the development of liquid hydrogen as a propellant.

In the Kennedy Space Center's Press Site auditorium, Laura Henning, public information officer for the Canaveral National Seashore, speaks to members of the media at a news conference to discuss upcoming flight tests to study the effects of sonic booms. Kennedy is partnering with Armstrong, Langley and Space Florida for a program called SonicBAT for Sonic Booms in Atmospheric Turbulence. Starting in August, NASA F-18 jets will take off from the Shuttle Landing Facility and fly at supersonic speeds while agency researchers on the ground measure the effects of low-altitude turbulence on sonic booms. The study could lead to technology mitigating the annoying sonic booms making possible supersonic flights over populated areas.
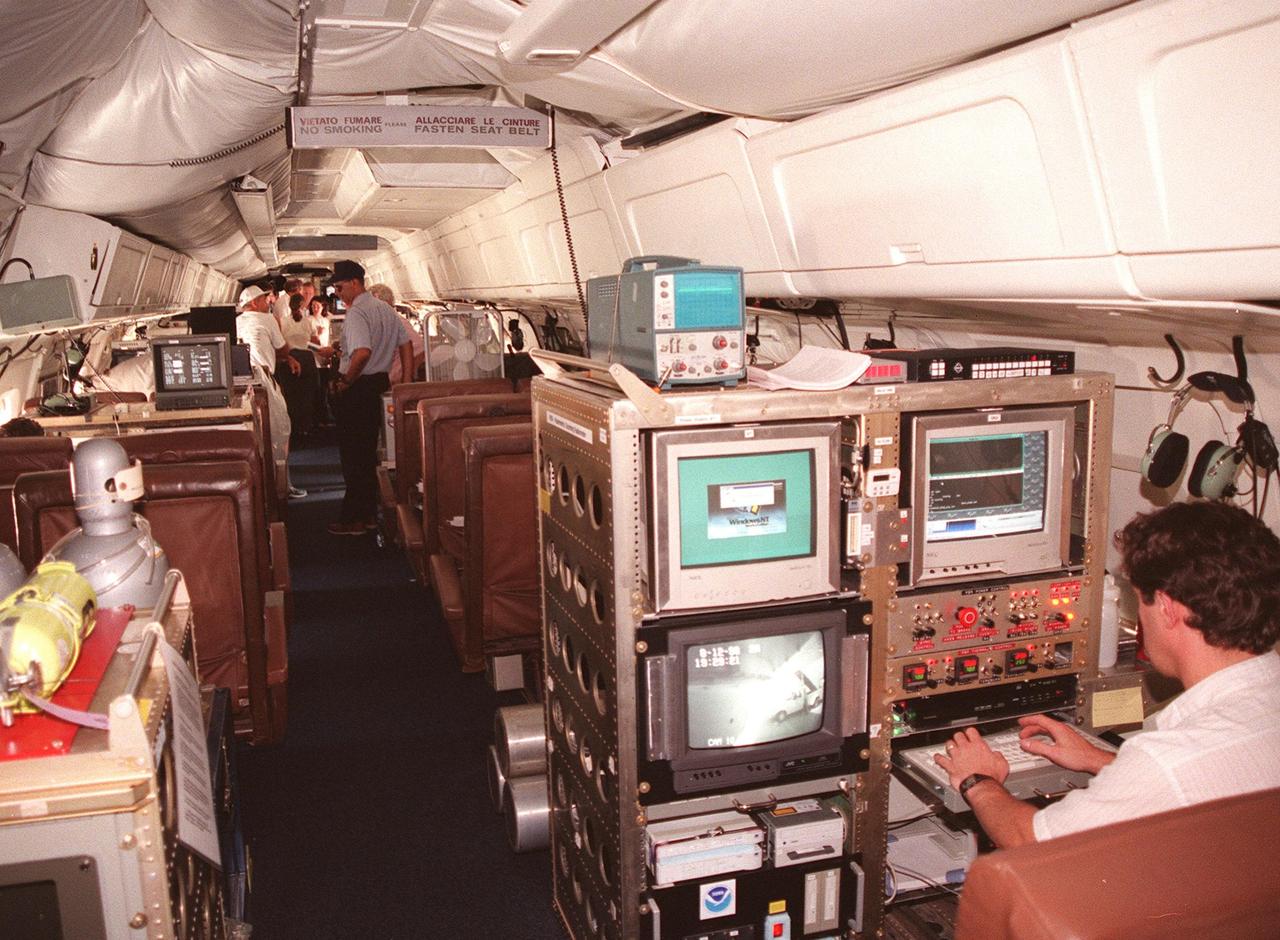
Inside this NASA Dryden Flight Research Center DC-8, which was on view at Patrick Air Force Base, visitors get a close-up look at the instruments that will be used to collect high-altitude information about Atlantic hurricanes and tropical storms as part of a NASA-led Atmospheric Dynamics and Remote Sensing program. The DC-8 is one of two aircraft being flown in a study through September to learn about the storms from top to bottom. The other plane, a modified U2, and the DC-8 will fly in conjunction with scheduled storm flights of the National Oceanic and Atmospheric Administration (NOAA) out of MacDill Air Force Base in Tampa and the U.S. Air Force 53rd Weather Reconnaissance Squadron from Keesler Air Force Base, Miss. The hurricane study is part of NASA’s Earth Science enterprise to better understand the total Earth system and the effects of natural and human-induced changes on the global environment
VANDENBERG AIR FORCE BASE, Calif. -- On Space Launch Complex 2 at Vandenberg Air Force Base in California, workers center the Delta II first stage for the OSTM/Jason-2 spacecraft above the launcher in the umbilical tower. The OSTM, or Ocean Topography Mission, on the Jason-2 satellite is a follow-on to Jason-1. It will take oceanographic studies of sea surface height into an operational mode for continued climate forecasting research and science and industrial applications. This satellite altimetry data will help determine ocean circulation, climate change and sea-level rise. OSTM is a joint effort by the National Oceanic and Atmospheric Administration, NASA, France’s Centre National d’Etudes Spatiales and the European Meteorological Satellite Organisation. OSTM/Jason-2 will be launched aboard a United Launch Alliance Delta II 7320 from Vandenberg on June 15. Photo credit: NASA/Dan Liberotti
Officials from NASA, National Oceanic and Atmospheric Administration (NOAA), and other mission managers participate in a social panel on Monday, June 24, 2024, at NASA’s Kennedy Space Center in Florida for the launch of GOES-U (Geostationary Operational Environmental Satellite U) mission. From left to right, Leah Martin, NASA Communications; Ellen Ramirez, deputy division chief, Mission Operations Division, National Environmental Satellite, Data, and Information Service Office of Satellite and Product Operations, NOAA; Jade Zsiros, telemetry engineer, NASA’s Launch Services Program; Dakota Smith, satellite analyst and communicator, NOAA’s Cooperative Institute for Research in the Atmosphere; Allana Nepomuceno, senior manager, GOES-U Assembly, Test, and Launch Operations, Lockheed Martin; Chris Reith, program manager, Advanced Baseline Imager, L3Harris Technologies. The two-hour launch window opens at 5:16 p.m. EDT Tuesday, June 25, for the satellite’s launch on a SpaceX Falcon Heavy rocket from Launch Complex 39A at NASA’s Kennedy Space Center in Florida.
A National Aeronautics and Space Administration (NASA) Lockheed U-2 aircraft on display at the 1973 Inspection of the Lewis Research Center in Cleveland, Ohio. Lockheed developed the U-2 as a high-altitude reconnaissance aircraft in the early 1950s before satellites were available. The U-2 could cruise over enemy territory at 70,000 feet and remain impervious to ground fire, interceptor aircraft, and even radar. An advanced camera system was designed specifically for the aircraft. The pilot is required to use a pressure suit similar to those worn by astronauts. NASA’s Ames Research Center received two U-2 aircraft in April 1971 to conduct high-altitude research. They were used to study and monitor various Earth resources, celestial bodies, atmospheric chemistry, and oceanic processes. NASA replaced its U-2s with ER-2 aircraft in 1981 and 1989. The ER-2s were designed to carry up to 2600 pounds of scientific equipment. The ER-2 program was transferred to Dryden Flight Research Center in 1997. Since the inaugural flight for this program on August 31, 1971, NASA’s U-2 and ER-2 aircraft have flown more than 4500 data missions and test flights for NASA, other federal agencies, states, universities, and the private sector.

Technicians set up test hardware inside the test section of the Icing Research Tunnel at the National Aeronautics and Space Administration (NASA) Lewis Research Center. The Icing Research Tunnel was built in the early 1940s to study the formation of ice on aircraft surfaces and develop methods of preventing or eradicating that ice. Ice buildup is dangerous because it adds extra weight, effects aerodynamics, and sometimes blocks air flow through engines. The Icing Research Tunnel is a closed-loop atmospheric wind tunnel with a 6- by 9-foot test section. The tunnel can produce speeds up to 300 miles per hour and temperatures from 30 to -45 °F. NACA engineers struggled initially to perfect a spray bar system to introduce moisture into the airstream. The tunnel was shut down in the late 1950s as the center focused its energy exclusively on space. Industrial customers began using the tunnel sporadically, then steadily, in the 1960s. Boeing, Aerojet, Lockheed, Sikorsky, Beech and others ran tests during the 1960s. Boeing analyzed engine inlets for the CH-47 Chinook, CH-46 (Sea Knight) and CH-113. This photograph was taken during a series of 100 ice-phobic coatings for the Federal Aviation Administration. They found that many of the coatings reduced ice adhesion to the test sample, but they could not be used for aircraft applications.
A Martin B-57B Canberra outfitted with a noise suppressor on its right engine at the National Aeronautics and Space Administration (NASA) Lewis Research Center. The aircraft was being prepared for the October 1966 Inspection of the center. The Inspection also marked Lewis’ twentieth anniversary. Lewis researchers had been studying engine noise for almost a decade, but the problem seemed to be increasing in the mid-1960s with heavier airline traffic and larger engines. Researchers discovered early on that the majority of the noise did not emanate from the engine itself, but from the mixing of the hot exhaust gasses with the atmosphere. Attempts to reduce the turbulence using new exhaust nozzles were successful but often resulted in decreased engine performance. The researchers decided to try to lower the jet nozzle exit velocity without decreasing its thrust. The inlet mass air flow had to be increased to accomplish this. The Lewis B-57B was powered by two Wright Aeronautical J65 turbojets. Lewis engineers modified the stators on the two engines to simulate the noise levels from more-modern turbofan engines. A noise suppressor was added to only one of the two engines, seen here on the left. The engines were run one at a time at power levels similar to landing while the aircraft sat on the Lewis hangar apron. A microphone and recording equipment was setup to capture the noise levels. The engine with the suppressor produced 13 fewer decibels than the standard engine.
KENNEDY SPACE CENTER, FLA. - On a tour of the KSC Beach Corrosion Test Site, Testbed Manager Louis MacDowell (foreground) explains to Center Director Jim Kennedy (third from right) about a study being undertaken for the U.S. Navy: nonchrome primers for aircraft. At left is Lead Scientist Dr. Luz Marina Calle and behind MacDowell is Dr. Paul Hintze, who is working on a graduate project for the National Research Council. The KSC Beach Corrosion Test Site was established in the 1960s and has provided more than 30 years of historical information on the long-term performance of many materials in use at KSC and other locations around the world. Located 100 feet from the Atlantic Ocean approximately 1 mile south of the Space Shuttle launch sites, the test facility includes an atmospheric exposure site, a flowing seawater exposure site, and an on-site electrochemistry laboratory and monitoring station. The beach laboratory is used to conduct real-time corrosion experiments and provides for the remote monitoring of surrounding weather conditions. The newly added flowing seawater immersion facility provides for the immersion testing of materials and devices under controlled conditions.
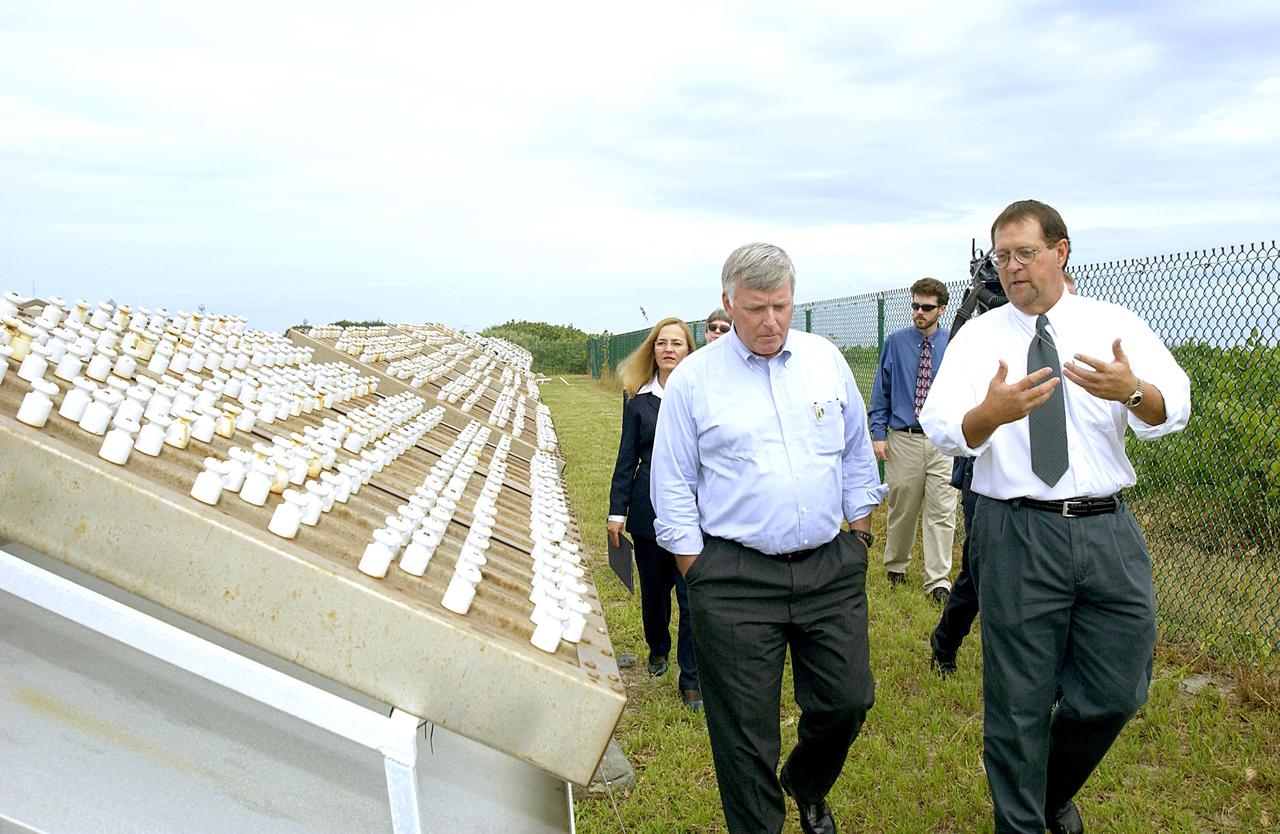
KENNEDY SPACE CENTER, FLA. - On a tour of the KSC Beach Corrosion Test Site, Louis MacDowell (right), Testbed manager, explains to Center Director Jim Kennedy a project being undertaken for the U.S. Navy. At left are nonchrome primers for aircraft being studied. Behind Kennedy is Lead Scientist Dr. Luz Marina Calle. Behind MacDowell is Dr. Paul Hintze, who is working on a graduate project for the National Research Council. The KSC Beach Corrosion Test Site was established in the 1960s and has provided more than 30 years of historical information on the long-term performance of many materials in use at KSC and other locations around the world. Located 100 feet from the Atlantic Ocean approximately 1 mile south of the Space Shuttle launch sites, the test facility includes an atmospheric exposure site, a flowing seawater exposure site, and an on-site electrochemistry laboratory and monitoring station. The beach laboratory is used to conduct real-time corrosion experiments and provides for the remote monitoring of surrounding weather conditions. The newly added flowing seawater immersion facility provides for the immersion testing of materials and devices under controlled conditions.
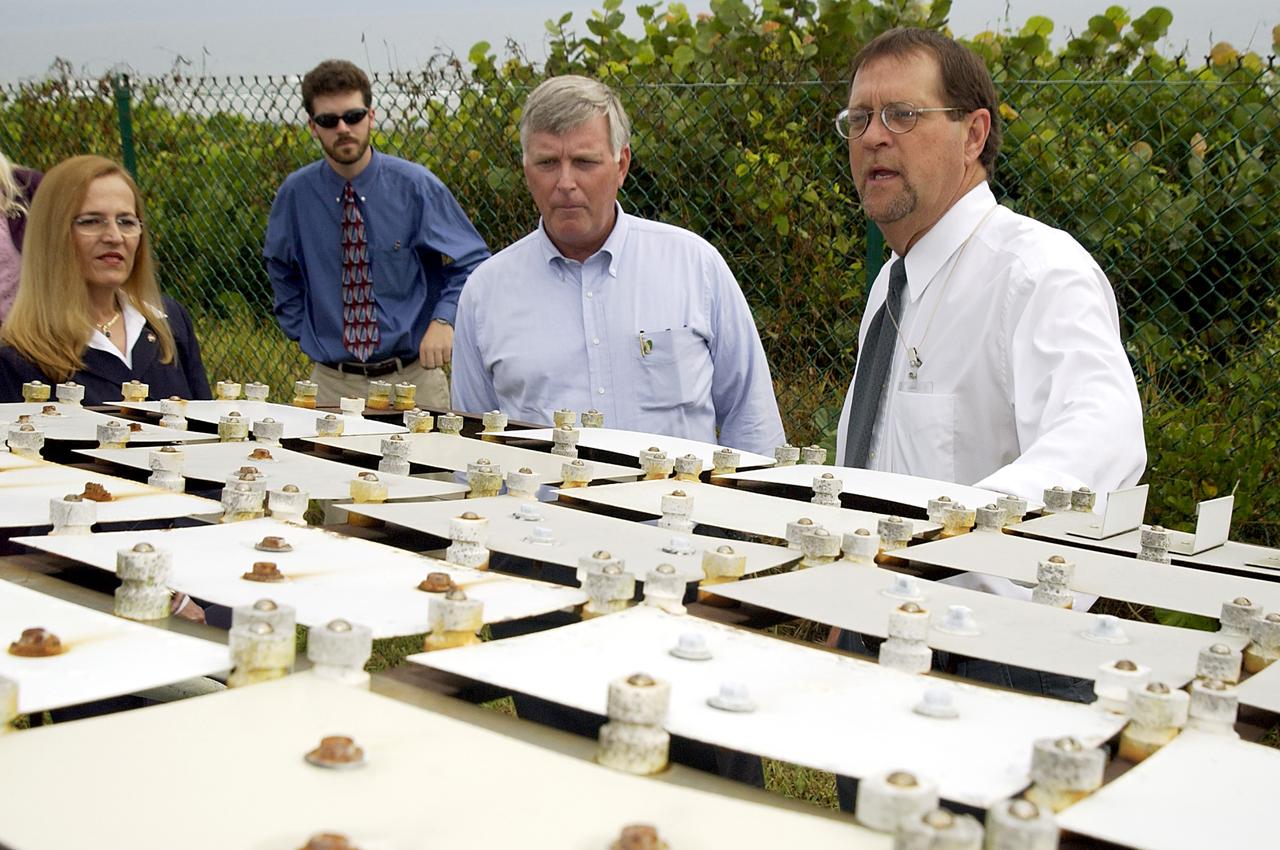
KENNEDY SPACE CENTER, FLA. - On a tour of the KSC Beach Corrosion Test Site, Center Director Jim Kennedy (second from right) learns from Testbed Manager Louis MacDowell (right) about a project being undertaken for the U.S. Navy. Being studied are nonchrome primers for aircraft. At left are Lead Scientist Dr. Luz Marina Calle and Dr. Paul Hintze, who is working on a graduate project for the National Research Council. The KSC Beach Corrosion Test Site was established in the 1960s and has provided more than 30 years of historical information on the long-term performance of many materials in use at KSC and other locations around the world. Located 100 feet from the Atlantic Ocean approximately 1 mile south of the Space Shuttle launch sites, the test facility includes an atmospheric exposure site, a flowing seawater exposure site, and an on-site electrochemistry laboratory and monitoring station. The beach laboratory is used to conduct real-time corrosion experiments and provides for the remote monitoring of surrounding weather conditions. The newly added flowing seawater immersion facility provides for the immersion testing of materials and devices under controlled conditions.
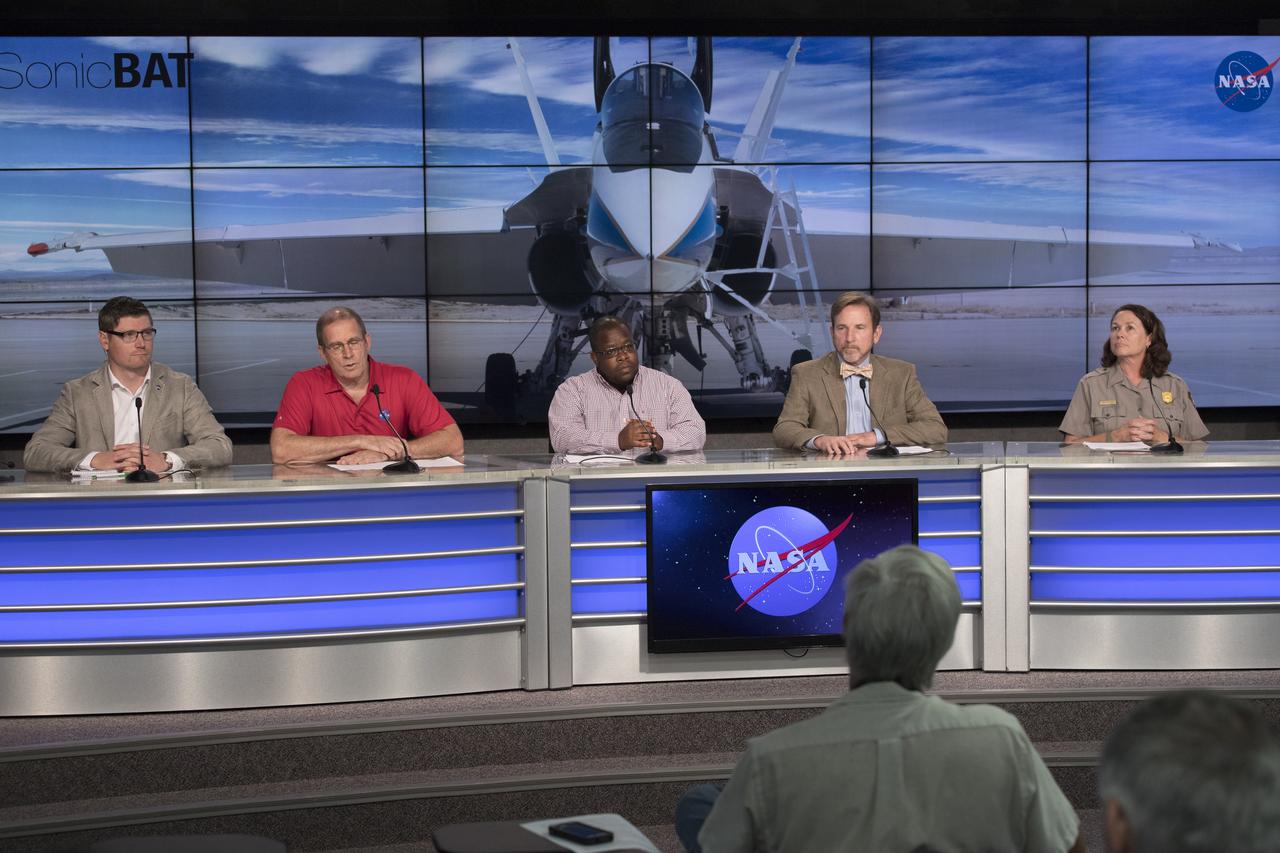
In the Kennedy Space Center's Press Site auditorium, NASA and other government leaders speak to members of the media at a news conference to discuss upcoming flight tests to study the effects of sonic booms. Participants from left are: Matthew Kamlet of NASA Communications at the Armstrong Flight Research Center in California; Peter Coen, SonicBAT Mission Analysis at NASA’s Langley Research Center in Virginia; Larry Cliatt, SonicBAT Fluid Mechanics at Armstrong; Dale Ketcham chief of Strategic Alliances for Space Florida; and Laura Henning, public information officer for the Canaveral National Seashore. Kennedy is partnering with Armstrong, Langley and Space Florida for a program called SonicBAT for Sonic Booms in Atmospheric Turbulence. Starting in August, NASA F-18 jets will take off from the Shuttle Landing Facility and fly at supersonic speeds while agency researchers on the ground measure the effects of low-altitude turbulence on sonic booms. The study could lead to technology mitigating the annoying sonic booms making possible supersonic flights over populated areas.
A group of Coast Guard seamen leave their ship to verify ice formations on the Great Lakes as part of an joint effort with the National Aeronautics and Space Administration (NASA) Lewis Research Center and the National Oceanic and Atmospheric Administration. The regular winter freezing of large portions of the Great Lakes stalled the shipping industry. Lewis began working on two complementary systems to monitor the ice. The Side Looking Airborne Radar (SLAR) system used microwaves to measure the ice distribution and electromagnetic systems used noise modulation to determine the thickness of the ice. The images were then transferred via satellite to the Coast Guard station. The Coast Guard then transmitted the pertinent images by VHF to the ship captains to help them select the best route. The Great Lakes ice mapping devices were first tested on NASA aircraft during the winter of 1972 and 1973. The pulsed radar system was transferred to the Coast Guard’s C-130 aircraft for the 1975 and 1976 winter. The SLAR was installed in the rear cargo door, and the small S-band antenna was mounted to the underside of the aircraft. Coast Guard flights began in January 1975 at an altitude of 11,000 feet. Early in the program, teams of guardsmen and NASA researchers frequently set out in boats to take samples and measurements of the ice in order to verify the radar information.
Pilot Earle Boyer and researcher Henry Brandhorst prepare for a solar cell calibration flight in a Martin B-57B Canberra at the National Aeronautics and Space Administration (NASA) Lewis Research Center. Lewis was in the early stages of decades-long energy conversion and space power research effort. Brandhorst, a member of the Chemistry and Energy Conversion Division, led a team of Lewis researchers in a quest to develop new power sources to sustain spacecraft in orbit. Solar cells proved to be an important source of energy, but researchers discovered that their behavior varied at different atmospheric levels. Their standardization and calibration were critical. Brandhorst initiated a standardized way to calibrate solar cells in the early 1960s using the B-57B aircraft. The pilots would take the aircraft up into the troposphere and open the solar cell to the sunlight. The aircraft would steadily descend while instruments recorded how much energy was being captured by the solar cell. From this data, Brandhorst could determine the estimated power for a particular solar cell at any altitude. Pilot Earle Boyer joined NASA Lewis in October 1962. He had flown Convair F-102 Delta Dagger fighters in the Air Force and served briefly in the National Guard before joining the Langley Research Center. Boyer was only at Langley a few months before he transferred to Cleveland. He flew the B-57B, a Convair F-106 Delta Dart, Gulfstream G-1 with an experimental turboprop, Learjet and many other aircraft over the next 32 years at Lewis.
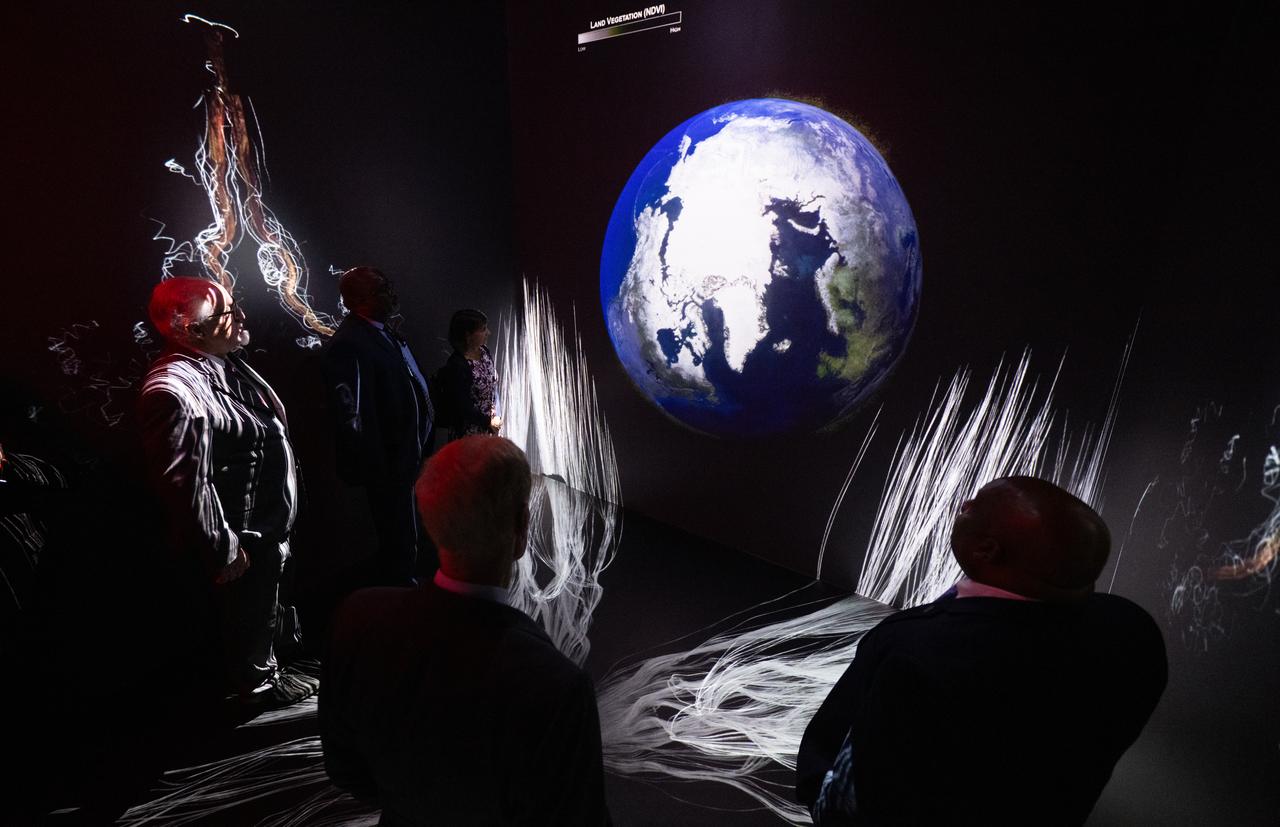
NASA Administrator Bill Nelson, Michael Morgan, Assistant Secretary of Commerce for Environmental Observation and Prediction at the National Oceanic and Atmospheric Administration (NOAA), Marlen Eve, Deputy Administrator for the Agricultural Research Service at the U.S. Department of Agriculture (USDA), and Eric Hooks, Deputy Administrator of the Federal Emergency Management Agency (FEMA), are seen as they watch “Space for Earth,” the immersive audio-visual installation in NASA’s Earth Information Center, following the ribbon cutting ceremony, Wednesday, June 21, 2023, at the Mary W. Jackson NASA Headquarters building in Washington. The Earth Information Center is new immersive experience that combines live data sets with cutting-edge data visualization and storytelling to allow visitors to see how our planet is changing. Photo Credit: (NASA/Joel Kowsky)
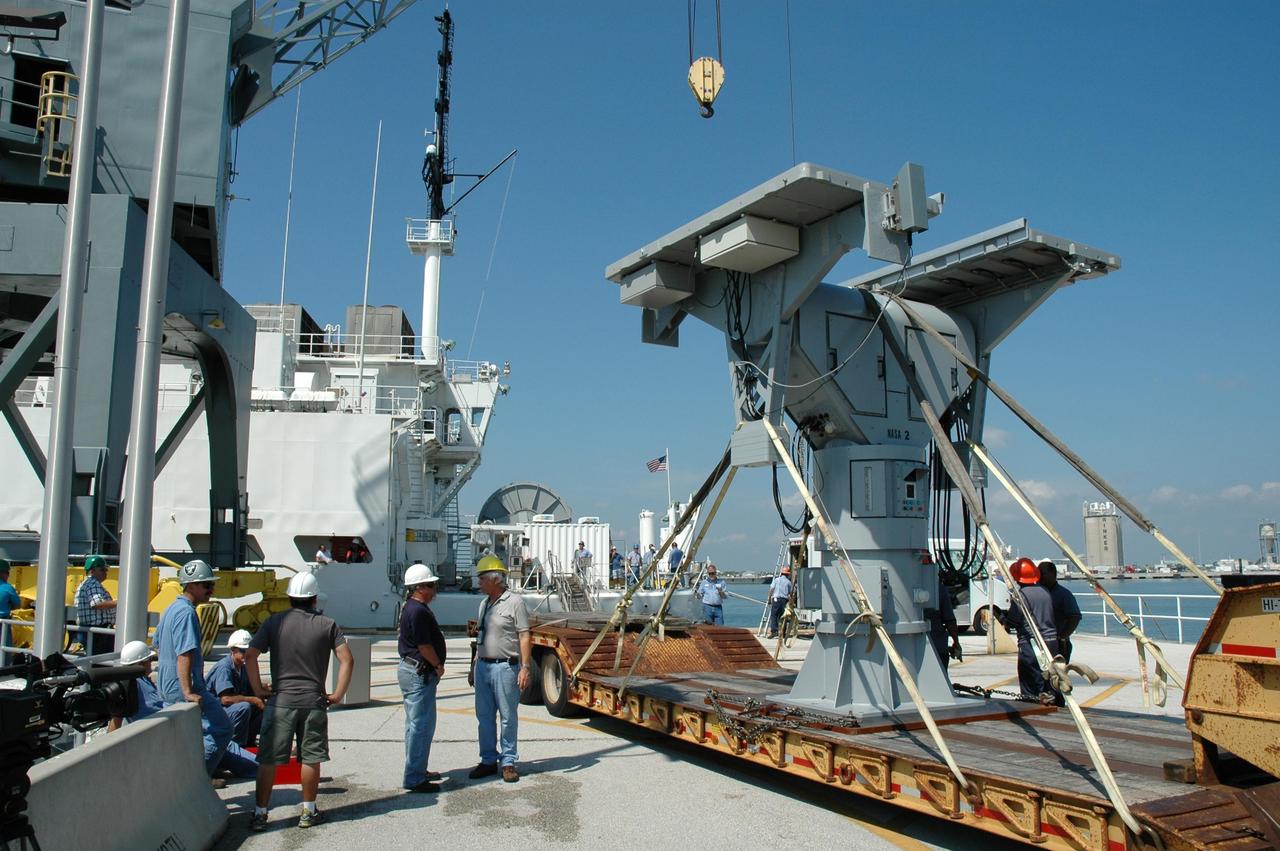
KENNEDY SPACE CENTER, FLA. - An X-band radar is ready to be loaded on the U.S. Naval Ship Hayes at Port Canaveral in Florida to support the July 1 launch of Space Shuttle Discovery on mission STS-121. There are two Continuous Pulse Doppler X-band radars located on ships for the STS-121 launch. The other one is mounted on a booster recovery ship downrange of the launch site. The two radars provide velocity and differential Shuttle/debris motion information. Combined with the C-band radar located at the Haulover Canal near the launch site, they provide high definition images of any debris that might fall from the external tank/shuttle. The X-band data (screen captures) will be sent from the ships via satellite link to the National Center for Atmospheric Research site. Photo credit: NASA/Jim Grossmann

KENNEDY SPACE CENTER, FLA. - On the dock at Port Canaveral in Florida, a worker secures a crane hook on an X-band radar to be transferred to and installed on the U.S. Naval Ship Hayes. The radar will support the July 1 launch of Space Shuttle Discovery on mission STS-121. There are two Continuous Pulse Doppler X-band radars located on ships for the STS-121 launch. The other one is mounted on a booster recovery ship downrange of the launch site. The two radars provide velocity and differential Shuttle/debris motion information. Combined with the C-band radar located at the Haulover Canal near the launch site, they provide high definition images of any debris that might fall from the external tank/shuttle. The X-band data (screen captures) will be sent from the ships via satellite link to the National Center for Atmospheric Research site. Photo credit: NASA/Jim Grossmann
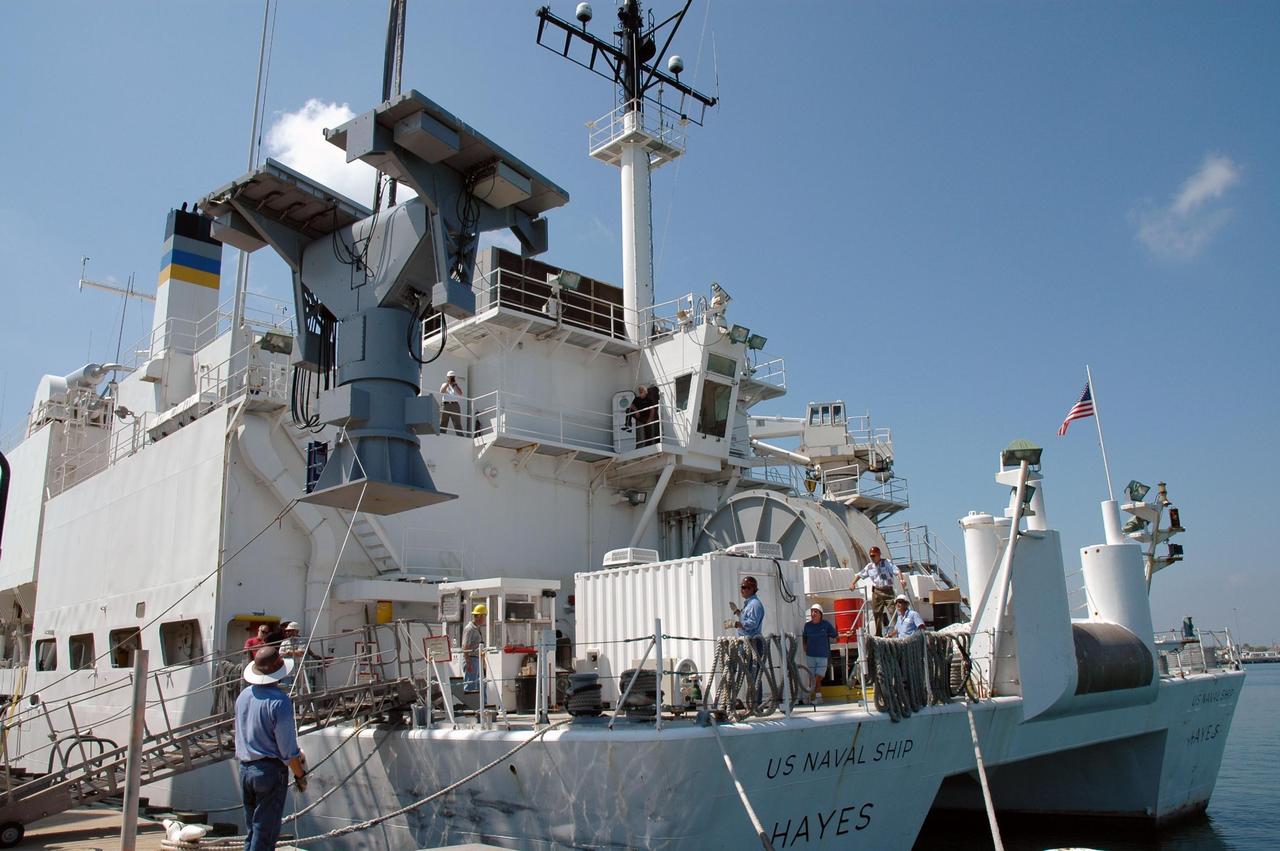
KENNEDY SPACE CENTER, FLA. - An X-band radar is transferred onto the U.S. Naval Ship Hayes at Port Canaveral in Florida to support the July 1 launch of Space Shuttle Discovery on mission STS-121. There are two Continuous Pulse Doppler X-band radars located on ships for the STS-121 launch. The other one is mounted on a booster recovery ship downrange of the launch site. The two radars provide velocity and differential Shuttle/debris motion information. Combined with the C-band radar located at the Haulover Canal near the launch site, they provide high definition images of any debris that might fall from the external tank/shuttle. The X-band data (screen captures) will be sent from the ships via satellite link to the National Center for Atmospheric Research site. Photo credit: NASA/Jim Grossmann
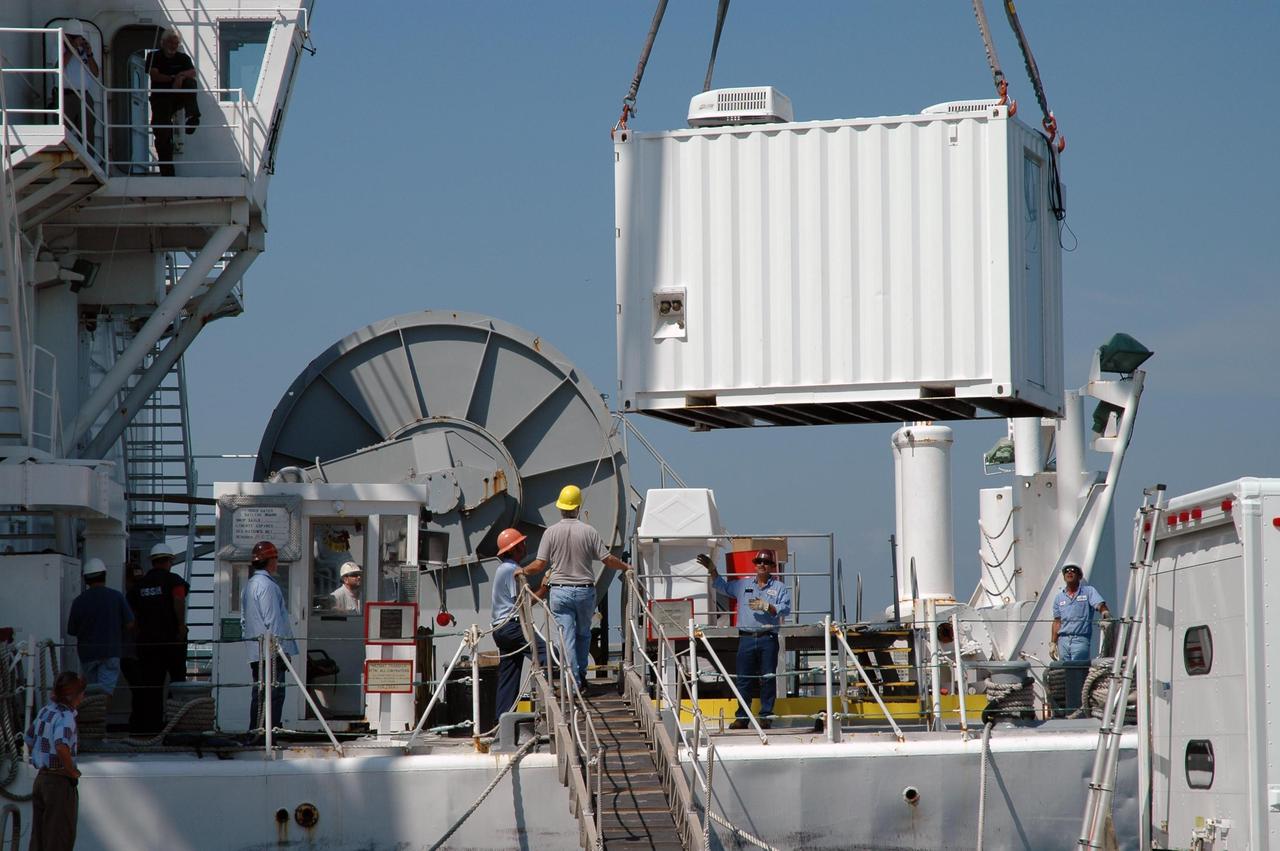
KENNEDY SPACE CENTER, FLA. - A support equipment module for an X-band radar is being loaded on the U.S. Naval Ship Hayes at Port Canaveral in Florida to support the July 1 launch of Space Shuttle Discovery on mission STS-121. There are two Continuous Pulse Doppler X-band radars located on ships for the STS-121 launch. The other one is mounted on a booster recovery ship downrange of the launch site. The two radars provide velocity and differential Shuttle/debris motion information. Combined with the C-band radar located at the Haulover Canal near the launch site, they provide high definition images of any debris that might fall from the external tank/shuttle. The X-band data (screen captures) will be sent from the ships via satellite link to the National Center for Atmospheric Research site. Photo credit: NASA/Jim Grossmann
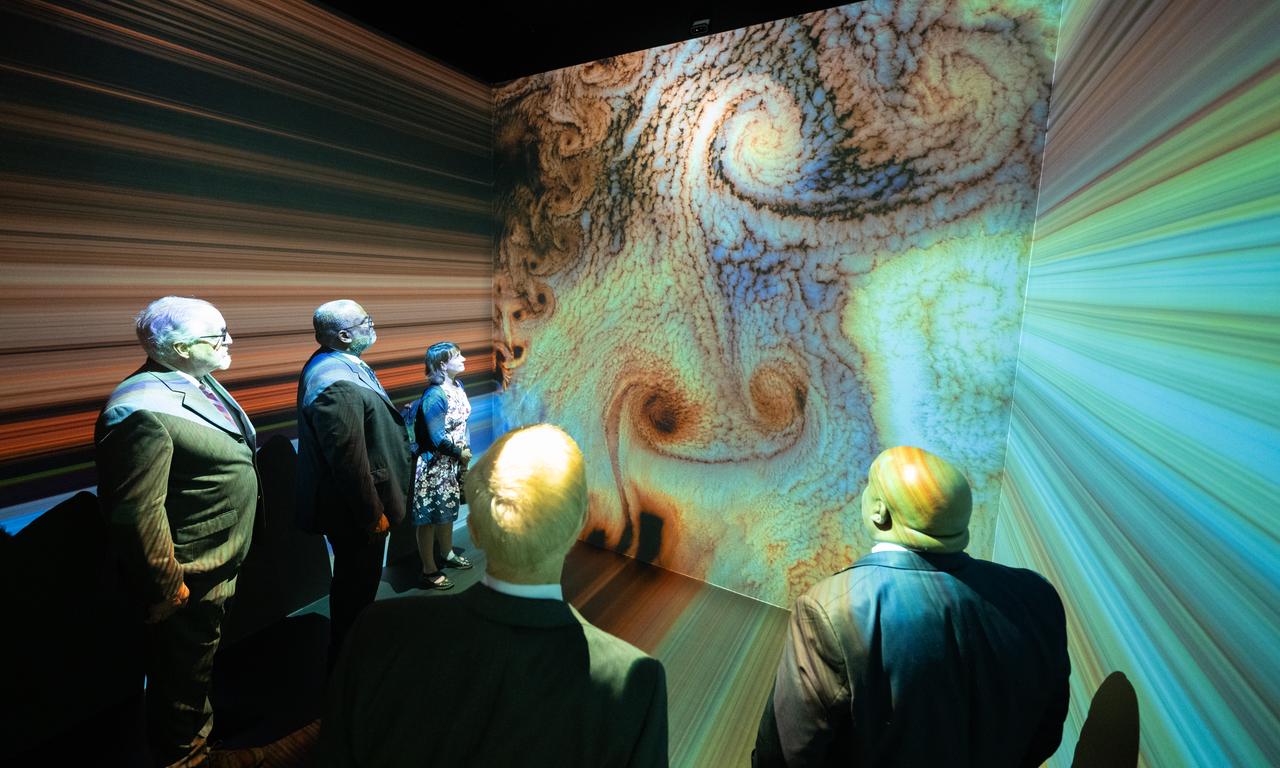
NASA Administrator Bill Nelson, Michael Morgan, Assistant Secretary of Commerce for Environmental Observation and Prediction at the National Oceanic and Atmospheric Administration (NOAA), Marlen Eve, Deputy Administrator for the Agricultural Research Service at the U.S. Department of Agriculture (USDA), and Eric Hooks, Deputy Administrator of the Federal Emergency Management Agency (FEMA), are seen as they watch “Space for Earth,” the immersive audio-visual installation in NASA’s Earth Information Center, following the ribbon cutting ceremony, Wednesday, June 21, 2023, at the Mary W. Jackson NASA Headquarters building in Washington. The Earth Information Center is new immersive experience that combines live data sets with cutting-edge data visualization and storytelling to allow visitors to see how our planet is changing. Photo Credit: (NASA/Joel Kowsky)
KENNEDY SPACE CENTER, FLA. - An X-band radar is installed on the U.S. Naval Ship Hayes at Port Canaveral in Florida to support the July 1 launch of Space Shuttle Discovery on mission STS-121. There are two Continuous Pulse Doppler X-band radars located on ships for the STS-121 launch. The other one is mounted on a booster recovery ship downrange of the launch site. The two radars provide velocity and differential Shuttle/debris motion information. Combined with the C-band radar located at the Haulover Canal near the launch site, they provide high definition images of any debris that might fall from the external tank/shuttle. The X-band data (screen captures) will be sent from the ships via satellite link to the National Center for Atmospheric Research site. Photo credit: NASA/Jim Grossmann
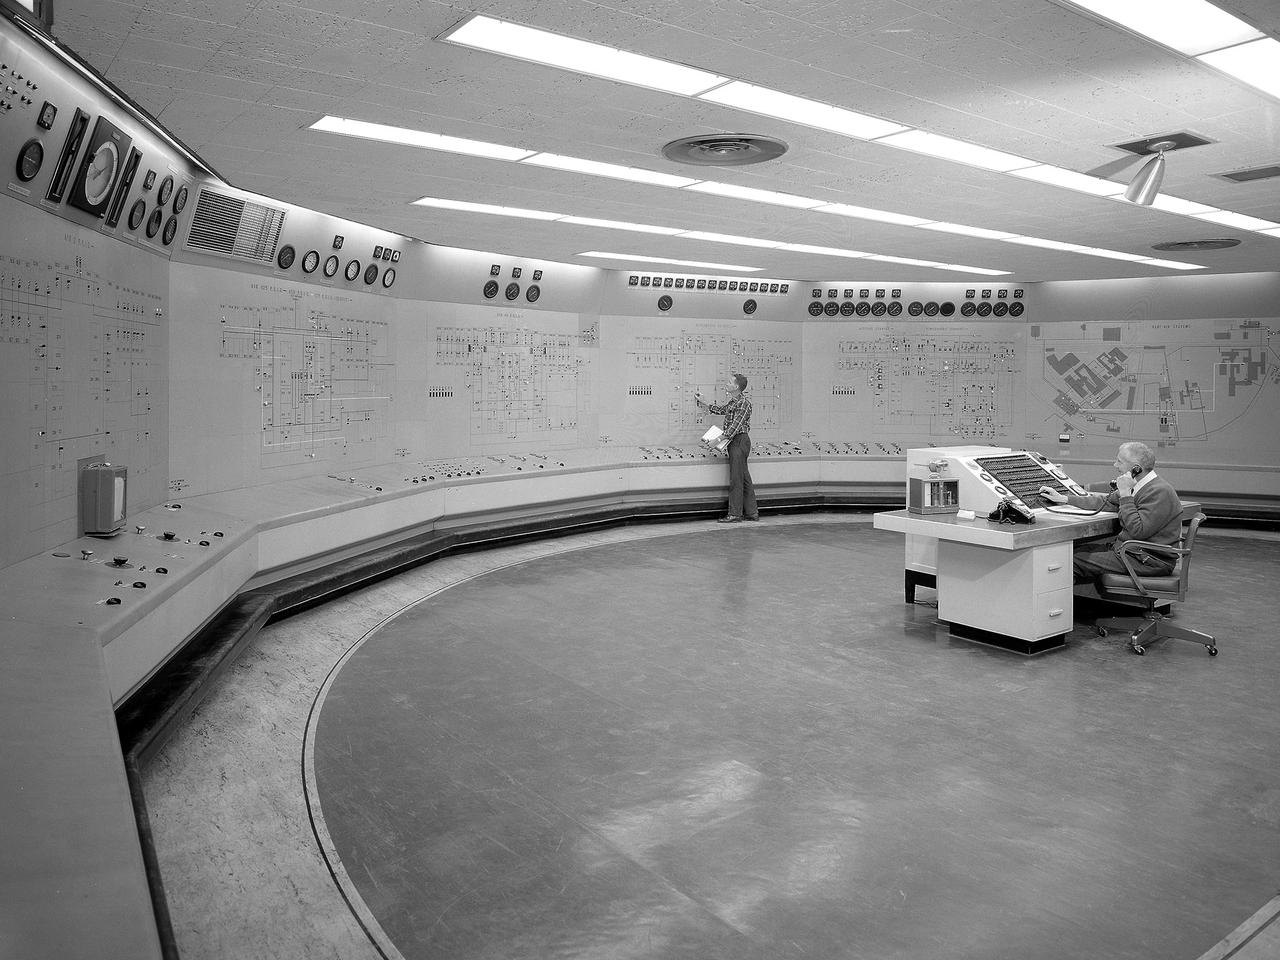
Operators in the Engine Research Building’s Central Control Room at the National Aeronautics and Space Administration (NASA) Lewis Research Center. The massive 4.25-acre Engine Research Building contains dozens of test cells, test stands, and altitude chambers. A powerful a collection of compressors and exhausters located in the central portion of the basement provides process air and exhaust for these test areas. This system is connected to similar process air systems in the laboratory’s other large test facilities. The Central Control Room coordinates this activity and communicates with the local utilities. The panels on the wall contain schematics with indicator lights and instrumentation for the atmospheric exhaust, altitude exhaust, refrigerated air, and process air systems. The process air equipment included twelve exhausters, four compressors, refrigeration system, cooling water, and an exhaust system. The operators in the control room kept in contact with engineers running the process air system and those conducting the tests in the test cells. The operators also coordinated with the local power companies to make sure enough electricity was available to operate the powerful compressors and exhausters.
ER-2 flyover at L.A. County Airshow, March 25, 2017. NASA will be working with the National Oceanic and Atmospheric Administration’s (NOAA) on their newest weather satellite, Geostationary Operational Environmental Satellite-R-series, or GOES-R, that launched into orbit Nov. 19. Now that it has reached its final designated orbit, GOES-R will be known operationally as GOES-16. The ER-2 will help NOAA calibrate sensors and validate data transmitted down from the satellite. The formal ER-2 science flights will take place between March and Mary of 2017 in two phases; during phase one, flights will be operated from the aircraft's normal base of operations at NASA Armstrong Flight Research Center’s Building 703. Phase two flights will be based out of Warner Robbins Air Force Base in Georgia, where thunderstorm conditions can be more easily found and observed.
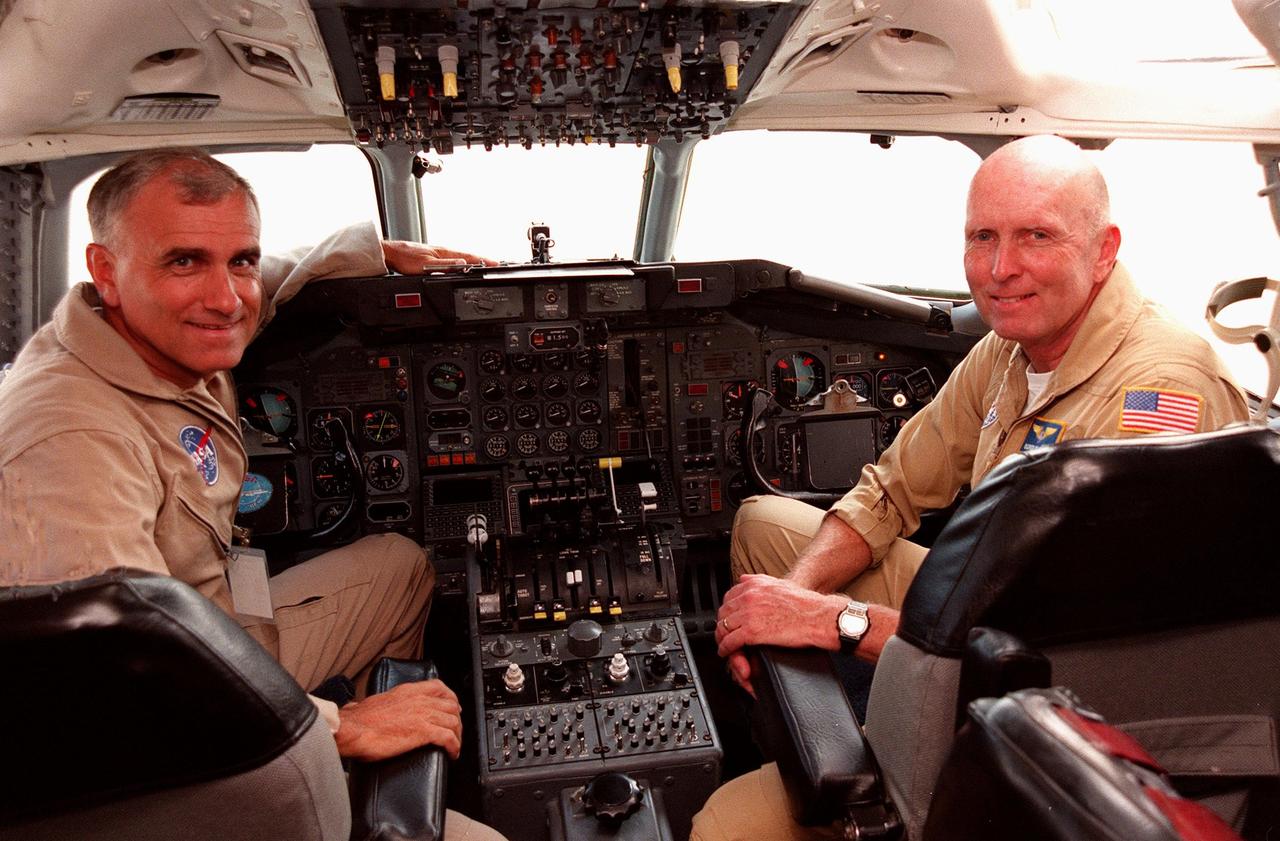
NASA pilots Dick Ewens and Gordon Fullerton sit at the controls in the cockpit of the Dryden Flight Research Center DC-8 that was on view at Patrick Air Force Base. The DC-8 is one of two aircraft being flown in a hurricane study through September to learn about the storms from top to bottom. Flying at 35,000 to 40,000 feet, the DC-8 is equipped with instruments to measure a hurricane’s structure, environment and changes in intensity and tracking. The other plane, a modified U2, and the DC-8 will fly in conjunction with scheduled storm flights of the National Oceanic and Atmospheric Administration (NOAA) out of MacDill Air Force Base in Tampa and the U.S. Air Force 53rd Weather Reconnaissance Squadron from Keesler Air Force Base, Miss. The study is part of NASA’s Earth Science enterprise to better understand the total Earth system and the effects of natural and human-induced changes on the global environment

NASA climatologist Gary Jedlovec, a member of the Earth Science team in Marshall Space Flight Center’s Science and Technology Office, discusses the satellite technology and ground-based tools used to record and trend regional and global climate changes over the past century and to provide forecast models looking 100 years into the future. Jedlovec and his team, which partners with National Oceanic and Atmospheric Association researchers and their colleagues around the world, spoke to the Marshall “Green Team” -- environmental engineers and support personnel who help guide Marshall’s focus on safer, more cost-efficient energy use. The Green Team, led by Marshall Sustainability Engineer Donna Leach of the Environmental Engineering & Occupational Health Office, currently is preparing activities and outreach for Earth Day 2020, set for next April.
![Astronaut Neil Armstrong examines a Vertical and Short Takeoff and Landing test setup in the 9- by 15-Foot Low Speed Wind Tunnel at the National Aeronautics and Space Administration (NASA) Lewis Research Center. Armstrong spent February 6, 1970 at Lewis attending technical meetings and touring some facilities. Just six months after Armstrong had returned from the moon looming agency budget cuts were already a concern in his comments. He noted that NASA had to “find a balanced approach…and [make] aggressive use of available facilities.” Armstrong spent four months at the center as a research pilot in 1955. Armstrong had served as a Navy pilot during the Korean War then earned a degree in aeronautical engineering at Purdue University. He was recruited by Lewis while at Purdue and began at the center shortly after graduation. During his brief tenure in Cleveland Armstrong served as both a test pilot and research engineer, primarily involved with icing research. In his role as research pilot Armstrong also flew a North American F-82 Twin Mustang over the ocean near Wallops Island to launch small instrumented rockets from high altitudes down into the atmosphere to obtain high Mach numbers. After four months in Cleveland a position opened up at what is today the Dryden Flight Research Center. Armstrong’s career in Cleveland officially ended on June 30, 1955.](https://images-assets.nasa.gov/image/GRC-1970-C-00473/GRC-1970-C-00473~medium.jpg)
Astronaut Neil Armstrong examines a Vertical and Short Takeoff and Landing test setup in the 9- by 15-Foot Low Speed Wind Tunnel at the National Aeronautics and Space Administration (NASA) Lewis Research Center. Armstrong spent February 6, 1970 at Lewis attending technical meetings and touring some facilities. Just six months after Armstrong had returned from the moon looming agency budget cuts were already a concern in his comments. He noted that NASA had to “find a balanced approach…and [make] aggressive use of available facilities.” Armstrong spent four months at the center as a research pilot in 1955. Armstrong had served as a Navy pilot during the Korean War then earned a degree in aeronautical engineering at Purdue University. He was recruited by Lewis while at Purdue and began at the center shortly after graduation. During his brief tenure in Cleveland Armstrong served as both a test pilot and research engineer, primarily involved with icing research. In his role as research pilot Armstrong also flew a North American F-82 Twin Mustang over the ocean near Wallops Island to launch small instrumented rockets from high altitudes down into the atmosphere to obtain high Mach numbers. After four months in Cleveland a position opened up at what is today the Dryden Flight Research Center. Armstrong’s career in Cleveland officially ended on June 30, 1955.
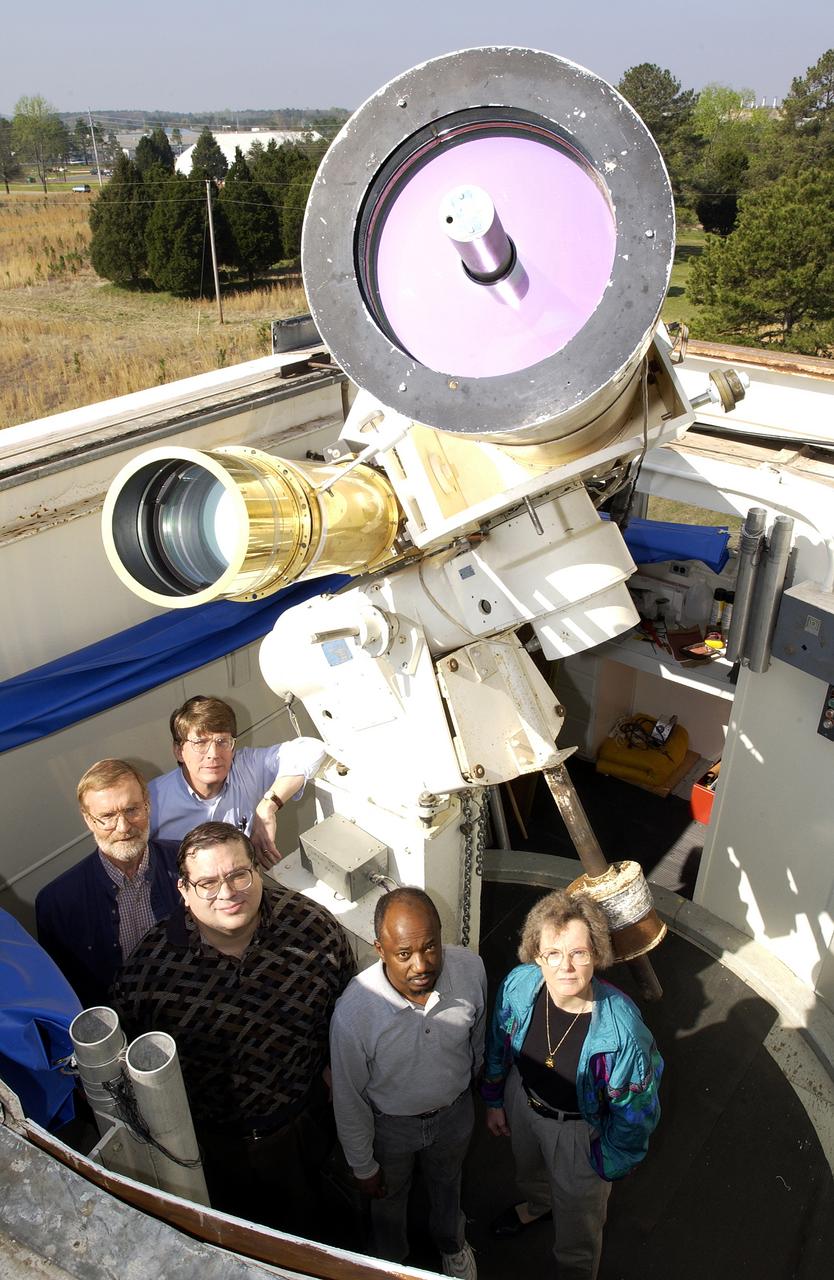
Using the Solar Vector Magnetograph, a solar observation facility at NASA's Marshall Space Flight Center (MSFC), scientists from the National Space Science and Technology Center (NSSTC) in Huntsville, Alabama, are monitoring the explosive potential of magnetic areas of the Sun. This effort could someday lead to better prediction of severe space weather, a phenomenon that occurs when blasts of particles and magnetic fields from the Sun impact the magnetosphere, the magnetic bubble around the Earth. When massive solar explosions, known as coronal mass ejections, blast through the Sun's outer atmosphere and plow toward Earth at speeds of thousands of miles per second, the resulting effects can be harmful to communication satellites and astronauts outside the Earth's magnetosphere. Like severe weather on Earth, severe space weather can be costly. On the ground, magnetic storms wrought by these solar particles can knock out electric power. Photographed are a group of contributing researchers in front of the Solar Vector Magnetograph at MSFC. The researchers are part of NSSTC's solar physics group, which develops instruments for measuring magnetic fields on the Sun. With these instruments, the group studies the origin, structure, and evolution of the solar magnetic fields and the impact they have on Earth's space environment.
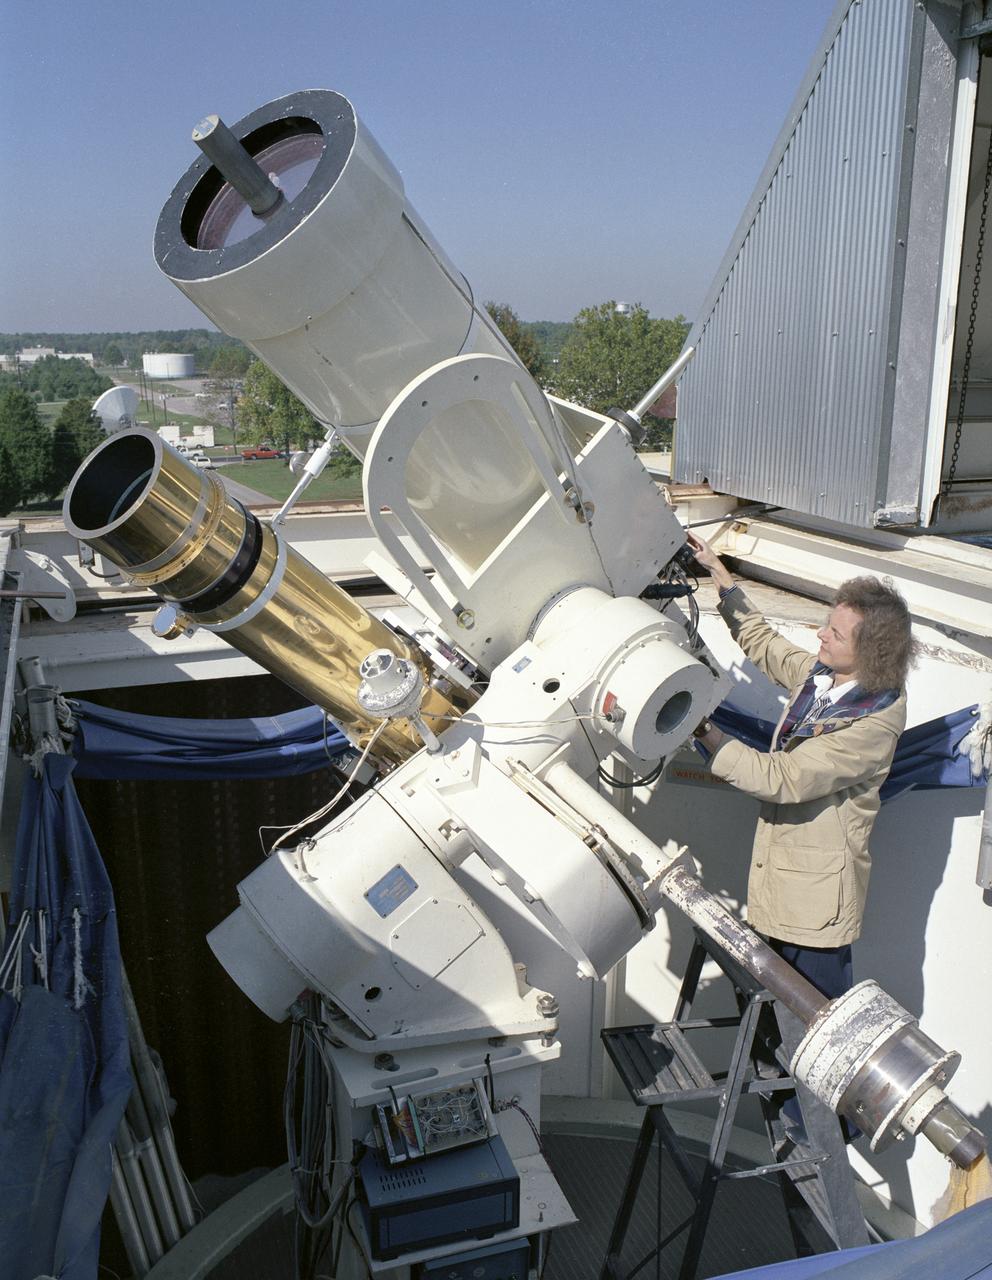
Using the Solar Vector Magnetograph, a solar observation facility at NASA's Marshall Space Flight Center (MSFC), scientists from the National Space Science and Technology Center (NSSTC) in Huntsville, Alabama, are monitoring the explosive potential of magnetic areas of the Sun. This effort could someday lead to better prediction of severe space weather, a phenomenon that occurs when blasts of particles and magnetic fields from the Sun impact the magnetosphere, the magnetic bubble around the Earth. When massive solar explosions, known as coronal mass ejections, blast through the Sun's outer atmosphere and plow toward Earth at speeds of thousands of miles per second, the resulting effects can be harmful to communication satellites and astronauts outside the Earth's magnetosphere. Like severe weather on Earth, severe space weather can be costly. On the ground, the magnetic storm wrought by these solar particles can knock out electric power. The researchers from MSFC and NSSTC's solar physics group develop instruments for measuring magnetic fields on the Sun. With these instruments, the group studies the origin, structure, and evolution of the solar magnetic field and the impact it has on Earth's space environment. This photograph shows the Solar Vector Magnetograph and Dr. Mona Hagyard of MSFC, the director of the observatory who leads the development, operation and research program of the Solar Vector Magnetograph.
Aerial view of the 8- by 6-Foot Supersonic Wind Tunnel in its original configuration at the National Advisory Committee for Aeronautics (NACA) Lewis Flight Propulsion Laboratory. The 8- by 6 was the laboratory’s first large supersonic wind tunnel. It was also the NACA’s most powerful supersonic tunnel, and its first facility capable of running an engine at supersonic speeds. The 8- by 6-foot tunnel has been used to study inlets and exit nozzles, fuel injectors, flameholders, exit nozzles, and controls on ramjet and turbojet propulsion systems. The 8- by 6 was originally an open-throat and non-return tunnel. This meant that the supersonic air flow was blown through the test section and out the other end into the atmosphere. In this photograph, the three drive motors in the structure at the left supplied power to the seven-stage axial-flow compressor in the light-colored structure. The air flow passed through flexible walls which were bent to create the desired speed. The test article was located in the 8- by 6-foot stainless steel test section located inside the steel pressure chamber at the center of this photograph. The tunnel dimensions were then gradually increased to slow the air flow before it exited into the atmosphere. The large two-story building in front of the tunnel was used as office space for the researchers.
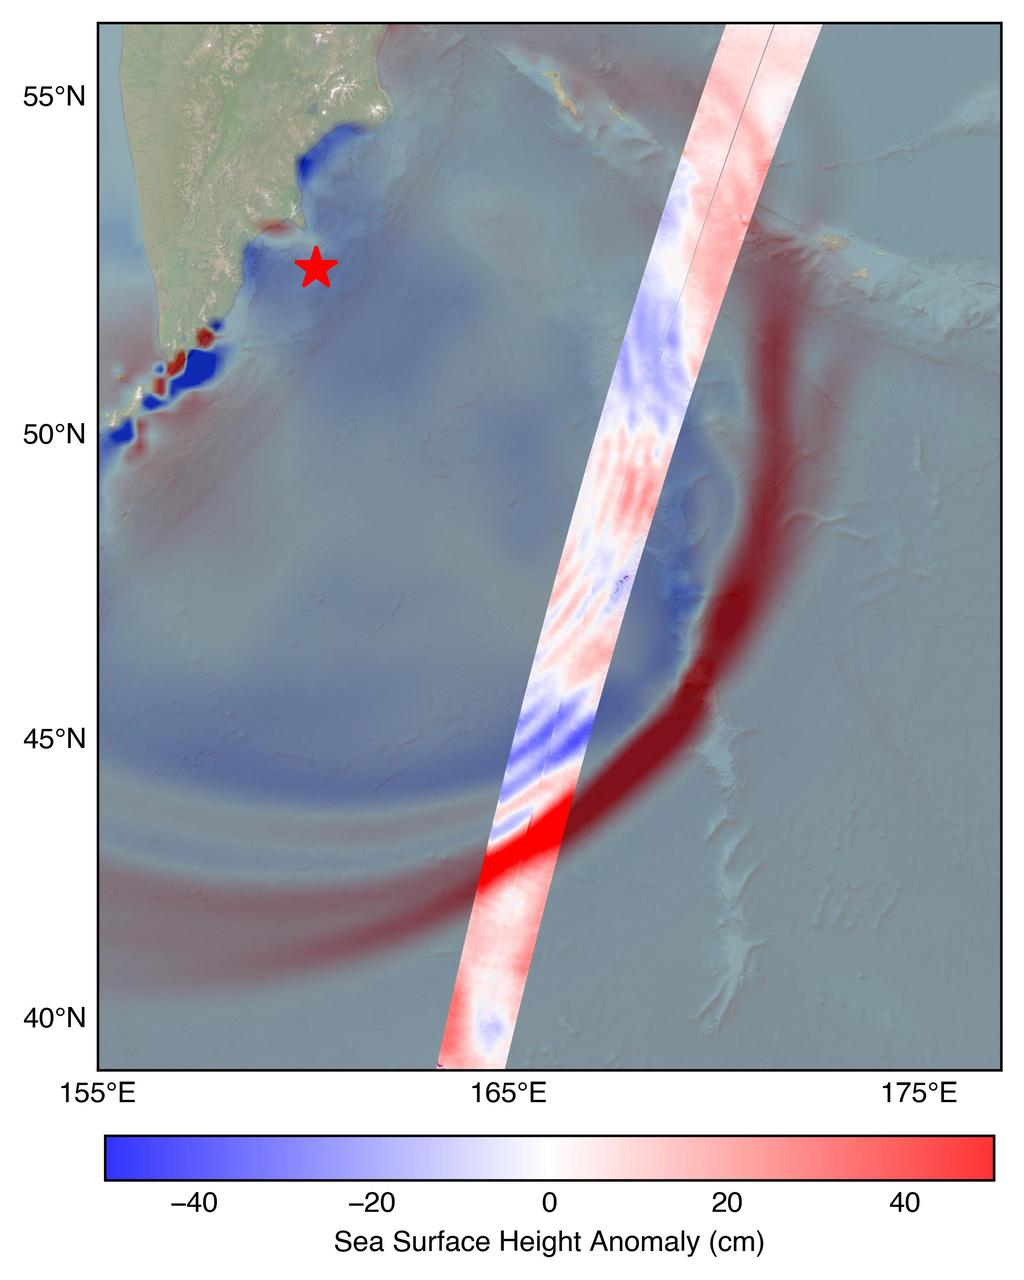
The U.S.-French SWOT (Surface Water and Ocean Topography) satellite captured the leading edge of a tsunami wave that rolled through the Pacific Ocean on July 30, 2025 (11:25 a.m. local time), in the wake of a magnitude 8.8 earthquake that struck Russia's Kamchatka Peninsula. The satellite captured the data about 70 minutes after the earthquake struck. The SWOT sea level measurements, shown in the highlighted swath from the satellite's ground track, is plotted against a tsunami forecast model from the National Oceanic and Atmospheric Administration (NOAA) Center for Tsunami Research in the background. A red star marks the location of the earthquake. The measurements show a wave height exceeding 1.5 feet (45 centimeters) as well as a look at the shape and direction of travel of the leading edge of the wave (indicated in red). Researchers noted that while the wave height might seem small, tsunamis extend from the seafloor to the ocean surface. A seemingly small wave in the open ocean can become much larger in shallower coastal waters. https://photojournal.jpl.nasa.gov/catalog/PIA26652
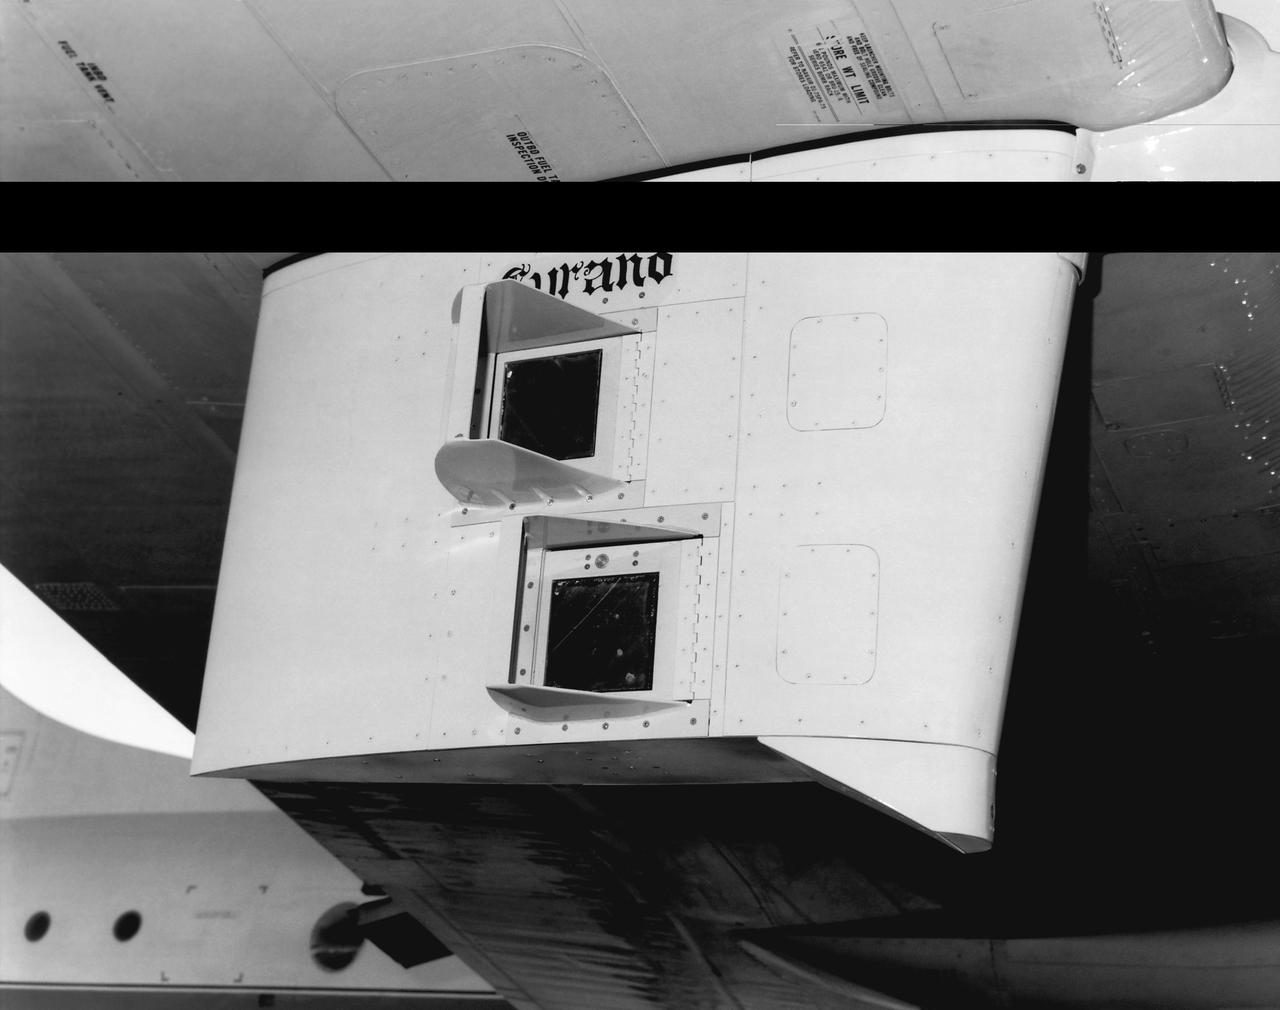
This photo shows the Shuttle tile flight test fixture under the wing of a National Oceanographic and Atmospheric Administration WP-3D aircraft.
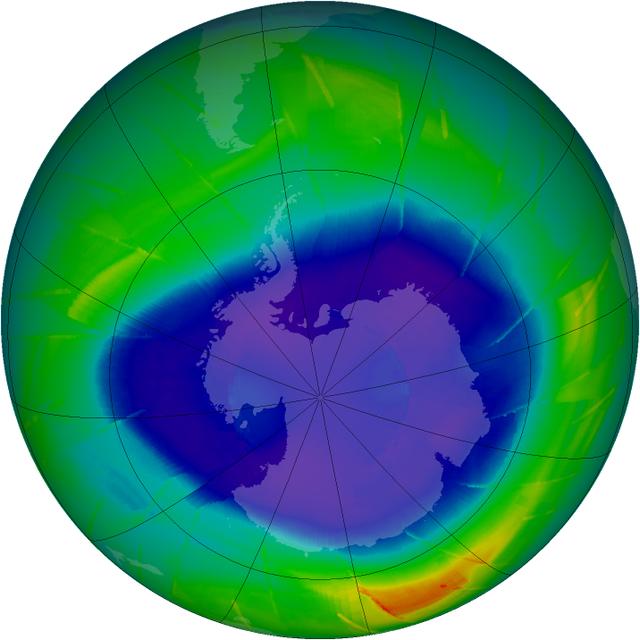
The annual ozone hole has started developing over the South Pole, and it appears that it will be comparable to ozone depletions over the past decade. This composite image from September 10 depicts ozone concentrations in Dobson units, with purple and blues depicting severe deficits of ozone. "We have observed the ozone hole again in 2009, and it appears to be pretty average so far," said ozone researcher Paul Newman of NASA's Goddard Space Flight Center in Greenbelt, Md. "However, we won't know for another four weeks how this year's ozone hole will fully develop." Scientists are tracking the size and depth of the ozone hole with observations from the Ozone Monitoring Instrument on NASA's Aura spacecraft, the Global Ozone Monitoring Experiment on the European Space Agency's ERS-2 spacecraft, and the Solar Backscatter Ultraviolet instrument on the National Oceanic and Atmospheric Administration's NOAA-16 satellite. The depth and area of the ozone hole are governed by the amount of chlorine and bromine in the Antarctic stratosphere. Over the southern winter, polar stratospheric clouds (PSCs) form in the extreme cold of the atmosphere, and chlorine gases react on the cloud particles to release chlorine into a form that can easily destroy ozone. When the sun rises in August after months of seasonal polar darkness, the sunlight heats the clouds and catalyzes the chemical reactions that deplete the ozone layer. The ozone hole begins to grow in August and reaches its largest area in late September to early October. Recent observations and several studies have shown that the size of the annual ozone hole has stabilized and the level of ozone-depleting substances has decreased by 4 percent since 2001. But since chlorine and bromine compounds have long lifetimes in the atmosphere, a recovery of atmospheric ozone is not likely to be noticeable until 2020 or later. Visit NASA's Ozone Watch page for current imagery and data: <a href="http://ozonewatch.gsfc.nasa.gov/index.html" rel="nofollow">ozonewatch.gsfc.nasa.gov/index.html</a>
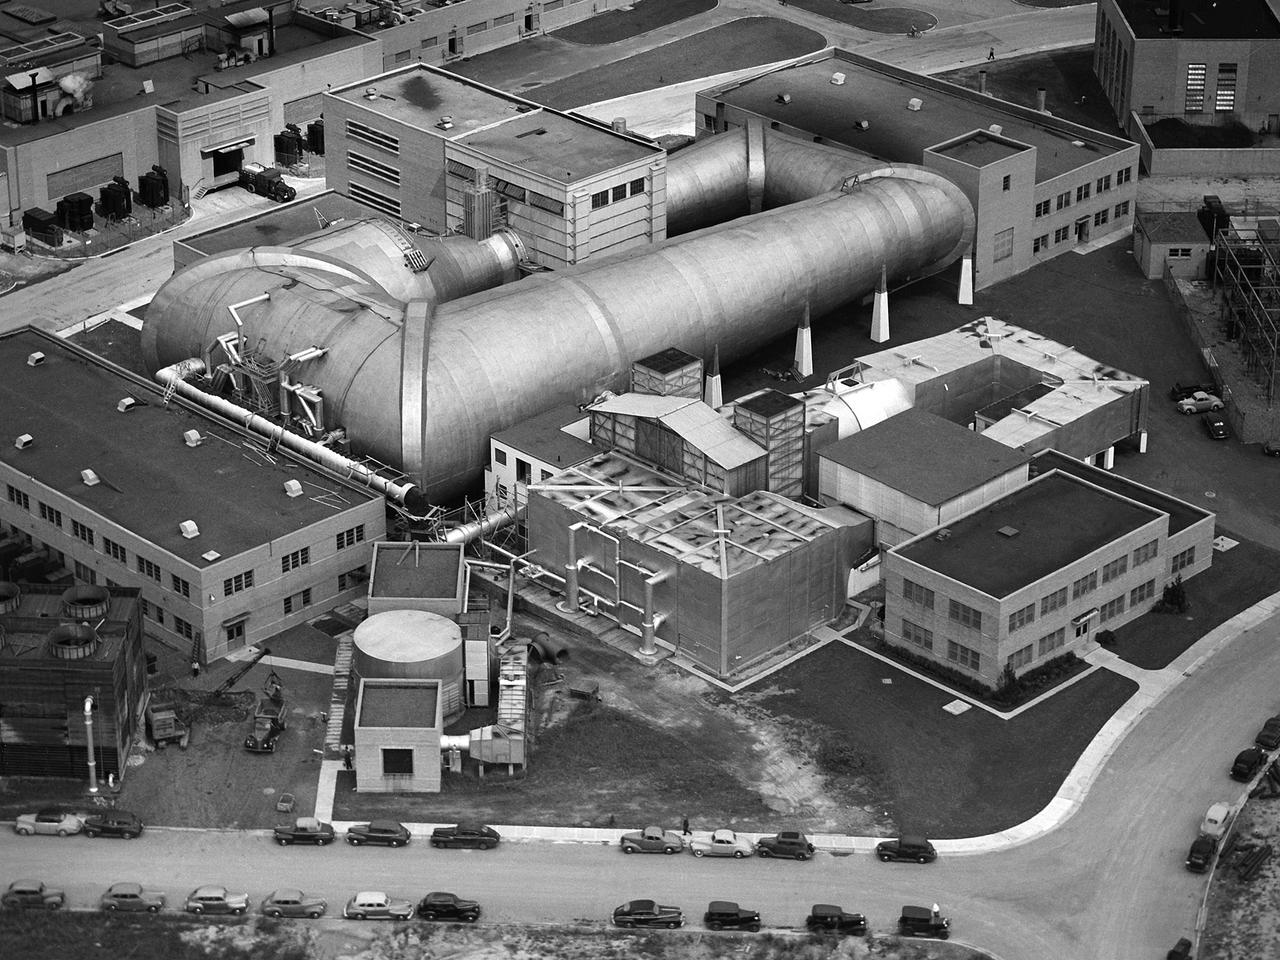
This aerial photograph shows the entire original wind tunnel complex at the National Advisory Committee for Aeronautics (NACA) Aircraft Engine Research Laboratory. The large Altitude Wind Tunnel (AWT) at the center of the photograph dominates the area. The Icing Research Tunnel to the right was incorporated into the lab’s design to take advantage of the AWT’s powerful infrastructure. The laboratory’s first supersonic wind tunnel was added to this complex just prior to this September 1945 photograph. The AWT was the nation’s only wind tunnel capable of studying full-scale engines in simulated flight conditions. The AWT’s test section and control room were within the two-story building near the top of the photograph. The exhauster equipment used to thin the airflow and the drive motor for the fan were in the building to the right of the tunnel. The unique refrigeration equipment was housed in the structure to the left of the tunnel. The Icing Research Tunnel was an atmospheric tunnel that used the AWT’s refrigeration equipment to simulate freezing rain inside its test section. A spray bar system inside the tunnel was originally used to create the droplets. The 18- by 18-inch supersonic wind tunnel was built in the summer of 1945 to take advantage of the AWT’s powerful exhaust system. It was the lab’s first supersonic tunnel and could reach Mach 1.91. Eventually the building would house three small supersonic tunnels, referred to as the “stack tunnels” because of the vertical alignment. The two other tunnels were added to this structure in 1949 and 1951.
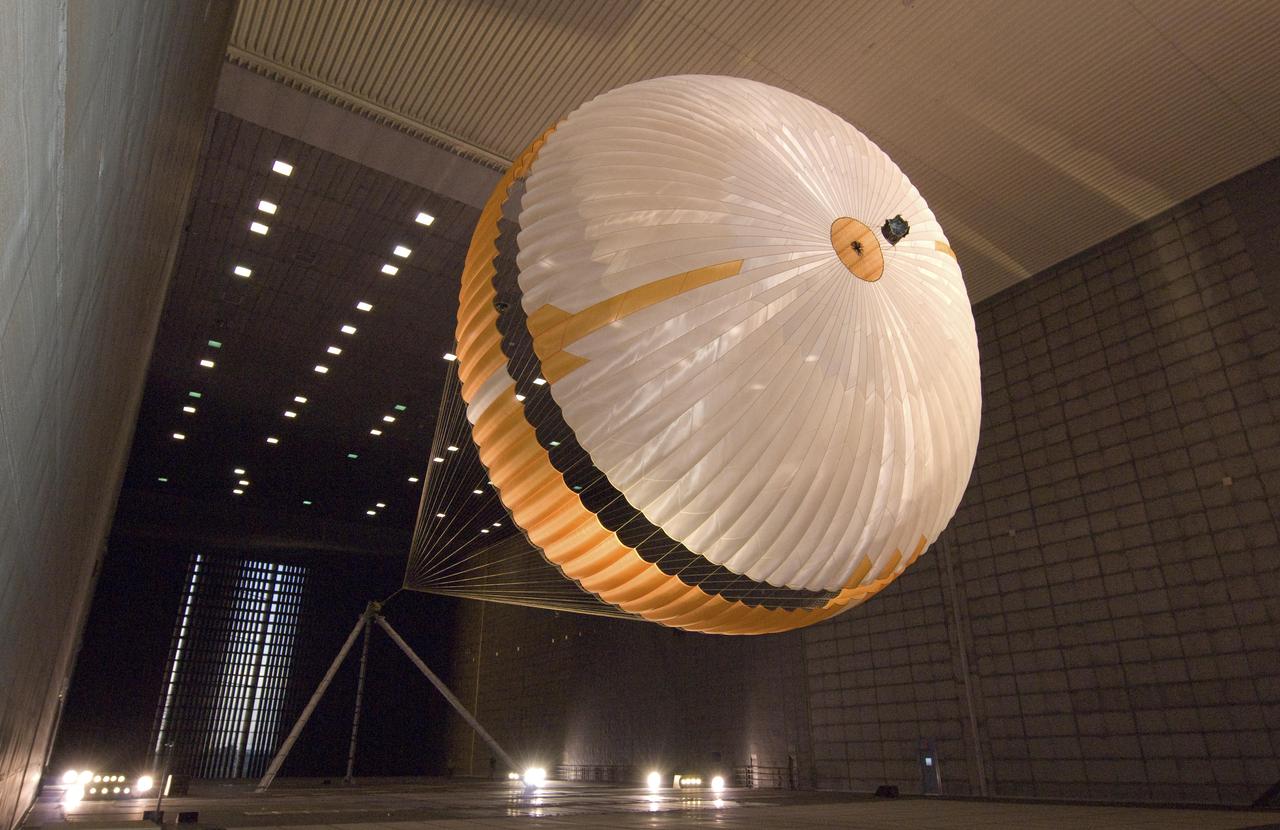
The parachute for NASA next mission to Mars passed flight-qualification testing in March and April 2009 inside the world largest wind tunnel, at NASA Ames Research Center, Moffett Field, Calif. NASA's Mars Science Laboratory mission, to be launched in 2011 and land on Mars in 2012, will use the largest parachute ever built to fly on an extraterrestrial mission. This image shows a duplicate qualification-test parachute inflated in an 80-mile-per-hour (36-meter-per-second) wind inside the test facility. The parachute uses a configuration called disk-gap-band. It has 80 suspension lines, measures more than 50 meters (165 feet) in length, and opens to a diameter of nearly 16 meters (51 feet). Most of the orange and white fabric is nylon, though a small disk of heavier polyester is used near the vent in the apex of the canopy due to higher stresses there. It is designed to survive deployment at Mach 2.2 in the Martian atmosphere, where it will generate up to 65,000 pounds of drag force. The wind tunnel is 24 meters (80 feet) tall and 37 meters (120 feet) wide, big enough to house a Boeing 737. It is part of the National Full-Scale Aerodynamics Complex, operated by the Arnold Engineering Development Center of the U.S. Air Force. http://photojournal.jpl.nasa.gov/catalog/PIA11995

NASA release July 27, 2011 These jets, known as spicules, were captured in an SDO image on April 25, 2010. Combined with the energy from ripples in the magnetic field, they may contain enough energy to power the solar wind that streams from the sun toward Earth at 1.5 million miles per hour. Credit: NASA/SDO/AIA Like giant strands of seaweed some 32,000 miles high, material shooting up from the sun sways back and forth with the atmosphere. In the ocean, it's moving water that pulls the seaweed along for a ride; in the sun's corona, magnetic field ripples called Alfvén waves cause the swaying. For years these waves were too difficult to detect directly, but NASA's Solar Dynamics Observatory (SDO) is now able to track the movements of this solar "seaweed" and measure how much energy is carried by the Alfvén waves. The research shows that the waves carry more energy than previously thought, and possibly enough to drive two solar phenomena whose causes remain points of debate: the intense heating of the corona to some 20 times hotter than the sun's surface and solar winds that blast up to 1.5 million miles per hour. "SDO has amazing resolution so you can actually see individual waves," says Scott McIntosh at the National Center for Atmospheric Research in Boulder, Colo. "Now we can see that instead of these waves having about 1000th the energy needed as we previously thought, it has the equivalent of about 1100W light bulb for every 11 square feet of the sun's surface, which is enough to heat the sun's atmosphere and drive the solar wind." To read more go to: <a href="http://www.nasa.gov/mission_pages/sdo/news/alfven-waves.html" rel="nofollow">www.nasa.gov/mission_pages/sdo/news/alfven-waves.html</a> <b><a href="http://www.nasa.gov/centers/goddard/home/index.html" rel="nofollow">NASA Goddard Space Flight Center</a></b> enables NASA’s mission through four scientific endeavors: Earth Science, Heliophysics, Solar System Exploration, and Astrophysics. Goddard plays a leading role in NASA’s accomplishments by contributing compelling scientific knowledge to advance the Agency’s mission. <b>Follow us on <a href="http://twitter.com/NASA_GoddardPix" rel="nofollow">Twitter</a></b> <b>Like us on <a href="http://www.facebook.com/pages/Greenbelt-MD/NASA-Goddard/395013845897?ref=tsd" rel="nofollow">Facebook</a></b> <b>Find us on <a href="http://web.stagram.com/n/nasagoddard/?vm=grid" rel="nofollow">Instagram</a></b>
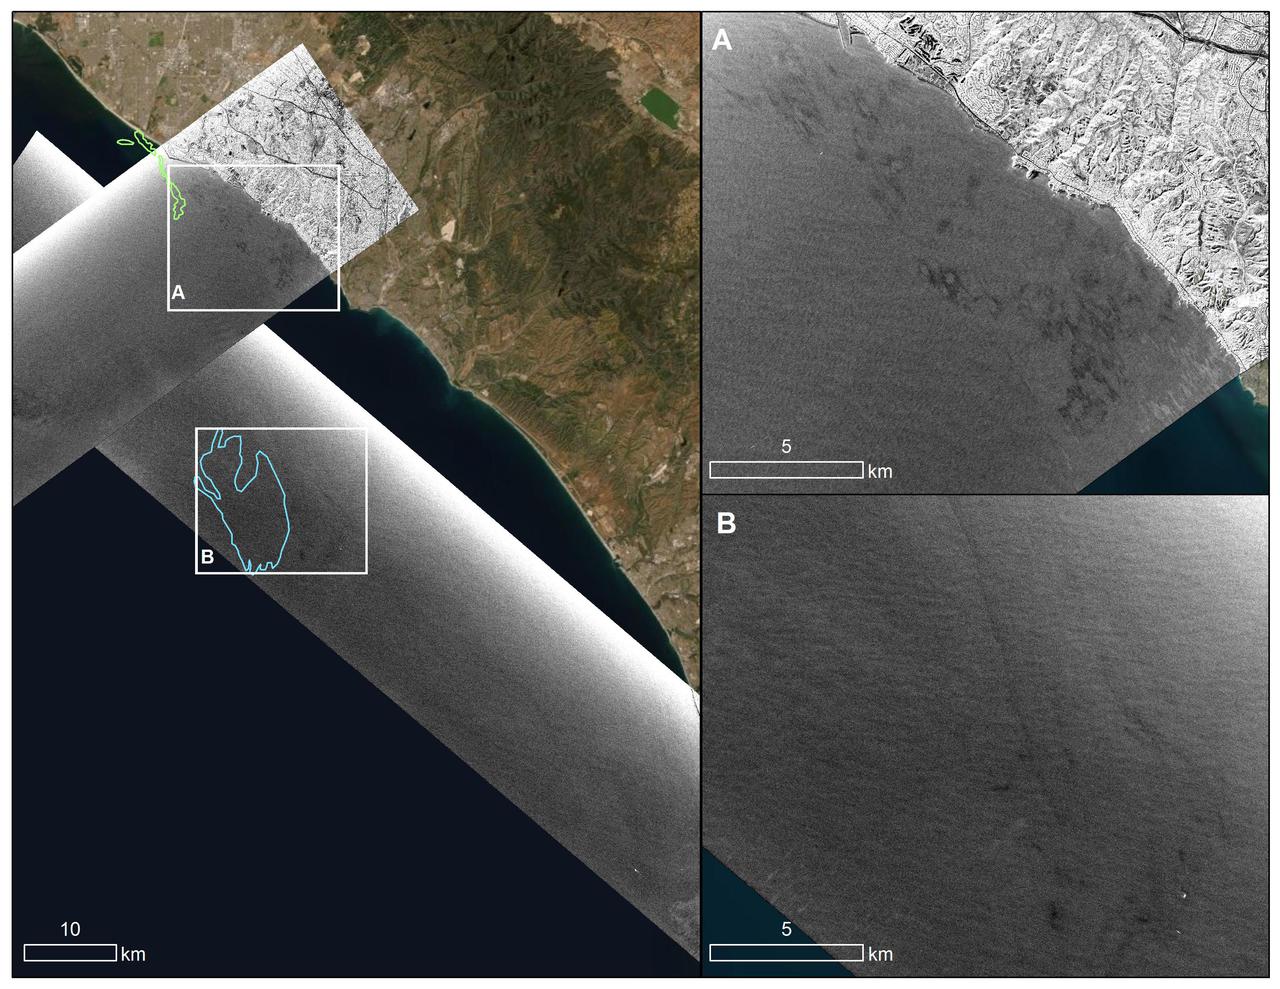
An oil spill off the Southern California coast – first reported to the U.S. Coast Guard on Oct. 2, 2021 – prompted an effort by NASA's Applied Sciences Disasters Program to determine what NASA resources and capabilities could be available to support response efforts for the spill. As part of those efforts, a team from NASA's Jet Propulsion Laboratory in Southern California flew an airplane equipped with an instrument known as the Uninhabited Aerial Vehicle Synthetic Aperture Radar (UAVSAR) over the spill area on Oct. 6 to corroborate the presence and location of oil slicks. Mapping the location of oil slicks and determining how thick the oil is can also help with clean-up activities. The JPL researchers collected the UAVSAR data in support of the National Oceanic and Atmospheric Administration (NOAA), which regularly monitors U.S. coastal waters for potential spills. This image shows a composite of two images taken during passes (grayscale regions) made by the UAVSAR instrument off the coast of Huntington Beach. Dark smudges off the coast in the close-up images to the right (labeled A and B) are potential oil slicks – NOAA researchers will analyze the data to look for the presence of oil. The area outlined in light green (image on the left) was identified by NOAA using satellite data as a region possibly containing oil on Oct.3, while the blue outline shows an area on Oct. 6 that could also contain oil. Attached to the bottom of a Gulfstream-III based at NASA's Armstrong Flight Research Center near Palmdale, California, UAVSAR is an all-weather tool that bounces radar signals off of Earth's surface. Repeated images of the same areas, taken at different times, enable scientists to detect changes in those regions. The radar signals will reflect differently off of different surfaces, including oil and seawater. These signal variations can tell researchers about the presence of an oil slick in the ocean, and in some cases provide information about its thickness. https://photojournal.jpl.nasa.gov/catalog/PIA23782
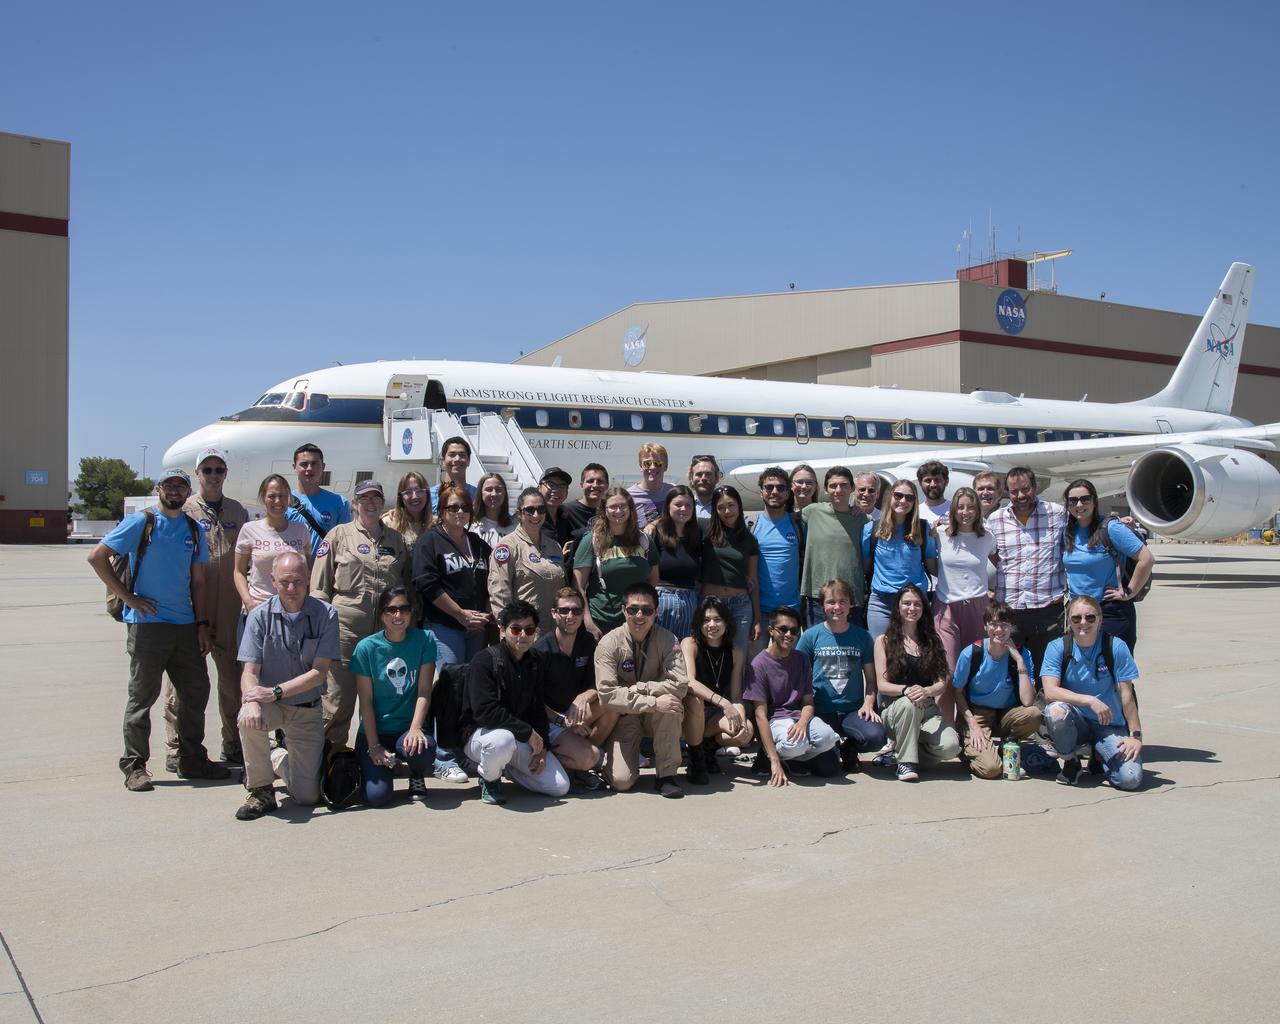
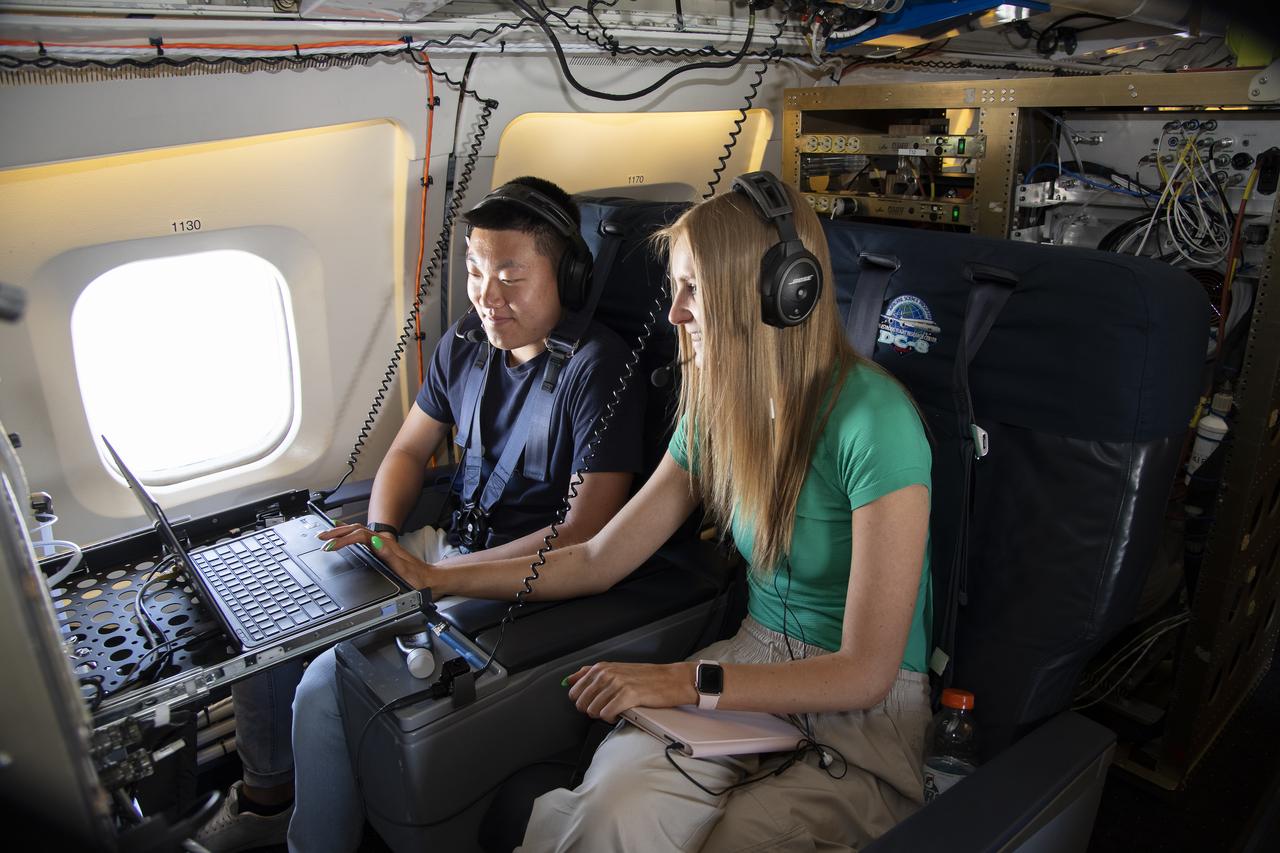
NASA Armstrong’s Student Airborne Research Program celebrates 15 years of success in 2023. An eight-week summer internship program, SARP offers upper-level undergraduate students the opportunity to acquire hands-on research experience as part of a scientific campaign using NASA Airborne Science Program flying science laboratories—aircraft outfitted specifically for research projects. Students onboard NASA’s DC-8 aircraft, the largest flying science laboratory in the world, help scientists from NOAA, the National Oceanic and Atmospheric Administration with a science project investigating air quality and non-vehicular pollution sources called AEROMMA, which measures Atmospheric Emissions and Reactions Observed from Megacities to Marine Areas. In 2023, NASA also introduced a sister program, SARP East to complement the West Coast program.
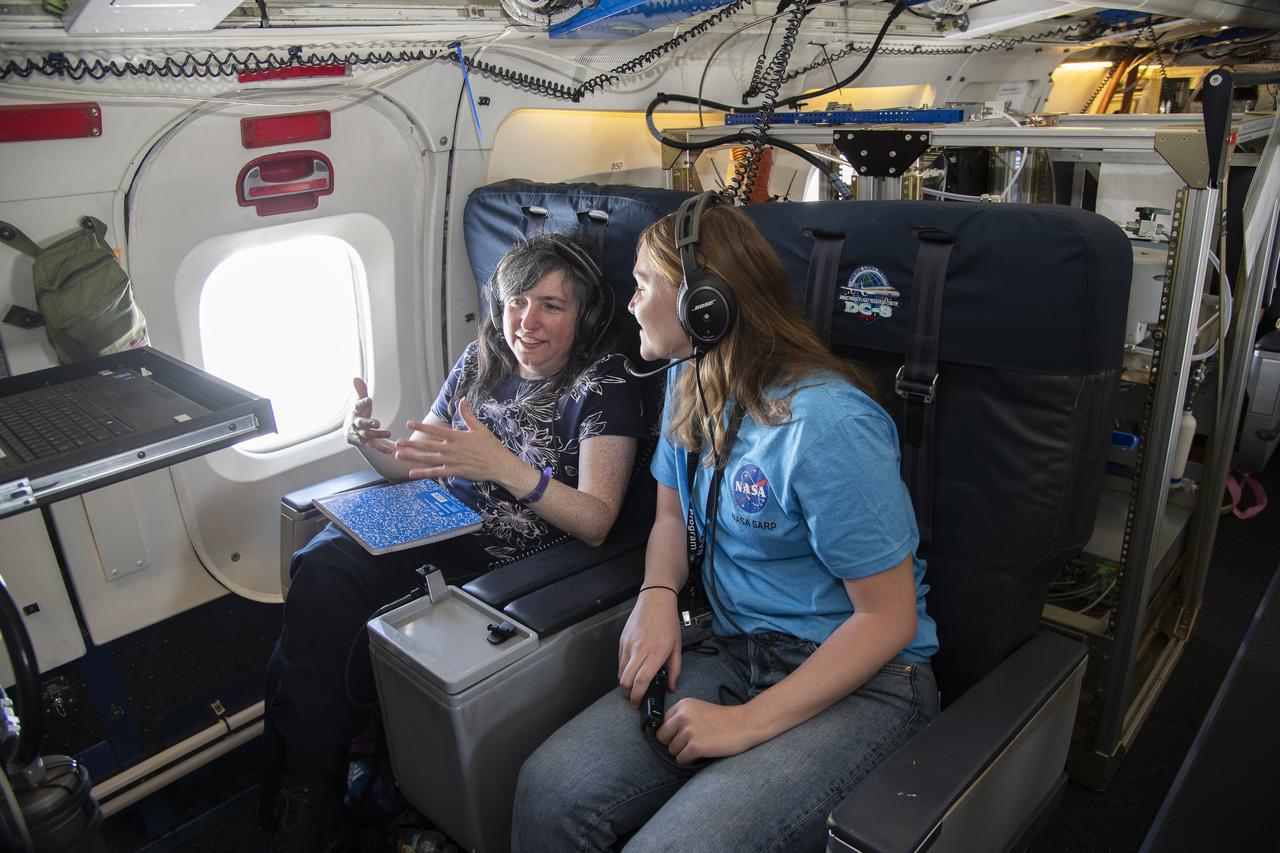
NASA Armstrong’s Student Airborne Research Program celebrates 15 years of success in 2023. An eight-week summer internship program, SARP offers upper-level undergraduate students the opportunity to acquire hands-on research experience as part of a scientific campaign using NASA Airborne Science Program flying science laboratories—aircraft outfitted specifically for research projects. Students onboard NASA’s DC-8 aircraft, the largest flying science laboratory in the world, help scientists from NOAA, the National Oceanic and Atmospheric Administration with a science project investigating air quality and non-vehicular pollution sources called AEROMMA, which measures Atmospheric Emissions and Reactions Observed from Megacities to Marine Areas. In 2023, NASA also introduced a sister program, SARP East to complement the West Coast program.
NASA Armstrong’s Student Airborne Research Program celebrates 15 years of success in 2023. An eight-week summer internship program, SARP offers upper-level undergraduate students the opportunity to acquire hands-on research experience as part of a scientific campaign using NASA Airborne Science Program flying science laboratories—aircraft outfitted specifically for research projects. Students onboard NASA’s DC-8 aircraft, the largest flying science laboratory in the world, help scientists from NOAA, the National Oceanic and Atmospheric Administration with a science project investigating air quality and non-vehicular pollution sources called AEROMMA, which measures Atmospheric Emissions and Reactions Observed from Megacities to Marine Areas. In 2023, NASA also introduced a sister program, SARP East to complement the West Coast program.
NASA Armstrong’s Student Airborne Research Program celebrates 15 years of success in 2023. An eight-week summer internship program, SARP offers upper-level undergraduate students the opportunity to acquire hands-on research experience as part of a scientific campaign using NASA Airborne Science Program flying science laboratories—aircraft outfitted specifically for research projects. Students onboard NASA’s DC-8 aircraft, the largest flying science laboratory in the world, help scientists from NOAA, the National Oceanic and Atmospheric Administration with a science project investigating air quality and non-vehicular pollution sources called AEROMMA, which measures Atmospheric Emissions and Reactions Observed from Megacities to Marine Areas. In 2023, NASA also introduced a sister program, SARP East to complement the West Coast program.
NASA Armstrong’s Student Airborne Research Program celebrates 15 years of success in 2023. An eight-week summer internship program, SARP offers upper-level undergraduate students the opportunity to acquire hands-on research experience as part of a scientific campaign using NASA Airborne Science Program flying science laboratories—aircraft outfitted specifically for research projects. Students onboard NASA’s DC-8 aircraft, the largest flying science laboratory in the world, help scientists from NOAA, the National Oceanic and Atmospheric Administration with a science project investigating air quality and non-vehicular pollution sources called AEROMMA, which measures Atmospheric Emissions and Reactions Observed from Megacities to Marine Areas. In 2023, NASA also introduced a sister program, SARP East to complement the West Coast program.
NASA Armstrong’s Student Airborne Research Program celebrates 15 years of success in 2023. An eight-week summer internship program, SARP offers upper-level undergraduate students the opportunity to acquire hands-on research experience as part of a scientific campaign using NASA Airborne Science Program flying science laboratories—aircraft outfitted specifically for research projects. Students onboard NASA’s DC-8 aircraft, the largest flying science laboratory in the world, help scientists from NOAA, the National Oceanic and Atmospheric Administration with a science project investigating air quality and non-vehicular pollution sources called AEROMMA, which measures Atmospheric Emissions and Reactions Observed from Megacities to Marine Areas. In 2023, NASA also introduced a sister program, SARP East to complement the West Coast program.
NASA Armstrong’s Student Airborne Research Program celebrates 15 years of success in 2023. An eight-week summer internship program, SARP offers upper-level undergraduate students the opportunity to acquire hands-on research experience as part of a scientific campaign using NASA Airborne Science Program flying science laboratories—aircraft outfitted specifically for research projects. Students onboard NASA’s DC-8 aircraft, the largest flying science laboratory in the world, help scientists from NOAA, the National Oceanic and Atmospheric Administration with a science project investigating air quality and non-vehicular pollution sources called AEROMMA, which measures Atmospheric Emissions and Reactions Observed from Megacities to Marine Areas. In 2023, NASA also introduced a sister program, SARP East to complement the West Coast program.

NASA Armstrong’s Student Airborne Research Program celebrates 15 years of success in 2023. An eight-week summer internship program, SARP offers upper-level undergraduate students the opportunity to acquire hands-on research experience as part of a scientific campaign using NASA Airborne Science Program flying science laboratories—aircraft outfitted specifically for research projects. Students onboard NASA’s DC-8 aircraft, the largest flying science laboratory in the world, help scientists from NOAA, the National Oceanic and Atmospheric Administration with a science project investigating air quality and non-vehicular pollution sources called AEROMMA, which measures Atmospheric Emissions and Reactions Observed from Megacities to Marine Areas. In 2023, NASA also introduced a sister program, SARP East to complement the West Coast program.
Preparations for a shroud jettison test for the Orbiting Astronomical Observatory-1 (OAO-1) satellite in the Space Power Chambers facility at the National Aeronautics and Space Administration (NASA) Lewis Research Center. The satellite was to be launched on an Atlas-Agena rocket in the spring of 1966. The 3900-pound payload was the heaviest ever attempted by Agena. The satellite was the first of three equipped with powerful telescopes to study ultraviolet data from specific stars and galaxies. In-depth observations were not possible from Earth-bound telescopes because of the filtering and distortion of the atmosphere. The OAO-1 satellite was wider in diameter than the Agena stage, so a new clamshell shroud was created to enclose both the satellite and the Agena. The clamshell shroud consisted of three sections that enclosed both the Agena and OAO-1: a fiberglass nose fairing and aluminum mid and aft fairings. The upper two fairings separated when the Atlas engines stopped, and the aft fairing fell away with the Atlas upon separation from the upper stages The large altitude tank in the Space Power Chambers could simulate altitudes up to 100,000 feet. Three shroud jettison tests were run in July 1965 and the first week of August at a simulated altitude of 20 miles. The April 8, 1966 launch from Cape Canaveral went smoothly, but the OAO-1 satellite failed after only 90 minutes due to a battery failure.
Setup of a Surveyor/Atlas/Centaur shroud in the Space Power Chambers for a leak test at the National Aeronautics and Space Administration (NASA) Lewis Research Center. Centaur was a 15,000-pound thrust second-stage rocket designed for the military in 1957 and 1958 by General Dynamics. It was the first major rocket to use the liquid hydrogen technology developed by Lewis in the 1950s. The Centaur Program suffered numerous problems before being transferred to Lewis in 1962. Several test facilities at Lewis’ main campus and Plum Brook Station were built or modified specifically for Centaur, including the Space Power Chambers. In 1961, NASA Lewis management decided to convert its Altitude Wind Tunnel into two large test chambers and later renamed it the Space Power Chambers. The conversion, which took over 2 years, included the removal of the tunnel’s internal components and insertion of bulkheads to seal off the new chambers. The larger chamber, seen here, could simulate altitudes of 100,000 feet. It was used for Centaur shroud separation and propellant management studies until the early 1970s. The leak test in this photograph was likely an attempt to verify that the shroud’s honeycomb shell did not seep any of its internal air when the chamber was evacuated to pressures similar to those found in the upper atmosphere.
A mechanic at the National Aeronautics and Space Administration (NASA) Lewis Research Center prepares the inverted base of a Mercury capsule for a test of its posigrade retrorockets inside the Altitude Wind Tunnel. In October 1959 NASA’s Space Task Group allocated several Project Mercury assignments to Lewis. The Altitude Wind Tunnel was modified to test the Atlas separation system, study the escape tower rocket plume, train astronauts to bring a spinning capsule under control, and calibrate the capsule’s retrorockets. The turning vanes, makeup air pipes, and cooling coils were removed from the wide western end of the tunnel to create a 51-foot diameter test chamber. The Mercury capsule had a six-rocket retro-package affixed to the bottom of the capsule. Three of these were posigrade rockets used to separate the capsule from the booster and three were retrograde rockets used to slow the capsule for reentry into the earth’s atmosphere. Performance of the retrorockets was vital since there was no backup system. Qualification tests of the retrorockets began in April 1960 on a retrograde thrust stand inside the southwest corner of the Altitude Wind Tunnel. These studies showed that a previous issue concerning the delayed ignition of the propellant had been resolved. Follow-up test runs verified reliability of the igniter’s attachment to the propellant. In addition, the capsule’s retrorockets were calibrated so they would not alter the capsule’s attitude when fired.
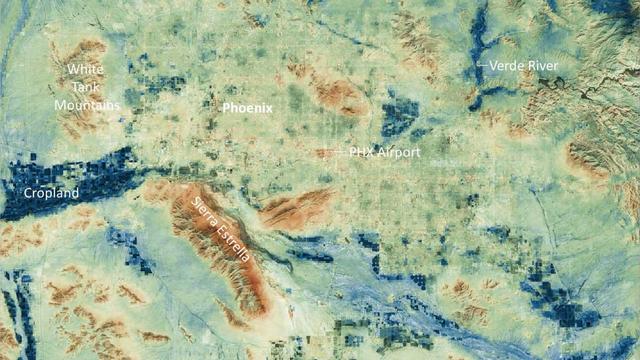
Researchers at NASA's Jet Propulsion Laboratory have created a series of maps showing land-surface temperatures in the Phoenix area in July 2023, when the city experienced a record-breaking run of hot weather. The images reveal the cumulative effect – overnight and across the month – of relentless daytime heating. The data was captured during overnight hours (around 2 a.m.) on several days in July by an instrument called the Visible Infrared Imaging Radiometer Suite (VIIRS) aboard the NOAA-NASA Suomi National Polar-orbiting Partnership (Suomi NPP) satellite managed by the National Oceanic and Atmospheric Administration and NASA. The images show how built surfaces – roads, buildings, airport runways, and the like – retain heat, sometimes hovering around 100 degrees Fahrenheit (38 degrees Celsius) for hours after sunset. From July 1 to July 19, the built surfaces in the maps grew progressively hotter, likely the combined effect of the heat wave intensifying and the cumulative heating of those human-made structures. Due to their high heat capacity, these surfaces didn't fully cool overnight before the onset of the next day's heat. At the center of the images is Phoenix's Sky Harbor International Airport, where VIIRS measured the hottest land-surface temperature within the city. The airport is also where Phoenix takes its official air temperature. By those measurements, the city experienced the hottest month on record in July, including a record 31 consecutive days in which the temperature exceeded 110 degrees Fahrenheit (43.3 degrees Celsius). The previous record was 18 days. Land-surface temperatures in cities are usually warmer than in rural and undeveloped areas because of human activities and the materials used for building. Streets – seen in these maps as a grid pattern – are often the hottest part of the built environment due to dark asphalt paving that absorbs more sunlight than lighter-colored surfaces; asphalt absorbs up to 95% of solar radiation. In the images, the mountains near Phoenix are also notably hot due to their angle to the Sun and greater soil exposure from lack of vegetation. The hot surfaces in and around the city stand in contrast to nearby irrigated surfaces such as agricultural fields, golf courses, and parks, which fell as low as 68 degrees Fahrenheit (18.9 degrees Celsius) during the night. The Verde River and other nearby waterways also were significantly cooler. VIIRS is one of five instruments aboard the NOAA-NASA Suomi NPP satellite. Short for Suomi National Polar-orbiting Partnership, the spacecraft is one of several in the Joint Polar Satellite System. The images were produced from the VNP21IMG Land Surface Temperature product, which is available at NASA's Land, Atmosphere Near-real-time Capability for EOS (LANCE). Animation available at https://photojournal.jpl.nasa.gov/catalog/PIA25868
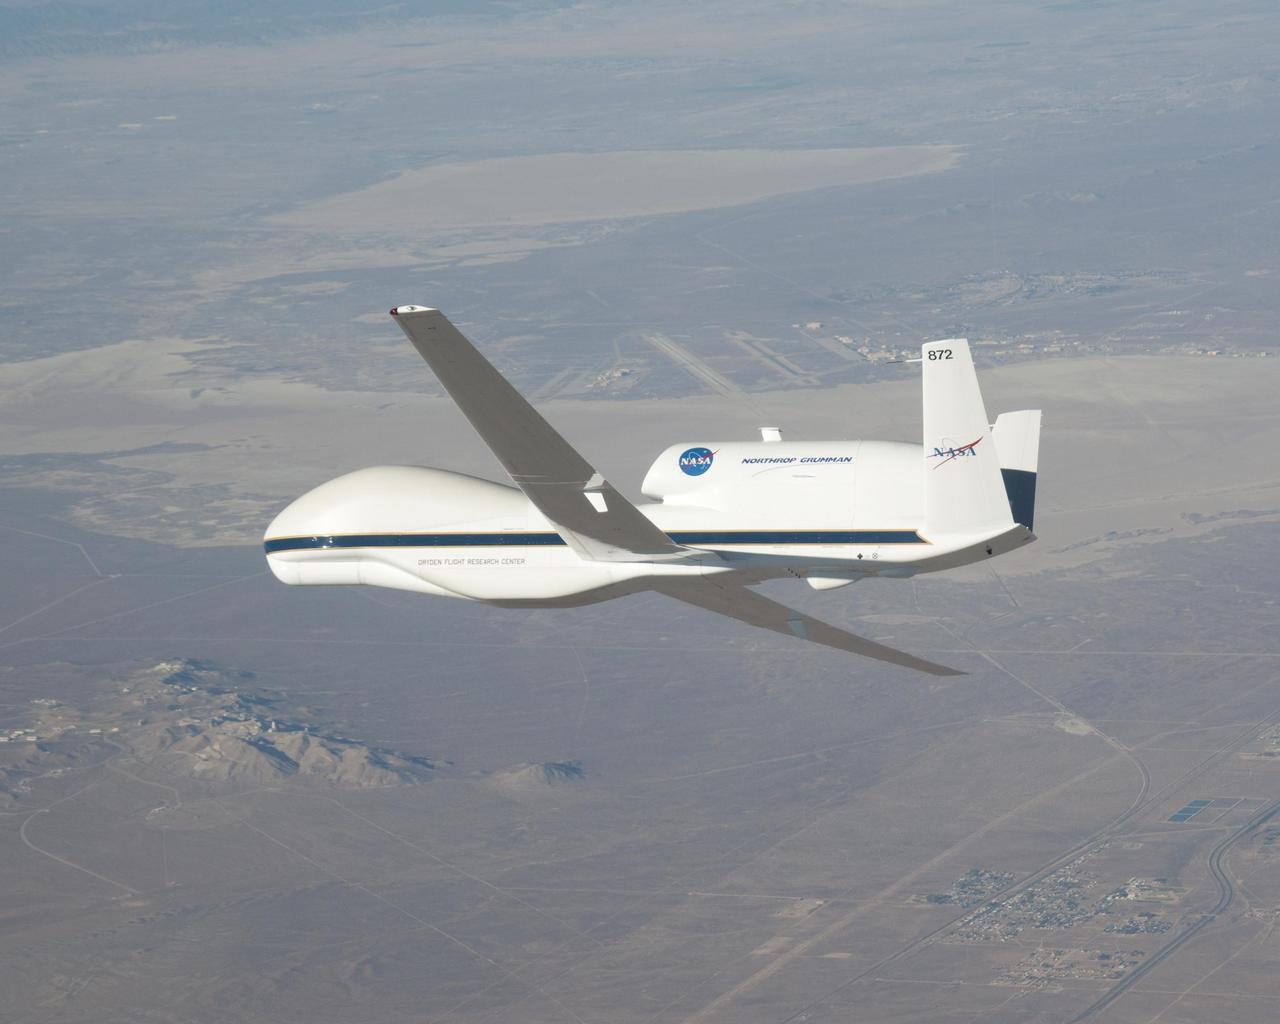
NASA image acquired October 23, 2009. At NASA’s Dryden Research Center in California, a group of engineers, scientists, and aviation technicians have set up camp in a noisy, chilly hangar on Edwards Air Force base. For the past two weeks, they have been working to mount equipment—from HD video cameras to ozone sensors—onto NASA’s Global Hawk, a remote-controlled airplane that can fly for up to 30 hours at altitudes up to 65,000 feet. The team is gearing up for the Global Hawk Pacific campaign, a series of four or five scientific research flights that will take the Global Hawk over the Pacific Ocean and Arctic regions. The 44-foot-long aircraft, with its comically large nose and 116-foot wingspan is pictured in the photograph above, banking for landing over Rogers Dry Lake in California at the end of a test flight on October 23, 2009. The long wings carry the plane’s fuel, and the bulbous nose is one of the payload bays, which house the science instruments. For the Global Hawk Pacific campaign, the robotic aircraft will carry ten science instruments that will sample the chemical composition of air in the troposphere (the atmospheric layer closest to Earth) and the stratosphere (the layer above the troposphere). The mission will also observe clouds and aerosol particles in the troposphere. The primary purpose of the mission is to collect observations that can be used to check the accuracy of simultaneous observations collected by NASA’s Aura satellite. Co-lead scientist Paul Newman from Goddard Space Flight Center is writing about the ground-breaking mission for the Earth Observatory’s Notes from the Field blog. NASA Photograph by Carla Thomas. <b><a href="http://www.nasa.gov/centers/goddard/home/index.html" rel="nofollow">NASA Goddard Space Flight Center</a></b> is home to the nation's largest organization of combined scientists, engineers and technologists that build spacecraft, instruments and new technology to study the Earth, the sun, our solar system, and the universe. To learn more about this image go to: <a href="http://earthobservatory.nasa.gov/IOTD/view.php?id=43291" rel="nofollow">earthobservatory.nasa.gov/IOTD/view.php?id=43291</a>
Technicians prepare the Space Electric Research Test (SERT-I) payload for a test in Tank Number 5 of the Electric Propulsion Laboratory at the National Aeronautics and Space Administration (NASA) Lewis Research Center. Lewis researchers had been studying different methods of electric rocket propulsion since the mid-1950s. Harold Kaufman created the first successful engine, the electron bombardment ion engine, in the early 1960s. These electric engines created and accelerated small particles of propellant material to high exhaust velocities. Electric engines have a very small amount of thrust, but once lofted into orbit by workhorse chemical rockets, they are capable of small, continuous thrust for periods up to several years. The electron bombardment thruster operated at a 90-percent efficiency during testing in the Electric Propulsion Laboratory. The package was rapidly rotated in a vacuum to simulate its behavior in space. The SERT-I mission, launched from Wallops Island, Virginia, was the first flight test of Kaufman’s ion engine. SERT-I had one cesium engine and one mercury engine. The suborbital flight was only 50 minutes in duration but proved that the ion engine could operate in space. The Electric Propulsion Laboratory included two large space simulation chambers, one of which is seen here. Each uses twenty 2.6-foot diameter diffusion pumps, blowers, and roughing pumps to remove the air inside the tank to create the thin atmosphere. A helium refrigeration system simulates the cold temperatures of space.
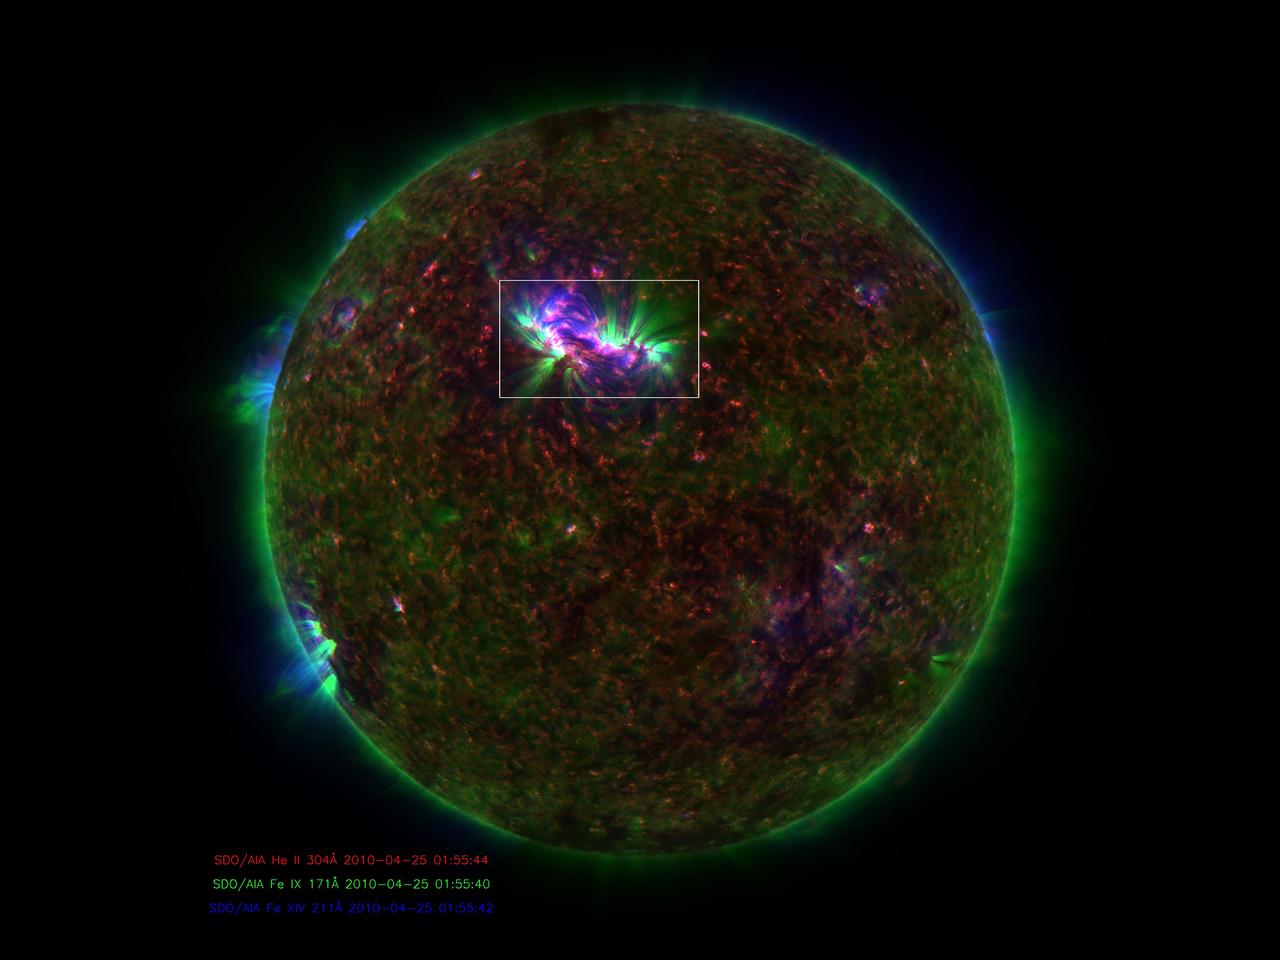
NASA image release January 6, 2010 Caption: Spicules on the sun, as observed by the Solar Dynamics Observatory. These bursts of gas jet off the surface of the sun at 150,000 miles per hour and contain gas that reaches temperatures over a million degrees. GREENBELT, Md. -- Observations from NASA's Solar Dynamics Observatory (SDO) and the Japanese satellite Hinode show that some gas in the giant, fountain-like jets in the sun's atmosphere known as spicules can reach temperatures of millions of degrees. The finding offers a possible new framework for how the sun's high atmosphere gets so much hotter than the surface of the sun. What makes the high atmosphere, or corona, so hot – over a million degrees, compared to the sun surface's 10,000 degrees Fahrenheit -- remains a poorly understood aspect of the sun's complicated space weather system. That weather system can reach Earth, causing auroral lights and, if strong enough, disrupting Earth's communications and power systems. Understanding such phenomena, therefore, is an important step towards better protecting our satellites and power grids. "The traditional view is that all the heating happens higher up in the corona," says Dean Pesnell, who is SDO's project scientist at NASA's Goddard Space Flight Center in Greenbelt, Md. "The suggestion in this paper is that cool gas is being ejected from the sun's surface in spicules and getting heated on its way to the corona." Spicules were first named in the 1940s, but were hard to study in detail until recently, says Bart De Pontieu of Lockheed Martin's Solar and Astrophysics Laboratory, Palo Alto, Calif. who is the lead author on a paper on this subject in the January 7, 2011 issue of Science magazine. In visible light, spicules can be seen to send large masses of so-called plasma – the electromagnetic gas that surrounds the sun – up through the lower solar atmosphere or photosphere. The amount of material sent up is stunning, some 100 times as much as streams away from the sun in the solar wind towards the edges of the solar system. But nobody knew if they contained hot gas. "Heating of spicules to the necessary hot temperatures has never been observed, so their role in coronal heating had been dismissed as unlikely," says De Pontieu. Now, De Pontieu's team -- which included researchers at Lockheed Martin, the High Altitude Observatory of the National Center for Atmospheric Research (NCAR) in Colorado and the University of Oslo, Norway -- was able to combine images from SDO and Hinode to produce a more complete picture of the gas inside these gigantic fountains. The scientists found that a large fraction of the gas is heated to a hundred thousand degrees, while a small fraction is heated to millions of degrees. Time-lapsed images show that this material spews up into the corona, with most falling back down towards the surface of the sun. However, the small fraction of the gas that is heated to millions of degrees does not immediately return to the surface. Given the large number of spicules on the Sun, and the amount of material in the spicules, the scientists believe that if even some of that super hot plasma stays aloft it would make a contribution to coronal heating. Astrophysicist Jonathan Cirtain, who is the U.S. project scientist for Hinode at NASA's Marshall Space Flight Center, Huntsville, Ala., says that incorporating such new information helps address an important question that reaches far beyond the sun. "This breakthrough in our understanding of the mechanisms which transfer energy from the solar photosphere to the corona addresses one of the most compelling questions in stellar astrophysics: How is the atmosphere of a star heated?" he says. "This is a fantastic discovery, and demonstrates the muscle of the NASA Heliophysics System Observatory, comprised of numerous instruments on multiple observatories." Hinode is the second mission in NASA's Solar Terrestrial Probes program, the goal of which is to improve understanding of fundamental solar and space physics processes. The mission is led by the Japan Aerospace Exploration Agency (JAXA) and the National Astronomical Observatory of Japan (NAOJ). The collaborative mission includes the U.S., the United Kingdom, Norway and Europe. NASA Marshall manages Hinode U.S. science operations and oversaw development of the scientific instrumentation provided for the mission by NASA, academia and industry. The Lockheed Martin Advanced Technology Center is the lead U.S. investigator for the Solar Optical Telescope on Hinode. SDO is the first mission in a NASA science program called Living With a Star, the goal of which is to develop the scientific understanding necessary to address those aspects of the sun-Earth system that directly affect our lives and society. NASA Goddard built, operates, and manages the SDO spacecraft for NASA's Science Mission Directorate in Washington. To learn more go to: <a href="http://www.nasa.gov/mission_pages/sdo/news/news20110106-spicules.html" rel="nofollow">www.nasa.gov/mission_pages/sdo/news/news20110106-spicules...</a> Credit: NASA Goddard/SDO/AIA <b><a href="http://www.nasa.gov/centers/goddard/home/index.html" rel="nofollow">NASA Goddard Space Flight Center</a></b> enables NASA’s mission through four scientific endeavors: Earth Science, Heliophysics, Solar System Exploration, and Astrophysics. Goddard plays a leading role in NASA’s accomplishments by contributing compelling scientific knowledge to advance the Agency’s mission. <b>Follow us on <a href="http://twitter.com/NASA_GoddardPix" rel="nofollow">Twitter</a></b> <b>Join us on <a href="http://www.facebook.com/pages/Greenbelt-MD/NASA-Goddard/395013845897?ref=tsd" rel="nofollow">Facebook</a></b>
During a flight over the Pine Island Glacier ice shelf, the DC-8 banks over the Amundsen Sea and the clean edge of the ice shelf front. The shelf drops about 200 feet from its surface to sea level. This image was taken on Oct. 26, 2011. Credit: NASA/GSFC/Jefferson Beck NASA's Operation IceBridge returns to a base camp of Punta Arenas, Chile for the third year of flights over Antarctica's changing sea ice, glaciers and ice sheets. NASA's DC-8, outfitted with seven remote-sensing instruments, and a Gulfstream 5 operated by the National Science Foundation and National Center for Atmospheric Research and outfitted with a high-altitude laser-ranging mapper, will fly from Chile over Antarctica in October and November. The mission is designed to record changes to Antarctica's ice sheets and give scientists insight into what is driving those changes. Follow the progress of the mission: Campaign News site: <a href="http://www.nasa.gov/mission_pages/icebridge/index.html" rel="nofollow">www.nasa.gov/mission_pages/icebridge/index.html</a> IceBridge blog: <a href="http://blogs.nasa.gov/cm/newui/blog/viewpostlist.jsp?blogname=icebridge" rel="nofollow">blogs.nasa.gov/cm/newui/blog/viewpostlist.jsp?blogname=ic...</a> Twitter: @nasa_ice <b><a href="http://www.nasa.gov/audience/formedia/features/MP_Photo_Guidelines.html" rel="nofollow">NASA image use policy.</a></b> <b><a href="http://www.nasa.gov/centers/goddard/home/index.html" rel="nofollow">NASA Goddard Space Flight Center</a></b> enables NASA’s mission through four scientific endeavors: Earth Science, Heliophysics, Solar System Exploration, and Astrophysics. Goddard plays a leading role in NASA’s accomplishments by contributing compelling scientific knowledge to advance the Agency’s mission. <b>Follow us on <a href="http://twitter.com/NASA_GoddardPix" rel="nofollow">Twitter</a></b> <b>Like us on <a href="http://www.facebook.com/pages/Greenbelt-MD/NASA-Goddard/395013845897?ref=tsd" rel="nofollow">Facebook</a></b> <b>Find us on <a href="http://instagrid.me/nasagoddard/?vm=grid" rel="nofollow">Instagram</a></b>
Overnight on October 4-5, 2012, a mass of energetic particles from the atmosphere of the Sun were flung out into space, a phenomenon known as a coronal mass ejection. Three days later, the storm from the Sun stirred up the magnetic field around Earth and produced gorgeous displays of northern lights. NASA satellites track such storms from their origin to their crossing of interplanetary space to their arrival in the atmosphere of Earth. Using the “day-night band” (DNB) of the Visible Infrared Imaging Radiometer Suite (VIIRS), the Suomi National Polar-orbiting Partnership (Suomi NPP) satellite acquired this view of the aurora borealis early on the morning of October 8, 2012. The northern lights stretch across Canada’s Quebec and Ontario provinces in the image, and are part of the auroral oval that expanded to middle latitudes because of a geomagnetic storm. The DNB sensor detects dim light signals such as auroras, airglow, gas flares, city lights, and reflected moonlight. In the case of the image above, the sensor detected the visible light emissions as energetic particles rained down from Earth’s magnetosphere and into the gases of the upper atmosphere. The images are similar to those collected by the Operational Linescan System flown on U.S. Defense Meteorological Satellite Program (DMSP) satellites for the past three decades. “When I first saw images like this as a graduate student, I was immediately struck by the fluid dynamic characteristics of the aurora,” said Tom Moore, a space physicist at NASA's Goddard Space Flight Center. “Viewing the aurora in this way makes it immediately clear that space weather is an interaction of fluids from the Sun with those of the Earth's upper atmosphere. The electrodynamics make for important differences between plasmas and ordinary fluids, but familiar behaviors (for example, waves and vortices) are still very apparent. It makes me wonder at the ability of apparently empty space to behave like a fluid.” Auroras typically occur when solar flares and coronal mass ejections—or even an active solar wind stream—disturb and distort the magnetosphere, the cocoon of space protected by Earth’s magnetic field. The collision of solar particles and pressure into our planet’s magnetosphere accelerates particles trapped in the space around Earth (such as in the radiation belts). Those particles are sent crashing down into Earth’s upper atmosphere—at altitudes of 100 to 400 kilometers (60 to 250 miles)—where they excite oxygen and nitrogen molecules and release photons of light. The results are rays, sheets, and curtains of dancing light in the sky. Auroras are a beautiful expression of the connection between Sun and Earth, but not all of the connections are benign. Auroras are connected to geomagnetic storms, which can distort radio communications (particularly high frequencies), disrupt electric power systems on the ground, and give slight but detectable doses of radiation to flight crews and passengers on high-latitude airplane flights and on spacecraft. The advantage of images like those from VIIRS and DMSP is resolution, according to space physicist Patrick Newell of the Johns Hopkins University Applied Physics Laboratory. “You can see very fine detail in the aurora because of the low altitude and the high resolution of the camera,” he said. Most aurora scientists prefer to use images from missions dedicated to aurora studies (such as Polar, IMAGE, and ground-based imagers), which can offer many more images of a storm (rather than one per orbit) and can allow researchers to calculate the energy moving through the atmosphere. There are no science satellites flying right now that provide such a view, though astronauts regularly photograph and film auroras from the International Space Station. NASA Earth Observatory image by Jesse Allen and Robert Simmon, using VIIRS Day-Night Band data from the Suomi National Polar-orbiting Partnership (Suomi NPP) and the University of Wisconsin's Community Satellite Processing Package. Suomi NPP is the result of a partnership between NASA, the National Oceanic and Atmospheric Administration, and the Department of Defense. Caption by Mike Carlowicz. Instrument: Suomi NPP - VIIRS Credit: <b><a href="http://www.earthobservatory.nasa.gov/" rel="nofollow"> NASA Earth Observatory</a></b> <b><a href="http://www.nasa.gov/audience/formedia/features/MP_Photo_Guidelines.html" rel="nofollow">NASA image use policy.</a></b> <b><a href="http://www.nasa.gov/centers/goddard/home/index.html" rel="nofollow">NASA Goddard Space Flight Center</a></b> enables NASA’s mission through four scientific endeavors: Earth Science, Heliophysics, Solar System Exploration, and Astrophysics. Goddard plays a leading role in NASA’s accomplishments by contributing compelling scientific knowledge to advance the Agency’s mission. <b>Follow us on <a href="http://twitter.com/NASA_GoddardPix" rel="nofollow">Twitter</a></b> <b>Like us on <a href="http://www.facebook.com/pages/Greenbelt-MD/NASA-Goddard/395013845897?ref=tsd" rel="nofollow">Facebook</a></b> <b>Find us on <a href="http://instagrid.me/nasagoddard/?vm=grid" rel="nofollow">Instagram</a></b>
To commemorate the upcoming 10th anniversary of the DSCOVR (Deep Space Climate Observatory) mission, NASA’s Goddard Space Flight Center in Greenbelt, Md., hosted environmentalist and former Vice President Al Gore, shown here addressing a crowd in the Building 3 Harry J. Goett Auditorium, on Oct. 16, 2024. “The image of our Earth from space is the single most compelling iconic image that any of us have ever seen,” Gore said at a panel discussion for employees. “Now we have, thanks to DSCOVR, 50,000 ‘Blue Marble’ photographs … To date there are more than 100 peer-reviewed scientific publications that are based on the unique science gathered at the L1 point by DSCOVR. For all of the scientists who are here and those on the teams that are represented here, I want to say congratulations and thank you.” Following Gore’s talk on climate monitoring, Goddard scientists participated in a panel discussion, “Remote Sensing and the Future of Earth Observations,” which explored the latest advancements in technology that allow for the monitoring of the atmosphere from space and showcased how Goddard’s research drives the future of Earth science. Gore’s visit also entailed a meeting with the DSCOVR science team, a view into the clean room where Goddard is assembling the Roman Space Telescope, and a stop at the control center for PACE: NASA’s Plankton, Aerosol, Cloud, ocean Ecosystem mission. Launched Feb. 11, 2015, DSCOVR is a space weather station that monitors changes in the solar wind, providing space weather alerts and forecasts for geomagnetic storms that could disrupt power grids, satellites, telecommunications, aviation and GPS. DSCOVR is a joint mission among NASA, the National Oceanic and Atmospheric Administration (NOAA), and the U.S. Air Force. The project originally was called Triana, a mission conceived of by Gore in 1998 during his vice presidency.
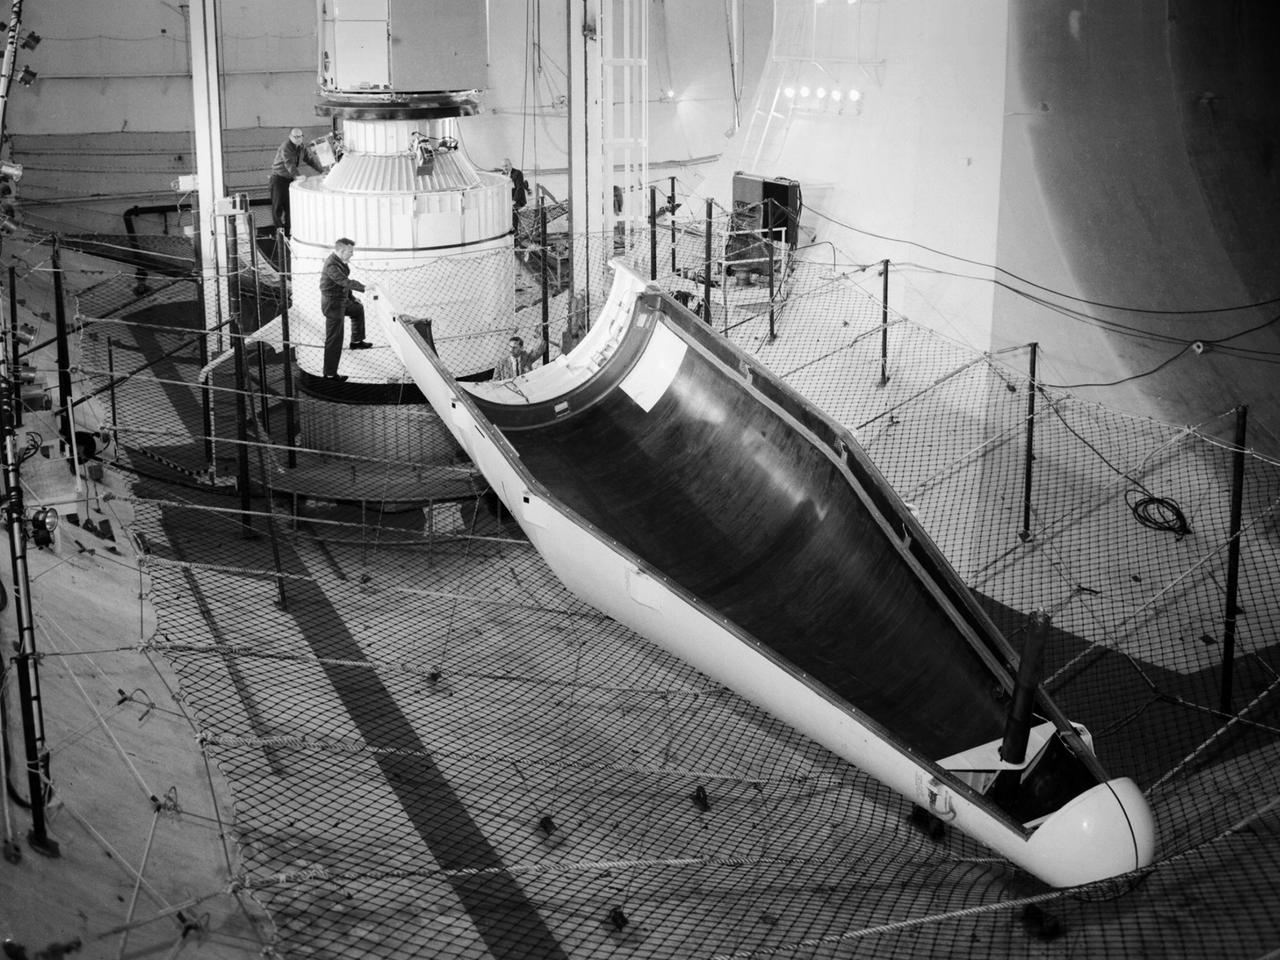
Researchers at the National Aeronautics and Space Administration (NASA) Lewis Research Center conducted a series of shroud jettison tests for the second Orbiting Astronomical Observatory (OAO-2) in the Space Power Chambers during April 1968. The Orbiting Astronomical Observatory satellites were designed by Goddard Space Flight Center to study and retrieve ultraviolet data on stars and galaxies which earthbound and atmospheric telescopes could not view due to ozone absorption. The shroud jettison system was tested in the Space Power Chambers. In 1961, NASA Lewis management decided to convert its Altitude Wind Tunnel into two large test chambers and later renamed it the Space Power Chambers. The conversion, which took over two years, included removing the tunnel’s internal components and inserting bulkheads to seal off the new chambers. The larger chamber, seen here, could simulate altitudes of 100,000 feet. These chambers were used for a variety of tests on the Centaur second-stage rocket until the early 1970s. The first OAO mission in 1965 failed due to problems with the satellite. OAO-2 would be launched on an Atlas/Centaur with a modified Agena shroud. The new shroud was 18 feet longer than the normal Centaur payload shrouds. This new piece of hardware was successfully qualified during three tests at 90,000 feet altitude in the Space Power Chambers in April 1968. For the first time, x-rays were used to verify the payload clearance once the shroud was sealed. OAO-2 was launched on December 7, 1968 and proved to be an extremely successful mission.
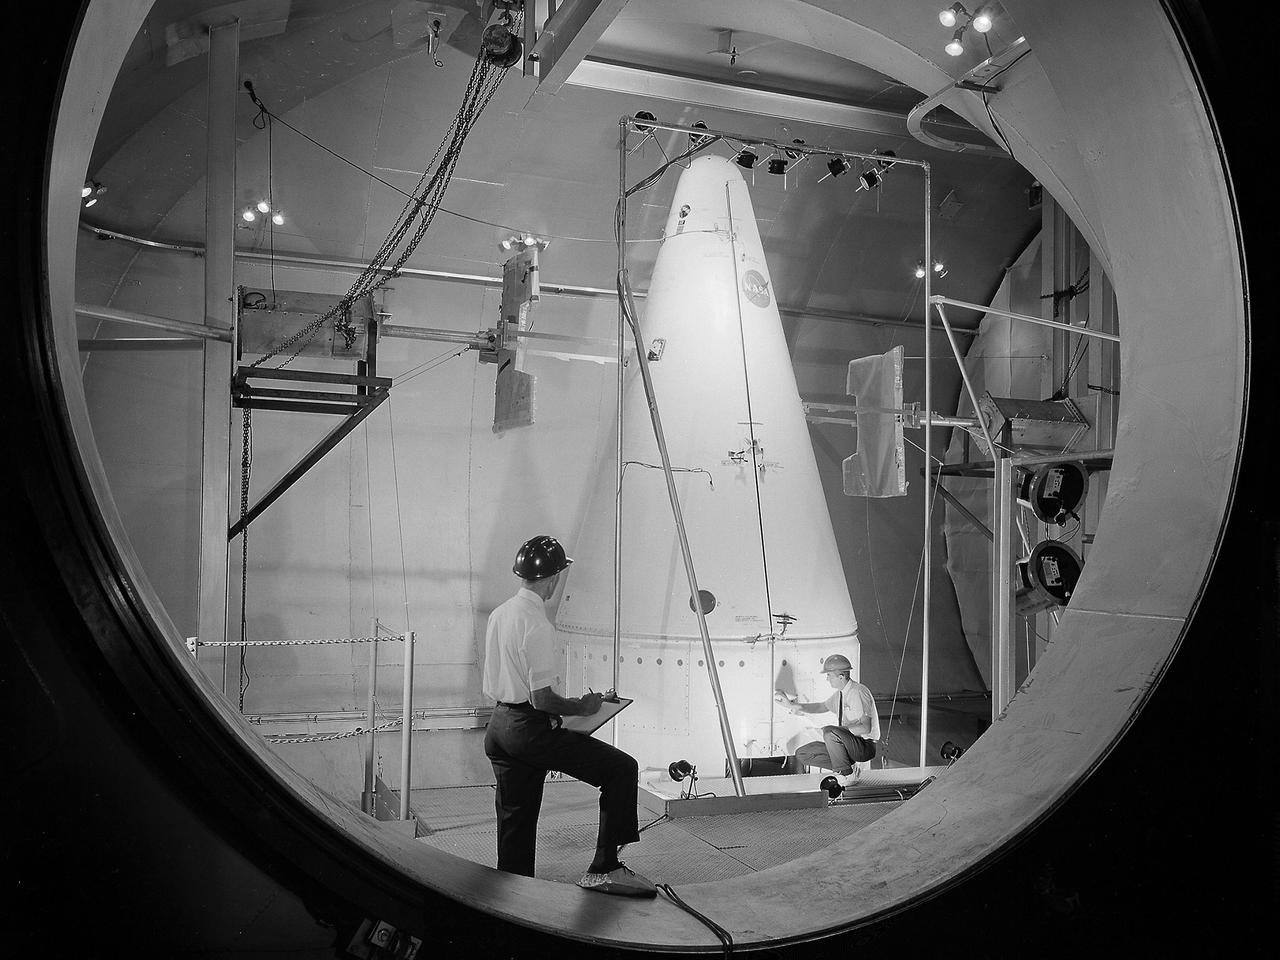
Researchers prepare a Centaur-Surveyor nose cone shroud for a separation test in the Space Power Chambers at the National Aeronautics and Space Administration (NASA) Lewis Research Center. Lewis was in the midst of an extensive effort to prepare the Centaur second-stage rocket for its missions to send the Surveyor spacecraft to the moon as a precursor to the Apollo missions. The nose fairing provided an aerodynamic shield for the payload, guidance system, and electronics package as the rocket traveled through the Earth’s atmosphere. Upon entering space, the thruster near the tip of the fairing forced the two pieces away from the space vehicle. The June 30, 1964 launch of Atlas-Centaur-3 was successful. Within a month of the launch, a Centaur shroud was obtained and installed in the Space Power Chambers. The facility was the only space tank in the country large enough to accommodate the hardware. The two halves of the fiberglass fairing were mounted vertically to a platform. Aluminum pads were set up on either side to catch the shroud halves as they were jettisoned, and a myriad of high-speed cameras were installed to record the tests. The shroud was badly damaged during the first test. It was replaced, and the test equipment redesigned. Over the course of 11 runs during the summer of 1964, the redesigned bulkhead was retested and the new fairing was validated by the final jettison on November 24, 1964. Just over two weeks later, Atlas-Centaur-4 successfully launched a mock-up Surveyor spacecraft into orbit. It was the first Centaur mission to have an error-free shroud jettison.
A United launch Alliance Atlas V 401 rocket soars upward after liftoff from Space Launch Complex 3 at Vandenberg Space Force Base in California on Nov. 10, carrying the National Oceanic and Atmospheric Administration’s (NOAA) Joint Polar Satellite System-2 (JPSS-2) and NASA’s Low-Earth Orbit Flight Test of an Inflatable Decelerator (LOFTID) technology demonstration. Launch was at 1:49 a.m. PST. JPSS-2 is the third satellite in the polar satellite series and is expected to capture data to improve weather forecasts, helping scientists predict and prepare for extreme weather events and climate change. After JPSS-2 safely reaches orbit, LOFTID will follow a re-entry trajectory from low-Earth orbit to demonstrate the inflatable heat shield’s ability to slow down and survive re-entry. LOFTID is a partnership with ULA and is dedicated to the memory of Bernard Kutter, one of the company’s engineers who played a key role in developing the technology. LOFTID will demonstrate how the inflatable aeroshell, or heat shield, can slow down and survive re-entry in conditions relevant to many potential applications, whether landing humans on Mars, new missions to Venus and Titan, or returning heavier payloads and samples from low-Earth orbit.
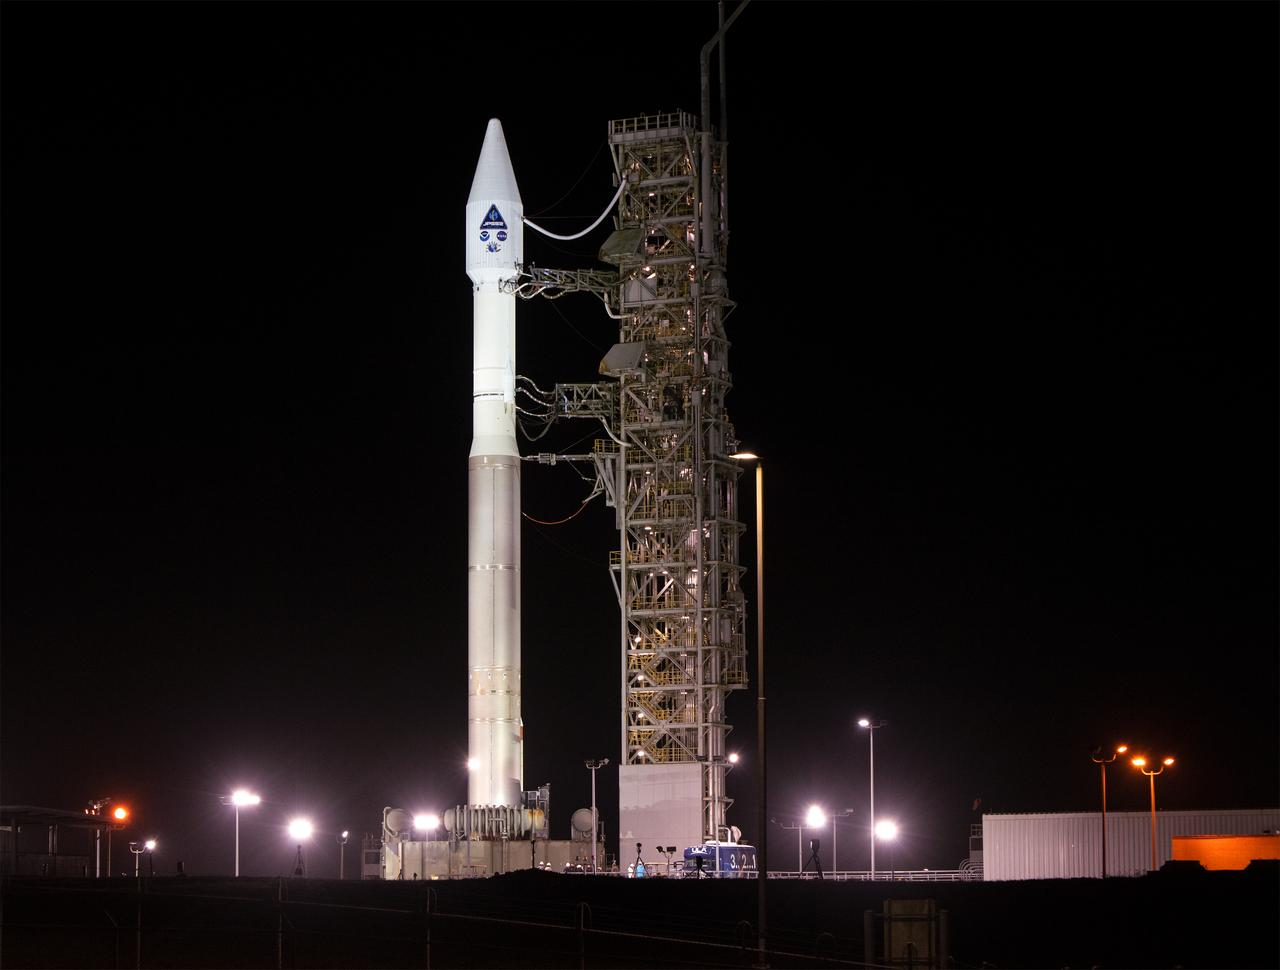
The National Oceanic and Atmospheric Administration’s (NOAA) Joint Polar Satellite System-2 (JPSS-2) satellite with NASA’s Low-Earth Orbit Flight Test of an Inflatable Decelerator (LOFTID) as a secondary payload, stand ready to lift off atop a United Launch Alliance (ULA) Atlas V rocket from Space Launch Complex-3 at Vandenberg Space Force Base in California on Nov. 10.
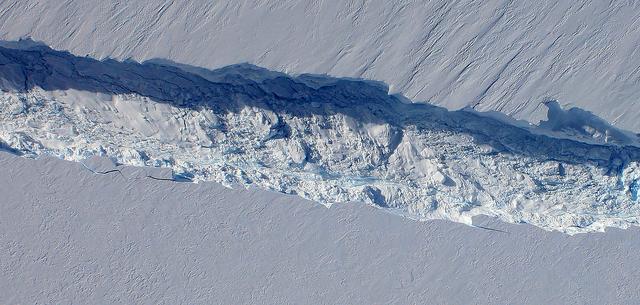
A close-up image of the crack spreading across the ice shelf of Pine Island Glacier shows the details of the boulder-like blocks of ice that fell into the rift when it split. For most of the 18-mile stretch of the crack that NASA’s DC-8 flew over on Oct. 26, 2011, it stretched about 240 feet wide, as roughly seen here. The deepest points ranged from about 165 to 190 feet, roughly equal to the top of the ice shelf down to sea level. Scientists expect the crack to propagate and the ice shelf to calve an iceberg of more than 300 square miles in the coming months. This image was captured by the Digital Mapping System (DMS) aboard the DC-8. Credit: NASA/DMS NASA's Operation IceBridge returns to a base camp of Punta Arenas, Chile for the third year of flights over Antarctica's changing sea ice, glaciers and ice sheets. NASA's DC-8, outfitted with seven remote-sensing instruments, and a Gulfstream 5 operated by the National Science Foundation and National Center for Atmospheric Research and outfitted with a high-altitude laser-ranging mapper, will fly from Chile over Antarctica in October and November. The mission is designed to record changes to Antarctica's ice sheets and give scientists insight into what is driving those changes. Follow the progress of the mission: Campaign News site: <a href="http://www.nasa.gov/mission_pages/icebridge/index.html" rel="nofollow">www.nasa.gov/mission_pages/icebridge/index.html</a> IceBridge blog: <a href="http://blogs.nasa.gov/cm/newui/blog/viewpostlist.jsp?blogname=icebridge" rel="nofollow">blogs.nasa.gov/cm/newui/blog/viewpostlist.jsp?blogname=ic...</a> Twitter: @nasa_ice <b><a href="http://www.nasa.gov/audience/formedia/features/MP_Photo_Guidelines.html" rel="nofollow">NASA image use policy.</a></b> <b><a href="http://www.nasa.gov/centers/goddard/home/index.html" rel="nofollow">NASA Goddard Space Flight Center</a></b> enables NASA’s mission through four scientific endeavors: Earth Science, Heliophysics, Solar System Exploration, and Astrophysics. Goddard plays a leading role in NASA’s accomplishments by contributing compelling scientific knowledge to advance the Agency’s mission. <b>Follow us on <a href="http://twitter.com/NASA_GoddardPix" rel="nofollow">Twitter</a></b> <b>Like us on <a href="http://www.facebook.com/pages/Greenbelt-MD/NASA-Goddard/395013845897?ref=tsd" rel="nofollow">Facebook</a></b> <b>Find us on <a href="http://instagrid.me/nasagoddard/?vm=grid" rel="nofollow">Instagram</a></b>
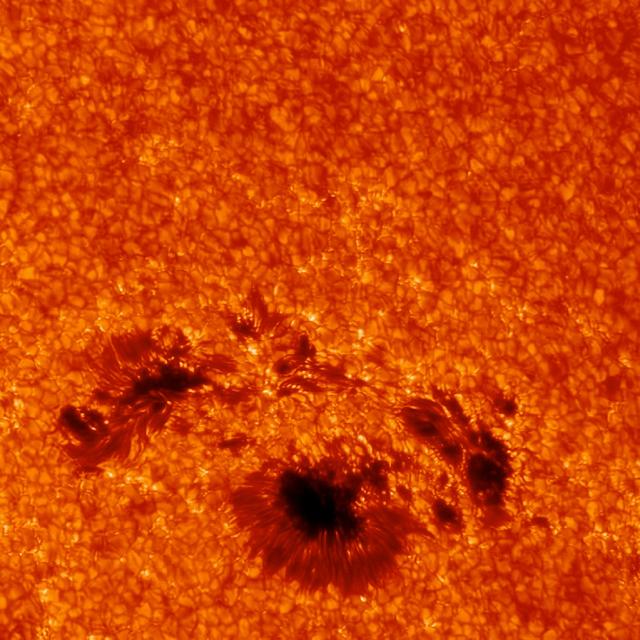
This close-up of the sunspot underneath the March 29, 2014, flare shows incredible detail. The image was captured by the G-band camera at Sacramento Peak in New Mexico. This instrument can focus on only a small area at once, but provide very high resolution. Ground-based telescope data can be hindered by Earth's atmosphere, which blocks much of the sun's ultraviolet and X-ray light, and causes twinkling even in the light it does allow through. As it happens, the March 29 flare occurred at a time of day in New Mexico that often results in the best viewing times from the ground. Credit: Kevin Reardon (National Solar Observatory), Lucia Kleint (BAER Institute) -- On March 29, 2014 the sun released an X-class flare. It was observed by NASA's Interface Region Imaging Spectrograph, or IRIS; NASA's Solar Dynamics Observatory, or SDO; NASA's Reuven Ramaty High Energy Solar Spectroscopic Imager, or RHESSI; the Japanese Aerospace Exploration Agency's Hinode; and the National Solar Observatory's Dunn Solar Telescope located at Sacramento Peak in New Mexico. To have a record of such an intense flare from so many observatories is unprecedented. Such research can help scientists better understand what catalyst sets off these large explosions on the sun. Perhaps we may even some day be able to predict their onset and forewarn of the radio blackouts solar flares can cause near Earth - blackouts that can interfere with airplane, ship and military communications. Read more: <a href="http://1.usa.gov/1kMDQbO" rel="nofollow">1.usa.gov/1kMDQbO</a> Join our Google+ Hangout on May 8 at 2:30pm EST: <a href="http://go.nasa.gov/1mwbBEZ" rel="nofollow">go.nasa.gov/1mwbBEZ</a> Credit: NASA Goddard <b><a href="http://www.nasa.gov/audience/formedia/features/MP_Photo_Guidelines.html" rel="nofollow">NASA image use policy.</a></b> <b><a href="http://www.nasa.gov/centers/goddard/home/index.html" rel="nofollow">NASA Goddard Space Flight Center</a></b> enables NASA’s mission through four scientific endeavors: Earth Science, Heliophysics, Solar System Exploration, and Astrophysics. Goddard plays a leading role in NASA’s accomplishments by contributing compelling scientific knowledge to advance the Agency’s mission. <b>Follow us on <a href="http://twitter.com/NASAGoddardPix" rel="nofollow">Twitter</a></b> <b>Like us on <a href="http://www.facebook.com/pages/Greenbelt-MD/NASA-Goddard/395013845897?ref=tsd" rel="nofollow">Facebook</a></b> <b>Find us on <a href="http://instagram.com/nasagoddard?vm=grid" rel="nofollow">Instagram</a></b>

Some of the BARREL balloon launches took place at the South African National Antarctic Expedition Research base, called SANAE IV, the others at Halley Research Station. This balloon is taking flight at SANAE IV. Credit: NASA --- In Antarctica in January, 2013 – the summer at the South Pole – scientists launched 20 balloons up into the air to study an enduring mystery of space weather: when the giant radiation belts surrounding Earth lose material, where do the extra particles actually go? The mission is called BARREL (Balloon Array for Radiation belt Relativistic Electron Losses) and it is led by physicist Robyn Millan of Dartmouth College in Hanover, NH. Millan provided photographs from the team’s time in Antarctica. The team launched a balloon every day or two into the circumpolar winds that circulate around the pole. Each balloon floated for anywhere from 3 to 40 days, measuring X-rays produced by fast-moving electrons high up in the atmosphere. BARREL works hand in hand with another NASA mission called the Van Allen Probes, which travels through the Van Allen radiation belts surrounding Earth. The belts wax and wane over time in response to incoming energy and material from the sun, sometimes intensifying the radiation through which satellites must travel. Scientists wish to understand this process better, and even provide forecasts of this space weather, in order to protect our spacecraft. As the Van Allen Probes were observing what was happening in the belts, BARREL tracked electrons that precipitated out of the belts and hurtled down Earth’s magnetic field lines toward the poles. By comparing data, scientists will be able to track how what’s happening in the belts correlates to the loss of particles – information that can help us understand this mysterious, dynamic region that can impact spacecraft. Having launched balloons in early 2013, the team is back at home building the next set of payloads. They will launch 20 more balloons in 2014. <b><a href="http://www.nasa.gov/audience/formedia/features/MP_Photo_Guidelines.html" rel="nofollow">NASA image use policy.</a></b> <b><a href="http://www.nasa.gov/centers/goddard/home/index.html" rel="nofollow">NASA Goddard Space Flight Center</a></b> enables NASA’s mission through four scientific endeavors: Earth Science, Heliophysics, Solar System Exploration, and Astrophysics. Goddard plays a leading role in NASA’s accomplishments by contributing compelling scientific knowledge to advance the Agency’s mission. <b>Follow us on <a href="http://twitter.com/NASA_GoddardPix" rel="nofollow">Twitter</a></b> <b>Like us on <a href="http://www.facebook.com/pages/Greenbelt-MD/NASA-Goddard/395013845897?ref=tsd" rel="nofollow">Facebook</a></b> <b>Find us on <a href="http://instagram.com/nasagoddard?vm=grid" rel="nofollow">Instagram</a></b>
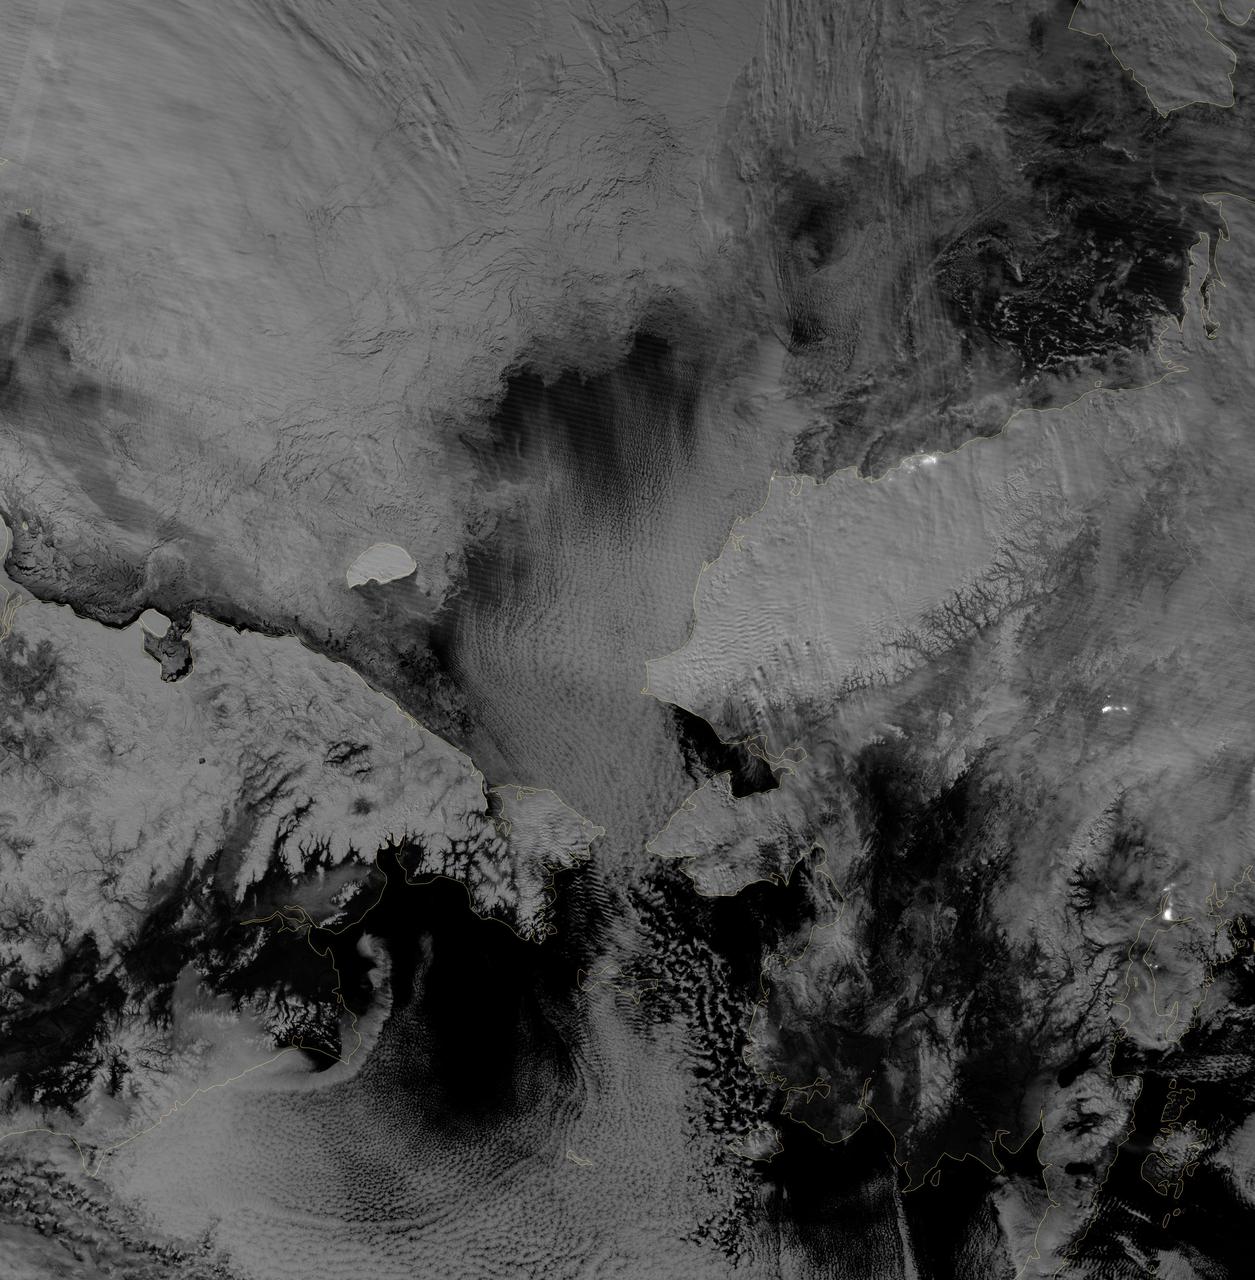
Image acquired October 30, 2012 Scientists watched the Arctic with particular interest in the summer of 2012, when Arctic sea ice set a new record low. The behavior of sea ice following such a low extent also interests scientists, but as Arctic sea ice was advancing in the autumn of 2012, so was polar darkness. Fortunately, the Visible Infrared Imaging Radiometer Suite (VIIRS) on the Suomi NPP satellite can see in the dark. The VIIRS “day-night band” detects light in a range of wavelengths from green to near-infrared and uses filtering techniques to observe signals such as gas flares, auroras, wildfires, city lights, and reflected moonlight. VIIRS acquired this nighttime view of sea ice north of Russia and Alaska on October 30, 2012. The day-night band takes advantage of moonlight, airglow (the atmosphere’s self-illumination through chemical reactions), zodiacal light (sunlight scattered by interplanetary dust), and starlight from the Milky Way. By using these dim light sources, the day-night band can detect changes in clouds, snow cover, and sea ice. The VIIRS day-night band offers a unique perspective because once polar night has descended, satellite sensors relying on visible light can no longer produce photo-like images. And although passive microwave sensors can monitor sea ice through the winter, they offer much lower resolution. Steve Miller of the Cooperative Institute for Research in the Atmosphere at Colorado State University has used the day-night band to study nighttime behavior of weather systems and sees advantages in studying the polar regions. “There’s a lot of use with these measurements as we look back at a season of record ice melt in the Arctic,” Miller says. “We can observe areas where there is ice melt and reformation, where there’s clear water and ships can pass through—especially as the ‘great darkness’ approaches with winter.” Ted Scambos of the National Snow and Ice Data Center at the University of Colorado concurs. “Things start changing rapidly in the late fall: sea ice formation and snow cover extent at the highest latitudes. This lets us see rapid-growth areas in detail.” The day-night band is also useful for following weather systems, including severe storms, which can develop and strike populous areas at night as well as day. Geostationary Operational Environmental Satellites orbit the Earth’s equator. The satellites offer uninterrupted observations of North America, but high-latitude areas such as Alaska may benefit more from polar-orbiting satellites. Miller explains, “In the high latitudes, the orbits begin to overlap considerably, which gives you a lot more passes in Alaska. If you start to look at multiple passes and stitch them together, you can get a version of a poor man’s geostationary time loop of the weather.” Day-night band imagery at high latitudes has already proven useful for tracking rapid ice movement and diagnosing Gulf of Alaska circulations. The day-night band is even useful at tracking ship movement at high latitudes. NASA Earth Observatory image by Jesse Allen and Robert Simmon, using VIIRS Day-Night Band data from the Suomi National Polar-orbiting Partnership. Suomi NPP is the result of a partnership between NASA, the National Oceanic and Atmospheric Administration, and the Department of Defense. Caption by Michon Scott. Instrument: Suomi NPP - VIIRS Credit: <b><a href="http://www.earthobservatory.nasa.gov/" rel="nofollow"> NASA Earth Observatory</a></b> <b>Click here to view all of the <a href="http://earthobservatory.nasa.gov/Features/NightLights/" rel="nofollow"> Earth at Night 2012 images </a></b> <b>Click here to <a href="http://earthobservatory.nasa.gov/NaturalHazards/view.php?id=79825" rel="nofollow"> read more </a> about this image </b> <b><a href="http://www.nasa.gov/audience/formedia/features/MP_Photo_Guidelines.html" rel="nofollow">NASA image use policy.</a></b> <b><a href="http://www.nasa.gov/centers/goddard/home/index.html" rel="nofollow">NASA Goddard Space Flight Center</a></b> enables NASA
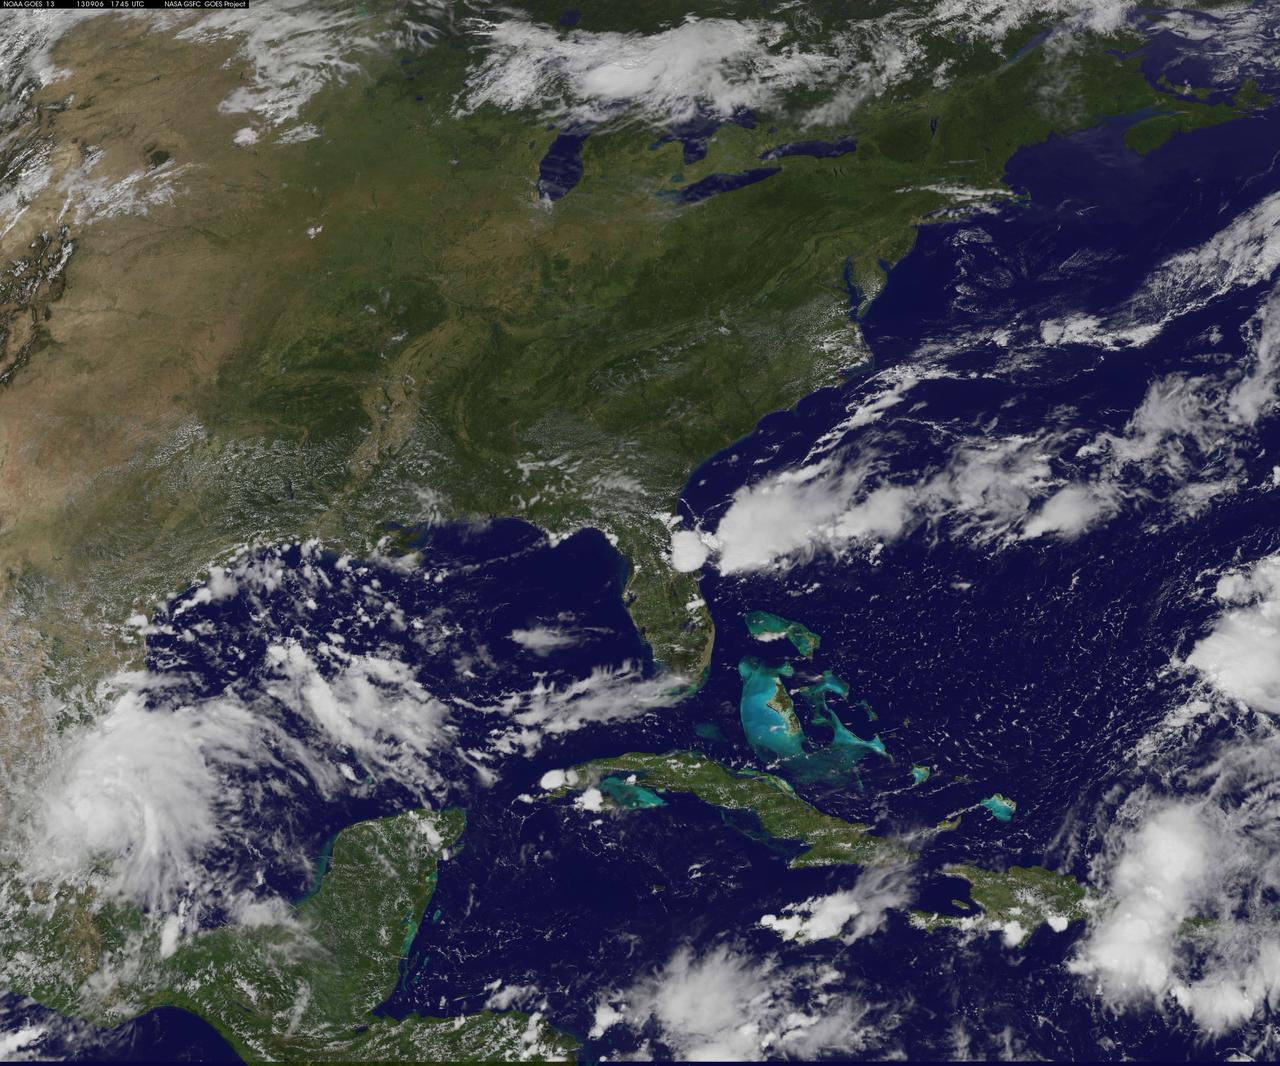
NASA's Wallops Flight Facility is located on Wallops Island, Va. and is the site of tonight's moon mission launch. Satellite imagery from NOAA's GOES-East satellite shows that high pressure remains in control over the Mid-Atlantic region, providing an almost cloud-free sky. This visible image of the Mid-Atlantic was captured by NOAA's GOES-East satellite at 17:31 UTC/1:31 p.m. EDT and shows some fair weather clouds over the Delmarva Peninsula (which consists of the state of Delaware and parts of Maryland and Virginia - which together is "Delmarva") and eastern Virginia and North Carolina. Most of the region is cloud-free, making for a perfect viewing night to see a launch. NOAA operates GOES-East and NASA's GOES Project at the NASA Goddard Space Flight Center in Greenbelt, Md. creates images and animations from the data. NOAA's National Weather Service forecast for tonight, Sept. 6 calls for winds blowing from the east to 11 mph, with clear skies and overnight temperatures dropping to the mid-fifties. The Lunar Atmosphere and Dust Environment Explorer, known as LADEE (pronounced like "laddie"), launches tonight at 11:27 p.m. EDT from Pad 0B at the Mid-Atlantic Regional Spaceport, at NASA Wallops and will be visible along the Mid-Atlantic with tonight's perfect weather conditions. LADEE is managed by NASA's Ames Research Center in Moffett Field, Calif. This will be the first launch to lunar orbit from NASA Wallops and the first launch of a Minotaur V rocket – the biggest ever launched from Wallops. NASA's LADEE is a robotic mission that will orbit the moon to gather detailed information about the lunar atmosphere, conditions near the surface and environmental influences on lunar dust. A thorough understanding of these characteristics will address long-standing unknowns, and help scientists understand other planetary bodies as well. LADEE also carries an important secondary payload, the Lunar Laser Communication Demonstration, or LLCD, which will help us open a new era of space communications by becoming NASA's first high rate, two-way, space laser system. Live coverage of the launch can be seen beginning at 9:30 p.m. EDT on NASA-TV at: <a href="http://www.nasa.gov/ntv" rel="nofollow">www.nasa.gov/ntv</a> For more information about LADEE, visit: <a href="http://www.nasa.gov/ladee" rel="nofollow">www.nasa.gov/ladee</a> <b><a href="http://www.nasa.gov/audience/formedia/features/MP_Photo_Guidelines.html" rel="nofollow">NASA image use policy.</a></b> <b><a href="http://www.nasa.gov/centers/goddard/home/index.html" rel="nofollow">NASA Goddard Space Flight Center</a></b> enables NASA’s mission through four scientific endeavors: Earth Science, Heliophysics, Solar System Exploration, and Astrophysics. Goddard plays a leading role in NASA’s accomplishments by contributing compelling scientific knowledge to advance the Agency’s mission. <b>Follow us on <a href="http://twitter.com/NASA_GoddardPix" rel="nofollow">Twitter</a></b> <b>Like us on <a href="http://www.facebook.com/pages/Greenbelt-MD/NASA-Goddard/395013845897?ref=tsd" rel="nofollow">Facebook</a></b> <b>Find us on <a href="http://instagram.com/nasagoddard?vm=grid" rel="nofollow">Instagram</a></b>
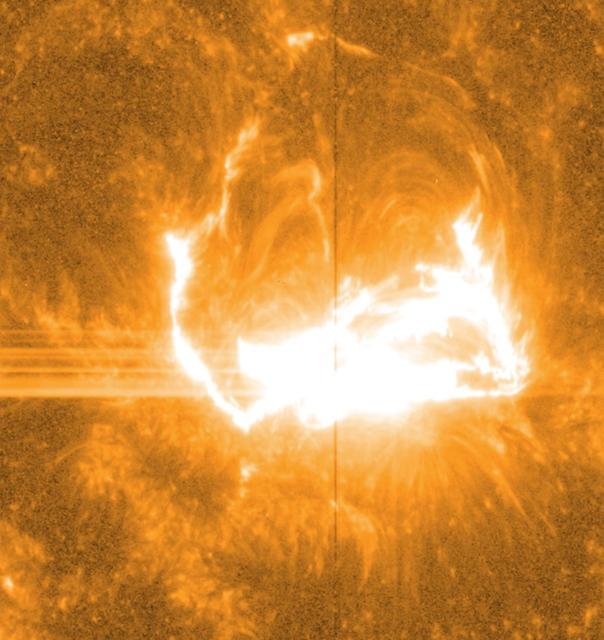
Like almost all solar observatories, NASA's IRIS can provide images of different layers of the sun's atmosphere, which together create a whole picture of what's happening. This image shows light at a wavelength of 1400 Angstrom, which highlights material some 650 miles above the sun's surface. The vertical line in the middle shows the slit for IRIS's spectrograph, which can separate light into its many wavelengths to provide even more information about the temperature and velocity of material during a flare. Credit: NASA/IRIS/Goddard Space Flight Center -- On March 29, 2014 the sun released an X-class flare. It was observed by NASA's Interface Region Imaging Spectrograph, or IRIS; NASA's Solar Dynamics Observatory, or SDO; NASA's Reuven Ramaty High Energy Solar Spectroscopic Imager, or RHESSI; the Japanese Aerospace Exploration Agency's Hinode; and the National Solar Observatory's Dunn Solar Telescope located at Sacramento Peak in New Mexico. To have a record of such an intense flare from so many observatories is unprecedented. Such research can help scientists better understand what catalyst sets off these large explosions on the sun. Perhaps we may even some day be able to predict their onset and forewarn of the radio blackouts solar flares can cause near Earth - blackouts that can interfere with airplane, ship and military communications. Read more: <a href="http://1.usa.gov/1kMDQbO" rel="nofollow">1.usa.gov/1kMDQbO</a> Join our Google+ Hangout on May 8 at 2:30pm EST: <a href="http://go.nasa.gov/1mwbBEZ" rel="nofollow">go.nasa.gov/1mwbBEZ</a> Credit: NASA Goddard <b><a href="http://www.nasa.gov/audience/formedia/features/MP_Photo_Guidelines.html" rel="nofollow">NASA image use policy.</a></b> <b><a href="http://www.nasa.gov/centers/goddard/home/index.html" rel="nofollow">NASA Goddard Space Flight Center</a></b> enables NASA’s mission through four scientific endeavors: Earth Science, Heliophysics, Solar System Exploration, and Astrophysics. Goddard plays a leading role in NASA’s accomplishments by contributing compelling scientific knowledge to advance the Agency’s mission. <b>Follow us on <a href="http://twitter.com/NASAGoddardPix" rel="nofollow">Twitter</a></b> <b>Like us on <a href="http://www.facebook.com/pages/Greenbelt-MD/NASA-Goddard/395013845897?ref=tsd" rel="nofollow">Facebook</a></b> <b>Find us on <a href="http://instagram.com/nasagoddard?vm=grid" rel="nofollow">Instagram</a></b>
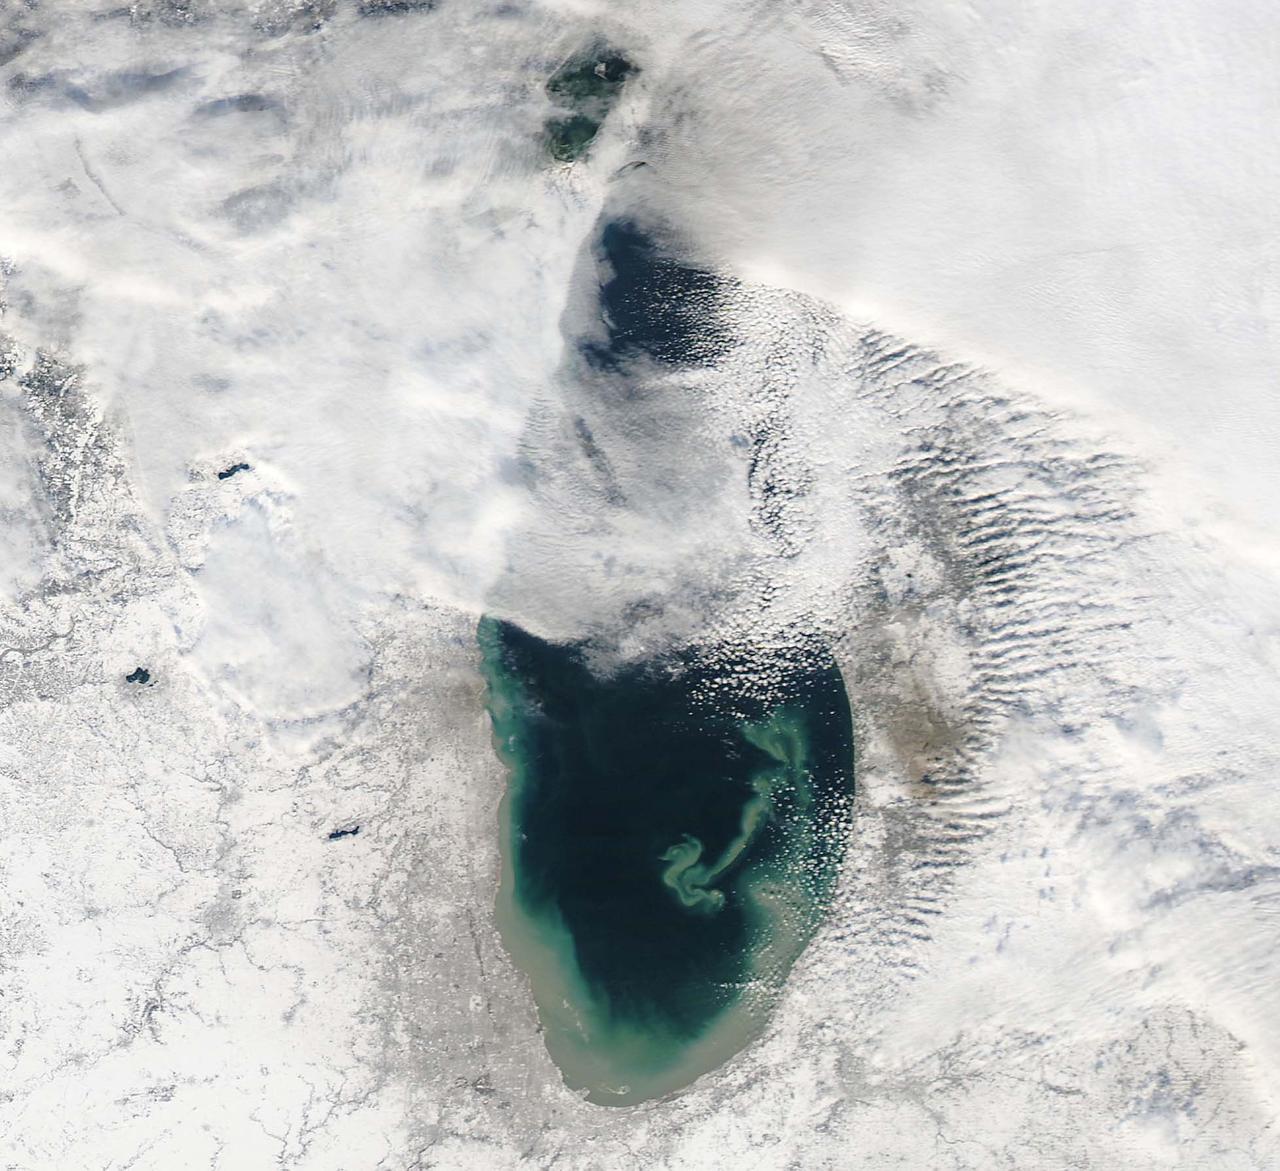
NASA image acquired December 17, 2010 In mid-December 2010, suspended sediments transformed the southern end of Lake Michigan. Ranging in color from brown to green, the sediment filled the surface waters along the southern coastline and formed a long, curving tendril extending toward the middle of the lake. The Moderate Resolution Imaging Spectroradiometer (MODIS) on NASA’s Aqua satellite captured these natural-color images on December 17, 2010 (top), and December 10, 2010 (bottom). Such sediment clouds are not uncommon in Lake Michigan, where winds influence lake circulation patterns. A scientificpaper published in 2007 described a model of the circulation, noting that while the suspended particles mostly arise from lake-bottom sediments along the western shoreline, they tend to accumulate on the eastern side. When northerly winds blow, two circulation gyres, rotating in opposite directions, transport sediment along the southern shoreline. As the northerly winds die down, the counterclockwise gyre predominates, and the smaller, clockwise gyre dissipates. Clear water—an apparent remnant of the small clockwise gyre—continues to interrupt the sediment plume. George Leshkevich, a researcher with the U.S. National Oceanic and Atmospheric Administration, explains that the wind-driven gyres erode lacustrine clay (very fine lakebed sediment) on the western shore before transporting it, along with re-suspended lake sediments, to the eastern shore. On the eastern side, the gyre encounters a shoreline bulge that pushes it toward the lake’s central southern basin, where it deposits the sediments. The sediment plume on December 17 followed a windy weather front in the region on December 16. NASA image courtesy MODIS Rapid Response Team at NASA GSFC. Caption by Michon Scott. Instrument: Aqua - MODIS <b><a href="http://www.nasa.gov/centers/goddard/home/index.html" rel="nofollow">NASA Goddard Space Flight Center</a></b> enables NASA’s mission through four scientific endeavors: Earth Science, Heliophysics, Solar System Exploration, and Astrophysics. Goddard plays a leading role in NASA’s accomplishments by contributing compelling scientific knowledge to advance the Agency’s mission. <b>Follow us on <a href="http://twitter.com/NASA_GoddardPix" rel="nofollow">Twitter</a></b> <b>Join us on <a href="http://www.facebook.com/pages/Greenbelt-MD/NASA-Goddard/395013845897?ref=tsd" rel="nofollow">Facebook</a></b> To read more about this image go to: <a href="http://earthobservatory.nasa.gov/IOTD/view.php?id=48511" rel="nofollow">earthobservatory.nasa.gov/IOTD/view.php?id=48511</a>
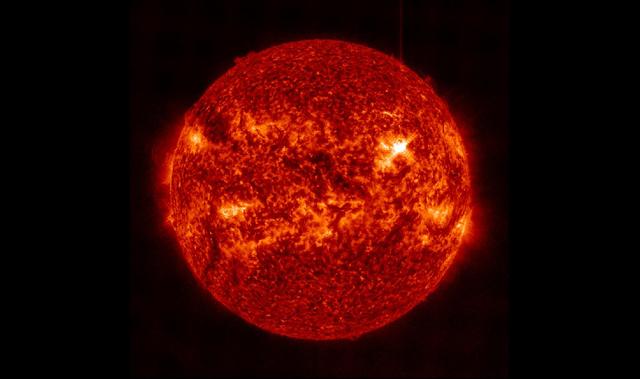
The March 29, 2014, X-class flare appears as a bright light on the upper right in this image from SDO, showing light in the 304 Angstrom wavelength. This wavelength shows material on the sun in what's called the transition region, where the chromosphere transitions into the upper solar atmosphere, the corona. Some light of the flare is clearly visible, but the flare appears brighter in other images that show hotter temperature material. Credit: NASA/SDO/AIA -- On March 29, 2014 the sun released an X-class flare. It was observed by NASA's Interface Region Imaging Spectrograph, or IRIS; NASA's Solar Dynamics Observatory, or SDO; NASA's Reuven Ramaty High Energy Solar Spectroscopic Imager, or RHESSI; the Japanese Aerospace Exploration Agency's Hinode; and the National Solar Observatory's Dunn Solar Telescope located at Sacramento Peak in New Mexico. To have a record of such an intense flare from so many observatories is unprecedented. Such research can help scientists better understand what catalyst sets off these large explosions on the sun. Perhaps we may even some day be able to predict their onset and forewarn of the radio blackouts solar flares can cause near Earth - blackouts that can interfere with airplane, ship and military communications. Read more: <a href="http://1.usa.gov/1kMDQbO" rel="nofollow">1.usa.gov/1kMDQbO</a> Join our Google+ Hangout on May 8 at 2:30pm EST: <a href="http://go.nasa.gov/1mwbBEZ" rel="nofollow">go.nasa.gov/1mwbBEZ</a> <b><a href="http://www.nasa.gov/audience/formedia/features/MP_Photo_Guidelines.html" rel="nofollow">NASA image use policy.</a></b> <b><a href="http://www.nasa.gov/centers/goddard/home/index.html" rel="nofollow">NASA Goddard Space Flight Center</a></b> enables NASA’s mission through four scientific endeavors: Earth Science, Heliophysics, Solar System Exploration, and Astrophysics. Goddard plays a leading role in NASA’s accomplishments by contributing compelling scientific knowledge to advance the Agency’s mission. <b>Follow us on <a href="http://twitter.com/NASAGoddardPix" rel="nofollow">Twitter</a></b> <b>Like us on <a href="http://www.facebook.com/pages/Greenbelt-MD/NASA-Goddard/395013845897?ref=tsd" rel="nofollow">Facebook</a></b> <b>Find us on <a href="http://instagram.com/nasagoddard?vm=grid" rel="nofollow">Instagram</a></b>
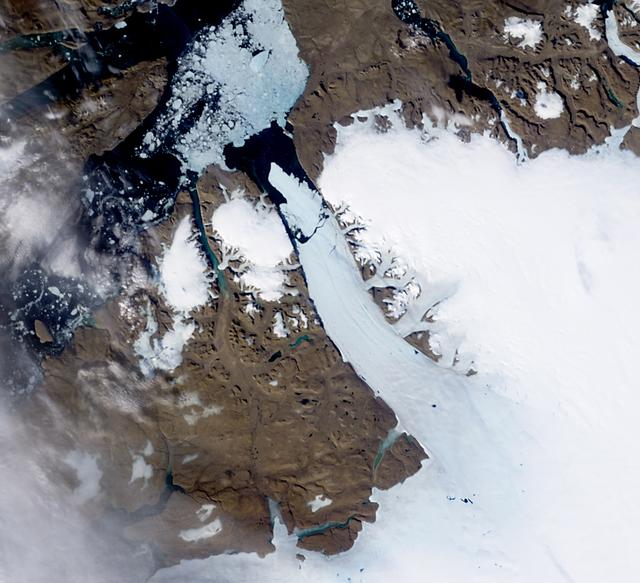
NASA image acquired August 5, 2010 On August 5, 2010, an enormous chunk of ice, roughly 97 square miles (251 square kilometers) in size, broke off the Petermann Glacier, along the northwestern coast of Greenland. The Canadian Ice Service detected the remote event within hours in near real-time data from the Moderate Resolution Imaging Spectroradiometer (MODIS) on NASA’s Aqua satellite. The Peterman Glacier lost about one-quarter of its 70-kilometer (40-mile) long floating ice shelf, said researchers who analyzed the satellite data at the University of Delaware. The Moderate Resolution Imaging Spectroradiometer (MODIS) on NASA’s Terra satellite captured these natural-color images of Petermann Glacier 18:05 UTC on August 5, 2010 (top), and 17:15 UTC on July 28, 2010 (bottom). The Terra image of the Petermann Glacier on August 5 was acquired almost 10 hours after the Aqua observation that first recorded the event. By the time Terra took this image, skies were less cloudy than they had been earlier in the day, and the oblong iceberg had broken free of the glacier and moved a short distance down the fjord. Icebergs calving off the Petermann Glacier are not unusual. Petermann Glacier’s floating ice tongue is the Northern Hemisphere’s largest, and it has occasionally calved large icebergs. The recently calved iceberg is the largest to form in the Arctic since 1962, said the University of Delaware. To read more and or to download the high res go here: <a href="http://www.nasa.gov/topics/earth/features/petermann-calve.html" rel="nofollow">www.nasa.gov/topics/earth/features/petermann-calve.html</a> or Click here to see more images from <b><a href="#//earthobservatory.nasa.gov/" rel="nofollow"> NASA Goddard’s Earth Observatory</a></b> NASA Earth Observatory image created by Jesse Allen and Robert Simmon, using data obtained from the Goddard Level 1 and Atmospheric Archive and Distribution System (LAADS). Caption by Holli Riebeek and Michon Scott. Instrument: Terra - MODIS <b><a href="http://www.nasa.gov/centers/goddard/home/index.html" rel="nofollow">NASA Goddard Space Flight Center</a></b> is home to the nation's largest organization of combined scientists, engineers and technologists that build spacecraft, instruments and new technology to study the Earth, the sun, our solar system, and the universe. <b>Follow us on <a href="http://twitter.com/NASA_GoddardPix" rel="nofollow">Twitter</a></b> <b>Join us on <a href="http://www.facebook.com/pages/Greenbelt-MD/NASA-Goddard/395013845897?ref=tsd" rel="nofollow">Facebook</a><b></b></b>
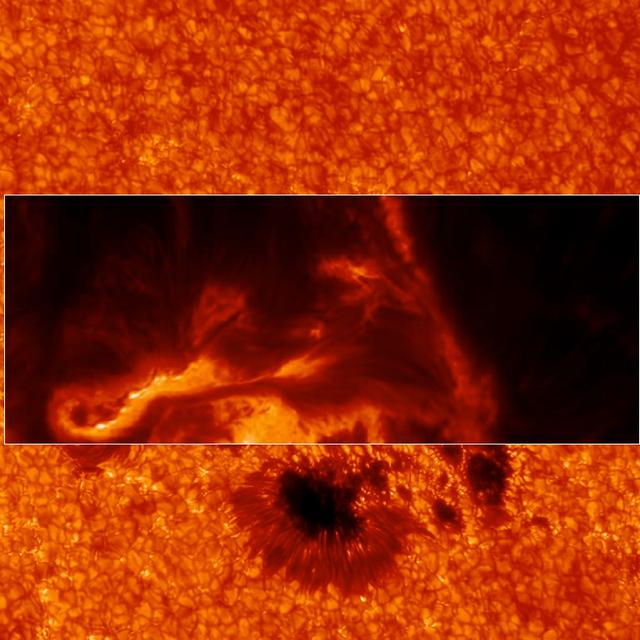
IBIS can focus in on different wavelengths of light, and so reveal different layers at different heights in the sun's lower atmosphere, the chromosphere. This image shows a region slightly higher than the former one. Credit: Lucia Kleint (BAER Institute), Paul Higgins (Trinity College Dublin, Ireland) -- On March 29, 2014 the sun released an X-class flare. It was observed by NASA's Interface Region Imaging Spectrograph, or IRIS; NASA's Solar Dynamics Observatory, or SDO; NASA's Reuven Ramaty High Energy Solar Spectroscopic Imager, or RHESSI; the Japanese Aerospace Exploration Agency's Hinode; and the National Solar Observatory's Dunn Solar Telescope located at Sacramento Peak in New Mexico. To have a record of such an intense flare from so many observatories is unprecedented. Such research can help scientists better understand what catalyst sets off these large explosions on the sun. Perhaps we may even some day be able to predict their onset and forewarn of the radio blackouts solar flares can cause near Earth - blackouts that can interfere with airplane, ship and military communications. Read more: <a href="http://1.usa.gov/1kMDQbO" rel="nofollow">1.usa.gov/1kMDQbO</a> Join our Google+ Hangout on May 8 at 2:30pm EST: <a href="http://go.nasa.gov/1mwbBEZ" rel="nofollow">go.nasa.gov/1mwbBEZ</a> Credit: NASA Goddard <b><a href="http://www.nasa.gov/audience/formedia/features/MP_Photo_Guidelines.html" rel="nofollow">NASA image use policy.</a></b> <b><a href="http://www.nasa.gov/centers/goddard/home/index.html" rel="nofollow">NASA Goddard Space Flight Center</a></b> enables NASA’s mission through four scientific endeavors: Earth Science, Heliophysics, Solar System Exploration, and Astrophysics. Goddard plays a leading role in NASA’s accomplishments by contributing compelling scientific knowledge to advance the Agency’s mission. <b>Follow us on <a href="http://twitter.com/NASAGoddardPix" rel="nofollow">Twitter</a></b> <b>Like us on <a href="http://www.facebook.com/pages/Greenbelt-MD/NASA-Goddard/395013845897?ref=tsd" rel="nofollow">Facebook</a></b> <b>Find us on <a href="http://instagram.com/nasagoddard?vm=grid" rel="nofollow">Instagram</a></b>
NASA image acquired December 3, 2012 As predicted, Typhoon Bopha made landfall on the Philippine island of Mindanao overnight December 3–4, 2012. Known in the Philippines as Pablo, the storm was blamed for 43 deaths and 25 injuries as of December 4, according to the Philippine Daily Inquirer. (To view the high res or to read more go to: <a href="http://1.usa.gov/XnYhVG" rel="nofollow">1.usa.gov/XnYhVG</a>) The Visible Infrared Imaging Radiometer Suite (VIIRS) on the Suomi NPP satellite acquired this image around 1:12 a.m. local time on December 4 (17:12 UTC on December 3). This image is from the VIIRS “day-night band,” which detects light in a range of wavelengths from green to near-infrared and uses filtering techniques to observe signals such as gas flares, auroras, wildfires, city lights, and reflected moonlight. Bopha remained a powerful typhoon as it made landfall on Mindanao, retaining a distinct eye and spiral shape as storm clouds stretched over the eastern part of the island. Unisys Weather reported that Bopha carried super-typhoon strength at the time it was coming ashore. William Straka, associate researcher at the Cooperative Institute for Meteorological Satellite Studies at the University of Wisconsin–Madison, estimated that the storm spanned at least 1,677 kilometers (1,042 miles). Bopha lost some strength after making landfall. On December 4 (late in the evening in the Philippines), the U.S. Navy’s Joint Typhoon Warning Center (JTWC) reported that the storm had maximum sustained winds of 95 knots (175 kilometers per hour) and gusts up to 115 knots (215 kilometers per hour)—still a fierce storm, but weakened since the previous day. The JTWC projected storm track showed Bopha continuing its movement toward the west-northwest, passing over the southern Philippines toward the South China Sea. NASA Earth Observatory image by Jesse Allen, using VIIRS day-night band data from the Suomi National Polar-orbiting Partnership. Suomi NPP is the result of a partnership between NASA, the National Oceanic and Atmospheric Administration, and the Department of Defense. Caption by Michon Scott. Instrument: Suomi NPP - VIIRS Credit: <b><a href="http://www.earthobservatory.nasa.gov/" rel="nofollow"> NASA Earth Observatory</a></b> <b><a href="http://www.nasa.gov/audience/formedia/features/MP_Photo_Guidelines.html" rel="nofollow">NASA image use policy.</a></b> <b><a href="http://www.nasa.gov/centers/goddard/home/index.html" rel="nofollow">NASA Goddard Space Flight Center</a></b> enables NASA’s mission through four scientific endeavors: Earth Science, Heliophysics, Solar System Exploration, and Astrophysics. Goddard plays a leading role in NASA’s accomplishments by contributing compelling scientific knowledge to advance the Agency’s mission. <b>Follow us on <a href="http://twitter.com/NASA_GoddardPix" rel="nofollow">Twitter</a></b> <b>Like us on <a href="http://www.facebook.com/pages/Greenbelt-MD/NASA-Goddard/395013845897?ref=tsd" rel="nofollow">Facebook</a></b> <b>Find us on <a href="http://instagrid.me/nasagoddard/?vm=grid" rel="nofollow">Instagram</a></b>

In January 2013, a new Earth-observing instrument was installed on the International Space Station (ISS). ISERV Pathfinder consists of a commercial camera, a telescope, and a pointing system, all positioned to look through the Earth-facing window of ISS’s Destiny module. ISERV Pathfinder is intended as an engineering exercise, with the long-term goal of developing a system for providing imagery to developing nations as they monitor natural disasters and environmental concerns. The image above is the “first light” from the new ISERV camera system, taken at 1:44 p.m. local time on February 16, 2013. It shows the Rio San Pablo as it empties into the Golfo de Montijo in Veraguas, Panama. It is an ecological transition zone, changing from agriculture and pastures to mangrove forests, swamps, and estuary systems. The area has been designated a protected area by the National Environmental Authority (ANAM) of Panama and is listed as a “wetland of international importance” under the Ramsar Convention. (Note that the image is rotated so that north is to the upper right.) “ISERV’s full potential is yet to be seen, but we hope it will really make a difference in people’s lives,” said principal investigator Burgess Howell of NASA’s Marshall Space Flight Center. “For example, if an earthen dam gives way in Bhutan, we want to be able to show officials where the bridge is out or where a road is washed out or a power substation is inundated. This kind of information is critical to focus and speed rescue efforts.” The instrument will be controlled from NASA Marshall in Huntsville, Alabama, in collaboration with researchers at hubs in Central America, East Africa, and the Hindu Kush–Himalaya region. They will rely on positioning software to know where the space station is at each moment and to calculate the next chance to view a particular area on the ground. If there's a good viewing opportunity, the SERVIR team will instruct the camera to take high-resolution photographs at 3 to 7 frames per second, totaling as many as 100 images per pass. With a resolution down to 3.2 meters (10 feet), it will be possible to spot fairly small details and objects. The current mission will test the limitations of Pathfinder and identify measures for improvements in a more permanent system. For instance, the engineering team is working to determine how the geometry of the ISS window affects the imagery; how much sunlight is needed to capture clear images; and how the atmosphere affects that clarity. This characterization phase will last several weeks to a few months. Eventually, ISERV should be made available to the natural hazards community and to basic research scientists. ISERV is short for ISS SERVIR Environmental Research and Visualization system. Together with the U.S. Agency for International Development, NASA runs the SERVIR program to provide satellite data, maps, and other tools to environmental decisionmakers in developing countries. (Servir is a Spanish word meaning “to serve.”) Learn more about the SERVIR program by clicking here: <a href="https://servirglobal.net/Global.aspx" rel="nofollow">servirglobal.net/Global.aspx</a> NASA image by Burgess Howell, SERVIR Global program. Caption by Dauna Coulter, NASA Marshall Space Flight Center, and Mike Carlowicz, NASA Earth Observatory. Instrument: ISS - ISERV Pathfinder Credit: <b><a href="http://www.earthobservatory.nasa.gov/" rel="nofollow"> NASA Earth Observatory</a></b> - <a href="http://1.usa.gov/12Aqmg9" rel="nofollow">1.usa.gov/12Aqmg9</a> <b><a href="http://www.nasa.gov/audience/formedia/features/MP_Photo_Guidelines.html" rel="nofollow">NASA image use policy.</a></b> <b><a href="http://www.nasa.gov/centers/goddard/home/index.html" rel="nofollow">NASA Goddard Space Flight Center</a></b> enables NASA’s mission through four scientific endeavors: Earth Science, Heliophysics, Solar System Exploration, and Astrophysics. Goddard plays a leading role in NASA’s accomplishments by contributing compelling scientific knowledge to advance the Agency’s mission. <b>Follow us on <a href="http://twitter.com/NASA_GoddardPix" rel="nofollow">Twitter</a></b> <b>Like us on <a href="http://www.facebook.com/pages/Greenbelt-MD/NASA-Goddard/395013845897?ref=tsd" rel="nofollow">Facebook</a></b> <b>Find us on <a href="http://instagram.com/nasagoddard?vm=grid" rel="nofollow">Instagram</a></b>