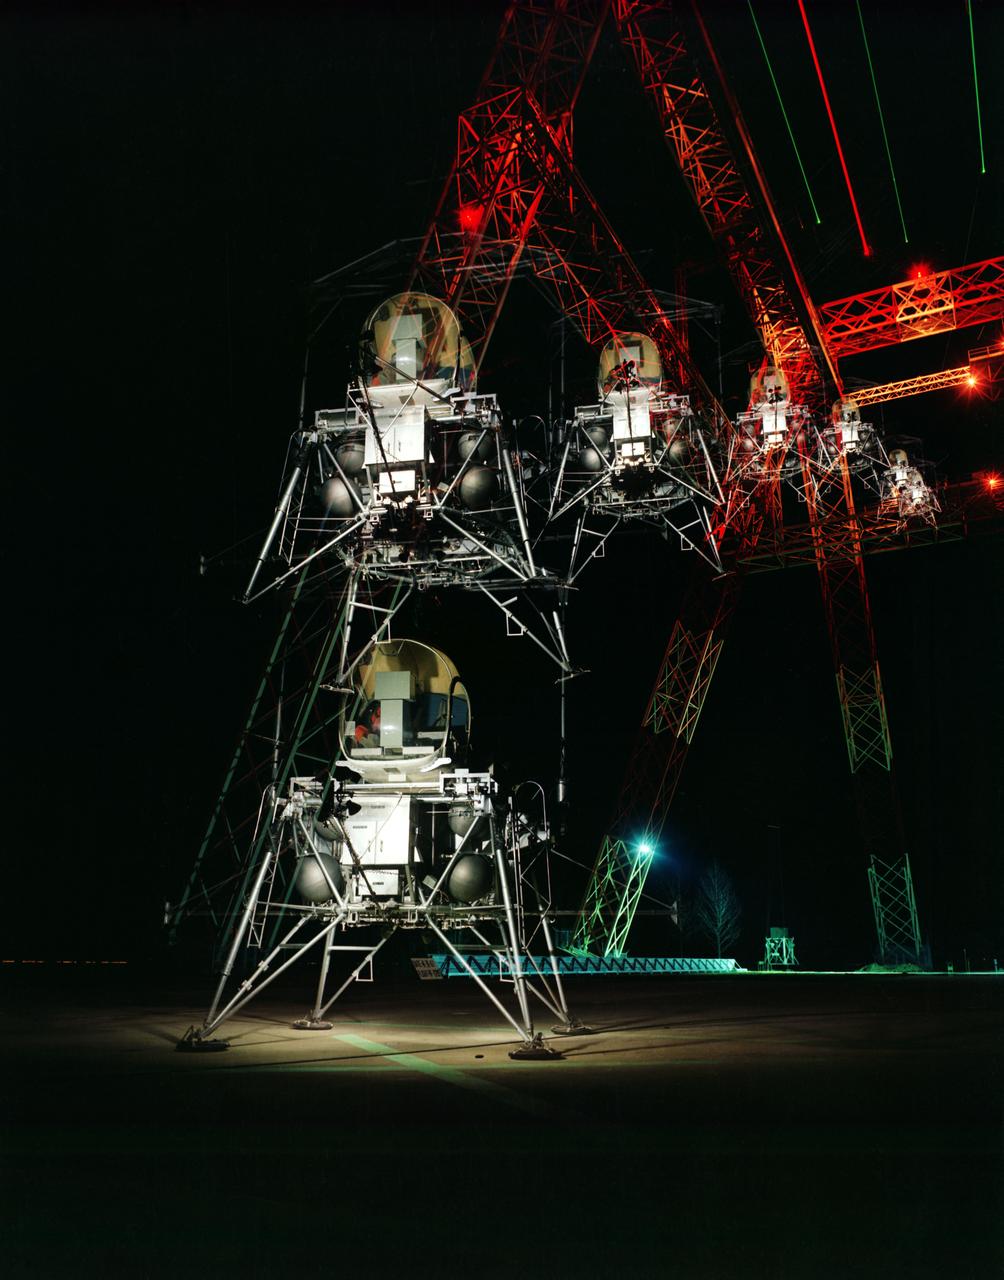
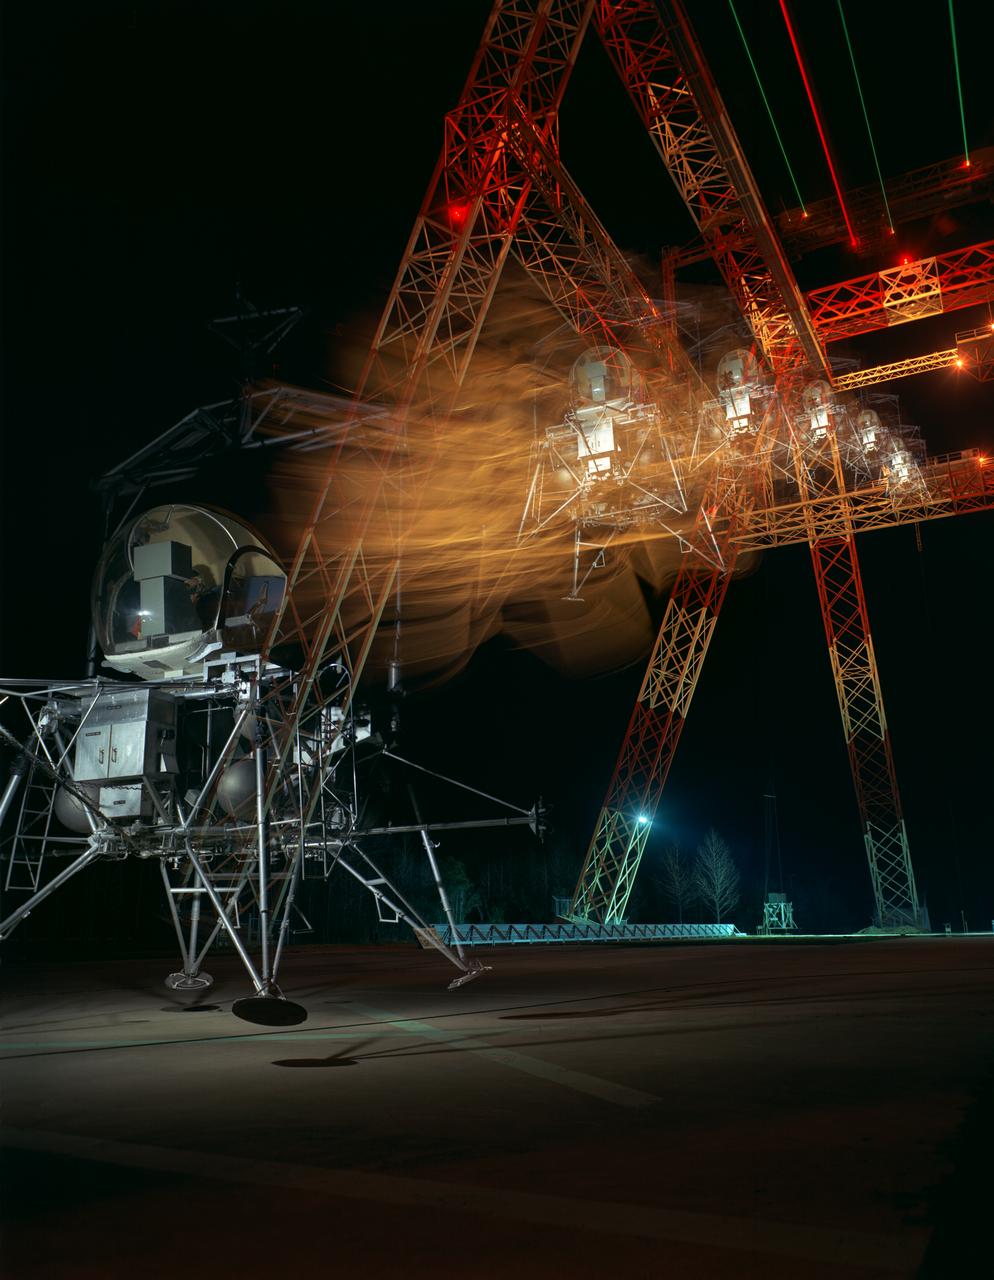
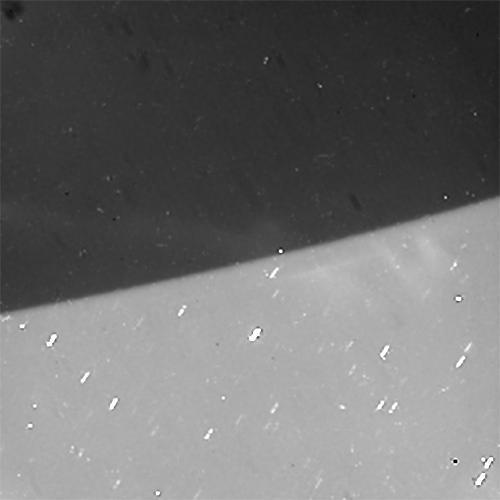
During a nighttime training session, a multiple exposure captures the movement of the Lunar Excursion Module Simulator (LEMS). The LEMS was a manned vehicle used to familiarize the Apollo astronauts with the handling characteristics of lunar-landing type vehicle. The Apollo Program is best known for the astronaut Neal Armstrong s first step on the Moon July 20, 1969. In its earliest test period, the LEMS featured a helicopter crew cabin atop the lunar landing module. Later, the helicopter crew cabin was replaced with a stand-up rectangular cabin which was more efficient for controlling maneuvers and for better viewing by the pilot. The vehicle was designed at Langley Research Center in Hampton, VA. This multiple exposure shows a simulated Moon landing of the (LEMS) trainer at Langley s Lunar Landing Research Facility. -- Photograph published in Winds of Change, 75th Anniversary NASA publication (page 70), by James Shultz. Also published in " A Century at Langley" by Joseph Chambers, pg. 93.
During a nighttime training session, a multiple exposure captures the movement of the Lunar Excursion Module Simulator (LEMS). The LEMS was a manned vehicle used to familiarize the Apollo astronauts with the handling characteristics of lunar-landing type vehicle. The Apollo Program is best known for the astronaut Neal Armstrong s first step on the Moon July 20, 1969. In its earliest test period, the LEMS featured a helicopter crew cabin atop the lunar landing module. Later, the helicopter crew cabin was replaced with a stand-up rectangular cabin which was more efficient for controlling maneuvers and for better viewing by the pilot. The vehicle was designed at Langley Research Center in Hampton, VA. This multiple exposure shows a simulated Moon landing of the (LEMS) trainer at Langley s Lunar Landing Research Facility. -- Photograph published in Winds of Change, 75th Anniversary NASA publication (page 70), by James Shultz. Also published in " A Century at Langley" by Joseph Chambers, pg. 93.
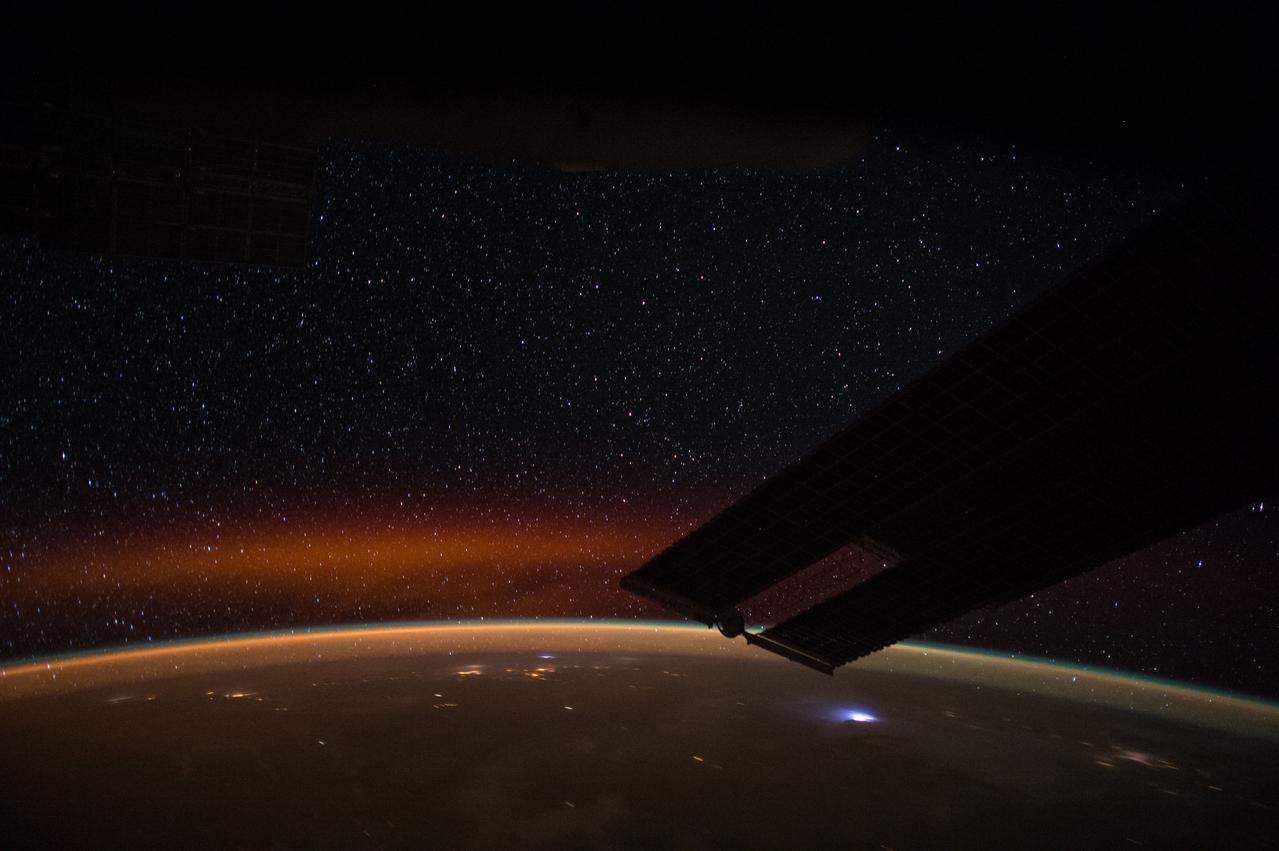
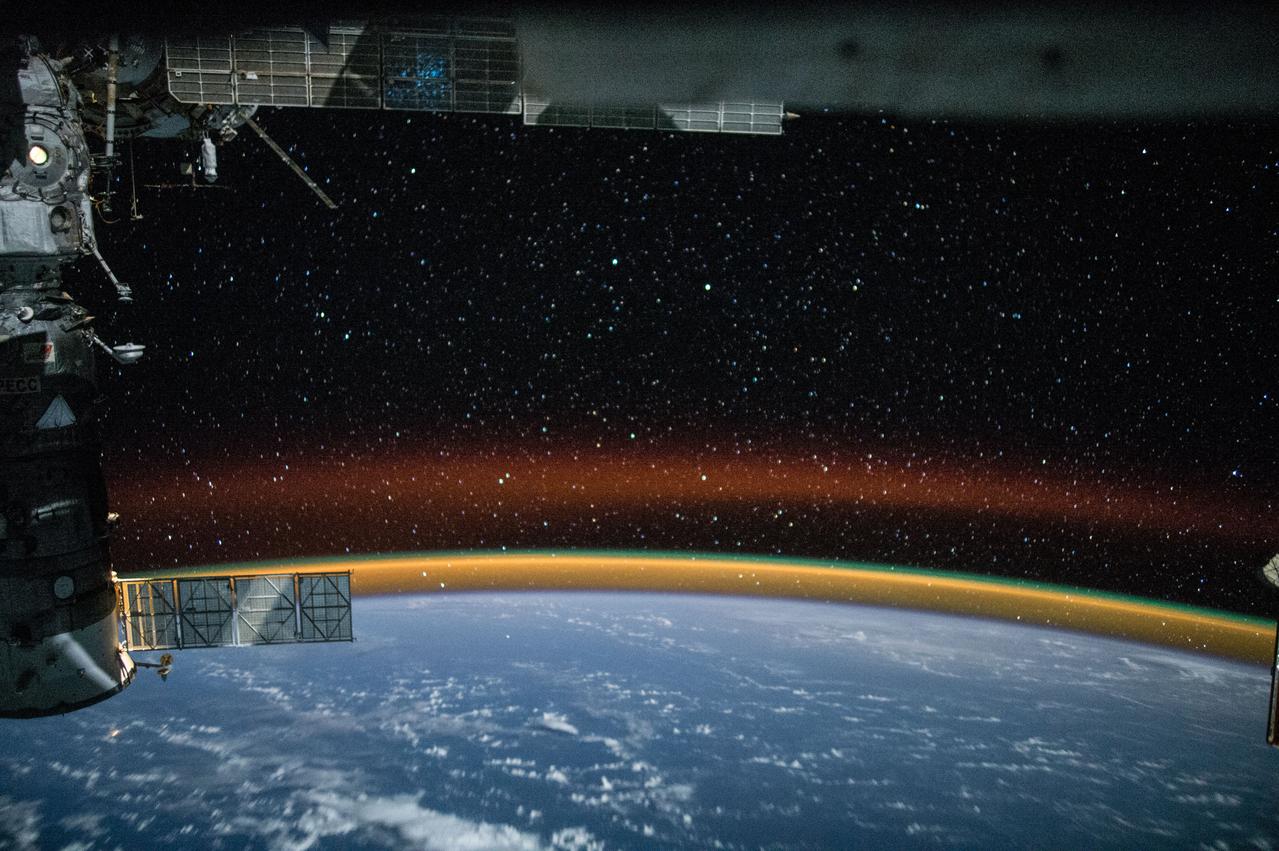
ISS043E193686 (05/14/2015) --- NASA astronaut Terry Virts commander of Expedition 43 on the International Space Station tweeted this night Earth observation with the comment: "This reddish brownish layer of our atmosphere is facinating- it's made of O and OH and is only seen in certain areas".

ISS043E193779 (05/14/2015) --- Sunrise as experienced from the International Space Station and the Expedition 43 crew.
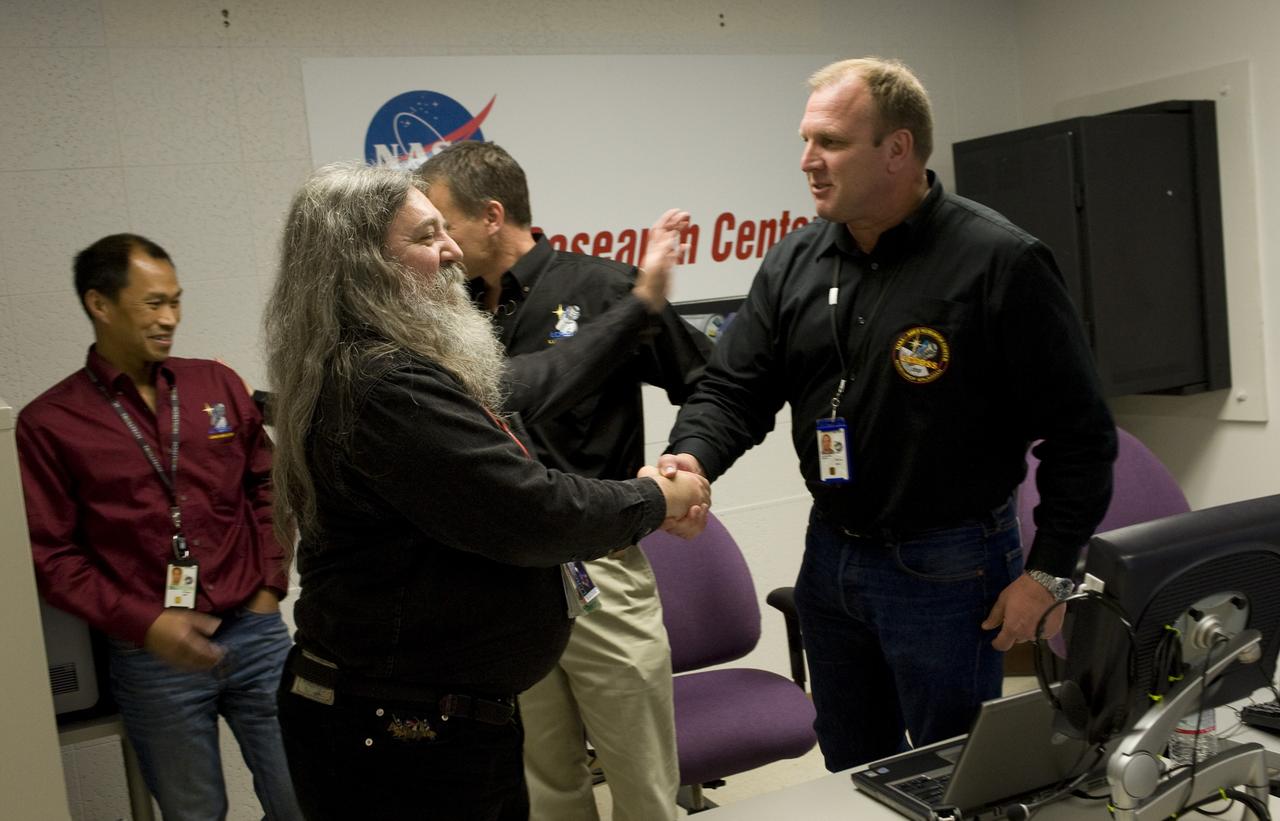
LCROSS Impact Night From left to right: Khanh Trinh (Simulator Engineer), and Dan Andrews (LCROSS Project Manager) in background, John Bresina (Command Sequencing Engineer), and John Schreiner (Mission Operations Manager), shake hands after confirmation the LCROSS spacecraft successfully impacted its target crater on the moon.
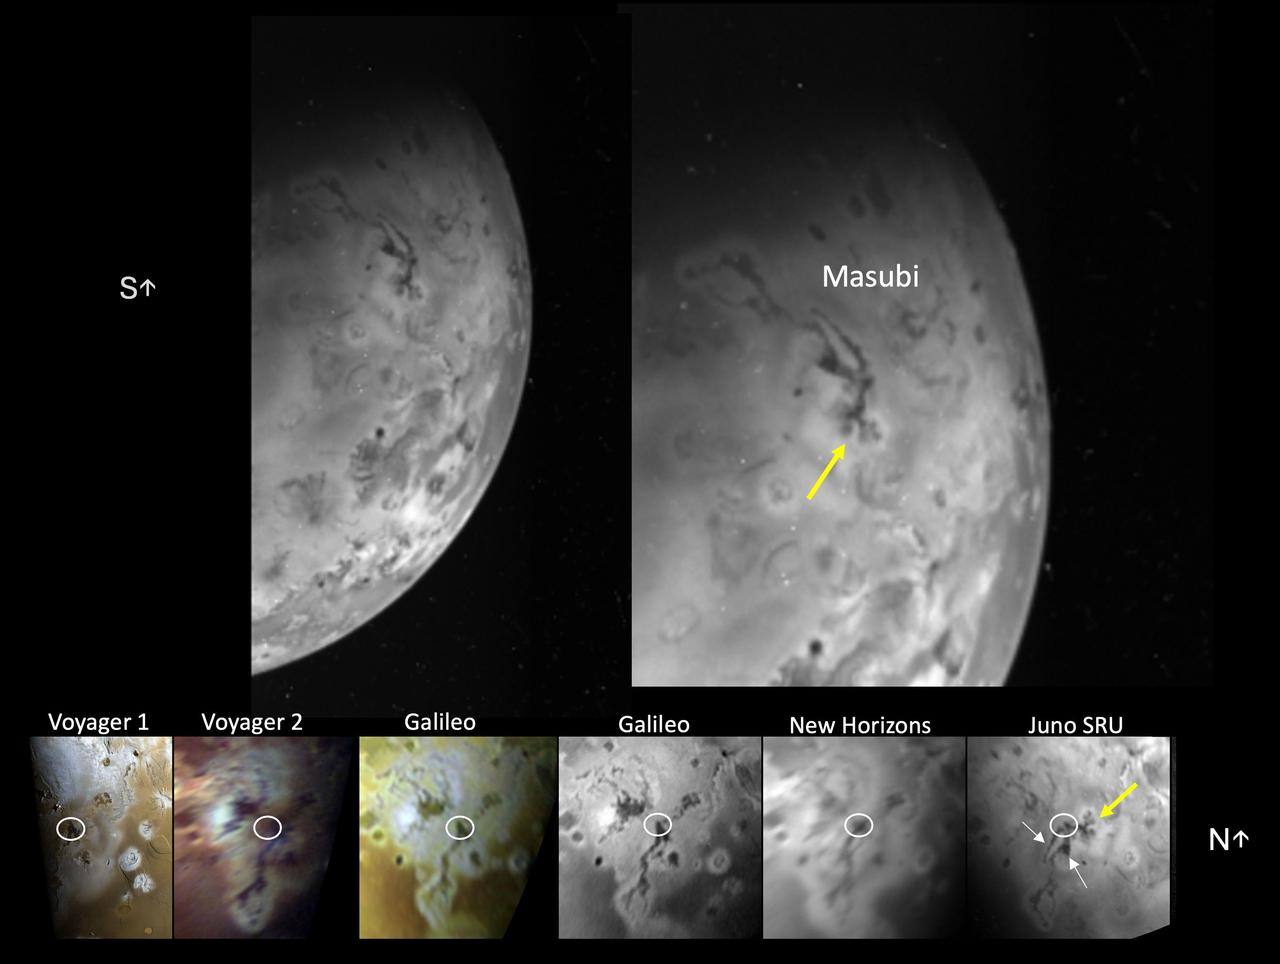
The Stellar Reference Unit (SRU) on NASA's Juno spacecraft collected this visible wavelength image of Io's night side while the surface was illuminated by Jupiter-shine on April 4, 2024. The image features the large compound flow field, Masubi, located on Io's southern hemisphere. Masubi was first observed by NASA's Voyager 1 in 1979 and has continued to expand ever since. A co-registered time sequence of Masubi observations covering 45 years is shown in the bottom panel. The location of the plume first observed by Galileo is circled in white in each image of the time sequence. The SRU observed even further expansion of pre-existing flows (white arrows) and two new flows with multiple lobes (yellow arrow). As of April 4, 2024, Masubi's total compound flow length is about 994 miles (1,600 kilometers), making it the longest currently active lava flow in the solar system. https://photojournal.jpl.nasa.gov/catalog/PIA26524

Taking advantage of extra solar energy collected during the day, NASA's Mars Exploration Rover Spirit settled in for an evening of stargazing, photographing the two moons of Mars as they crossed the night sky. The first two images in this sequence show gradual enhancements in the surface detail of Mars' largest moon, Phobos, made possible through a combination technique known as "stacking." In "stacking," scientists use a mathematical process known as Laplacian sharpening to reinforce features that appear consistently in repetitive images and minimize features that show up only intermittently. In this view of Phobos, the large crater named Stickney is just out of sight on the moon's upper right limb. Spirit acquired the first two images with the panoramic camera on the night of sol 585 (Aug. 26,2005). The far right image of Phobos, for comparison, was taken by the High Resolution Stereo Camera on Mars Express, a European Space Agency orbiter. The third image in this sequence was derived from the far right image by making it blurrier for comparison with the panoramic camera images to the left http://photojournal.jpl.nasa.gov/catalog/PIA06335
On Sept. 14, 2017, one day before making its final plunge into Saturn's atmosphere, NASA's Cassini spacecraft used its Ultraviolet Imaging Spectrograph, or UVIS, instrument to capture this final view of ultraviolet auroral emissions in the planet's north polar region. The view is centered on the north pole of Saturn, with lines of latitude visible for 80, 70 and 60 degrees. Lines of longitude are spaced 40 degrees apart. The planet's day side is at bottom, while the night side is at top. A sequence of images from this observation has also been assembled into a movie sequence. The last image in the movie was taken about an hour before the still image, which was the actual final UVIS auroral image. Auroral emissions are generated by charged particles traveling along the invisible lines of Saturn's magnetic field. These particles precipitate into the atmosphere, releasing light when they strike gas molecules there. Several individual auroral structures are visible here, despite that this UVIS view was acquired at a fairly large distance from the planet (about 424,000 miles or 683,000 kilometers). Each of these features is connected to a particular phenomenon in Saturn's magnetosphere. For instance, it is possible to identify auroral signatures here that are related to the injection of hot plasma from the dayside magnetosphere, as well as auroral features associated with a change in the magnetic field's shape on the magnetosphere's night side. Several possible scenarios have been postulated over the years to explain Saturn's changing auroral emissions, but researchers are still far from a complete understanding of this complicated puzzle. Researchers will continue to analyze the hundreds of image sequences UVIS obtained of Saturn's auroras during Cassini's 13-year mission, with many new discoveries likely to be made. This image and movie sequence were produced by the Laboratory for Planetary and Atmospheric Physics (LPAP) of the STAR Institute of the University of Liege in Belgium, in collaboration with the UVIS Team. The animation is available at https://photojournal.jpl.nasa.gov/catalog/PIA21899

This sequence of color-enhanced images shows how quickly the viewing geometry changes for NASA's Juno spacecraft as it swoops by Jupiter. The images were obtained by JunoCam. Once every 53 days, Juno swings close to Jupiter, speeding over its clouds. In just two hours, the spacecraft travels from a perch over Jupiter's north pole through its closest approach (perijove), then passes over the south pole on its way back out. This sequence shows 11 color-enhanced images from Perijove 8 (Sept. 1, 2017) with the south pole on the left (11th image in the sequence) and the north pole on the right (first image in the sequence). The first image on the right shows a half-lit globe of Jupiter, with the north pole approximately at the upper center of the image close to the terminator -- the dividing line between night and day. As the spacecraft gets closer to Jupiter, the horizon moves in and the range of visible latitudes shrinks. The second and third images in this sequence show the north polar region rotating away from the spacecraft's field of view while the first of Jupiter's lighter-colored bands comes into view. The fourth through the eighth images display a blue-colored vortex in the mid-southern latitudes near Points of Interest "Collision of Colours," "Sharp Edge," "Caltech, by Halka," and "Structure01." The Points of Interest are locations in Jupiter's atmosphere that were identified and named by members of the general public. Additionally, a darker, dynamic band can be seen just south of the vortex. In the ninth and tenth images, the south polar region rotates into view. The final image on the left displays Jupiter's south pole in the center. From the start of this sequence of images to the end, roughly 1 hour and 35 minutes elapsed. https://photojournal.jpl.nasa.gov/catalog/PIA21967 . - Enhanced image by Kevin M. Gill (CC-BY) based on images provided courtesy of NASA/JPL-Caltech/SwRI/MSSS
ISS043E108129 (04/11/2015) --- "Rainbow double Aurora" greet the astronauts and cosmonauts on board the International Space Station on Apr. 11, 2015 as a bonus during their busy workdays of science experiments, maintenance and operational duties.

ISS031-E-116058 (13 June 2012) --- Polar mesospheric clouds in the Northern Hemisphere are featured in this image photographed by an Expedition 31 crew member on the International Space Station. In both the Northern and Southern Hemisphere, during their respective late spring and early summer seasons, polar mesospheric clouds are at the peak of their visibility. Visible from the ground during twilight, aircraft in flight, and the International Space Station, they typically appear as delicate shining threads against the darkness of space?hence their other name of noctilucent or ?night-shining? clouds. On the same day this image was taken from the space station while it was passing over the night-darkened Tibetan Plateau, polar mesospheric clouds were also visible to aircraft flying above Canada. In addition to this still image, the space station crew took a time-lapse image sequence of polar mesospheric clouds several days earlier (June 5, 2012) while passing over western Asia; this is first such sequence of images of the phenomena taken from orbit. Polar mesospheric clouds form between 76-85 kilometers above the Earth?s surface, when there is sufficient water vapor at these high altitudes to freeze into ice crystals. The clouds are illuminated by the setting sun while the ground surface below is in darkness, lending them their night-shining properties. In addition to the illuminated tracery of polar mesospheric clouds trending across the center of the image, lower layers of the atmosphere are also illuminated; the lowest layer of the atmosphere, the stratosphere, is indicated by dim orange and red tones. While the exact cause of formation of polar mesospheric clouds is still debated?dust from meteors, global warming, and rocket exhaust have all been suggested as contributing factors?recent research suggests that changes in atmospheric gas composition or temperature has caused the clouds to become brighter over time.
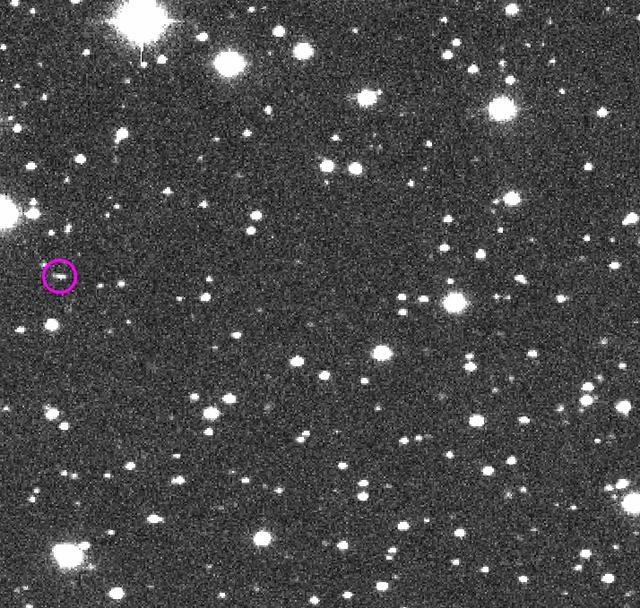
This frame from a sequence of four images taken during one night of observation by NASA's Catalina Sky Survey near Tucson, Arizona, shows the speck of light that moves relative to the background stars is a small asteroid that was, at the time, about as far away as the moon. This asteroid, named 2014 AA, was the second one ever detected on course to impact Earth. It was estimated to be about 6 to 10 feet (2 to 3 meters) in diameter, and it harmlessly hit Earth's atmosphere over the Atlantic Ocean about 20 hours after its discovery in these images. The images were taken Jan. 1, 2014. They provide an example of how asteroids are typically discovered by detection of their motion relative to background stars. An animation is available at https://photojournal.jpl.nasa.gov/catalog/PIA21712
Cassini gazed toward high southern latitudes near Saturn's south pole to observe ghostly curtains of dancing light -- Saturn's southern auroras, or southern lights. These natural light displays at the planet's poles are created by charged particles raining down into the upper atmosphere, making gases there glow. The dark area at the top of this scene is Saturn's night side. The auroras rotate from left to right, curving around the planet as Saturn rotates over about 70 minutes, compressed here into a movie sequence of about five seconds. Background stars are seen sliding behind the planet. Cassini was moving around Saturn during the observation, keeping its gaze fixed on a particular spot on the planet, which causes a shift in the distant background over the course of the observation. Some of the stars seem to make a slight turn to the right just before disappearing. This effect is due to refraction -- the starlight gets bent as it passes through the atmosphere, which acts as a lens. Random bright specks and streaks appearing from frame to frame are due to charged particles and cosmic rays hitting the camera detector. The aim of this observation was to observe seasonal changes in the brightness of Saturn's auroras, and to compare with the simultaneous observations made by Cassini's infrared and ultraviolet imaging spectrometers. The original images in this movie sequence have a size of 256x256 pixels; both the original size and a version enlarged to 500x500 pixels are available here. The small image size is the result of a setting on the camera that allows for shorter exposure times than full-size (1024x1024 pixel) images. This enabled Cassini to take more frames in a short time and still capture enough photons from the auroras for them to be visible. The images were taken in visible light using the Cassini spacecraft narrow-angle camera on July 20, 2017, at a distance of about 620,000 miles (1 million kilometers) from Saturn. The views look toward 74 degrees south latitude on Saturn. Image scale is about 0.9 mile (1.4 kilometers) per pixel on Saturn. An animation is available at https://photojournal.jpl.nasa.gov/catalog/PIA21623
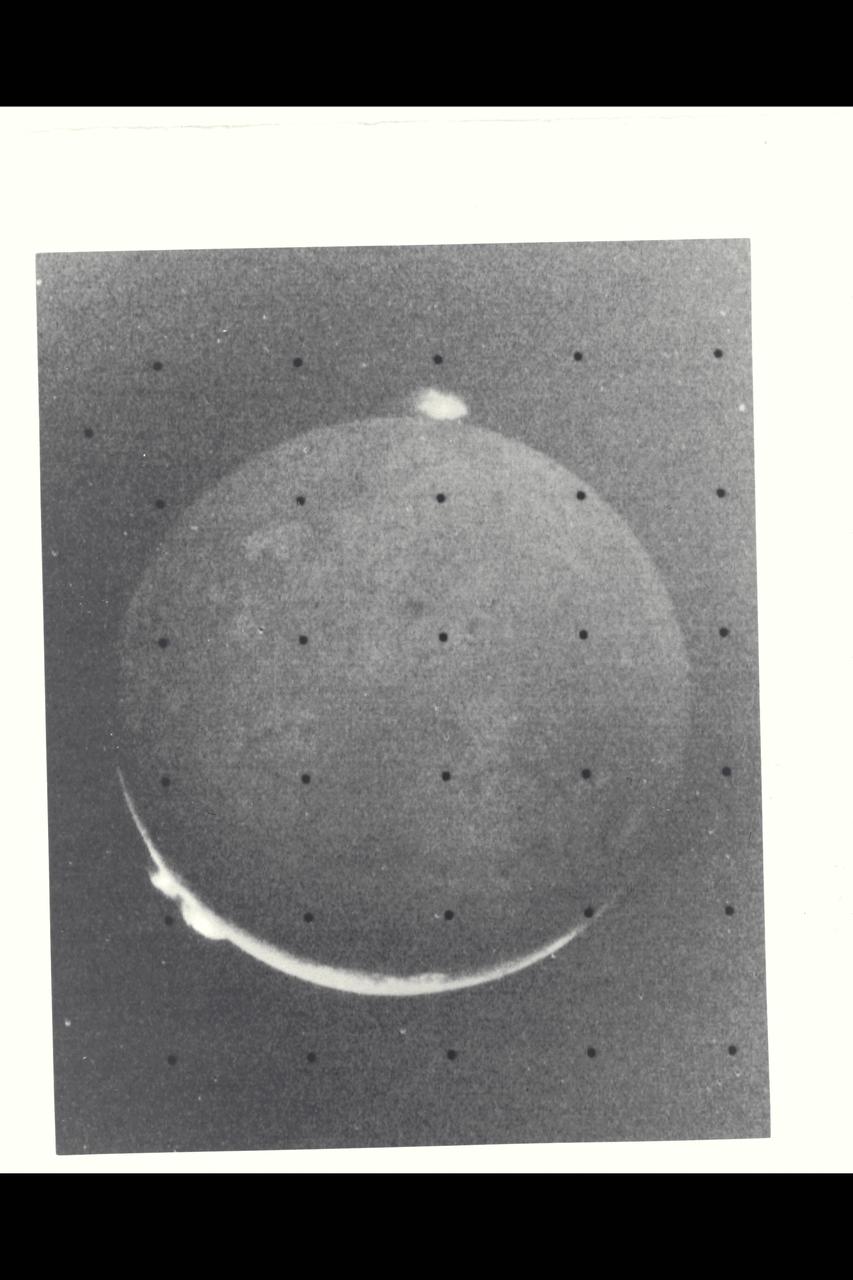
Range : 1.2 million kilometers (750,000 miles) This picture of Io is one of the last sequence of 'volcano watch' pictures planned as a time lapse study of the nearest of Jupiter's Galilean satellites. The sunlit crescent of Io is seen at the left, and the night side illuminated by light reflected from Jupiter can also be seen. Three volcanic eruption plumes are visible on the limb. All three were previously seen by Voyager 1. On the bright limb Plume 5 (upper) and Plume 6 (lower) are about 100 km high, while Plume 2 on the dark limb is about 185 km high and 325 km wide. The dimensions of Plume 2 are about 1 1/2 times greater than during the Boyager 1 encounter, indicating that the intensity of the eruptions has increased during the four-month time interval between the Boyager encounters. The three volcanic eruptions and at least three others have apparently been active at roughly the same intesity or greater for a period of at least four months.

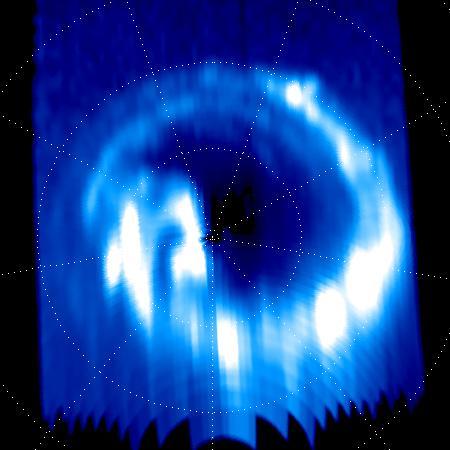
These mosaics of Jupiter's night side show the Jovian aurora at approximately 45 minute intervals as the auroral ring rotated with the planet below the spacecraft. The images were obtained by the Solid State Imaging (SSI) system on NASA's Galileo spacecraft. during its eleventh orbit of Jupiter. The auroral ring is offset from Jupiter's pole of rotation and reaches the lowest latitude near 165 degrees west longitude. The aurora is hundreds of kilometers wide, and when it crosses the edge of Jupiter, it is about 250 kilometers above the planet. As on Earth, the auroral emission is caused by electrically charged particles striking atoms in the upper atmosphere from above. The particles travel along Jupiter's magnetic field lines, but their origin is not fully understood. The field lines where the aurora is most intense cross the Jovian equator at large distances (many Jovian radii) from the planet. The faint background throughout the image is scattered light in the camera. This stray light comes from the sunlit portion of Jupiter, which is out of the image. In multispectral observations the aurora appears red, consistent with how atomic hydrogen in Jupiter's atmosphere would glow. Galileo's unique perspective allows it to view the night side of the planet at short range, revealing details that cannot be seen from Earth. These detailed features are time dependent, and can be followed in this sequence of Galileo images. In the first mosaic, the auroral ring is directly over Jupiter's limb and is seen "edge on." In the fifth mosaic, the auroral emission is coming from several distinct bands. This mosaic also shows the footprint of the Io flux tube. Volcanic eruptions on Jupiter's moon, Io, spew forth particles that become ionized and are pulled into Jupiter's magnetic field to form an invisible tube, the Io flux tube, between Jupiter and Io. The bright circular feature towards the lower right may mark the location where these energetic particles impact Jupiter. Stars which are visible in some of the images enable precise determination of where the camera is pointed. This has allowed the first three dimensional establishment of the position of the aurora. Surprisingly, the measured height is about half the altitude (above the one bar pressure level) predicted by magnetospheric models. The Universal Time, in Spacecraft Event Time (SCET), that the images were taken is listed beneath each mosaic. The first four frames were taken on November 5, 1997 (SCET 97.309) before the Galileo spacecraft reached perijove, the closest point to Jupiter. The latter four were taken three days later on November 8, 1997 (SCET 97.312), after perijove. Each image was taken at visible wavelengths and is displayed in shades of blue. North is at the top of the picture. A grid of planetocentric latitude and west longitude is overlain on the images. The resolution in the plane of the pictures is 15 kilometers per picture element. The images were taken at a range of 1.3 million kilometers. http://photojournal.jpl.nasa.gov/catalog/PIA01600
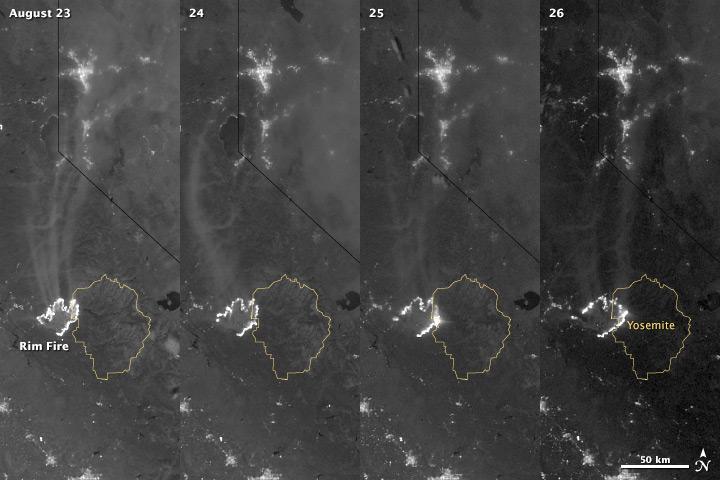
The winter of 2013 was among the driest on record for California, setting the stage for an active fire season. By August 26, the Rim Fire had made its way into the record books. At just 15 percent contained, the fire is now the 13th largest in California since records began in 1932. Apart from being large, the fire is also threatening one of the United States’ greatest natural treasures: Yosemite National Park. The Visible Infrared Imaging Radiometer Suite (VIIRS) on the Suomi NPP satellite tracked the growth of the fire between August 23 and August 26 in this series of nighttime images. The VIIRS day-night band is extremely sensitive to low light, making it possible to see the fire front from space. The brightest, most intense parts of the fire glow white, exceeding the brightness of the lights of Reno, Nevada to the north. Pale gray smoke streams north away from the fire throughout the sequence. The perimeter of the fire grows from day to day along different fronts, depending on winds and fire fighting efforts. On August 24, fire fighters focused their efforts on containing the western edge of the fire to prevent it from burning into Tuolumne City and the populated Highway 108 corridor. They also fought the eastern edge of the fire to protect Yosemite National Park. These efforts are evident in the image: Between August 23 and 24, the eastern edge of the fire held steady, and the western edge receded. The fire grew in the southeast. On the morning of August 25 fire managers reported that the fire was growing in the north and east. In the image, the most intense activity is just inside Yosemite National Park. Fire fighters reported that the Rim Fire continued to be extremely active on its eastern front on the morning of August 26, and this activity is visible in the image. By 8:00 a.m., the fire had burned 149,780 acres. The fire forced firefighters in Yosemite National Park to take measures to protect the Merced and Tuolumne Groves of Giant Sequoias, but the National Park Service reported that the trees were not in imminent danger. While parts of the park are closed, webcams show that most of the park has not been impacted. The Rim Fire started on the afternoon of August 17. It has destroyed 23 structures and threatened 4,500 other buildings. Its cause is under investigation. More details: <a href="http://1.usa.gov/18ilEAA" rel="nofollow">1.usa.gov/18ilEAA</a> NASA Earth Observatory image by Jesse Allen and Robert Simmon, using VIIRS Day Night Band data. Caption by Holli Riebeek. Instrument: Suomi NPP - VIIRS <b><a href="http://www.nasa.gov/audience/formedia/features/MP_Photo_Guidelines.html" rel="nofollow">NASA image use policy.</a></b> <b><a href="http://www.nasa.gov/centers/goddard/home/index.html" rel="nofollow">NASA Goddard Space Flight Center</a></b> enables NASA’s mission through four scientific endeavors: Earth Science, Heliophysics, Solar System Exploration, and Astrophysics. Goddard plays a leading role in NASA’s accomplishments by contributing compelling scientific knowledge to advance the Agency’s mission. <b>Follow us on <a href="http://twitter.com/NASA_GoddardPix" rel="nofollow">Twitter</a></b> <b>Like us on <a href="http://www.facebook.com/pages/Greenbelt-MD/NASA-Goddard/395013845897?ref=tsd" rel="nofollow">Facebook</a></b> <b>Find us on <a href="http://instagram.com/nasagoddard?vm=grid" rel="nofollow">Instagram</a></b>
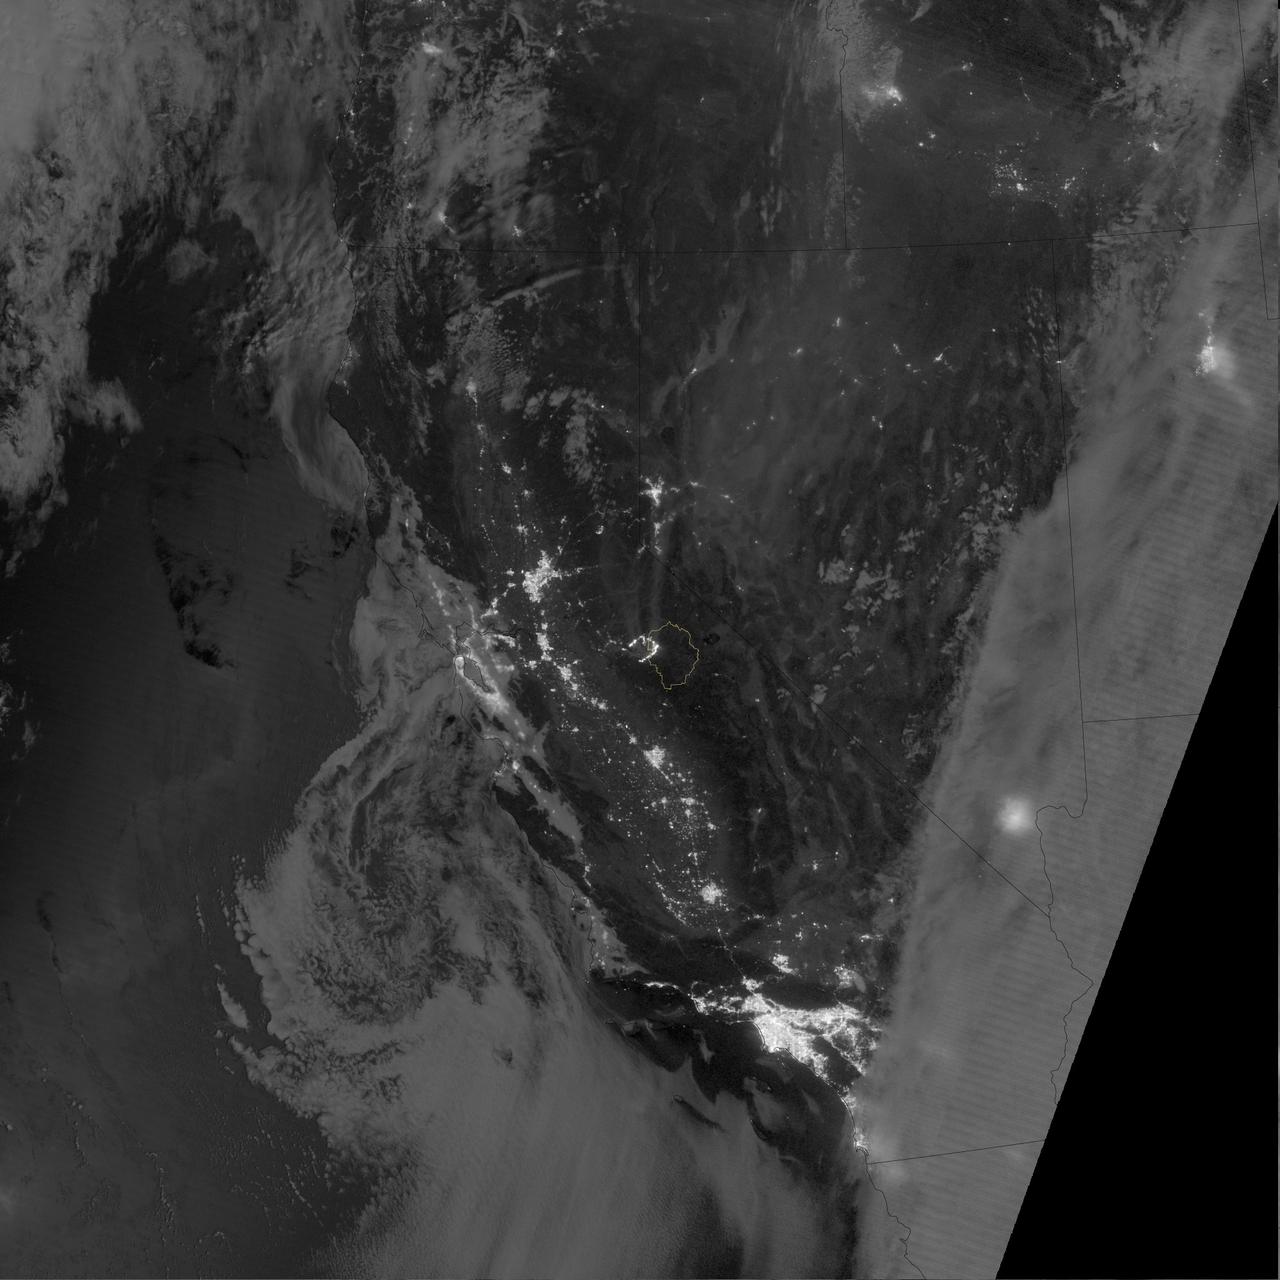
The winter of 2013 was among the driest on record for California, setting the stage for an active fire season. By August 26, the Rim Fire had made its way into the record books. At just 15 percent contained, the fire is now the 13th largest in California since records began in 1932. Apart from being large, the fire is also threatening one of the United States’ greatest natural treasures: Yosemite National Park. The Visible Infrared Imaging Radiometer Suite (VIIRS) on the Suomi NPP satellite tracked the growth of the fire between August 23 and August 26 in a series of nighttime images. The VIIRS day-night band is extremely sensitive to low light, making it possible to see the fire front from space. The brightest, most intense parts of the fire glow white, exceeding the brightness of the lights of Reno, Nevada to the north. Pale gray smoke streams north away from the fire throughout the sequence. The perimeter of the fire grows from day to day along different fronts, depending on winds and fire fighting efforts. On August 24, fire fighters focused their efforts on containing the western edge of the fire to prevent it from burning into Tuolumne City and the populated Highway 108 corridor. They also fought the eastern edge of the fire to protect Yosemite National Park. These efforts are evident in the image: Between August 23 and 24, the eastern edge of the fire held steady, and the western edge receded. The fire grew in the southeast. On the morning of August 25 fire managers reported that the fire was growing in the north and east. In the image, the most intense activity is just inside Yosemite National Park. Fire fighters reported that the Rim Fire continued to be extremely active on its eastern front on the morning of August 26, and this activity is visible in the image. By 8:00 a.m., the fire had burned 149,780 acres. The fire forced firefighters in Yosemite National Park to take measures to protect the Merced and Tuolumne Groves of Giant Sequoias, but the National Park Service reported that the trees were not in imminent danger. While parts of the park are closed, webcams show that most of the park has not been impacted. The Rim Fire started on the afternoon of August 17. It has destroyed 23 structures and threatened 4,500 other buildings. Its cause is under investigation. More details: <a href="http://1.usa.gov/18ilEAA" rel="nofollow">1.usa.gov/18ilEAA</a> NASA Earth Observatory image by Jesse Allen and Robert Simmon, using VIIRS Day Night Band data. Caption by Holli Riebeek. Instrument: Suomi NPP - VIIRS <b><a href="http://www.nasa.gov/audience/formedia/features/MP_Photo_Guidelines.html" rel="nofollow">NASA image use policy.</a></b> <b><a href="http://www.nasa.gov/centers/goddard/home/index.html" rel="nofollow">NASA Goddard Space Flight Center</a></b> enables NASA’s mission through four scientific endeavors: Earth Science, Heliophysics, Solar System Exploration, and Astrophysics. Goddard plays a leading role in NASA’s accomplishments by contributing compelling scientific knowledge to advance the Agency’s mission. <b>Follow us on <a href="http://twitter.com/NASA_GoddardPix" rel="nofollow">Twitter</a></b> <b>Like us on <a href="http://www.facebook.com/pages/Greenbelt-MD/NASA-Goddard/395013845897?ref=tsd" rel="nofollow">Facebook</a></b> <b>Find us on <a href="http://instagram.com/nasagoddard?vm=grid" rel="nofollow">Instagram</a></b>

The veils of Saturn's most mysterious moon have begun to lift in Cassini's eagerly awaited first glimpse of the surface of Titan, a world where scientists believe organic matter rains from hazy skies and seas of liquid hydrocarbons dot a frigid surface. Surface features previously observed only from Earth-based telescopes are now visible in images of Titan taken in mid-April by Cassini through one of the narrow angle camera's spectral filters specifically designed to penetrate the thick atmosphere. The image scale is 230 kilometers (143 miles) per pixel, and it rivals the best Earth-based images. The two images displayed here show Titan from a vantage point 17 degrees below its equator, yielding a view from 50 degrees north latitude all the way to its south pole. The image on the left was taken four days after the image on the right. Titan rotated 90 degrees in that time. The two images combined cover a region extending halfway around the moon. The observed brightness variations suggest a diverse surface, with variations in average reflectivity on scales of a couple hundred kilometers. The images were taken through a narrow filter centered at 938 nanometers, a spectral region in which the only obstacle to light is the carbon-based, organic haze. Despite the rather long 38-second exposure times, there is no noticeable smear due to spacecraft motion. The images have been magnified 10 times and enhanced in contrast to bring out details. No further processing to remove the effects of the overlying atmosphere has been performed. The superimposed grid over the images illustrates the orientation of Titan -- north is up and rotated 25 degrees to the left -- as well as the geographical regions of the satellite that are illuminated and visible. The yellow curve marks the position of the boundary between day and night on Titan. The enhanced image contrast makes the region within 20 degrees of this day and night division darker than usual. The Sun illuminates Titan from the right at a phase angle of 66 degrees. Because the Sun is in the southern hemisphere as seen from Titan, the north pole is canted relative to the boundary between day and night by 25 degrees. Also shown here is a map of relative surface brightness variations on Titan as measured in images taken in the 1080-nanometer spectral region in 1997 and 1998 by the Near Infrared Camera and Multi-Object Spectrometer on NASA's Hubble Space Telescope. These images have scales of 300 kilometers (186 miles) per pixel. The map colors indicate different surface reflectivities. From darkest to brightest, the color progression is: deep blue (darkest), light blue, green, yellow, red and deep red (brightest). The large, continent-sized, red feature extending from 60 degrees to 150 degrees west longitude is called Xanadu. It is unclear whether Xanadu is a mountain range, giant basin, smooth plain, or a combination of all three. It may be dotted with hydrocarbon lakes but that is also unknown. All that is presently known is that in Earth-based images, it is the brightest region on Titan. A comparison between the Cassini images and the Hubble map indicates that Xanadu is visible as a bright region in the Cassini image on the right. The dark blue northwest-southeast trending feature from 210 degrees to 250 degrees west longitude, and the bright yellow/green region to the east (right) and southeast of it at minus 50 degrees latitude and 180 to 230 degrees west longitude on the Hubble map, can both be seen in the image on the left. It is noteworthy that the surface is visible to Cassini from its present approach viewing geometry, which is not the most favourable for surface viewing. These early Cassini observations are promising for upcoming imaging sequences of Titan in which the resolution improves by a factor of five over the next two months. These results are encouraging for future, in-orbit observations of Titan that will be acquired from lower, more favorable phase angles. The first opportunity to view small-scale features (2 kilometers or 1.2 miles) on the surface comes during a 350,000 kilometer (217,500 mile) flyby over Titan's south pole on July 2, 2004, only 30 hours after Cassini's insertion into orbit around the ringed planet. http://photojournal.jpl.nasa.gov/catalog/PIA05390