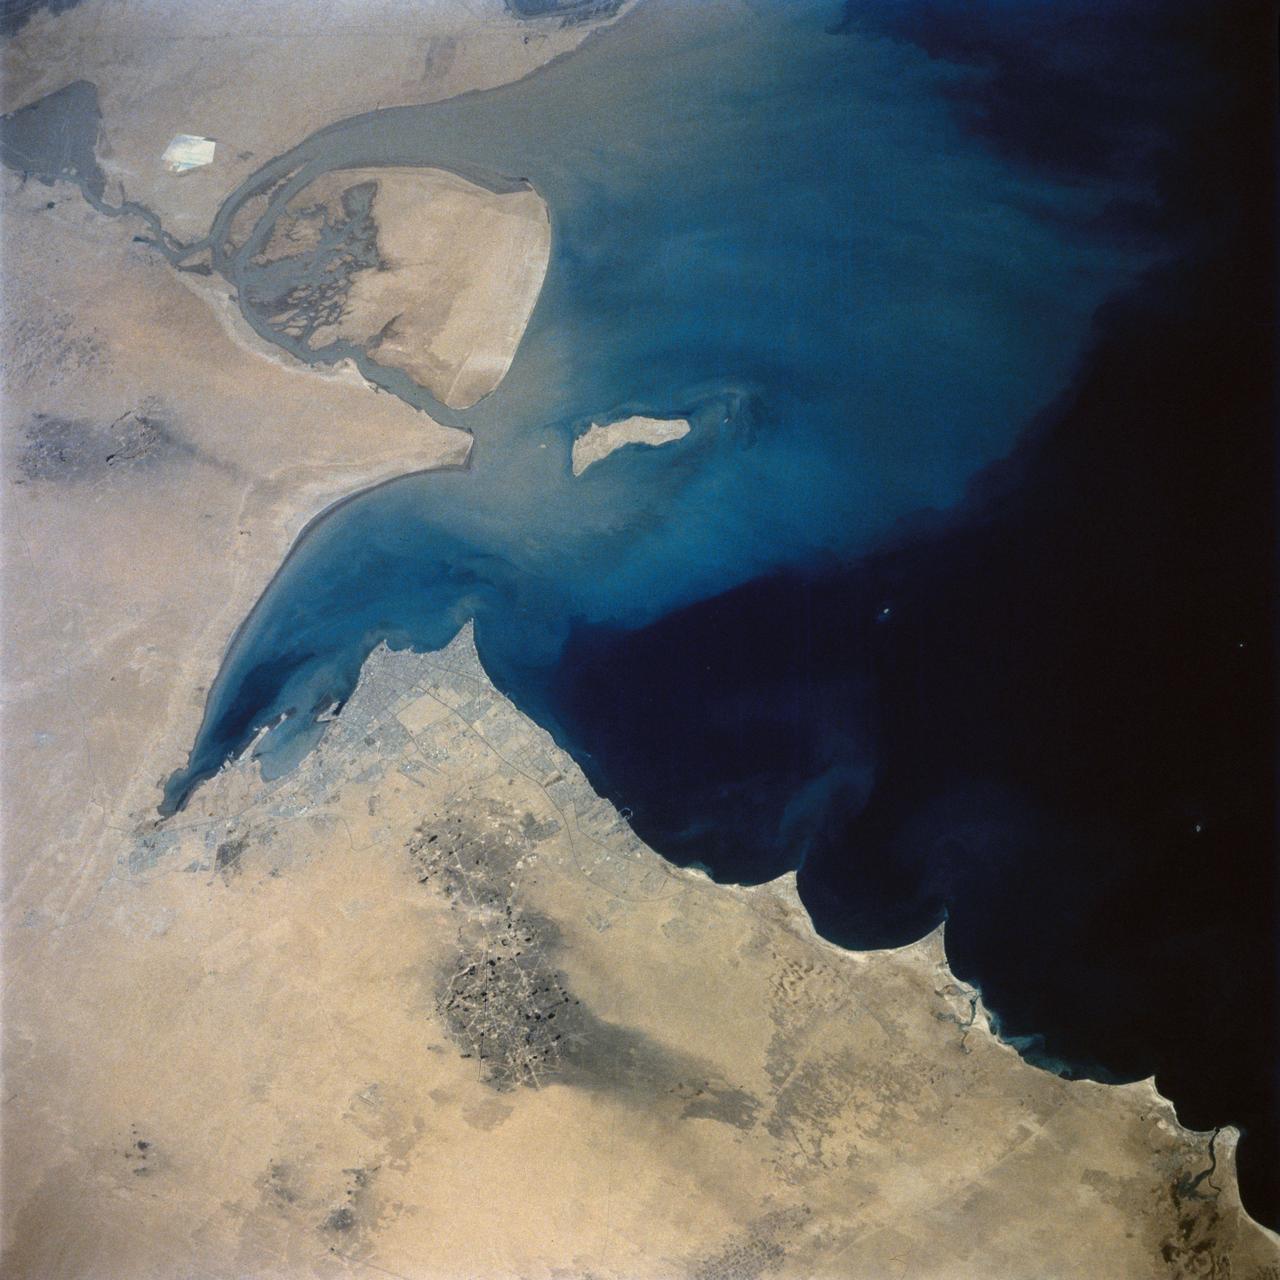
This view of the northern Persian Gulf shows Kuwait City and the Tigris and Euphrates River Deltas (29.5N, 48.5E). The oil laden sands and oil lakes of the Kuwait Oil Fields to the north and south of the city are clearly visible as dark patches surrounded by oil free desert sands. Comparison with earlier photos indicate that the oil laden sands are slowly being covered with clean sand carried by strong NW winds called Shmals.
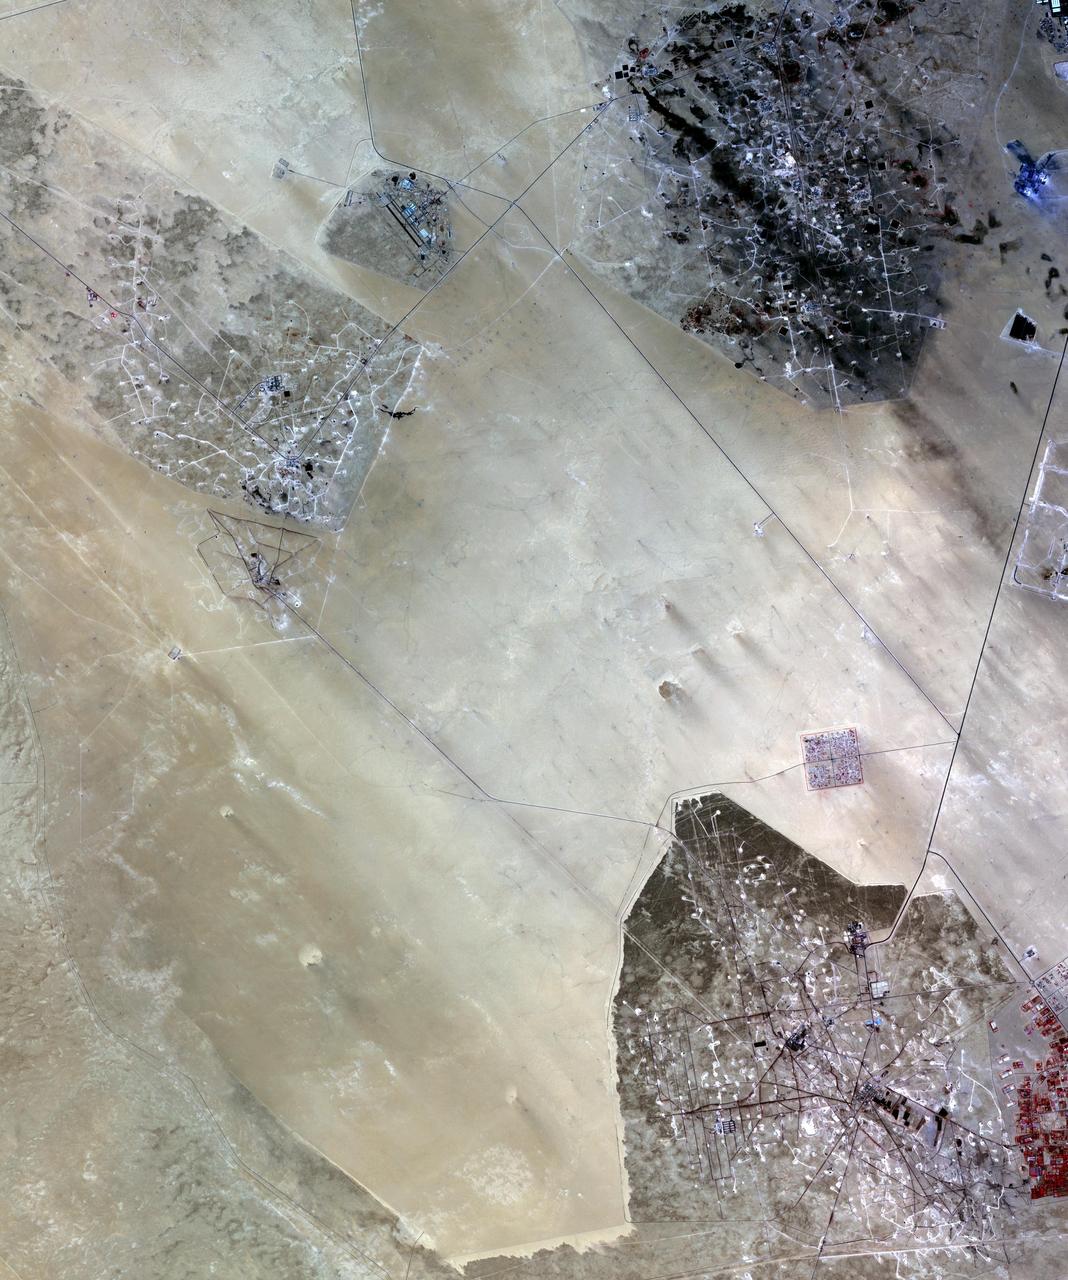
In the desert of southern Kuwait, three oil fields spread out across the empty landscape as seen by NASA Terra spacecraft.
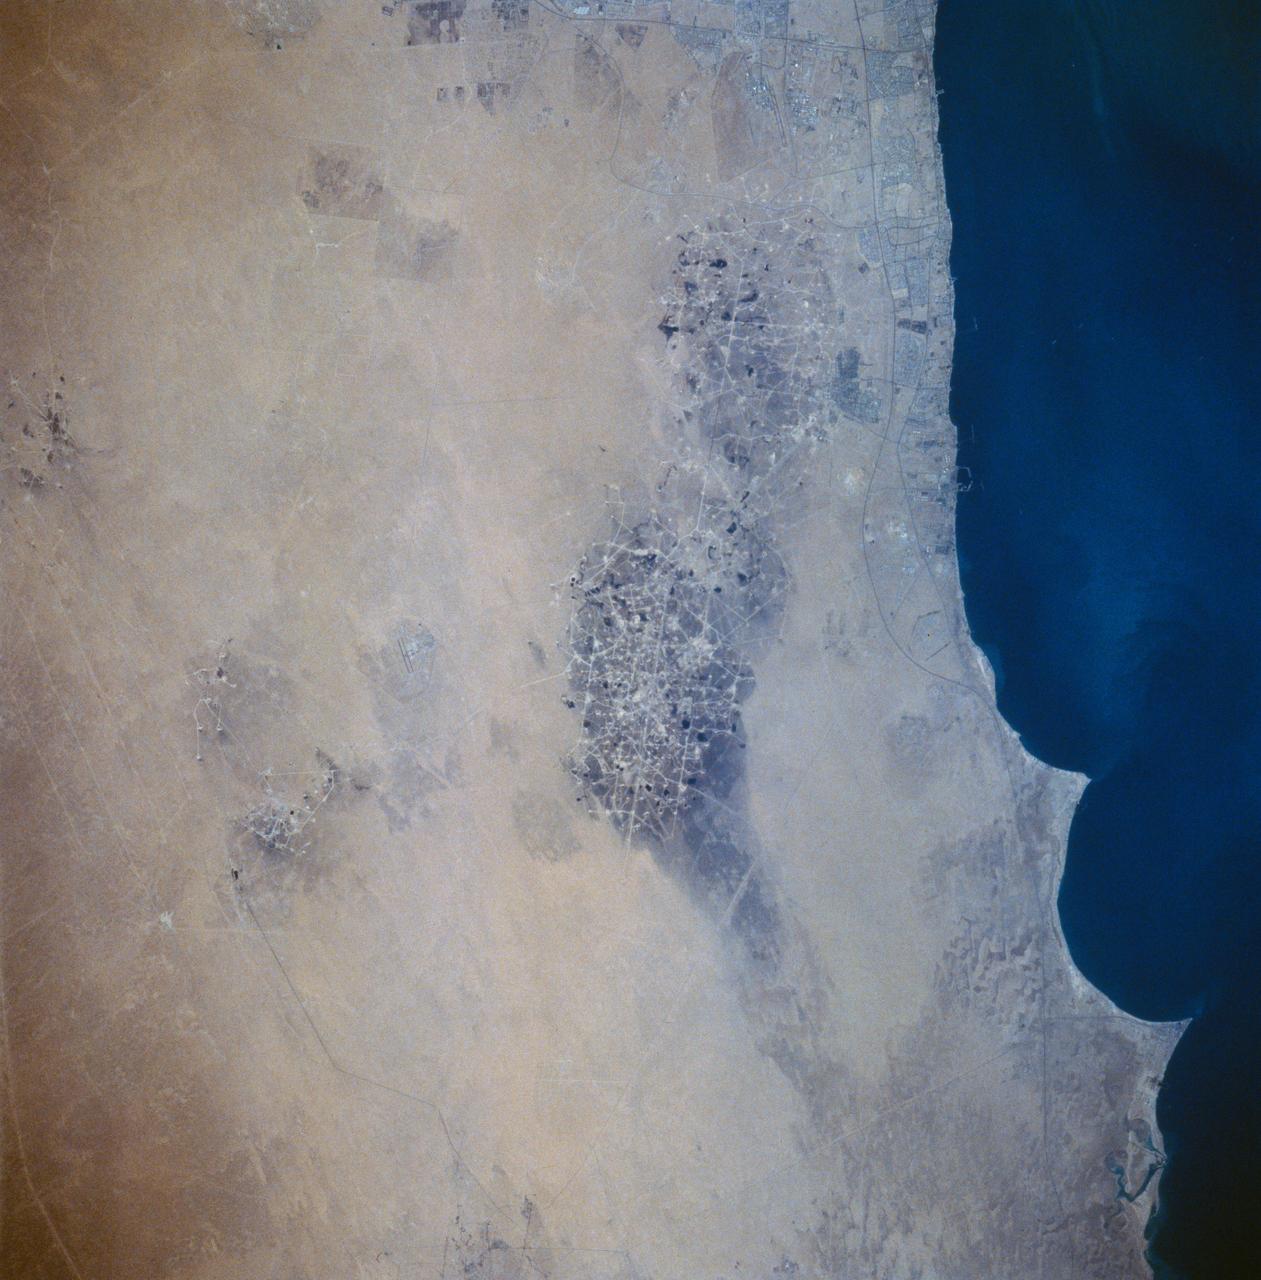
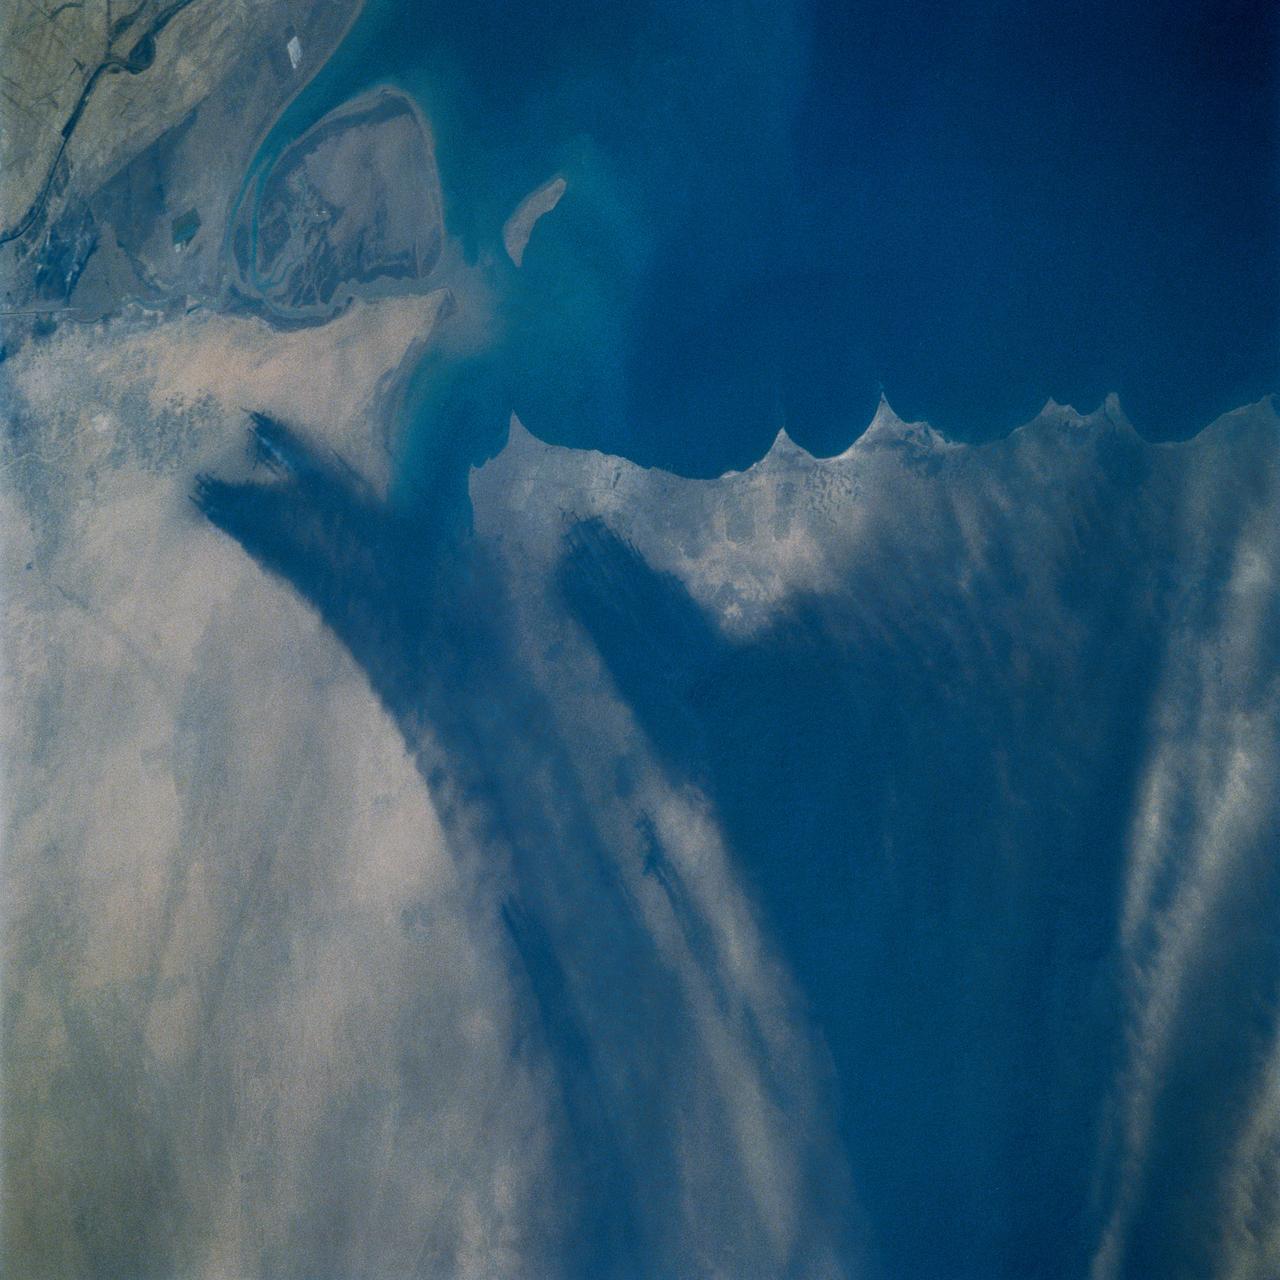
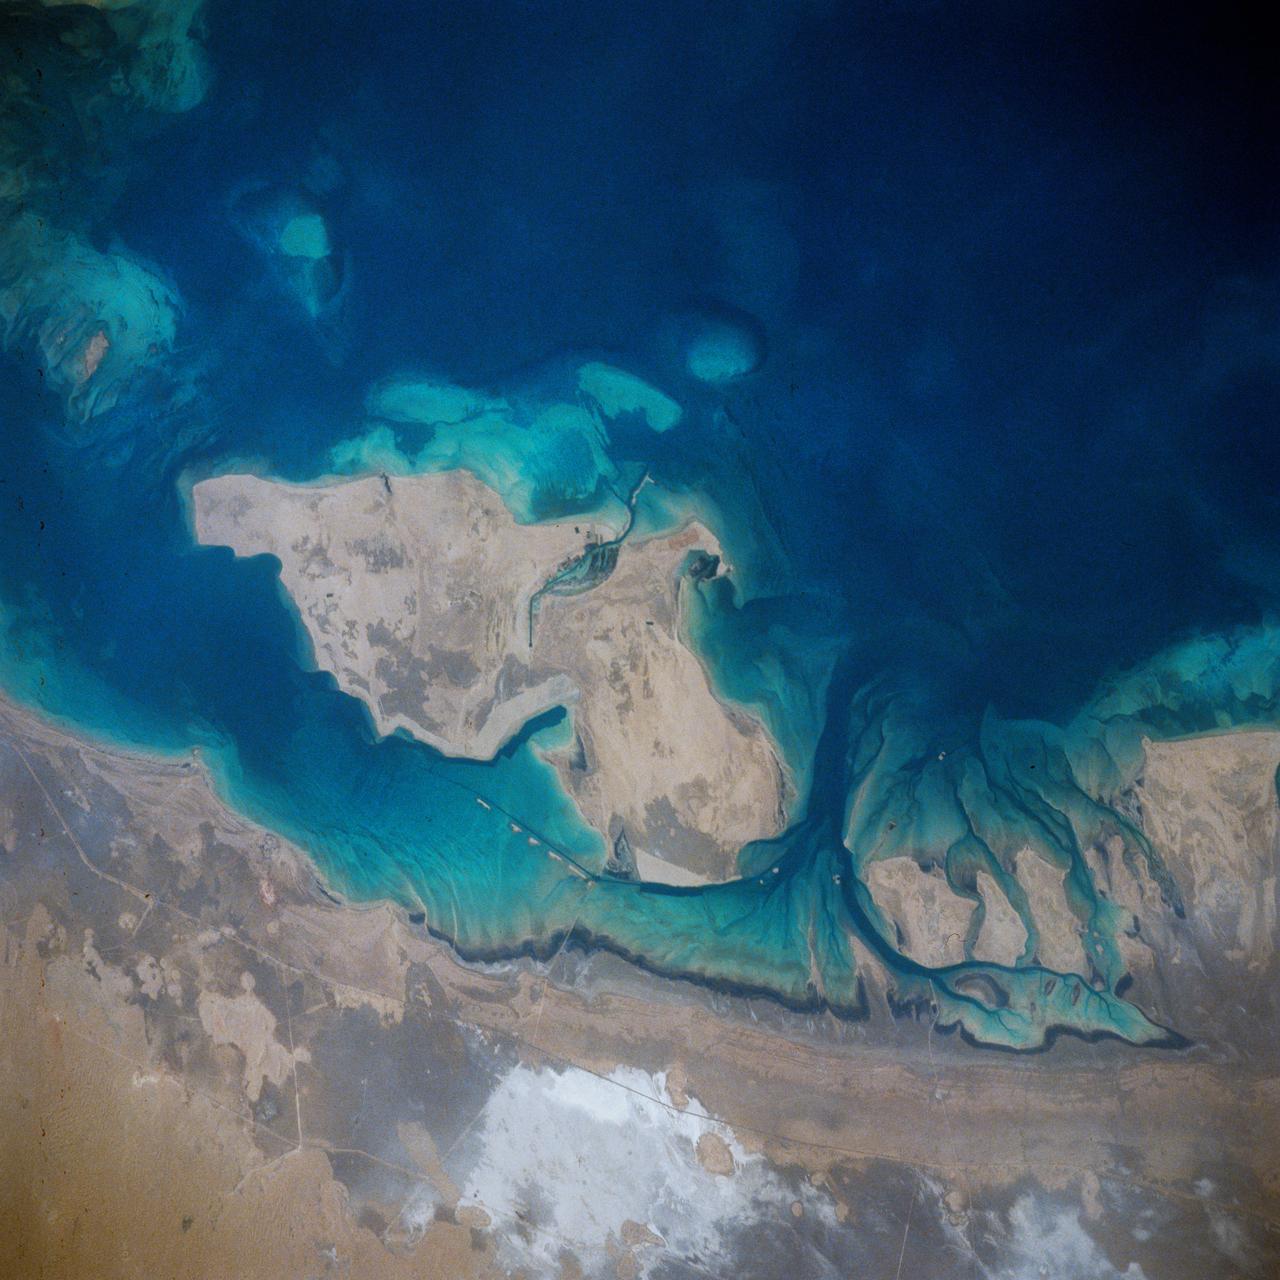
STS058-73-054 (18 Oct-1 Nov 1993) --- A clear view of the northern Kuwaiti coast shows the southern part of Kuwait City, and the major oil fields to the south. Oil-laden sands, where wells were set ablaze during the Gulf War in 1991, are visible south of Kuwait City as a dark, elongated patch surrounded by light-colored sand. Oil-stained sand between well sites (dots) and criss-crossing roads is gradually being covered by clean sand carried by strong, seasonal northwest winds.
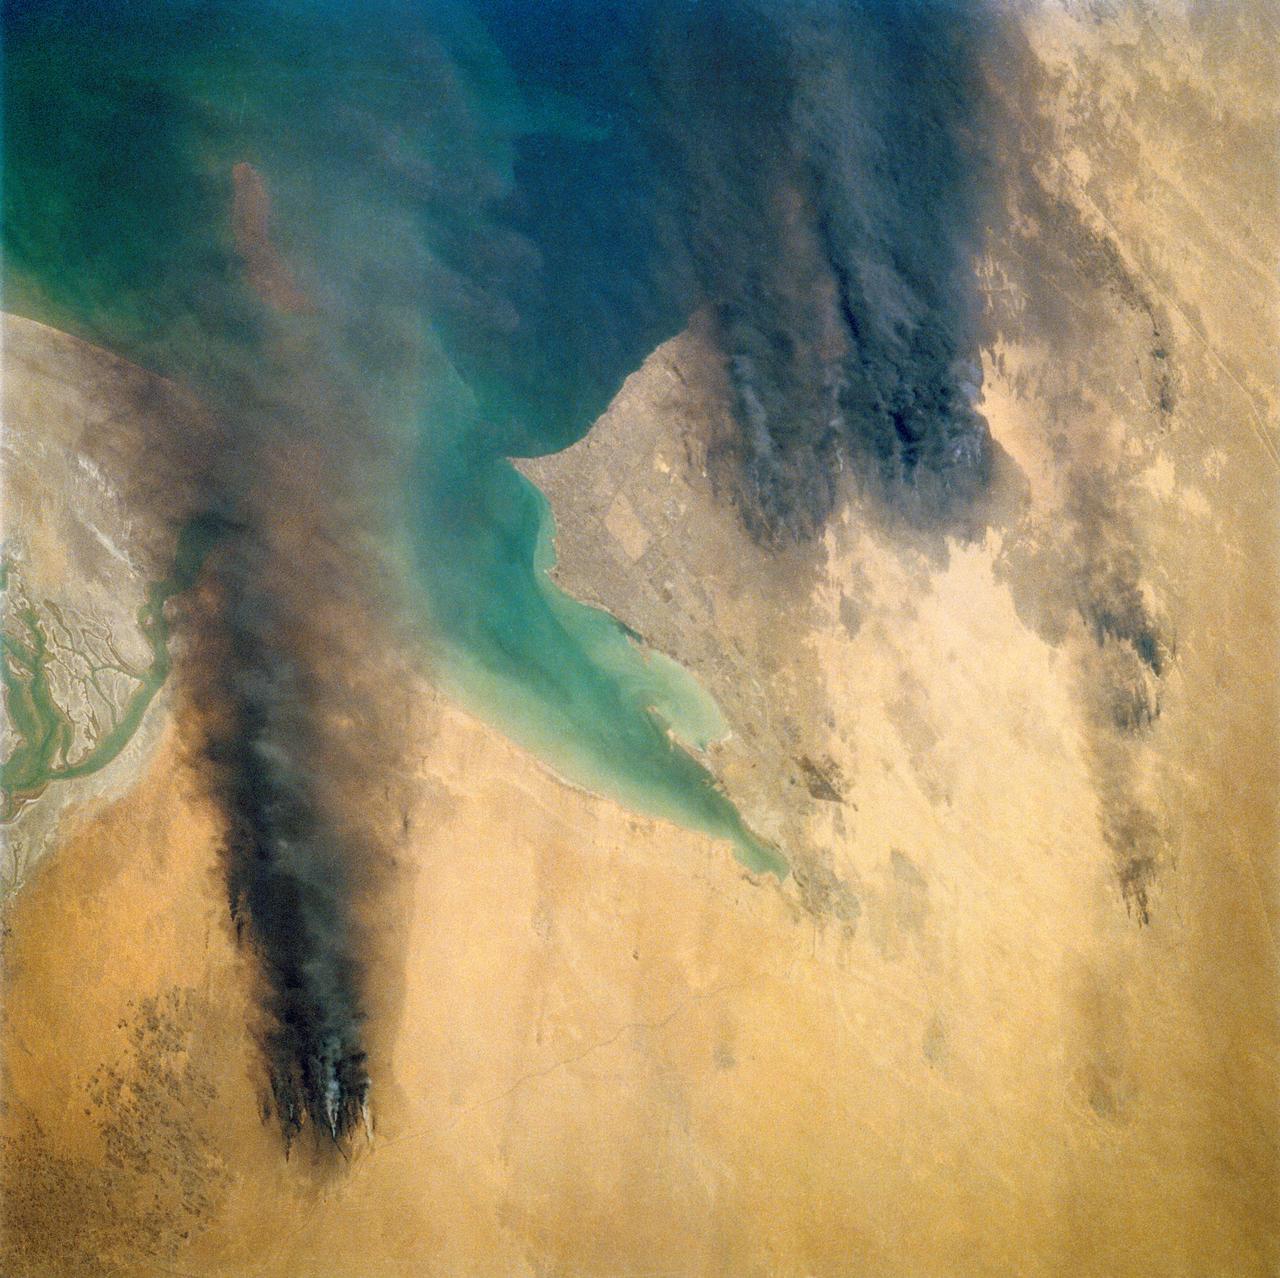
Smoke from the burning oil fields to the north of Kuwait City, seen on the south shore of Kuwayt Bay, almost totally obscures the view of the tiny, but oil rich, nation of Kuwait (30.0N, 48.0E). During the brief war between Iraq and the Allied forces, many of the oil wells in Kuwait were destroyed and set afire. For several months, those fires burned out of control, spewing wind borne smoke and ash for hundreds of miles.
Smoke from the burning oil fields to the north and south of Kuwait City, seen on the south shore of Kuwayt Bay almost totally obscures the view of the tiny, but oil rich, nation of Kuwait (29.0N, 48.0E). During the brief war between Iraq and the Allied forces, many of the oil wells in Kuwait were destroyed and set afire. For several months, those fires burned out of control, spewing wind borne smoke and ash for hundreds of miles.
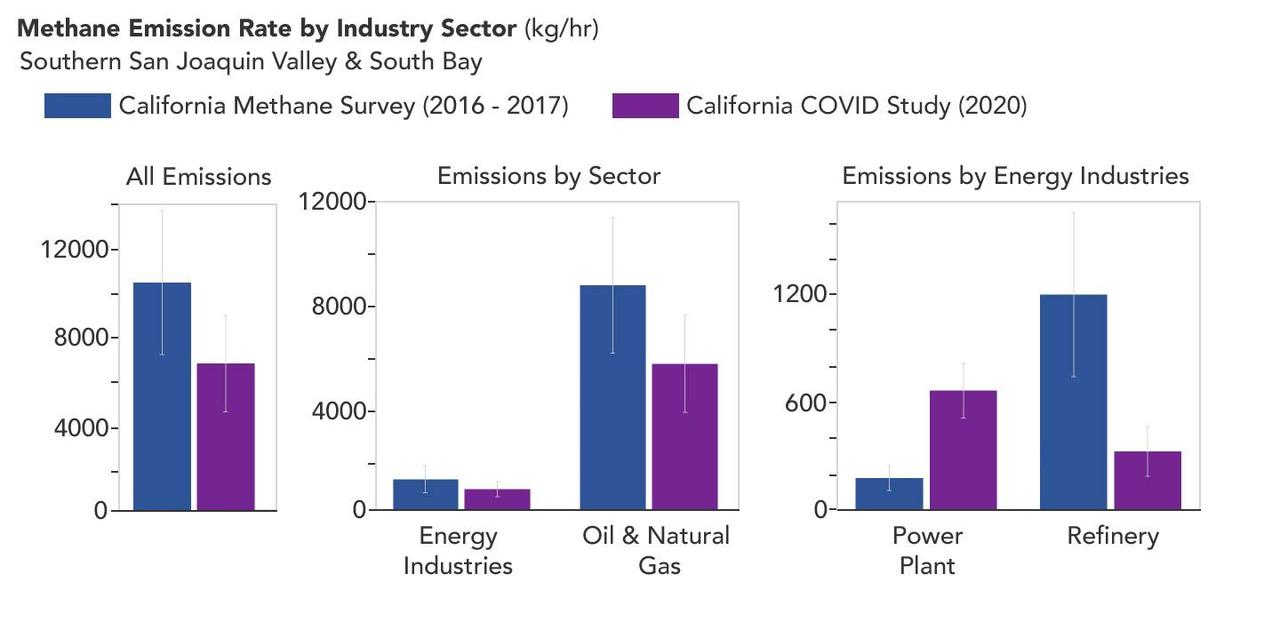
A March 2023 study by researchers at NASA's Jet Propulsion Laboratory in Southern California compared emissions from a belt of oil refineries across the South Bay area of Los Angeles during the first summer of the COVID-19 pandemic to those observed three years earlier. Using data from a NASA airborne instrument, researchers saw that most of the facilities they identified as methane sources in 2016-17 were no longer emitting the greenhouse gas in 2020, leading to a 73% reduction in measured emissions. The study uses measurements made by an imaging spectrometer called AVIRIS-NG (Airborne Visible/Infrared Imaging Spectrometer-Next Generation). Attached to the bottom of an aircraft, the instrument can detect greenhouse gas emissions from individual facilities or even pieces of equipment by looking at how the gases absorb sunlight. In 2016 and 2017, AVIRIS-NG was flown over 22,000 square miles (57,000 square kilometers) of the state as part of the California Methane Survey. From July to September 2020, researchers retraced some of those flight paths over refineries and power plants in Los Angeles County and over oil fields in central California's San Joaquin Valley. The flights were funded by NASA's Earth Science Division, the California Air Resources Board, and the California Energy Commission. The 2020 surveys over Los Angeles identified only 11 plumes from five refinery sources, with a total emissions rate of about 712 pounds (323 kilograms) methane per hour. The 2016 and 2017 flights had found 48 plumes from 33 sources, with a total emissions rate of roughly 2,639 pounds (1,197 kilograms) methane per hour. The drop correlates with an 18% decrease in monthly production in Southern California refineries between the two flight campaigns, the scientists noted, citing data from the California Energy Commission. The study also found that emissions from oil fields in and around the city of Bakersfield in central California fell 34.2%, correlating with a 24.2% drop in oil production. Reduced production during the pandemic due to lower demand for fuel and lower gas prices could have led to the drop in methane emissions, as oil fields and refineries emitted less methane as part of operations. However, researchers said, improved equipment maintenance and mitigation efforts at those facilities between 2016 and 2020 can't be ruled out as a factor. https://photojournal.jpl.nasa.gov/catalog/PIA25864
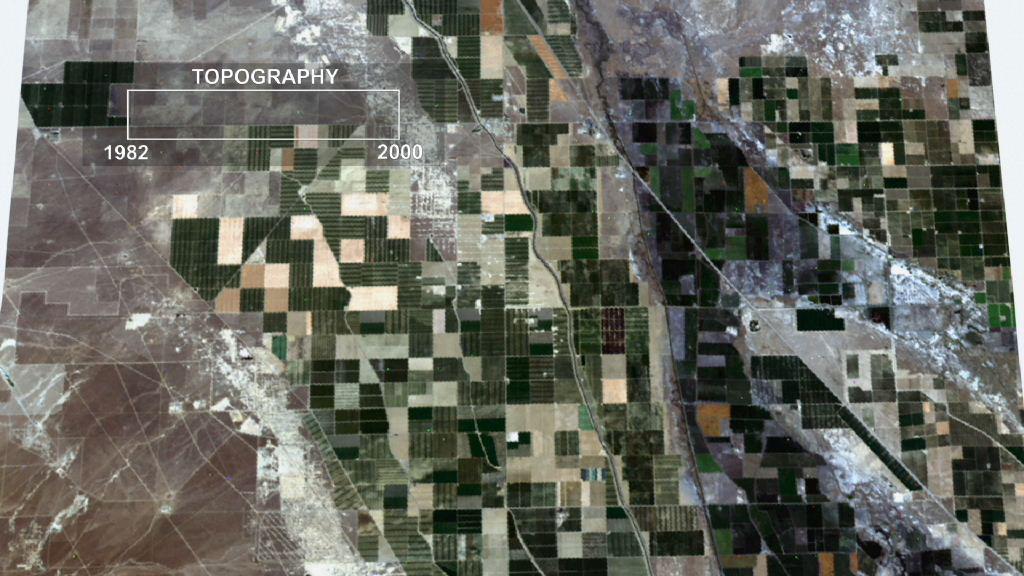
This frame from an animation depicts ground subsidence resulting from the extraction of oil. The oil fields are located near the community of Lost Hills, California, approximately 100 km northwest of Bakersfield.
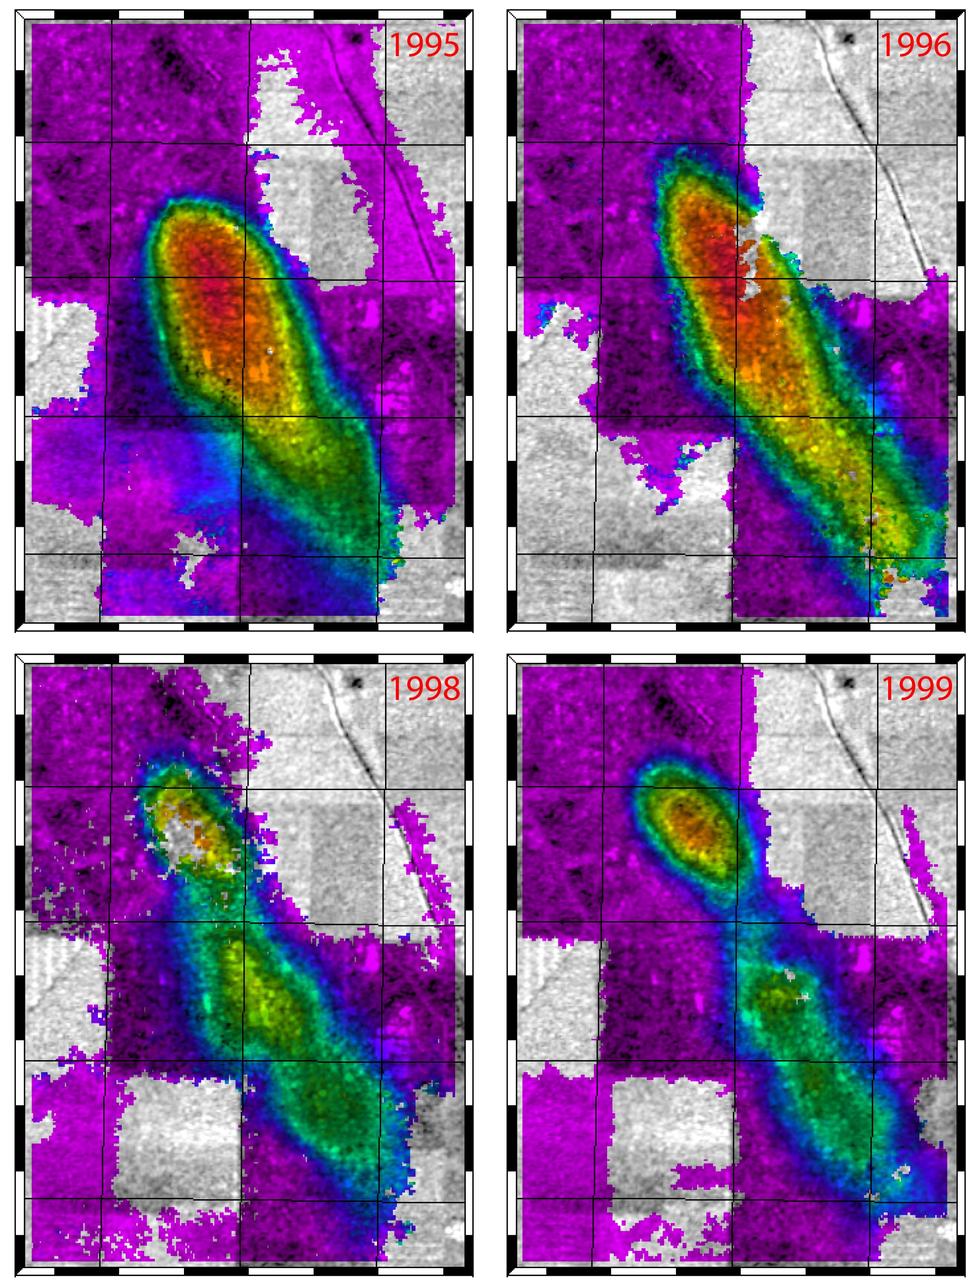
This figure shows a comparison of interferograms from four different years mapping the rapid ground subsidence over the Lost Hills oil field in California.
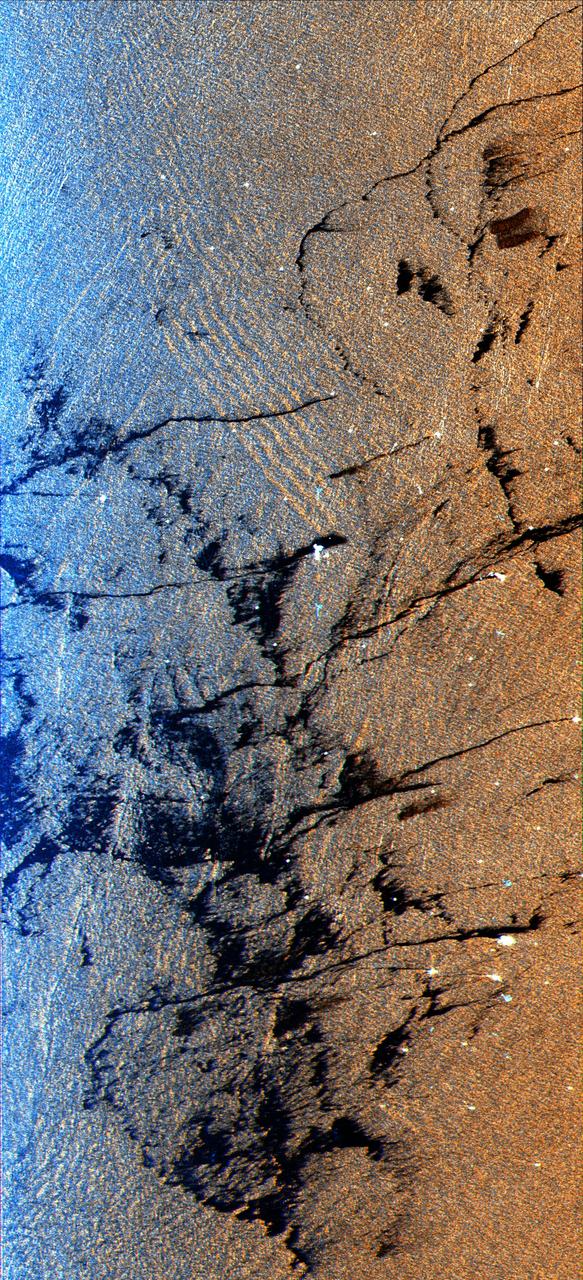
This is a radar image of an offshore drilling field about 150 km 93 miles west of Bombay, India, in the Arabian Sea. The dark streaks are extensive oil slicks surrounding many of the drilling platforms, which appear as bright white spots.
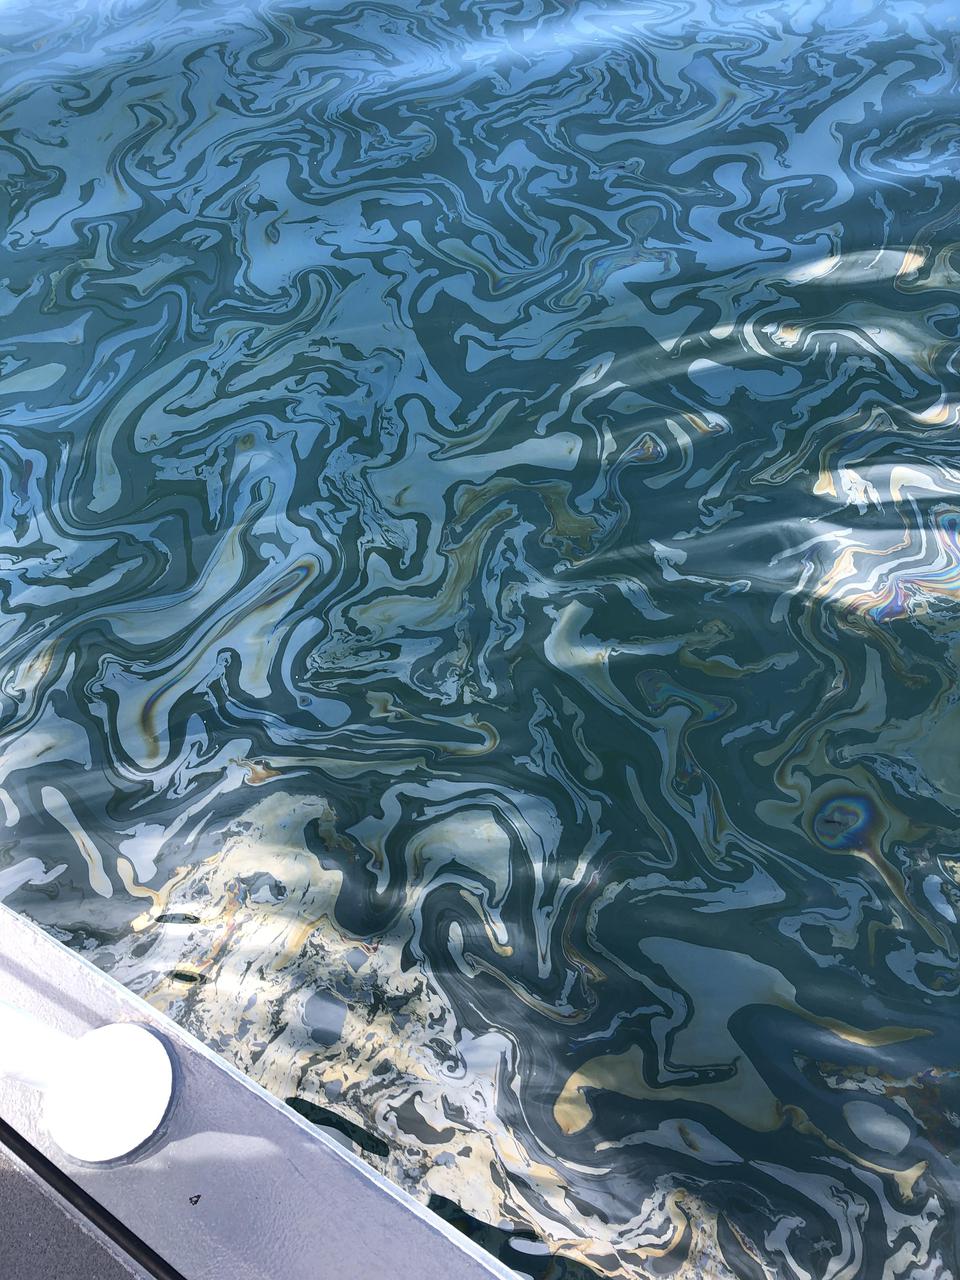
An oil slick from naturally occurring oil seeps off the coast of Santa Barbara, California. The NASA-NOAA Marine Oil Spill Thickness (MOST) project is using the area to test the ability of a radar instrument called UAVSAR to detect the thickness of oil in oil slicks – important information for first responders to oil spills. Having concluded their second field campaign in Santa Barbara at the end of October, 2021, the MOST team is working to develop a way for NOAA – the lead federal agency for detecting and tracking coastal oil spills – to use remote sensing data to determine not just where oil is, but where the thickest parts of it are. NASA's UAVSAR, or Uninhabited Aerial Vehicle Synthetic Aperture Radar, attaches to the fuselage of an airplane that collects a roughly 12-mile-wide (19-kilometer-wide) image of the area. The instrument sends radar pulses down to the surface of the ocean, and the signals that bounce back are used to detect roughness, caused by waves, at the ocean's surface. Oil dampens the waves, creating areas of smoother water that appear darker than the surrounding clean water in the SAR imagery – the thicker the oil, the darker the area appears. When the project concludes, likely in 2023, scientists hope to have a prototype system for detecting oil spill thickness that can be deployed in emergencies. https://photojournal.jpl.nasa.gov/catalog/PIA23699
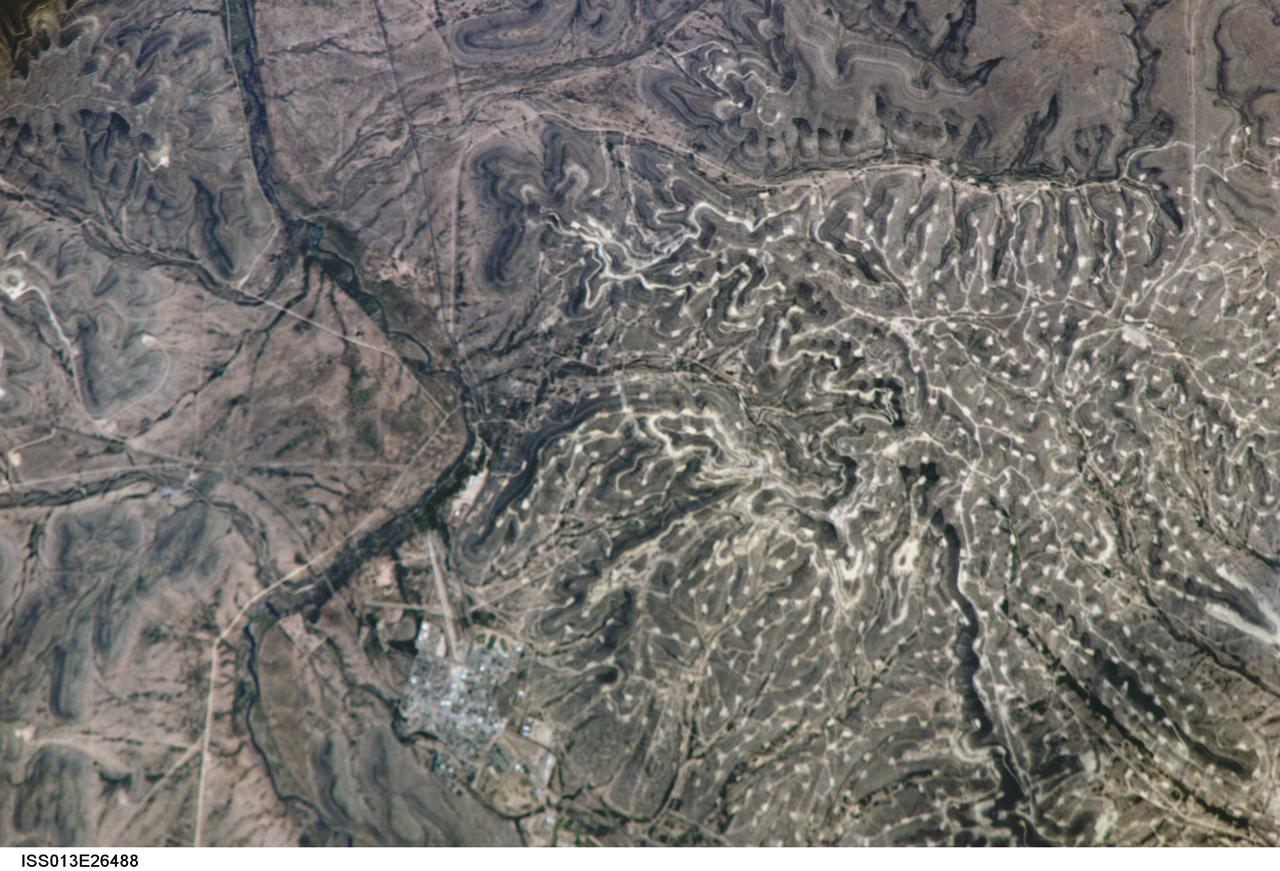
ISS013-E-26488 (25 May 2006) --- Yates Oilfield, west Texas is featured in this image photographed by an Expedition 13 crewmember on the International Space Station. The Permian Basin of west Texas and southeastern New Mexico is one of the most productive petroleum provinces of North America. The Basin is a large depression in the Precambrian bedrock surface along the southern edge of the North American craton, or oldest bedrock core of the continent. The Yates Oil Field is marked in this image by numerous white well locations and petroleum infrastructure dotting the layered sedimentary rocks of the Permian Basin. The Pecos River bed borders the oil field to the east-northeast. The Yates Field started petroleum production in 1926, and by 1995 had produced over 2 billion barrels of oil.
STS039-72-060 (28 April-6 May 1991) --- This view from the Earth-orbiting Space Shuttle Discovery shows the smoke from burning oil well fires, aftermath of Iraqi occupation. Oil wells to the north of the Bay of Kuwait and just south of Kuwait City, on the south shore, can be seen burning out of control. Compared with pictures of the same area shot during STS-37 (April 1991), this frame shows a complete shift of winds, with much of the smoke blowing eastward over the Gulf. The STS-37 scenes showed lengthy southward-blowing sheets of smoke toward Saudi Arabia. In this view, the Gulf island Faylakah Awhah is barely visible through the smoke.
STS039-71-088 (28 April-6 May 1991) --- A handheld 70mm frame of the southern Persian Gulf area. The island in the middle of the frame is Al Jirab, 30 miles west of Abu Dhabi in the United Arab Emirates. On the mainland beaches opposite the island, a thick and continuous black fringe of oil can be seen as a line. Photo experts studying the STS 39 photography have not yet ascertained the source of the oil. They disclosed that if the oil does in fact stem from damaged Kuwaiti offshore oil fields, the slick has been blown southward at least 460 miles. The city of Tarif is visible in the affected area. Lighter brown slicks can be seen offshore. A causeway joins Al Jirab to the mainland and a dredged ship channel with its associated islands can be seen west of the causeway.

AS6-02-1455 (4 April 1968) --- Texas is photographed from the Apollo 6 (Spacecraft 020/Saturn 502) unmanned space mission. Seen in this photograph are Midland, Brownfield, Big Spring, J. B. Thomas Lake, headwaters of Colorado and Brazos Rivers, and the west Texas gas and oil fields.
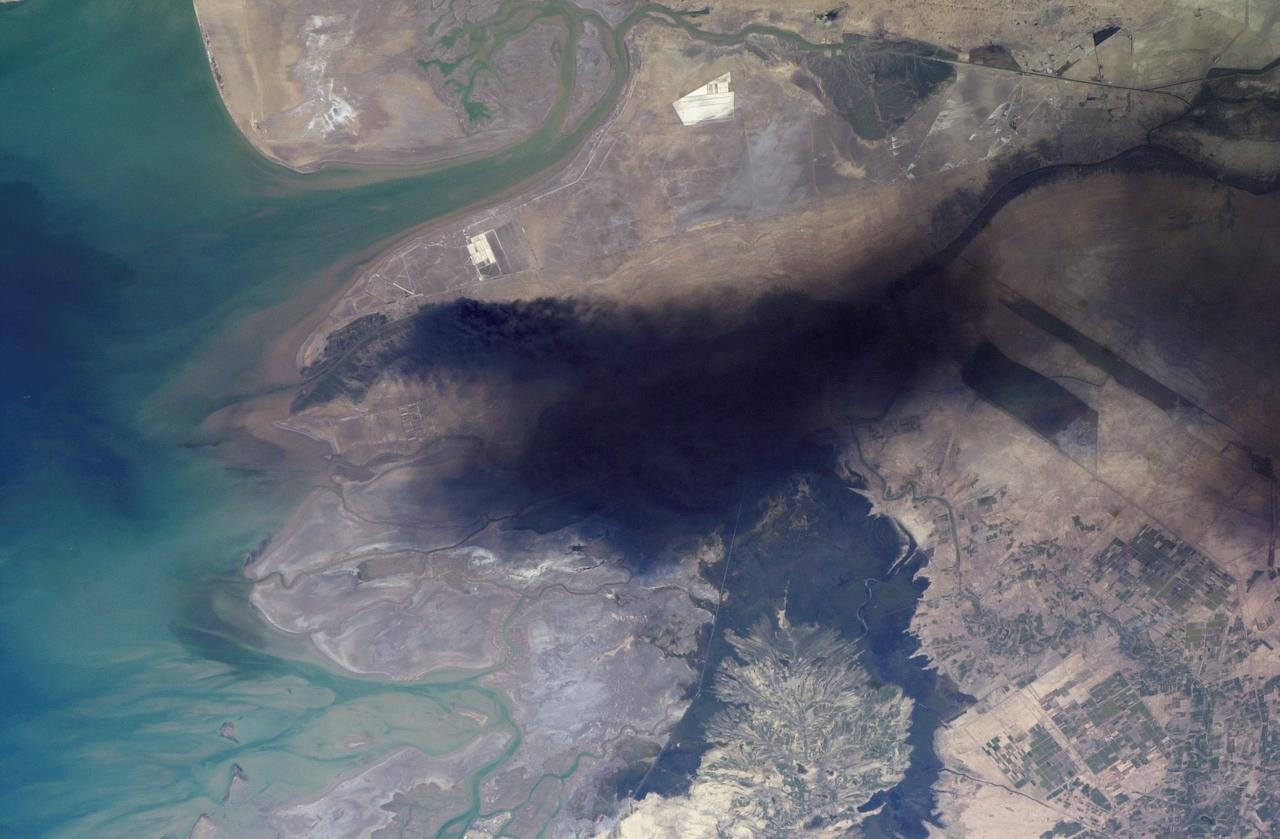
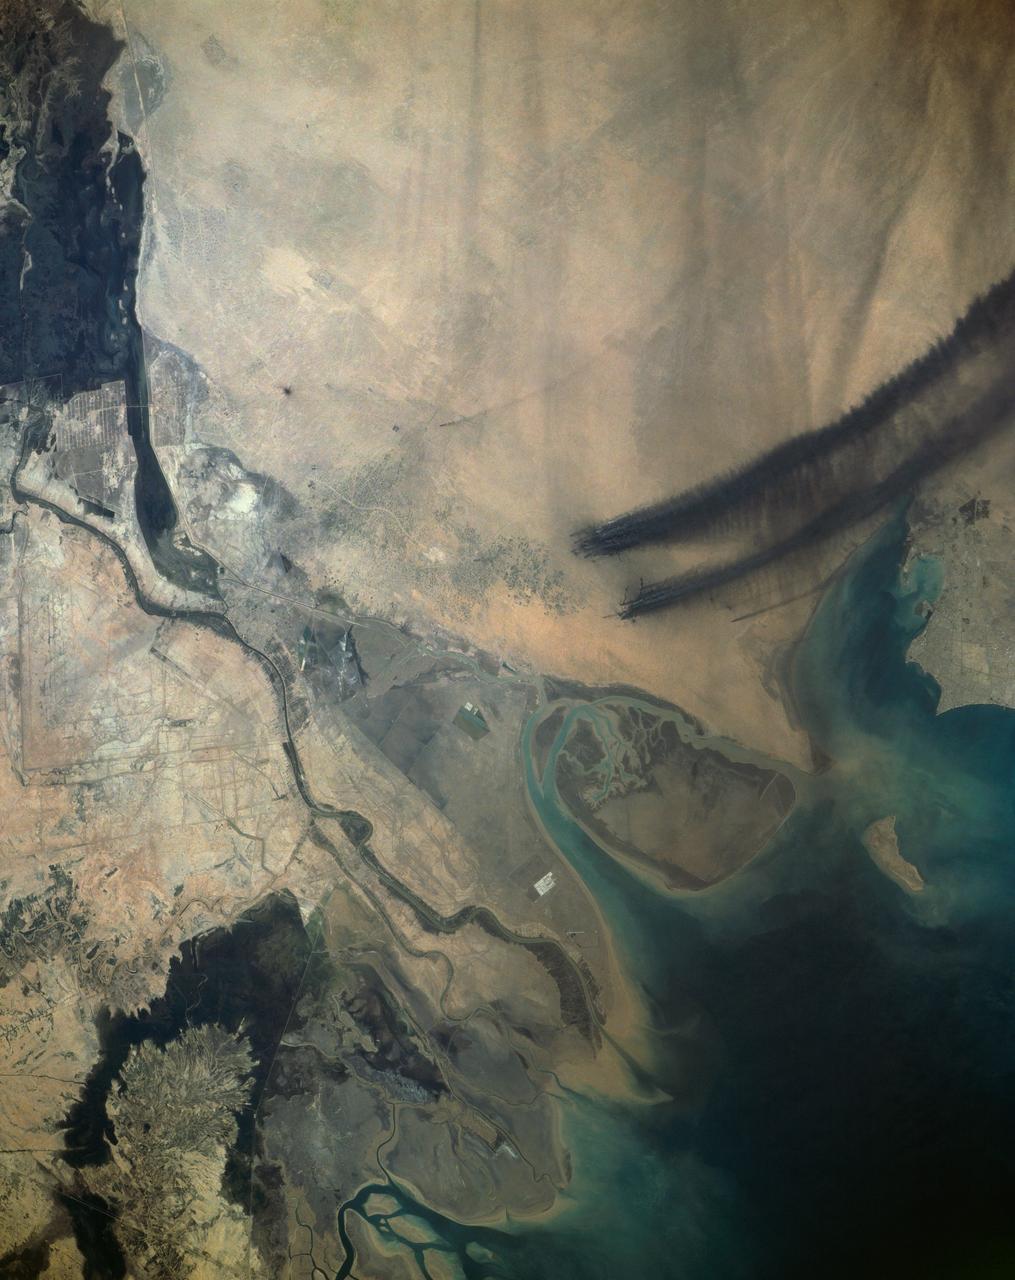
ISS008-E-18938 (24 March 2004) --- This photo of a large black smoke plume over southeastern Iraq was taken by an Expedition 8 crewmember on the International Space Station. The oil that is burning spilled from a ruptured pipeline on March 23, 2004. This photo was taken the next afternoon and shows details of land use near the fire. The delta of the Shatt al Arab has numerous channels, estuaries, and tidal flats. Near the top of the photo (southwest) are two large white salt evaporator operations while to the lower right are wetlands and irrigated agricultural fields. Iraq’s only oil terminal on the Persian Gulf is near the left edge of the plume.
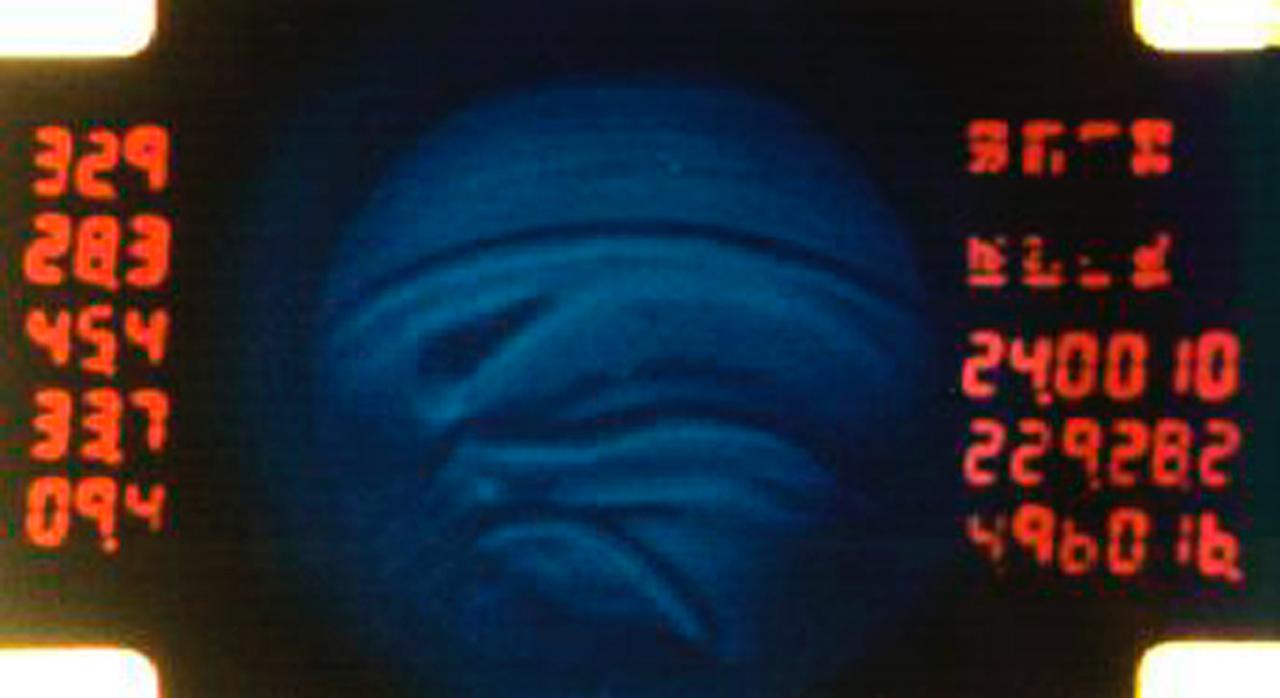
A 16mm film frame shows convective regions inside silicone oil playing the part of a stellar atmosphere in the Geophysical Fluid Flow Cell (GFFC). An electrostatic field pulled the oil inward to mimic gravity's effects during the experiments. The GFFC thus produced flow patterns that simulated conditions inside the atmospheres of Jupiter and the Sun and other stars. Numbers of the frame indicate temperatures and other conditions. This image is from the Spacelab-3 flight in 1985. GFFC was reflown on U.S. Microgravity Laboratory-2 in 1995. The principal investigator was John Hart of the University of Colorado at Boulder. It was managed by NASA's Marshall Space Flight Center. (Credit: NASA/Marshall Space Flight Center)

A steel hemisphere was at the core of the Geophysical Fluid Flow Cell (GFFC) that flew on two Spacelab missions. It was capped by a sapphire dome. Silicone oil between the two played the part of a steller atmosphere. An electrostatic field pulled the oil inward to mimic gravity's effects during the experiments. The GFFC thus produced flow patterns that simulated conditions inside the atmospheres of Jupiter and the Sun and other stars. GFFC flew on Spacelab-3 in 1985 and U.S. Microgravity Laboratory-2 in 1995. The principal investigator was John Hart of the University of Colorado at Boulder. It was managed by NASA's Marshall Space Flight Center. (Credit: NASA/Marshall Space Flight Center)
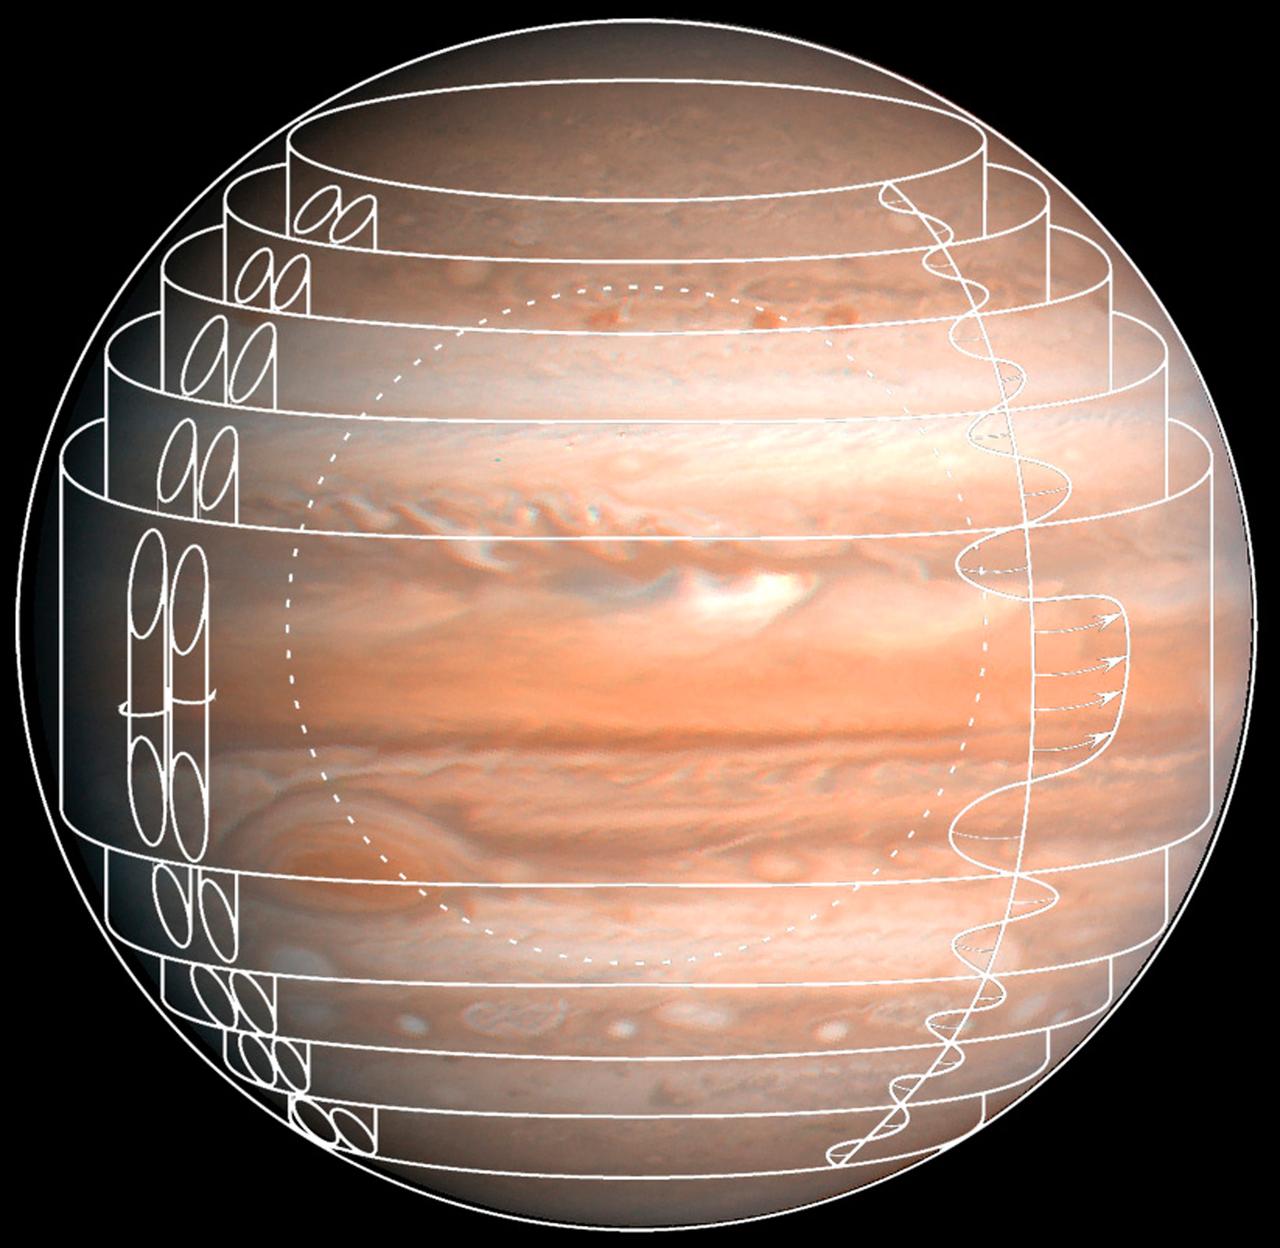
This composite image depicts one set of flow patterns simulated in the Geophysical Fluid Flow Cell (GFFC) that flew on two Spacelab missions. Silicone oil served as the atmosphere around a rotating steel hemisphere (dotted circle) and an electrostatic field pulled the oil inward to mimic gravity's effects during the experiments. The GFFC thus produced flow patterns that simulated conditions inside the atmospheres of Jupiter and the Sun and other stars. GFFC flew on Spacelab-3 in 1985 and U.S. Microgravity Laboratory-2 in 1995. The principal investigator was John Hart of the University of Colorado at Boulder. It was managed by NASA's Marshall Space Flight Center. (Credit: NASA/Marshall Space Flight Center)
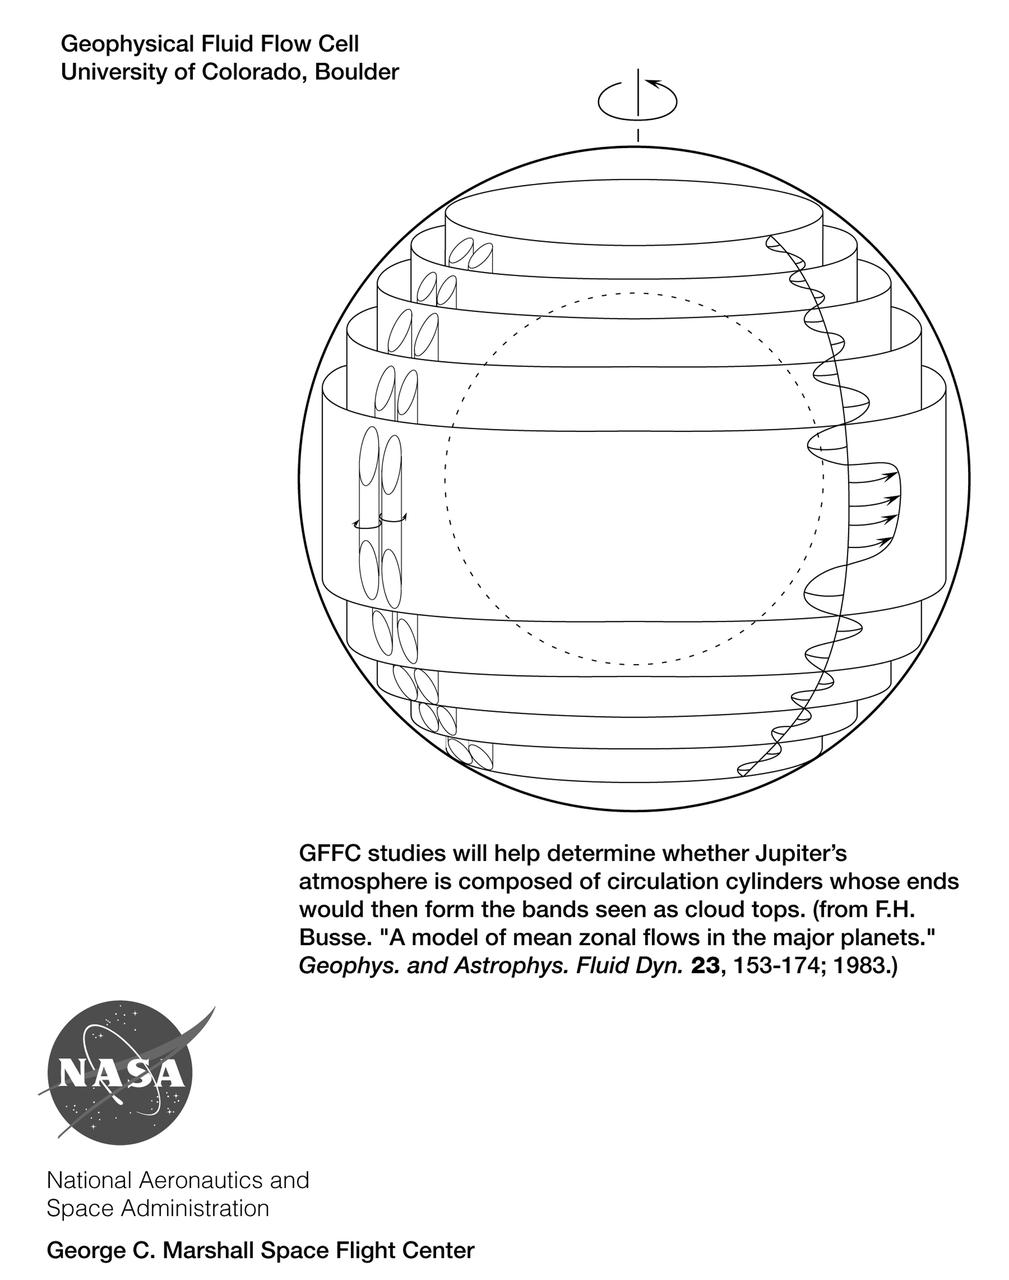
This drawing depicts one set of flow patterns simulated in the Geophysical Fluid Flow Cell (GFFC) that flew on two Spacelab missions. Silicone oil served as the atmosphere around a rotating steel hemisphere (dotted circle) and an electrostatic field pulled the oil inward to mimic gravity's effects during the experiments. The GFFC thus produced flow patterns that simulated conditions inside the atmospheres of Jupiter and the Sun and other stars. The principal investigator was John Hart of the University of Colorado at Boulder. It was managed by NASA's Marshall Space Flight Center (MSFC). An Acrobat PDF copy of this drawing is available at http://microgravity.nasa.gov/gallery. (Credit: NASA/Marshall Space Flight Center)
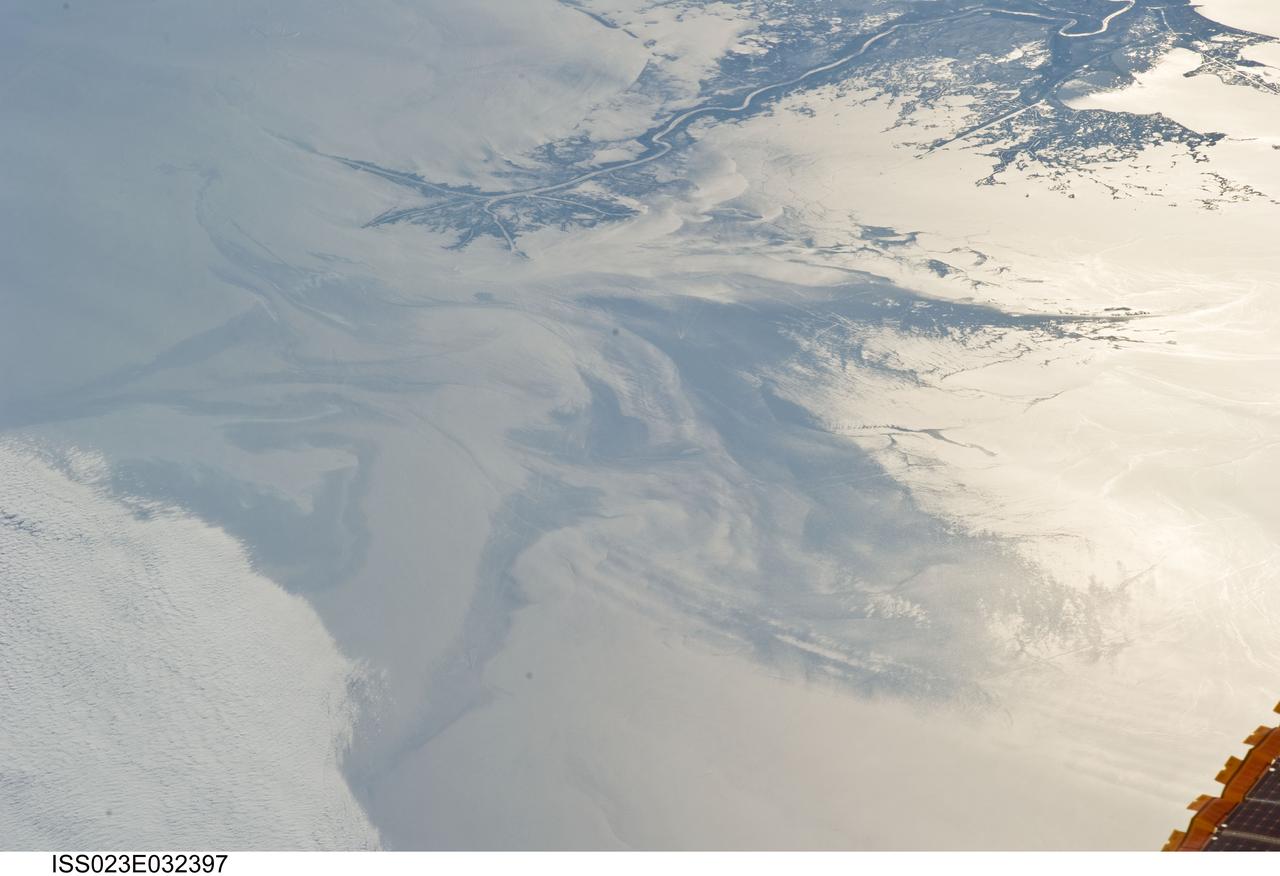
ISS023-E-032397 (4 May 2010) --- The Gulf of Mexico oil spill is featured in this image photographed by an Expedition 23 crew member on the International Space Station. On April 20, 2010 the oil rig Deepwater Horizon suffered an explosion and sank two days later. Shortly thereafter oil began leaking into the Gulf of Mexico from ruptured pipes as safety cutoff mechanisms failed to operate. Automated nadir-viewing orbital NASA sensors have been tracking the growth of the oil spill as it has spread towards the northern Gulf Coast. This detailed photograph provides a different viewing perspective on the ongoing event. The image is oblique, meaning that it was taken with a sideways viewing angle from the space station, rather than the ?straight down? or nadir view typical of automated satellite sensors. The view is towards the west; the ISS was located over the eastern edge of the Gulf of Mexico when the image was taken. The Mississippi River Delta and nearby Louisiana coast (top) appear dark in the sunglint that illuminates most of the image. This phenomenon is caused by sunlight reflecting off the water surface ? much like a mirror ? directly back towards the astronaut observer onboard the orbital complex. The sunglint improves the identification of the oil spill (colored dark to light gray) which is creating a different water texture, and therefore a contrast, between the smooth and rougher water of the reflective ocean surface (colored silver to white). Wind and water current patterns have modified the oil spill?s original shape into streamers and elongated masses. Efforts are ongoing to contain the spill and protect fragile coastal ecosystems and habitats such as the Chandeleur Islands (right center). Other features visible in the image include a solid field of low cloud cover at the lower left corner of the image. A part of one of the ISS solar arrays is visible at lower right. Wave patterns at lower right are most likely caused by tidal effects.
iss049e002308 (9/13/2016) --- A view taken during Selectable Optics Diagnostic Instrument (SODI) DSC Hardware Setup the MSG Work Volume. The Selectable Optical Diagnostics Instrument - Diffusion and Soret Coefficient (SODI-DSC) experiment will study diffusion in six different liquids over time in the absence of convection induced by the gravity field. The SODI-DSC investigation will provide information to scientist which can be used to more efficiently extract oil resources.

iss049e002305 (9/13/2016) --- A view taken during Selectable Optics Diagnostic Instrument (SODI) DSC Hardware Setup the MSG Work Volume. The Selectable Optical Diagnostics Instrument - Diffusion and Soret Coefficient (SODI-DSC) experiment will study diffusion in six different liquids over time in the absence of convection induced by the gravity field. The SODI-DSC investigation will provide information to scientist which can be used to more efficiently extract oil resources.

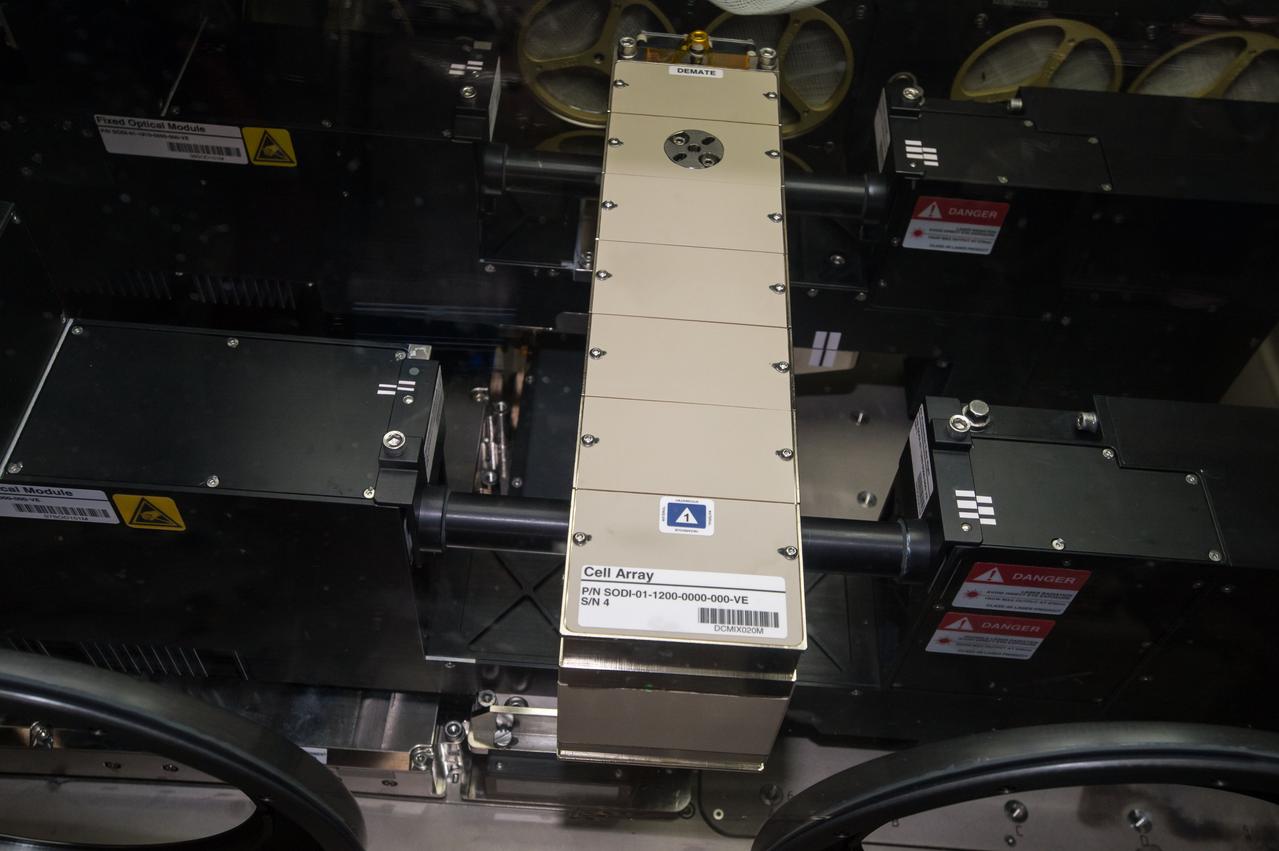
ISS038-E-009255 (26 Nov. 2013) --- In the International Space Station?s Destiny laboratory, NASA astronaut Michael Hopkins, Expedition 38 flight engineer, prepares to install and activate the Selectable Optics Diagnostic Instrument (SODI) cell array two in the Microgravity Science Glovebox (MSG) for the Selectable Optics Diagnostic Instrument-Diffusion Coefficient in Mixtures 2 (SODI-DCMIX 2) experiment. SODI-DCMIX 2 is supporting research to determine diffusion coefficients in different petroleum field samples and refine petroleum reservoir models to help lead to more efficient extraction of oil resources.

ISS038-E-009253 (26 Nov. 2013) --- In the International Space Station’s Destiny laboratory, NASA astronaut Michael Hopkins, Expedition 38 flight engineer, prepares to install and activate the Selectable Optics Diagnostic Instrument (SODI) cell array two in the Microgravity Science Glovebox (MSG) for the Selectable Optics Diagnostic Instrument-Diffusion Coefficient in Mixtures 2 (SODI-DCMIX 2) experiment. SODI-DCMIX 2 is supporting research to determine diffusion coefficients in different petroleum field samples and refine petroleum reservoir models to help lead to more efficient extraction of oil resources.
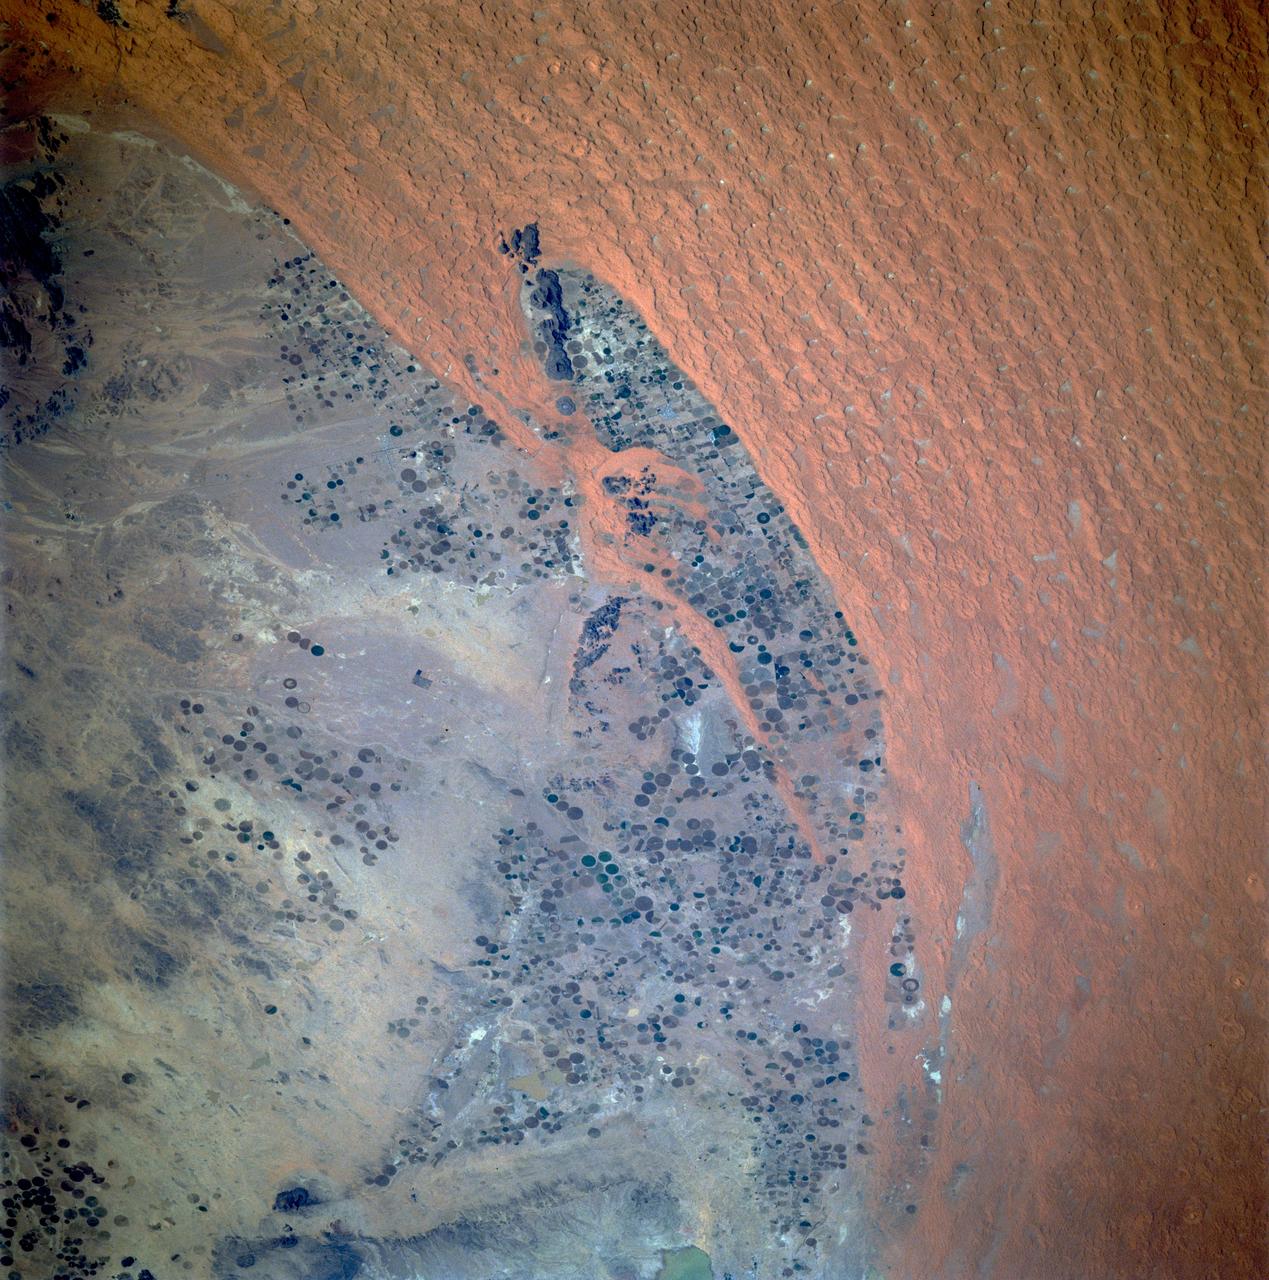
STS087-703-089 (19 November – 5 December 1997) --- Featured in this view is center pivot irrigation in central Saudi Arabia. Abundant petroleum has provided the energy source for deep-well pumps that tap groundwater stored in bedrock many thousands of years ago when the climate was much wetter. The fields are carved out of ancient alluvial fan deposits, also formed when rainfall was much greater; the fields are pushed right to the edge of the Nafud al Mazhur (sand sea), representative of the present climate. The mining of petroleum and groundwater has enabled Saudi Arabia to become an exporter of wheat and other commodities, in addition to the oil for which it is famous. This picture is one of the 70mm Earth observation visuals used by the crew at its post flight presentation events.
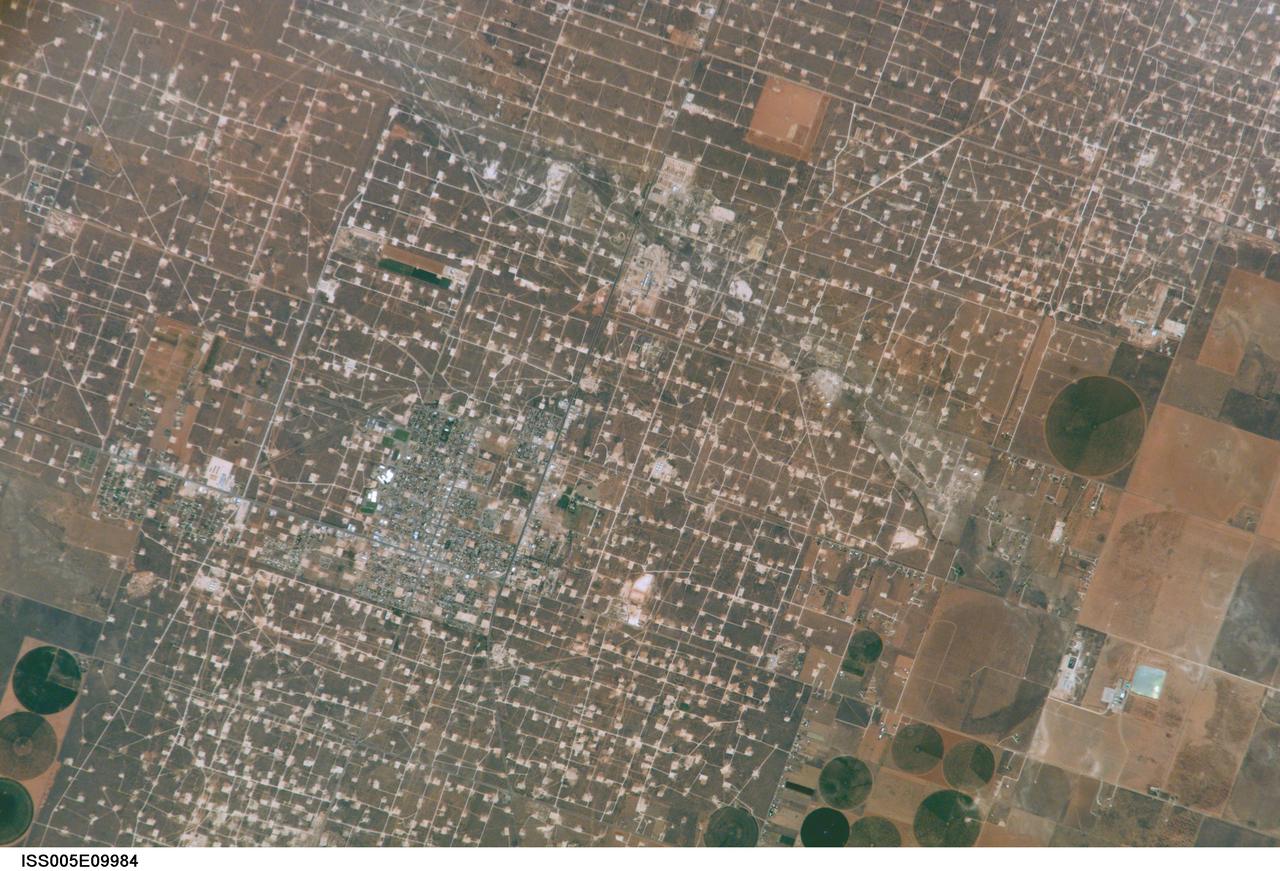
ISS005-E-9984 (17 August 2002) --- This digital still photograph, taken from the International Space Station (ISS) during its fifth staffing, depicts both agriculture and the petroleum industry, which compete for land use near Denver City, Texas. The photo was recently released by the Earth Sciences and Image Analysis Laboratory at Johnson Space Center. The area is southwest of Lubbock near the New Mexico border. According to analysts studying the station imagery, the economy of this region is almost completely dependent on its underground resources of petroleum and water. Both resources result in distinctive land use patterns visible from space. Historically this area has produced vast quantities of oil and gas since development began in the 1930s. A fine, light-colored grid of roads and pipelines connect well sites over this portion of the Wasson Oil Field, one of the state’s most productive. Since the 1940s, agricultural land use has shifted from grazing to irrigated cultivation of cotton, sorghum, wheat, hay, and corn. The water supply is drawn from wells tapping the vast Ogallala Aquifer. Note the large, circular center-pivot irrigation systems in the lower corners of the image. The largest is nearly a mile in diameter.
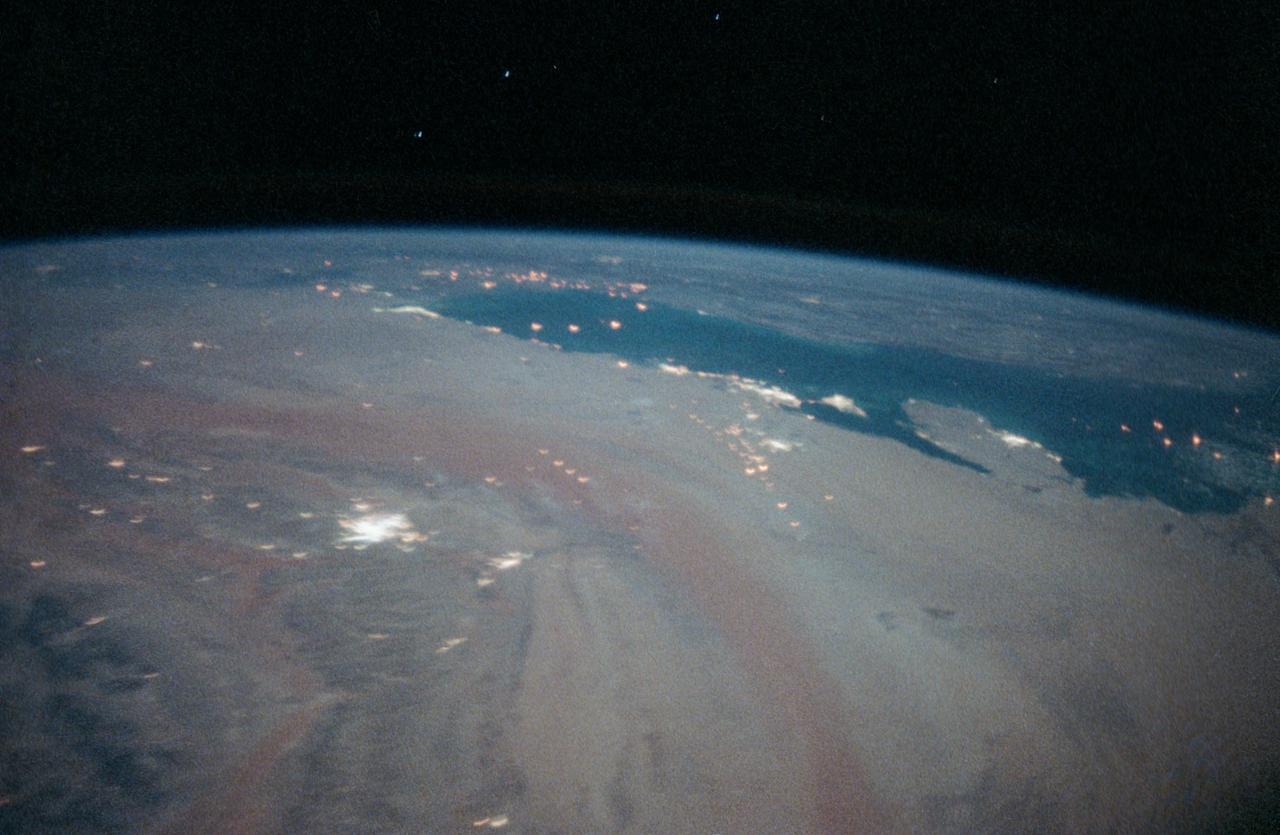
STS-35 Earth observation taken aboard Columbia, Orbiter Vehicle (OV) 102, is of the Persian Gulf area. Major cities and oilfields of the countries of Saudi Arabia (foreground), Iraq (top left), Iran (top center and top right), Kuwait, Bahrain, Qatar, and a portion of the United Arab Emirates are visible in this scene. The cities are the large whitish areas of city lights. Flares characteristic of the Mid-East oil field practices are visible both onshore and offshore throughout the scene. Major cities identifiable are in Iraq - Baghdad, Basra, and Faw; in Qatar - Ab Dawhah; in Kuwait - Kuwait City; in Saudi Arabia - Riyadh, Al Jubayl, Dharan, Al Huf, Ad Dilam and Al Hariq; and Bahrain and its associated causeway to the mainland.

ISS030-E-090918 (21 Feb. 2012) --- Agricultural fields in the Wadi As-Sirhan Basin in Saudi Arabia are featured in this image photographed by an Expedition 30 crew member on the International Space Station. Northern Saudi Arabia hosts some of the most extensive sand and gravel deserts in the world, but modern agricultural technology has changed the face of some of them. This photograph presents the almost surreal image of abundant green fields in the midst of a barren desert ? specifically the Wadi As-Sirhan Basin of northwestern Saudi Arabia. As recently as 1986 there was little to no agricultural activity in the area, but over the subsequent 26 years agricultural fields have been steadily developed, largely as a result of investment of oil industry revenues by the Saudi government. The fields use water pumped from subsurface aquifers and is distributed in rotation about a center point within a circular field ? a technique known as center-pivot agriculture. This technique affords certain benefits relative to more traditional surface irrigation such as better control of water use and application of fertilizers. The use of this so-called ?precision agriculture? is particularly important in regions subject to high evaporative water loss; by better controlling the amount and timing of water application, evaporative losses can be minimized. Crops grown in the area include fruits, vegetables, and wheat. For a sense of scale, agricultural fields in active use (dark green) and fallow (brown to tan), are approximately one kilometer in diameter. While much of the Wadi As-Sirhan Basin shown here is sandy (light tan to brown surfaces) and relatively flat, low hills and rocky outcrops (dark gray) of underlying sedimentary rocks are visible at left and right.
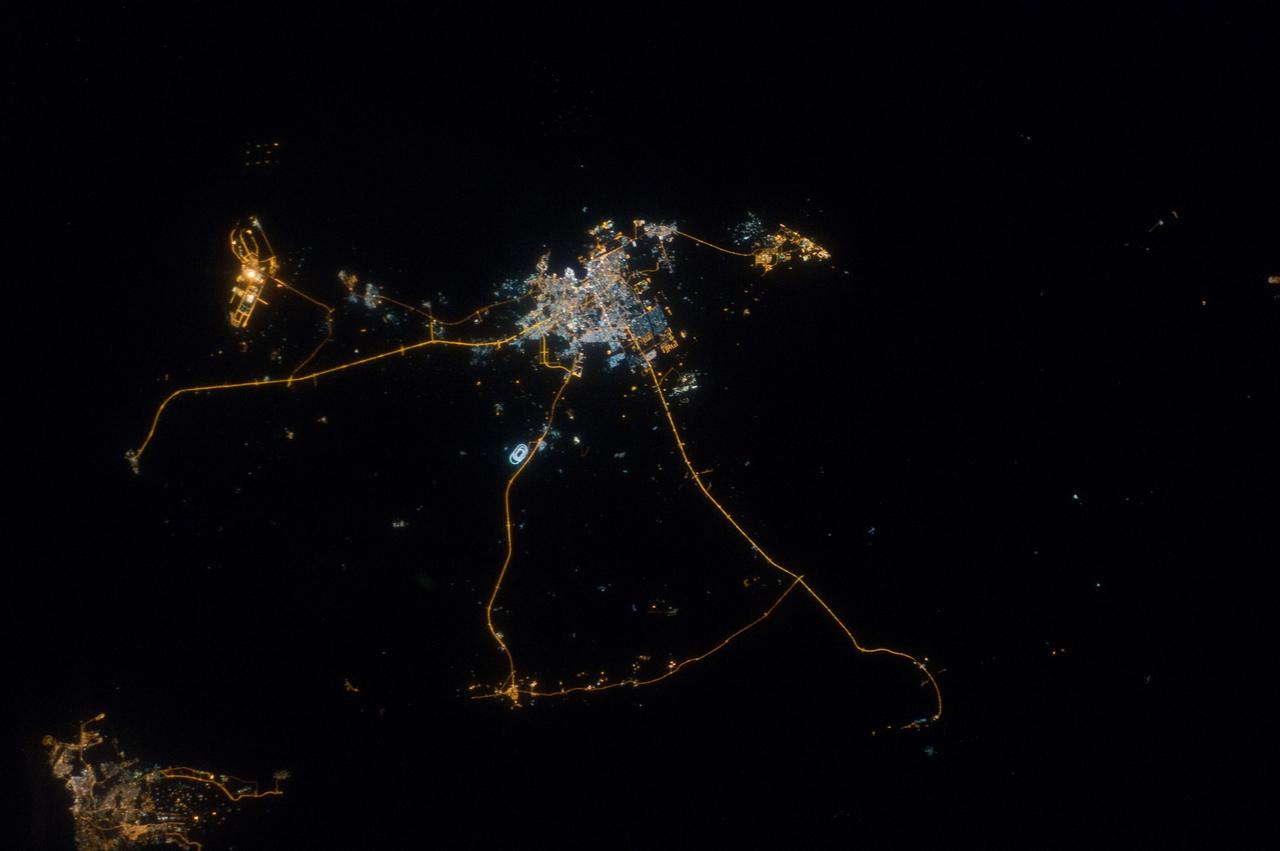
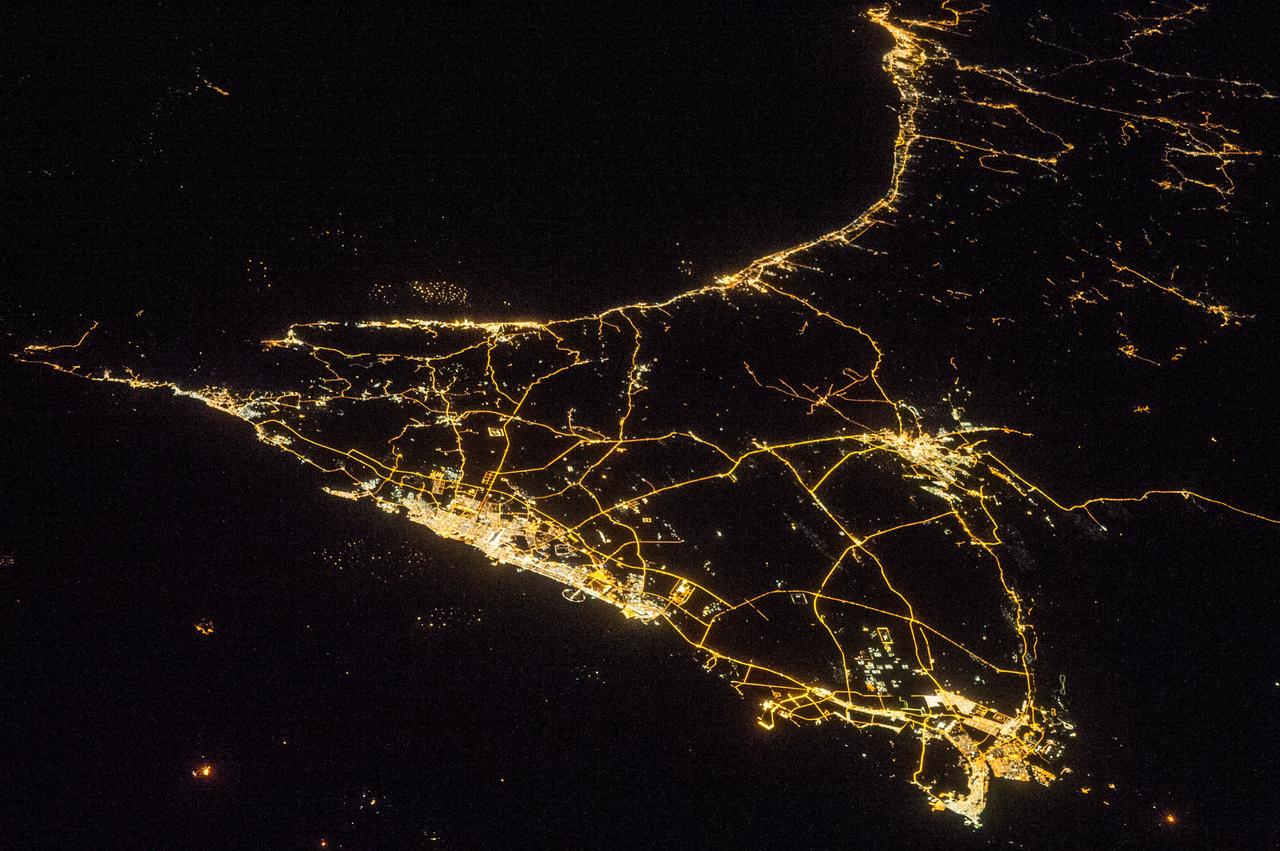
ISS033-E-014856 (13 Oct. 2012) --- A nighttime view of Qatar is featured in this image photographed by an Expedition 33 crew member on the International Space Station. Night lights can be very revealing regarding the distribution of people on the landscape. Here the lights of Qatar show the precise demographic geography of the country. The brightest group at center shows the capital city Doha with the neighboring smaller ports of Ad-Dahira and Umm Sa?id to the north and south, respectively. Even highways and their relative importance can be discerned. Highways are clearly visible leading from the capital west to the Dukhan oil fields, to Saudi Arabia, and to the north of the country--where, judging by the lack of night lights, the population is very low. The relatively low-traffic coast road between the oil fields and the Saudi frontier also stands out. This kind of highly informative human geographic detail is very difficult to discern in daylight images, in which even larger cities, especially in deserts, are hard to see. Almost the entire island nation of Bahrain appears at lower left, with its capital city Manama nearly as bright as the lights of Doha. The difference in light intensity reflects a difference in population?Doha has 1.45 million inhabitants, while the very dense Manama metro area has a population of 1.2 million. While some night views are highly informative about a landscape, they can also be difficult and confusing to identify. Astronauts learn to recognize where they are at night by flying over populated places repeatedly, even though coastlines?one of their best geographic indicators?are generally lost to view because water surfaces and unpopulated land surfaces look the same without illumination (such as from a full moon). Thus the thumb-shaped Qatari peninsula, so well-known in Middle Eastern geography, cannot be discerned at all in this night image. The inset at top right overlays the coastline as seen in daylight onto the night patterns of the image. It shows the Qatari peninsula, with the long arm of the Gulf of Bahrain separating it from Saudi Arabia.

An oil slick in the Gulf of Mexico following Hurricane Ida – a high-end Category 4 when it made landfall near Port Fourchon, Louisiana, on Aug. 29, 2021 – appears as a green trail in the inset false-color graphic provided by NASA's Delta-X project, while the surrounding seawater appears orange. The National Oceanic and Atmospheric Administration (NOAA) regularly monitors U.S. coastal waters for potential spills and noticed slicks that appeared just off the coast after the hurricane. They were able to use this information from Delta-X to corroborate other data they had about oil slicks in the area (satellite image in the second inset picture). The blue-green swath crossing from the Gulf of Mexico over the Louisiana coast denotes the flight path of the Delta-X radar instrument on Sept. 1, just before 11:30 a.m. CDT. Charged with studying the Mississippi River Delta, Delta-X was gearing up to collect data on Louisiana's coastal wetlands when Hurricane Ida barreled ashore in late August. The storm damaged buildings and infrastructure alike, resulting in power outages, flooding, and oil slicks in the Gulf of Mexico. Oil tends to smooth out the bumps on the ocean's surface, which results in a distinct radar signal that the Delta-X mission was able to pick out of their data. Delta-X added flight paths to their planned schedule – with the support of NASA's Applied Science Disaster Program – in order to collect information over the gulf in areas of interest to NOAA. Delta-X is studying two wetlands – the Atchafalaya and Terrebonne Basins – by land, boat, and air to quantify water and sediment flow as well as vegetation growth. While the Atchafalaya Basin has been gaining land through sediment accumulation, Terrebonne Basin, which is right next to the Atchafalaya, has been rapidly losing land. The data collected by the project will be applied to models used to forecast which areas of the delta are likely to gain or lose land under various sea level rise, river flow, and watershed management scenarios. The mission uses several instruments to collect its data. Affixed to the bottom of a Gulfstream-III airplane, one of those instruments, the all-weather Uninhabited Aerial Vehicle Synthetic Aperture Radar (UAVSAR), bounces radar signals off of Earth's surface, forming a kind of image of a particular area. Repeated images of the same regions, captured at different times, enable researchers to detect changes in those areas, such as fluctuating water levels beneath the vegetation as the tides move in and out of these wetlands. In addition to radar measurements, teams from Caltech, Louisiana State University, Florida International University, and other collaborating institutions gather water and vegetation samples – among other data – by boat, other airborne sensors, and from instruments on the ground. Funded by NASA's Earth Venture Suborbital (EVS-3) program, Delta-X is managed by the agency's Jet Propulsion Laboratory. Caltech in Pasadena, California, manages JPL for NASA. Fall 2021 was Delta-X's last scheduled field campaign, although the five-year mission will run through the end of 2023. https://photojournal.jpl.nasa.gov/catalog/PIA24540
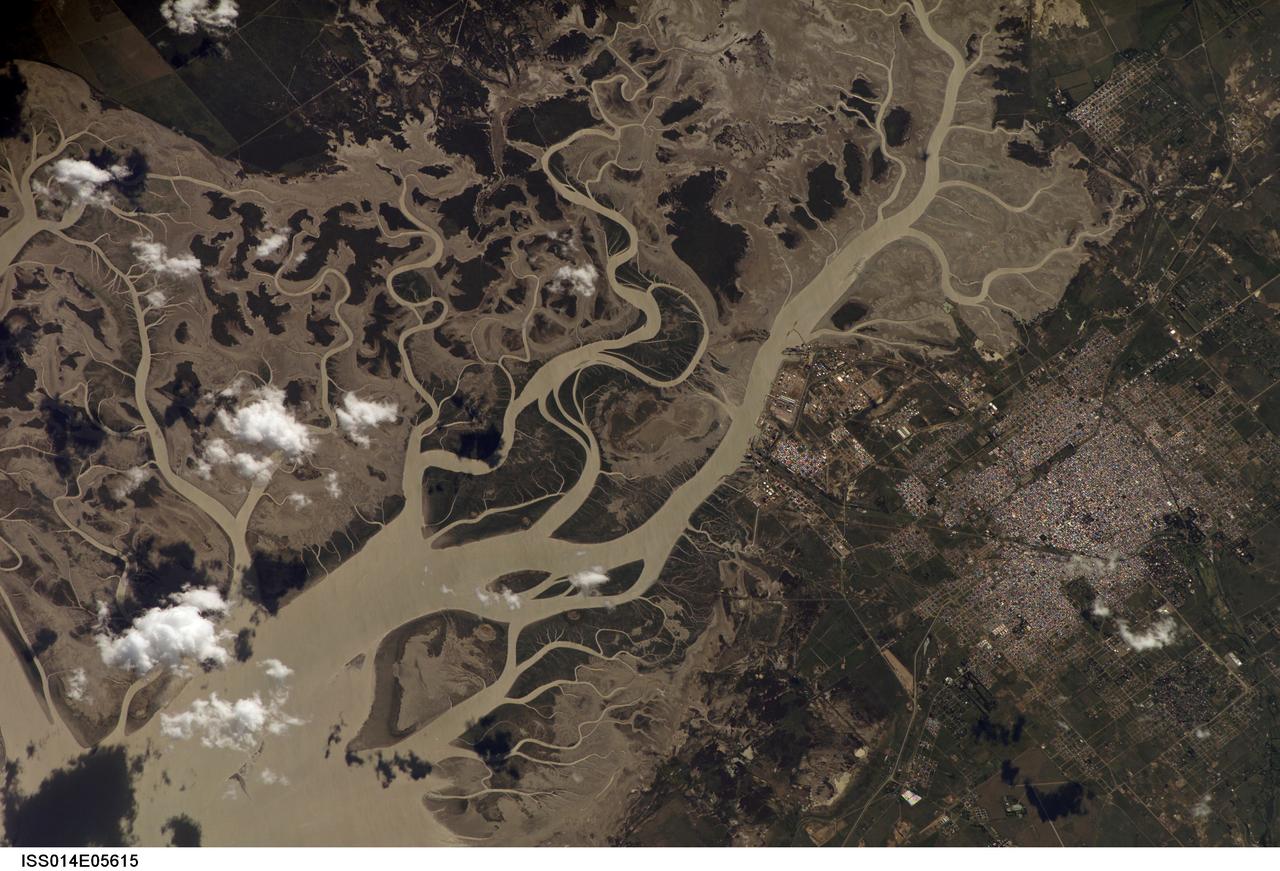
ISS014-E-05615 (14 Oct. 2006) --- Bahia Blanca, Buenos Aires Province, Argentina is featured in this image photographed by an Expedition 14 crewmember on the International Space Station. The port city of Bahia Blanca lies almost 600 kilometers southwest of Buenos Aires on the southern rim of the Argentine economic heartland. This small city of 275,000 people is captured in one frame which shows its position near the mouth of the Arroyo Naposta. The salt flats (gray) and wetlands bordering this estuary, characterized by twisting, light colored tidal channels and dark swamps, lie mainly on the south side of the river. The yellow tinge to the water surfaces arises from the partial sunglint reflection on this particular day. The name Bahia Blanca (White Bay) derives from the white color of the salt and was applied to the major bay--noted by Magellan as he probed the coast of South America for a passage to the Pacific Ocean in 1520--and then to the city at the head of this bay. Highways, airline routes and pipelines from oil and gas fields to the west and south all converge on Bahia Blanca. The city is a major cultural center and historically has acted as a gateway for immigration. Higher ground on the north side of the estuary affords stable ground for the growth of the city and for intensive agriculture, a mainstay of the Argentine economy. The city is set back from the waterfront where an industrial park, a petrochemical center, and dockyards (white ellipse) are located.
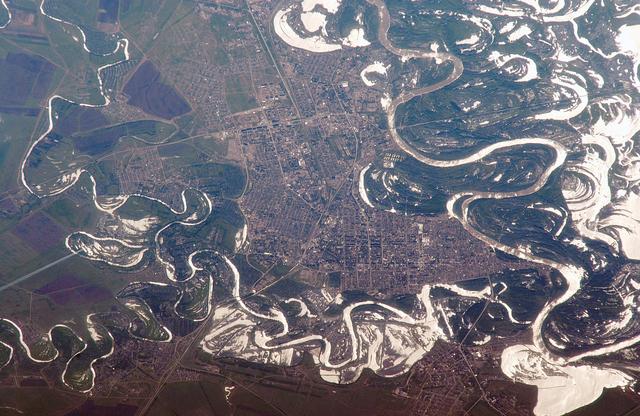
ISS011-E-06717 (22 May 2005) --- Uralsk, Kazakhstan is featured in this image photographed by an Expedition 11 crew member on the international space station. The rough boundary between Europe and Asia is defined by the Ural River and the Ural Mountains to its north. The Ural River flows to the great inland Caspian Sea, and gives its name to the major city of Uralsk (population approximately 250,000) on its banks. Lying just inside the Kazakh border with Russia, Uralsk is an agricultural and industrial center, and important trade stop since the early 1600s. Barge traffic has passed up and down the Ural River between the Caspian Sea and the Ural Mountains for centuries. Today it is one of the major entry points for rail traffic from Europe to Siberia, servicing the many new oil fields in the Caspian basin and the industrial cities of the southern Urals. This view shows the sunglint (light reflected from the water surface towards the observer) on the rivers, lakes and ponds of the Ural floodplain (right side of image) and that of a tributary, the Chogan River (left side of image). The cityscape of Uralsk, on the headland between the two, is relatively difficult to see because the water and sunglint dominate the scene.
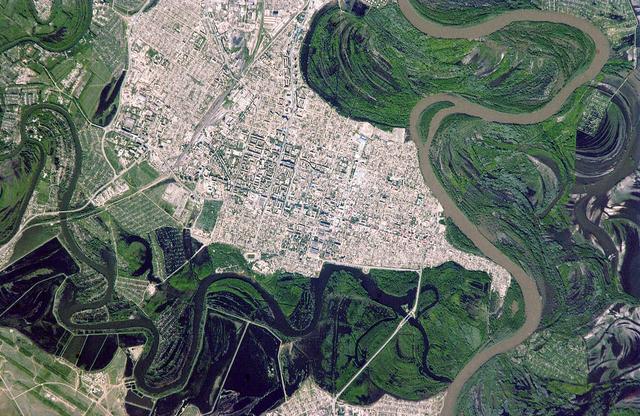
ISS011-E-06712 (22 May 2005) --- Uralsk, Kazakhstan is featured in this image photographed by an Expedition 11 crew member on the international space station. The rough boundary between Europe and Asia is defined by the Ural River and the Ural Mountains to its north. The Ural River flows to the great inland Caspian Sea, and gives its name to the major city of Uralsk (population approximately 250,000) on its banks. Lying just inside the Kazakh border with Russia, Uralsk is an agricultural and industrial center, and important trade stop since the early 1600s. Barge traffic has passed up and down the Ural River between the Caspian Sea and the Ural Mountains for centuries. Today it is one of the major entry points for rail traffic from Europe to Siberia, servicing the many new oil fields in the Caspian basin and the industrial cities of the southern Urals. Numerous details are visible in the photo, including the city margin, city blocks and even the causeway and individual buildings. Part of the smaller sister city of Zashaghan can be seen on the opposite bank (bottom). The green vegetated parts of the floodplains and black inundated parts (lower left, bottom image) stand out clearly. The brown Ural River waters contrast with the darker color of its tributary, the Chogan River (lower image).

ISS033-E-021663 (15 Nov. 2012) --- A nighttime view of the Dallas, Texas metropolitan area is featured in this image photographed by an Expedition 33 crew member on the International Space Station. Most metropolitan areas of the western United States are configured over large areas with a regular street grid pattern that is highly recognizable from space, particularly at night. The northern Dallas metropolitan area exhibits this pattern. The north-south and east-west grid pattern of major surface streets is highlighted by orange street lighting, lending a fishnet-like appearance to the urban area. Within this framework, smaller residential and commercial buildings and streets give green-gray stipple patterns to some blocks. The airplane terminals of Dallas-Fort Worth International Airport are lit with golden-yellow lights, and surrounded by relatively dark runways and fields at left. Likewise, the runways of Dallas Love Field at lower center are recognizable by their darkness. Other dark areas within the metro region are open space, parks, and water bodies. Dallas is part of the larger Dallas-Fort Worth-Arlington Metropolitan Statistical Area (population 6,526,548 in 2011) as recognized by the U.S. Census Bureau; to most Texans, it is simply ?DFW? or ?the Metroplex.? Several of the larger urban areas within DFW are visible in this image; Dallas, Garland and Richardson all have populations above 100,000 according to the North Central Texas Council of Governments. While historically the economy of Dallas was based in the oil and cotton industries, today commerce, technology, healthcare, and transportation are the major economic drivers.
ISS038-E-016335 (11 Dec. 2013) --- A nighttime view of the United Arab Emirates is featured in this image photographed by an Expedition 38 crew member on the International Space Station. Geographers like night images of cities because you see immediately so much about the human landscape--things that are difficult or impossible to see in day images. You see where the cities are located and their shape; the brightest light clusters frequently indicate the city centers. In large field of view images, such as this photograph of the United Arab Emirates (UAE), you can also see cities' position relative to one another and their relative size. Here the largest cluster of lights is the conurbation ("joined cities") of Dubai-Sharjah-Ajman (population 3.25 million), with its smaller neighbor Dubai (population 2.1 million). These cities front onto the Persian Gulf (also known as the Arabian Gulf) where the city lights are cut off abruptly at the coastline. The bright city centers are located at the coast showing that sea trade is important (and has been important) in the growth of these cities. Smaller cities are Al Ain (population 518,000), the fourth largest city in the UAE, and Fujairah (population 152,000). Major highways join the cities in a brightly lit network, and a faint peppering of lights offshore shows the relatively young oil and gas platforms on either side of the Musandam Peninsula (left). Despite being taken at night, the spike of the Musandam Peninsula is easy to imagine at the south end of the Persian Gulf. The biggest cities in the UAE are Abu Dhabi and Dubai. Muscat, the capital city of the neighboring country of Oman, appears top center. By contrast, the almost unpopulated Musandam Peninsula shows very few lights.
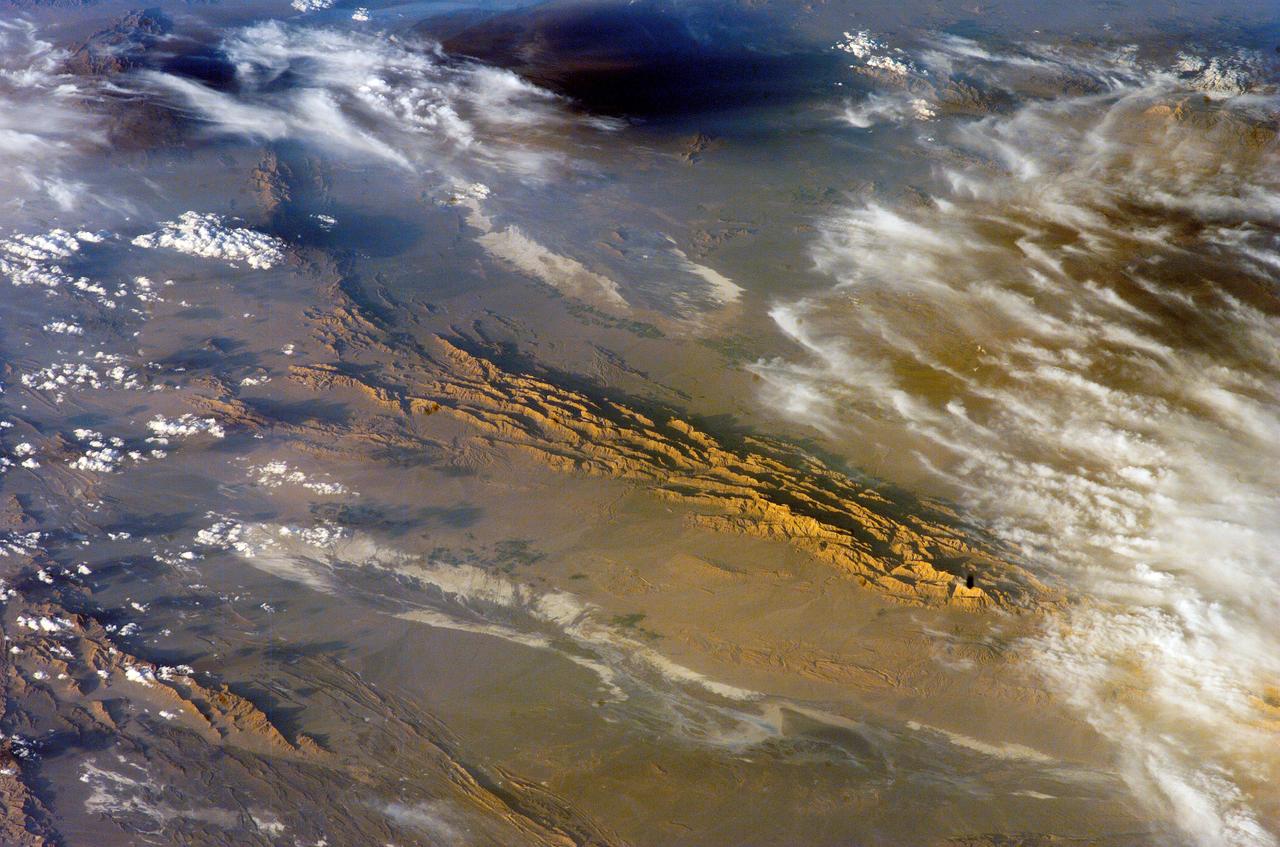
ISS012-E-18779 (28 Feb. 2006) --- Winter in the Dasht-e-Lut Desert, eastern Iran is featured in this image photographed by an Expedition 12 crew member on the International Space Station. The image takes advantage of the low angle of illumination to reveal linear geological structures of the Iranian mountain range bordering the western edge of the basin known as Dasht-e-Lut. The range rises 1818 meters (6000 feet) above sea level and lies 750 kilometers (466 miles) north of the Persian Gulf. The convoluted appearance results from erosion of folded and faulted rocks – softer rocks erode away quickly, leaving more resistant rock to form linear ridges perpendicular to the direction of compression. While not a major oil producing region like the Zagros Fold Belt to the southwest, the mountains of east-central Iran contain economically important deposits of copper and other metals. Little vegetation is visible from space in the arid interior basin of the Dasht-e-Lut. Iran is climatically part of the Afro-Asian belt of deserts that stretch from the Cape Verde islands off West Africa all the way to Mongolia near Beijing. The patchy, elongated, light-colored feature in the foreground (parallel to the mountain range) is the northernmost of the Dasht dry lakes that stretch southward 300 kilometers (186 miles). High country is the source of precipitation-derived water in all near-tropical deserts. Agricultural fields (small dark patches in the image) that depend on this precipitation are located down slope near the margin of the dry, salty soils of the lake.
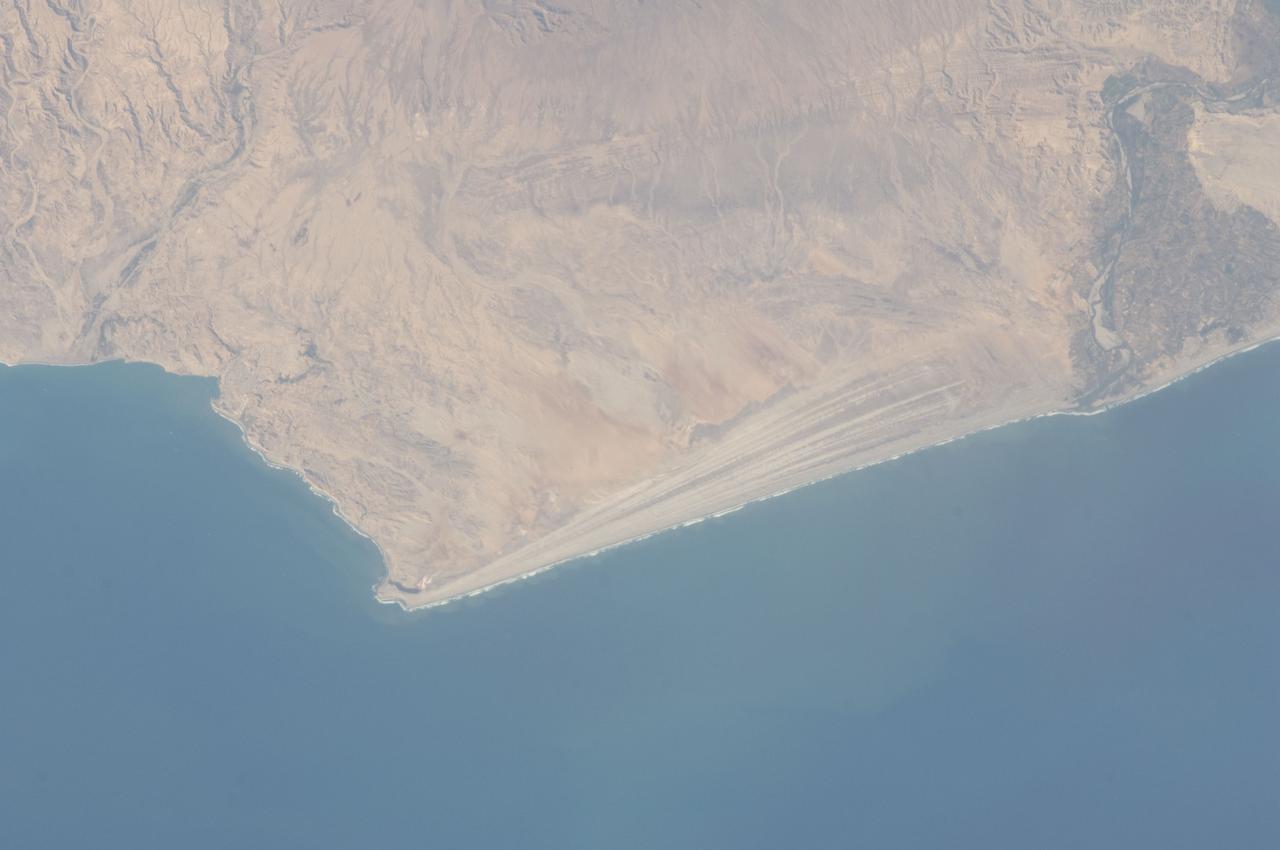
ISS032-E-016579 (11 Aug. 2012) --- A strandplain on coastal Peru is featured in this image photographed by an Expedition 32 crew member on the International Space Station. The scale and orientation of landscape features that are difficult to see on the ground often become readily visible from orbit. Numerous subparallel lines (center) along the arid, northern coast of Peru (about five degrees south of the Equator) are close-packed beach ridges, known collectively as a strandplain (for scale, the strandplain is 30 kilometers long). Each ridge shows the position of a prior shoreline. The Chira River delta appears at right, with dark green agricultural fields occupying the delta of the river. A smaller river reaches the sea, without forming a delta, at extreme left. The prominent cape at lower left is Punta Balcones, a region with many oil wells. Strandplains are built by successive additions of beach sand usually from some nearby source. Currents on this coast of South America come from the south, suggesting to scientists that the Chira River delta (right) is the source of the sand. The newest beach is being formed today by the waves?which appear as the thin ragged white line along the strandplain?supplied by the north-flowing current. The regularity of the spacing of the beaches suggests that some episodic influx of sediment controls beach formation. This influx may be determined by floods coming down the Chira River, possibly controlled by the heavy rains of El Nino events which occur irregularly every few years. Two other sets of faint parallel lines can be seen on higher ground inland (between arrows, center and top right), the upper set stretching all the way from the Chira river floodplain. Seen in many places along the coast of Peru, scientists believe these may also be strandplains (i.e. formed at sea level) generated when the land surface was at a lower altitude; both also may have been produced by sand from the Chira River. The land surface is known to be rising along this coast with the rise of the Andes Mts. (outside the top of the image), explaining why the upper shorelines now lie 120 meters above sea level.
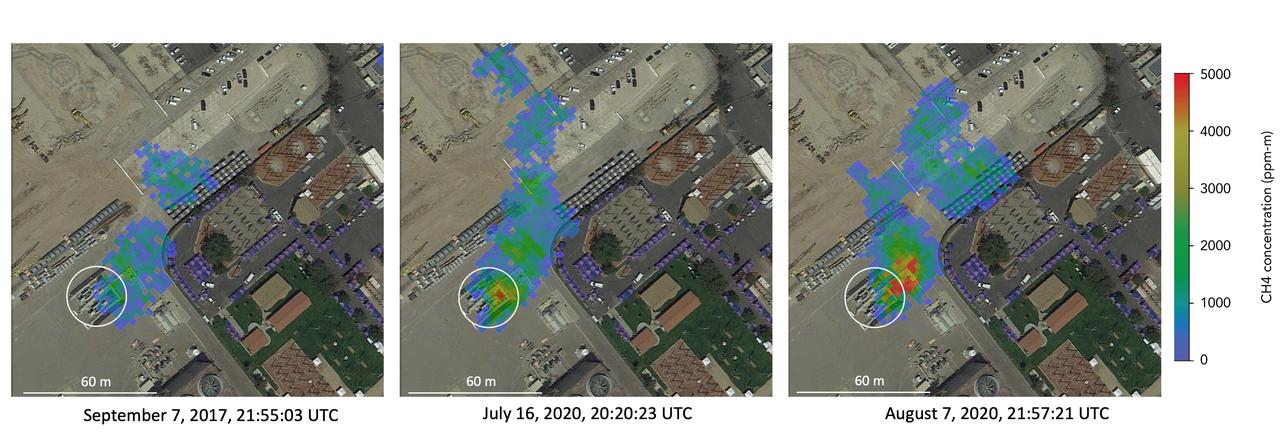
Atmospheric methane is a potent greenhouse gas and an important contributor to air quality. Future instruments on orbiting satellites can help improve our understanding of important methane emission sources. NASA conducts periodic methane studies using the next-generation Airborne Visible/Infrared Imaging Spectrometer (AVIRIS-NG) instrument. These studies are determining the locations and magnitudes of the largest methane emission sources across California, including those associated with landfills, refineries, dairies, wastewater treatment plants, oil and gas fields, power plants, and natural gas infrastructure. These three images show concentrations of methane in a natural gas plume relative to background air measured by AVIRIS-NG, overlaid on true-color land surface images (source: Google Earth). The aircraft was flying at an altitude of about 10,000 feet (3,000 meters) above ground level and the AVIRIS-NG image pixels are each about 10 feet (3 meters) across. The plume shape varies with changing emission rate, wind speed and direction. The methane plume originates from a compressor — circled in each image — at Valley Generating Station, a natural gas-fired power plant near Los Angeles. The color scale indicates the concentration of methane in each pixel relative to background methane concentrations in the surrounding atmosphere. The plume was initially detected by a single overflight in September 2017 but assumed at the time to be due to normal operations (intermittent venting). The plume was detected by AVIRIS-NG again on six flights in July-August 2020. https://photojournal.jpl.nasa.gov/catalog/PIA24019
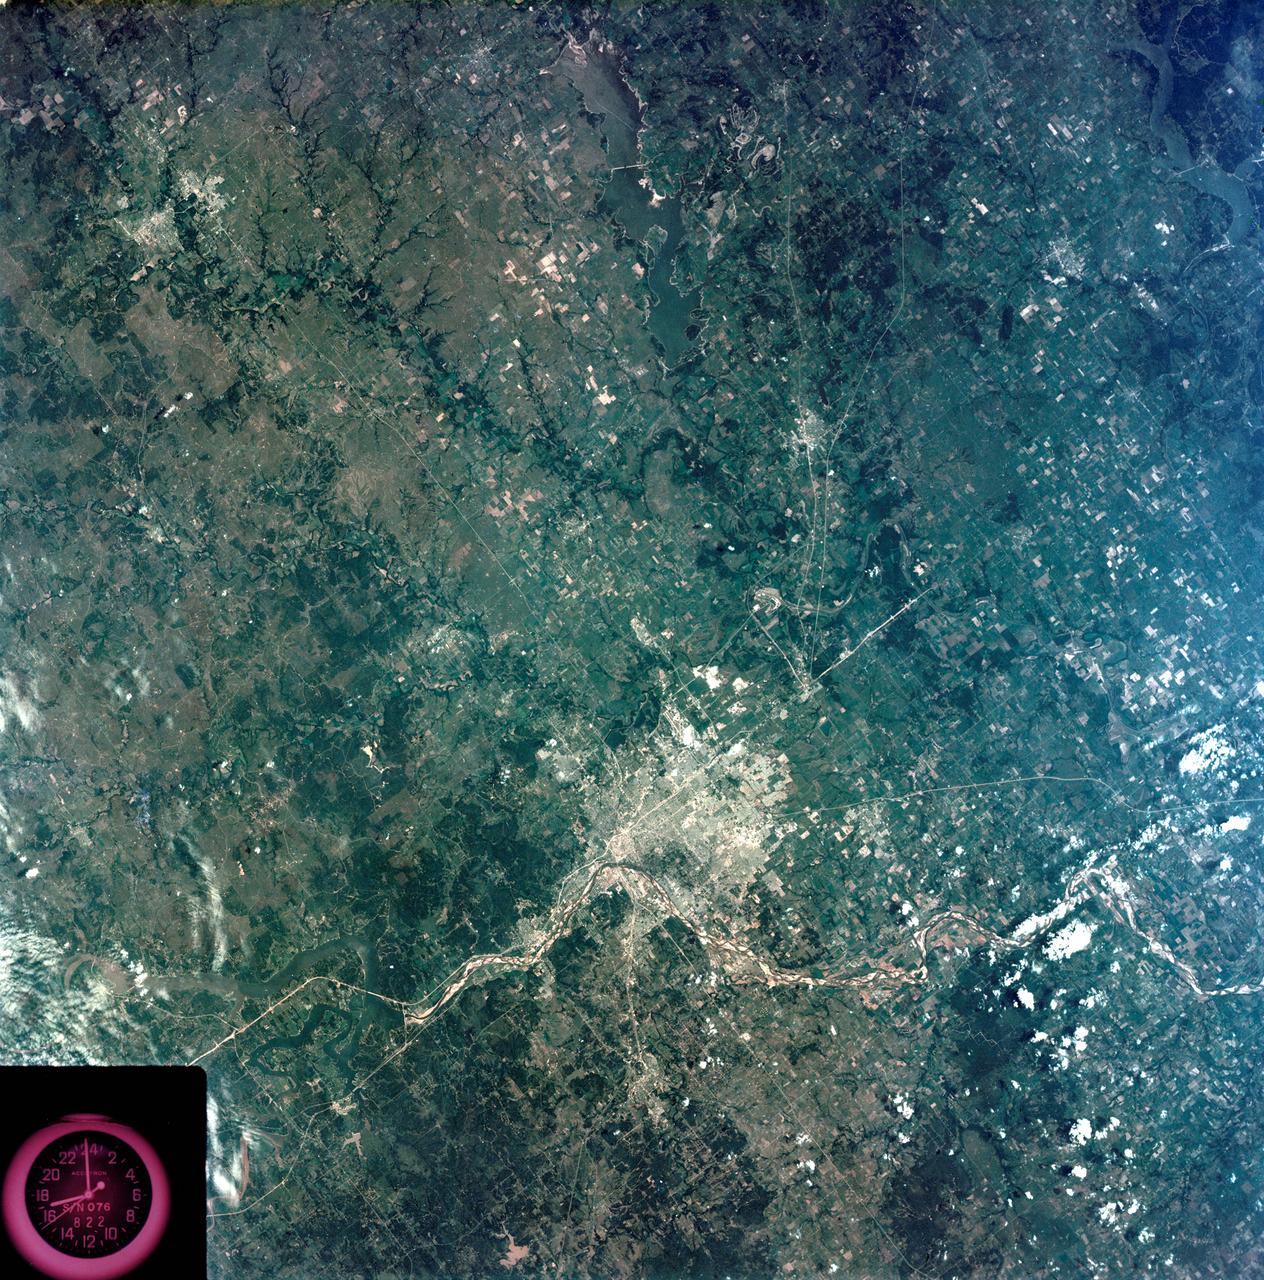
S73-35080 (July-September 1973) --- A vertical view of northeast Oklahoma and the metropolitan Tulsa area is seen in this Skylab 3 Earth Resources Experiments Package S190-B (five-inch Earth terrain camera) photograph taken from the Skylab space station in Earth orbit. THE PICTURE SHOULD BE HELD WITH THE CLOCK ON THE LEFT AND THE LAKE IN THE CORNER ON THE RIGHT. THE LONG STRETCH OF HIGHWAY (U.S. 75) RUNS STRAIGHT NORTH FROM TULSA. Tulsa, a rapidly expanding city in the heart of the mid-continent oil field, has a population of approximately 330,000. The Arkansas River meanders across the southern (lower) portion of the photograph passing through Tulsa as it flows southeastward. Oologah Reservoir, the long body of water, is located northeast of Tulsa. Lake Hudson is the body of water in the right corner of the picture. Keystone Reservoir is to the west and upstream from Tulsa. Westward from Tulsa U.S. 64 makes a 45 degree bend as it turns northwest to cross the Keystone Reservoir. The thin white line over the Oologah Reservoir is a highway bridge. Bartlesville is on U.S. 75 near the north (top) corner of the picture. The Tulsa International Airport is immediately northeast of downtown Tulsa. Several smaller airfields are visible in the surrounding area. The toll roads and other major highways are clearly visible in the picture. Claremore is northeast of Tulsa on U.S. 66 with the Will Rogers Turnpike passing nearby. Sapulpa is southwest of Tulsa on the Turner Turnpike which leads toward Oklahoma City. The detailed information contained in this photograph can be extracted by direct observation and applied to updating land use and cultural maps of Tulsa and to numerous surrounding satellite cities. All EREP photography is available to the public through the Department of Interior?s Earth Resources Observations Systems Data Center, Sioux Falls, South Dakota, 57198. (Alternate number SL3-83-206) Photo credit: NASA
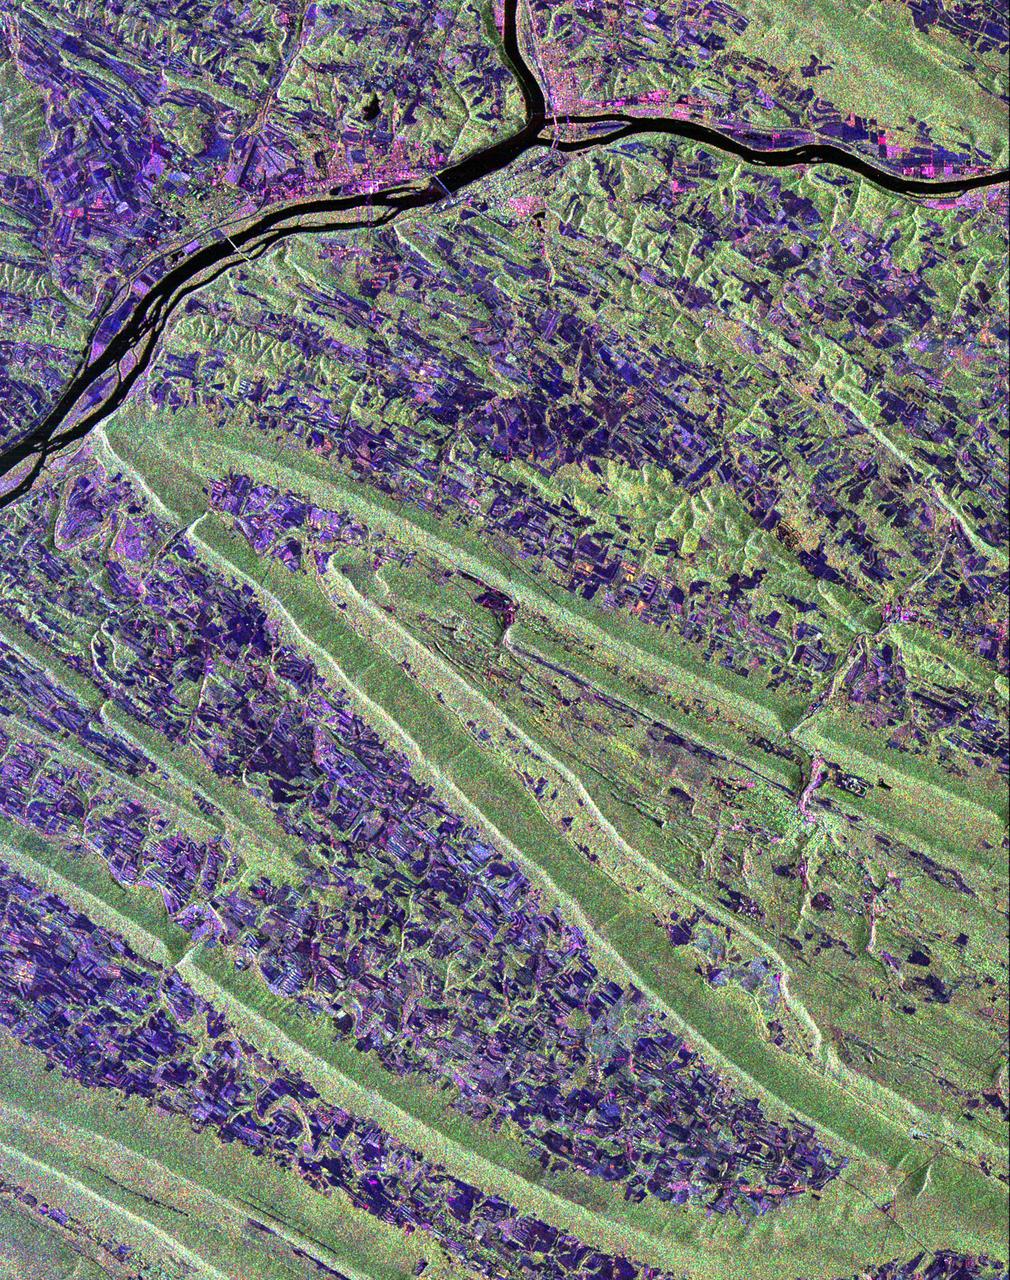
Scientists are using this radar image of the area surrounding Sunbury, Pennsylvania to study the geologic structure and land use patterns in the Appalachian Valley and Ridge province. This image was collected on October 6, 1994 by the Spaceborne Imaging Radar-C/ X-Band Synthetic Aperture Radar (SIR-C/X-SAR) on orbit 102 of the space shuttle Endeavour. The image is centered on latitude 40.85 degrees North latitude and 76.79 degrees West longitude. The area shown is approximately 30.5 km by 38 km. (19 miles by 24 miles). North is towards the upper right of the image. The Valley and Ridge province occurs in the north-central Appalachians, primarily in Pennsylvania, Maryland, and Virginia. It is an area of adjacent valleys and ridges that formed when the Appalachian mountain were created some 370 to 390 million years ago. During the continental collision that formed the Appalachians, the rocks in this area were pushed from the side and buckled much like a rug when pushed from one end. Subsequent erosion has produced the landscape we see in this image. The more resistant rocks, such as sandstone, form the tops of the ridges which appear as forested greenish areas on this image. The less resistant rocks, such as limestone, form the lower valleys which are cleared land and farm fields and are purple in this image. Smaller rivers and streams in the area flow along the valleys and in places cut across the ridges in "water gaps." In addition to defining the geography of this region, the Valley and Ridge province also provides this area with natural resources. The valleys provide fertile farmland and the folded mountains form natural traps for oil and gas accumulation; coal deposits are also found in the mountains. The colors in the image are assigned to different frequencies and polarizations of the SIR-C radar as follows: red is L-band horizontally transmitted, horizontally received; green is L-band horizontally transmitted, vertically received; blue is C-band horizontally transmitted, horizontally received. The river junction near the top of the image is where the West Branch River flows into the Susquehanna River, which then flows to the south-southwest past the state capitol of Harrisburg, 70 km (43 miles) to the south and not visible in this image. The town of Sunbury is shown along the Susquehanna on the east just to the southeast of the junction with West Branch. Three structures that cross the Susquehanna; the northern and southern of these structures are bridges and middle structure is the Shamokin Dam which confines the Susquehanna just south of the junction with West Branch. The prominent S-shaped mountain ridge in the center of the image is, from north to south, Little Mountain (the top of the S), Line Mountain (the middle of the S), and Mahantango Mountain (the bottom of the S). http://photojournal.jpl.nasa.gov/catalog/PIA01306
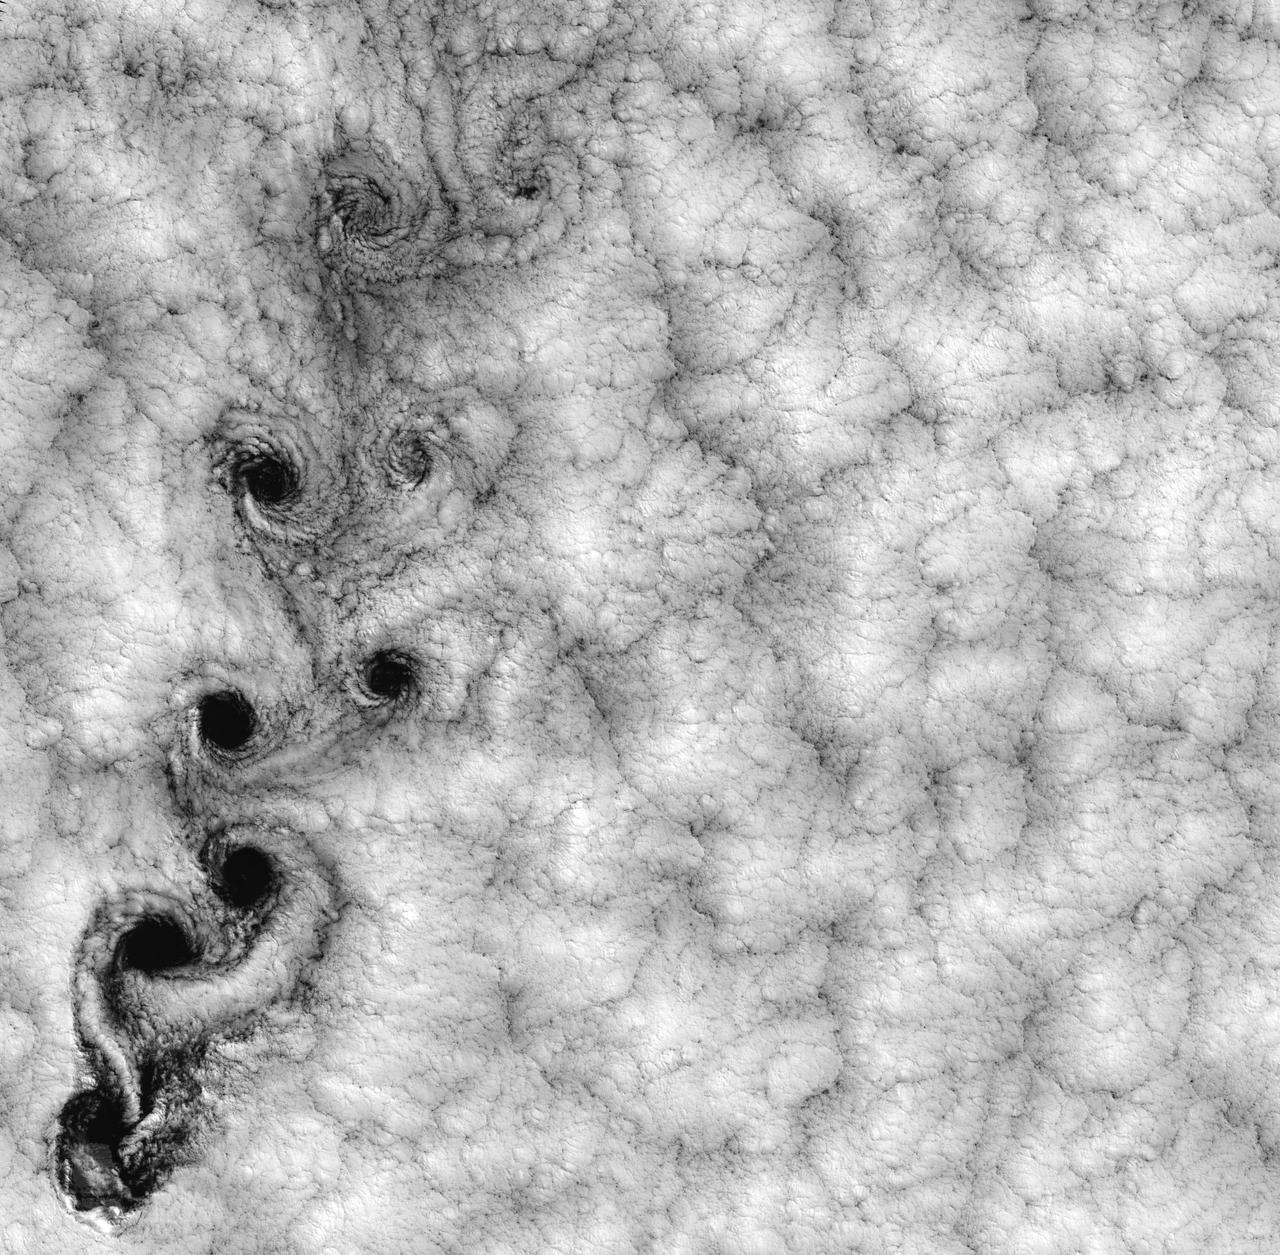
NASA image acquired September 15, 1999 This Landsat 7 image of clouds off the Chilean coast near the Juan Fernandez Islands (also known as the Robinson Crusoe Islands) on September 15, 1999, shows a unique pattern called a “von Karman vortex street.” This pattern has long been studied in the laboratory, where the vortices are created by oil flowing past a cylindrical obstacle, making a string of vortices only several tens of centimeters long. Study of this classic “flow past a circular cylinder” has been very important in the understanding of laminar and turbulent fluid flow that controls a wide variety of phenomena, from the lift under an aircraft wing to Earth’s weather. Here, the cylinder is replaced by Alejandro Selkirk Island (named after the true “Robinson Crusoe,” who was stranded here for many months in the early 1700s). The island is about 1.5 km in diameter, and rises 1.6 km into a layer of marine stratocumulus clouds. This type of cloud is important for its strong cooling of the Earth’s surface, partially counteracting the Greenhouse warming. An extended, steady equatorward wind creates vortices with clockwise flow off the eastern edge and counterclockwise flow off the western edge of the island. The vortices grow as they advect hundreds of kilometers downwind, making a street 10,000 times longer than those made in the laboratory. Observing the same phenomenon extended over such a wide range of sizes dramatizes the “fractal” nature of atmospheric convection and clouds. Fractals are characteristic of fluid flow and other dynamic systems that exhibit “chaotic” motions. Both clockwise and counter-clockwise vortices are generated by flow around the island. As the flow separates from the island’s leeward (away from the source of the wind) side, the vortices “swallow” some of the clear air over the island. (Much of the island air is cloudless due to a local “land breeze” circulation set up by the larger heat capacity of the waters surrounding the island.) The “swallowed” gulps of clear island air get carried along within the vortices, but these are soon mixed into the surrounding clouds. Landsat is unique in its ability to image both the small-scale eddies that mix clear and cloudy air, down to the 30 meter pixel size of Landsat, but also having a wide enough field-of-view, 180 km, to reveal the connection of the turbulence to large-scale flows such as the subtropical oceanic gyres. Landsat 7, with its new onboard digital recorder, has extended this capability away from the few Landsat ground stations to remote areas such as Alejandro Island, and thus is gradually providing a global dynamic picture of evolving human-scale phenomena. For more details on von Karman vortices, refer to <a href="http://climate.gsfc.nasa.gov/~cahalan" rel="nofollow">climate.gsfc.nasa.gov/~cahalan</a>. Image and caption courtesy Bob Cahalan, NASA GSFC Instrument: Landsat 7 - ETM+ Credit: NASA/GSFC/Landsat <b><a href="http://www.nasa.gov/centers/goddard/home/index.html" rel="nofollow">NASA Goddard Space Flight Center</a></b> enables NASA’s mission through four scientific endeavors: Earth Science, Heliophysics, Solar System Exploration, and Astrophysics. Goddard plays a leading role in NASA’s accomplishments by contributing compelling scientific knowledge to advance the Agency’s mission. <b>Follow us on <a href="http://twitter.com/NASA_GoddardPix" rel="nofollow">Twitter</a></b> <b>Join us on <a href="http://www.facebook.com/pages/Greenbelt-MD/NASA-Goddard/395013845897?ref=tsd" rel="nofollow">Facebook</a></b>