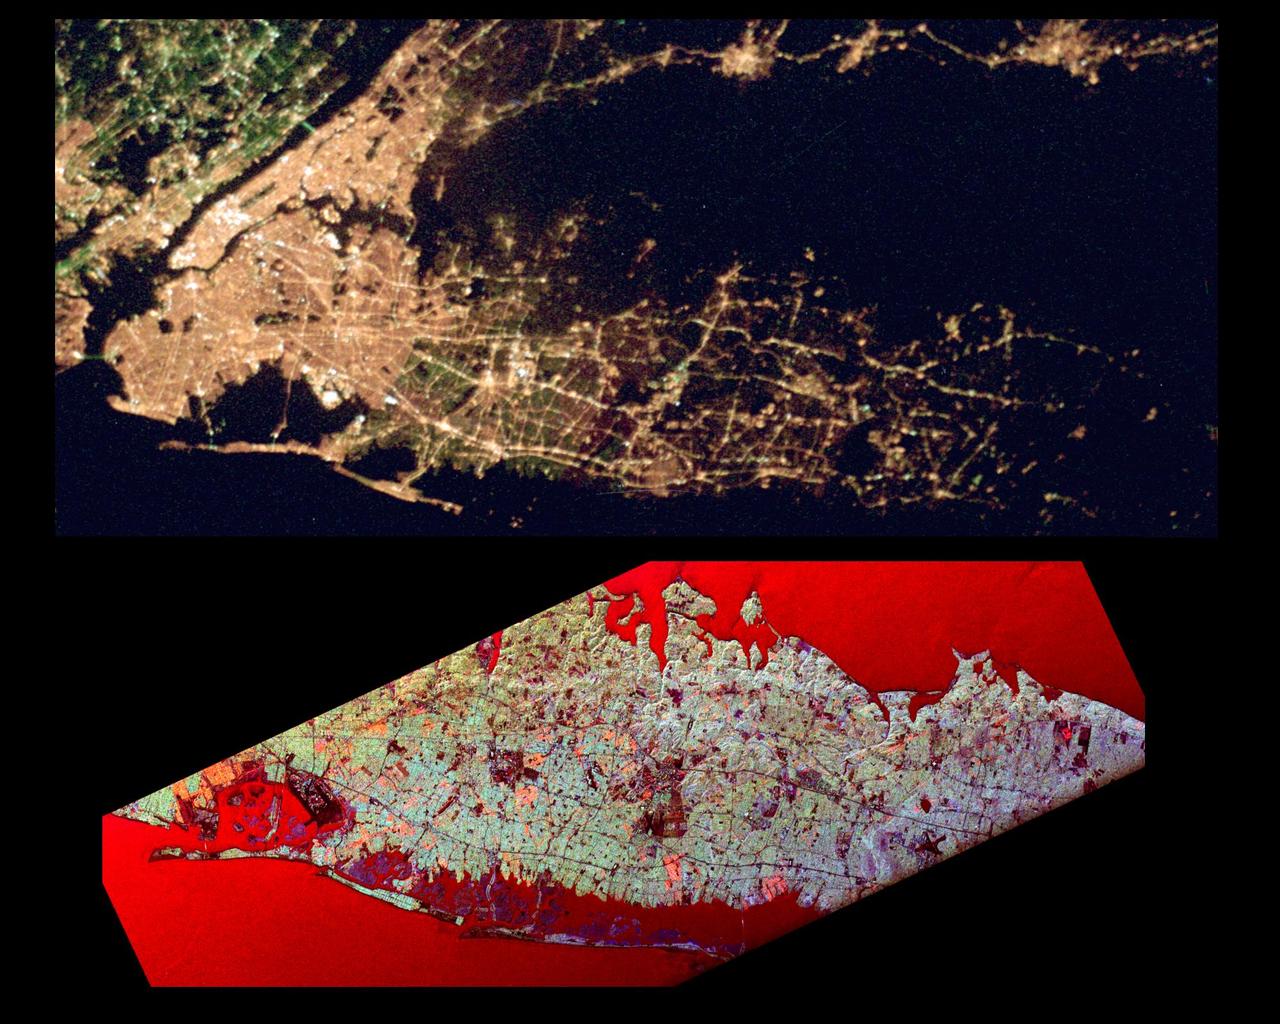
This pair of images of the Long Island, New York region is a comparison of an optical photograph (top) and a radar image (bottom), both taken in darkness in April 1994. The photograph at the top was taken by the Endeavour astronauts at about 3 a.m. Eastern time on April 20, 1994. The image at the bottom was acquired at about the same time four days earlier on April 16,1994 by the Spaceborne Imaging Radar-C/X-Band Synthetic Aperture Radar (SIR-C/X-SAR) system aboard the space shuttle Endeavour. Both images show an area approximately 100 kilometers by 40 kilometers (62 miles by 25 miles) that is centered at 40.7 degrees North latitude and 73.5 degrees West longitude. North is toward the upper right. The optical image is dominated by city lights, which are particularly bright in the densely developed urban areas of New York City located on the left half of the photo. The brightest white zones appear on the island of Manhattan in the left center, and Central Park can be seen as a darker area in the middle of Manhattan. To the northeast (right) of the city, suburban Long Island appears as a less densely illuminated area, with the brightest zones occurring along major transportation and development corridors. Since radar is an active sensing system that provides its own illumination, the radar image shows a great amount of surface detail, despite the night-time acquisition. The colors in the radar image were obtained using the following radar channels: red represents the L-band (horizontally transmitted and received); green represents the L-band (horizontally transmitted and vertically received); blue represents the C-band (horizontally transmitted and vertically received). In this image, the water surface - the Atlantic Ocean along the bottom edge and Long Island Sound shown at the top edge - appears red because small waves at the surface strongly reflect the horizontally transmitted and received L-band radar signal. Networks of highways and railroad lines are clearly visible in the radar image; many of them can also be seen as bright lines i the optical image. The runways of John F. Kennedy International Airport appear as a dark rectangle in Jamaica Bay on the left side of the image. Developed areas appear generally as bright green and orange, while agricultural, protected and undeveloped areas appear darker blue or purple. This contrast can be seen on the barrier islands along the south coast of Long Island, which are heavily developed in the Rockaway and Long Beach areas south and east of Jamaica Bay, but further to the east, the islands are protected and undeveloped. http://photojournal.jpl.nasa.gov/catalog/PIA01785
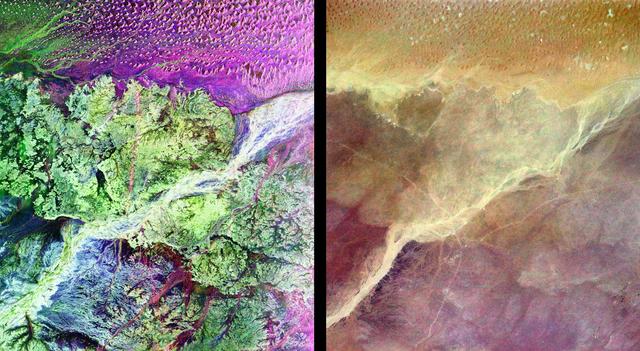
This pair of images from space shows a portion of the southern Empty Quarter of the Arabian Peninsula in the country of Oman. On the left is a radar image of the region around the site of the fabled Lost City of Ubar, discovered in 1992 with the aid of remote sensing data. On the right is an enhanced optical image taken by the shuttle astronauts. Ubar existed from about 2800 BC to about 300 AD. and was a remote desert outpost where caravans were assembled for the transport of frankincense across the desert. The actual site of the fortress of the Lost City of Ubar, currently under excavation, is too small to show in either image. However, tracks leading to the site, and surrounding tracks, show as prominent, but diffuse, reddish streaks in the radar image. Although used in modern times, field investigations show many of these tracks were in use in ancient times as well. Mapping of these tracks on regional remote sensing images provided by the Landsat satellite was a key to recognizing the site as Ubar. The prominent magenta colored area is a region of large sand dunes. The green areas are limestone rocks, which form a rocky desert floor. A major wadi, or dry stream bed, runs across the scene and appears as a white line. The radar images, and ongoing field investigations, will help shed light on an early civilization about which little in known. The radar image was taken by the Spaceborne Imaging Radar C/X-Band Synthetic Aperture Radar (SIR-C/X-SAR) and is centered at 18 degrees North latitude and 53 degrees East longitude. The image covers an area about 50 kilometers by 100 kilometers (31 miles by 62 miles). The colors in the image are assigned to different frequencies and polarizations of the radar as follows: red is L-band, horizontally transmitted, horizontally received; blue is C-band horizontally transmitted, horizontally received; green is L-band horizontally transmitted, vertically received. SIR-C/X-SAR, a joint mission of the German, Italian and the United States space agencies, is part of NASA's Mission to Planet Earth. http://photojournal.jpl.nasa.gov/catalog/PIA01302
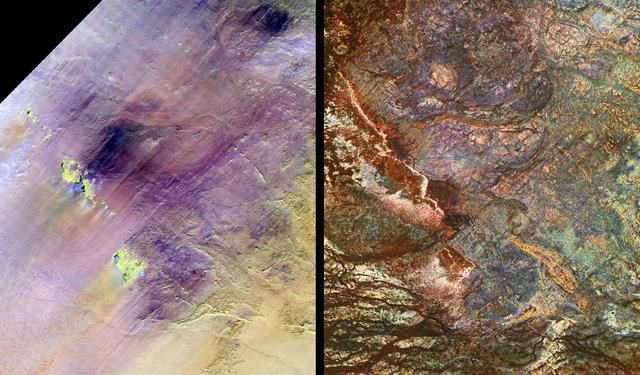
These images show two views of a region of south-central Egypt. On the left is an optical image from NASA Landsat Thematic Mapper, and on the right is a radar image from NASA Spaceborne Imaging Radar-C/X-band Synthetic Aperture Radar SIR-C/X-SAR.
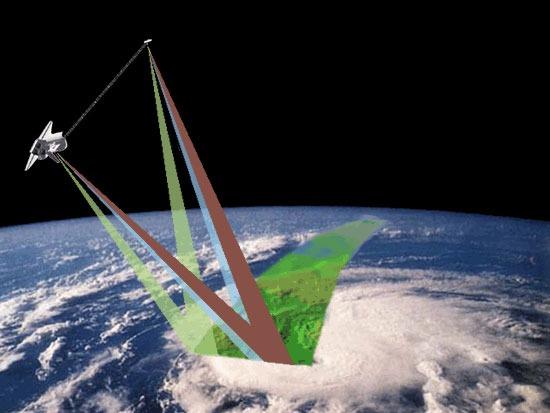
JSC2000E-01557 (January 2000) --- This partially computer-generated scene depicts anticipated coverage by the Shuttle Radar Topography Mission (SRTM) of topographic features on Earth. Heavy cloud cover, hurricanes and cyclonic storms can prevent optical cameras on satellites or aircraft from imaging some areas. SRTM radar, with its long wavelength, will penetrate clouds as well as providing its own illumination, making it independent of daylight.
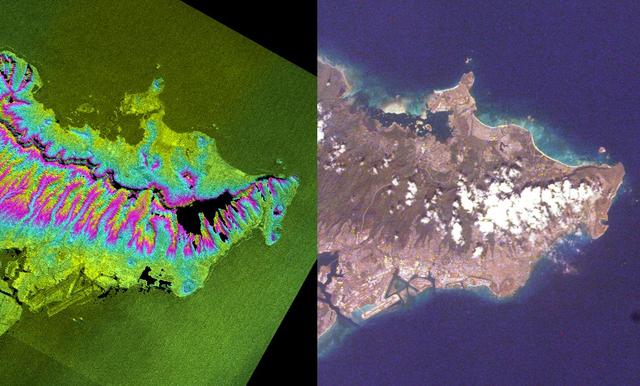
These two images of the eastern part of the island of Oahu, Hawaii provide information on regional topography and show the relationship between urban development and sensitive ecosystems.
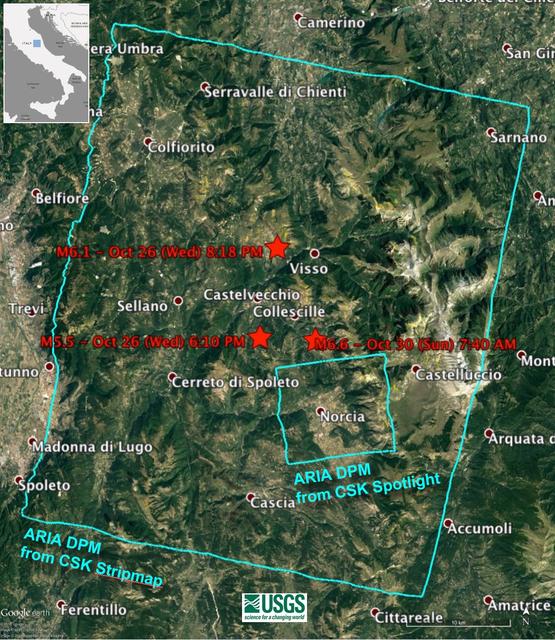
Damage Proxy Map (DPM) v0.5, derived from the Italian Space Agency's COSMO-SkyMed Spotlight synthetic aperture radar (SAR) data acquired from an ascending orbit, covering an area of 6.2-by-6.2 miles (10-by-10 kilometers), centered at Norcia, Italy. Red pixels (pixel size about 16 feet, or 5 meters)represent areas of potential damage due to the Magnitude 6.6 Oct 30, 2016, Central Italy earthquakes, as well as ground surface change during the time period Oct. 30, 2016 -- Oct. 31, 2016. The color variation from yellow to red indicate increasingly more significant ground surface change. Preliminary validation was carried out by comparing with high-resolution pre- and post-event optical imagery acquired by DigitalGlobe's WorldView satellites, and a damage map produced by the European Commission Copernicus Emergency Management Service based upon visual inspection of high-resolution pre- (Orthophoto) and post-event (Pleiades-1) optical imagery. This DPM provides broad geographic coverage of the earthquake's impact in the region. Areas that fall in radar shadow and layover were masked out. The DPM should be used as guidance to identify damaged areas, and may be less reliable over vegetated areas. http://photojournal.jpl.nasa.gov/catalog/PIA15374
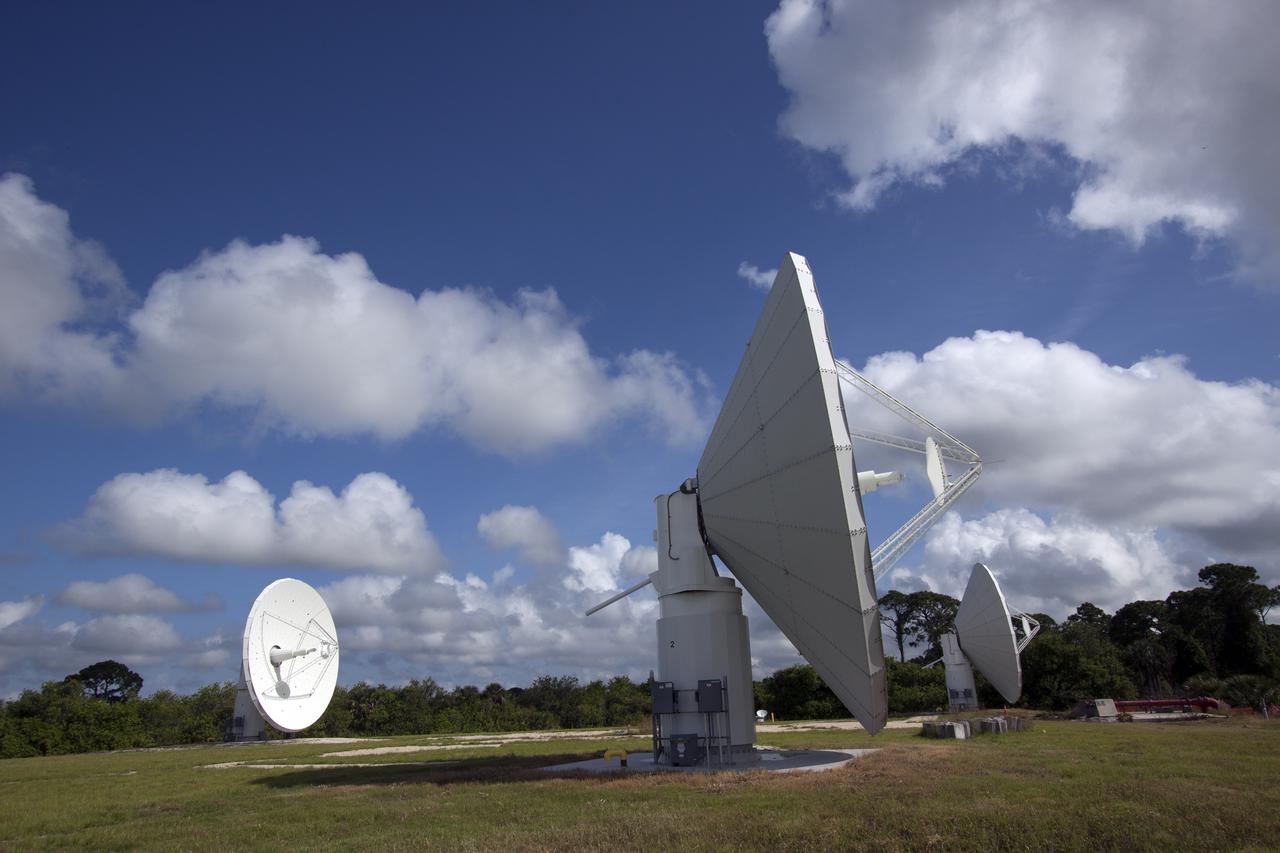
CAPE CANAVERAL, Fla. -- At NASA’s Kennedy Space Center in Florida, the three Ka-Band Objects Observation and Monitoring, or Ka-BOOM, testbed antennas are used to track the pattern of the sun during initial testing of the new system. The goal of Ka-BOOM is to prove technologies that will allow future systems to characterize near-Earth objects in terms of size, shape, rotation_tumble rate and to determine the trajectory of those objects. Radar studies can determine the trajectory 100,000 times more precisely than can optical methods. While also capable of space communication and radio science experiments, developing radar applications is the primary focus of the arrays. The 40-foot-diameter dish antenna arrays are at the site of the former Vertical Processing Facility, which has been demolished. Photo credit: NASA_Jim Grossmann
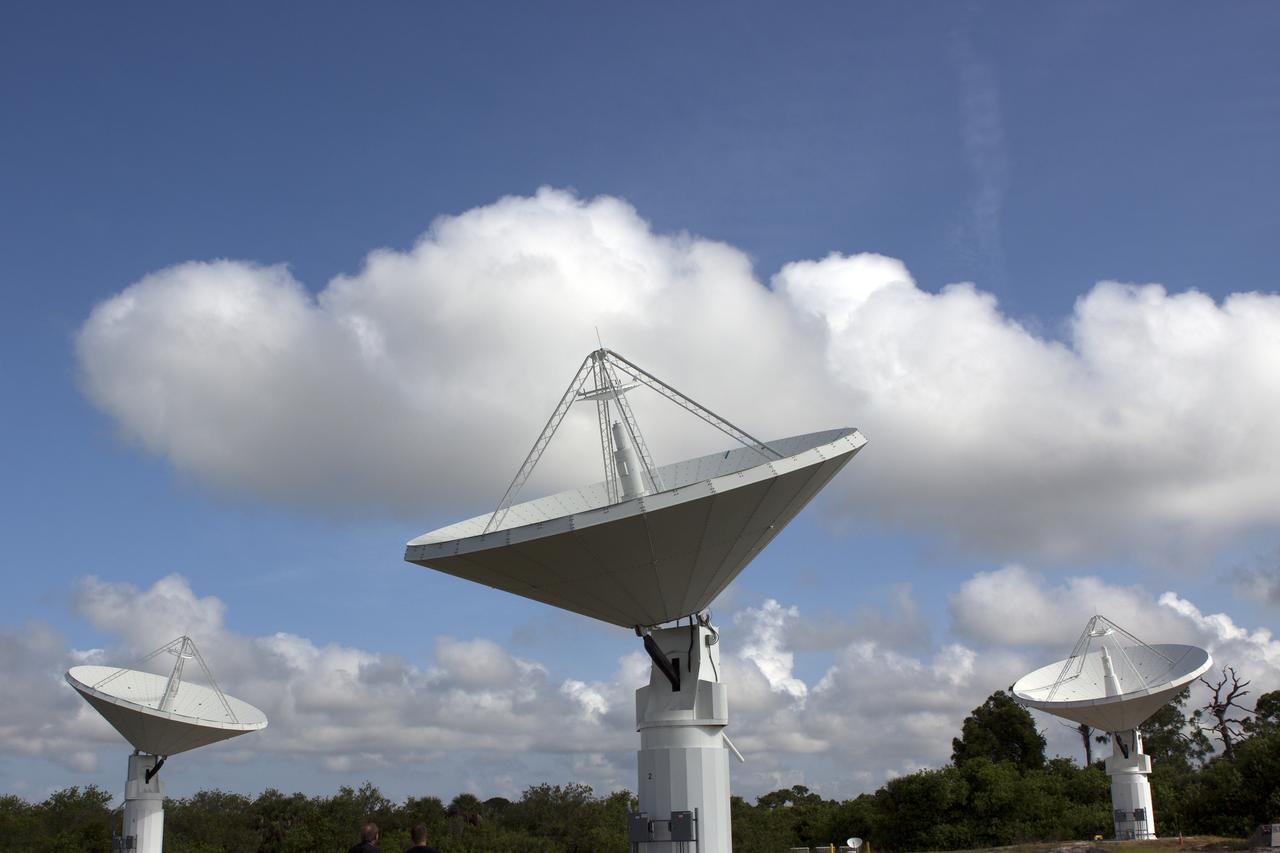
CAPE CANAVERAL, Fla. -- At NASA’s Kennedy Space Center in Florida, the three Ka-Band Objects Observation and Monitoring, or Ka-BOOM, testbed antennas are used to track the pattern of the sun during initial testing of the new system. The goal of Ka-BOOM is to prove technologies that will allow future systems to characterize near-Earth objects in terms of size, shape, rotation_tumble rate and to determine the trajectory of those objects. Radar studies can determine the trajectory 100,000 times more precisely than can optical methods. While also capable of space communication and radio science experiments, developing radar applications is the primary focus of the arrays. The 40-foot-diameter dish antenna arrays are at the site of the former Vertical Processing Facility, which has been demolished. Photo credit: NASA_Jim Grossmann
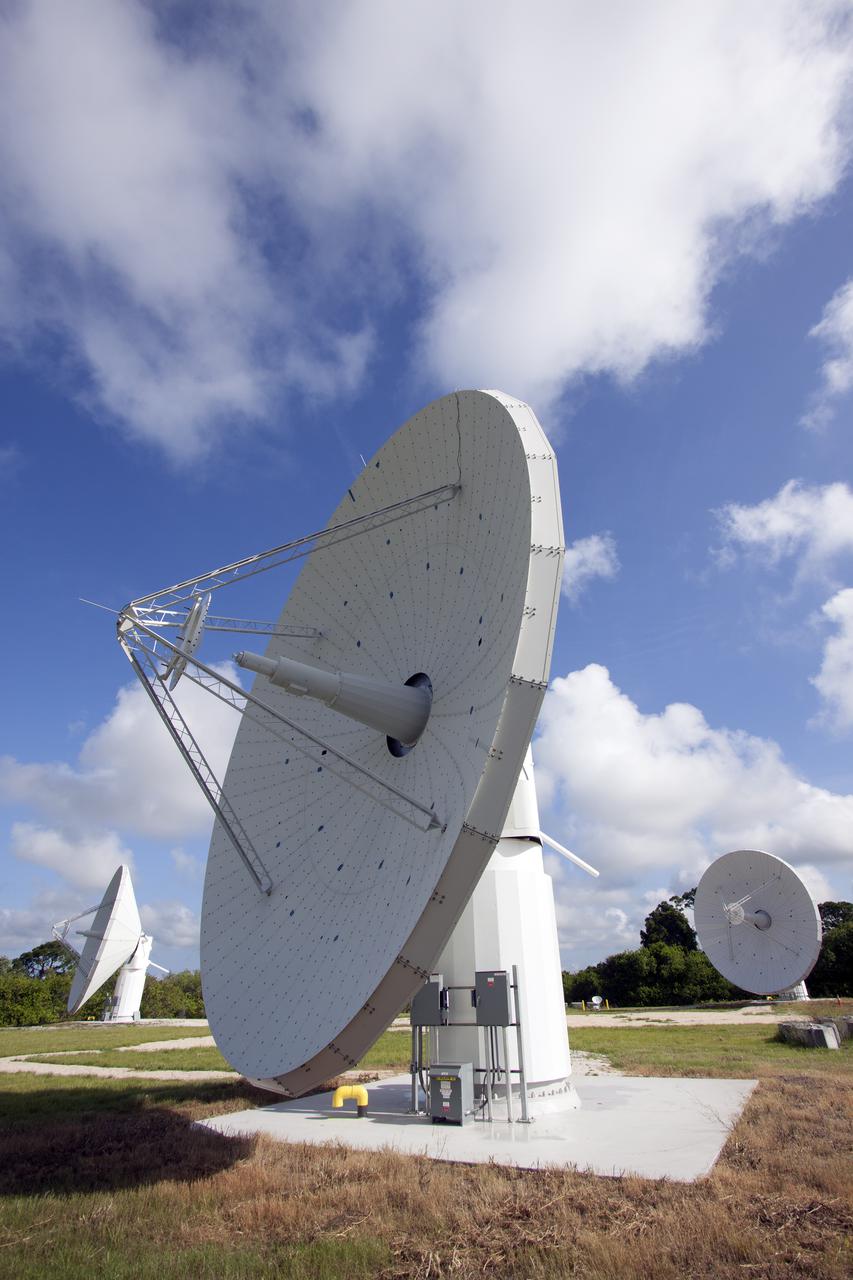
CAPE CANAVERAL, Fla. -- At NASA’s Kennedy Space Center in Florida, one of the three Ka-Band Objects Observation and Monitoring, or Ka-BOOM, testbed antennas is used to track the sun during initial testing of the new system. The goal of Ka-BOOM is to prove technologies that will allow future systems to characterize near-Earth objects in terms of size, shape, rotation_tumble rate and to determine the trajectory of those objects. Radar studies can determine the trajectory 100,000 times more precisely than can optical methods. While also capable of space communication and radio science experiments, developing radar applications is the primary focus of the arrays. The 40-foot-diameter dish antenna arrays are at the site of the former Vertical Processing Facility, which has been demolished. Photo credit: NASA_Jim Grossmann
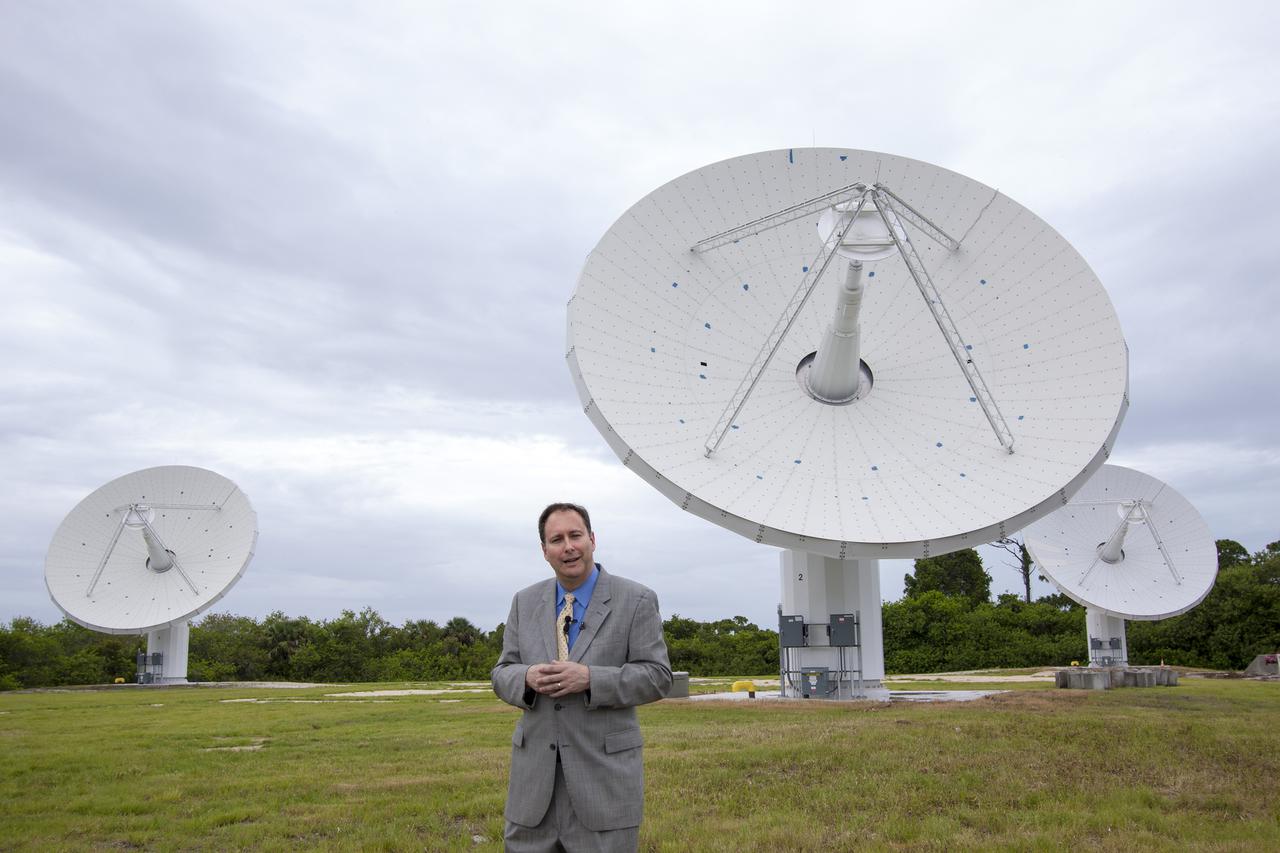
CAPE CANAVERAL, Fla. – At NASA’s Kennedy Space Center in Florida, Robert Lightfoot, NASA associate director, talks to members of the media at the Ka Band Objects Observation and Monitoring, or KaBOOM, testbed antenna array site during a tour of Kennedy facilities. The goal of KaBOOM is to prove technologies that will allow future systems to characterize near-Earth objects in terms of size, shape, rotation_tumble rate and to determine the trajectory of those objects. Radar studies can determine the trajectory 100,000 times more precisely than can optical methods. While also capable of space communication and radio science experiments, developing radar applications is the primary focus of the arrays. The 40-foot-diameter dish antenna arrays are at the site of the former Vertical Processing Facility, which has been demolished. Photo credit: NASA_Jim Grossmann
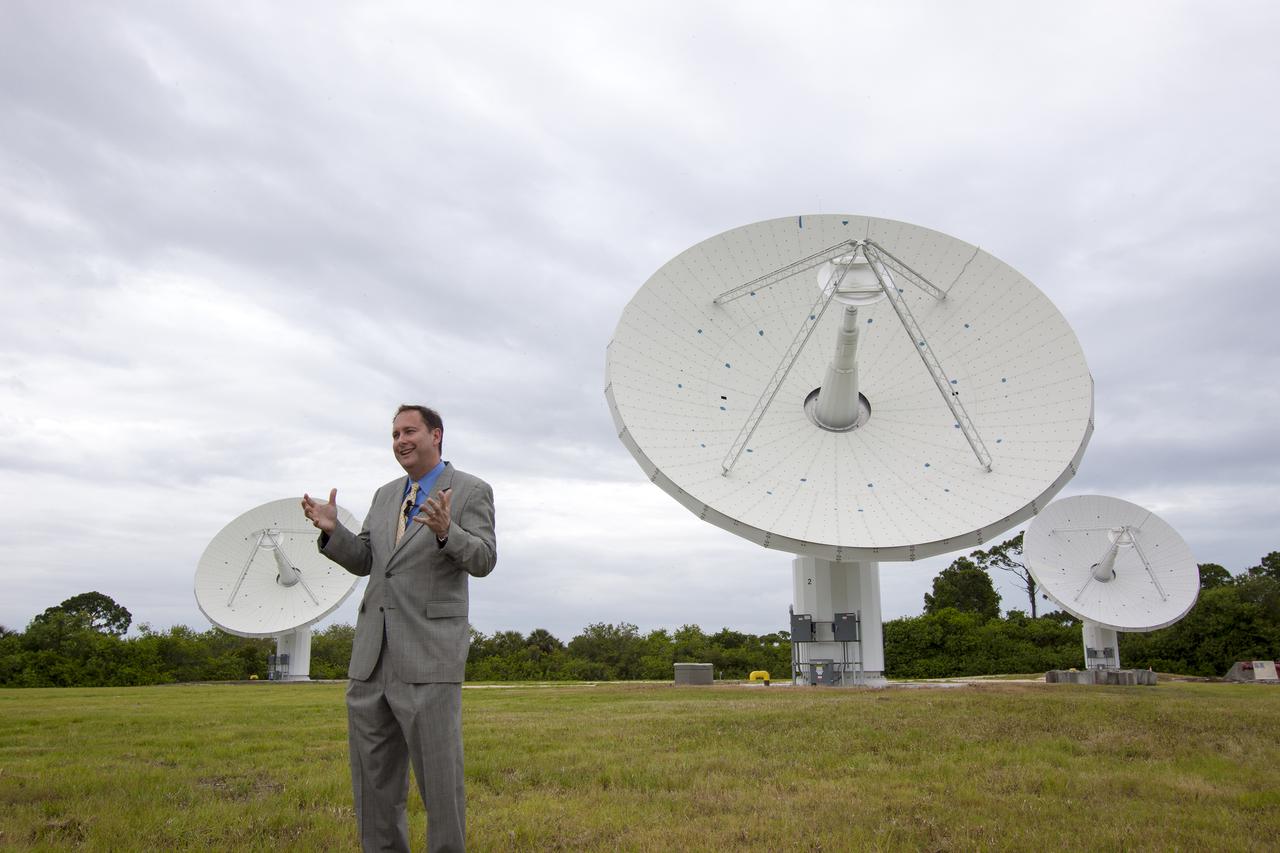
CAPE CANAVERAL, Fla. – At NASA’s Kennedy Space Center in Florida, Robert Lightfoot, NASA associate director, talks to members of the media at the Ka Band Objects Observation and Monitoring, or KaBOOM, testbed antenna array site during a tour of Kennedy facilities. The goal of KaBOOM is to prove technologies that will allow future systems to characterize near-Earth objects in terms of size, shape, rotation_tumble rate and to determine the trajectory of those objects. Radar studies can determine the trajectory 100,000 times more precisely than can optical methods. While also capable of space communication and radio science experiments, developing radar applications is the primary focus of the arrays. The 40-foot-diameter dish antenna arrays are at the site of the former Vertical Processing Facility, which has been demolished. Photo credit: NASA_Jim Grossmann
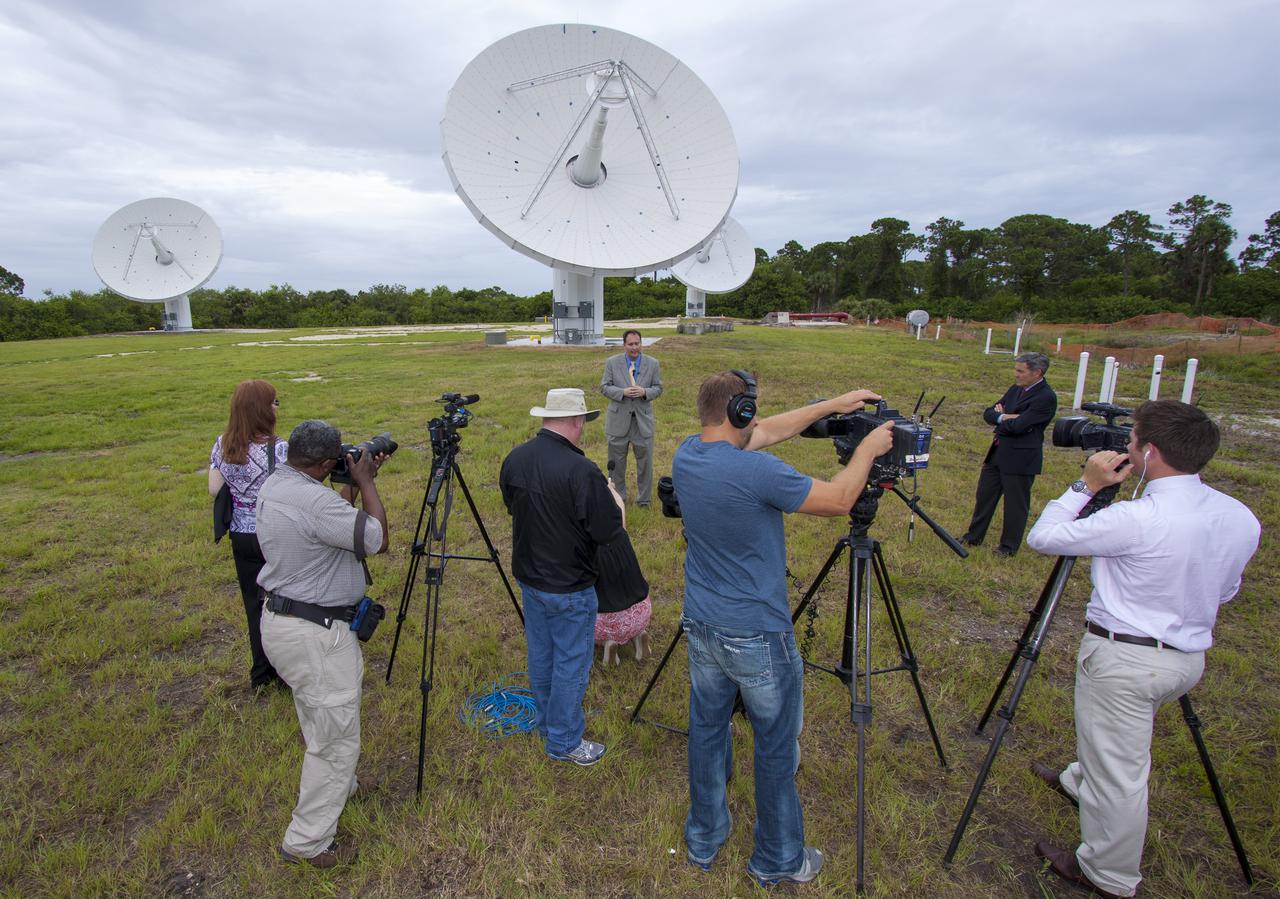
CAPE CANAVERAL, Fla. – At NASA’s Kennedy Space Center in Florida, Robert Lightfoot, NASA associate director, talks to members of the media at the Ka Band Objects Observation and Monitoring, or KaBOOM, testbed antenna array site during a tour of Kennedy facilities. At right is Kennedy Director Bob Cabana. The goal of KaBOOM is to prove technologies that will allow future systems to characterize near-Earth objects in terms of size, shape, rotation_tumble rate and to determine the trajectory of those objects. Radar studies can determine the trajectory 100,000 times more precisely than can optical methods. While also capable of space communication and radio science experiments, developing radar applications is the primary focus of the arrays. The 40-foot-diameter dish antenna arrays are at the site of the former Vertical Processing Facility, which has been demolished. Photo credit: NASA_Jim Grossmann
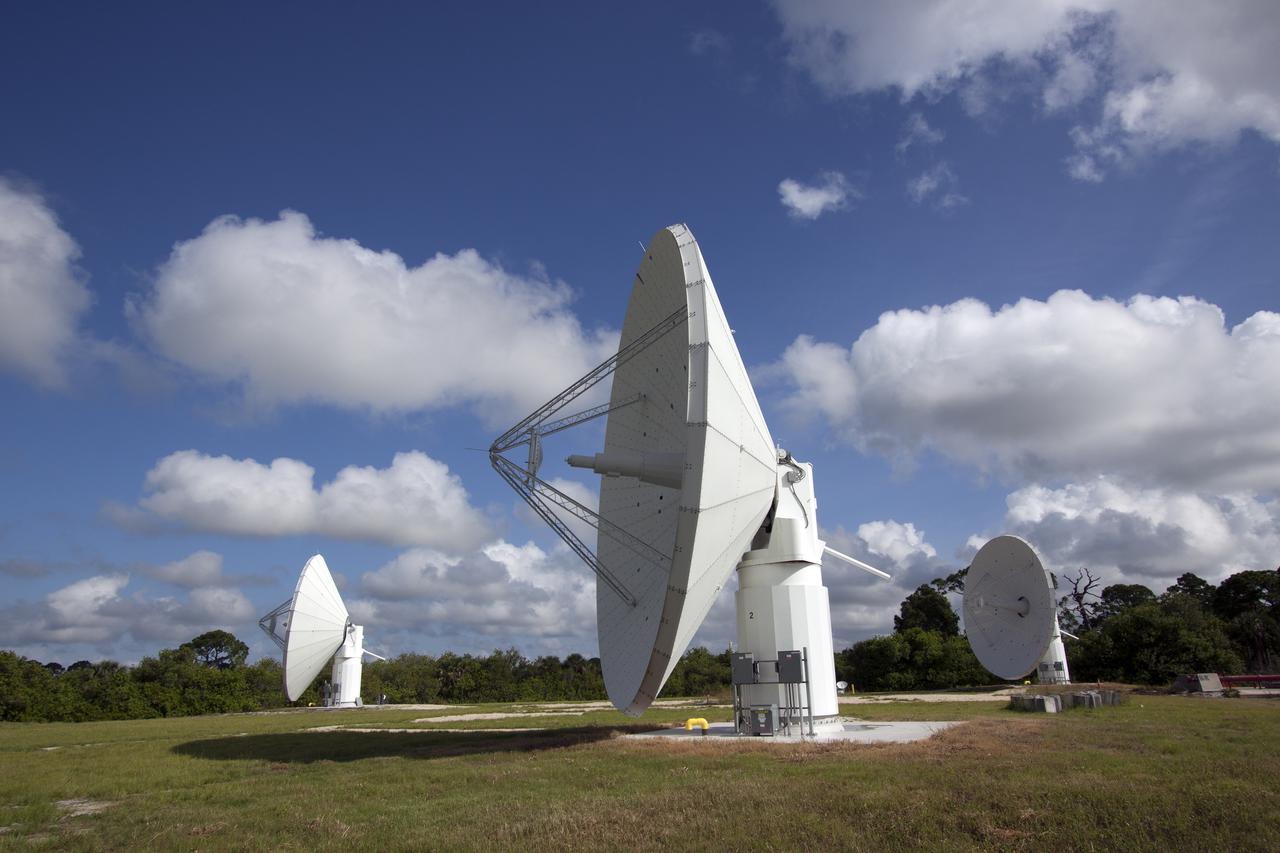
CAPE CANAVERAL, Fla. -- At NASA’s Kennedy Space Center in Florida, the three Ka-Band Objects Observation and Monitoring, or Ka-BOOM, testbed antennas are used to track the pattern of the sun during initial testing of the new system. The goal of Ka-BOOM is to prove technologies that will allow future systems to characterize near-Earth objects in terms of size, shape, rotation_tumble rate and to determine the trajectory of those objects. Radar studies can determine the trajectory 100,000 times more precisely than can optical methods. While also capable of space communication and radio science experiments, developing radar applications is the primary focus of the arrays. The 40-foot-diameter dish antenna arrays are at the site of the former Vertical Processing Facility, which has been demolished. Photo credit: NASA_Jim Grossmann
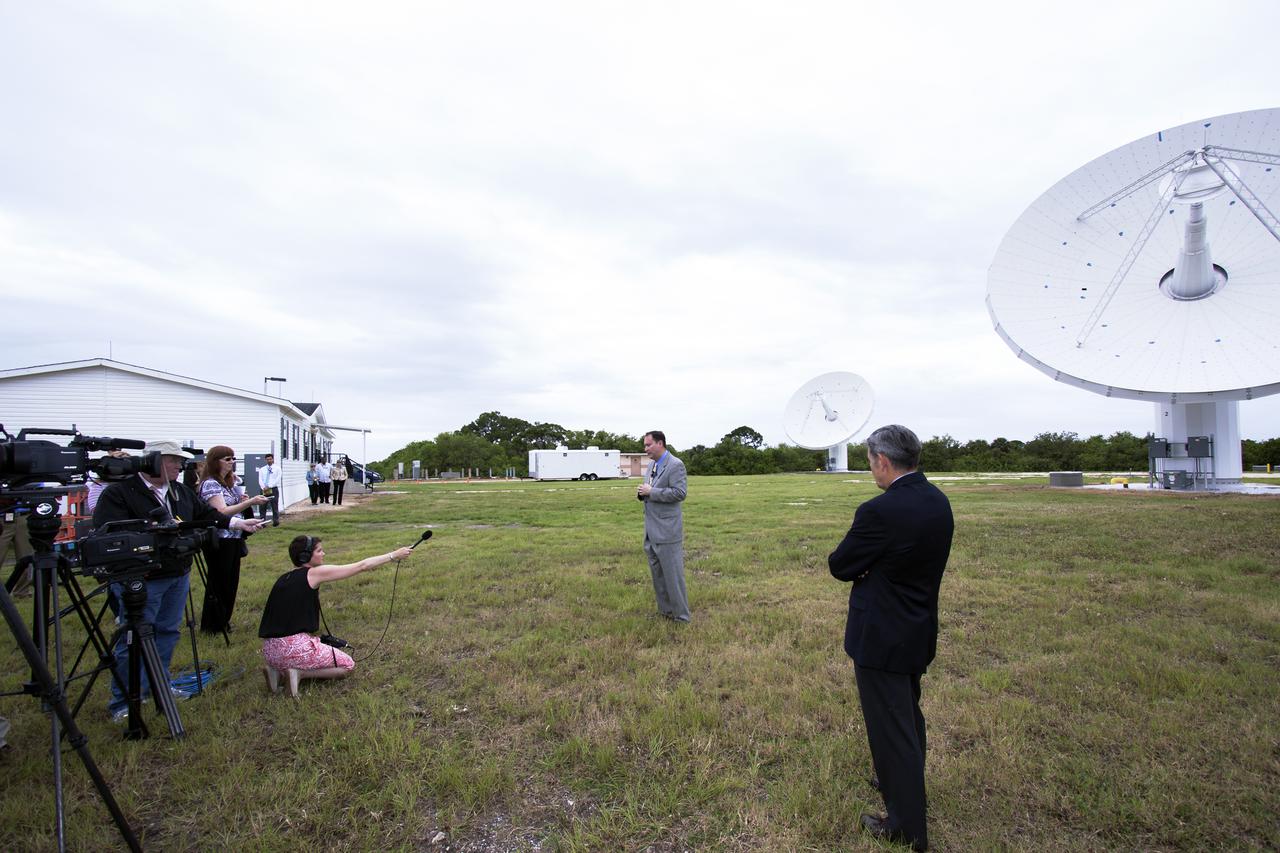
CAPE CANAVERAL, Fla. – At NASA’s Kennedy Space Center in Florida, Robert Lightfoot, NASA associate director, talks to members of the media at the Ka Band Objects Observation and Monitoring, or KaBOOM, testbed antenna array site during a tour of Kennedy facilities. At right, in the foreground is Kennedy Director Bob Cabana. The goal of KaBOOM is to prove technologies that will allow future systems to characterize near-Earth objects in terms of size, shape, rotation_tumble rate and to determine the trajectory of those objects. Radar studies can determine the trajectory 100,000 times more precisely than can optical methods. While also capable of space communication and radio science experiments, developing radar applications is the primary focus of the arrays. The 40-foot-diameter dish antenna arrays are at the site of the former Vertical Processing Facility, which has been demolished. Photo credit: NASA_Jim Grossmann
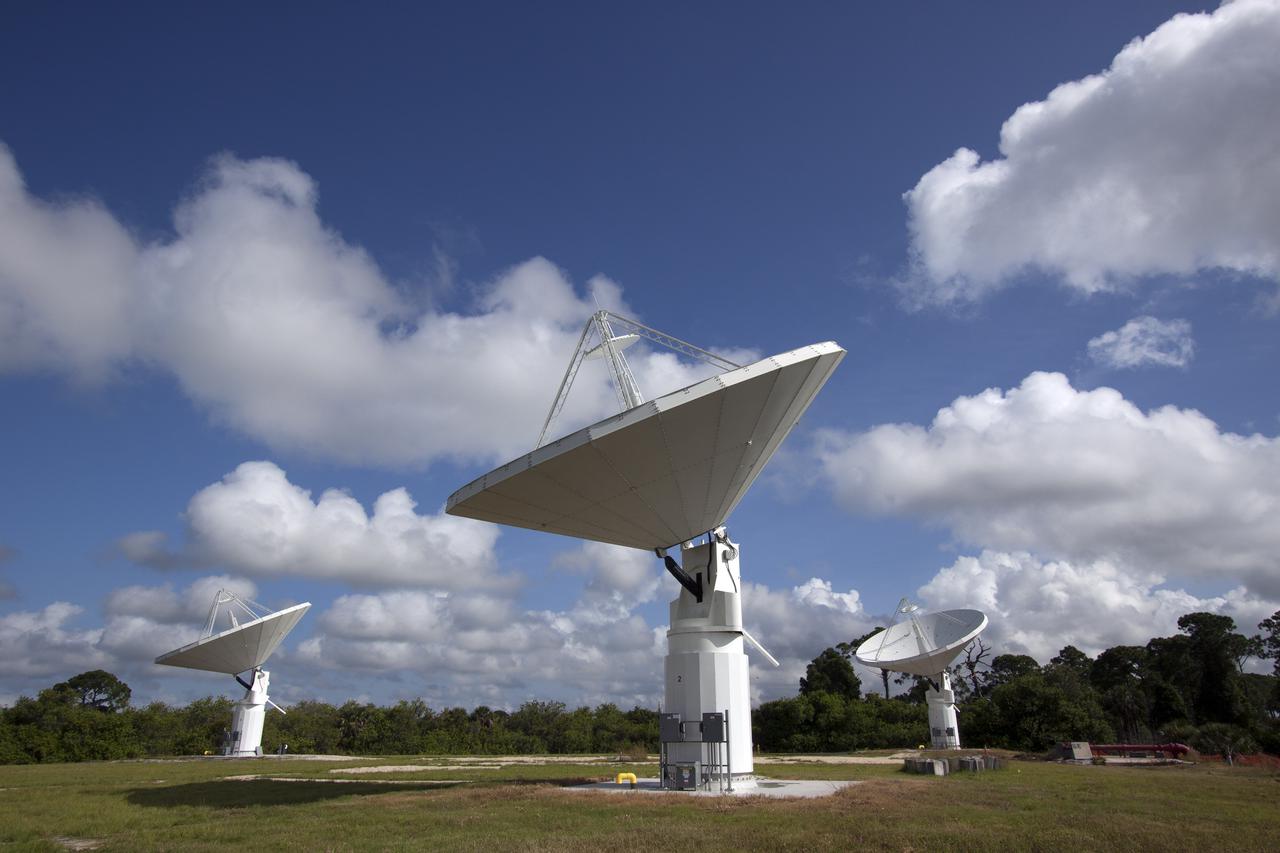
CAPE CANAVERAL, Fla. -- At NASA’s Kennedy Space Center in Florida, the three Ka-Band Objects Observation and Monitoring, or Ka-BOOM, testbed antennas are used to track the pattern of the sun during initial testing of the new system. The goal of Ka-BOOM is to prove technologies that will allow future systems to characterize near-Earth objects in terms of size, shape, rotation_tumble rate and to determine the trajectory of those objects. Radar studies can determine the trajectory 100,000 times more precisely than can optical methods. While also capable of space communication and radio science experiments, developing radar applications is the primary focus of the arrays. The 40-foot-diameter dish antenna arrays are at the site of the former Vertical Processing Facility, which has been demolished. Photo credit: NASA_Jim Grossmann
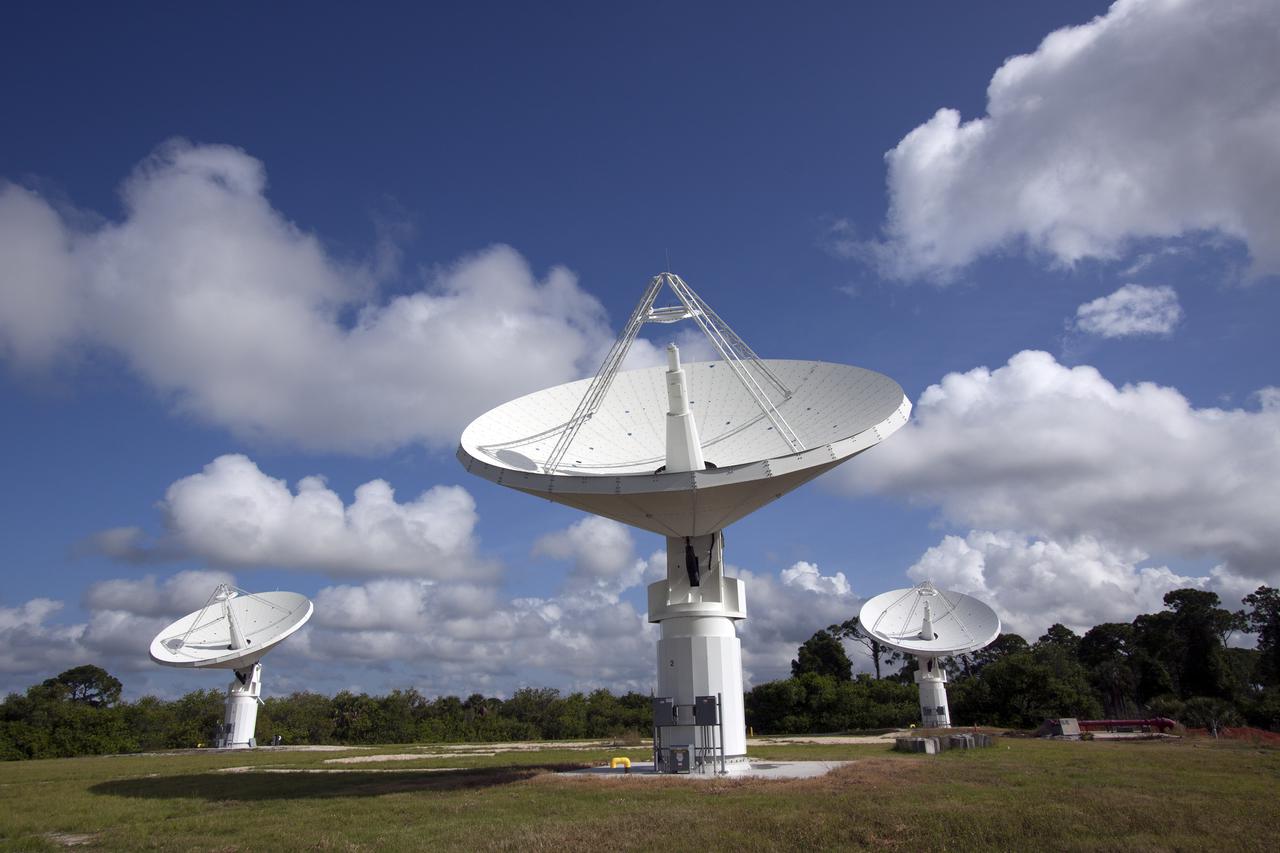
CAPE CANAVERAL, Fla. -- At NASA’s Kennedy Space Center in Florida, the three Ka-Band Objects Observation and Monitoring, or Ka-BOOM, testbed antennas are used to track the pattern of the sun during initial testing of the new system. The goal of Ka-BOOM is to prove technologies that will allow future systems to characterize near-Earth objects in terms of size, shape, rotation_tumble rate and to determine the trajectory of those objects. Radar studies can determine the trajectory 100,000 times more precisely than can optical methods. While also capable of space communication and radio science experiments, developing radar applications is the primary focus of the arrays. The 40-foot-diameter dish antenna arrays are at the site of the former Vertical Processing Facility, which has been demolished. Photo credit: NASA_Jim Grossmann
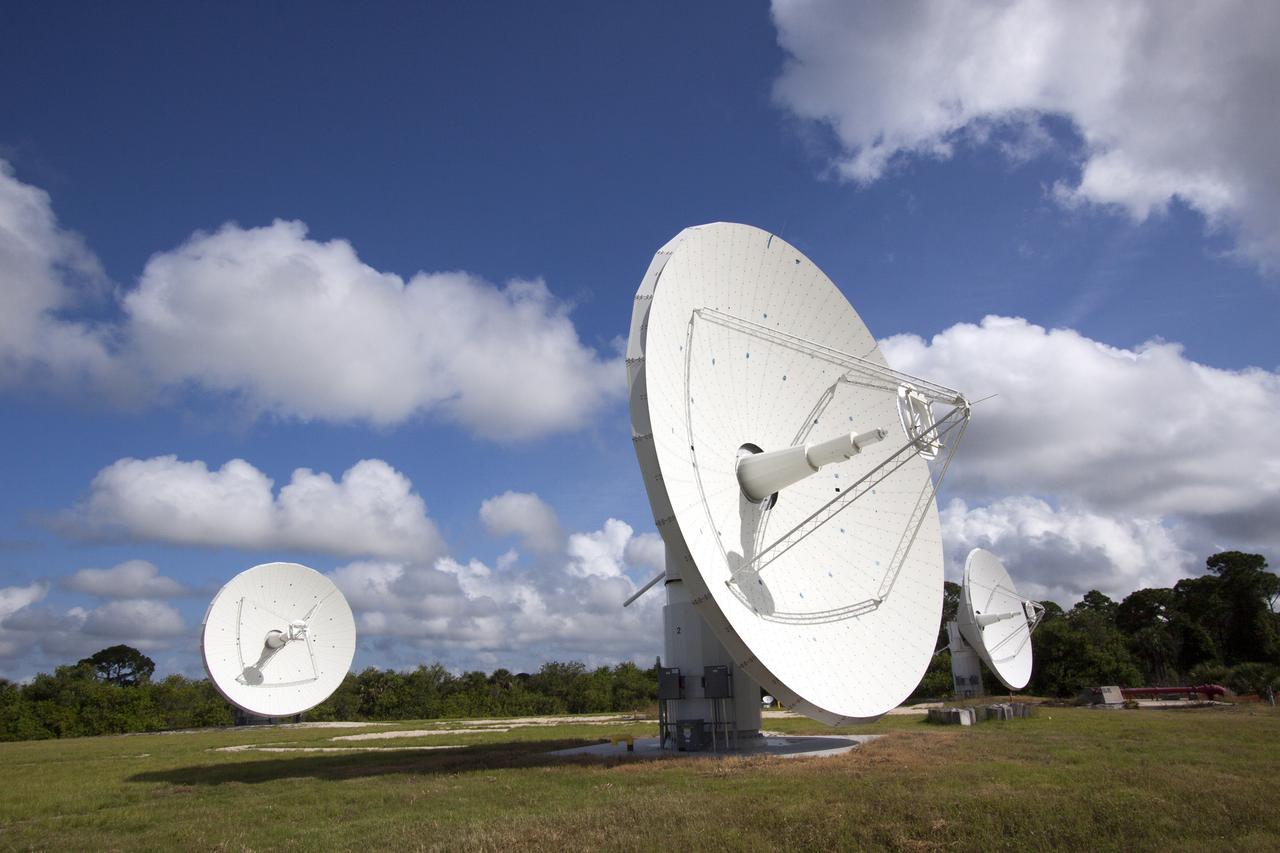
CAPE CANAVERAL, Fla. -- At NASA’s Kennedy Space Center in Florida, the three Ka-Band Objects Observation and Monitoring, or Ka-BOOM, testbed antennas are used to track the pattern of the sun during initial testing of the new system. The goal of Ka-BOOM is to prove technologies that will allow future systems to characterize near-Earth objects in terms of size, shape, rotation_tumble rate and to determine the trajectory of those objects. Radar studies can determine the trajectory 100,000 times more precisely than can optical methods. While also capable of space communication and radio science experiments, developing radar applications is the primary focus of the arrays. The 40-foot-diameter dish antenna arrays are at the site of the former Vertical Processing Facility, which has been demolished. Photo credit: NASA_Jim Grossmann
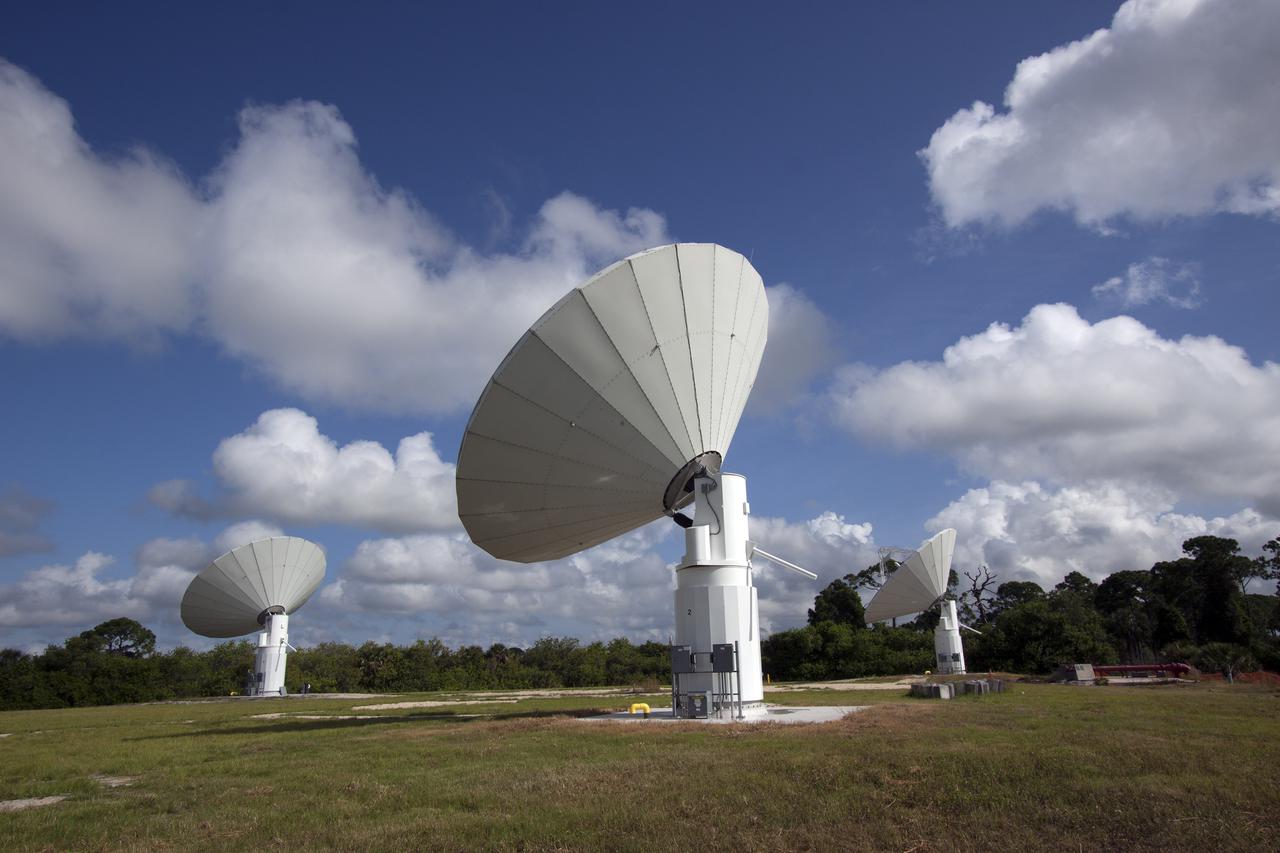
CAPE CANAVERAL, Fla. -- At NASA’s Kennedy Space Center in Florida, the three Ka-Band Objects Observation and Monitoring, or Ka-BOOM, testbed antennas are used to track the pattern of the sun during initial testing of the new system. The goal of Ka-BOOM is to prove technologies that will allow future systems to characterize near-Earth objects in terms of size, shape, rotation_tumble rate and to determine the trajectory of those objects. Radar studies can determine the trajectory 100,000 times more precisely than can optical methods. While also capable of space communication and radio science experiments, developing radar applications is the primary focus of the arrays. The 40-foot-diameter dish antenna arrays are at the site of the former Vertical Processing Facility, which has been demolished. Photo credit: NASA_Jim Grossmann
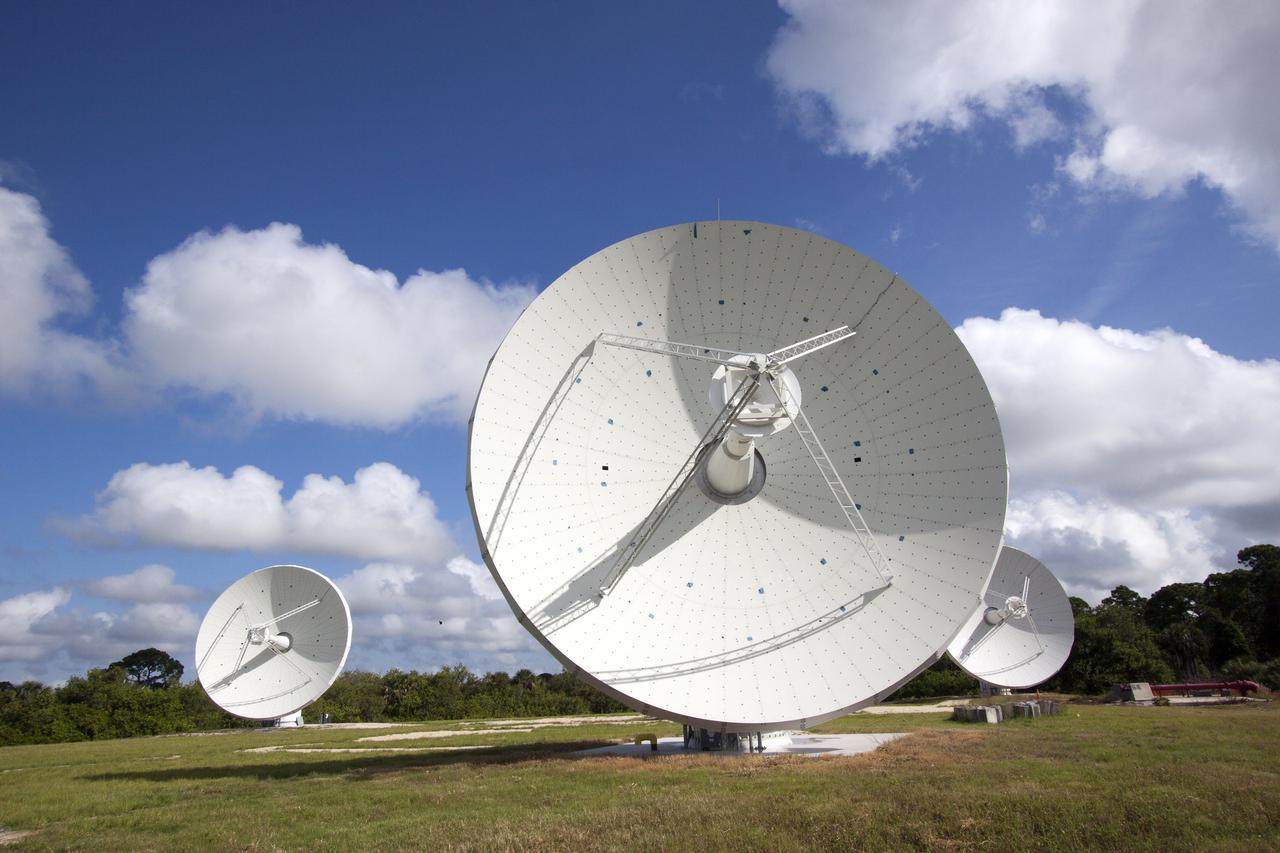
CAPE CANAVERAL, Fla. -- At NASA’s Kennedy Space Center in Florida, the three Ka-Band Objects Observation and Monitoring, or Ka-BOOM, testbed antennas are used to track the pattern of the sun during initial testing of the new system. The goal of Ka-BOOM is to prove technologies that will allow future systems to characterize near-Earth objects in terms of size, shape, rotation_tumble rate and to determine the trajectory of those objects. Radar studies can determine the trajectory 100,000 times more precisely than can optical methods. While also capable of space communication and radio science experiments, developing radar applications is the primary focus of the arrays. The 40-foot-diameter dish antenna arrays are at the site of the former Vertical Processing Facility, which has been demolished. Photo credit: NASA_Jim Grossmann
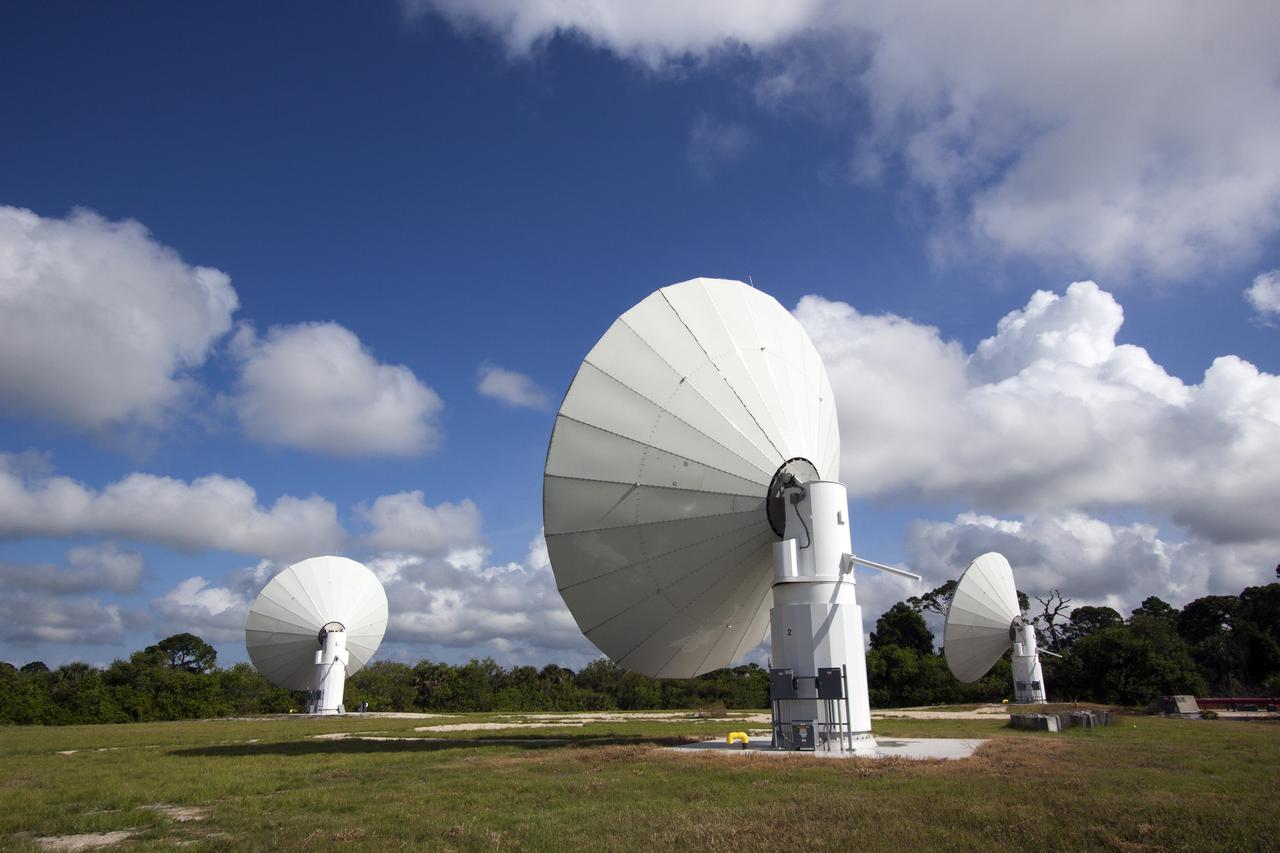
CAPE CANAVERAL, Fla. -- At NASA’s Kennedy Space Center in Florida, the three Ka-Band Objects Observation and Monitoring, or Ka-BOOM, testbed antennas are used to track the pattern of the sun during initial testing of the new system. The goal of Ka-BOOM is to prove technologies that will allow future systems to characterize near-Earth objects in terms of size, shape, rotation_tumble rate and to determine the trajectory of those objects. Radar studies can determine the trajectory 100,000 times more precisely than can optical methods. While also capable of space communication and radio science experiments, developing radar applications is the primary focus of the arrays. The 40-foot-diameter dish antenna arrays are at the site of the former Vertical Processing Facility, which has been demolished. Photo credit: NASA_Jim Grossmann
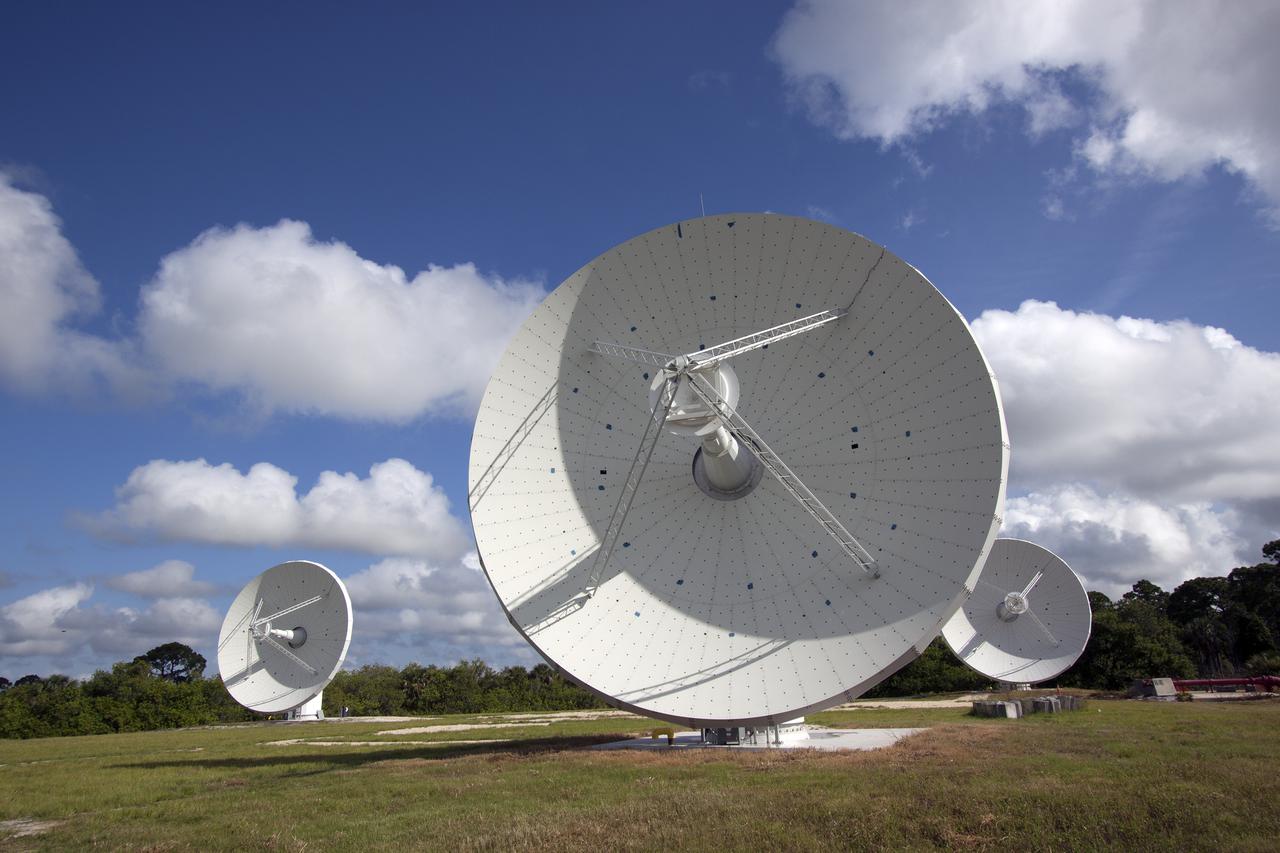
CAPE CANAVERAL, Fla. -- At NASA’s Kennedy Space Center in Florida, the three Ka-Band Objects Observation and Monitoring, or Ka-BOOM, testbed antennas are used to track the pattern of the sun during initial testing of the new system. The goal of Ka-BOOM is to prove technologies that will allow future systems to characterize near-Earth objects in terms of size, shape, rotation_tumble rate and to determine the trajectory of those objects. Radar studies can determine the trajectory 100,000 times more precisely than can optical methods. While also capable of space communication and radio science experiments, developing radar applications is the primary focus of the arrays. The 40-foot-diameter dish antenna arrays are at the site of the former Vertical Processing Facility, which has been demolished. Photo credit: NASA_Jim Grossmann
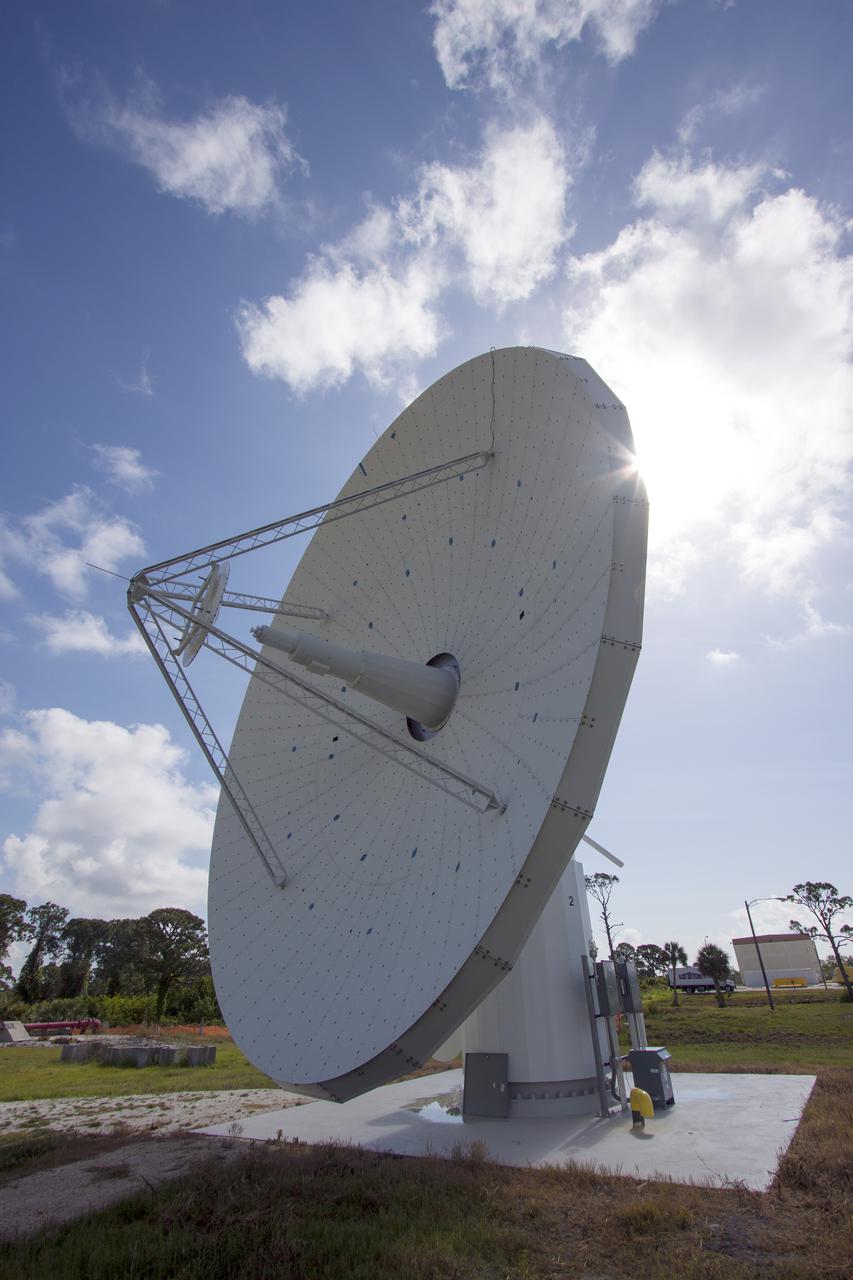
CAPE CANAVERAL, Fla. -- At NASA’s Kennedy Space Center in Florida, one of the three Ka-Band Objects Observation and Monitoring, or Ka-BOOM, testbed antennas is used to track the pattern of the sun during initial testing of the new system. The goal of Ka-BOOM is to prove technologies that will allow future systems to characterize near-Earth objects in terms of size, shape, rotation_tumble rate and to determine the trajectory of those objects. Radar studies can determine the trajectory 100,000 times more precisely than can optical methods. While also capable of space communication and radio science experiments, developing radar applications is the primary focus of the arrays. The 40-foot-diameter dish antenna arrays are at the site of the former Vertical Processing Facility, which has been demolished. Photo credit: NASA_Jim Grossmann
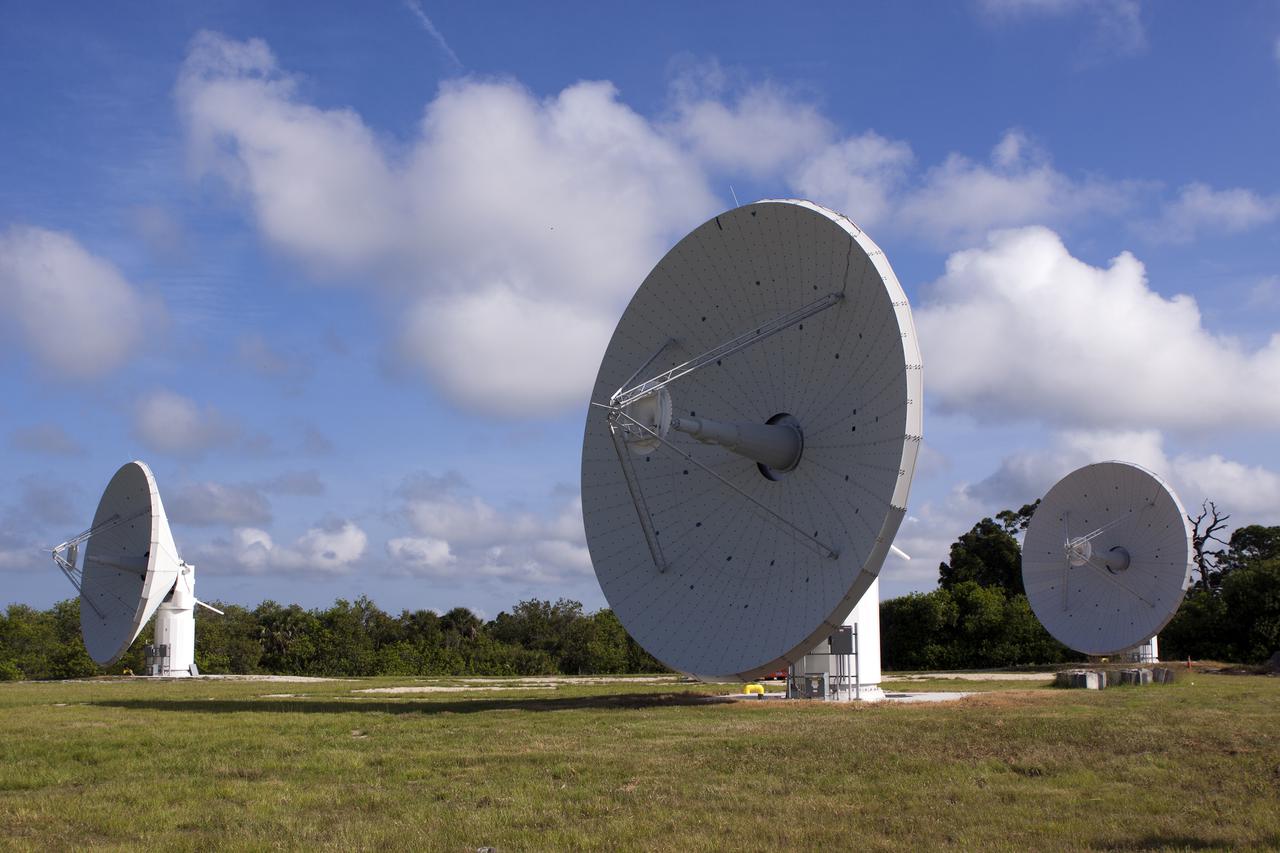
CAPE CANAVERAL, Fla. -- At NASA’s Kennedy Space Center in Florida, one of the three Ka-Band Objects Observation and Monitoring, or Ka-BOOM, testbed antennas is used to track the sun during initial testing of the new system. The goal of Ka-BOOM is to prove technologies that will allow future systems to characterize near-Earth objects in terms of size, shape, rotation_tumble rate and to determine the trajectory of those objects. Radar studies can determine the trajectory 100,000 times more precisely than can optical methods. While also capable of space communication and radio science experiments, developing radar applications is the primary focus of the arrays. The 40-foot-diameter dish antenna arrays are at the site of the former Vertical Processing Facility, which has been demolished. Photo credit: NASA_Jim Grossmann
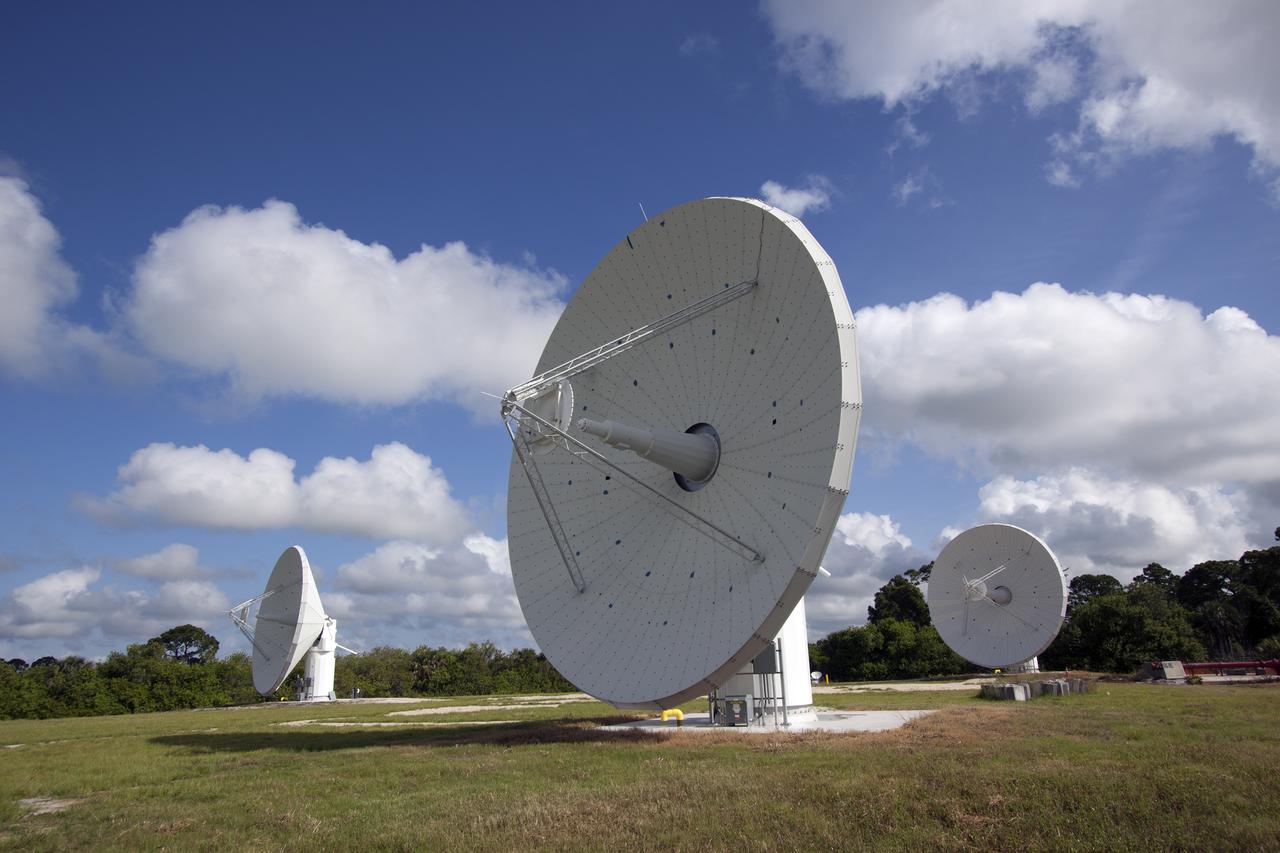
CAPE CANAVERAL, Fla. -- At NASA’s Kennedy Space Center in Florida, one of the three Ka-Band Objects Observation and Monitoring, or Ka-BOOM, testbed antennas is used to track the pattern of the sun during initial testing of the new system. The goal of Ka-BOOM is to prove technologies that will allow future systems to characterize near-Earth objects in terms of size, shape, rotation_tumble rate and to determine the trajectory of those objects. Radar studies can determine the trajectory 100,000 times more precisely than can optical methods. While also capable of space communication and radio science experiments, developing radar applications is the primary focus of the arrays. The 40-foot-diameter dish antenna arrays are at the site of the former Vertical Processing Facility, which has been demolished. Photo credit: NASA_Jim Grossmann
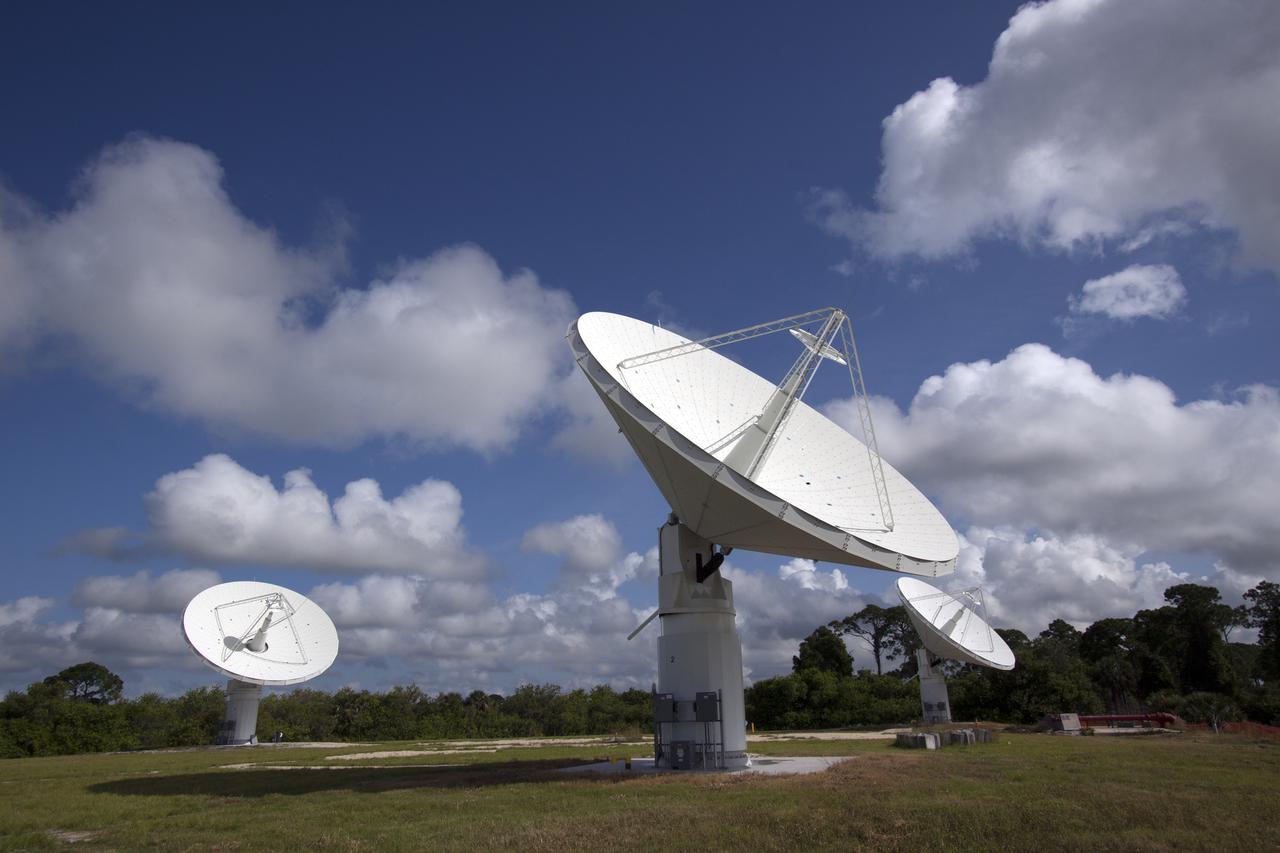
CAPE CANAVERAL, Fla. -- At NASA’s Kennedy Space Center in Florida, the three Ka-Band Objects Observation and Monitoring, or Ka-BOOM, testbed antennas are used to track the pattern of the sun during initial testing of the new system. The goal of Ka-BOOM is to prove technologies that will allow future systems to characterize near-Earth objects in terms of size, shape, rotation_tumble rate and to determine the trajectory of those objects. Radar studies can determine the trajectory 100,000 times more precisely than can optical methods. While also capable of space communication and radio science experiments, developing radar applications is the primary focus of the arrays. The 40-foot-diameter dish antenna arrays are at the site of the former Vertical Processing Facility, which has been demolished. Photo credit: NASA_Jim Grossmann
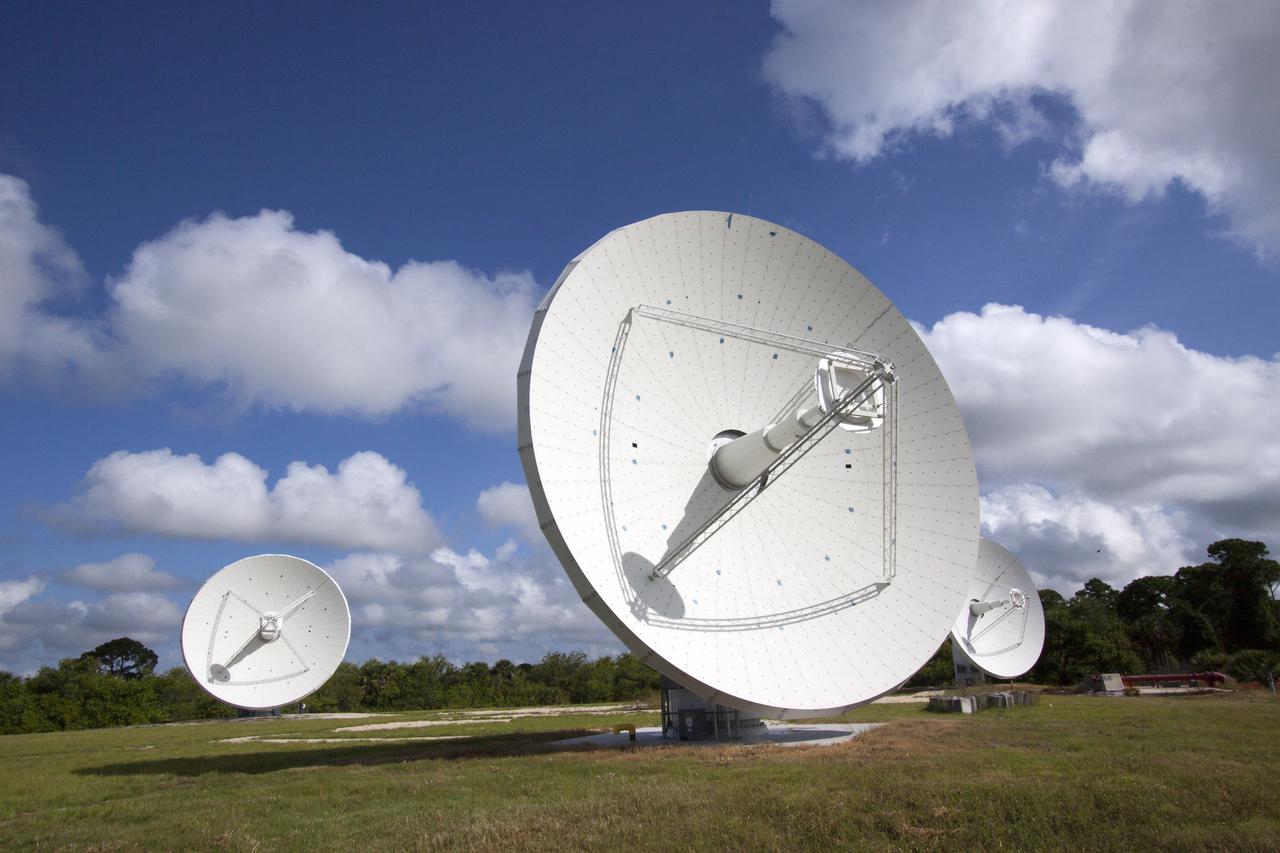
CAPE CANAVERAL, Fla. -- At NASA’s Kennedy Space Center in Florida, the three Ka-Band Objects Observation and Monitoring, or Ka-BOOM, testbed antennas are used to track the pattern of the sun during initial testing of the new system. The goal of Ka-BOOM is to prove technologies that will allow future systems to characterize near-Earth objects in terms of size, shape, rotation_tumble rate and to determine the trajectory of those objects. Radar studies can determine the trajectory 100,000 times more precisely than can optical methods. While also capable of space communication and radio science experiments, developing radar applications is the primary focus of the arrays. The 40-foot-diameter dish antenna arrays are at the site of the former Vertical Processing Facility, which has been demolished. Photo credit: NASA_Jim Grossmann

Deep Space Station 13 (DSS-13) at NASA's Goldstone Deep Space Communications Complex near Barstow, California – part of the agency's Deep Space Network – is a 34-meter (112-foot) experimental antenna that has been retrofitted with an optical terminal (the boxy instrument below the center of the antenna's dish). Since November 2023, DSS-13 has been tracking the downlink laser of the Deep Space Optical Communications (DSOC) experiment that is aboard NASA's Psyche mission, which launched on Oct. 13, 2023. In a first, the antenna also synchronously received radio-frequency signals from the spacecraft as it travels through deep space on its way to investigate the metal-rich asteroid Psyche. The laser signal collected by the camera is then transmitted through optical fiber that feeds into a cryogenically cooled semiconducting nanowire single photon detector. Designed and built by JPL's Microdevices Laboratory, the detector is identical to the one used at Caltech's Palomar Observatory, in San Diego County, California, that acts as DSOC's downlink ground station. Goldstone is one of three complexes that comprise NASA's Deep Space Network, which provides radio communications for all of the agency's interplanetary spacecraft and is also utilized for radio astronomy and radar observations of the solar system and the universe. NASA's Jet Propulsion Laboratory, a division of Caltech in Pasadena, California, manages the DSN for the agency. https://photojournal.jpl.nasa.gov/catalog/PIA26148
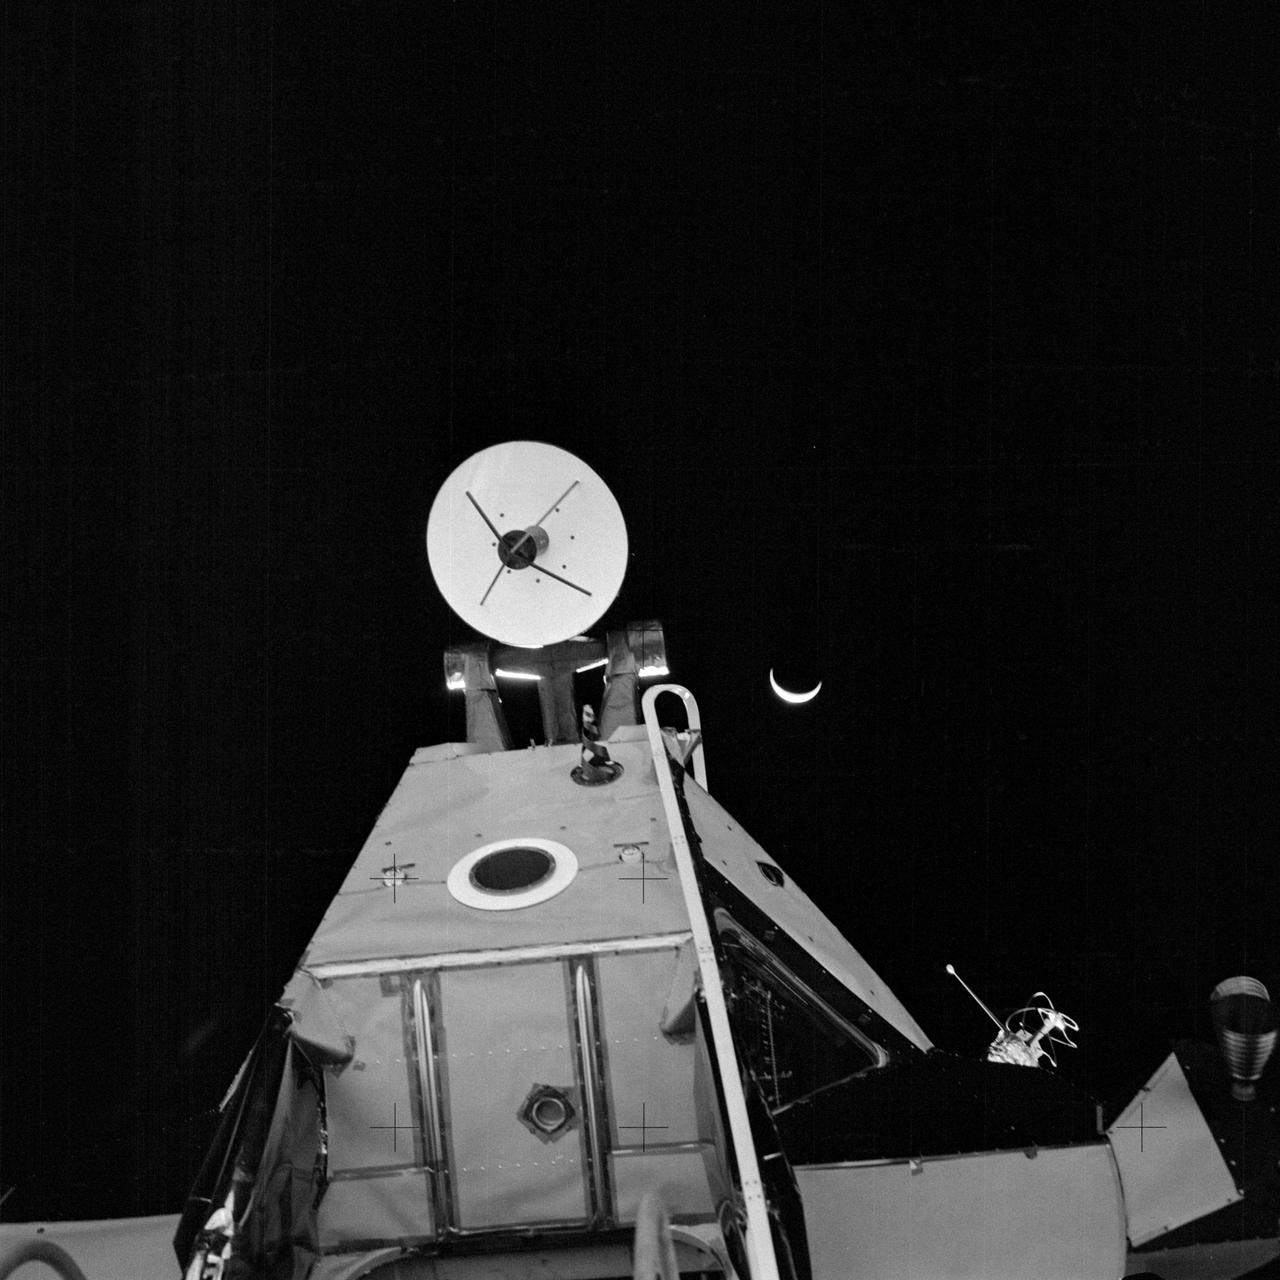
AS14-64-9193 (5 Feb. 1971) --- A close-up view of the forward section of the Apollo 14 Lunar Module (LM) ascent stage, looking upward from the LM ladder. This photograph was taken by one of the Apollo 14 astronauts at the close of their first extravehicular activity (EVA). The LM's ingress/egress hatch is just out of view at the bottom, near center. At the top center is the rendezvous radar antenna. An RCS thruster is visible at the far right. One of the two VHF antennas is on the right. The LM's optical alignment telescope is located at the black circle which has a wide, white ring around it. The crescent Earth can be seen in the far distant background.
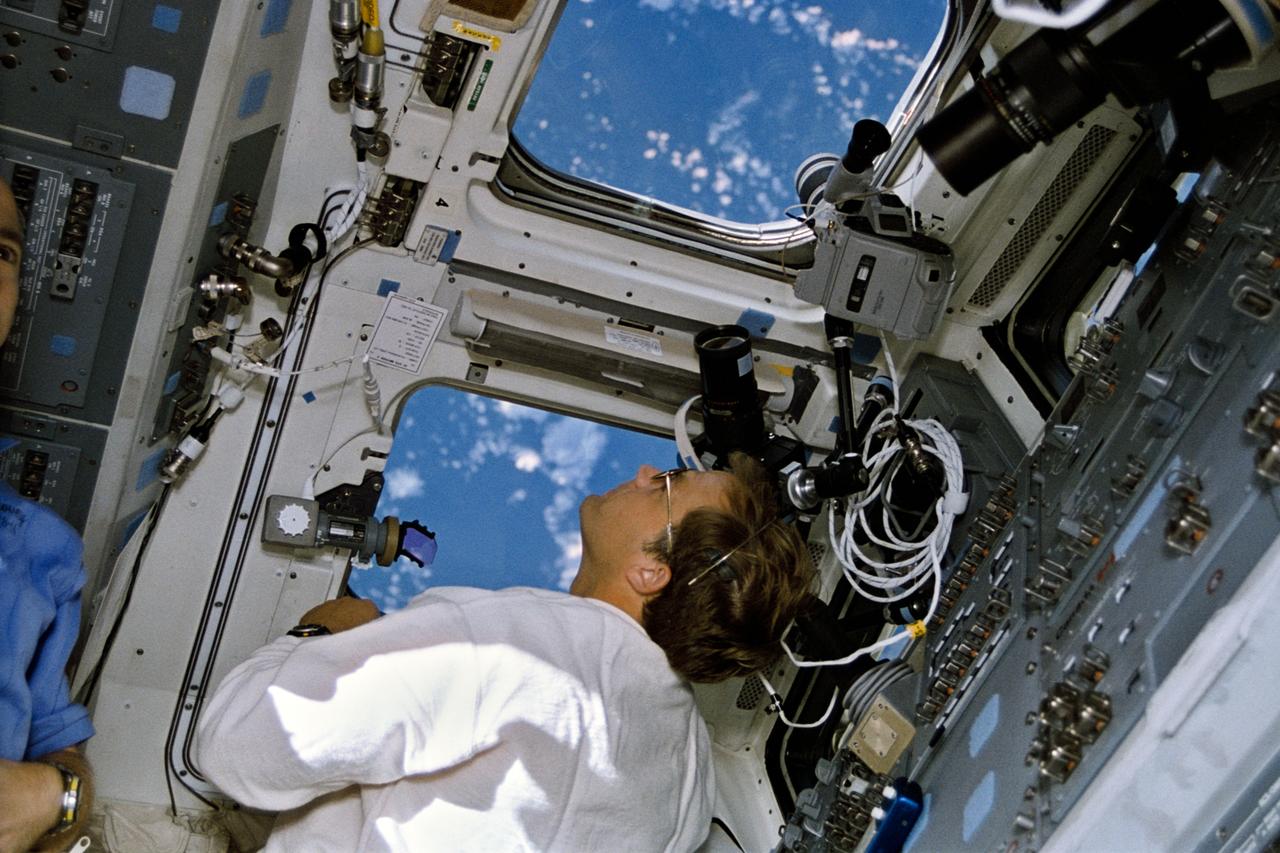
STS064-08-016 (9-20 Sept. 1994) --- Astronaut Mark C. Lee monitors the Lidar In-Space Technology Experiment (LITE) at work in the space shuttle Discovery's cargo bay. The mission specialist is surrounded by cameras which were used by the six NASA astronauts onboard for the almost 11-day mission. Near Lee's head is a 100mm lens which he used to collect data on a myriad of cloud formations which he observed on Earth, 130 nautical miles away. Photo credit: NASA or National Aeronautics and Space Administration EDITOR'S NOTE: In uncropped versions of this picture, astronaut Carl J. Meade is partially in frame at left.
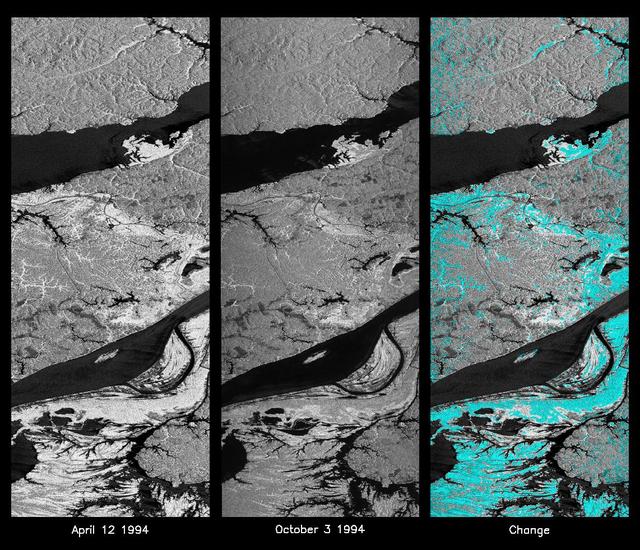
These L-band images of the Manaus region of Brazil were acquired by the Spaceborne Imaging Radar-C and X-band Synthetic Aperture Radar (SIR-C/X-SAR) aboard the space shuttle Endeavour. The left image was acquired on April 12, 1994, and the middle image was acquired on October 3, 1994. The area shown is approximately 8 kilometers by 40 kilometers (5 miles by 25 miles). The two large rivers in this image, the Rio Negro (top) and the Rio Solimoes (bottom), combine at Manaus (west of the image) to form the Amazon River. The image is centered at about 3 degrees south latitude and 61 degrees west longitude. North is toward the top left of the images. The differences in brightness between the images reflect changes in the scattering of the radar channel. In this case, the changes are indicative of flooding. A flooded forest has a higher backscatter at L-band (horizontally transmitted and received) than an unflooded river. The extent of the flooding is much greater in the April image than in the October image, and corresponds to the annual, 10-meter (33-foot) rise and fall of the Amazon River. A third image at right shows the change in the April and October images and was created by determining which areas had significant decreases in the intensity of radar returns. These areas, which appear blue on the third image at right, show the dramatic decrease in the extent of flooded forest, as the level of the Amazon River falls. The flooded forest is a vital habitat for fish and floating meadows are an important source of atmospheric methane. This demonstrates the capability of SIR-C/X-SAR to study important environmental changes that are impossible to see with optical sensors over regions such as the Amazon, where frequent cloud cover and dense forest canopies obscure monitoring of floods. Field studies by boat, on foot and in low-flying aircraft by the University of California at Santa Barbara, in collaboration with Brazil's Instituto Nacional de Pesguisas Estaciais, during the first and second flights of the SIR-C/X-SAR system have validated the interpretation of the radar images. http://photojournal.jpl.nasa.gov/catalog/PIA01740
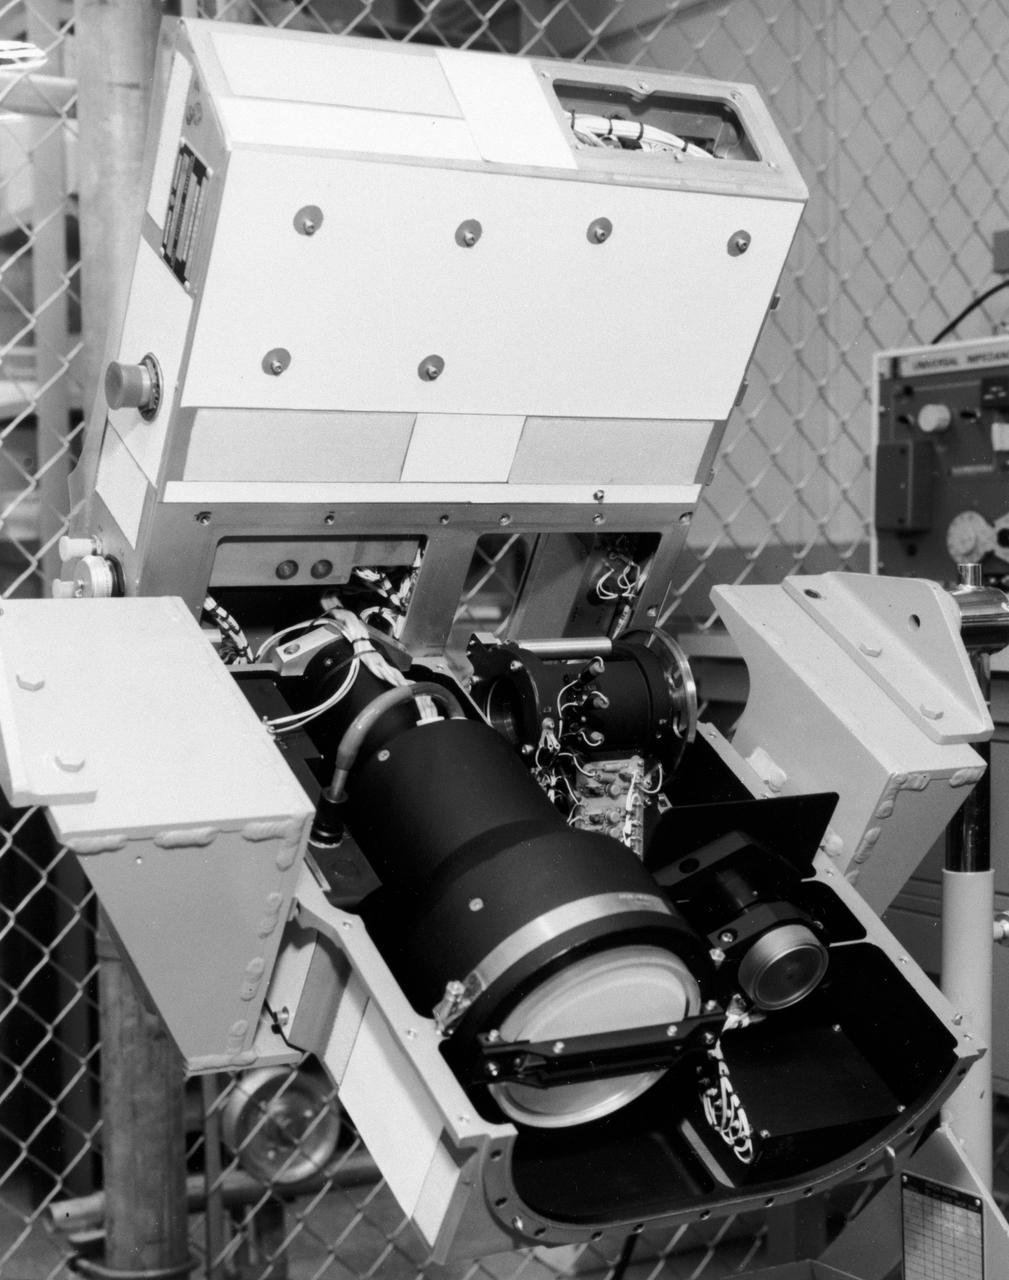
S72-49482 (November 1972) --- The Optical Recorder of the Lunar Sounder Experiment (S-209) which will be mounted in the SIM bay of the Apollo 17 Service Module. The three functional parts of the Lunar Sounder are the optical recorder, the coherent synthetic aperture radar, and the antennas, a retractable dipole for HF and a yagi for VHF. The Lunar Sounder will probe three-quarters of a mile below the moon's surface from the orbiting Apollo 17 spacecraft. Electronic data recorded on film will be retrieved by the crew during trans-Earth EVA. Geologic information on the lunar interior obtained by the sounder will permit scientific investigation of underground rock layers, lava flow patterns, rille (canyon) structures, mascon properties, and any areas containing water. A prototype lunar sounder has been flight tested in aircraft over selected Earth sites to confirm the equipment design and develop scientific analysis techniques. The Lunar Sounder Experiment was developed by North American Rockwell's (NR) Space Division for NASA's Manned Spacecraft Center to provide data for a scientific investigation team with representatives from the Jet Propulsion Laboratory, University of Utah, University of Michigan, U.S. Geological Survey, and NASA Ames Research Center.
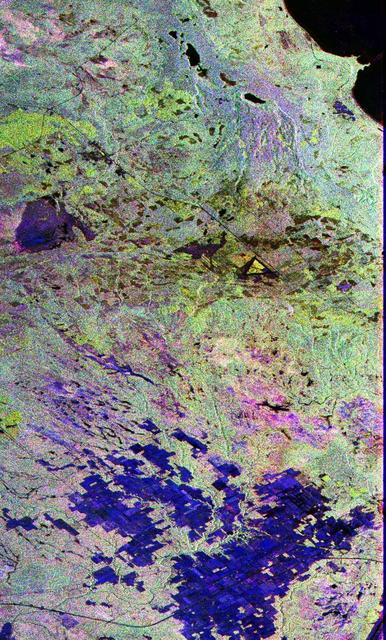
This image is a false-color composite of Raco, Michigan, centered at 46.39 degrees north latitude, 84.88 degrees west longitude. This image was acquired by the Spaceborne Imaging Radar-C and X-Band Synthetic Aperture Radar (SIR-C/X-SAR) aboard the space shuttle Endeavour on its sixth orbit and during the first full-capability test of the instrument on April 9, 1994. This image was produced using both L-band and C-band data. The area shown is approximately 20 kilometers by 50 kilometers (12 by 30 miles). Raco is located at the eastern end of Michigan's upper peninsula, west of Sault Ste. Marie and south of Whitefish Bay on Lake Superior. The site is located at the boundary between the boreal forests and the northern temperate forests, a transitional zone that is expected to be ecologically sensitive to anticipated global changes resulting from climatic warming. On any given day, there is a 60 percent chance that this area will be obscured to some extent by cloud clover which makes it difficult to image using optical sensors. http://photojournal.jpl.nasa.gov/catalog/PIA01700
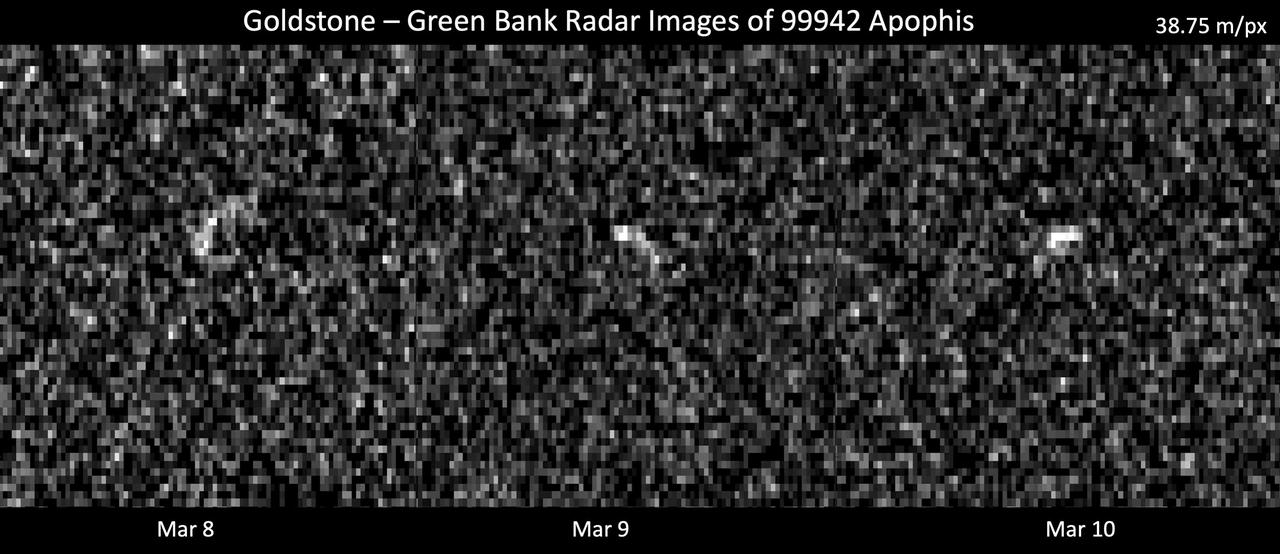
These images represent radar observations of asteroid 99942 Apophis on March 8, 9, and 10, 2021, as it made its last close approach before its 2029 Earth encounter that will see the object pass our planet by less than 20,000 miles (32,000 kilometers). The 70-meter radio antenna at the Deep Space Network's Goldstone Deep Space Communications Complex near Barstow, California, and the 100-meter Green Bank Telescope in West Virginia used radar to precisely track Apophis' motion. At the time of these observations, Apophis was about 10.6 million miles (17 million kilometers) from Earth, and each pixel has a resolution of 127 feet (38.75 meters). These observations helped scientists of the Center for Near Earth Object Studies (CNEOS), managed by NASA's Jet Propulsion Laboratory, precisely determine the 1,100-feet-wide (340-meter-wide) asteroid's orbit around the Sun, ruling out any Earth impact threat for the next hundred years or more. As a result of these observations, Apophis was removed from the Sentry Impact Risk Table. The radar team will continue to analyze these observations to determine more information about Apophis' size, shape, and rate of spin. Relying on optical telescopes and ground-based radar to help characterize every near-Earth object's orbit to improve long-term hazard assessments, CNEOS computes high-precision orbits in support of NASA's Planetary Defense Coordination Office. https://photojournal.jpl.nasa.gov/catalog/PIA24168
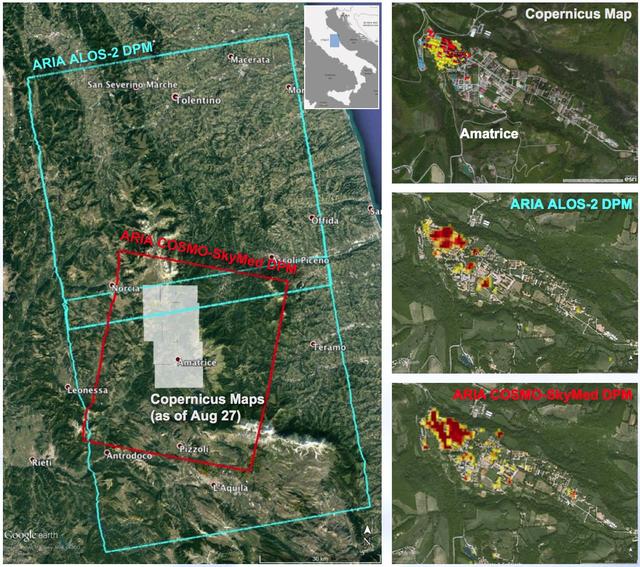
A NASA-funded program provided valuable information for responders and groups supporting the recovery efforts for the Aug. 24, 2016, magnitude 6.2 earthquake that struck central Italy. The earthquake caused significant loss of life and property damage in the town of Amatrice. To assist in the disaster response efforts, scientists at NASA's Jet Propulsion Laboratory and Caltech, both in Pasadena, California, obtained and used radar imagery of the earthquake's hardest-hit region to discriminate areas of damage from that event. The views indicate the extent of damage caused by the earthquake and subsequent aftershocks in and around Amatrice, based on changes to the ground surface detected by radar. The color variations from yellow to red indicate increasingly more significant ground surface change. The damage maps were created from data obtained before and after the earthquake by satellites belonging to the Italian Space Agency (ASI) and the Japan Aerospace Exploration Agency (JAXA). The radar-derived damage maps compare well with a damage map produced by the European Commission Copernicus Emergency Management Service based upon visual inspection of high-resolution pre-earthquake aerial photographs and post-earthquake satellite optical imagery, and provide broader geographic coverage of the earthquake's impact in the region. The X-band COSMO-SkyMed (CSK) data were provided through a research collaboration with ASI and were acquired on July 3, August 20, and August 28, 2016. The L-band ALOS/PALSAR-2 data were provided by JAXA through its science research program and were acquired on September 9, 2015, January 27, 2016, and August 24, 2016. The radar data were processed by the Advanced Rapid Imaging and Analysis (ARIA) team at JPL and Caltech. ARIA is a NASA-funded project that is building an automated system for demonstrating the ability to rapidly and reliably provide GPS and satellite data to support the local, national and international hazard monitoring and response communities. Using space-based imagery of disasters, ARIA data products can provide rapid assessments of the geographic region impacted by a disaster, as well as detailed imaging of the locations where damage occurred. Radar can "see" through clouds day and night and measure centimeter-level ground movements. NASA is partnering with the Indian Space Research Organization (ISRO) to develop the NASA ISRO Synthetic Aperture Radar (NISAR) mission that will routinely provide systematic SAR observations of Earth's land and ice-covered surfaces at least twice every 12 days, enabling greater scientific understanding of the dynamic processes that drive the Earth system and natural hazards, as well as providing actionable support for disaster response and recovery. http://photojournal.jpl.nasa.gov/catalog/PIA21091
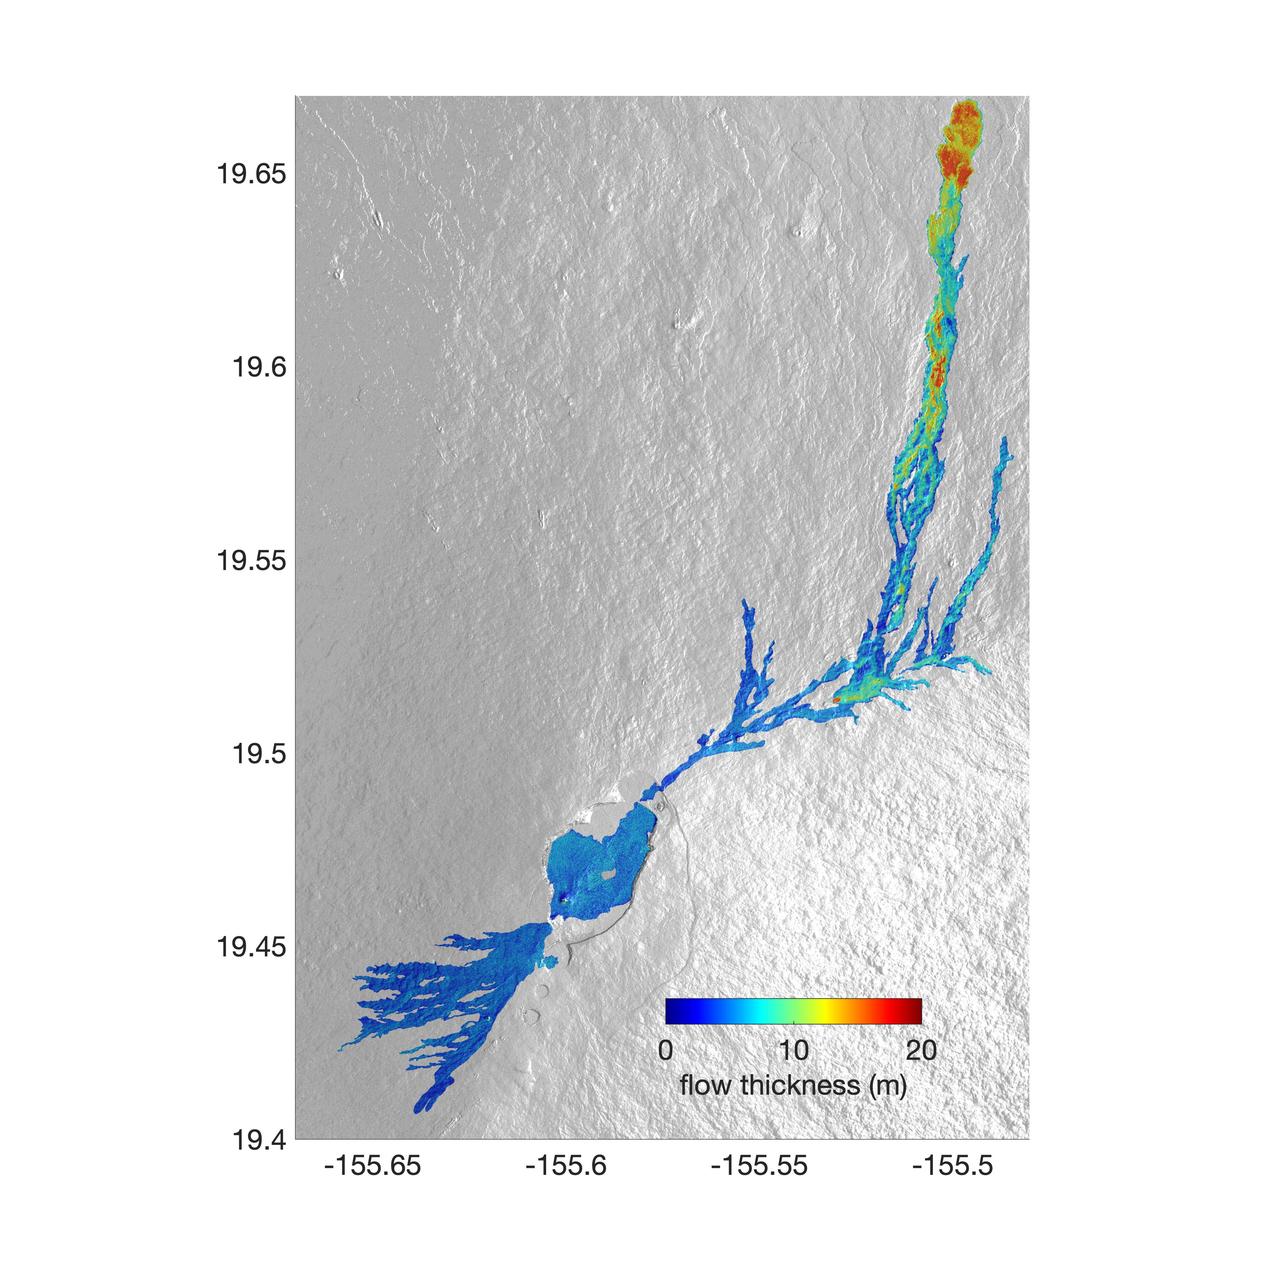
The world's largest active volcano – Hawaii's Mauna Loa – had been quiet for 38 years. But in 2022, the volcano began to stir, showing increased numbers of small earthquakes and subtle swelling of certain land surfaces in September. On November 27, fountains of lava began spurting from the mountain's Northeast Rift Zone and streams of molten rock flowed to the north. Ten days into the eruption, a NASA aircraft conducted its first flight over the erupting volcano. It carried NASA's Uninhabited Aerial Vehicle Synthetic Aperture Radar (UAVSAR) system, which was used to map the volcano's topography in fine detail with a Ka-band instrument called GLISTIN-A. Teams from NASA's Jet Propulsion Laboratory and the United States Geological Survey (USGS) used data from that sensor to map the thickness of those flows during a series of flights on December 7, 8, and 10. The map above shows the thickness of the lava flows during the flight on December 7, the day before USGS scientists noticed a significant decline in the pace of the eruption. A few days later, they declared the eruption had stopped. The map shows the thickness of the lava flows in the summit caldera, where the eruption began, and of lava flows on Mauna Loa's northeastern flank. The color variation from blue to orange indicates increasing lava flow thickness. A maximum thickness of roughly 25 meters (82 feet) is shown, though values exceeding 40 meters (131 feet) were observed in some areas. The thickening at the northern end of the flow is due to lava accumulating away from the vent, along with a flattening of the terrain at the saddle between the Mauna Loa and Mauna Kea volcanoes. By comparing to pre-eruption maps of this area's topography, including GLISTIN-A data collected in 2017, the USGS researchers were able to calculate the size and volume of the lava flow. Over the roughly 14-day eruption, Mauna Loa erupted more than 8.8 billion cubic feet (230 million cubic meters) along a lava flow that extended up to 16.5 miles (19.5 kilometers) from the vent, according to the USGS. The UAVSAR operates from a pod mounted beneath a crewed Gulfstream III jet from NASA's Armstrong Flight Research Center in California. Repeated topographic maps generated with each flight reveal the progression and thickening of lava with time – important information for scientific understanding of volcano processes and for emergency response. For the Mauna Loa science flights, the instrument suite featured an additional state-of-the-art imaging tool: the synthetic aperture radar-fusion optical short-wave infrared (SAR-Fusion Optical/SWIR) camera system. SAR-Fusion collects data over the same ground swath as GLISTIN-A to map land surface changes using optical/SWIR photogrammetry methods. GLISTIN-A was designed to provide all-weather, high-resolution surface topography not available through existing lidar or radar sensors. GLISTIN-A was originally demonstrated as a new radar technique for mapping ice surfaces. Science demonstration flights began in 2013 over alpine glaciers and sea ice in Alaska, and a floodplain in California. Its applications have since expanded to other areas, such as snow accumulation and volcano dynamics. The first time the instrument was deployed for volcano response was in 2018 during the three-month eruption of Kilauea. The success of that operation paved the way for deployment to Mauna Loa. https://photojournal.jpl.nasa.gov/catalog/PIA25526
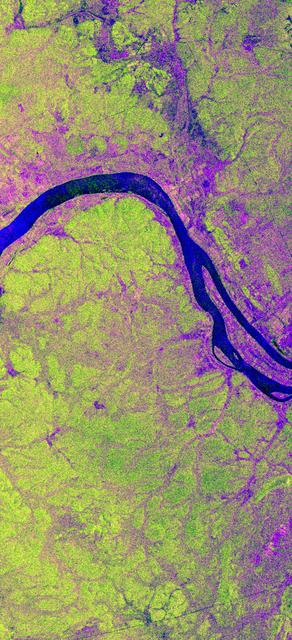
This is an X-band image showing seasonal changes at the hydrological test site of Bebedouro in Brazil. The image is centered at 9 degrees south latitude and 40.2 degrees west longitude. This image was acquired by the Spaceborne Imaging Radar-C and X-band Synthetic Aperture Radar (SIR-C/X-SAR) aboard the space shuttle Endeavour on April 10, 1994, during the first flight of the radar system, and on October 1, 1994, during the second mission. The swath width is approximately 16.5 kilometers (10.5 miles) wide. The image channels have the following color assignments: red represents data acquired on April 10; green represents data acquired on October 1; blue corresponds to the ratio of the two data sets. Agriculture plays an important economic and social role in Brazil. One of the major problems related to Brazilian agriculture is estimating the size of planting areas and their productivity. Due to cloud cover and the rainy season, which occurs from November through April, optical and infrared Earth observations are seldom used to survey the region. An additional goal of monitoring this region is to watch the floodplains of rivers like Rio Sao Francisco in order to determine suitable locations for additional agricultural fields. This area belongs to the semi-arid northeastern region of Brazil, where estimates have suggested that about 10 times more land could be used for agriculture, including some locations which could be used for irrigation projects. Monitoring of soil moisture during the important summer crop season is of high priority for the future development and productivity of this region. In April the area was covered with vegetation because of the moisture of the soil and only small differences could be seen in X-band data. In October the run-off channels of this hilly region stand out quite clearly because the greenish areas indicated much less soil moisture and water content in plants. http://photojournal.jpl.nasa.gov/catalog/PIA01733
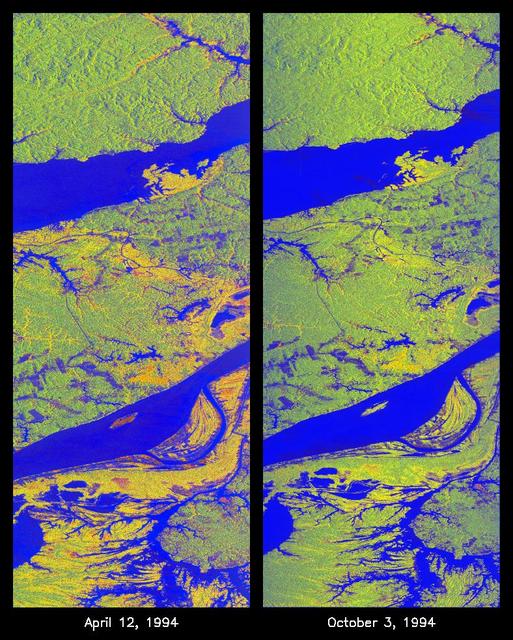
These two false-color images of the Manaus region of Brazil in South America were acquired by the Spaceborne Imaging Radar-C and X-band Synthetic Aperture Radar on board the space shuttle Endeavour. The image at left was acquired on April 12, 1994, and the image at right was acquired on October 3, 1994. The area shown is approximately 8 kilometers by 40 kilometers (5 miles by 25 miles). The two large rivers in this image, the Rio Negro (at top) and the Rio Solimoes (at bottom), combine at Manaus (west of the image) to form the Amazon River. The image is centered at about 3 degrees south latitude and 61 degrees west longitude. North is toward the top left of the images. The false colors were created by displaying three L-band polarization channels: red areas correspond to high backscatter, horizontally transmitted and received, while green areas correspond to high backscatter, horizontally transmitted and vertically received. Blue areas show low returns at vertical transmit/receive polarization; hence the bright blue colors of the smooth river surfaces can be seen. Using this color scheme, green areas in the image are heavily forested, while blue areas are either cleared forest or open water. The yellow and red areas are flooded forest or floating meadows. The extent of the flooding is much greater in the April image than in the October image and appears to follow the 10-meter (33-foot) annual rise and fall of the Amazon River. The flooded forest is a vital habitat for fish, and floating meadows are an important source of atmospheric methane. These images demonstrate the capability of SIR-C/X-SAR to study important environmental changes that are impossible to see with optical sensors over regions such as the Amazon, where frequent cloud cover and dense forest canopies block monitoring of flooding. Field studies by boat, on foot and in low-flying aircraft by the University of California at Santa Barbara, in collaboration with Brazil's Instituto Nacional de Pesguisas Estaciais, during the first and second flights of the SIR-C/X-SAR system have validated the interpretation of the radar images. http://photojournal.jpl.nasa.gov/catalog/PIA01735
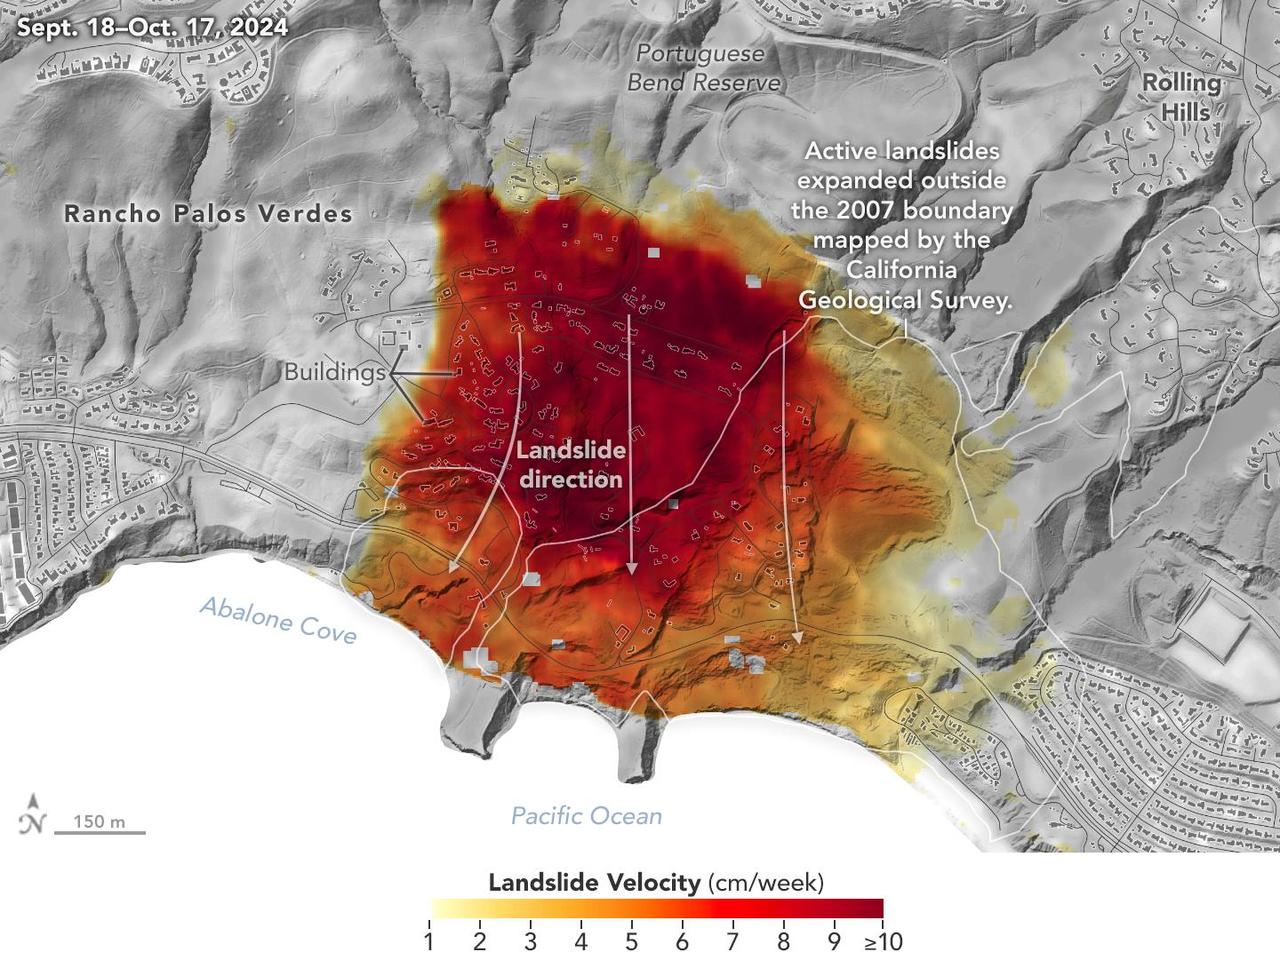
Researchers at NASA's Jet Propulsion Laboratory in Southern California used data from an airborne radar to measure the movement of the slow-moving landslides on the Palos Verdes Peninsula in Los Angeles County. The analysis determined that, during a period of four weeks in the fall of 2024, land in the residential area slid toward the ocean by as much as 4 inches (10 centimeters) per week. Portions of the peninsula, which juts into the Pacific Ocean just south of the city of Los Angeles, is part of an ancient complex of landslides and has been moving for at least the past six decades, affecting hundreds of buildings in local communities. The motion accelerated and the active area expanded following record-breaking rainfall in Southern California in 2023 and another heavy-precipitation winter in 2024. To create this visualization, the Advanced Rapid Imaging and Analysis (ARIA) team used data from four flights of NASA's Uninhabited Aerial Vehicle Synthetic Aperture Radar (UAVSAR) that took place between Sept. 18 and Oct. 17. The UAVSAR instrument was mounted to a Gulfstream III jet flown out of NASA's Armstrong Flight Research Center in Edwards, California, and the four flights were planned to estimate the speed and direction of the landslides in three dimensions. In the image, colors indicate how fast parts of the landslide complex were moving in late September and October, with the darkest reds indicating the highest speeds. The arrows represent the direction of horizontal motion. The white solid lines are the boundaries of active landslide areas as defined in 2007 by the California Geological Survey. The insights from the UAVSAR flights were part of a package of analyses by the ARIA team that also used data from ESA's (the European Space Agency's) Copernicus Sentinel-1A/B satellites. The analyses were provided to California officials to support the state's response to the landslides and made available to the public at NASA's Disaster Mapping Portal. The ARIA mission is a collaboration between JPL and Caltech, which manages JPL for NASA, to leverage radar and optical remote-sensing, GPS, and seismic observations for science as well as to aid in disaster response. The project investigates the processes and impacts of earthquakes, volcanoes, landslides, fires, subsurface fluid movement, and other natural hazards. UAVSAR has flown thousands of radar missions around the world since 2007 studying phenomena such as glaciers and ice sheets, vegetation in ecosystems, and natural hazards like earthquakes, volcanoes, and landslides. https://photojournal.jpl.nasa.gov/catalog/PIA26495
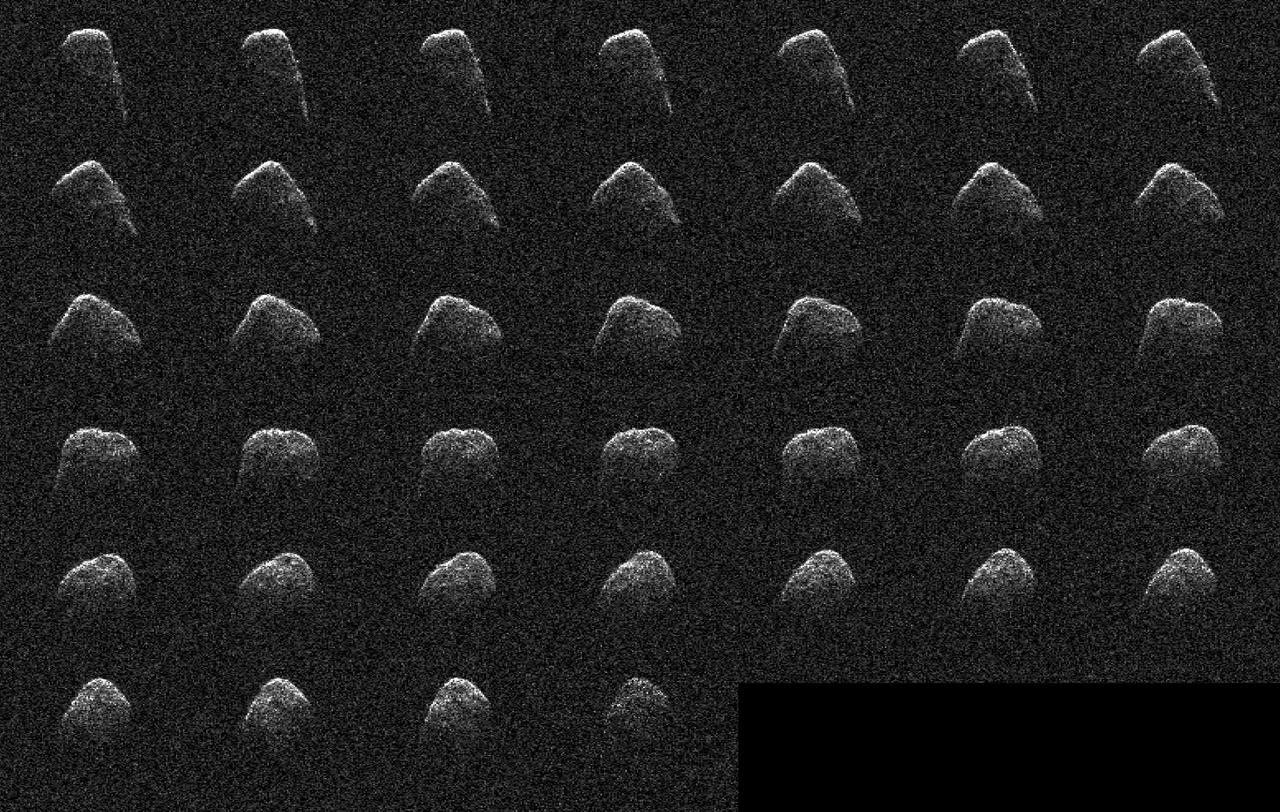
These images and animation represent NASA radar observations of 4660 Nereus on Dec. 10, 2021, before the asteroid's close approach on Dec. 11, when it came within 2.5 million miles (4 million kilometers) of Earth. Using the 70-meter radio antenna at the Deep Space Network's Goldstone Deep Space Communications Complex near Barstow, California, scientists from NASA's Jet Propulsion Laboratory acquired the most detailed radar images of the nearly 1,100-foot-wide (330-meter-wide) near-Earth asteroid since its discovery almost four decades earlier. Nereus' orbit is very well known and the asteroid does not pose a threat to Earth. During the asteroid's close approach, an image resolution of about 12.3 feet (3.75 meters) per pixel was possible, revealing surface features such as potential boulders and craters, plus ridges and other topography. Asteroid Nereus' previous approach in 2002 was near enough to Earth to reveal the asteroid's size and overall shape, but too distant to show surface features. The new observations will also help scientists better understand the asteroid's shape and rotation while providing them new data to further refine its orbital path around the Sun. Nereus belongs to the relatively rare E-type asteroid family that exhibits very unusual radar scattering properties. It's thought that this may be caused by asteroids of this type having particularly rough terrain. Also, E-type asteroids are optically bright, sometimes reflecting as much as 50% of the sunlight that hits their surface. Typical S-type asteroids reflect about 15%, whereas dark C-type asteroids reflect only a few percent. It's thought that E-class asteroids may be the source of very rare Aubrite meteorites and are composed of comparatively bright material. The 2021 close approach was the best opportunity for radar imaging of Nereus until 2060, when the asteroid will approach within 750,000 miles (1.2 million kilometers) of Earth, only three times the Earth-Moon distance. At that time, Nereus will be an easy target for small telescopes and possibly even powerful binoculars. Nereus – named after a sea god from Greek mythology – was discovered in 1982 by Eleanor "Glo" Helin as part of the JPL Palomar Planet-Crossing Asteroid Survey. Movie available at https://photojournal.jpl.nasa.gov/catalog/PIA24566
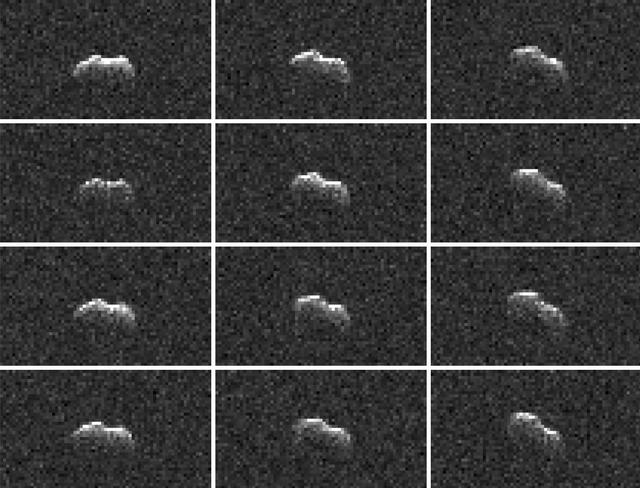
On March 21, 2021, the large asteroid 2001 FO32 made a close approach with our planet, passing at a distance of about 1.25 million miles (2 million kilometers) — or 5 1/4 times the distance from Earth to the Moon. While there was no risk of the near-Earth asteroid colliding with Earth as its orbit is very well known, scientists at NASA's Jet Propulsion Laboratory in Southern California took the opportunity to capture these radar images of the asteroid as it tumbled past. Using NASA's 34-meter (111.5-feet) Deep Space Station 13 (DSS-13) radio antenna at the Deep Space Network's Goldstone Deep Space Communication Complex near Barstow, California, radio signals were transmitted to 2001 FO32. The signals then bounced off the surface of the asteroid and were received by the 100-meter (328-feet) Green Bank Telescope in West Virginia. Such radar observations can offer additional insight into the asteroid's orbit, provide a better estimate of its dimensions and rotation rate, and help glimpse surface features (like large boulders or craters). Other radar observations were carried out by scientists using the 34-meter DSS-43 antenna at the Deep Space Network's Canberra Deep Space Communication Complex in Australia. Along with the Commonwealth Scientific and Industrial Research Organisation's Australia Telescope Compact Array near Narrabri in New South Wales, both antennas worked together to track 2001 FO32. Asteroid 2001 FO32 was discovered in March 2001 by the Lincoln Near-Earth Asteroid Research (LINEAR) program in Socorro, New Mexico, and had been estimated, based on optical measurements, to be roughly 3,000 feet (1 kilometer) wide. In more recent follow-up observations by NEOWISE, 2001 FO32 appears to be faint when observed in infrared wavelengths, which suggests the object is likely less than 1 kilometer in diameter. Analysis by the NEOWISE team shows that it is between 1,300 to 2,230 feet (440 to 680 meters) wide. Further analysis of data from the radar campaign will better refine the size of the asteroid and increase the precision of its orbital calculations. For more information about 2001 FO32 and observing campaign, read: https://www.jpl.nasa.gov/news/asteroid-2001-fo32-will-safely-pass-by-earth-march-21 https://photojournal.jpl.nasa.gov/catalog/PIA24561
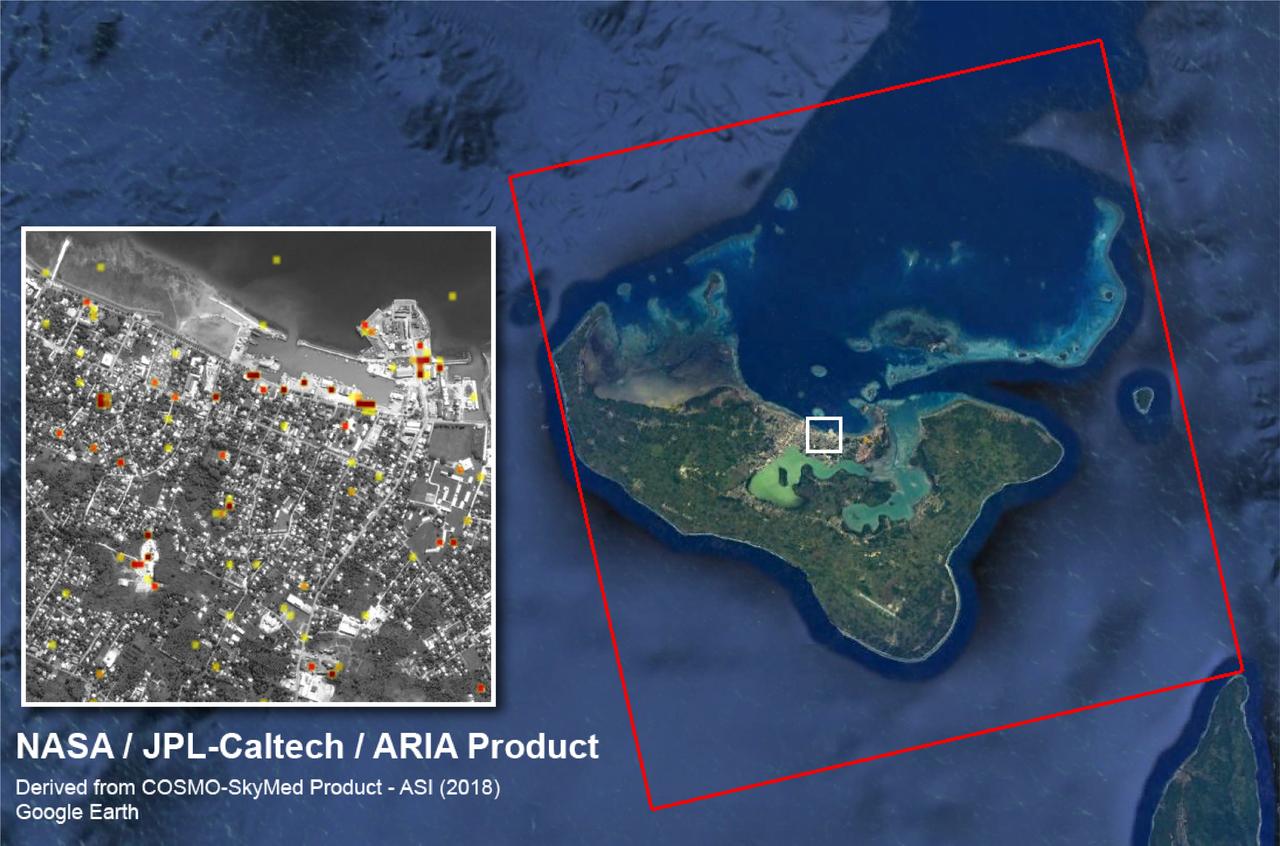
The Advanced Rapid Imaging and Analysis (ARIA) team at NASA's Jet Propulsion Laboratory created this Damage Proxy Map (DPM) of Tongatapu, the main island of Tonga, following the landfall of Cyclone Gita, a Category 4 storm that hit Tonga on Feb. 12-13, 2018. The map depicts areas that are likely damaged from the storm, shown by red and yellow pixels. The map was produced by comparing two pairs of interferometric synthetic aperture radar (InSAR) images from the COSMO-SkyMed satellites, operated by the Italian Space Agency (ASI). The pre- and post-cyclone images were acquired on Jan. 19 and Feb. 13, 2018, respectively. The later image was acquired just 4-1/2 hours after the peak damage by the cyclone. The map covers the entire island of Tongatapu (the 25-by-25-mile, or 40-by-40 kilometer SAR image footprint indicated with the large red polygon). Each pixel measures about 98 feet (30 meters) across. The color variation from yellow to red indicates increasingly more significant ground surface change. Preliminary validation of the SAR data was done by comparing them with high-resolution optical imagery acquired by DigitalGlobe. This Damage Proxy Map should be used as guidance to identify damaged areas and may be less reliable over vegetated and flooded areas. https://photojournal.jpl.nasa.gov/catalog/PIA22257
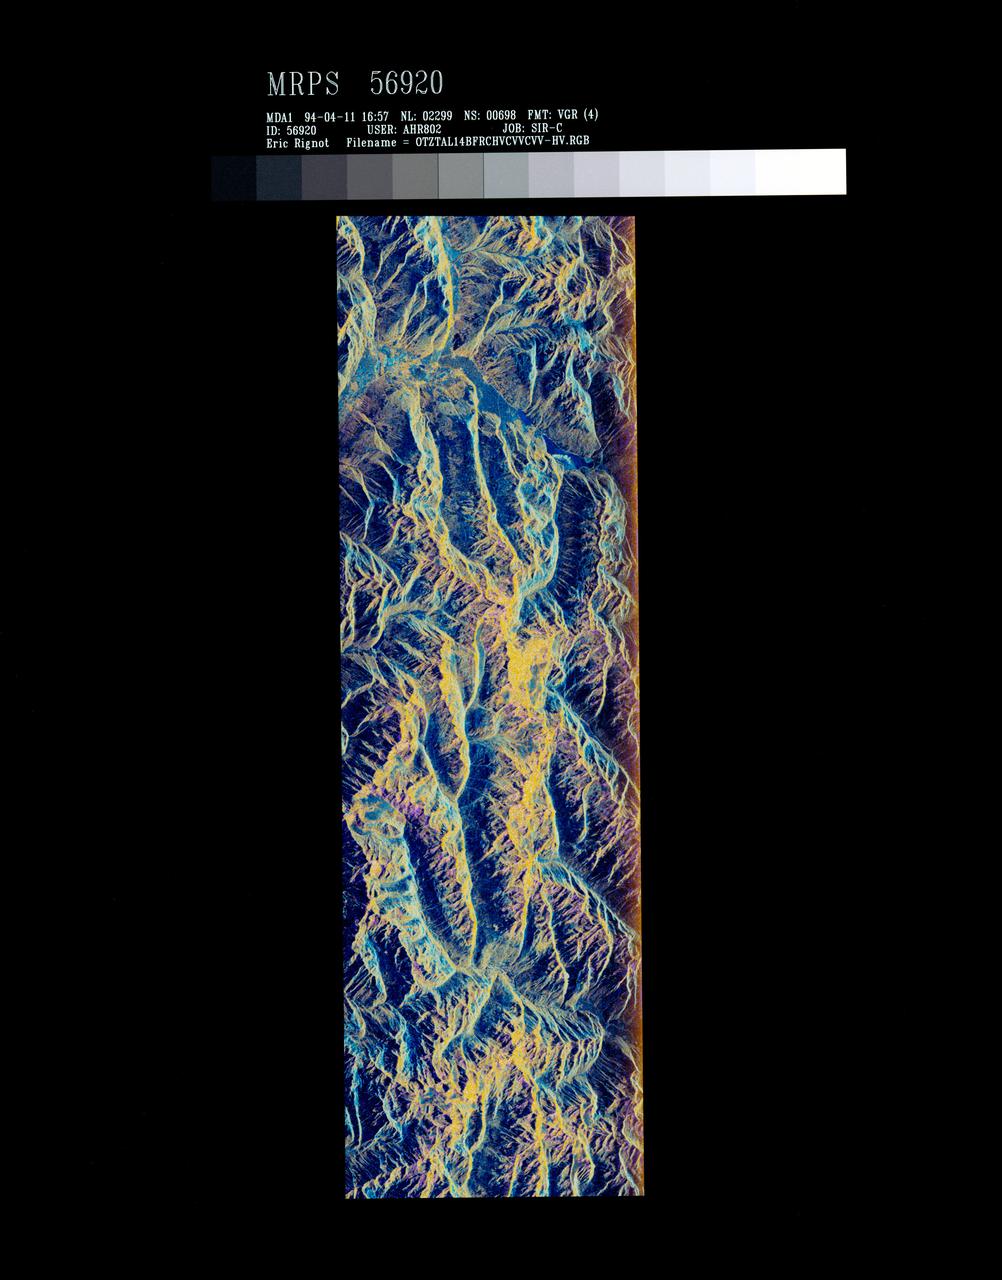
STS059-S-072 (13 April 1994) --- This image is a false-color composite of Oetztal, Austria located in the Central Alps, centered at 46.8 degrees north latitude, and 10.70 degrees east longitude, at the border between Switzerland (top), Italy (left) and Austria (right and bottom). The area shown is 50 kilometers (30 miles) south of Innsbruck, Austria. This image was acquired by the Spaceborne Imaging Radar-C and X-Band Synthetic Aperture Radar (SIR-C/X-SAR) aboard the Space Shuttle Endeavour on its 14th orbit. Oetztal is a SIR-C/X-SAR hydrology supersite. Approximately one quarter of this image is covered by glaciers, the largest of which, Gepatschferner, is visible as a triangular yellow patch in the center of the scene. The summits of the main peaks reach elevations between 3,500 and 3,768 meters (11,500 and 12,362 feet) above sea level. The tongues of the glaciers are descending from elevated plateaus down into narrow valleys which were formed during the last ice age. This color image was produced in C-Band using multi-polarization information (Red=CHV, Green=CVV, Blue=CVV/CHV). The blue areas are lakes (Gepatsch Dam at center right; Lake Muta at top right) and glacier ice. The yellow areas are slopes facing the radar and areas of dry snow. Purple corresponds to slopes facing away from the radar. Yellow in the valley bottom corresponds to tree covered areas. There is 30 to 50 centimeters (12 to 20 inches) of dry, fresh snow on the glaciers, and about 10 centimeters (4 inches) in the valley at the city of Vent, Austria (center). At these data were taken, the weather was cold, with snow and thick fog. The entire area would appear white to an optical sensor because it is all covered under a winter snowpack. Researchers are interested in Oetztal because knowing how glaciers shrink and grow over time is an important indication of climatic change. SIR-C/X-SAR is part of NASA's Mission to Planet Earth (MTPE). SIR-C/X-SAR radars illuminate Earth with microwaves allowing detailed observations at any time, regardless of weather or sunlight conditions. SIR-C/X-SAR uses three microwave wavelengths: L-Band (24 cm), C-Band (6 cm), and X-Band (3 cm). The multi-frequency data will be used by the international scientific community to better understand the global environment and how it is changing. The SIR-C/X-SAR data, complemented by aircraft and ground studies, will give scientists clearer insights into those environmental changes which are caused by nature and those changes which are induced by human activity. SIR-C was developed by NASA's Jet Propulsion Laboratory (JPL). X-SAR was developed by the Dornire and Alenia Spazio Companies for the German Space Agency, Deutsche Agentur fuer Raumfahrtangelegenheiten (DARA), and the Italian Space Agency, Agenzia Spaziale Italiana (ASI). JPL Photo ID: P-43890
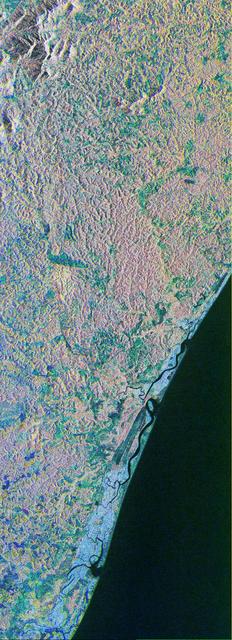
This is a color composite image of southern Bahia, Brazil, centered at 15.22 degree south latitude and 39.07 degrees west longitude. The image was acquired by the Spaceborne Imaging Radar-C/X-band Synthetic Aperture Radar aboard the space shuttle Endeavour on its 38th orbit of Earth on October 2, 1994. The image covers an area centered over the Una Biological Reserve, one the largest protected areas in northeastern Brazil. The 7,000-hectare reserve is administered by the Brazilian Institute for the Environment and is part of the larger Atlantic coastal forest, a narrow band of rain forest extending along the eastern coast of Brazil. The Atlantic coastal forest of southern Bahia is one of the world's most threatened and diverse ecosystems. Due to widespread settlement, only 2 to 5 percent of the original forest cover remains. Yet the region still contains an astounding variety of plants and animals, including a large number of endemic species. More than half of the region's tree species and 80 percent of its animal species are indigenous and found nowhere else on Earth. The Una Reserve is also the only federally protected habitat for the golden-headed lion tamarin, the yellow-breasted capuchin monkey and many other endangered species. In the past few years, scientists from Brazilian and international conservation organizations have coordinated efforts to study the biological diversity of this region and to develop practical and economically viable options for preserving the remaining primary forests in southern Bahia. The shuttle imaging radar is used in this study to identify various land uses and vegetation types, including remaining patches of primary forest, cabruca forest (cacao planted in the understory of the native forest), secondary forest, pasture and coastal mangrove. Standard remote-sensing technology that relies on light reflected from the forest canopy cannot accurately distinguish between cabruca and undisturbed forest. Optical remote sensing is also limited by the nearly continuous cloud cover in the region and heavy rainfall, which occurs more than 150 days each year. The ability of the shuttle radars to "see" through the forest canopy to the cultivated cacao below -- independent of weather or sunlight conditions --will allow researchers to distinguish forest from cabruca in unprecedented detail. This SIR-C/X-SAR image was produced by assigning red to the L-band, green to the C-band and blue to the X-band. The Una Reserve is located in the middle of the image west of the coastline and slightly northwest of Comandatuba River. The reserve's primary forests are easily detected by the pink areas in the image. The intensity of red in these areas is due to the high density of forest vegetation (biomass) detected by the radar's L-band (horizontally transmitted and vertically received) channel. Secondary forest is visible along the reserve's eastern border. The Serrado Mar mountain range is located in the top left portion of the image. Cabruca forest to the west of Una Reserve has a different texture and a yellow color. The removal of understory in cabruca forest reduces its biomass relative to primary forest, which changes the L-band and C-band penetration depth and returns, and produces a different texture and color in the image. The region along the Atlantic is mainly mangrove swamp, agricultural fields and urban areas. The high intensity of blue in this region is a result of increasing X-band return in areas covered with swamp and low vegetation. The image clearly separates the mangrove region (east of coastal Highway 001, shown in blue) from the taller and dryer forest west of the highway. The high resolution capability of SIR-C/X-SAR imaging and the sensitivity of its frequency and polarization channels to various land covers will be used for monitoring and mapping areas of importance for conservation. http://photojournal.jpl.nasa.gov/catalog/PIA01764
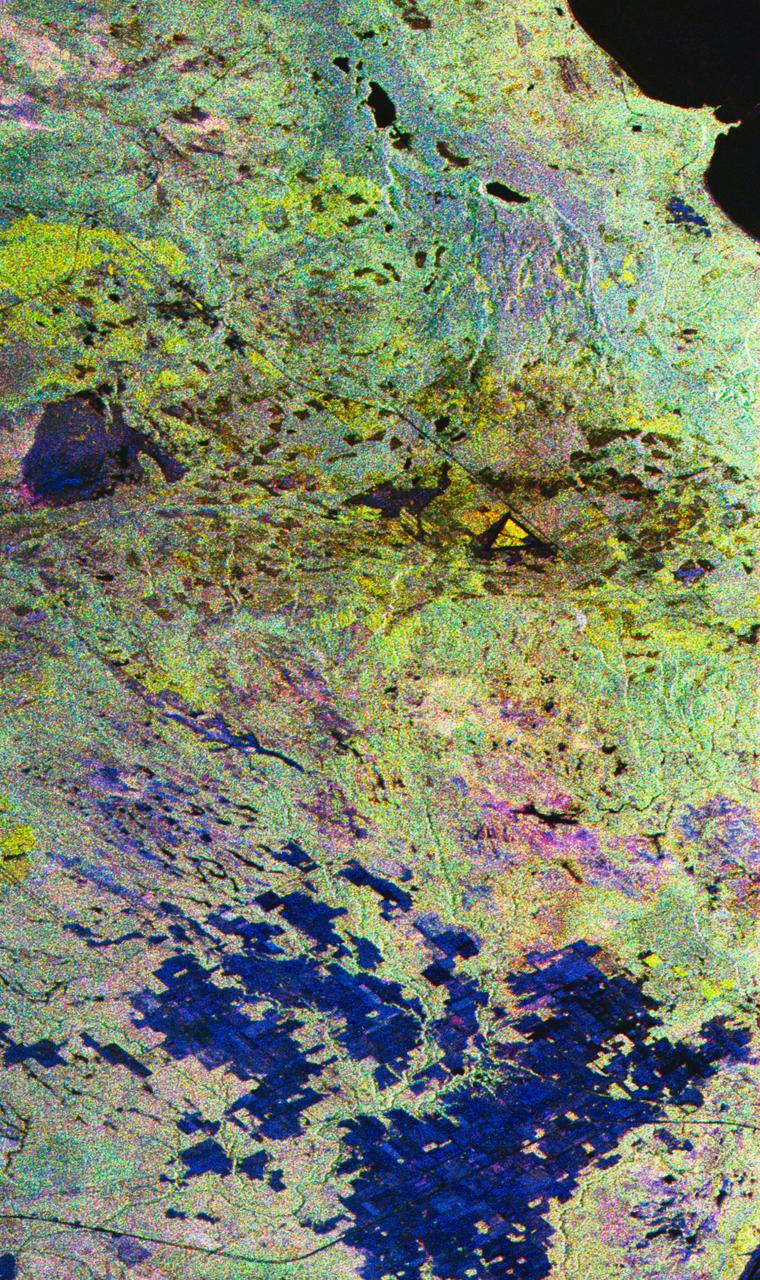
STS059-S-027 (10 April 1994) --- This image is a false-color composite of Raco, Michigan, centered at 46.39 degrees north latitude, 84.88 degrees east longitude. This image was acquired by the Spaceborne Imaging Radar-C and X-Band Synthetic Aperture Radar (SIR-C/X-SAR) aboard the Space Shuttle Endeavour on its 6th orbit and during the first full-capacity test of the instrument. This image was produced using both L-Band and C-Band data. The area shown is approximately 20 kilometers by 50 kilometers. Raco is located at the eastern end of Michigan's upper peninsula, west of Sault Ste. Marie and south of Whitefish Bay on Lake Superior. The site is located at the boundary between the boreal forests and the northern temperate forests, a transitional zone that is expected to be ecologically sensitive to anticipated global changes resulting from climatic warming. On any given day, there is a 60 percent chance that this area will be obscured to some extent by cloud cover which makes it difficult to image using optical sensors. In this color representation (Red=LHH, Green=LHV, Blue=CHH), darker areas in the image are smooth surfaces such as frozen lakes and other non-forested areas. The colors are related to the types of trees and the brightness is related to the amount of plant material covering the surface, called forest biomass. Accurate information about land-cover is important to area resource managers and for use in regional- to global-scale scientific models used to understand global change. SIR-C/X-SAR radars illuminate Earth with microwaves allowing detailed observations at any time, regardless of weather or sunlight conditions. SIR-C/X-SAR uses three microwave wavelengths: L-Band (24 cm), C-Band (6 cm), and X-Band (3 cm). The multi-frequency data will be used by the international scientific community to better understand the global environment and how it is changing. The SIR-C/X-SAR data, complemented by aircraft and ground studies, will give scientists clearer insights into those environmental changes which are caused by nature and those changes which are induced by human activity. SIR-C was developed by NASA's Jet Propulsion Laboratory (JPL). X-SAR was developed by the Dornire and Alenia Spazio Companies for the German Space Agency, Deutsche Agentur fuer Raumfahrtangelegenheiten (DARA), and the Italian Space Agency, Agenzia Spaziale Italiana (ASI). JPL Photo ID: P-43882
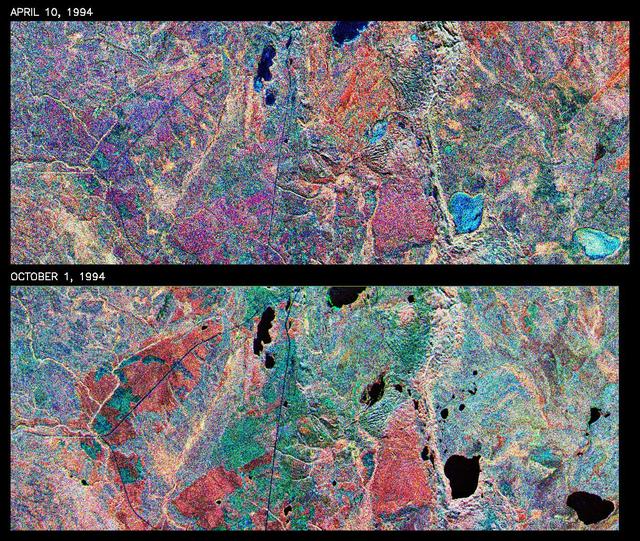
This is a comparison of images over Prince Albert, produced by NASA Spaceborne Imaging Radar-C and X-band Synthetic Aperture Radar aboard the space shuttle Endeavour on its 20th orbit on April 10, 1994. The area is centered at 53.91 degrees north latitude and 104.69 degrees west longitude and is located 40 kilometers (25 miles) north and 30 kilometers (18.5 miles) east of the town of Prince Albert in the Saskatchewan province of Canada. The image covers the area east of Candle Lake, between the gravel highway of 120 and west of highway 106. The area imaged is near the southern limit of the boreal forest. The boreal forest of North America is a continuous vegetation belt at high latitudes stretching across the continent from the Atlantic shoreline of central Labrador and then westward across Canada to the interior mountains and central coastal plains of Alaska. The forest is also part of a larger northern hemisphere circumpolar boreal forest belt. Coniferous trees dominate the entire forest but deciduous trees are also present. During the month of April, the forest experiences seasonal changes from a frozen condition to a thawed condition. The trees are completely frozen over the winter season and the forest floor is covered by snow. As the average temperature rises in the spring, the trees are thawed and the snow melts. This transition has an impact on the rate of moisture evaporation and release of carbon dioxide into the atmosphere. In late September and early October, the boreal forest experiences a relatively different seasonal change. At this time, the leaves on deciduous trees start changing color and dropping off. The soil and trees are quite often moist due to frequent rainfall and cloud cover. The evaporation of moisture and carbon dioxide into the atmosphere also diminishes at this time. SIR-C/X-SAR is sensitive to the moisture of soil and vegetation and can sense this freeze-thaw cycle and the summer-fall seasonal transition over forested areas in particular. Optical sensors, by contrast, are blind to these regions, which are perpetually obscured by thick cloud cover. These changes were detected by comparing the April and October color composite images of L-band data in red, C-band data in green and X-band (vertically received and transmitted) in blue. The changes in intensity of each color over lakes, various forest stands and clear cuts in the two images is striking. Lakes such as Lake Heiberg, Crabtree Lake and Williams Lake, in the right middle part of the image, are frozen in April (appearing in bright blue) and melted (appearing in black) in October. The higher intensity of blue over lakes in April is due to low penetration of the X-band (vertically received and transmitted) and the radar's high sensitivity to surface features. Forest stands also exhibit major changes between the two images. The red areas in the October image are old jack pine canopies that cause higher return at L-band because of their moist condition in late summer compared to their partially frozen condition in April (in purple). Similarly, in the areas near the middle of the image, where black spruce and mixed aspen and jack pine trees dominate, the contrast between blue in October and red and green in April is an indication that the top of the canopy (needles and branches) were frozen in April and moist in October. The changes due to deforestation by logging companies or natural fires can also be detected by comparing the images. For example, the small blue area near the intersection of Harding Road and Highway 120 is the result of logging which occurred after the April data was acquired. The surface area of clear cut is approximately 4 hectares, which is calculated from the high-resolution capability of the radar images and verified by scientists participating in field work during the mission. http://photojournal.jpl.nasa.gov/catalog/PIA01732
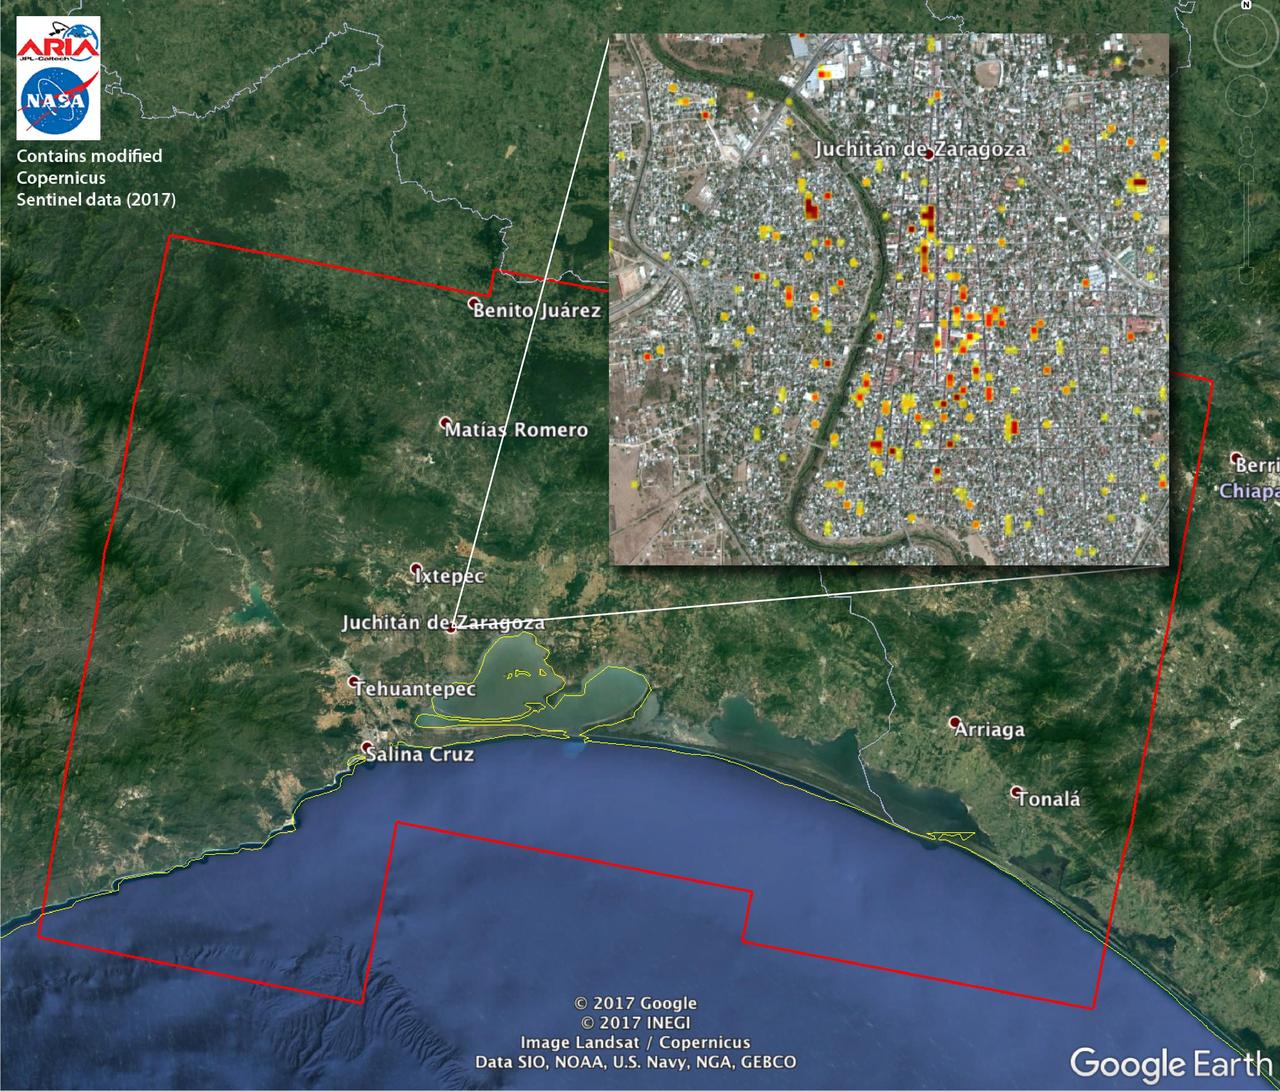
The Advanced Rapid Imaging and Analysis (ARIA) team at NASA's Jet Propulsion Laboratory in Pasadena, California, and Caltech, also in Pasadena, created this Damage Proxy Map (DPM) depicting areas of Southern Mexico that are likely damaged (shown by red and yellow pixels) from the magnitude 8.1 Chiapas earthquake of Sept. 7, 2017 (near midnight local time, early morning on Sept. 8 UTC). The map is derived from synthetic aperture radar (SAR) images from the Copernicus Sentinel-1A and Sentinel-1B satellites, operated by the European Space Agency (ESA). The images were taken before (Sept. 7, 2017 UTC) and after (Sept. 13, 2017 UTC) the earthquake. The map covers an area of 155 by 106 miles (250 by 170 kilometers). Each pixel measures about 33 yards (30 meters) across. The color variation from yellow to red indicates increasingly more significant ground surface change. Preliminary validation was done by comparing the SAR images to optical satellite imagery from DigitalGlobe. This damage proxy map should be used as guidance to identify damaged areas, and may be less reliable over vegetated areas. Sentinel-1 data were accessed through the Copernicus Open Access Hub. The image contains modified Copernicus Sentinel data (2017), processed by ESA and analyzed by the NASA-JPL/Caltech ARIA team. This research was carried out at JPL under a contract with NASA. https://photojournal.jpl.nasa.gov/catalog/PIA21956
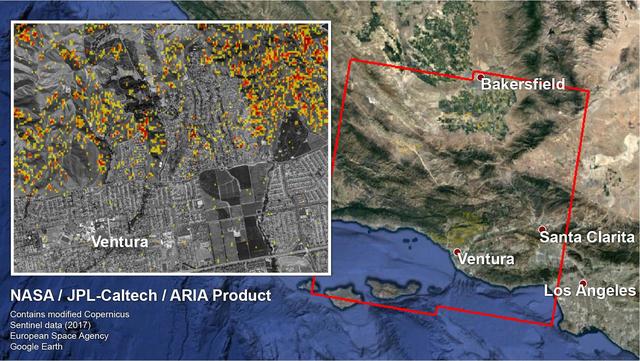
The Advanced Rapid Imaging and Analysis (ARIA) team at NASA's Jet Propulsion Laboratory in Pasadena, California, and Caltech, also in Pasadena, created a Damage Proxy Map (DPM) depicting areas in Southern California that are likely damaged (shown by red and yellow pixels) as a result of recent wildfires, including the Thomas Fire in Ventura and Santa Barbara Counties, highlighted in the attached image taken from the DPM. The map is derived from synthetic aperture radar (SAR) images from the Copernicus Sentinel-1 satellites, operated by the European Space Agency (ESA). The images were taken before (Nov. 28, 2017, 6 a.m. PST) and after (Dec. 10, 2017, 6 a.m. PST) the onset of the fires. The map covers an area of 107 by 107 miles (172 by 172 kilometers), shown by the large red polygon. Each pixel measures about 33 yards (30 meters) across. The color variation from yellow to red indicates increasingly more significant ground surface change. Preliminary validation was done by comparing the map to optical satellite imagery from DigitalGlobe. This damage proxy map should be used as guidance to identify damaged areas, and may be less reliable over vegetated areas. For example, the colored pixels seen over mountainous areas may seem a little scattered even though the reality could be that the contiguous areas were burned. Patches of farmland can also appear as signals due to plowing or irrigation. The full map is available to download from https://aria-share.jpl.nasa.gov/events/20171210-SoCal_Fire/. https://photojournal.jpl.nasa.gov/catalog/PIA22191
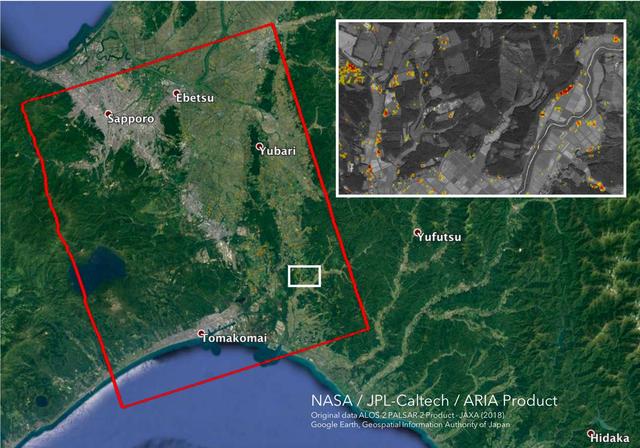
The Advanced Rapid Imaging and Analysis (ARIA) team at NASA's Jet Propulsion Laboratory in Pasadena, California, and Caltech, also in Pasadena, created this Damage Proxy Map (DPM) depicting areas in the southwestern part of Hokkaido, Japan, that are likely damaged as a result of the M6.6 September 5 earthquake in 2018 (shown by red and yellow pixels). The map is derived from synthetic aperture radar (SAR) images from the ALOS-2 satellites, operated by Japan Aerospace Exploration Agency (JAXA). The images were taken before and after the earthquake -- August 23 and September 6, respectively. The map covers an area of 70 by 57 kilometers, shown by the large red polygon. Each pixel measures about 30 meters across. The color variation from yellow to red indicates increasingly more significant ground surface change. Preliminary validation was done by comparing with the high-resolution airborne optical imagery provided by the Geospatial Information Authority of Japan. This damage proxy map should be used as guidance to identify damaged areas, and may be less reliable over vegetated areas. For example, pixels over vegetated areas and farmlands may be false positives, and the lack of colored pixels over vegetated areas does not necessarily mean no damage. The DPM was created by the NASA-JPL/Caltech ARIA team, and the ALOS-2 data were provided by JAXA. The algorithm development was carried out at JPL under a contract with NASA. https://photojournal.jpl.nasa.gov/catalog/PIA22696
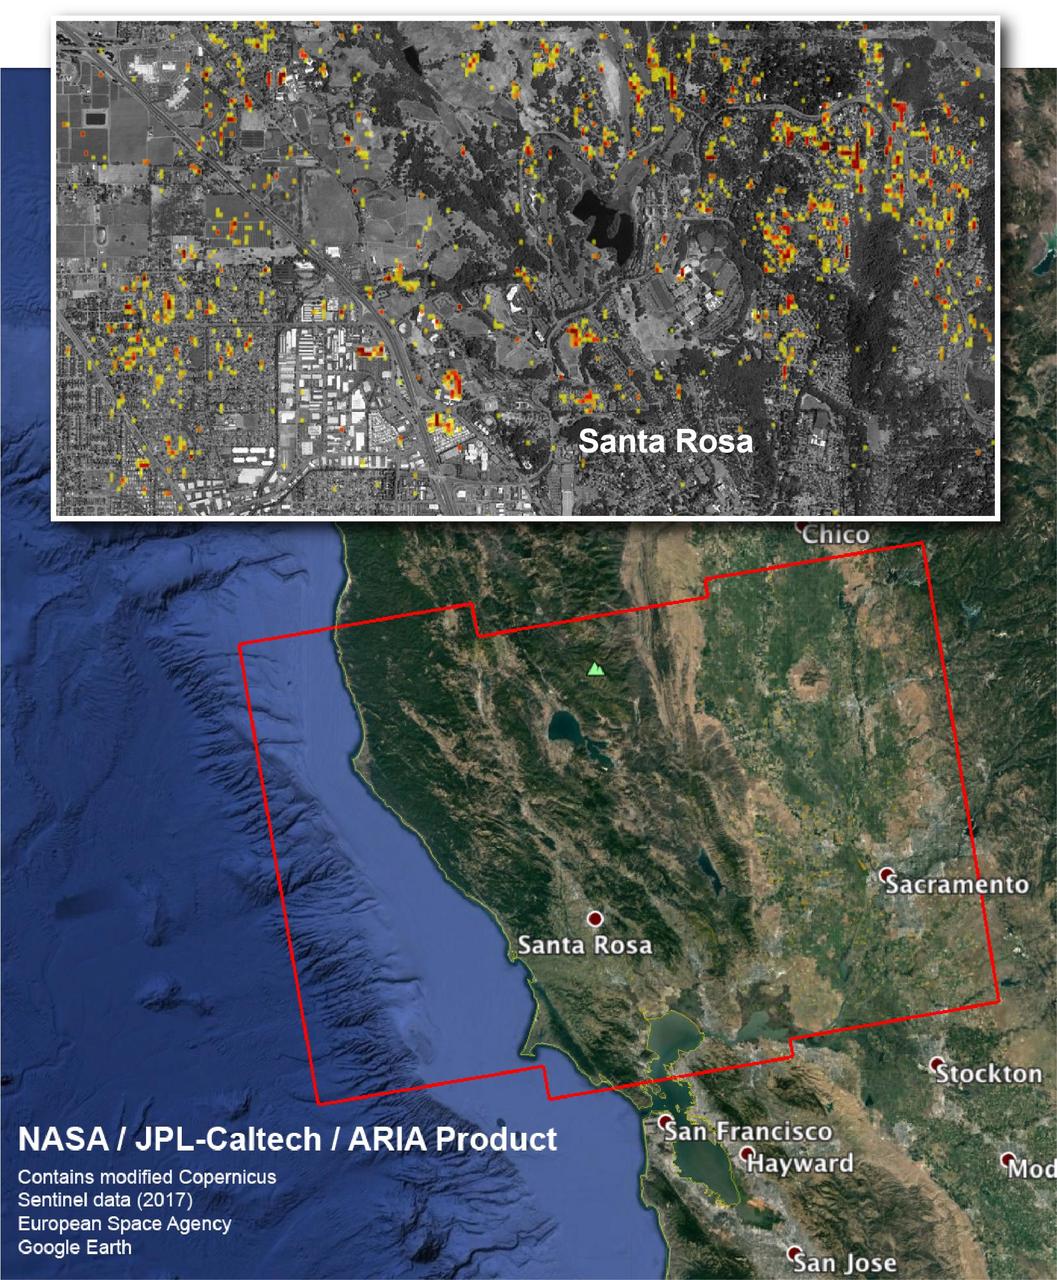
The Advanced Rapid Imaging and Analysis (ARIA) team at NASA's Jet Propulsion Laboratory in Pasadena, California, and Caltech, also in Pasadena, created this Damage Proxy Map depicting areas in Northern California that are likely damaged (shown by red and yellow pixels) as a result of the region's current outbreak of wildfires. The map is derived from synthetic aperture radar (SAR) images from the Copernicus Sentinel-1 satellites, operated by the European Space Agency (ESA). The images were taken before (Sep. 27, 2017, 7 p.m. PDT) and after (Oct. 9, 2017, 7 p.m. PDT) the onset of the fires. The map has been provided to various agencies to aid in the wildfire response. The map covers the area within the large red polygon, and measures 155 by 106 miles (250 by 170 kilometers). The illustrative figure from the map depicted in the inset shows damage in the city of Santa Rosa. Each pixel in the Damage Proxy Map measures about 98 feet (30 meters) across. The color variation from yellow to red indicates increasingly more significant ground surface change. Preliminary validation was done by comparing to optical satellite imagery from DigitalGlobe. This Damage Proxy Map should be used as guidance to identify damaged areas, and may be less reliable over vegetated areas. Sentinel-1 data were accessed through the Copernicus Open Access Hub. The image contains modified Copernicus Sentinel data (2017), processed by ESA and analyzed by the NASA-JPL/Caltech ARIA team. This research was carried out at JPL under a contract with NASA. https://photojournal.jpl.nasa.gov/catalog/PIA22048

The Advanced Rapid Imaging and Analysis (ARIA) team at NASA's Jet Propulsion Laboratory in Pasadena, California, and Caltech, also in Pasadena, created this Damage Proxy Map (DPM) depicting areas in the northeastern part of Lombok Island, Indonesia, that are likely damaged (shown by red and yellow pixels) as a result of the major earthquake sequence (including the M6.4 July 29, the M6.9 August 5, the M5.9 August 9, and the M6.4 August 18 earthquakes) in 2018. The map is derived from synthetic aperture radar (SAR) images from the ALOS-2 satellites, operated by Japan Aerospace Exploration Agency (JAXA). The images were taken before the (May 13, 2018 00:30) and after the (August 19, 2018 00:30, both local time) earthquakes. The map covers an area of 73 by 70 kilometers, shown by the large red polygon. Each pixel measures about 30 meters across. The color variation from yellow to red indicates increasingly more significant ground surface change. Preliminary validation was done by comparing with the DigitalGlobe's high-resolution optical satellite imagery. This damage proxy map should be used as guidance to identify damaged areas, and may be less reliable over vegetated areas. For example, the scattered single colored pixels over vegetated areas may be false positives, and the lack of colored pixels over vegetated areas does not necessarily mean no damage. The DPM was created by the NASA-JPL/Caltech ARIA team, and the ALOS-2 data were provided by JAXA. The Earth Observatory of Singapore coordinated with the Sentinel Asia to timely task the ALOS-2 satellite. The algorithm development was carried out at JPL under a contract with NASA. https://photojournal.jpl.nasa.gov/catalog/PIA22495
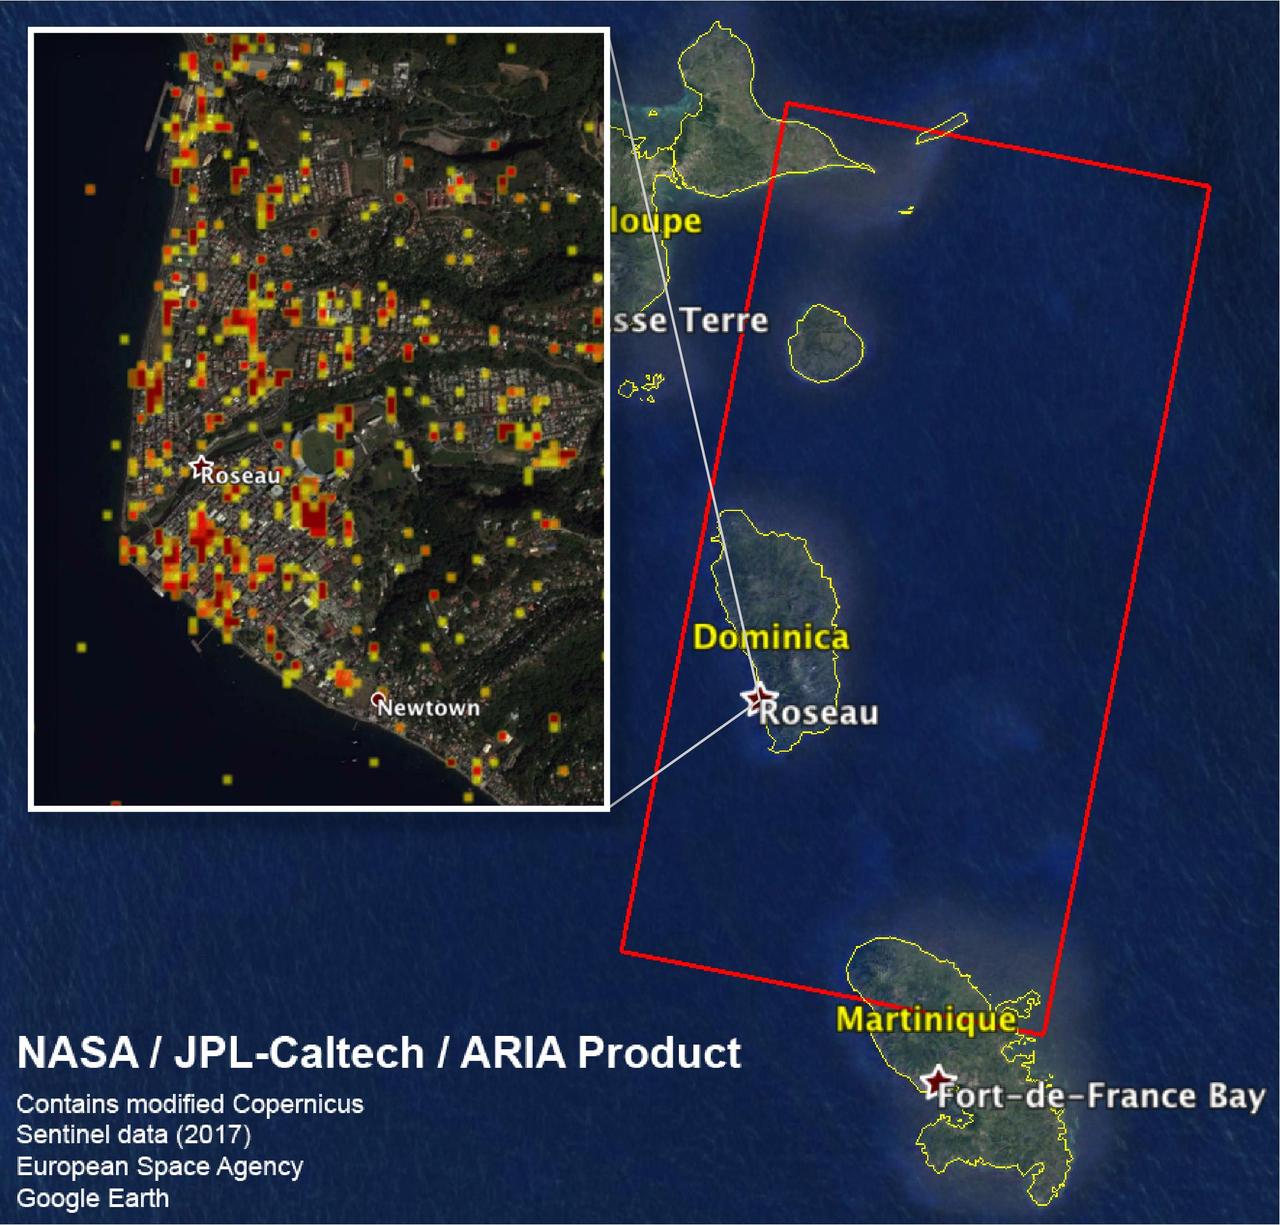
The Advanced Rapid Imaging and Analysis (ARIA) team at NASA's Jet Propulsion Laboratory in Pasadena, California, and Caltech, also in Pasadena, created this Damage Proxy Map (DPM) depicting areas including the Commonwealth of Dominica, that are likely damaged (shown by red and yellow pixels) as a result of Hurricane Maria (a Category 5 storm at landfall in Dominica on Sept. 18, 2017). The map is derived from synthetic aperture radar (SAR) images from the Copernicus Sentinel-1 satellites, operated by the European Space Agency (ESA). The images were taken before (March 27, 2017) and after (Sept. 23, 2017) the landfall of the storm. The map covers the area within the large red polygon, which measures 53 by 106 miles (85 by 170 kilometers). Each pixel measures about 98 feet (30 meters) across. The color variation from yellow to red indicates increasingly more significant ground surface change. Preliminary validation was done by comparing the data to a crowdsourced map by Clemson Center for Geospatial Technologies and optical satellite imagery feom DigitalGlobe. This damage proxy map should be used as guidance to identify damaged areas, and may be less reliable over vegetated areas. Sentinel-1 data were accessed through the Copernicus Open Access Hub. The image contains modified Copernicus Sentinel data (2017), processed by ESA and analyzed by the NASA/JPL-Caltech ARIA team. This research was carried out at JPL under a contract with NASA. https://photojournal.jpl.nasa.gov/catalog/PIA22037