
NASA Administrator Charles Bolden, 4th from left, is presented a plaque in honor of him becoming the 12th NASA Administrator by NASA Headquarters members of his fraternity, Omega Psi Phi: from left, Andrew Hubbard, Clinton Green, Carl Person, Dwayne Brown, and Elbert Cox, right. Omega Psi Phi Fraternity, Inc. was founded at Howard University on Nov. 17, 1911. The phrase “friendship is essential to the soul," is the fraternity’s motto. Photo Credit: (NASA/Bill Ingalls)

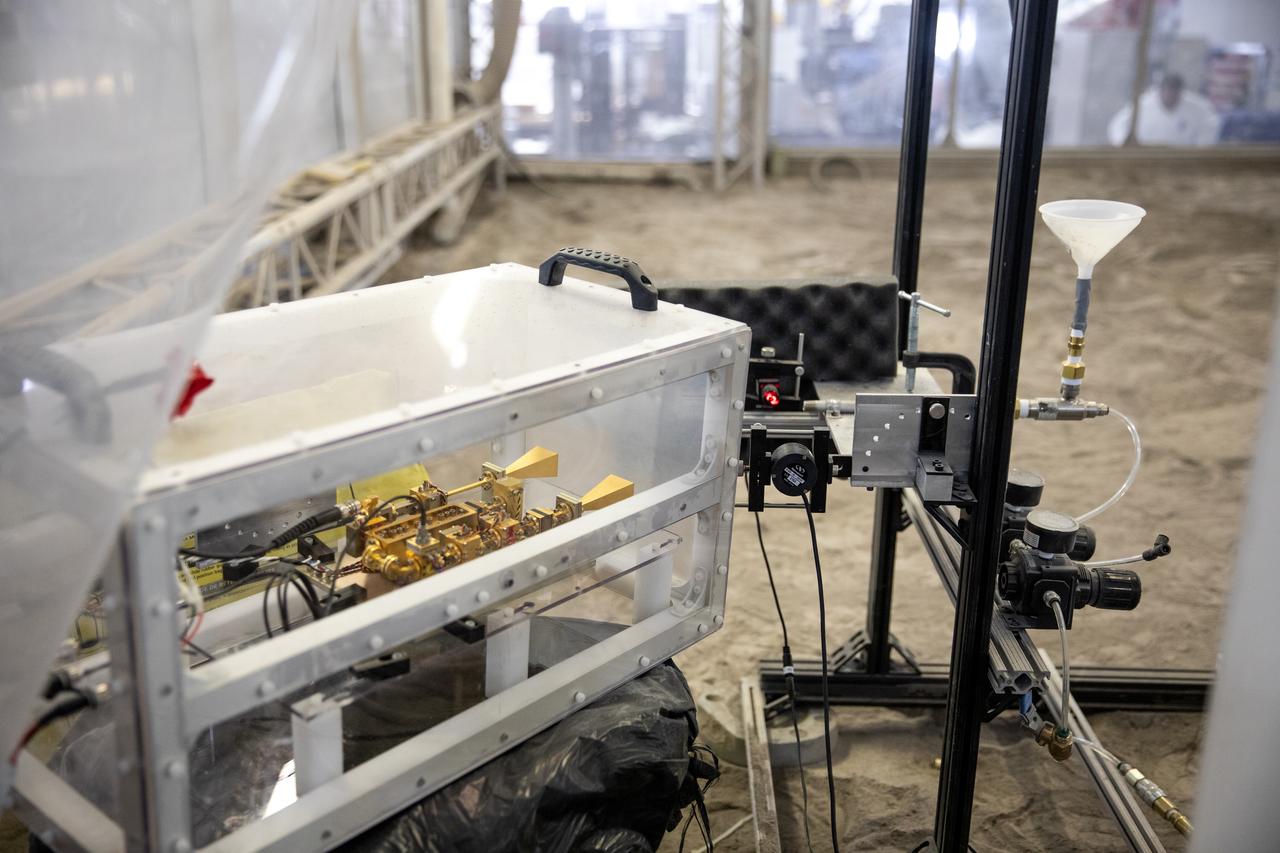
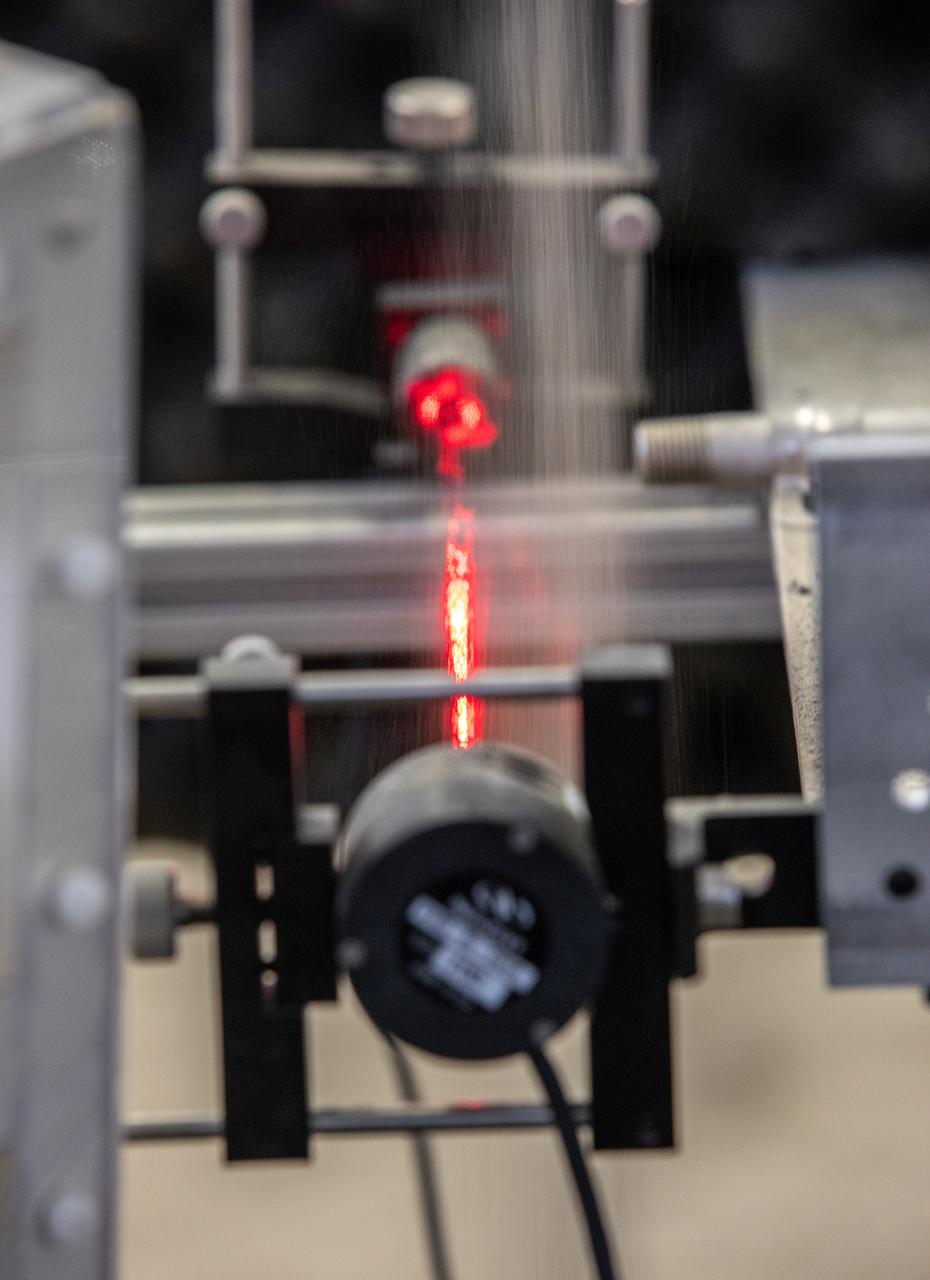
The Dust Concentration Monitor and the Millimeter Wave Doppler Radar undergo testing inside a regolith bin at the Granular Mechanics and Regolith Operations (GMRO) lab at the Kennedy Space Center’s Swamp Works on July 28, 2022, as part of Plume Surface Interaction (PSI) Instrumentation testing. The PSI Project is advancing both modeling and testing capabilities to understand exactly how rocket exhaust plumes affect a planetary landing site. This advanced modeling will help engineers evaluate the risks of various plumes on planetary surfaces, which will help them more accurately design landers for particular locations.
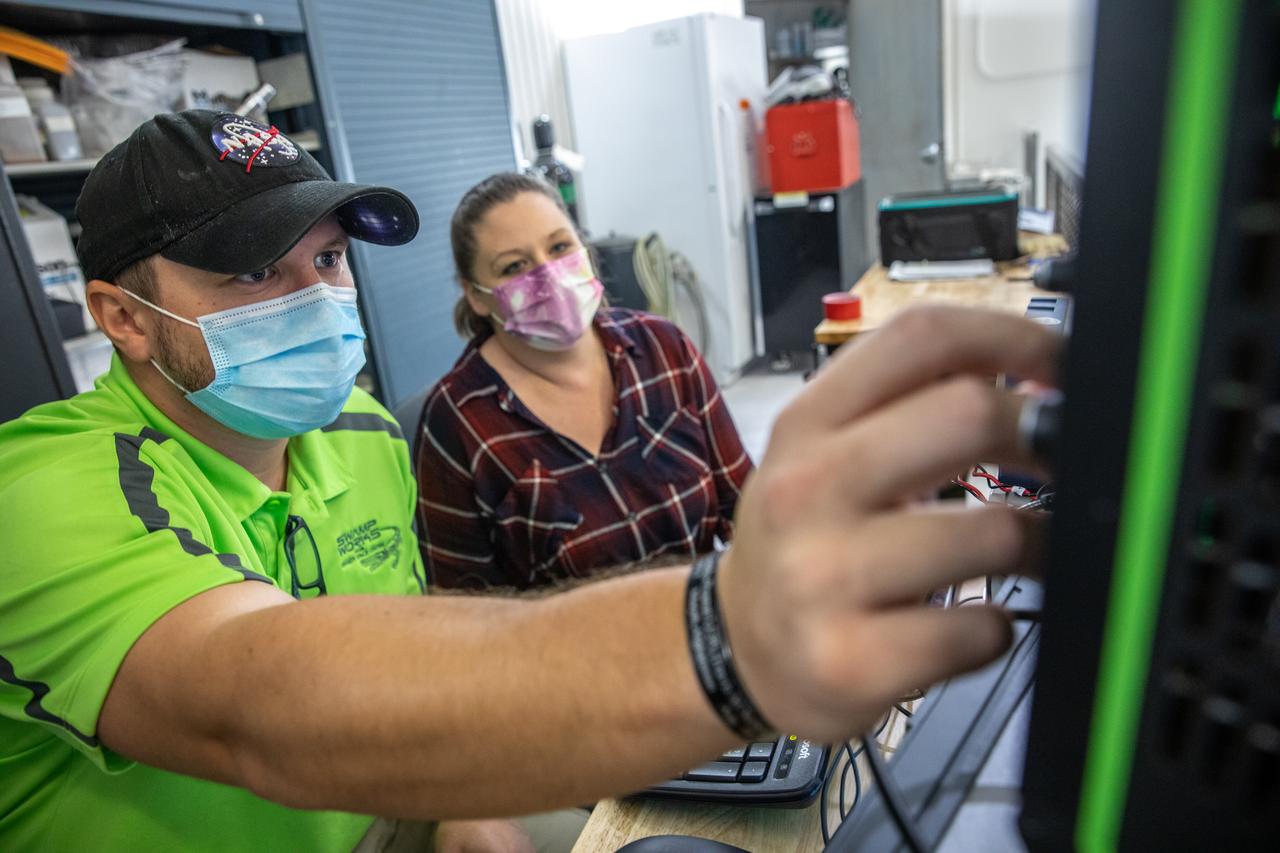
A team at NASA’s Kennedy Space Center in Florida assesses the Dust Concentration Monitor and the Millimeter Wave Doppler Radar inside a regolith bin at the Granular Mechanics and Regolith Operations (GMRO) lab at the spaceport’s Swamp Works on July 28, 2022, as part of Plume Surface Interaction (PSI) Instrumentation testing. The PSI Project is advancing both modeling and testing capabilities to understand exactly how rocket exhaust plumes affect a planetary landing site. This advanced modeling will help engineers evaluate the risks of various plumes on planetary surfaces, which will help them more accurately design landers for particular locations.
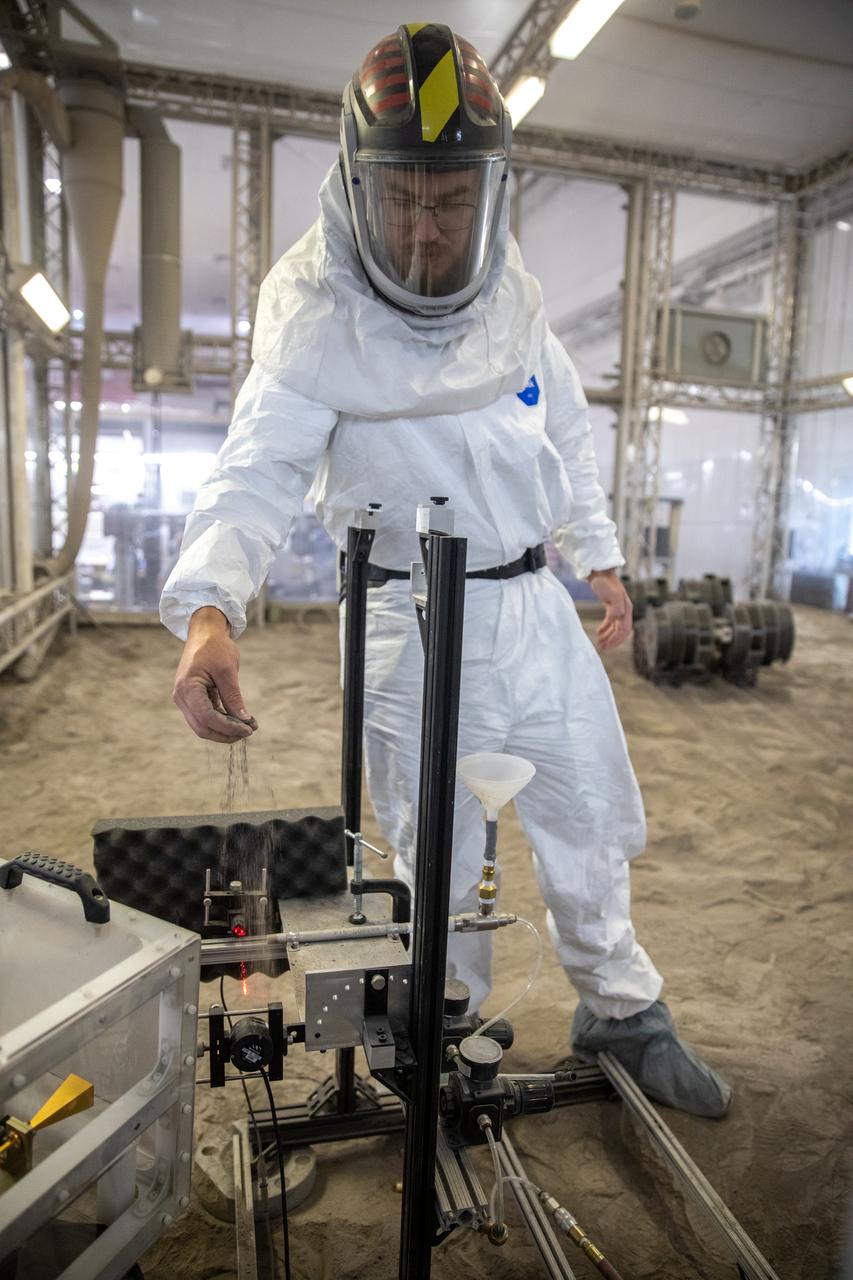
A team at NASA’s Kennedy Space Center in Florida assesses the Dust Concentration Monitor and the Millimeter Wave Doppler Radar inside a regolith bin at the Granular Mechanics and Regolith Operations (GMRO) lab at the spaceport’s Swamp Works on July 28, 2022, as part of Plume Surface Interaction (PSI) Instrumentation testing. The PSI Project is advancing both modeling and testing capabilities to understand exactly how rocket exhaust plumes affect a planetary landing site. This advanced modeling will help engineers evaluate the risks of various plumes on planetary surfaces, which will help them more accurately design landers for particular locations.
A team at NASA’s Kennedy Space Center in Florida assesses the Dust Concentration Monitor and the Millimeter Wave Doppler Radar inside a regolith bin at the Granular Mechanics and Regolith Operations (GMRO) lab at the spaceport’s Swamp Works on July 28, 2022, as part of Plume Surface Interaction (PSI) Instrumentation testing. The PSI Project is advancing both modeling and testing capabilities to understand exactly how rocket exhaust plumes affect a planetary landing site. This advanced modeling will help engineers evaluate the risks of various plumes on planetary surfaces, which will help them more accurately design landers for particular locations.
A team at NASA’s Kennedy Space Center in Florida assesses the Dust Concentration Monitor and the Millimeter Wave Doppler Radar inside a regolith bin at the Granular Mechanics and Regolith Operations (GMRO) lab at the spaceport’s Swamp Works on July 28, 2022, as part of Plume Surface Interaction (PSI) Instrumentation testing. The PSI Project is advancing both modeling and testing capabilities to understand exactly how rocket exhaust plumes affect a planetary landing site. This advanced modeling will help engineers evaluate the risks of various plumes on planetary surfaces, which will help them more accurately design landers for particular locations.
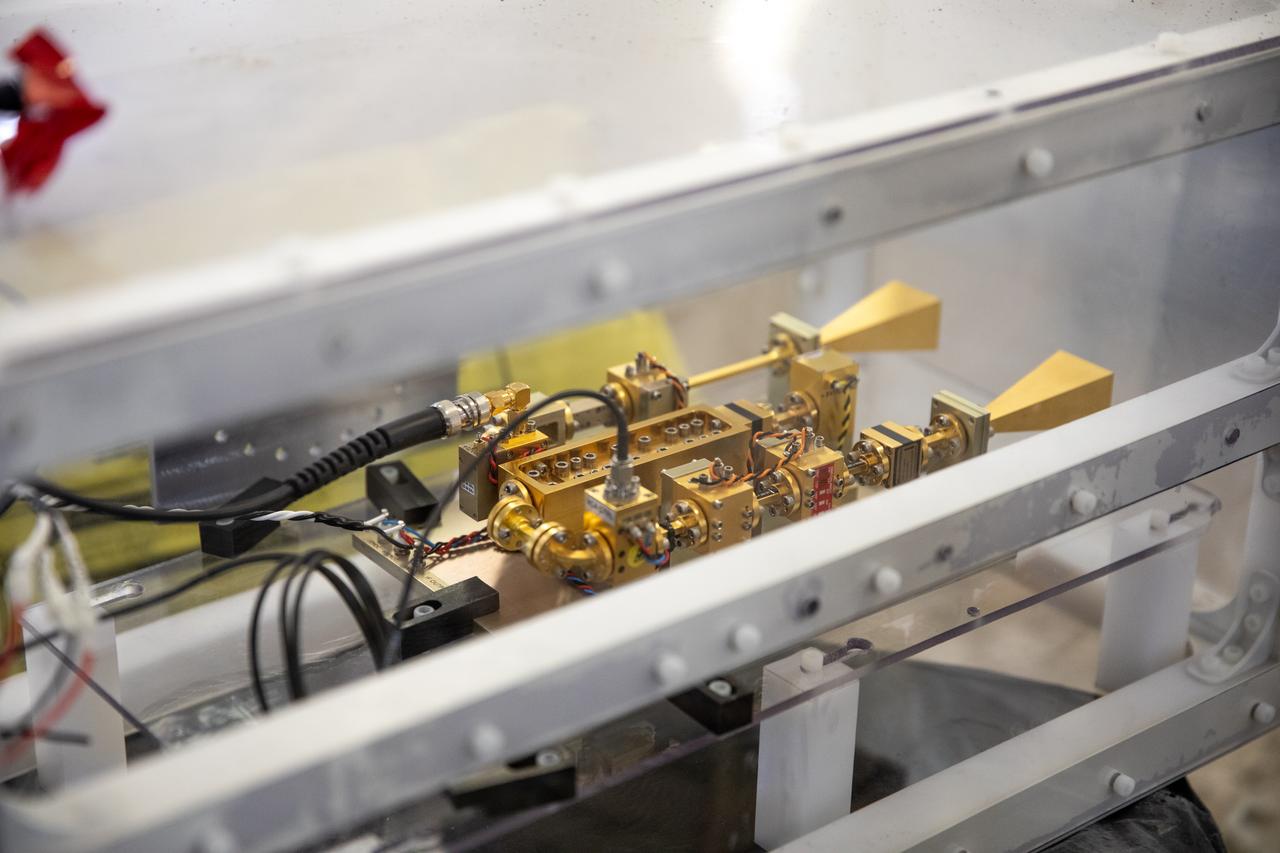
The Dust Concentration Monitor and the Millimeter Wave Doppler Radar undergo testing inside a regolith bin at the Granular Mechanics and Regolith Operations (GMRO) lab at the Kennedy Space Center’s Swamp Works on July 28, 2022, as part of Plume Surface Interaction (PSI) Instrumentation testing. The PSI Project is advancing both modeling and testing capabilities to understand exactly how rocket exhaust plumes affect a planetary landing site. This advanced modeling will help engineers evaluate the risks of various plumes on planetary surfaces, which will help them more accurately design landers for particular locations.
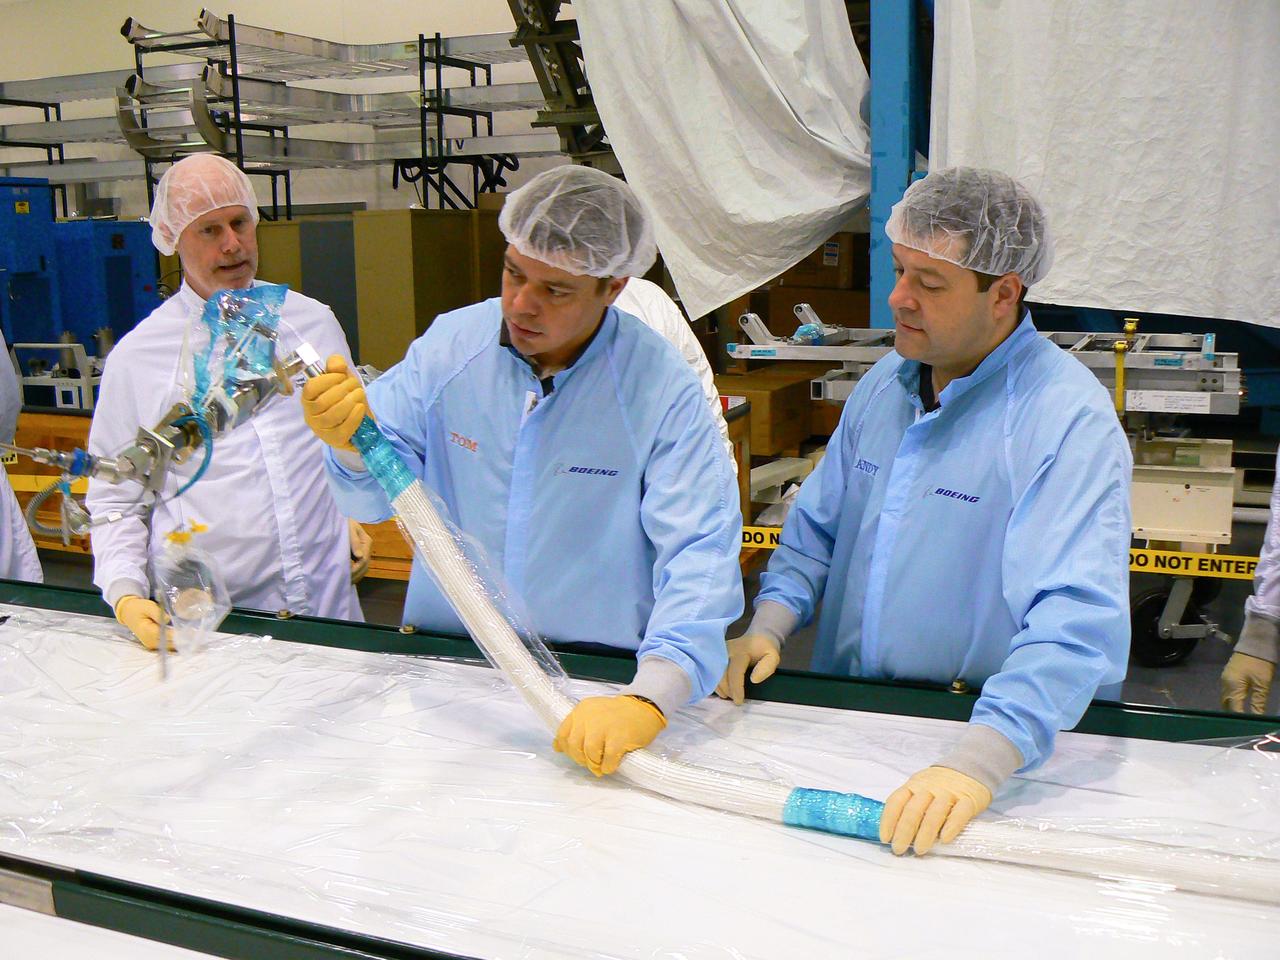
JSC2010-E-014775 (15 Jan. 2010) --- Seen at Marshall Space Center building 4708 in the high-bay clean room, astronauts Nicholas Patrick (right) and Robert Behnken, both STS-130 mission specialists, accompanied by Eric Howell, Boeing Huntsville Chief Engineer for ISS, handle ammonia hoses to be installed during mission STS-130. The hoses are at 500 pounds per square inch pressure (psi) to give them a feel for how stiff the hoses would be at 500 psi if they had to handle them under pressure on orbit.

Antonio "Tony" Knox, grand basileus of the Omega Psi Phi, speaks during an Astronauts Memorial Foundation tribute honoring U.S. Air Foce Maj. Robert Lawrence who was a member of the fraternity. Selected in 1967 for the Manned Orbiting Laboratory Program, Lawrence was the first African-American astronaut. He lost his life in a training accident 50 years ago. The ceremony took place in the Center for Space Education at the Kennedy Space Center Visitor Complex.

Antonio "Tony" Knox, grand basileus of the Omega Psi Phi farternity, makes a presentation to the Astronauts Memorial Foundation (AMF) with State Rep. Thad Altman, AMF president, accepting on behalf of the organization. The presentation took palce during an AMF tribute honoring U.S. Air Foce Maj. Lawrence who was a member of the fraternity. Selected in 1967 for the Manned Orbiting Laboratory Program, Lawrence was the first African-American astronaut. He lost his life in a training accident 50 years ago. The ceremony took place in the Center for Space Education at the Kennedy Space Center Visitor Complex.

Phase 2 of the A-3 Test Facility Subscale Diffuser Risk Mitigation Project at Stennis Space Center reached a milestone Oct. 25 when the E-3 Test Facility produced superheated (500+ degrees) steam for approximately 3 seconds at more than 400 psi. The test team, led by Barry Robinson of NASA's Test Projects Office, followed that success with further tests to lengthen the duration of steam production. On Nov. 1, they were able to maintain a consistent pressure and temperature of steam for 60 seconds. In December, the team began Phase 3 of the testing, providing data for the design and procurement to build the full-scale version of the steam diffuser for SSC's A-3 Test Stand.
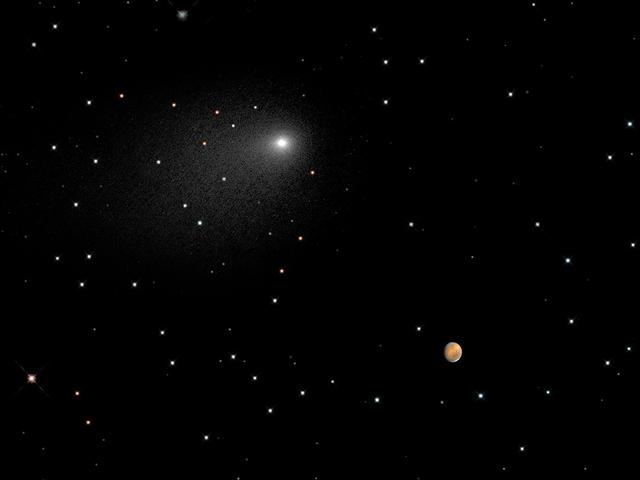
This composite NASA Hubble Space Telescope Image captures the positions of comet Siding Spring and Mars in a never-before-seen close passage of a comet by the Red Planet, which happened at 2:28 p.m. EDT October 19, 2014. The comet passed by Mars at approximately 87,000 miles (about one-third of the distance between Earth and the Moon). At that time, the comet and Mars were approximately 149 million miles from Earth. The comet image shown here is a composite of Hubble exposures taken between Oct. 18, 8:06 a.m. EDT to Oct. 19, 11:17 p.m. EDT. Hubble took a separate photograph of Mars at 10:37 p.m. EDT on Oct. 18. The Mars and comet images have been added together to create a single picture to illustrate the angular separation, or distance, between the comet and Mars at closest approach. The separation is approximately 1.5 arc minutes, or one-twentieth of the angular diameter of the full Moon. The background starfield in this composite image is synthesized from ground-based telescope data provided by the Palomar Digital Sky Survey, which has been reprocessed to approximate Hubble’s resolution. The solid icy comet nucleus is too small to be resolved in the Hubble picture. The comet’s bright coma, a diffuse cloud of dust enshrouding the nucleus, and a dusty tail, are clearly visible. This is a composite image because a single exposure of the stellar background, comet Siding Spring, and Mars would be problematic. Mars is actually 10,000 times brighter than the comet, and so could not be properly exposed to show detail in the Red Planet. The comet and Mars were also moving with respect to each other and so could not be imaged simultaneously in one exposure without one of the objects being motion blurred. Hubble had to be programmed to track on the comet and Mars separately in two different observations. The images were taken with Hubble’s Wide Field Camera 3. Credit: NASA, ESA, PSI, JHU/APL, STScI/AURA Credit: NASA, ESA, PSI, JHU/APL, STScI/AURA
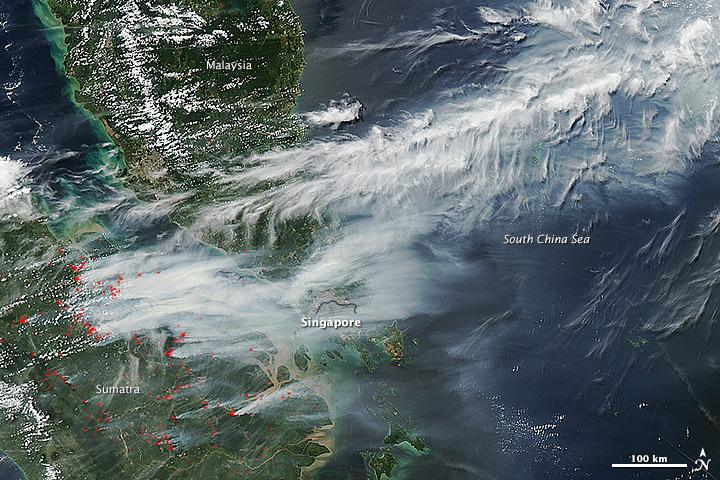
On June 19, 2013, NASA’s Aqua satellite captured a striking image of smoke billowing from illegal wildfires on the Indonesian island of Sumatra. The smoke blew east toward southern Malaysia and Singapore, and news media reported that thick clouds of haze had descended on Singapore, pushing pollution levels to record levels. Singapore’s primary measure of pollution, the Pollutant Standards Index (PSI)—a uniform measure of key pollutants similar to the Air Quality Index (AQI) used by the U.S. Environmental Protection Agency—spiked to 371 on the afternoon of June 20, 2013, the highest level ever recorded. The previous record occurred in 1997, when the index hit 226. Health experts consider any level above 300 to be “hazardous” to human health. Levels above 200 are considered “very unhealthy.” The image above was captured by the Moderate Resolution Imaging Spectroradiometer (MODIS), an instrument that observes the entire surface of Earth’s every 1 to 2 days. The image was captured during the afternoon at 6:30 UTC (2:30 p.m. local time). Though local laws prohibit it, farmers in Sumatra often burn forests during the dry season to prepare soil for new crops. The BBC reported that Singapore’s Prime Minister Lee Hsien Loong warned that the haze could “easily last for several weeks and quite possibly longer until the dry season ends in Sumatra.” NASA image by Jeff Schmaltz, LANCE/EOSDIS Rapid Response. Caption by Adam Voiland. Credit: <b><a href="http://www.earthobservatory.nasa.gov/" rel="nofollow"> NASA Earth Observatory</a></b> Instrument: Aqua - MODIS <b><a href="http://www.nasa.gov/audience/formedia/features/MP_Photo_Guidelines.html" rel="nofollow">NASA image use policy.</a></b> <b><a href="http://www.nasa.gov/centers/goddard/home/index.html" rel="nofollow">NASA Goddard Space Flight Center</a></b> enables NASA’s mission through four scientific endeavors: Earth Science, Heliophysics, Solar System Exploration, and Astrophysics. Goddard plays a leading role in NASA’s accomplishments by contributing compelling scientific knowledge to advance the Agency’s mission. <b>Follow us on <a href="http://twitter.com/NASA_GoddardPix" rel="nofollow">Twitter</a></b> <b>Like us on <a href="http://www.facebook.com/pages/Greenbelt-MD/NASA-Goddard/395013845897?ref=tsd" rel="nofollow">Facebook</a></b> <b>Find us on <a href="http://instagram.com/nasagoddard?vm=grid" rel="nofollow">Instagram</a></b>
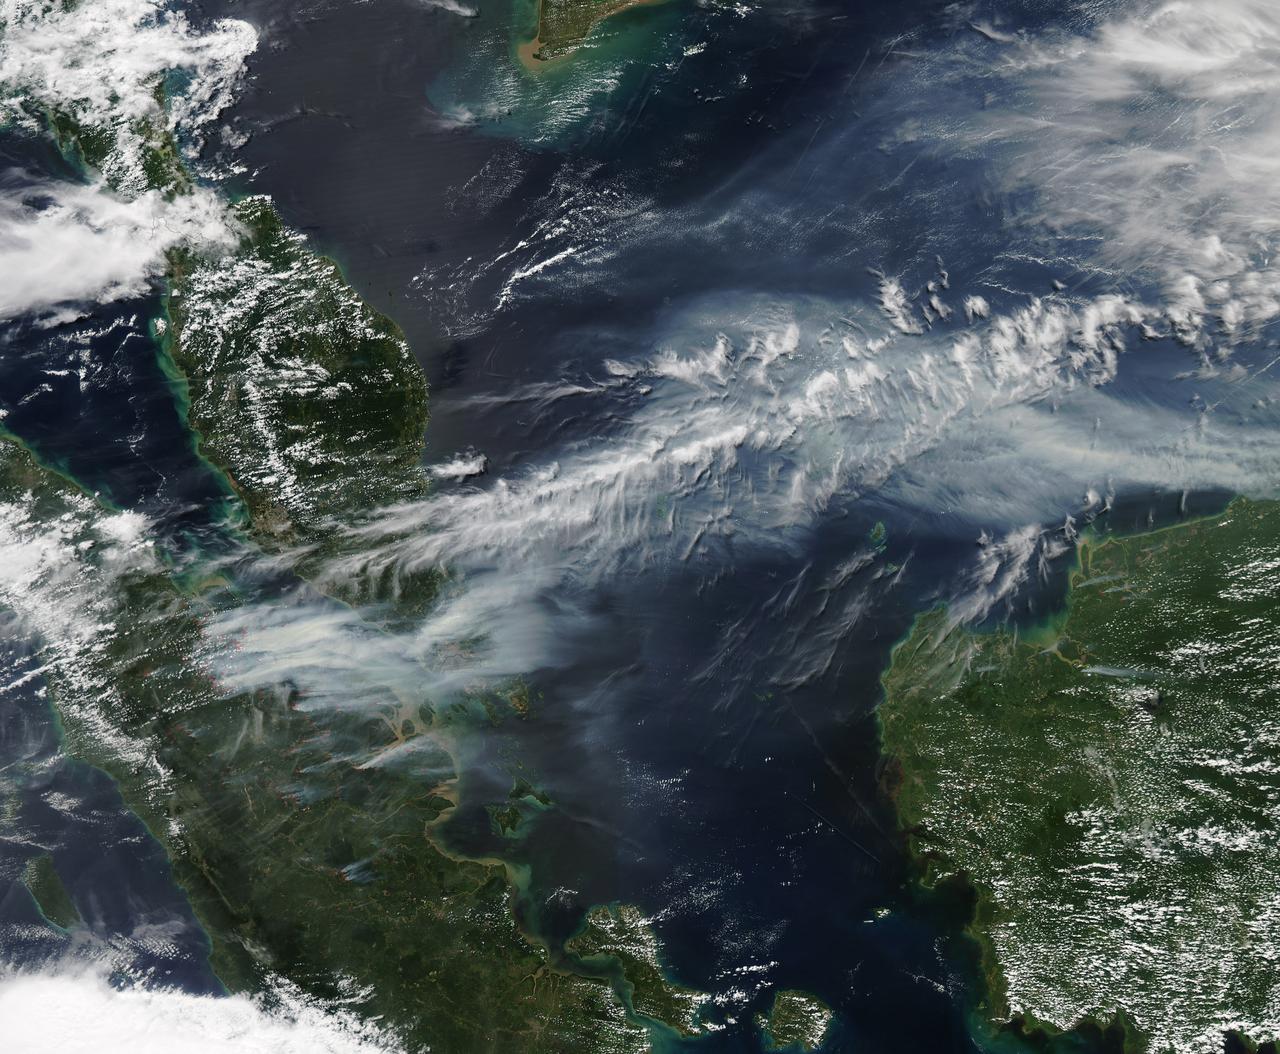
On June 19, 2013, NASA’s Aqua satellite captured a striking image of smoke billowing from illegal wildfires on the Indonesian island of Sumatra. The smoke blew east toward southern Malaysia and Singapore, and news media reported that thick clouds of haze had descended on Singapore, pushing pollution levels to record levels. Singapore’s primary measure of pollution, the Pollutant Standards Index (PSI)—a uniform measure of key pollutants similar to the Air Quality Index (AQI) used by the U.S. Environmental Protection Agency—spiked to 371 on the afternoon of June 20, 2013, the highest level ever recorded. The previous record occurred in 1997, when the index hit 226. Health experts consider any level above 300 to be “hazardous” to human health. Levels above 200 are considered “very unhealthy.” The image above was captured by the Moderate Resolution Imaging Spectroradiometer (MODIS), an instrument that observes the entire surface of Earth’s every 1 to 2 days. The image was captured during the afternoon at 6:30 UTC (2:30 p.m. local time). Though local laws prohibit it, farmers in Sumatra often burn forests during the dry season to prepare soil for new crops. The BBC reported that Singapore’s Prime Minister Lee Hsien Loong warned that the haze could “easily last for several weeks and quite possibly longer until the dry season ends in Sumatra.” NASA image by Jeff Schmaltz, LANCE/EOSDIS Rapid Response. Caption by Adam Voiland. Credit: <b><a href="http://www.earthobservatory.nasa.gov/" rel="nofollow"> NASA Earth Observatory</a></b> Instrument: Aqua - MODIS <b><a href="http://www.nasa.gov/audience/formedia/features/MP_Photo_Guidelines.html" rel="nofollow">NASA image use policy.</a></b> <b><a href="http://www.nasa.gov/centers/goddard/home/index.html" rel="nofollow">NASA Goddard Space Flight Center</a></b> enables NASA’s mission through four scientific endeavors: Earth Science, Heliophysics, Solar System Exploration, and Astrophysics. Goddard plays a leading role in NASA’s accomplishments by contributing compelling scientific knowledge to advance the Agency’s mission. <b>Follow us on <a href="http://twitter.com/NASA_GoddardPix" rel="nofollow">Twitter</a></b> <b>Like us on <a href="http://www.facebook.com/pages/Greenbelt-MD/NASA-Goddard/395013845897?ref=tsd" rel="nofollow">Facebook</a></b> <b>Find us on <a href="http://instagram.com/nasagoddard?vm=grid" rel="nofollow">Instagram</a></b>
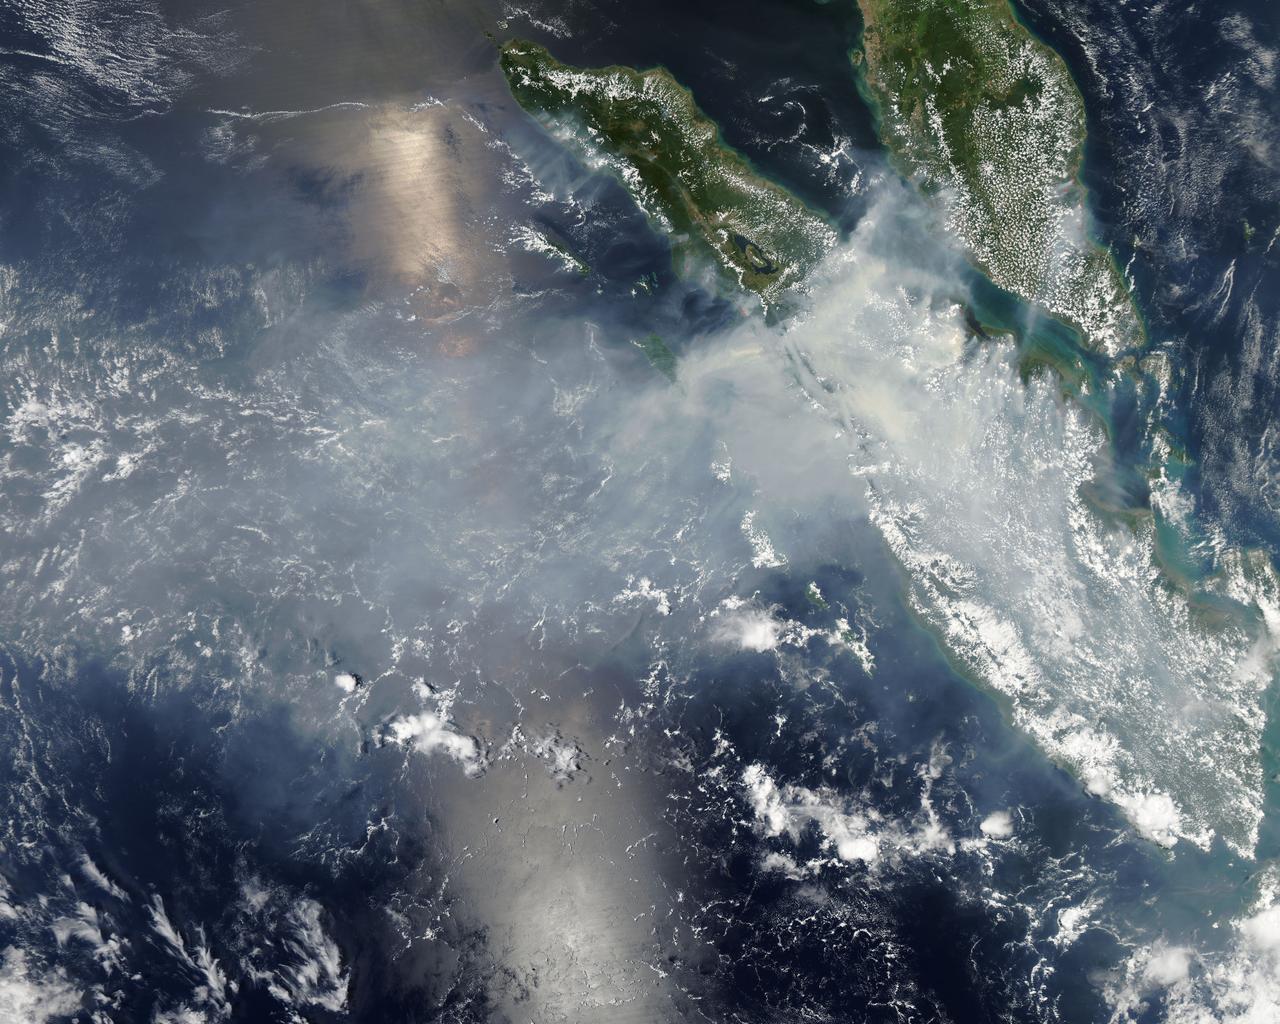
Fires burning in Sumatra continued to pour smoke over the region in mid-March, 2014, bringing air quality to dangerous levels. The Moderate Resolution Imaging Spectroradiometer (MODIS) aboard NASA’s Aqua satellite captured this true-color image of the smoke and haze across the region on March 12. According to the Jakarta Post, on March 12 the Sumatra Environmental Laboratory reported that 10 of 12 spots in Riau had an air quality of index above 300 on the Pollutant Standards Index (PSI), which is considered hazardous. Hazardous air quality had been recorded in some of the locations for 11 consecutive days. The province of Riau is located in the central eastern coast of Sumatra and, in this image, is hidden under thick bands of light gray smoke. Intense fires, reported as deliberately set to clear land, were burning in the Giam Siak Kecil-Bukit Batu biosphere reserve. This reserve contains over 700,000 hectares of sensitive peat forest that sustains a wide range of plant and animal species, including the Sumatra tiger, elephant, tapir and sun bear. With visibility as low as 500 m (1640 ft), 58 flights were cancelled in Pekanbaru, the capital of Riau province, on March 11. Schools were closed across the region, with 43,000 students affected in Payakumbuh, West Sumatra. On March 14, Selangor, Malaysia closed 203 schools, affecting 211,700 pupils, until the air quality improved. On that same day, according to Riau Health Agency, more than 55,000 residents in the province were suffering from haze-related illnesses, including acute respiratory infections, pneumonia and skin and eye irritation. Poor air quality not only affected transportation, human health and the ecosystem, but has had significant economic impacts. On March 17, Reuters reported that the poor air quality had forced Chevron, the country’s biggest oil producer, to close hundreds of its wells. As a result, Indonesia’s crude oil output dropped to 790,000 barrels per day (bpd) – significantly lower than the 870,000 bpd target. Although slash-and-burn techniques, which use fire to clear land, is illegal in Indonesia, the practice is still widespread, with approximately 99% of fires in Sumatra considered to be intentionally set. This year’s early agricultural fires began in February in Riau Province, home to palm-oil and pulpwood plantations. The emergency has prompted strong government response, including a shoot-on-sight order for any suspects involved in land burning activities that resisted arrest. According to the Jakarta Post, police have named as many as 60 suspected-fire starters in Riau. Credit: NASA/GSFC/Jeff Schmaltz/MODIS Land Rapid Response Team <b><a href="http://www.nasa.gov/audience/formedia/features/MP_Photo_Guidelines.html" rel="nofollow">NASA image use policy.</a></b> <b><a href="http://www.nasa.gov/centers/goddard/home/index.html" rel="nofollow">NASA Goddard Space Flight Center</a></b> enables NASA’s mission through four scientific endeavors: Earth Science, Heliophysics, Solar System Exploration, and Astrophysics. Goddard plays a leading role in NASA’s accomplishments by contributing compelling scientific knowledge to advance the Agency’s mission. <b>Follow us on <a href="http://twitter.com/NASAGoddardPix" rel="nofollow">Twitter</a></b> <b>Like us on <a href="http://www.facebook.com/pages/Greenbelt-MD/NASA-Goddard/395013845897?ref=tsd" rel="nofollow">Facebook</a></b> <b>Find us on <a href="http://instagram.com/nasagoddard?vm=grid" rel="nofollow">Instagram</a></b>
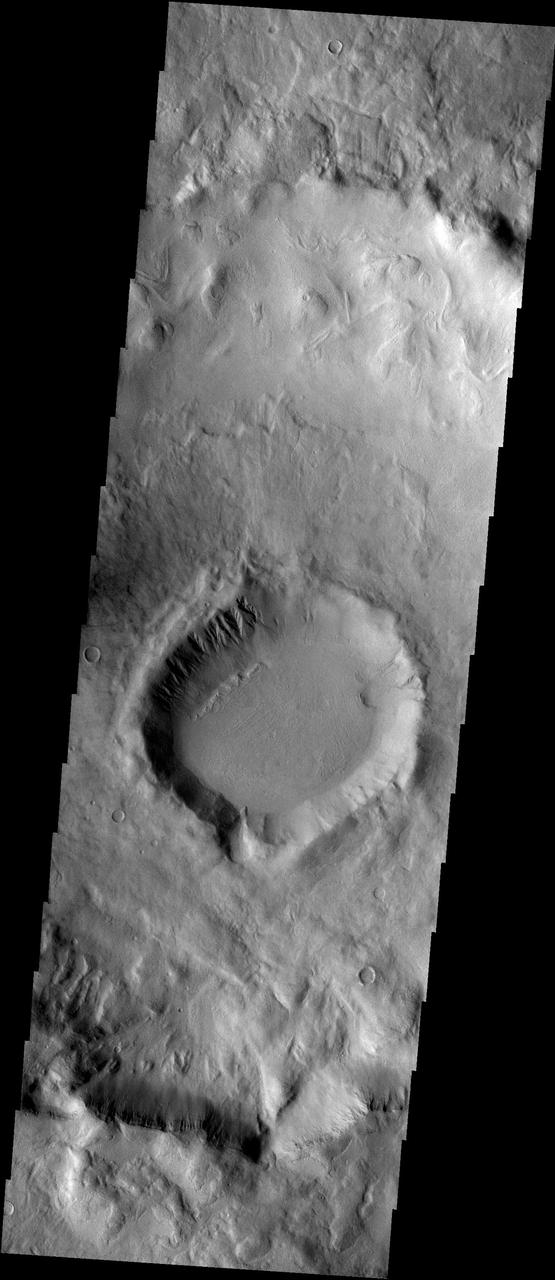
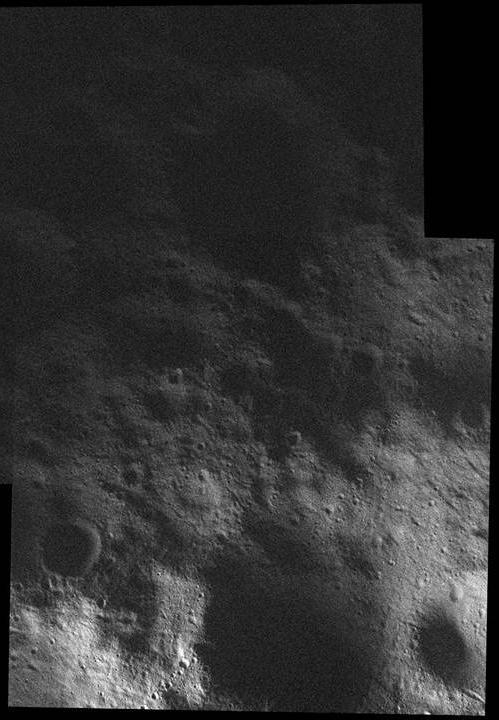
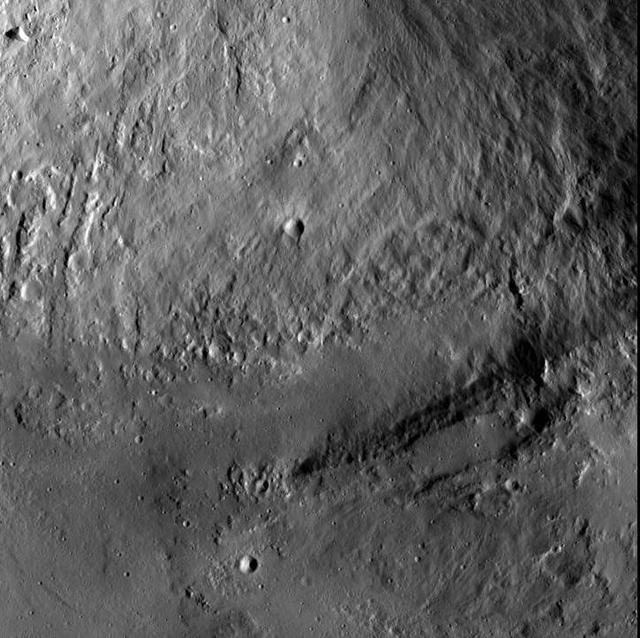
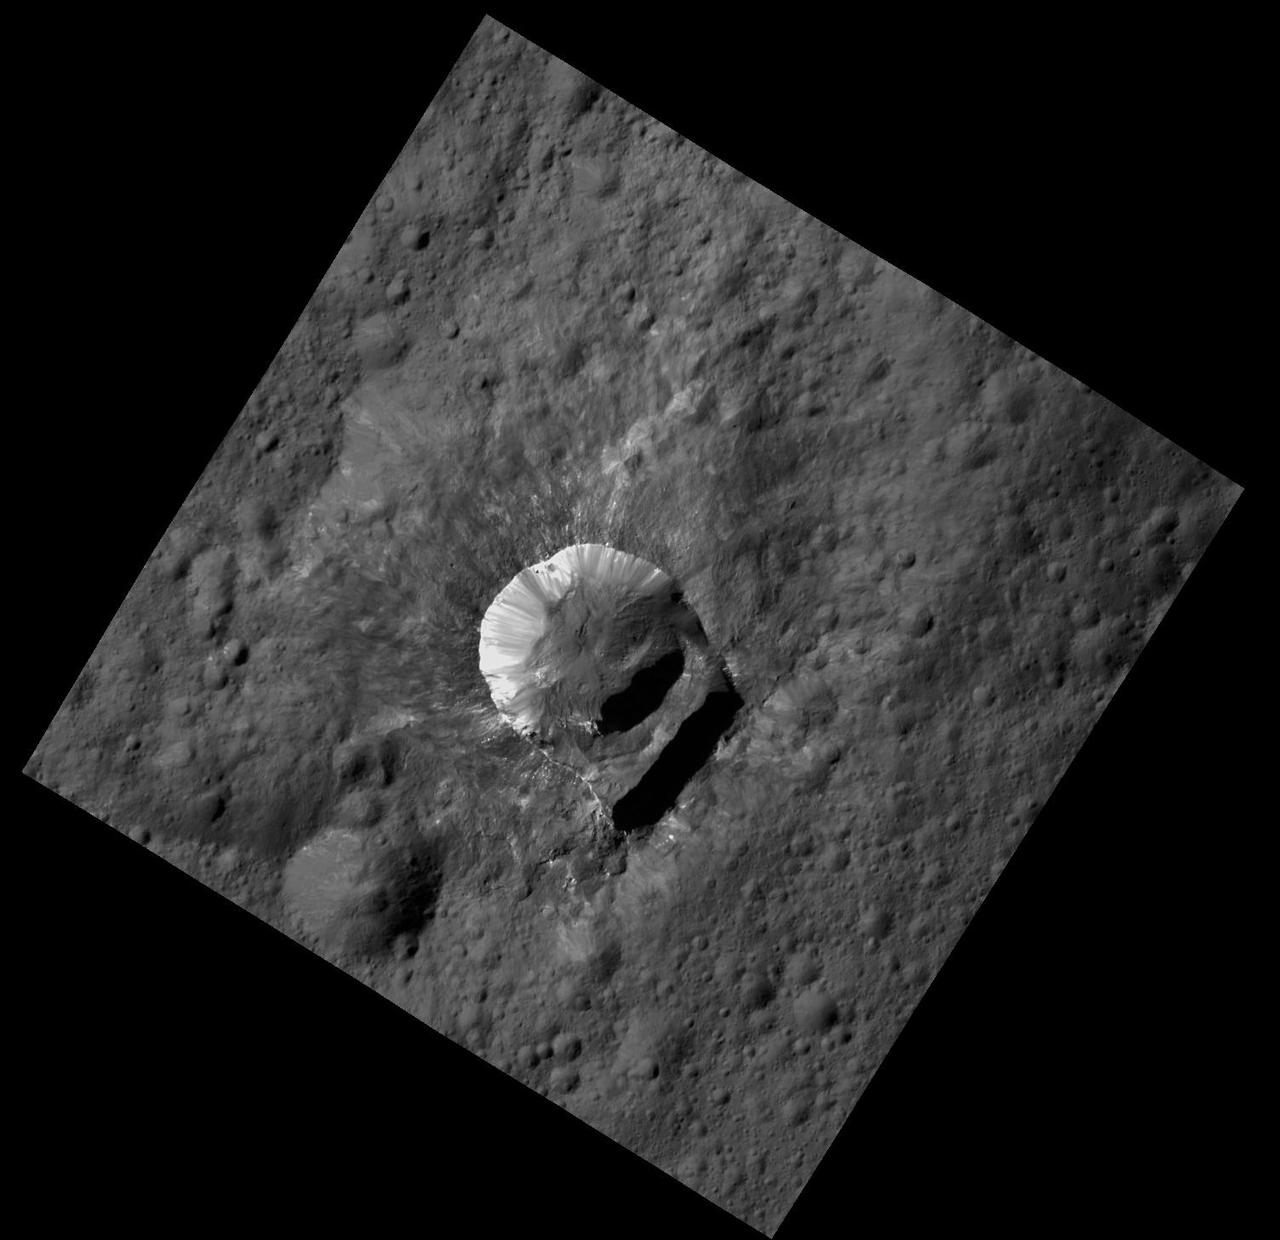
Signs of Landscape Modifications at Martian Crater
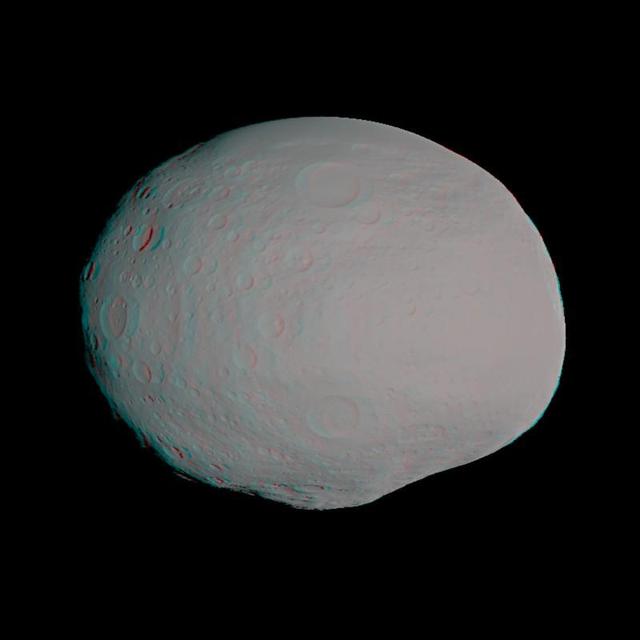
This anaglyph shows a 3-D model of the protoplanet Vesta, using scientists best guess to date of what the surface of the protoplanet might look like. It was created as part of an exercise for NASA Dawn mission. 3D glasses are necessary.
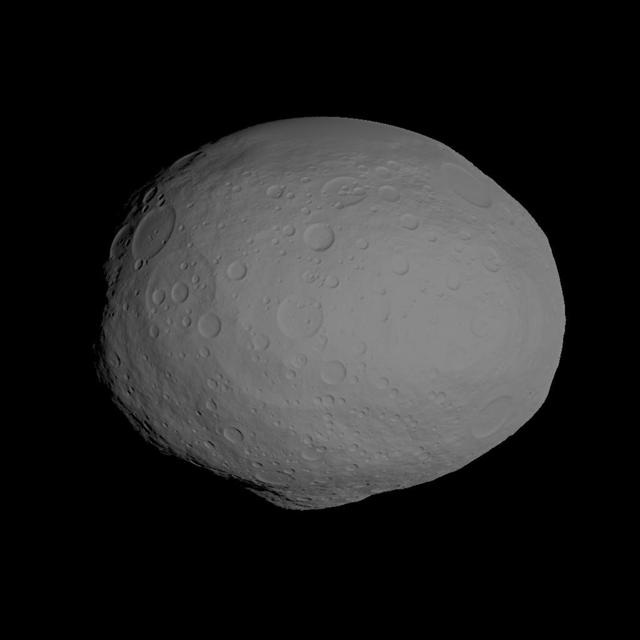
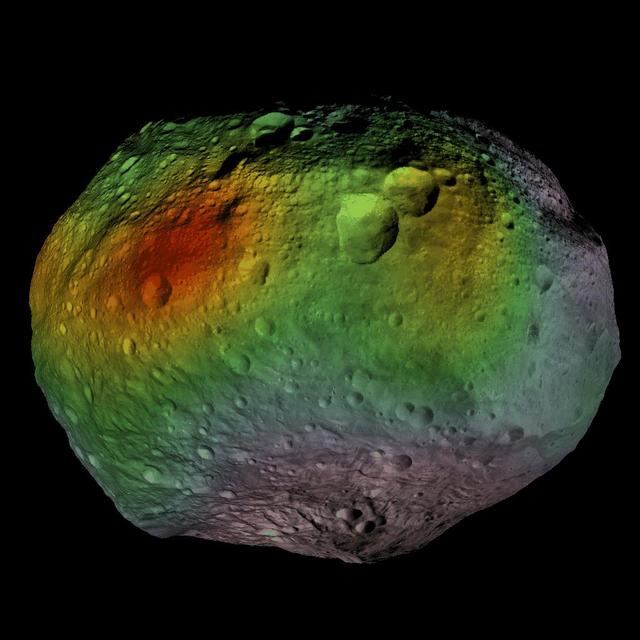
This image incorporates the best data on dimples and bulges of the protoplanet Vesta from ground-based telescopes and NASA Hubble Space Telescope. This model of Vesta uses scientists best guess to date of what the surface might look like.
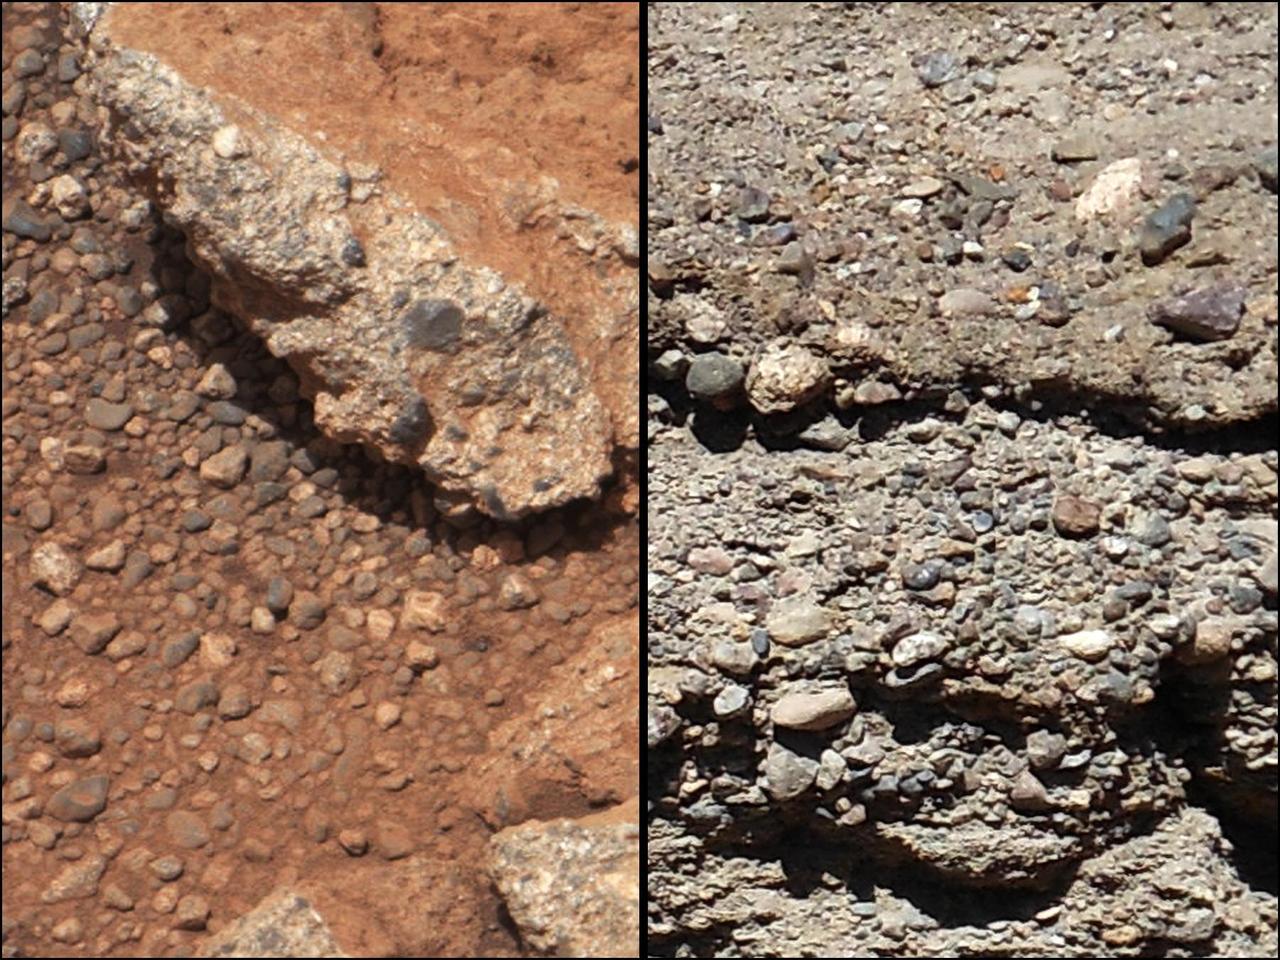
This set of images compares the Link outcrop of rocks on Mars left with similar rocks seen on Earth right. The Link outcrop shows rounded gravel fragments, or clasts, up to a couple inches few centimeters, within the rock outcrop.
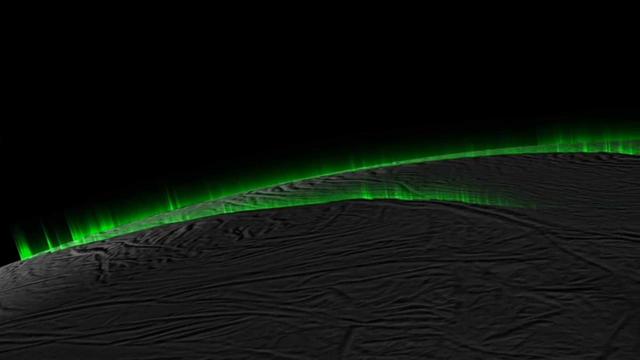
This simulation, which begins and ends with a real image from NASA Cassini spacecraft, demonstrates how the appearance of discrete jets could be an optical illusion that varies based on viewing geometry.
This image shows the scientists best guess to date of what the surface of the protoplanet Vesta might look like from the south pole and incorporates the best data on dimples and bulges Vesta from ground-based telescopes and NASA Hubble Space Telescope.
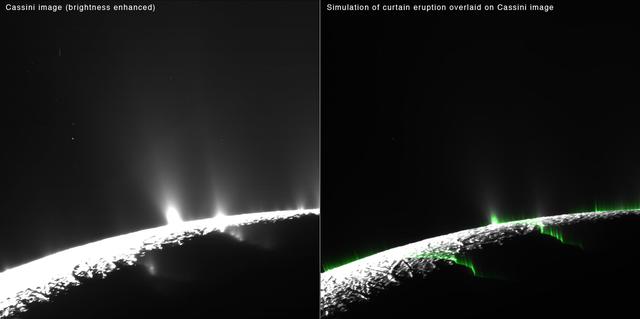
Phantom jets in simulated images produced by the scientists line up nicely with some of the features in real images from NASA Cassini spacecraft that appear to be discrete columns of spray.
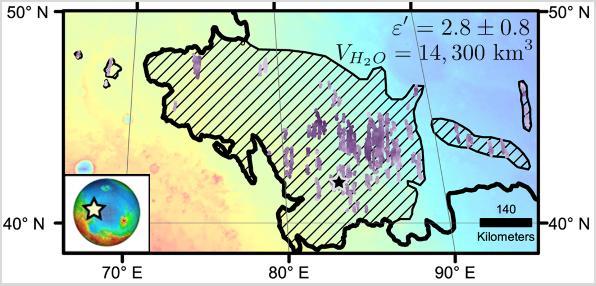
Diagonal striping on this map of a portion of the Utopia Planitia region on Mars indicates the area where a large subsurface deposit rich in water ice was assessed using the Shallow Radar (SHARAD) instrument on NASA's Mars Reconnaissance Orbiter. The area is about halfway between the planet's equator and north pole, and the deposit is estimated to hold about as much water as what is in Lake Superior, largest of the Great Lakes. The scale bar at lower right indicates 140 kilometers (76 miles). The violet vertical bars show depth to the bottom of the ice-rich deposit, as estimated from SHARAD passes overhead. Darkest violet indicates a depth of about 550 feet (about 170 meters). Palest violet indicates a depth of about 33 feet (10 meters). The value of 2.8 plus-or-minus 0.8 in the upper right corner denotes the dielectric constant, a property related to radar reflectivity. The value of 14,300 cubic kilometers is an estimate of the volume of water in the deposit. http://photojournal.jpl.nasa.gov/catalog/PIA21138
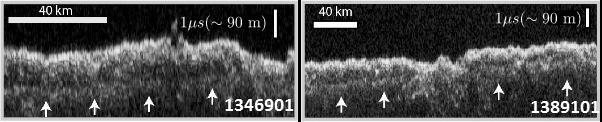
These two images show data acquired by the Shallow Radar (SHARAD) instrument while passing over two ground tracks in a part of Mars' Utopia Planitia region where the orbiting, ground-penetrating radar detected subsurface deposits rich in water ice. The instrument on NASA's Mars Reconnaissance Orbiter emits radio waves and times their echo off of radio-reflective surfaces and interfaces on Mars. The white arrows indicate a subsurface reflector interpreted as the bottom of the ice-rich deposit. The deposit is about as large in area as the state of New Mexico and contains about as much water as Lake Superior. The horizontal scale bar indicates 40 kilometers (25 miles) along the ground track of the radar, as flown by the orbiter overhead. The vertical scale bar indicates a return time of one microsecond for the reflected radio signal, equivalent to a distance of about 90 meters (295 feet). http://photojournal.jpl.nasa.gov/catalog/PIA21137

This synthesized composite of NASA Hubble Space Telescope images captures the positions of comet Siding Spring and Mars in a never-before-seen close passage of a comet by the Red Planet.
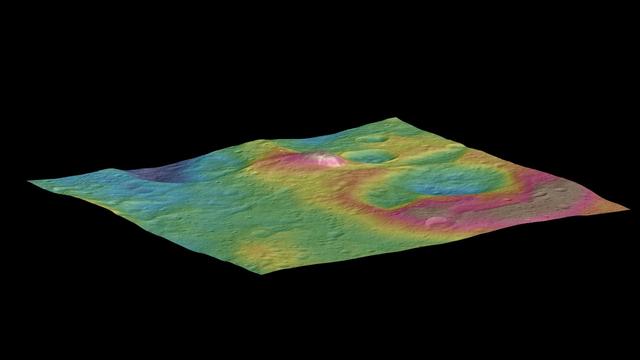
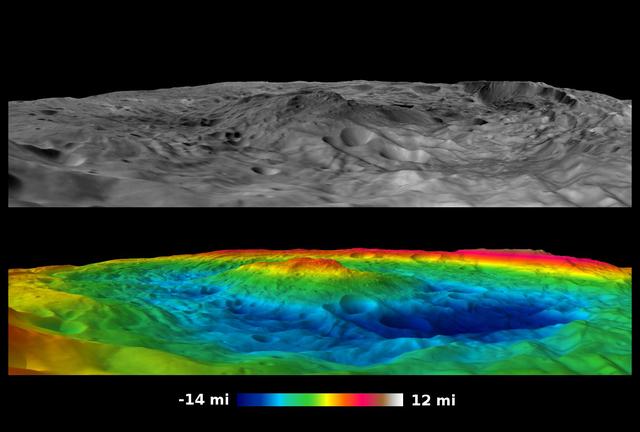
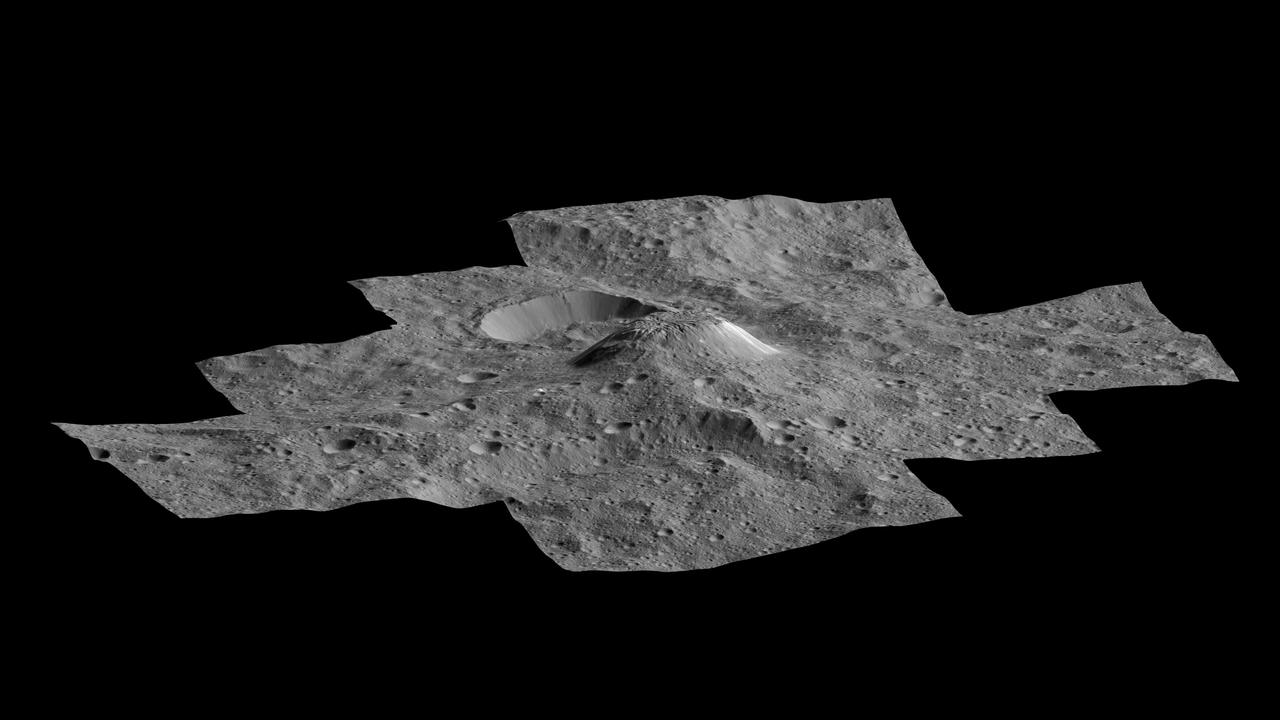
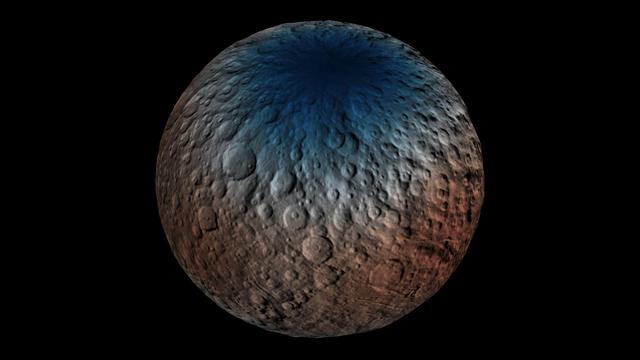
This view, made using images taken by NASA's Dawn spacecraft, features a tall conical mountain on Ceres. Elevations span a range of about 5 miles (8 kilometers) from the lowest places in this region to the highest terrains. Blue represents the lowest elevation, and brown is the highest. The white streaks seen running down the side of the mountain are especially bright parts of the surface. The image was generated using two components: images of the surface taken during Dawn's High Altitude Mapping Orbit (HAMO) phase, where it viewed the surface at a resolution of about 450 feet (140 meters) per pixel, and a shape model generated using images taken at varying sun and viewing angles during Dawn's lower-resolution Survey phase. The image of the region is color-coded according to elevation, and then draped over the shape model to give this view. http://photojournal.jpl.nasa.gov/catalog/PIA19976
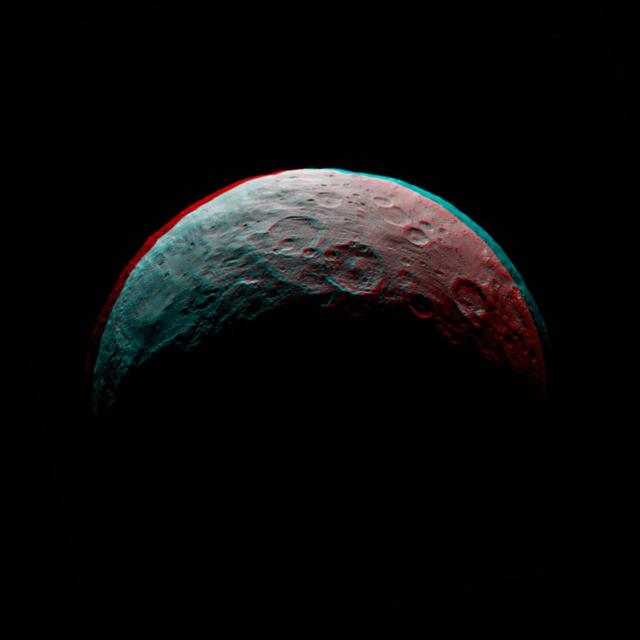
This anaglyph of Ceres is part of a sequence taken by NASA Dawn spacecraft April 24 to 26, 2015, from a distance of 8,500 miles 13,500 kilometers. http://photojournal.jpl.nasa.gov/catalog/PIA19539
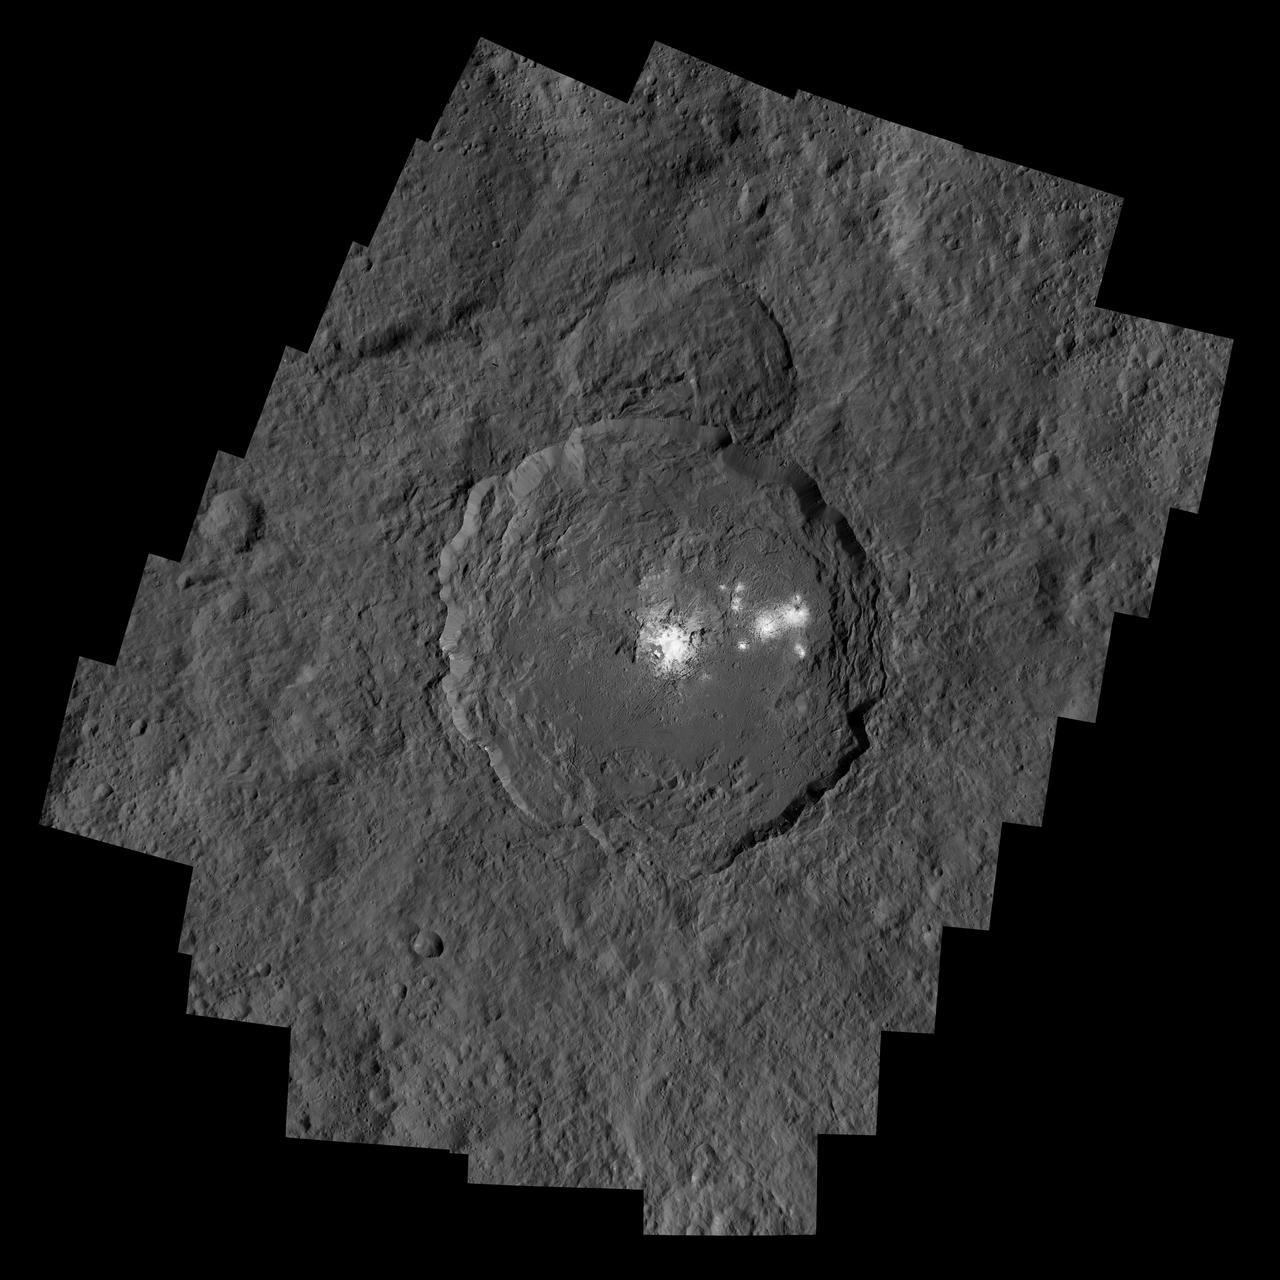
NASA Dawn spacecraft captured Occator Crater, containing the brightest area on Ceres; this closeup reveals a dome in a smooth-walled pit in the bright center of the crater.
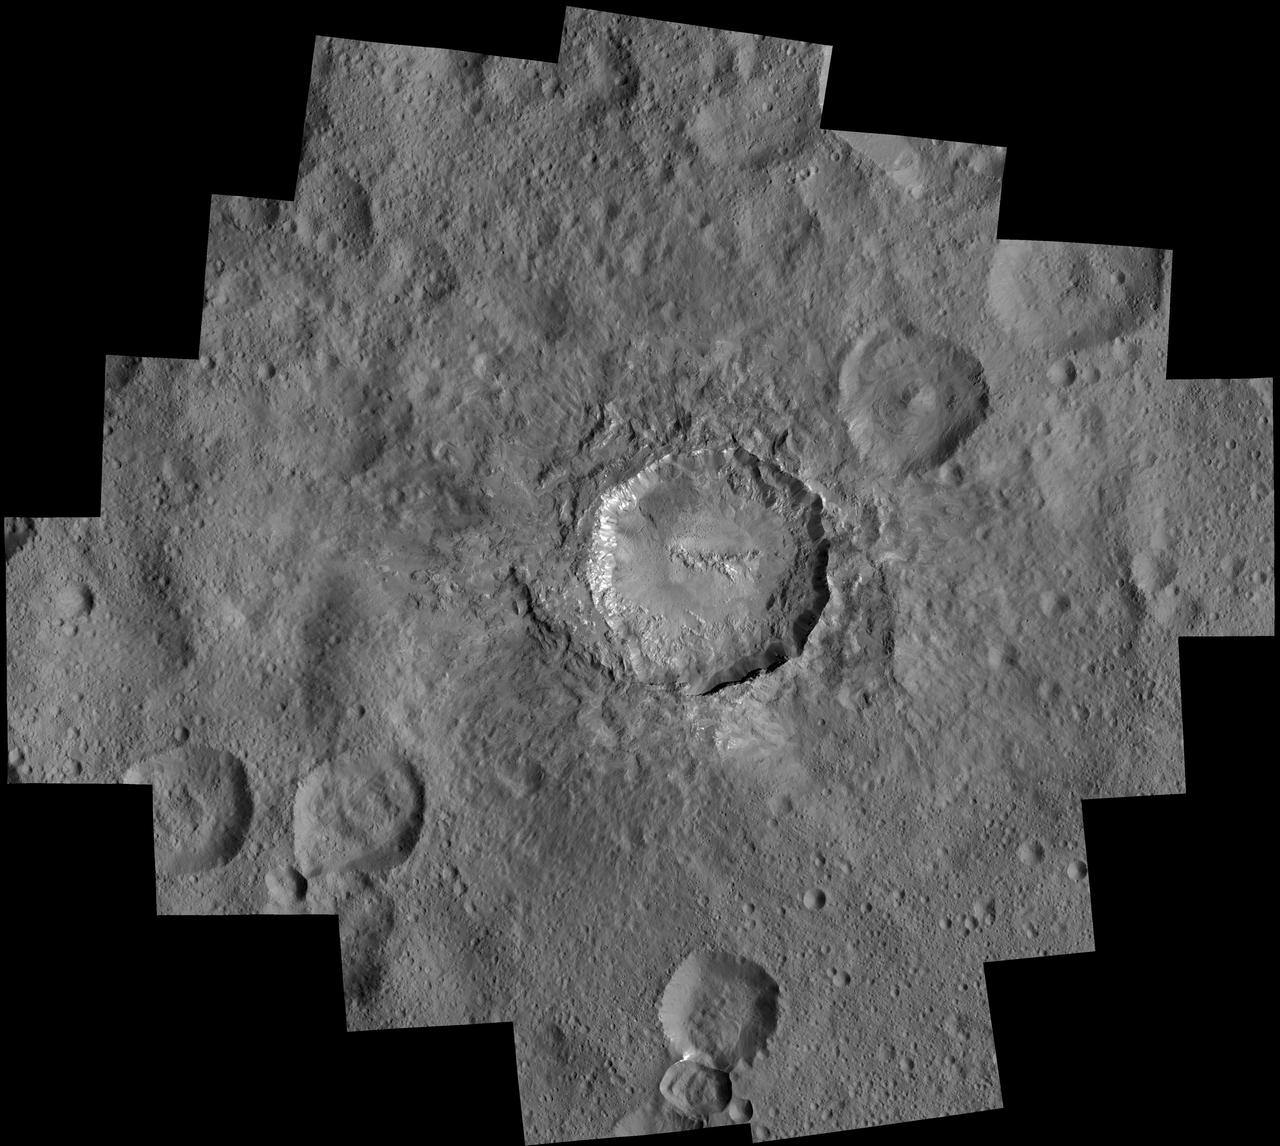
NASA Dawn spacecraft took images of Haulani Crater at a distance of 240 miles 385 kilometers from the surface of Ceres.
This image shows that NASA Dawn mission detected abundances of hydrogen in a wide swath around the equator of the giant asteroid Vesta. The hydrogen probably exists in the form of hydroxyl or water bound to minerals in Vesta surface.
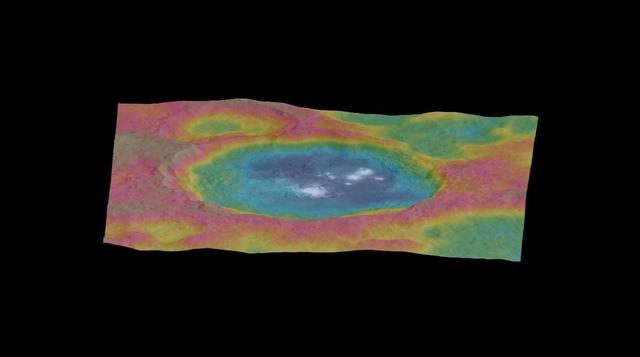
This still from an animation, made using images taken by NASA's Dawn spacecraft, features a color-coded topographic map of Occator crater on Ceres. Elevations span a range of about 4 miles (6 kilometers) from the lowest places in Occator to the highest terrains surrounding the crater. Blue is the lowest elevation, and brown is the highest. The animation was generated using two components: images of the surface taken during Dawn's High Altitude Mapping Orbit (HAMO) phase, where it viewed the surface at a resolution of about 450 feet (140 meters) per pixel, and a shape model generated using images taken at varying sun and viewing angles during Dawn's lower-resolution Survey phase. The shape model, which has been stretched by 1.5 times in the vertical direction to better illustrate the crater's topography. An animation is available is http://photojournal.jpl.nasa.gov/catalog/PIA19891
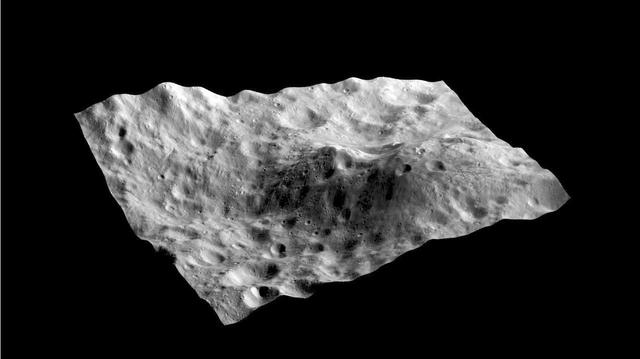
This image, from NASA Dawn spacecraft, shows rock material that has moved across the surface and flowed into a low area in the ridged floor of the Rheasilvia basin on asteroid Vesta.
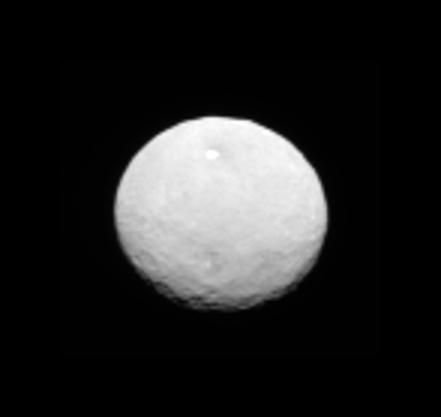
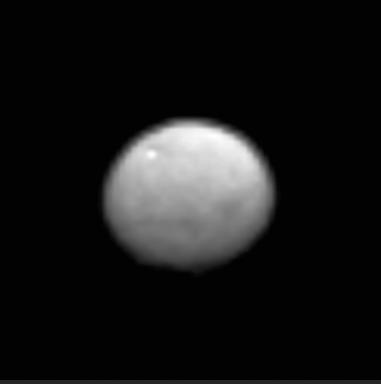
This is a frame from an animation showcasing a series of images NASA Dawn spacecraft took on approach to Ceres on Feb. 4, 2015 at a distance of about 90,000 miles 145,000 kilometers from the dwarf planet. http://photojournal.jpl.nasa.gov/catalog/PIA19182
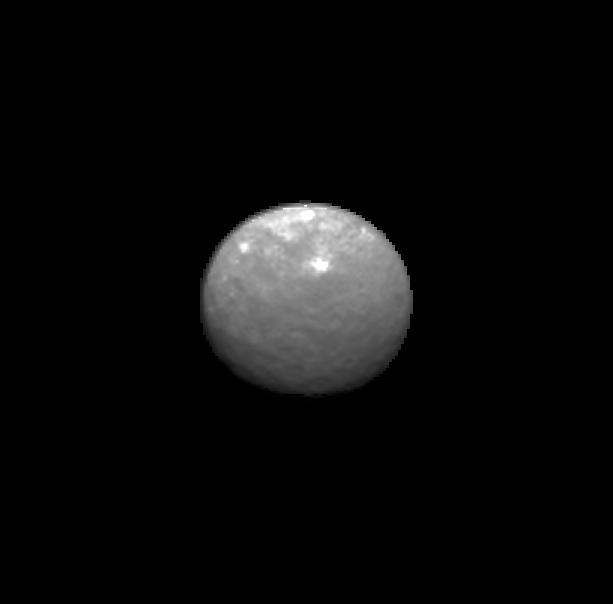
This still from an animation showcases a series of images NASA Dawn spacecraft took on approach to Ceres on Feb. 4, 2015 at a distance of about 90,000 miles 145,000 kilometers from the dwarf planet. http://photojournal.jpl.nasa.gov/catalog/PIA19179
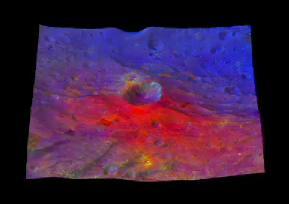
This image from NASA Dawn mission shows a 3-D, colorized rendering of Oppia Crater near the equator of the giant asteroid Vesta. Oppia is about 21 miles 34 kilometers across.
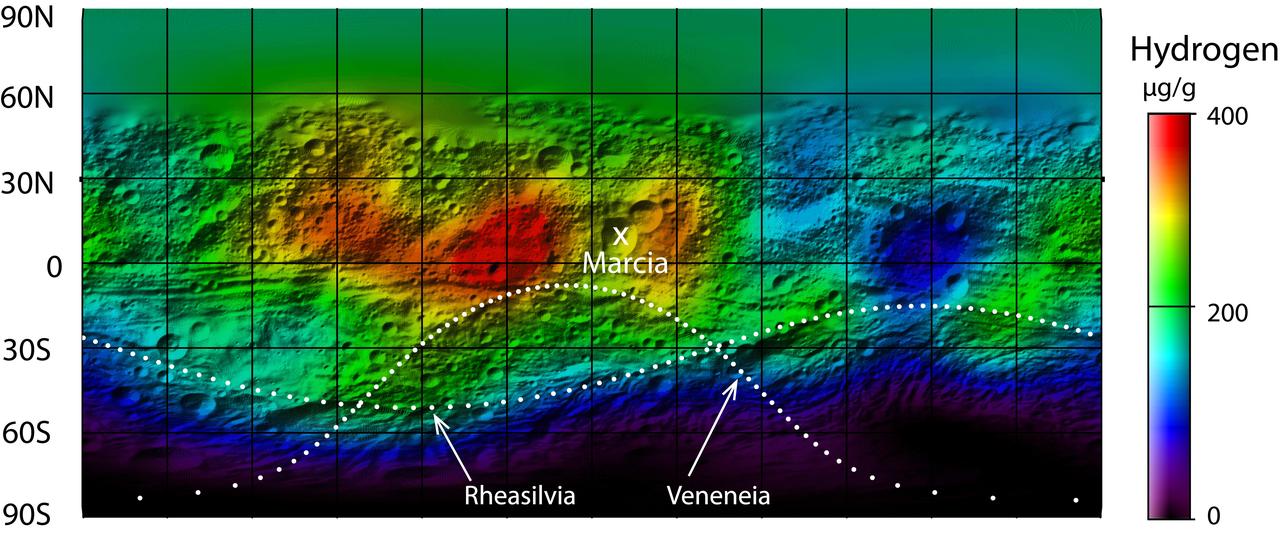
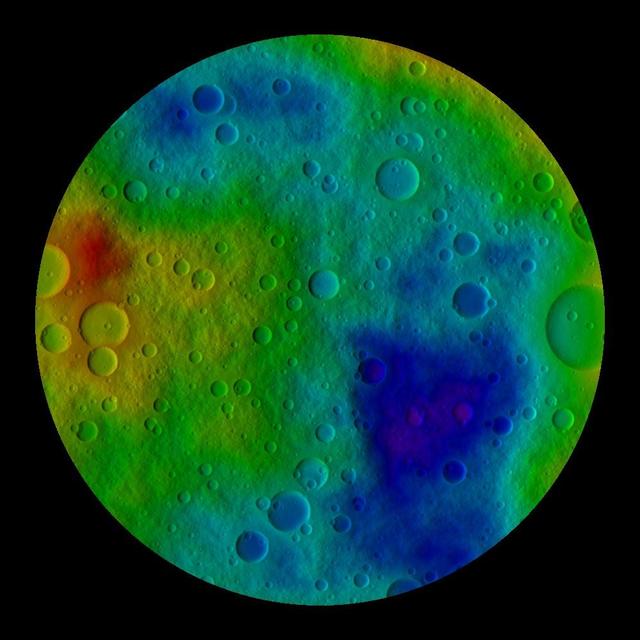
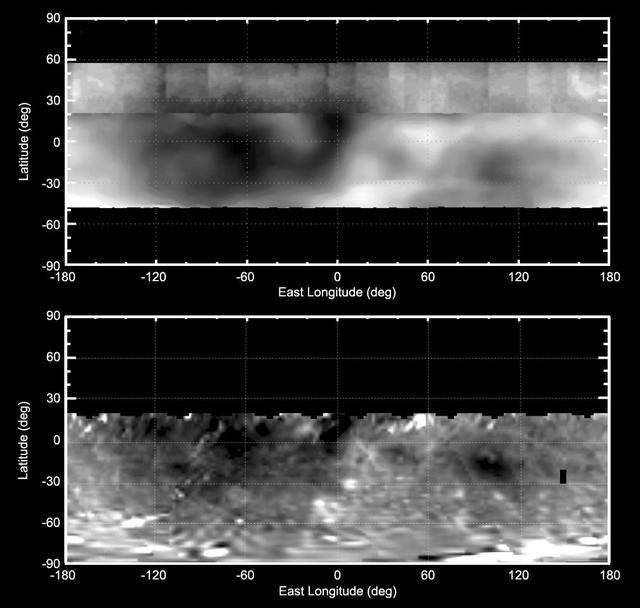
This map from NASA Dawn mission shows the global distribution of hydrogen on the surface of the giant asteroid Vesta.
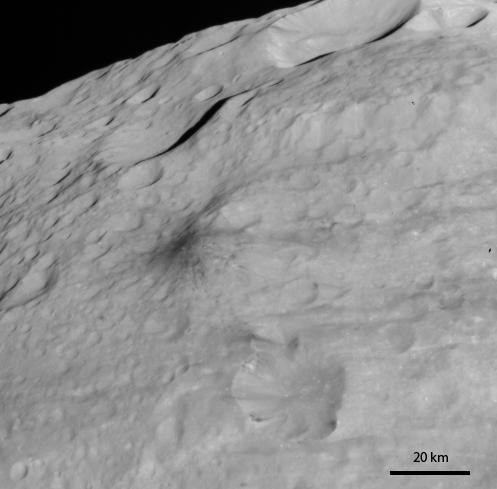
This still from a movie shows an image taken by NASA Dawn spacecraft layered on a digital terrain model of an unusual hill containing a dark-rayed impact crater and nearby dark deposit on asteroid Vesta.
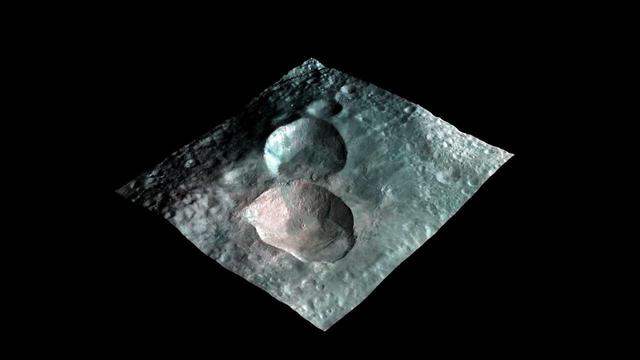
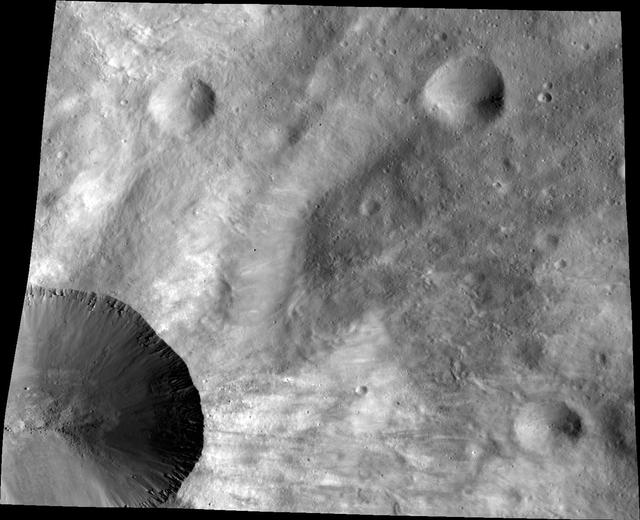
This image from NASA Dawn mission shows a 3-D rendering of the craters that make up the nowman feature on the giant asteroid Vesta. From left to right, the craters are named Marcia, Calpurnia, and Minucia.
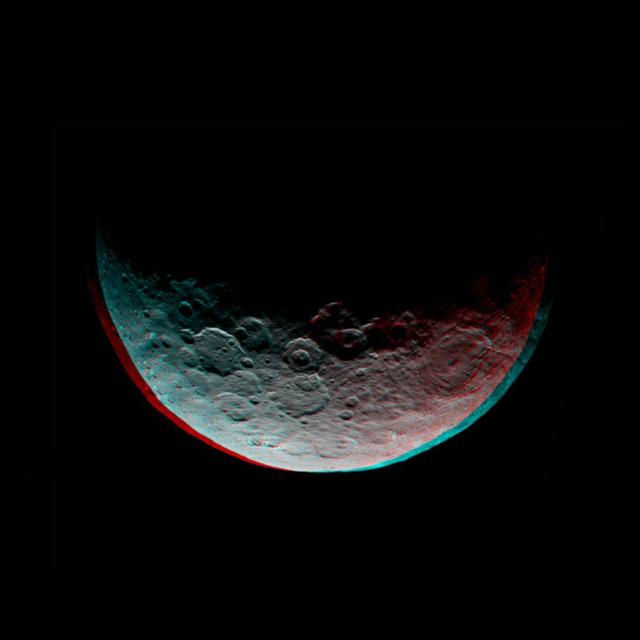
This anaglyph of Ceres is part of a sequence of images taken by NASA Dawn spacecraft April 24 to 26, 2015, from a distance of 8,500 miles 13,500 kilometers. 3-D glasses are needed to view this image. http://photojournal.jpl.nasa.gov/catalog/PIA19320
Scientists with NASA Dawn mission have created perspective views of the Rheasilvia impact basin on the giant asteroid Vesta. Rheasilvia is located in Vesta southern hemisphere.
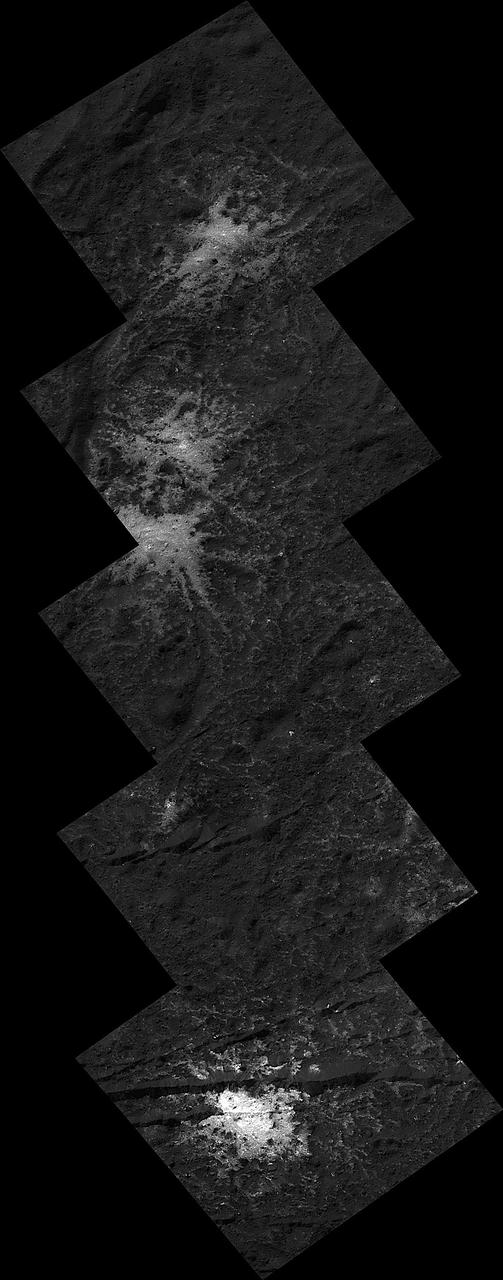
These "stars" found on the floor of Ceres' Occator Crater belong to the Vinalia Faculae. The faculae are deposits of salts, in particular sodium carbonate, possibly extruded through fractures connecting the surface to a deep reservoir of salty liquid. The images used in this montage were obtained by NASA's Dawn spacecraft in June 2018 from an altitude of about 21 miles (34 kilometers). NASA announced the conclusion of Dawn's mission operations was Oct. 31, 2018, when the spacecraft depleted its hydrazine. The center of this feature is located at about 20.2 degrees north latitude and 241.3 degrees east longitude, in the eastern part of Occator Crater. Occator Crater is named after the Roman agricultural deity of the harrowing, a helper of Ceres, the goddess of agriculture, grain crops, fertility and motherly relationships. https://photojournal.jpl.nasa.gov/catalog/PIA22980
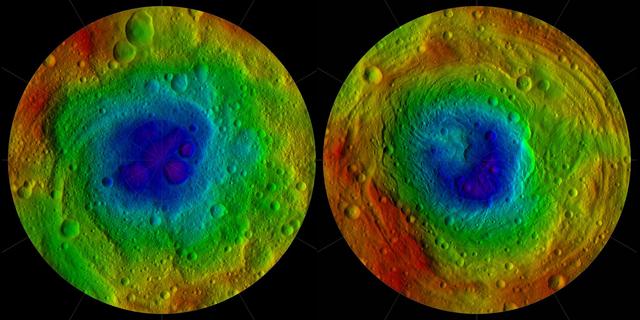
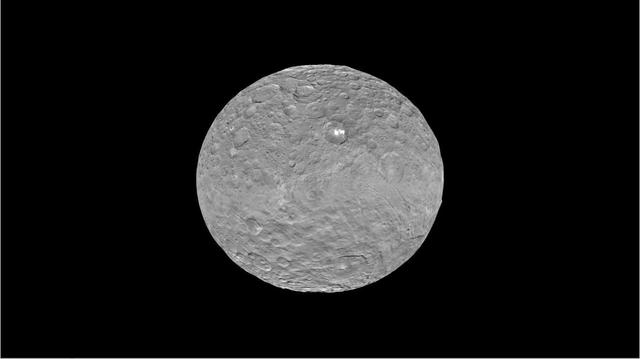
This frame from an animation shows a color-coded map from NASA Dawn mission revealing the highs and lows of topography on the surface of dwarf planet Ceres. The color scale extends 3.7 miles (6 kilometers) below the surface in purple to 3.7 miles (6 kilometers) above the surface in brown. The brightest features (those appearing nearly white) -- including the well-known bright spots within a crater in the northern hemisphere -- are simply reflective areas, and do not represent elevation. The topographic map was constructed from analyzing images from Dawn's framing camera taken from varying sun and viewing angles. The map was combined with an image mosaic of Ceres and projected onto a 3-D shape model of the dwarf planet to create the animation. http://photojournal.jpl.nasa.gov/catalog/PIA19605
This mosaic of the surface of asteroid Vesta was made from images obtained by NASA Dawn spacecraft while the area was entirely in the sun shadow. Light reflecting off of other areas of Vesta provides the only illumination.
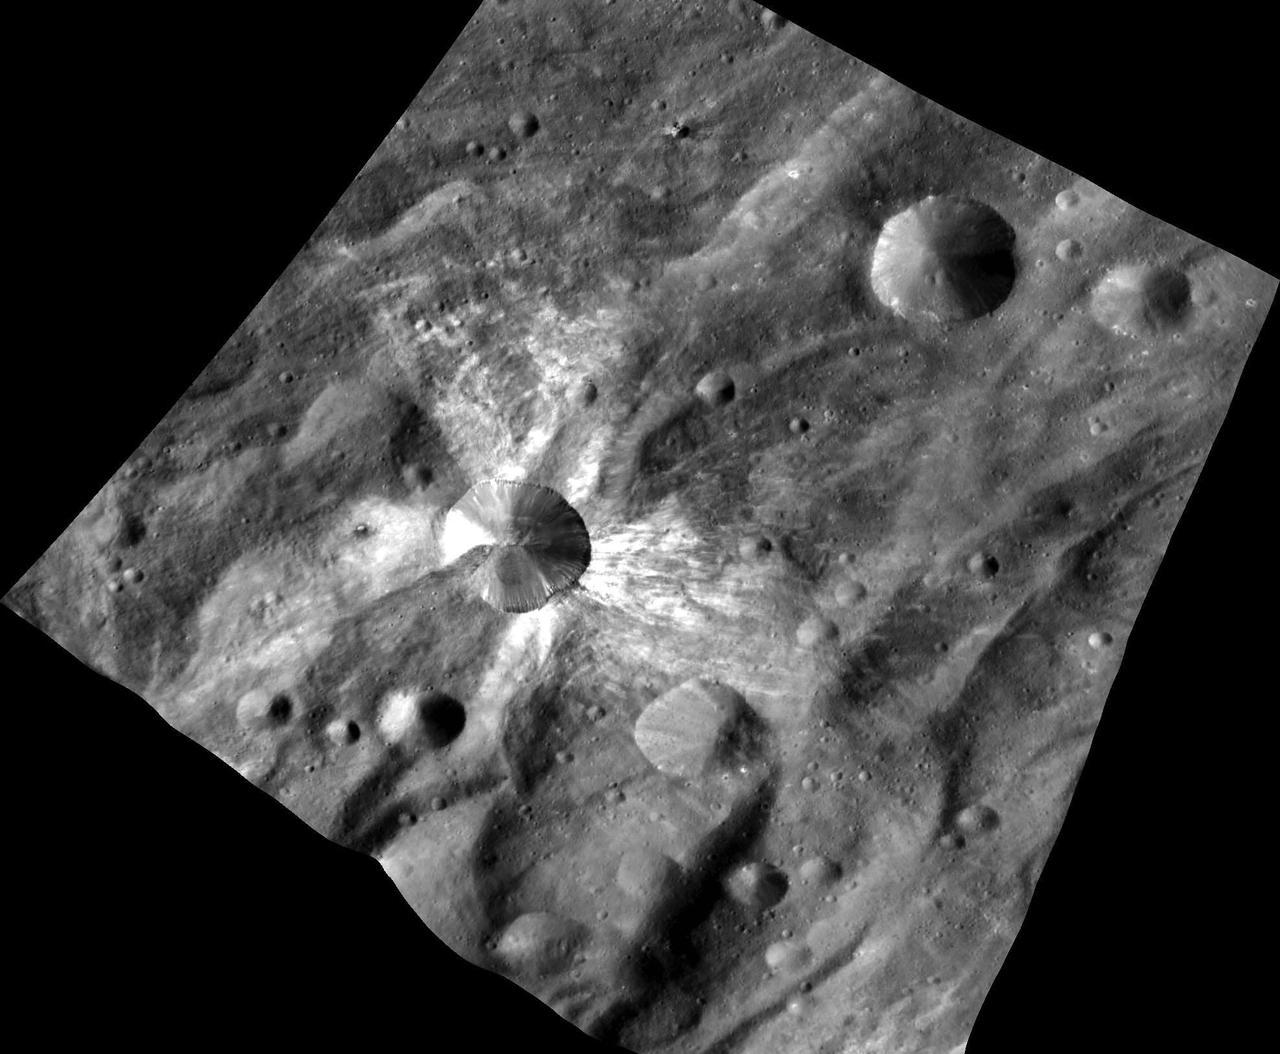
This image from NASA Dawn spacecraft features the distinctive crater Canuleia on the giant asteroid Vesta. Canuleia, about 6 miles 10 kilometers in diameter, is distinguished by the rays of bright material that streak out from it.
This side-perspective view of Ceres mysterious mountain Ahuna Mons was made with images from NASA Dawn spacecraft. Dawn took these images in December 2015.
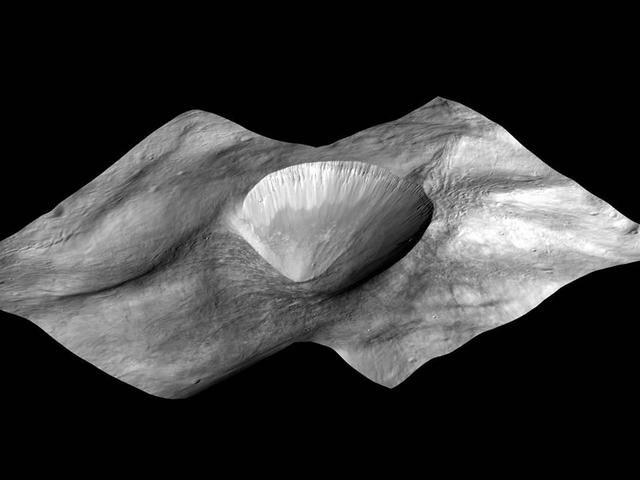
This image, made from data obtained by NASA Dawn spacecraft, shows a perspective view of a layered young crater in the Rheasilvia basin at asteroid Vesta.
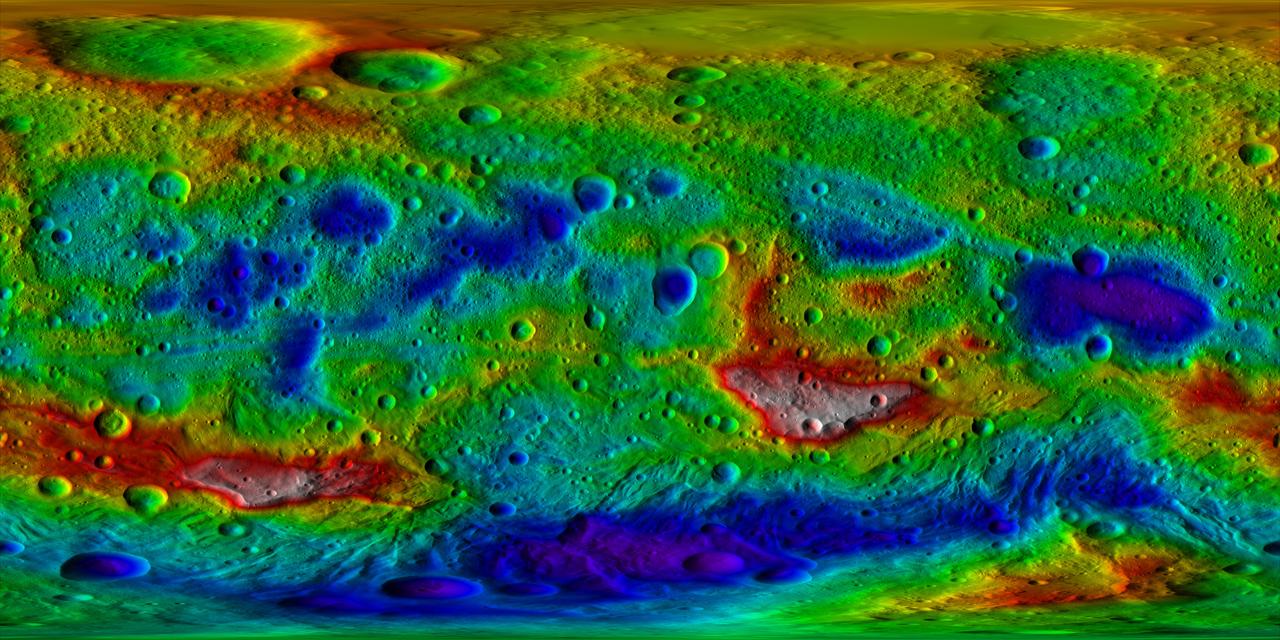
This color-coded topography map from NASA Dawn mission shows the giant asteroid Vesta in an equirectangular projection at 32 pixels per degree, relative to an ellipsoid of 177 miles by 177 miles by 142 miles.

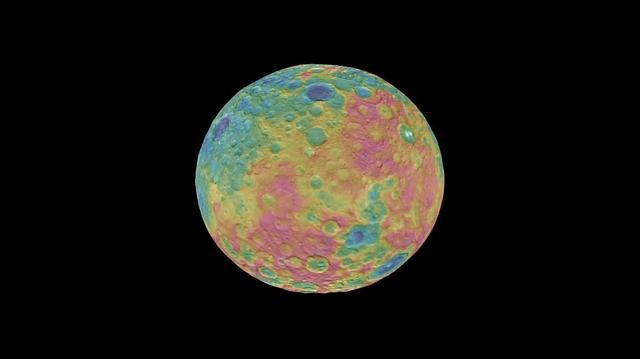
This map from NASA's Dawn mission shows locations of bright material on dwarf planet Ceres. There are more than 300 bright areas, called "faculae," on Ceres. Scientists have divided them into four categories: bright areas on the floors of crater (red), on the rims or walls of craters (green), in the ejecta blankets of craters (blue), and on the flanks of the mountain Ahuna Mons (yellow). https://photojournal.jpl.nasa.gov/catalog/PIA21914
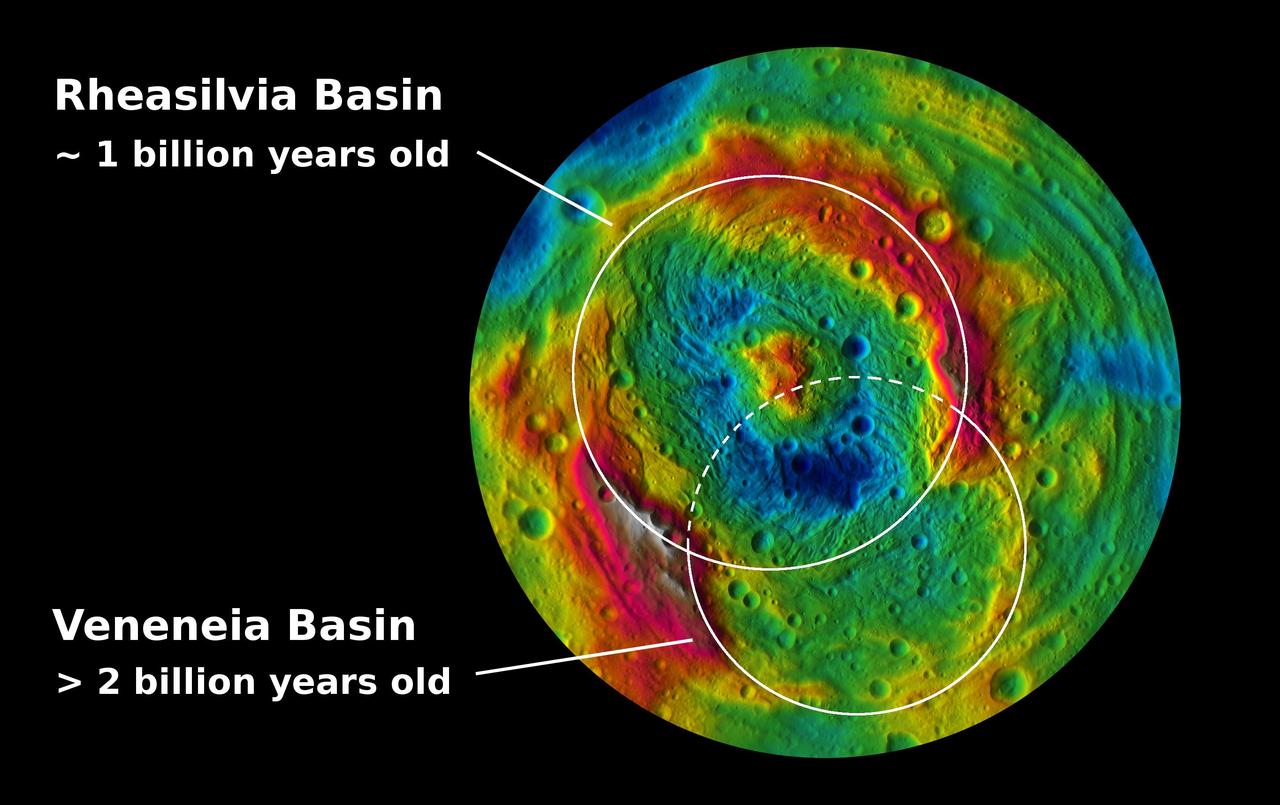
This topographic map from NASA Dawn mission shows the two large impact basins in the southern hemisphere of the giant asteroid Vesta.
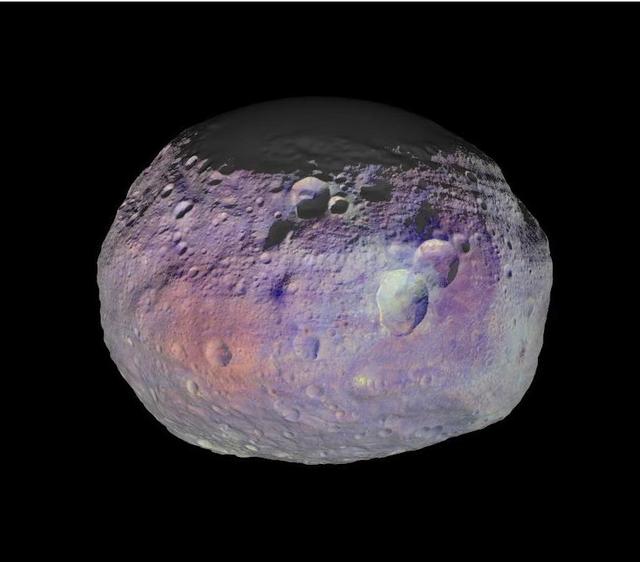
This image of asteroid Vesta is one of many images taken by NASA Dawn spacecraft to create an animation showing the diversity of minerals through color representation.
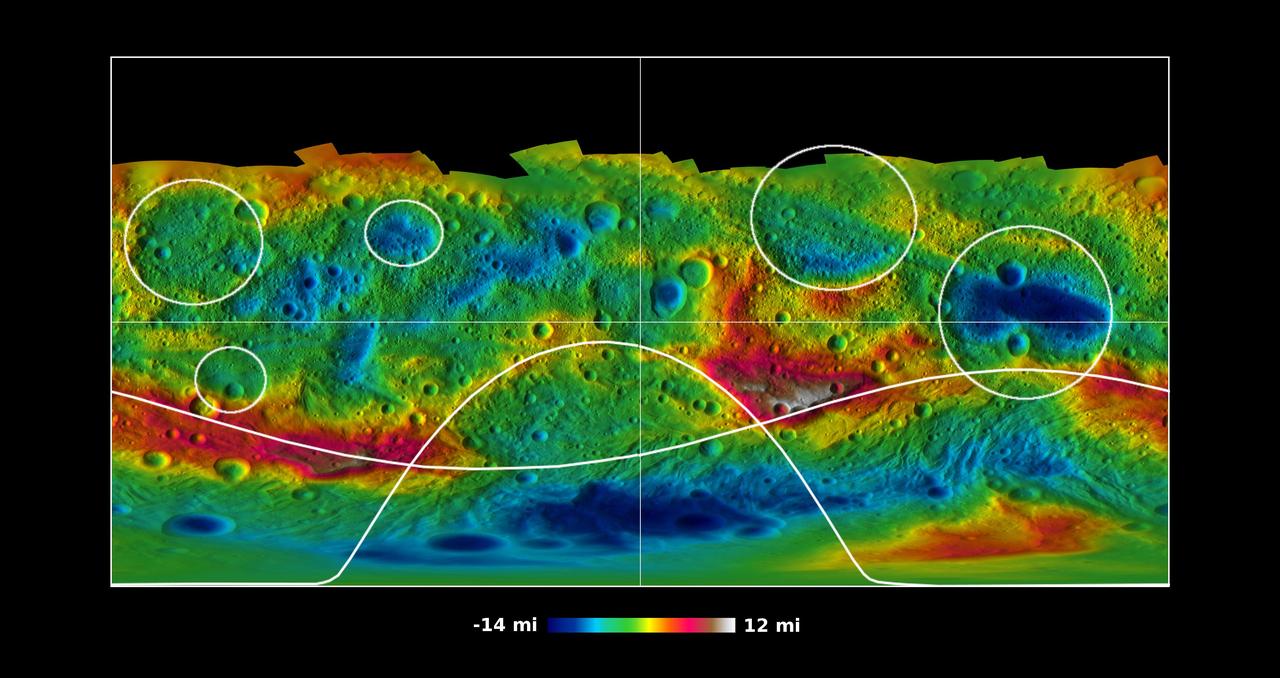
This global map from NASA Dawn mission shows the topography of the giant asteroid Vesta, with the seven most prominent impact basins highlighted.
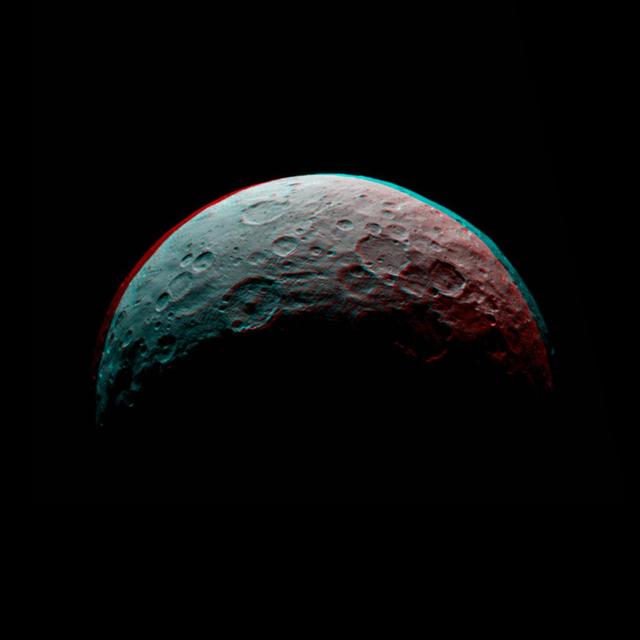
This image of Ceres is part of a sequence taken by NASA Dawn spacecraft April 24 to 26, 2015, from a distance of 8,500 miles 13,500 kilometers. You need 3-D glasses to view this image. http://photojournal.jpl.nasa.gov/catalog/PIA19537
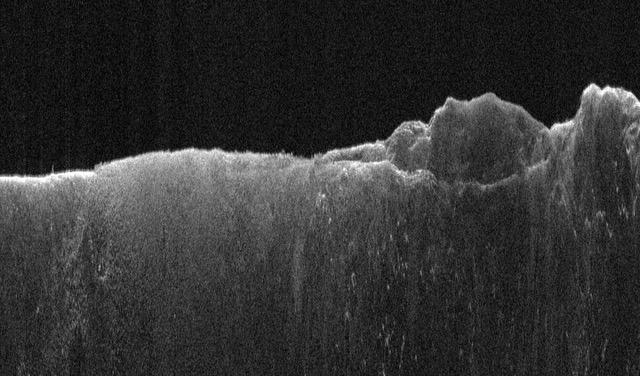
This radargram shows data collected by the Shallow Radar, or SHARAD, on NASA's Mars Reconnaissance Orbiter (MRO) on May 2, 2023, as it performed a 120-degree roll maneuver called a "very large roll" over a formation named Medusae Fossae. Scientists used SHARAD to look for ice beneath the surface of this region. Designed to peer from about a half-mile to a little over a mile (1 to 2 kilometers) below ground, SHARAD emits radio waves that are reflected off materials in the subsurface, measuring how long it takes for those waves to bounce back to the instrument. The longer it takes, the deeper the subsurface layer is. Because different materials reflect radio waves differently, SHARAD allows scientists to distinguish between rock, sand, and ice. While MRO often performs a standard 28-degree roll to give SHARAD's antenna a more direct view of Martian terrain, the 120-degree very large roll rotates the antenna even farther, providing its radio waves an unobstructed path to the surface. This boosts the radar's signals by 10 times or more, giving SHARAD a clearer, deeper view of the Martian underground than ever before. Scientists hope the very large rolls will help them look for frozen and liquid water, among other things. https://photojournal.jpl.nasa.gov/catalog/PIA26555
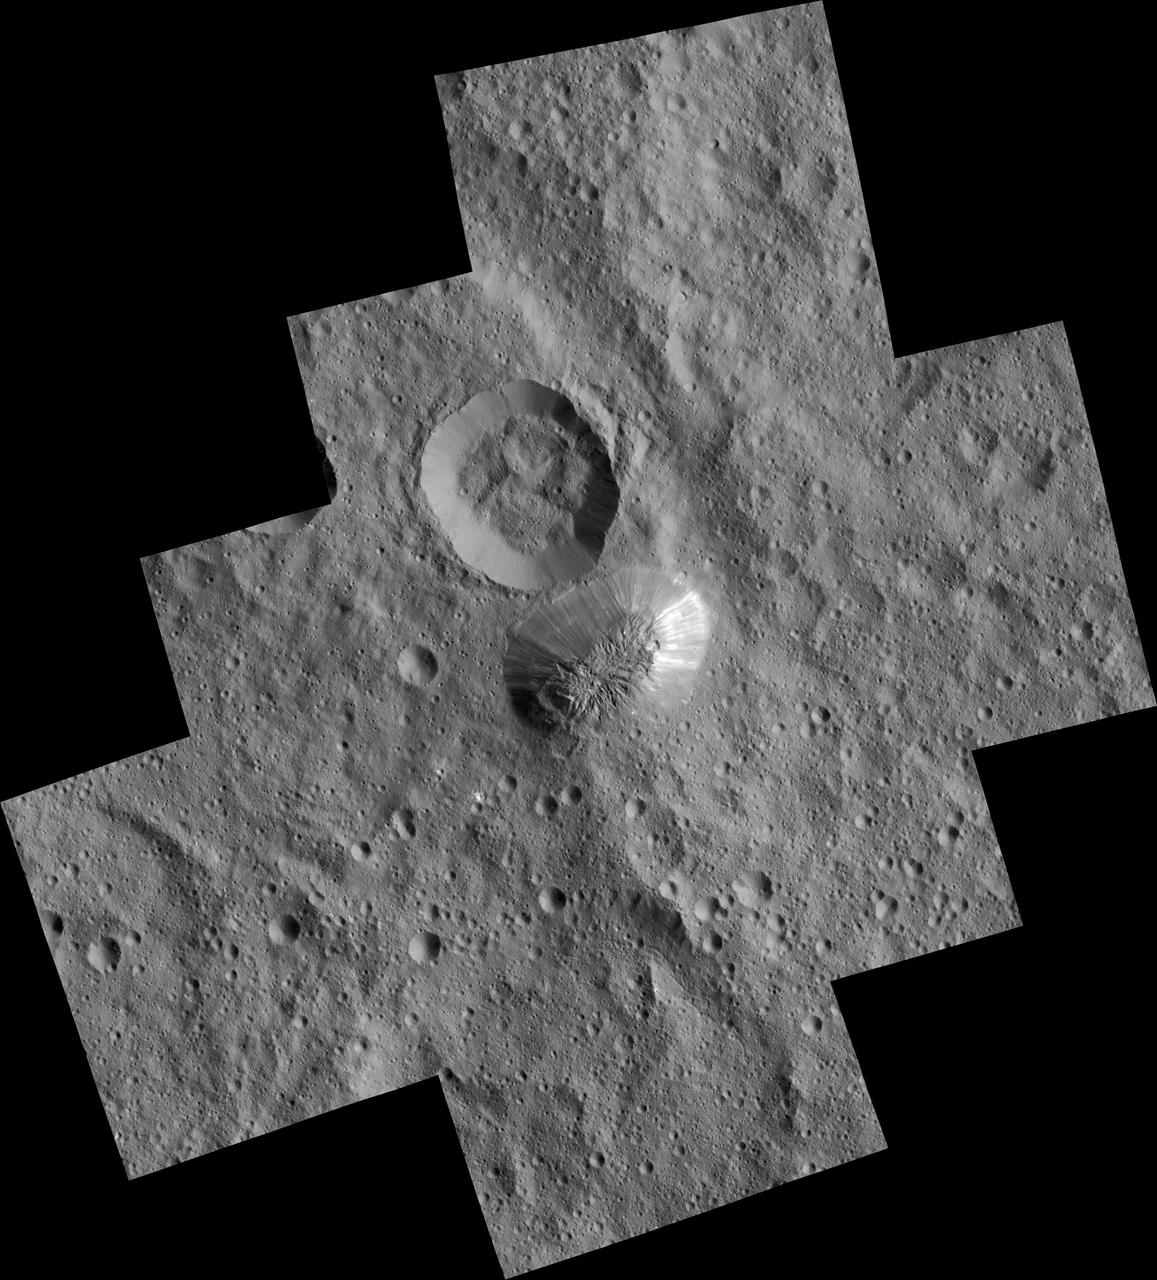
Ceres mysterious mountain Ahuna Mons is seen in this mosaic of images from NASA Dawn spacecraft, taken in December 2015.
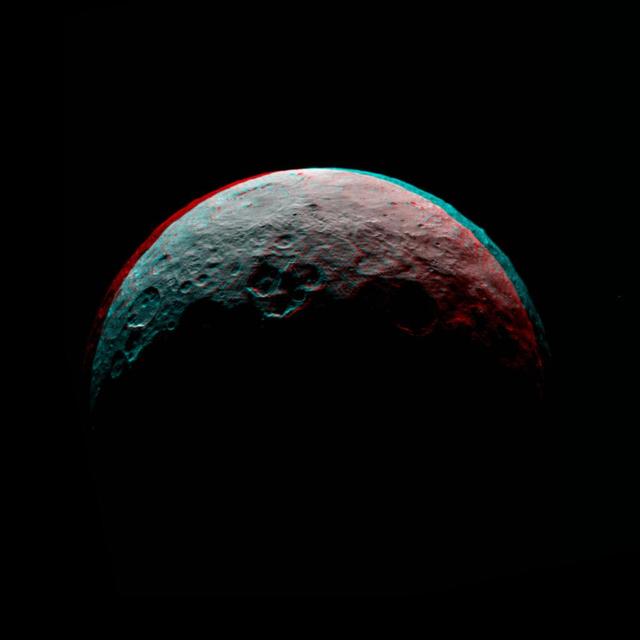
This anaglyph of Ceres is part of a sequence of images taken by NASA Dawn spacecraft April 24 to 26, 2015, from a distance of 8,500 miles 13,500 kilometers. http://photojournal.jpl.nasa.gov/catalog/PIA19540
This image from NASA Dawn mission shows the topography of the northern and southern hemispheres of the giant asteroid Vesta, updated with pictures obtained during Dawn last look back.
This frame from an animation comes from NASA Dawn spacecraft as it observed Ceres for an hour on Jan. 13, 2015, from a distance of 238,000 miles 383,000 kilometers. http://photojournal.jpl.nasa.gov/catalog/PIA19168
Ceres Haulani Crater is shown in these views from NASA Dawn spacecraft. These views reveal variations in the region brightness, mineralogy and temperature at infrared wavelengths.
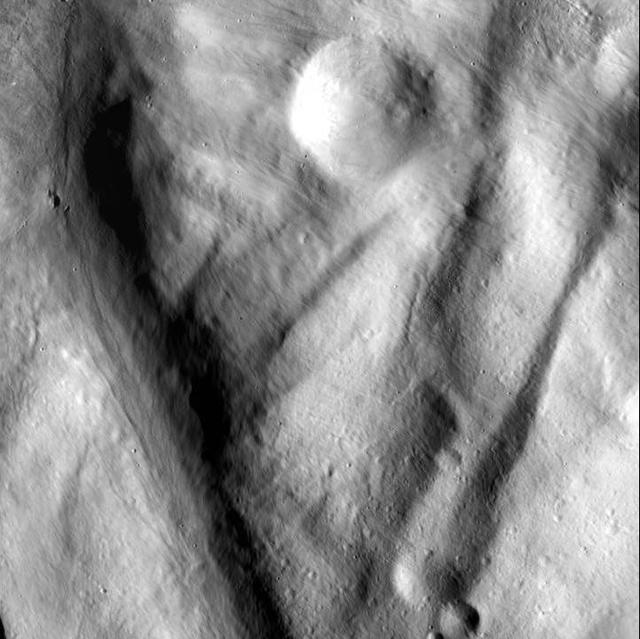
This image from NASA Dawn spacecraft shows an interior wall and southern terrace of Marcia crater on Vesta. Relatively smooth material covers much of the terrace and has flowed downslope toward the top of the image through channels.
This image from NASA Dawn spacecraft shows a close up of part of the rim around the crater Canuleia on the giant asteroid Vesta. Canuleia, about 6 miles 10 kilometers in diameter, is the large crater at the bottom-left of this image.
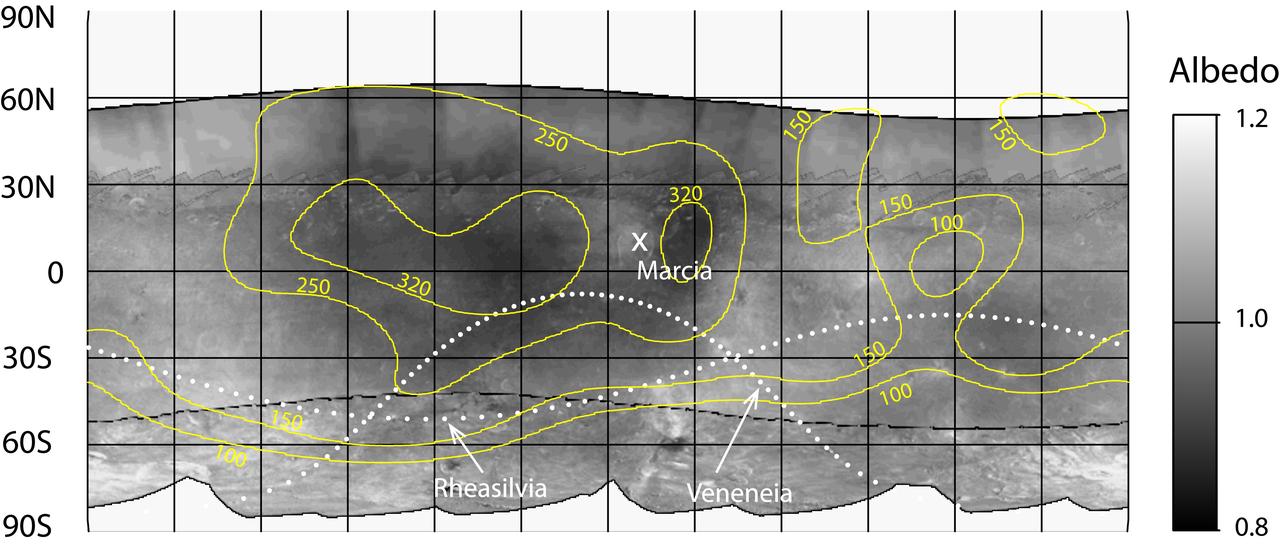
Hydrogen is most abundant in areas with low reflectivity, or albedo, on the giant asteroid Vesta, as shown in this contour map from NASA Dawn mission.
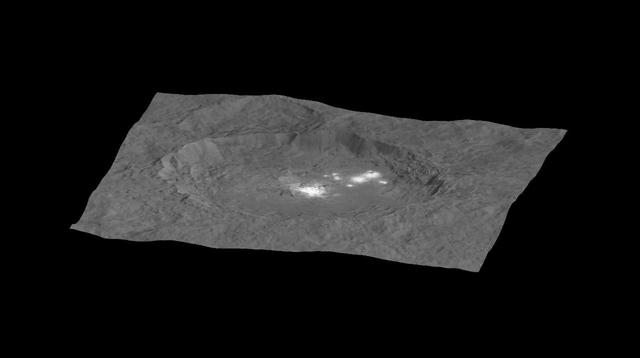
This still from an animation, made using images taken by NASA's Dawn spacecraft, shows Occator crater on Ceres, home to a collection of intriguing bright spots. The animation was generated using two components: images taken during Dawn's High Altitude Mapping Orbit (HAMO) phase, where it viewed the surface at a resolution of about 450 feet (140 meters) per pixel, and a shape model generated using images that were taken during Dawn's lower-resolution Survey phase. The image is draped over the shape model, which has been stretched by 1.5 times in the vertical direction to better illustrate the crater's topography. Elevations span a range of about 4 miles (6 kilometers) from the lowest places in Occator to the highest terrains surrounding the crater. The bright spots are much brighter than the rest of the surface, and tend to appear overexposed in most images. The image used here is a composite of two images of Occator: one using a short exposure that captures the detail in the bright spots, and one where the background surface is captured at normal exposure. http://photojournal.jpl.nasa.gov/catalog/PIA19890
NASA Dawn spacecraft obtained this image of the surface of asteroid Vesta with its framing camera on August 12, 2011. This image was taken through the framing camera clear filter. The image has a resolution of about 260 meters per pixel.
NASA Dawn spacecraft shows Oxo Crater is unique because of the relatively large lump in its crater rim.
These two maps of the giant asteroid Vesta show patterns of brightness from NASA Hubble Space Telescope top and NASA Dawn spacecraft bottom. Hubble view is from an orbit around Earth. Dawn went into orbit around Vesta from 2011 to 2012.
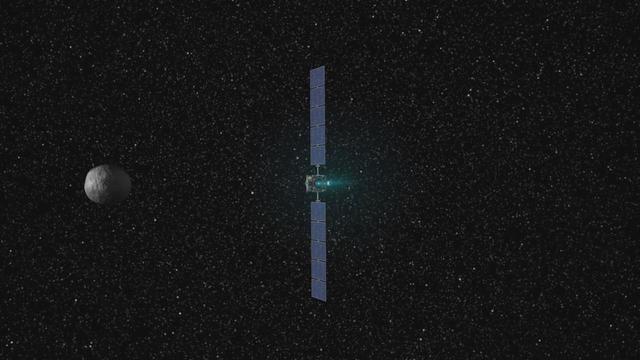
This frame from a movie presents a series of animations showing NASA Dawn spacecraft traveling to and operating at the giant asteroid Vesta.
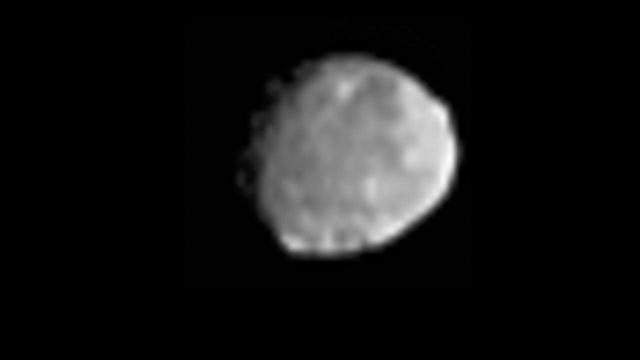
This image shows NASA Dawn view of Vesta from June 20, 2011, when the approaching spacecraft was about 117,000 miles 189,000 kilometers away from the body.
This frame from a video shows the bright spots in Occator crater on dwarf planet Ceres, generated from data from NASA Dawn spacecraft. The global view uses data collected by NASA's Dawn mission in April and May 2015. The highest-resolution parts of the map have a resolution of 1,600 feet (480 meters) per pixel. The second portion of the video shows the bright spots in Occator crater, which is about 60 miles (90 kilometers) across and 2 miles (4 kilometers) deep. Vertical relief has been exaggerated by a factor of five. Exaggerating the relief helps scientists understand and visualize the topography more easily, and highlights features that are sometimes subtle. The third portion of the video shows a mountain about 4 miles (6 kilometers) high, which is roughly the elevation of Mount McKinley in Alaska's Denali National Park. Vertical relief has been exaggerated by a factor of five. Exaggerating the relief helps scientists understand and visualize the topography much more easily, and highlights features that are sometimes subtle. The fourth section of the video shows the global view from the first section in 3-D view. A pair of 3-D glasses reveals striking detail in the topography of the dwarf planet. http://photojournal.jpl.nasa.gov/catalog/PIA19619