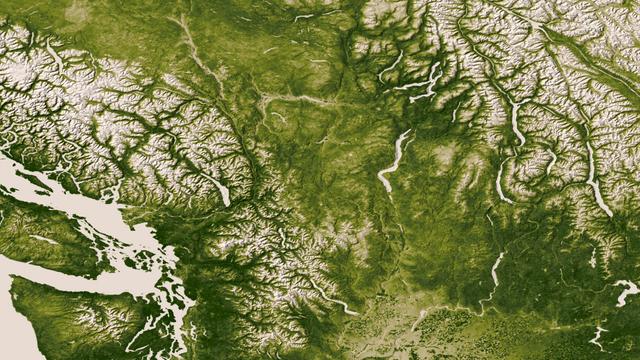
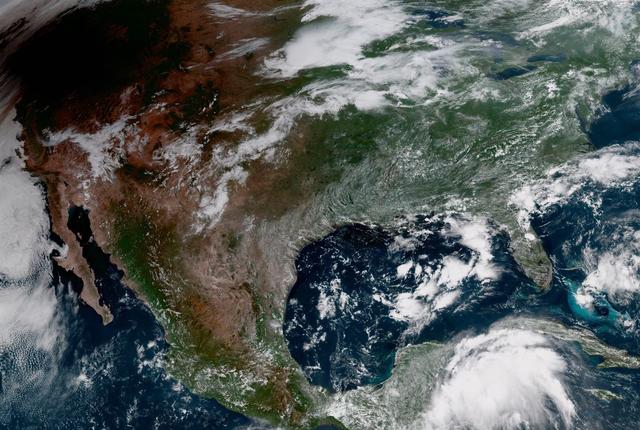
The Rocky, Cascade, and Coast Mountain Ranges dominate the landscape of the Pacific Northwest in this image created June 11-17, 2012 from the Visible-Infrared Imager/Radiometer Suite (VIIRS) instrument aboard the Suomi National Polar-orbiting Partnership or Suomi NPP satellite, a partnership between NASA and the National Oceanic and Atmospheric Administration, or NOAA. Potato and other agriculture can be seen in the bottom center of the image, as the Rockies transition to the plains of Idaho. High values of Normalized Difference Vegetation Index, or NDVI, represent dense green functioning vegetation and low NDVI values represent sparse green vegetation or vegetation under stress from limiting conditions, such as drought. Credit: NASA/NOAA To read more go to: <a href="http://www.nasa.gov/mission_pages/NPP/news/vegetation.html" rel="nofollow">www.nasa.gov/mission_pages/NPP/news/vegetation.html</a> <b><a href="http://www.nasa.gov/audience/formedia/features/MP_Photo_Guidelines.html" rel="nofollow">NASA image use policy.</a></b> <b><a href="http://www.nasa.gov/centers/goddard/home/index.html" rel="nofollow">NASA Goddard Space Flight Center</a></b> enables NASA’s mission through four scientific endeavors: Earth Science, Heliophysics, Solar System Exploration, and Astrophysics. Goddard plays a leading role in NASA’s accomplishments by contributing compelling scientific knowledge to advance the Agency’s mission. <b>Follow us on <a href="http://twitter.com/NASA_GoddardPix" rel="nofollow">Twitter</a></b> <b>Like us on <a href="http://www.facebook.com/pages/Greenbelt-MD/NASA-Goddard/395013845897?ref=tsd" rel="nofollow">Facebook</a></b> <b>Find us on <a href="http://instagram.com/nasagoddard?vm=grid" rel="nofollow">Instagram</a></b>

jsc2022e042488 (4/20/2022) --- A closeup of Pacific Northwest National Laboratory (PNNL) staff technician Yuliya Farris preparing sterile spaces used to hold soil in place during Dynamics of the Microbiome in Space (DynaMoS). Image courtesy of the Pacific Northwest National Laboratory.

jsc2022e042490 (9/24/2021) --- Preflight image of a rack of tubes containing different cultures of bacteria to be added to sterile soil. The Dynamics of the Microbiome in Space (DynaMoS) investigation. Image courtesy of the Pacific Northwest National Laboratory.
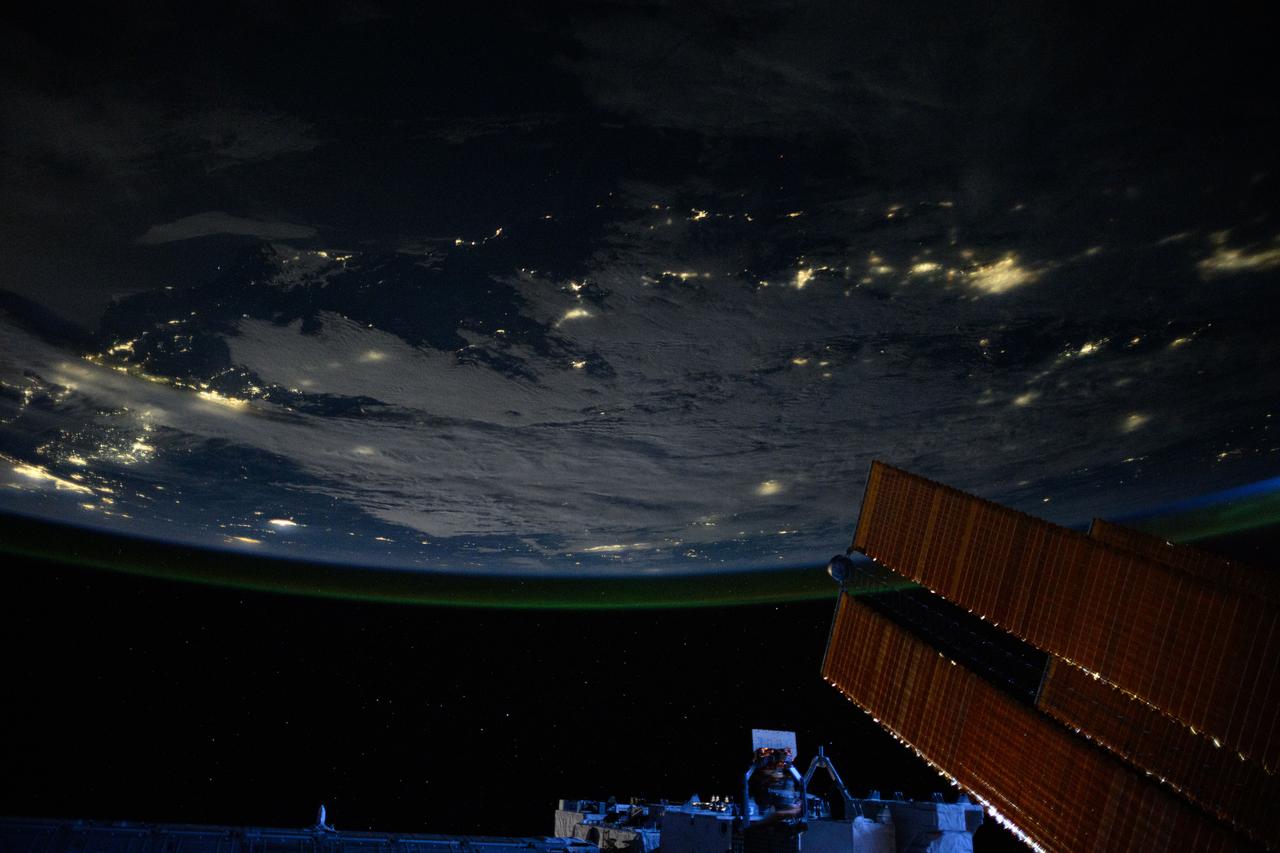
iss073e0088323 (May 16, 2025) --- City lights dot the Pacific Northwest region of North America at approximately 2:50 a.m. local time in this photograph from the International Space Station as it orbited 261 miles above the Pacific Ocean. In the lower right foreground, is a set of the orbital outpost's main solar arrays.
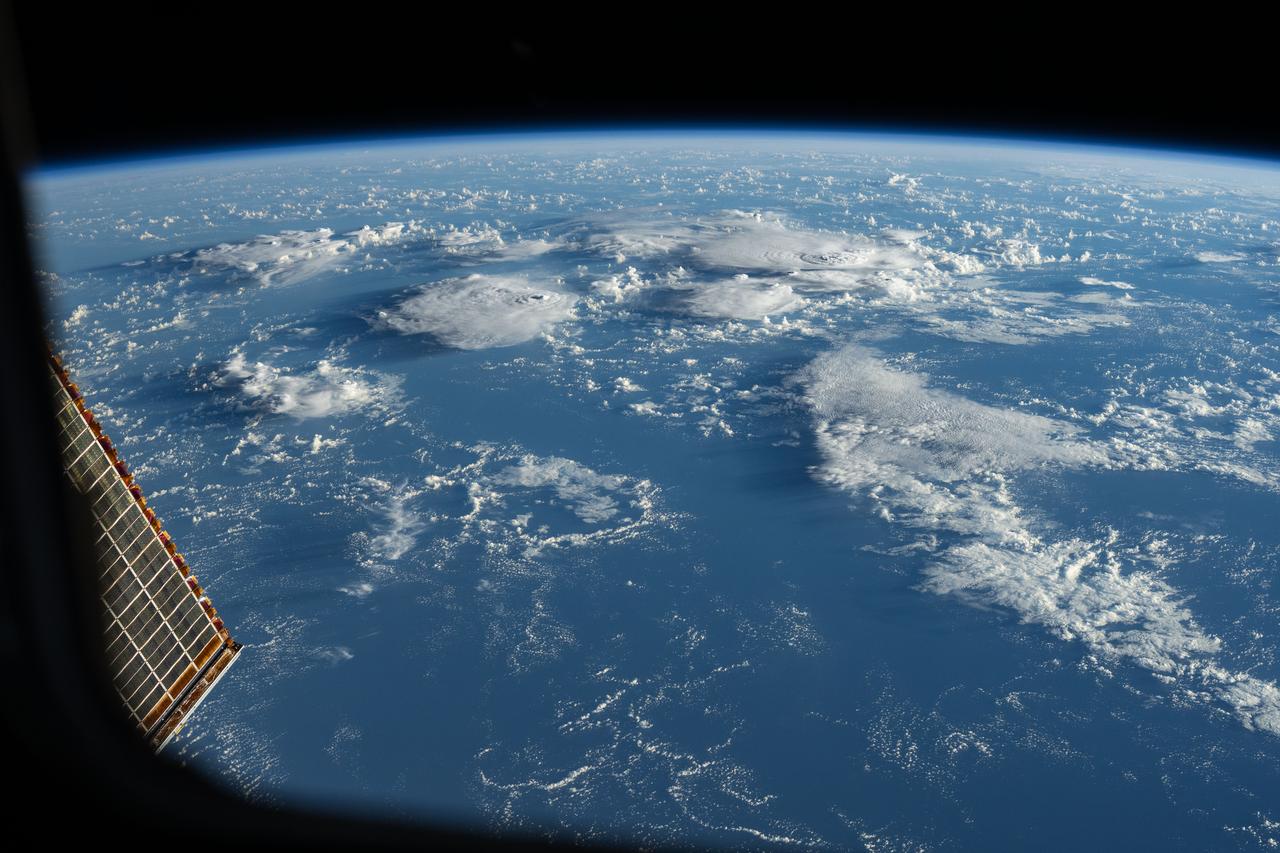
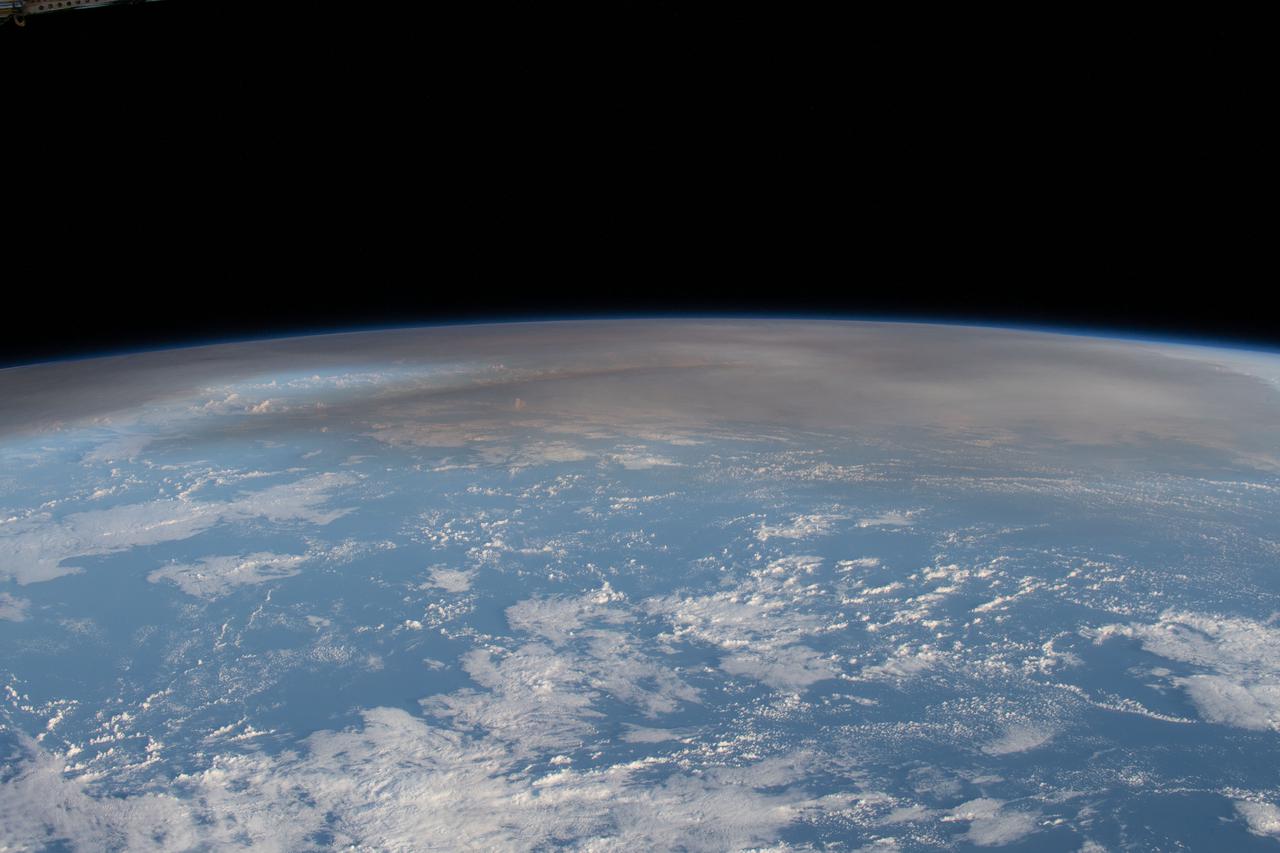
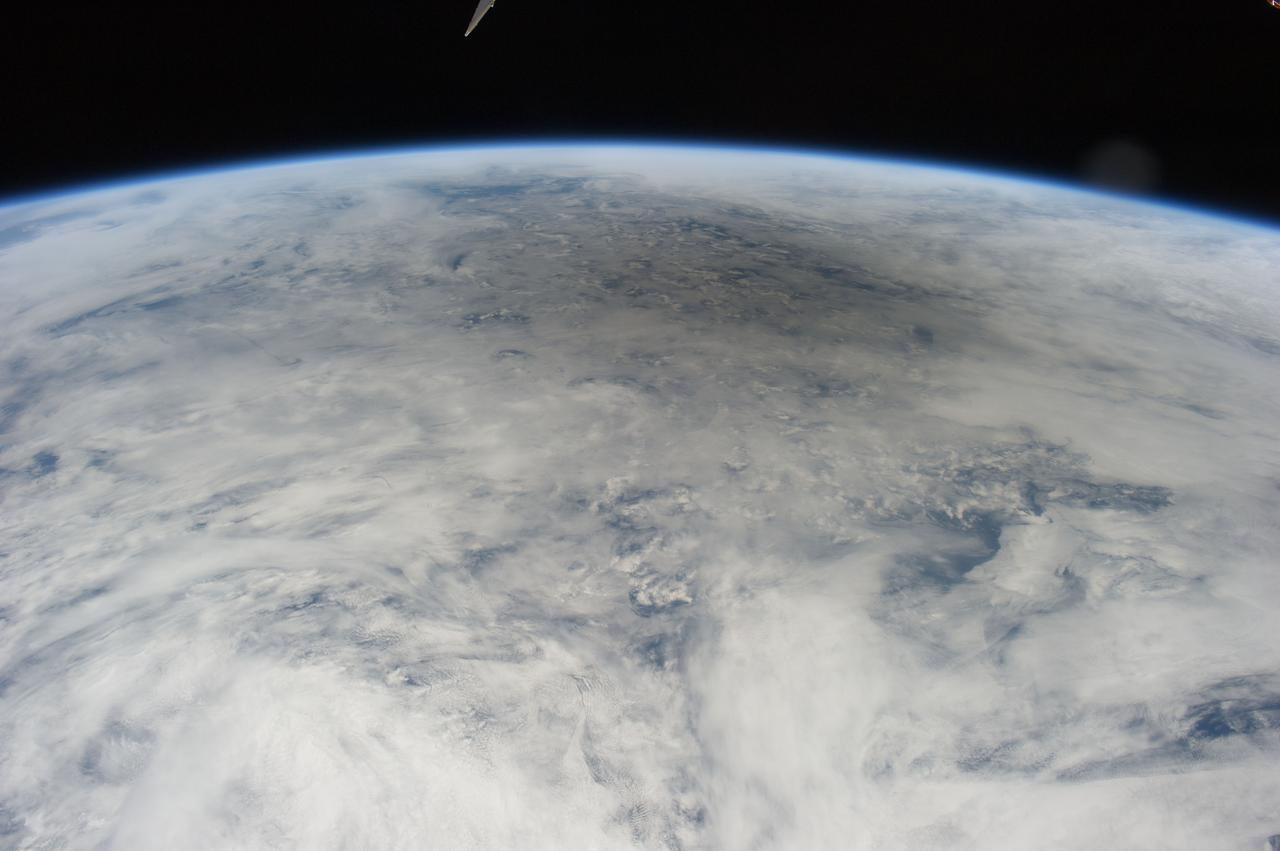
iss072e617674 (Feb. 1, 2025) --- Storm clouds rise above the South Pacific Ocean northwest of New Zealand in this photograph from the International Space Station as it orbited 264 miles above.

jsc2022e042489 (9/23/2021) --- Preflight image of a rack of tubes containing soil samples that have been inoculated with a model soil consortium for the Dynamics of the Microbiome in Space (DynaMoS) investigation, examines how microgravity affects metabolic interactions in communities of soil microbes. Image courtesy of the Pacific Northwest National Laboratory.
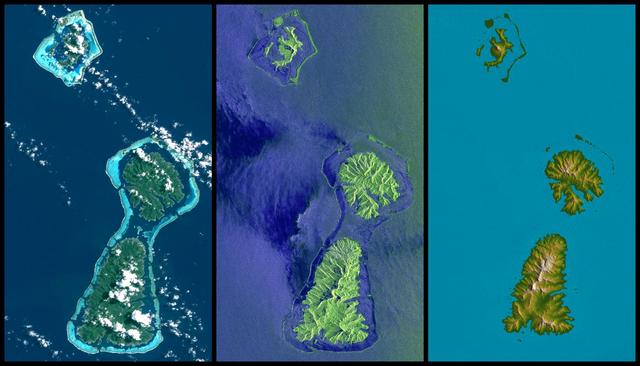
Bora Bora, Tahaa, and Raiatea top to bottom are Polynesian Islands about 220 kilometers 135 miles west-northwest of Tahiti in the South Pacific.
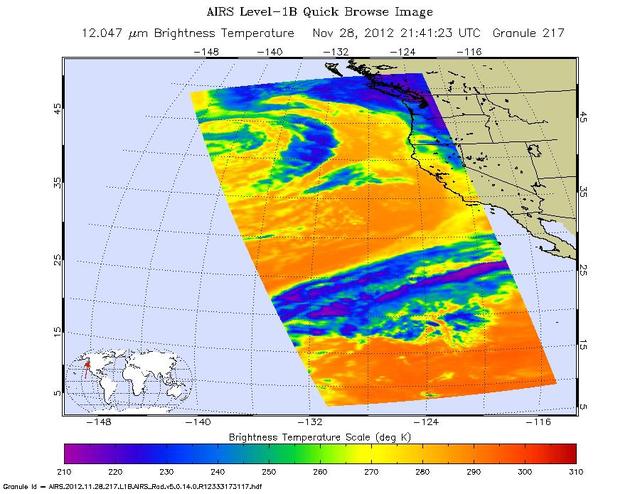
NASA Aqua spacecraft captured this infrared image of the first of a series of storms approaching the Pacific Northwest at 2141 UTC 1:41 p.m. PST on Nov. 28, 2012, marking the beginning of an atmospheric river event.
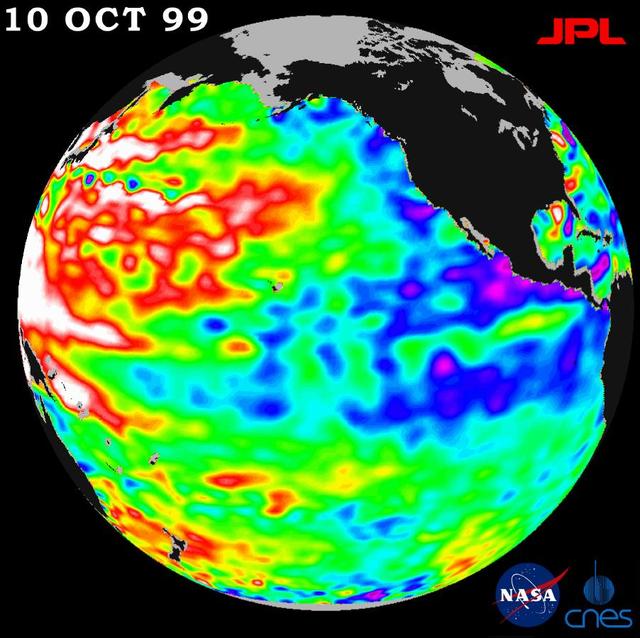
A repeat of last year mild La Niña conditions -- with a stormy winter in the Pacific Northwest and a dry winter in the southwestern United States -- will be the likely outcome of sea-surface heights observed by NASA TOPEX/Poseidon satellite.
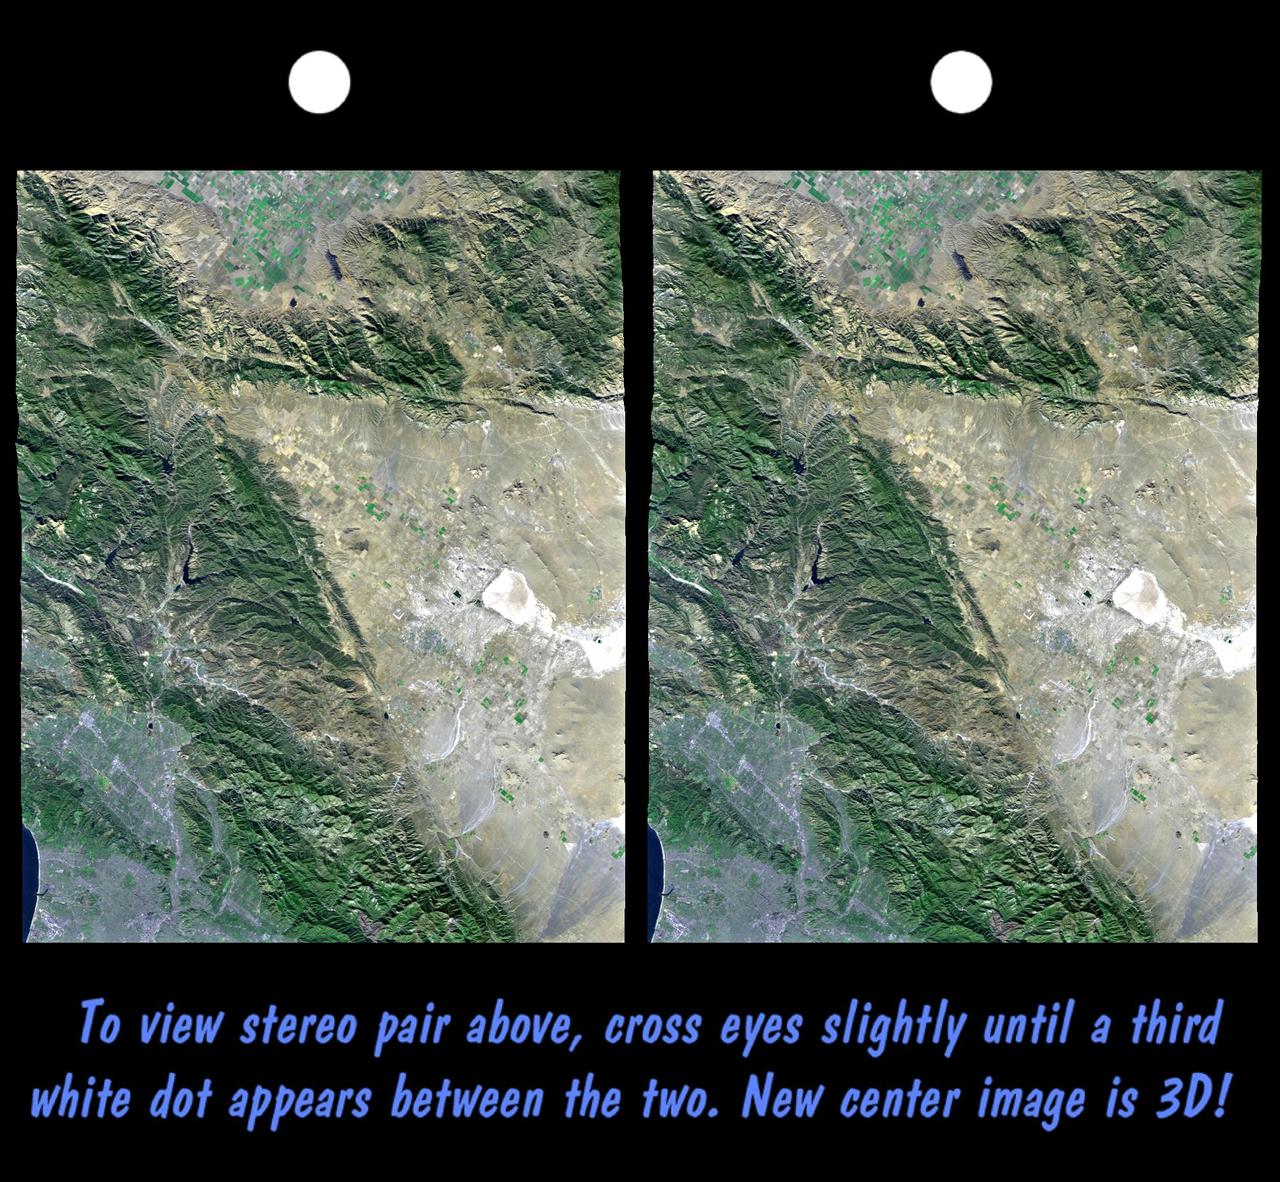
California topography poses challenges for road builders. Northwest of Los Angeles, deformation of Earth crust along the Pacific-North American crustal plate boundary has made transportation difficult.
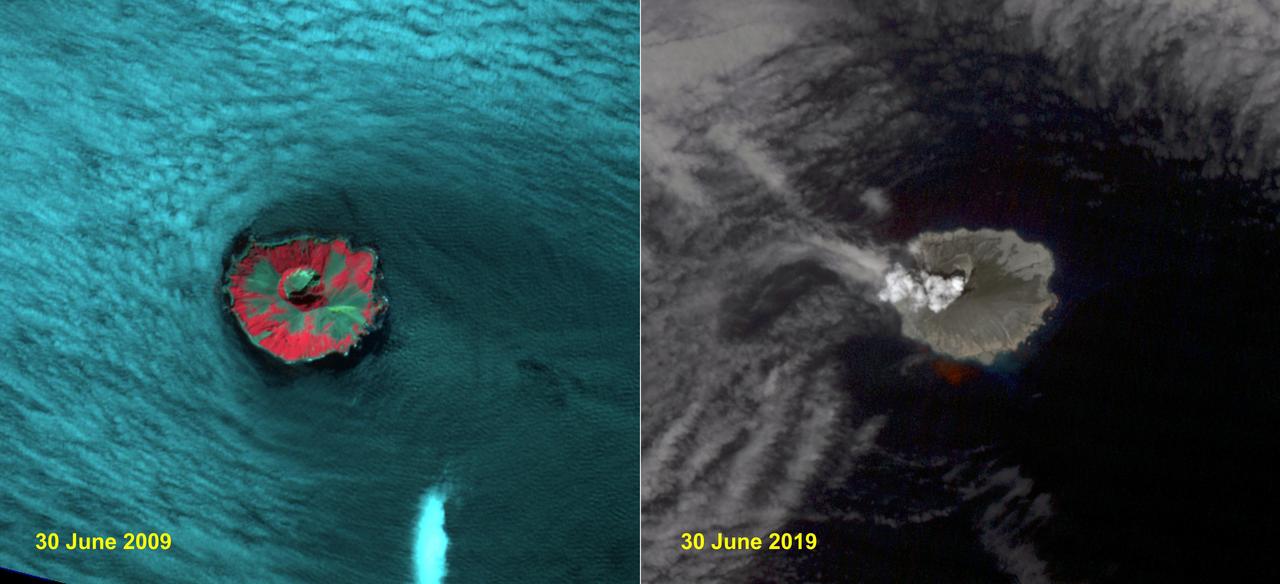
Raikoke volcanic island is near the center of the Kuril Islands in the Sea of Okhotsk in the northwest Pacific Ocean. The island is roughly circular with dimensions of 2.0 by 2.5 kilometers. On June 22, the volcano erupted with a gas and ash plume reaching 17 kilometers. The two ASTER images, acquired exactly 10 years apart on June 30, dramatically depict the changes to the island. In 2009, vegetation (red) covered most of the island. The 2019 image shows an ash and steam plume rising from the caldera. There is no trace of any vegetation, ash deposits having buried everything. The images are located at 48.3 degrees north, 153.2 degrees east. https://photojournal.jpl.nasa.gov/catalog/PIA23326
iss066e117997 (Jan. 16, 2022) --- The atmospheric plume from an underwater volcano eruption in the Pacific nation of Tonga is pictured from the International Space Station as it orbited 269 miles above the Pacific Ocean northwest of Auckland, New Zealand.
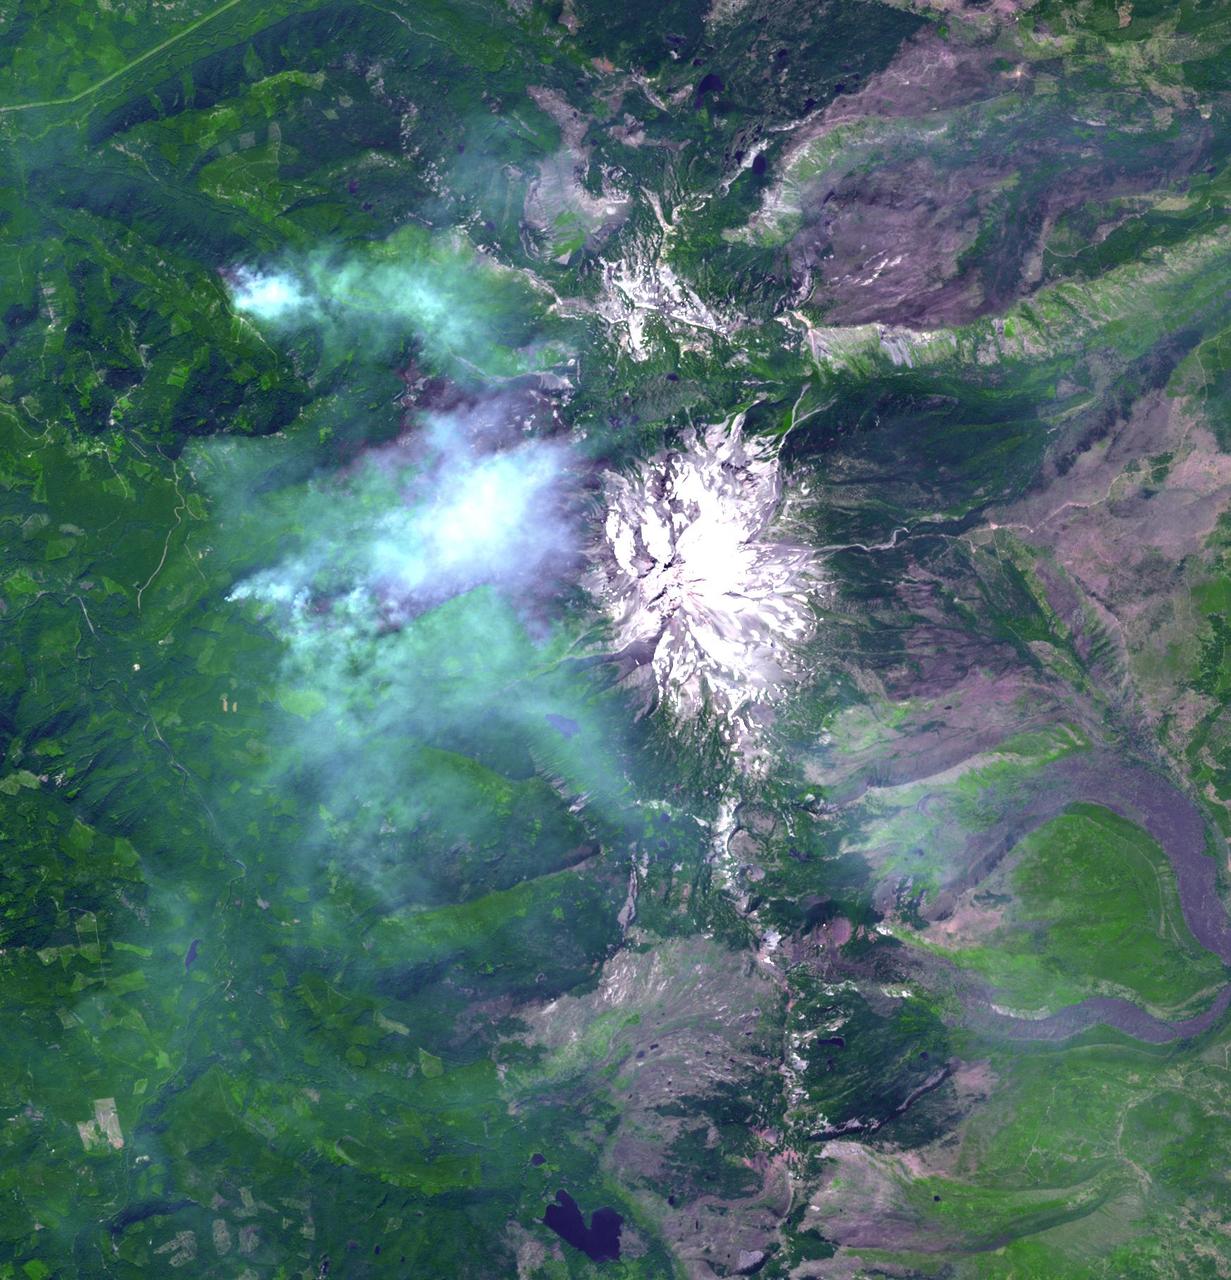
Earth observation taken during day pass by the Expedition 40 crew aboard the International Space Station (ISS). Folder lists this as: Pacific Northwest Wildfires.
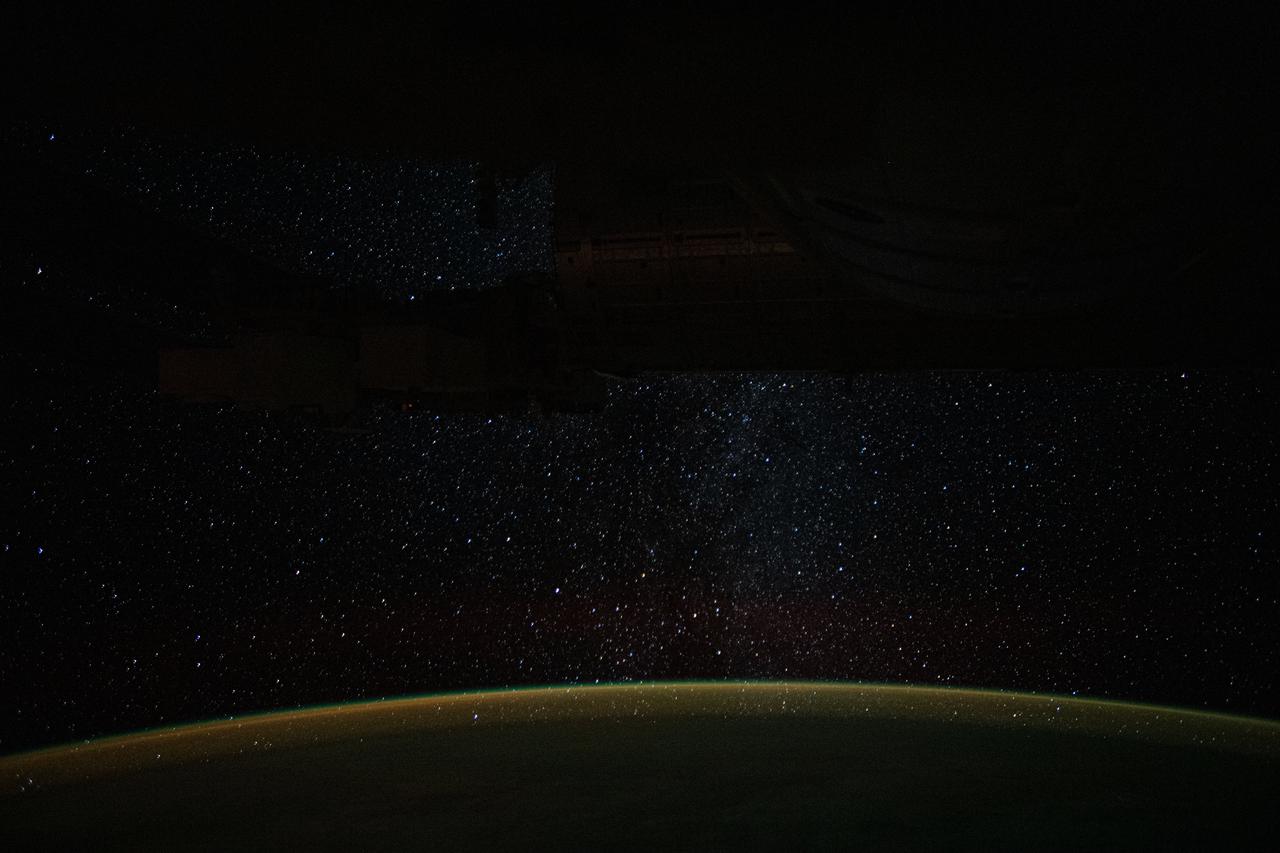
iss060e002064 (June 29, 2019) -- A starry Milky Way glitters above Earth's tranquil atmospheric glow as the International Space Station orbited 266 miles above the Pacific Ocean off the northwest coast of New Zealand.
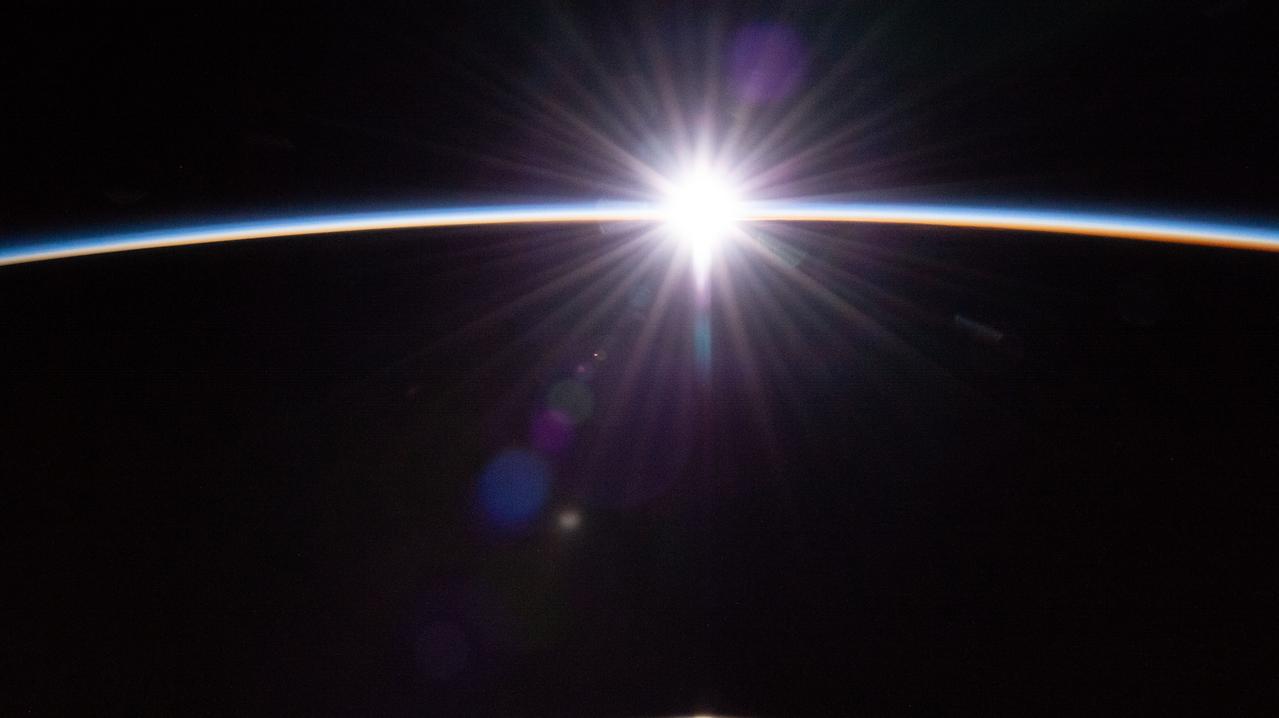
iss070e028899 (Nov. 22, 2023) --- The sun's first rays burst through the Earth's atmosphere in this photograph from the International Space Station as it orbited 264 miles above the Pacific Ocean northwest of New Zealand.

iss065e074523 (May 26, 2021) --- The Moon pictured during a lunar eclipse, and intersecting with the Earth's horizon, is seen from the International Space Station during a northwest to southeast orbital trek 263 miles above the Pacific Ocean.

iss065e376897 (Sept. 13, 2021) --- The International Space Station orbits 266 miles above the north Pacific Ocean off the coast of British Columbia, Canada, looking across the city lights of northwest America into a sunrise highlighted by an aurora.

iss065e074511 (May 26, 2021) --- The Moon pictured during a lunar eclipse is seen from the International Space Station during a northwest to southeast orbital trek 263 miles above the Pacific Ocean.
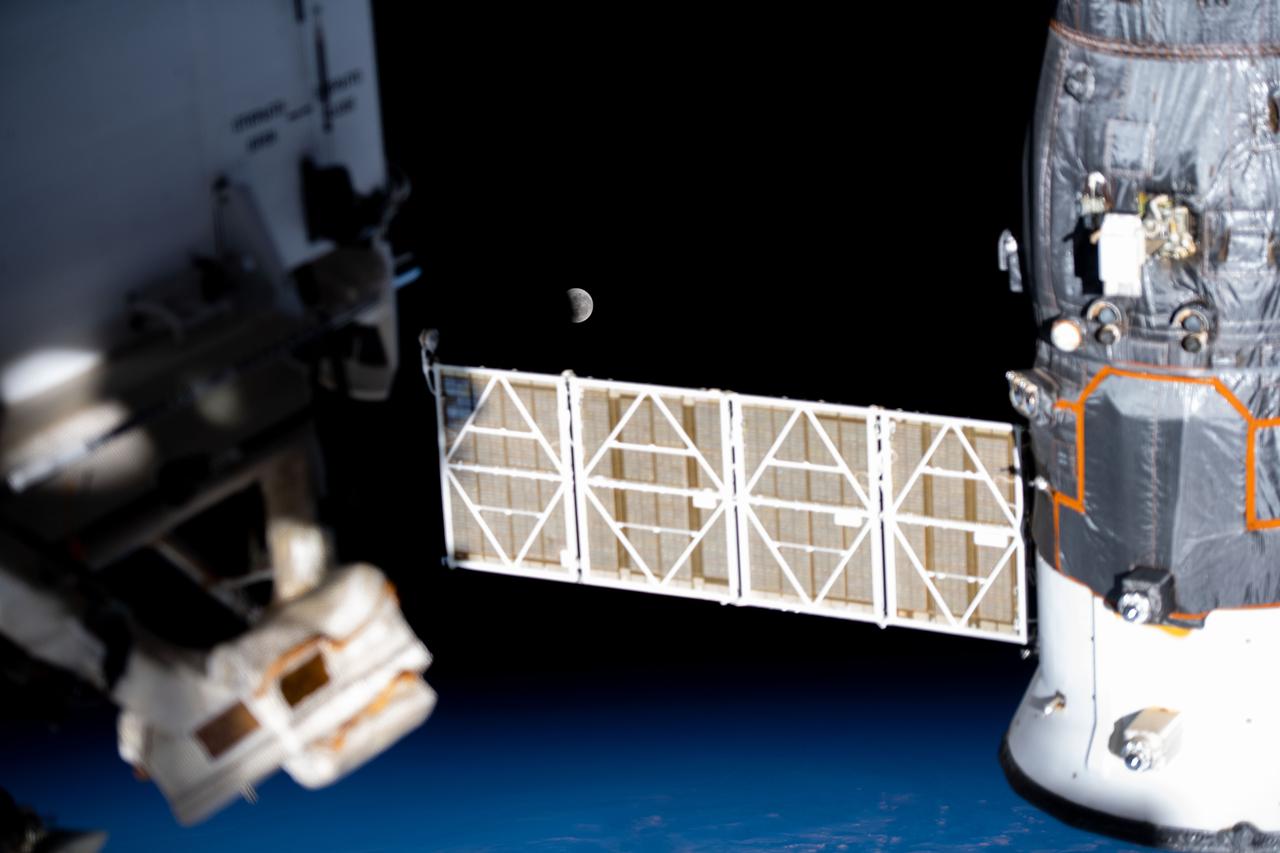
iss065e074503 (May 26, 2021) --- The Moon pictured during a lunar eclipse is seen from the International Space Station during a northwest to southeast orbital trek 263 miles above the Pacific Ocean.

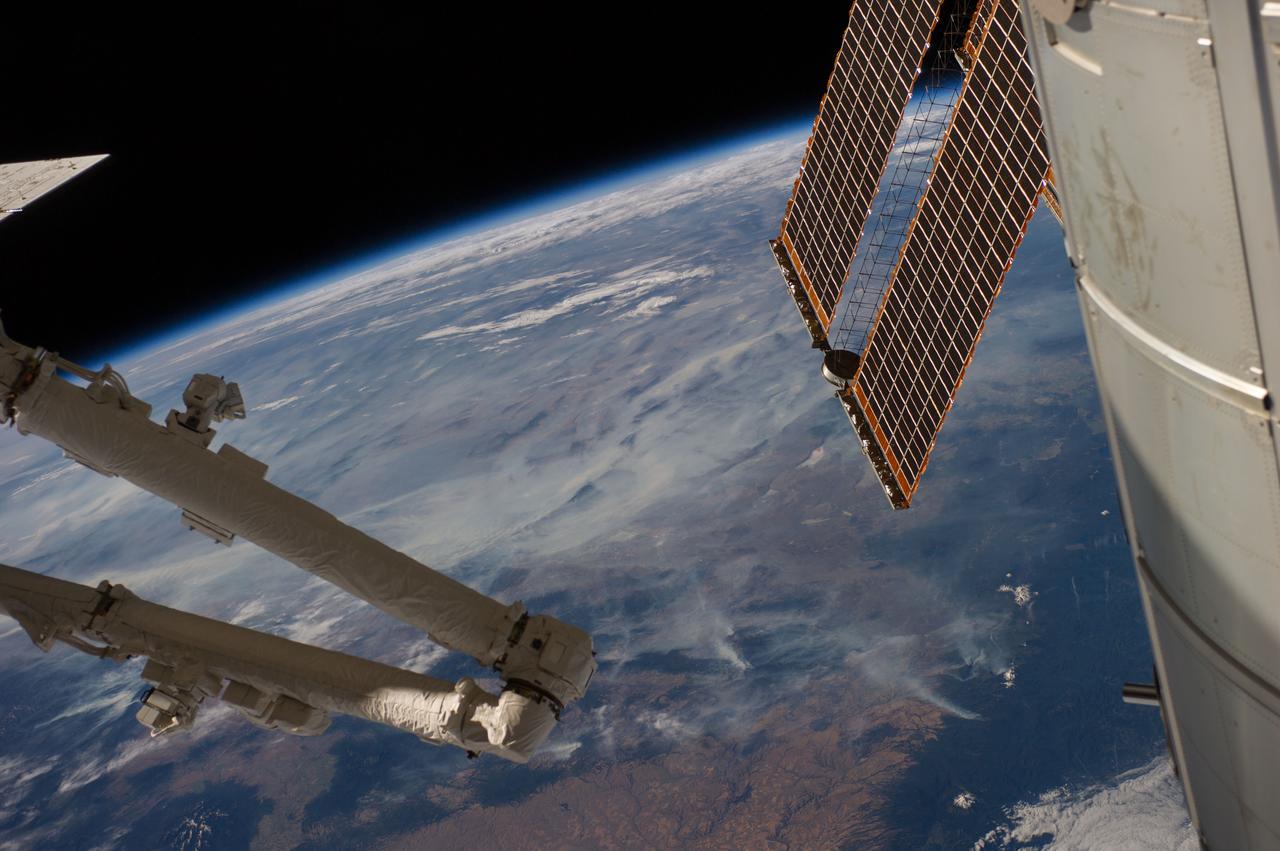
iss059e020197 (April 13, 2019) --- The International Space Station's Canadarm2 robotic arm and solar array's highlight the foreground as the orbital complex flew 260 miles above the South Pacific Ocean northwest of New Zealand.
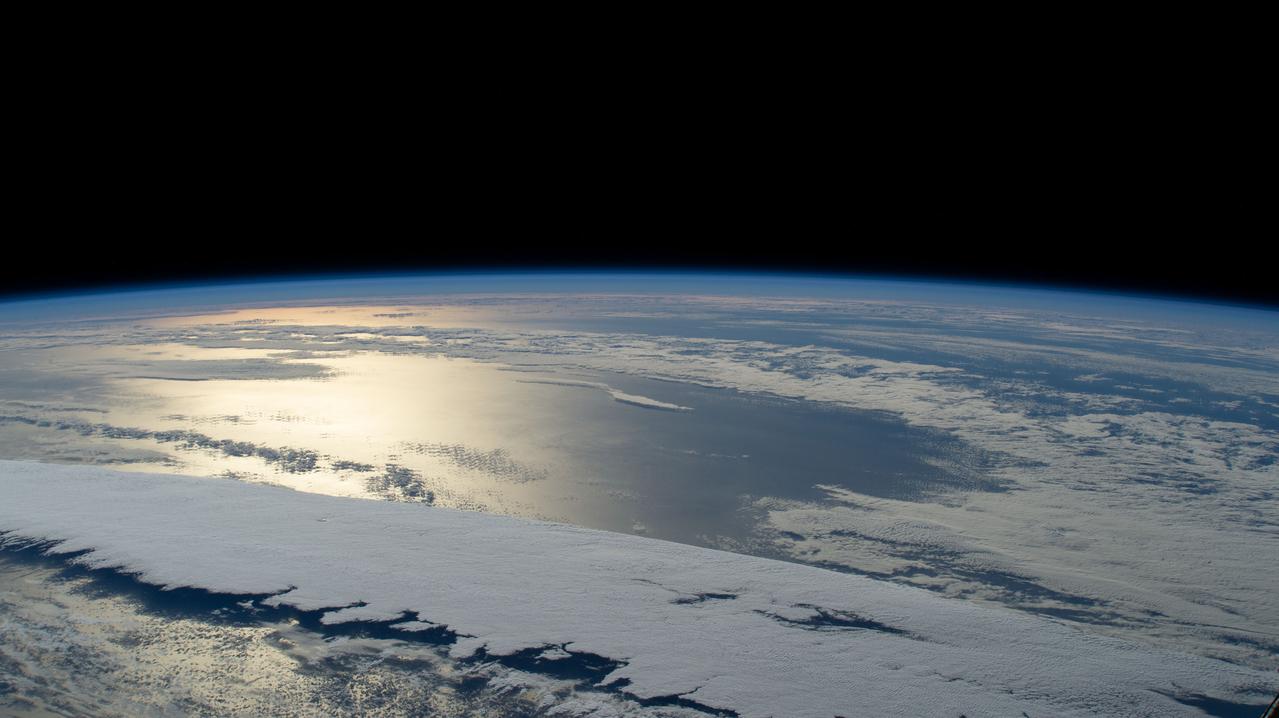
iss068e036653 (Jan. 1, 2022) --- The sun's glint beams off a partly cloudy Pacific Ocean in this photograph from the International Space Station as it orbited 260 miles above and northwest of Midway Atoll.

U.S.S. Bennington comes alongside the floating Apollo spacecraft 017 Command Module during recovery operations in the mid-Pacific Ocean. The Command Module splashed down at 3:37 p.m., November 9, 1967, 934 nautical miles northwest of Honolulu, Hawaii.
The shadow of the moon blots out the Pacific Northwest in this GOES-16 geocolor image of the 2017 Solar Eclipse. Credit: CIRA View more eclipse imagery at <a href="http://www.nesdis.noaa.gov/content/multimedia" rel="nofollow">www.nesdis.noaa.gov/content/multimedia</a>
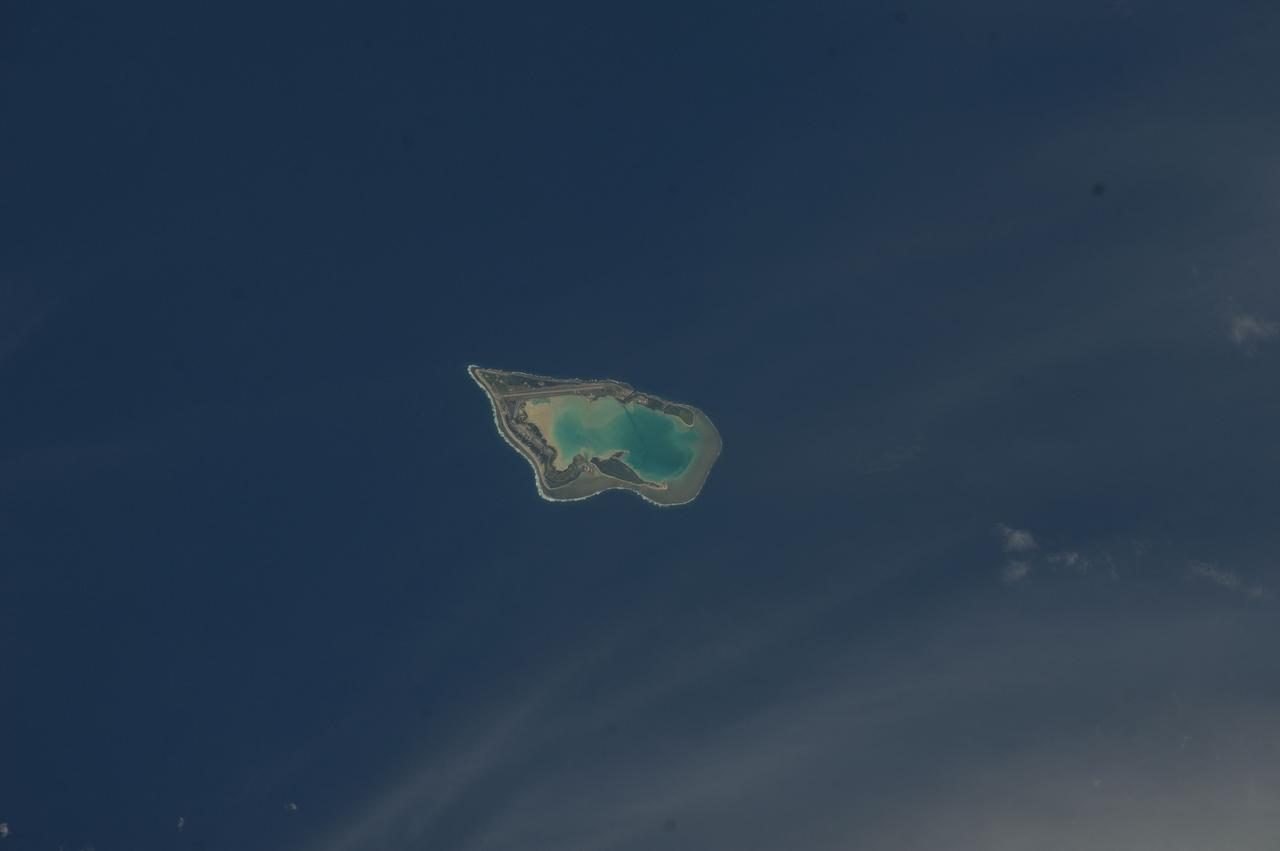
ISS033-E-007873 (27 Sept. 2012) --- Wake Island is featured in this image photographed by an Expedition 33 crew member on the International Space Station. The atoll of Wake Island is located in the central Pacific Ocean approximately 4,000 kilometers to the west-southwest of Hawaii and 2,400 kilometers to the northwest of Guam. In addition to Wake Island, the atoll includes the smaller Peale and Wilkes Island for a total land surface area of 6.5 square kilometers. Like many atolls in the Pacific, the islands and associated reefs formed around a submerged volcano. The lagoon in the center of the islands—characterized by shallow, light blue water in contrast to the surrounding darker, deeper Pacific Ocean waters—marks the approximate location of the summit crater of the volcano.

NASA Administrator Charles Bolden speaks to students at Aviation High School at a lunch and learn session Tuesday, Jan. 15, 2013 in Des Moines, WA. Aviation High School is a college preparatory aviation- and aerospace-themed school and a premier school of choice for science, technology, engineering and math (STEM) in the Pacific Northwest. Photo Credit: (NASA/Carla Cioffi)

iss072e188529 (Nov. 13, 2024) --- The International Space Station soars into an orbital sunset 259 miles above a cloudy Pacific Ocean northwest of the Hawaiian island chain. At left, the Soyuz MS-26 crew ship is pictured docked to the Rassvet module. At center, the Prichal docking module and the European robotic arm are pictured attached to the Nauka science module.

NASA Administrator Charles Bolden listens to students at Aviation High School at a lunch and learn session Tuesday, Jan. 15, 2013 in Des Moines, WA. Aviation High School is a college preparatory aviation- and aerospace-themed school and a premier school of choice for science, technology, engineering and math (STEM) in the Pacific Northwest. Photo Credit: (NASA/Carla Cioffi)

Aviation High School student, Katie McConville, introduces herself at a lunch and learn session with NASA Administrator Charles Bolden, Tuesday, Jan. 15, 2013 in Des Moines, WA. Aviation High School is a college preparatory aviation- and aerospace-themed school and a premier school of choice for science, technology, engineering and math (STEM) in the Pacific Northwest. Photo Credit: (NASA/Carla Cioffi)

Chris Lu (third from left), a student at Aviation High School, asks a question at a lunch and learn session with NASA Administrator Charles Bolden, Tuesday, Jan. 15, 2013 in Des Moines, WA. Aviation High School is a college preparatory aviation- and aerospace-themed school and a premier school of choice for science, technology, engineering and math (STEM) in the Pacific Northwest. Photo Credit: (NASA/Carla Cioffi)
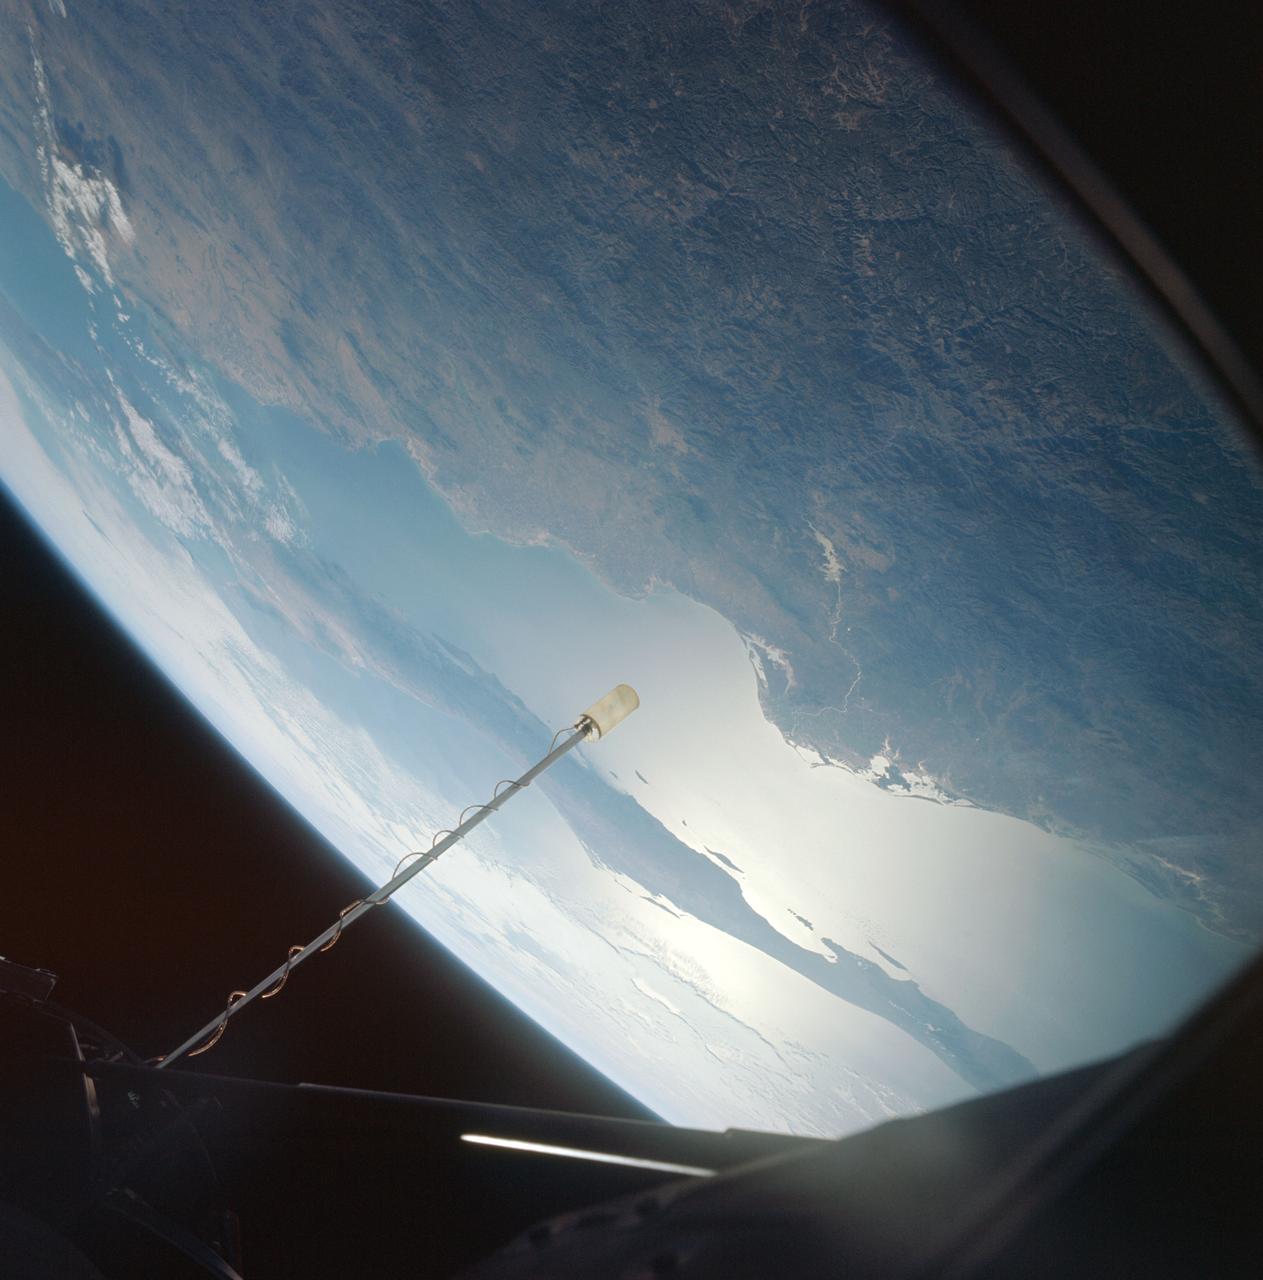
S66-63440 (12 Nov. 1966) --- Area of northwestern Mexico as seen from the Gemini-12 spacecraft during its 16th revolution of Earth. View is looking northwest. Body of water in the foreground is the Gulf of California. Pacific Ocean is in the background. Peninsula in center of picture is Baja California. States of Sonora (upper right) and Sinaloa (lower center) of Mexican mainland is in right foreground. City of Guaymas, Sonora, is near the center of the picture. Photo credit: NASA

Austin McHenry, a student at Aviation High School, introduces himself at a lunch and learn session with NASA Administrator Charles Bolden, Tuesday, Jan. 15, 2013 in Des Moines, WA. Aviation High School is a college preparatory aviation- and aerospace-themed school and a premier school of choice for science, technology, engineering and math (STEM) in the Pacific Northwest. Photo Credit: (NASA/Carla Cioffi)

S67-49423 (9 Nov. 1967) --- The Apollo Spacecraft 017 Command Module, with flotation collar still attached, is hoisted aboard the USS Bennington, prime recovery ship for the Apollo 4 (Spacecraft 017/Saturn 501) unmanned, Earth-orbital space mission. The Command Module splashed down at 3:37 p.m. (EST), Nov. 9, 1967, 934 nautical miles northwest of Honolulu, Hawaii, in the mid-Pacific Ocean. Note charred heat shield caused by extreme heat of reentry.
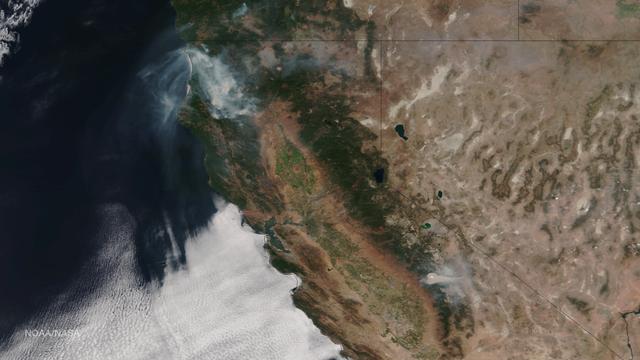
Very hot, dry and unstable conditions in California and across the Pacific Northwest add to the challenges facing firefighters as they battle blazes around the region. Cal Fire is urging Californians to be extremely cautious, especially for the next few days, as the current conditions increase the dangers authorities face. This image was taken by NASA-NOAA's Suomi NPP satellite's VIIRS instrument around 2145 UTC (5:45 p.m. EDT) on August 17, 2015. Northern California is seeing smoke from the River Complex, Route Complex, South Complex, Fork Complex and Mad River Complex fires combine over a large area of the Shasta-Trinity National Forest west of Redding, California, while the Rough Fire in Fresno County is spreading toward the Black Rock Reservoir, causing evacuations and road closures. Fires across the Pacific Northwest aren't limited to California. Please see the Suomi NPP VIIRS composites in NOAA View to see the growth and extent of fires over the past weeks. Credit: NASA/NOAA via <b><a href="www.nnvl.noaa.gov/" rel="nofollow"> NOAA Environmental Visualization Laboratory</a></b>
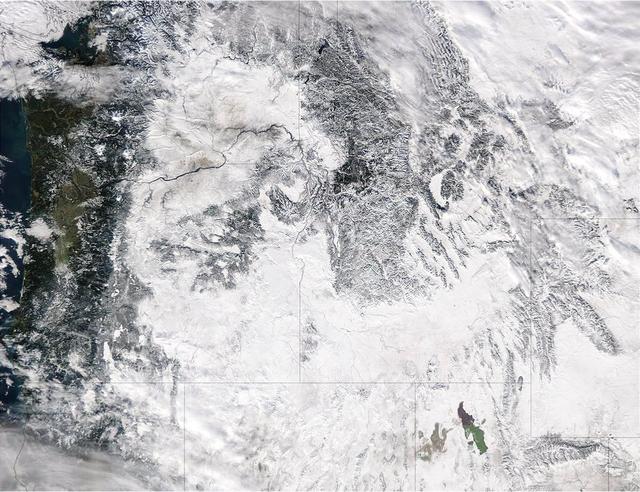
Extreme rain events have been affecting California and snow has blanketed the Pacific Northwest. This visible image from NASA's Aqua satellite on Jan. 6, 2017, at 3:35 p.m. EST (20:35 UTC) shows snow cover in the U.S. Pacific Northwest in Washington, Idaho, Oregon, northern California and Nevada. On Jan. 9, another area of low pressure moved over Oregon, where the National Weather Service is forecasting heavy snows. It was the same week last year that the West Coast endured a similar bout of very wet weather. Heavy rain affected the Pacific coast in 2016 during the same week from Jan. 5 through Jan. 7, as a progression of storm systems in the Eastern Pacific Ocean hit southern California and generated flooding and mudslides. For updated forecasts, visit the National Weather Service website at: <a href="http://www.weather.gov" rel="nofollow">www.weather.gov</a> Learn more about NASA's view of the storm: <a href="http://go.nasa.gov/2j0xpvW" rel="nofollow">go.nasa.gov/2j0xpvW</a> Credits: NASA Goddard MODIS Rapid Response <b><a href="http://www.nasa.gov/audience/formedia/features/MP_Photo_Guidelines.html" rel="nofollow">NASA image use policy.</a></b> <b><a href="http://www.nasa.gov/centers/goddard/home/index.html" rel="nofollow">NASA Goddard Space Flight Center</a></b> enables NASA’s mission through four scientific endeavors: Earth Science, Heliophysics, Solar System Exploration, and Astrophysics. Goddard plays a leading role in NASA’s accomplishments by contributing compelling scientific knowledge to advance the Agency’s mission. <b>Follow us on <a href="http://twitter.com/NASAGoddardPix" rel="nofollow">Twitter</a></b> <b>Like us on <a href="http://www.facebook.com/pages/Greenbelt-MD/NASA-Goddard/395013845897?ref=tsd" rel="nofollow">Facebook</a></b> <b>Find us on <a href="http://instagrid.me/nasagoddard/?vm=grid" rel="nofollow">Instagram</a></b>
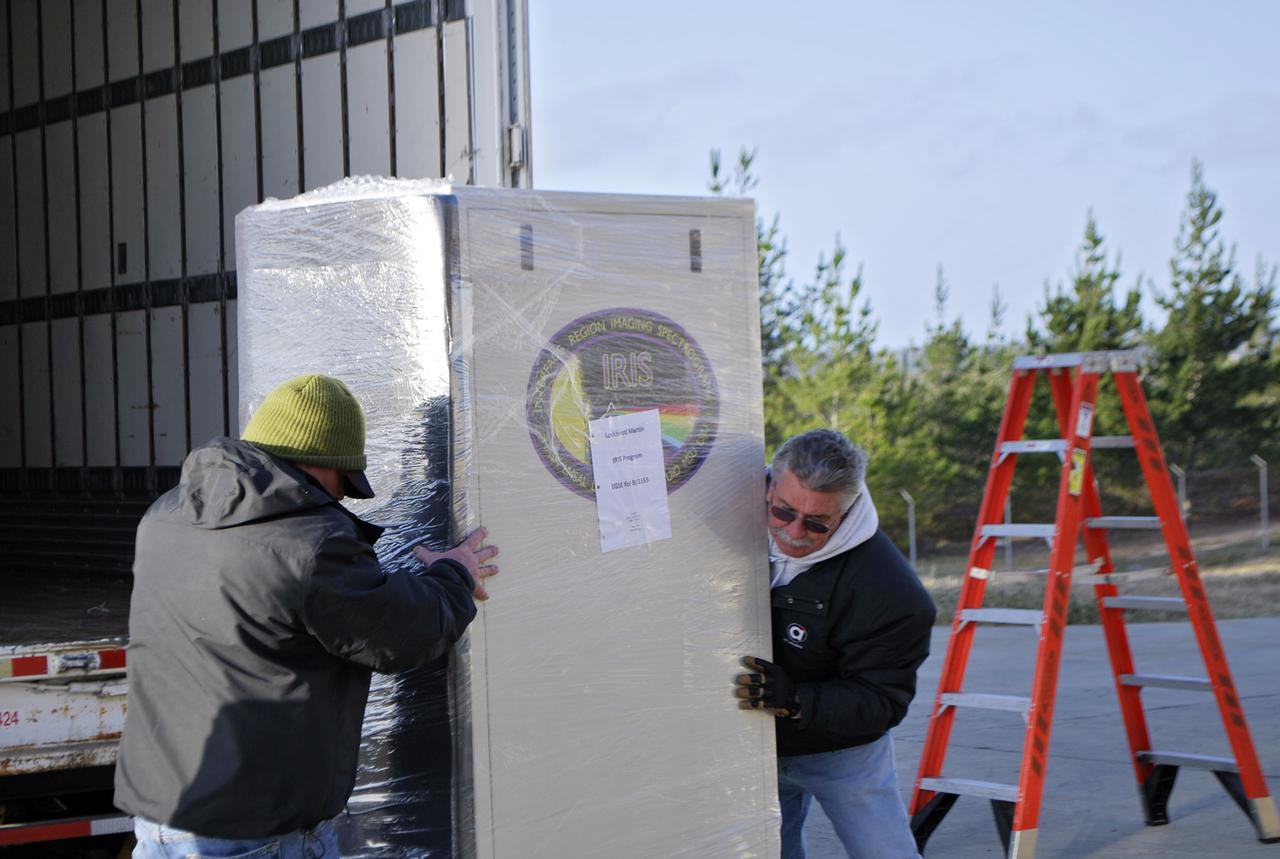
VANDENBERG AFB, Calif. – Technicians offload ground support equipment slated for NASA's IRIS mission. NASA’s Interface Region Imaging Spectrograph, or IRIS, satellite will improve our understanding of how heat and energy move through the deepest levels of the sun’s atmosphere, thereby increasing our ability to forecast space weather. On launch day, deployment of the Pegasus from Orbital’s L-1011 carrier aircraft will occur at a location over the Pacific Ocean about 100 miles northwest of Vandenberg off the central coast of California south of Big Sur. Photo credit: VAFB_Randy Beaudoin

VANDENBERG AFB, Calif. – Technicians work on the payload fairing that will protect NASA's IRIS spacecraft during launch aboard an Orbital Sciences Pegasus XL rocket. NASA’s Interface Region Imaging Spectrograph, or IRIS, satellite will improve our understanding of how heat and energy move through the deepest levels of the sun’s atmosphere, thereby increasing our ability to forecast space weather. On launch day, deployment of the Pegasus from Orbital’s L-1011 carrier aircraft will occur at a location over the Pacific Ocean about 100 miles northwest of Vandenberg off the central coast of California south of Big Sur. Photo credit: VAFB_Randy Beaudoin

VANDENBERG AFB, Calif. – A technician works on the payload fairing that will protect NASA's IRIS spacecraft during launch aboard an Orbital Sciences Pegasus XL rocket. NASA’s Interface Region Imaging Spectrograph, or IRIS, satellite will improve our understanding of how heat and energy move through the deepest levels of the sun’s atmosphere, thereby increasing our ability to forecast space weather. On launch day, deployment of the Pegasus from Orbital’s L-1011 carrier aircraft will occur at a location over the Pacific Ocean about 100 miles northwest of Vandenberg off the central coast of California south of Big Sur. Photo credit: VAFB_Randy Beaudoin
The Whitewater Fire in the Mount Jefferson Wilderness in Oregon was started by a lightning strike. As of Aug. 18, 2017, more than 117,000 acres and 30 miles (48 kilometers) of the Pacific Crest Trail are closed to the public in an area that had been expected to be popular with people there to view the August 21 solar eclipse. The smoke clouds sit over the burned area, just west-northwest of Mount Jefferson. The image was acquired Aug. 18, 2017, covers an area of 16 by 17 miles (26.1 by 27.2 kilometers), and is located at 44.7 degrees north, 121.8 degrees west. https://photojournal.jpl.nasa.gov/catalog/PIA21877

iss073e0780439 (Sept. 2, 2025) --- A diffuse aurora glows above Earth's horizon over Canada as its red and green hues shimmer like neon lights—an effect created by excited oxygen atoms high in the atmosphere. The city lights of the U.S.-Canadian Pacific Northwest (toward upper right) trace the continent eastward. The red aurora is produced by high-altitude oxygen atoms (~300 km), while the green glow comes from lower-altitude oxygen (~100 km), both excited by energetic electrons guided into the atmosphere by Earth's magnetic field during solar activity.
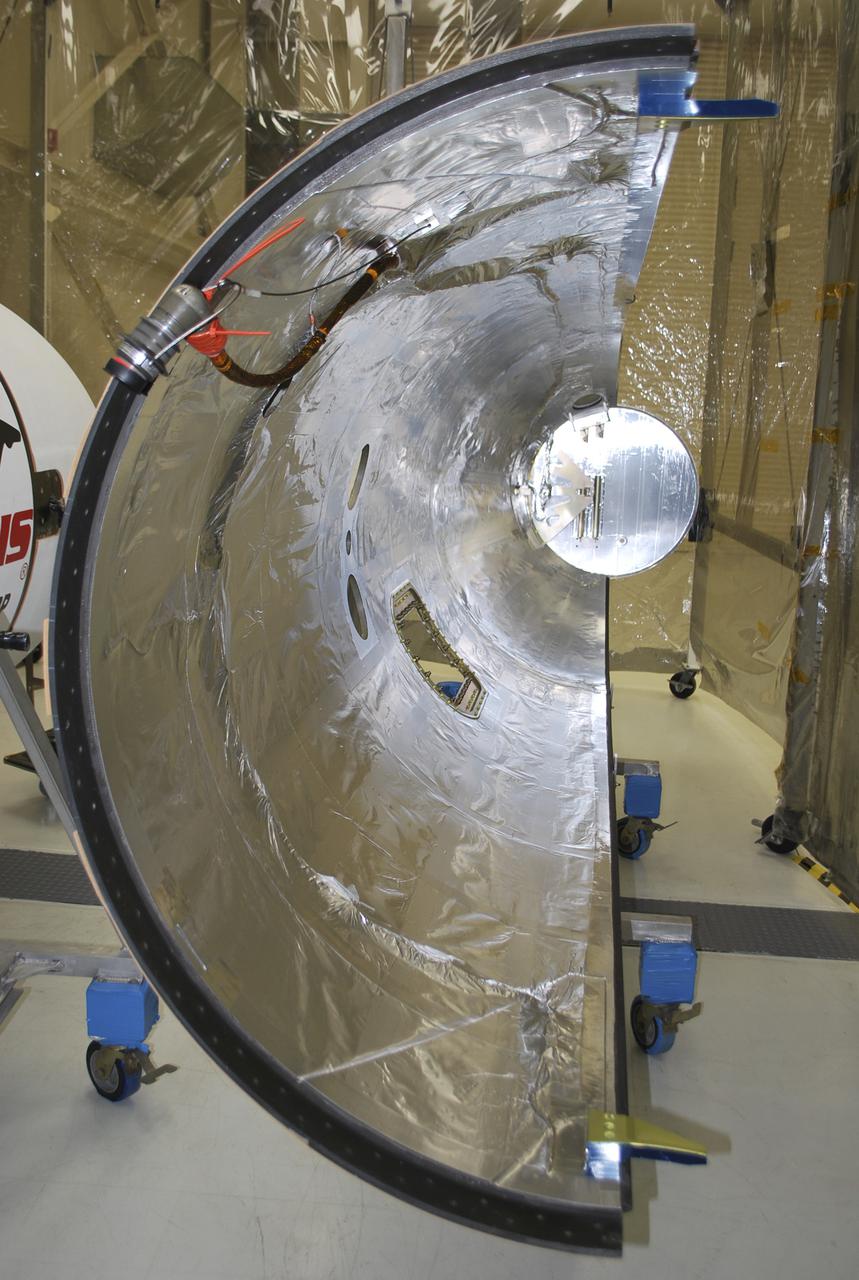
VANDENBERG AFB, Calif. – Half of the payload fairing that will protect NASA's IRIS spacecraft during launch aboard an Orbital Sciences Pegasus XL rocket as it is readied for launch. NASA’s Interface Region Imaging Spectrograph, or IRIS, satellite will improve our understanding of how heat and energy move through the deepest levels of the sun’s atmosphere, thereby increasing our ability to forecast space weather. On launch day, deployment of the Pegasus from Orbital’s L-1011 carrier aircraft will occur at a location over the Pacific Ocean about 100 miles northwest of Vandenberg off the central coast of California south of Big Sur.Photo credit: VAFB_Randy Beaudoin
On August 21, 2017, the first total solar eclipse to move across the United States in 99 years occurred. GOES-16 captured the eclipse with the Advanced Baseline Imager (ABI) which had a clear view of the moon’s shadow as it traveled diagonally across the path of totality of the Continental United States from the Pacific Northwest through South Carolina. In this full disk geocolor image from GOES-16 on August 21, 2017, the center of the moon's shadow is now east of the Mississippi River. Credit: CIRA View more eclipse imagery at <a href="http://www.nesdis.noaa.gov/content/multimedia" rel="nofollow">www.nesdis.noaa.gov/content/multimedia</a>
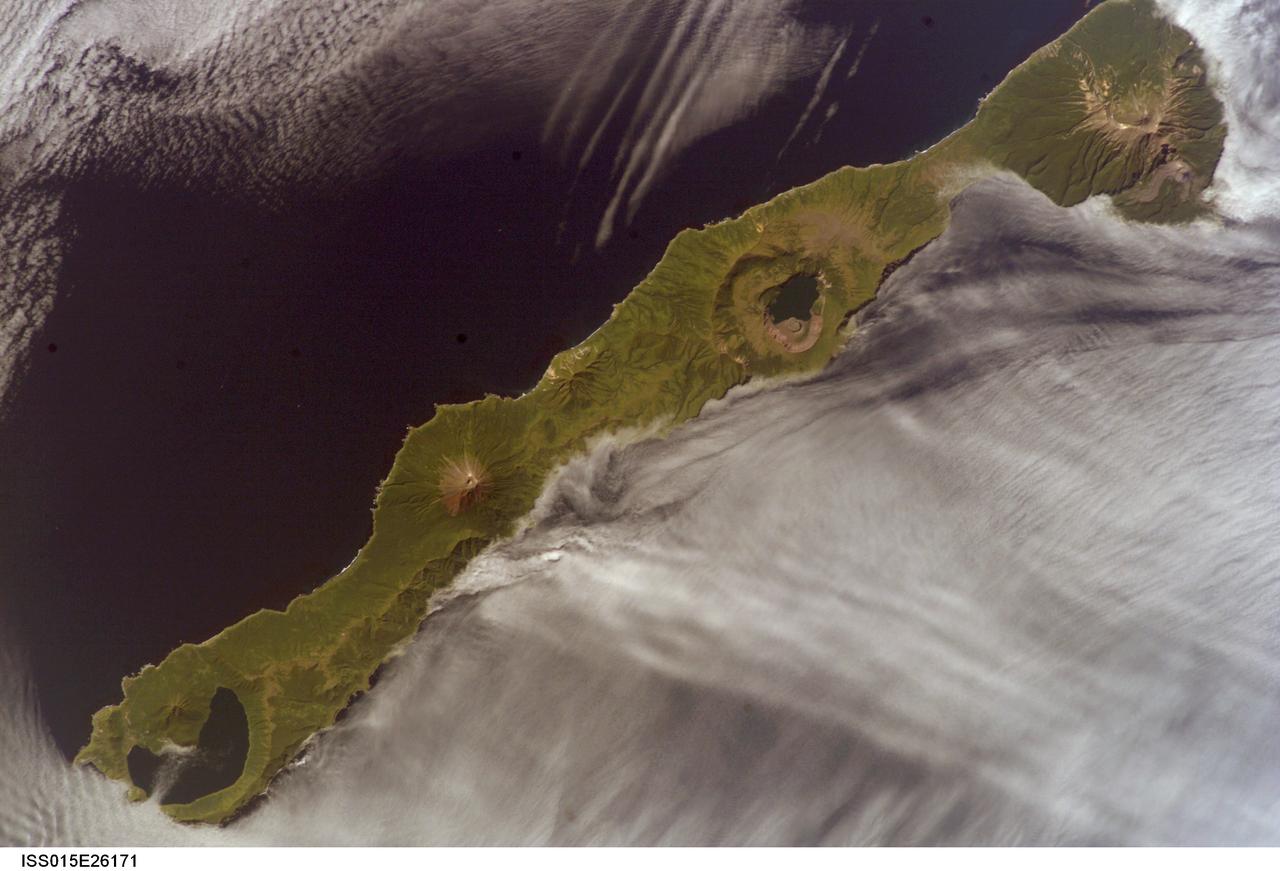
ISS015-E-26171 (1 Sept. 2007) --- Simushir Island, Kuril Archipelago, Russian Far East, is featured in this image photographed by an Expedition 15 crewmember on the International Space Station. Simushir is a deserted, 5-mile-wide volcanic island in the Kuril island chain, half way between northern Japan and the Kamchatka Peninsula of Russia. Four volcanoes - Milne, Prevo, Urataman and Zavaritski - have built cones that are high enough to rise above the altitude of green forest. The remaining remnant of Zavaritski volcano is a caldera -- a structure formed when a volcano collapses into its emptied magma chamber. A small lake fills the innermost of three nested calderas which make up Zavaritski Caldera. The larger caldera of Urataman Volcano is connected to the sea. A defunct Soviet naval base occupies the northern tip of the island next to this caldera. The islands and volcanoes of the Kuril chain are part of the Pacific Rim of Fire, marking the edge of the Pacific tectonic plate. Low stratus clouds approaching from the northwest (from the Sea of Okhotsk--top left) bank up against the northwest side of the island, making complex cloud patterns. A small finger of cloud can be seen entering the northernmost caldera (Urataman) at sea level. When this image was taken, the cloud layer had stopped at the northwest coast of the island, not flowing over even the low points of the island between the volcanoes. The cloud pattern suggests that the air mass flowed up and over the island, descending on the southeast side. This descending motion was enough--under stable atmospheric conditions--to warm up the atmosphere locally so that a cloud-free zone formed on the southeastern, lee side of the island.
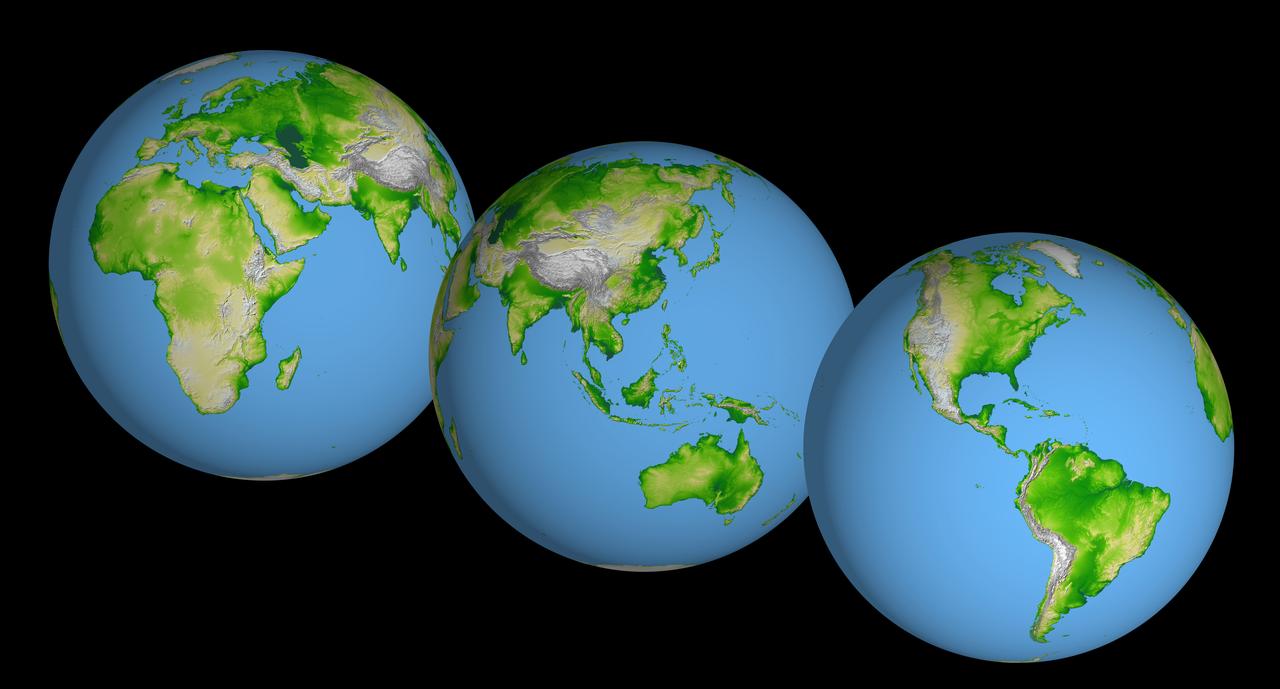
These images of the world were generated with data from the Shuttle Radar Topography Mission (SRTM). The SRTM Project has recently released a new global data set called SRTM30, where the original one arcsecond of latitude and longitude resolution (about 30 meters, or 98 feet, at the equator) was reduced to 30 arcseconds (about 928 meters, or 1496 feet.) These images were created from that data set and show the Earth as it would be viewed from a point in space centered over the Americas, Africa and the western Pacific. Two visualization methods were combined to produce the image: shading and color coding of topographic height. The shade image was derived by computing topographic slope in the northwest-southeast direction, so that northwest slopes appear bright and southeast slopes appear dark. Color coding is directly related to topographic height, with green at the lower elevations, rising through yellow and tan, to white at the highest elevations. Elevation data used in this image were acquired by the Shuttle Radar Topography Mission aboard the Space Shuttle Endeavour, launched on Feb. 11, 2000. http://photojournal.jpl.nasa.gov/catalog/PIA03394
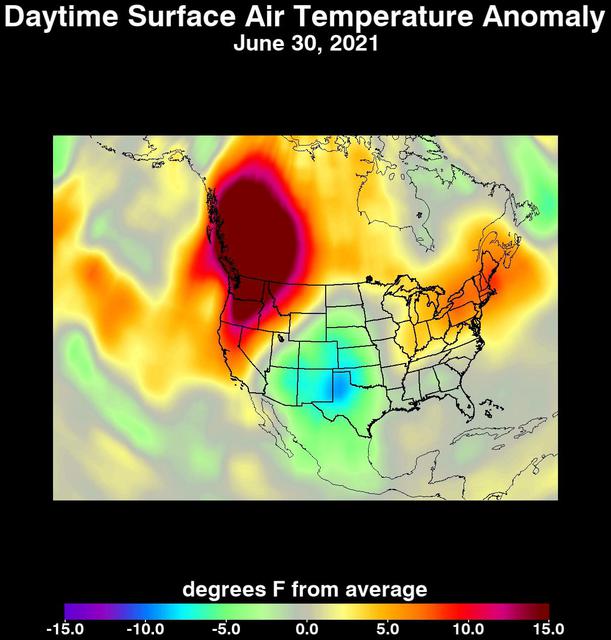
An unprecedented heat wave that started around June 26, 2021, smashed numerous all-time temperature records in the Pacific Northwest and western Canada. NASA's Atmospheric Infrared Sounder (AIRS), aboard the Aqua satellite, captured the progression of this slow-moving heat dome across the region from June 21 to 30. This animation of AIRS data shows surface air temperature anomalies, or values above or below long-term averages. Surface air temperature is something that people directly feel when they are outside. Some of the temperature anomalies were greater than 20 degrees Fahrenheit above the long-term average. On June 28, Quillayute, Washington, set an all-time high temperature record of 110 degrees Fahrenheit (43 degrees Celsius), shattering the old record of 99 degrees Fahrenheit (37 degrees Celsius). In British Columbia, the village of Lytton set a new all-time record for Canada at 119 degrees Fahrenheit (48 degrees Celsius) on June 29, only to break it the next day with a reading of 121 degrees Fahrenheit (49 degrees Celsius). The AIRS instrument recorded similar temperature anomalies at an altitude of about 10,000 feet (3,000 meters), showing that the extreme heat also affected mountainous regions. And temperature anomalies at roughly 18,000 feet (5,500 meters) demonstrated that the heat dome extended high into Earth's troposphere, creating the conditions for intense heat at the planet's surface that are normally found further south. Animation available at https://photojournal.jpl.nasa.gov/catalog/PIA24537

Pacific Northwest National Laboratory (PNNL) Scientist Yuliya Farris (left) prepares the Dynamics of Microbiomes in Space (DynaMoS) experiment inside a laboratory at the Florida spaceport’s Space Station Processing Facility on July 11, 2022. The DynaMoS experiment will launch on SpaceX’s 25th cargo resupply services mission to examine how microgravity affects metabolic interactions in communities of soil microbes. This will help NASA understand the function of soil microorganisms in space versus on Earth and how they can be used to enhance plant growth for crew consumption during long-duration missions to the Moon and Mars. SpaceX’s Falcon 9 rocket and Dragon spacecraft are scheduled to lift off from Kennedy’s Launch Complex 39A at 8:44 p.m. EDT on Thursday, July 14.

Pacific Northwest National Laboratory (PNNL) Scientist Yuliya Farris prepares the Dynamics of Microbiomes in Space (DynaMoS) experiment inside a laboratory at the Florida spaceport’s Space Station Processing Facility on July 11, 2022. The DynaMoS experiment will launch on SpaceX’s 25th cargo resupply services mission to examine how microgravity affects metabolic interactions in communities of soil microbes. This will help NASA understand the function of soil microorganisms in space versus on Earth and how they can be used to enhance plant growth for crew consumption during long-duration missions to the Moon and Mars. SpaceX’s Falcon 9 rocket and Dragon spacecraft are scheduled to lift off from Kennedy’s Launch Complex 39A at 8:44 p.m. EDT on Thursday, July 14.

Marci Garcia, a research associate at Pacific Northwest National Laboratory (PNNL), examines some of the science tubes that make up the Dynamics of Microbiomes in Space (DynaMoS) experiment inside a laboratory at the Space Station Processing Facility on July 11, 2022. The DynaMoS experiment will launch on SpaceX’s 25th cargo resupply services mission to examine how microgravity affects metabolic interactions in communities of soil microbes. This will help NASA understand the function of soil microorganisms in space versus on Earth and how they can be used to enhance plant growth for crew consumption during long-duration missions to the Moon and Mars. SpaceX’s Falcon 9 rocket and Dragon spacecraft are scheduled to lift off from Kennedy’s Launch Complex 39A at 8:44 p.m. EDT on Thursday, July 14.

Ryan McClure, scientist with Pacific Northwest National Laboratory (PNNL) prepare the Dynamics of Microbiomes in Space (DynaMoS) experiment inside a laboratory at the Space Station Processing Facility on July 11, 2022. The DynaMoS experiment will launch on SpaceX’s 25th cargo resupply services mission to examine how microgravity affects metabolic interactions in communities of soil microbes. This will help NASA understand the function of soil microorganisms in space versus on Earth and how they can be used to enhance plant growth for crew consumption during long-duration missions to the Moon and Mars. SpaceX’s Falcon 9 rocket and Dragon spacecraft are scheduled to lift off from Kennedy’s Launch Complex 39A at 8:44 p.m. EDT on Thursday, July 14.

Pacific Northwest National Laboratory (PNNL) Scientist Yuliya Farris prepares the Dynamics of Microbiomes in Space (DynaMoS) experiment inside a laboratory at the Florida spaceport’s Space Station Processing Facility on July 11, 2022. The DynaMoS experiment will launch on SpaceX’s 25th cargo resupply services mission to examine how microgravity affects metabolic interactions in communities of soil microbes. This will help NASA understand the function of soil microorganisms in space versus on Earth and how they can be used to enhance plant growth for crew consumption during long-duration missions to the Moon and Mars. SpaceX’s Falcon 9 rocket and Dragon spacecraft are scheduled to lift off from Kennedy’s Launch Complex 39A at 8:44 p.m. EDT on Thursday, July 14.
STS062-85-095 (4-18 March 1994) --- Gatun Lake and the forested Panama Canal Zone can be seen in this north northwest-looking low oblique photograph obtained in March 1994. The shipping chanel of the canal is 82.4 kilometers (51.2 miles) long, though the canal zone is only 65 kilometers (40 miles) long. The width of the canal zones extends generally 8 kilometers (5 miles) on either side of the shipping channel, except near Madden Lake. The canal connects the Atlantic Ocean (coastal city of Colon) with the Pacific Ocean near Panama City in a line that takes a northwest to southeast course because of the configuration of the isthmus. The canal zigzags across the isthmus to take advantage of the geographic features of the area such as the Chagres River. The controlled water supply for the canal is provided by the three artificial lakes: Gatun near the Atlantic terminus, Miraflores near the Pacific terminus and Madden about halfway across the isthmus. Gatun is the largest of the three lakes covering an area of 429 square kilometers (165 square miles). In the midst of this lake is Barro Colorado Island, a world-famous wild game perserve. Madden Lake was built as a large supplemental reservoir to keep water levels up in the canal during the dry season. All three lakes are vital sources of water for maintaining the ship channel over the continental divide (Gaillard Cut) and for regulating the flow of water that enables hugh vessels to be lifted and lowered in massive locks.
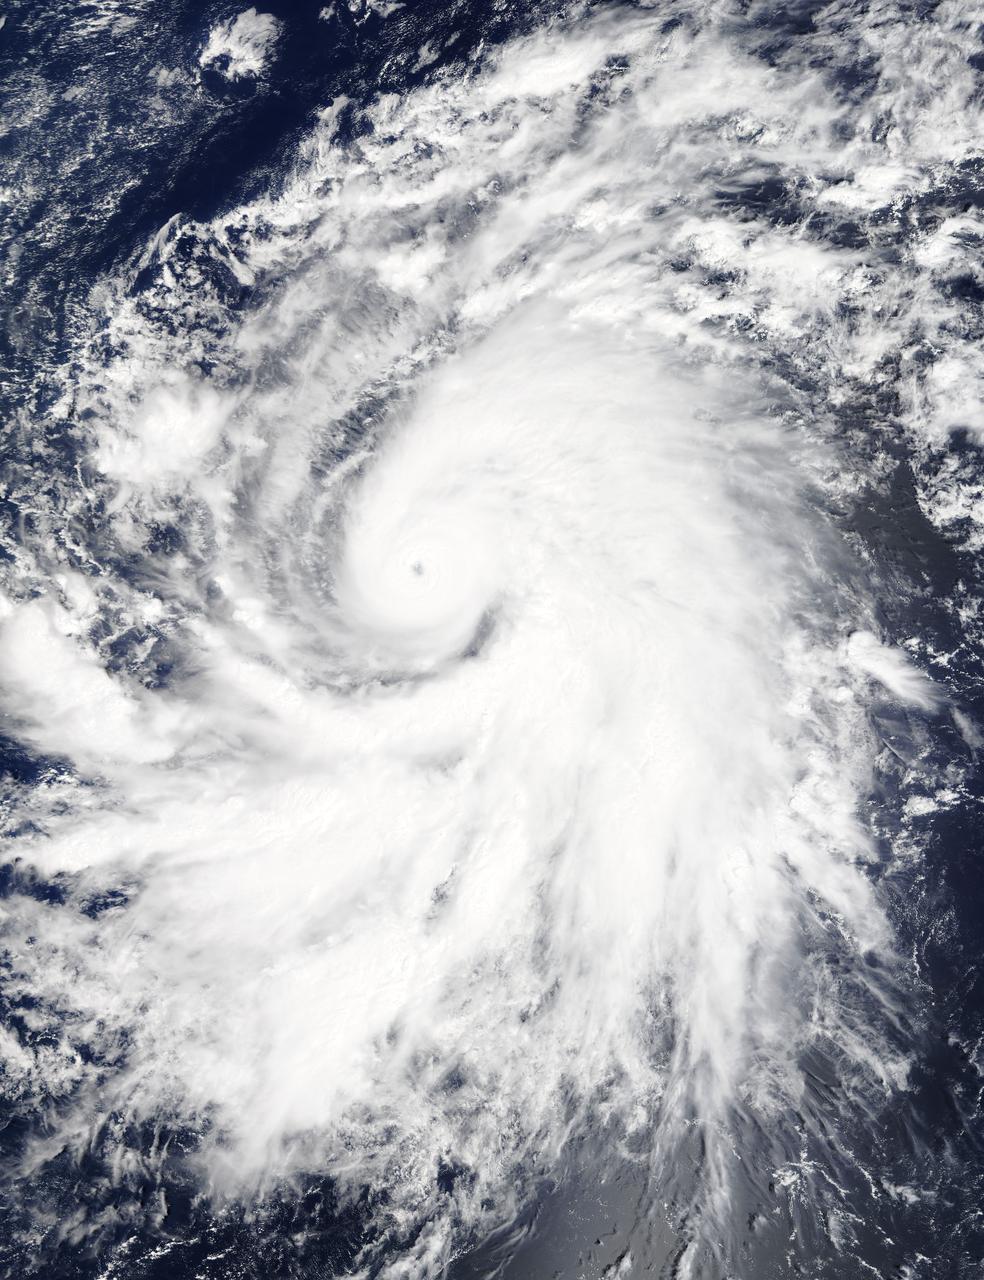
On Oct. 19 at 19:35 UTC (3:35 p.m. EDT) the MODIS instrument aboard NASA's Terra satellite saw Hurricane Olaf moving into the central Pacific Ocean with a visible eye. Powerful thunderstorms circled the eye and extended in a thick band in the eastern quadrant from north to south. At 5 a.m. EDT (0900 UTC) on Oct. 20, Hurricane Olaf's center was located near latitude 10.3 north and longitude 140.4 west. That's about 1,175 miles (1,890 km) east-southeast of Hilo, Hawaii. Despite being so far from Hawaii and because Olaf is a powerful hurricane, large swells generated by Olaf will begin to arrive along east facing shores of the main Hawaiian Islands over the next couple of days. The CPHC said that resultant surf will be large...potentially life-threatening and damaging. Olaf is moving toward the west-northwest near 10 mph (17 kph) and the Central Pacific Hurricane Center (CPHC), who has taken over forecast responsibilities now that Olaf has crossed the 140 degree longitude line, expects Olaf to turn toward the west-northwest and then northwest by October 21. Maximum sustained winds are near 150 mph (240 kph). Olaf is a category four hurricane on the Saffir-Simpson Hurricane wind scale. Some additional strengthening is forecast on Tuesday, Oct. 20 and fluctuations in intensity are possible Tuesday night and Wednesday. The estimated minimum central pressure is 938 millibars. Olaf is expected to remain a major hurricane for the next couple of days and begin curving to the northeast and away from Hawaii by Friday, October 23. For updates, visit: <a href="http://www.prh.noaa.gov/cphc" rel="nofollow">www.prh.noaa.gov/cphc</a>. Credit: NASA Goddard's MODIS Rapid Response Team <b><a href="http://www.nasa.gov/audience/formedia/features/MP_Photo_Guidelines.html" rel="nofollow">NASA image use policy.</a></b> <b><a href="http://www.nasa.gov/centers/goddard/home/index.html" rel="nofollow">NASA Goddard Space Flight Center</a></b> enables NASA’s mission through four scientific endeavors: Earth Science, Heliophysics, Solar System Exploration, and Astrophysics. Goddard plays a leading role in NASA’s accomplishments by contributing compelling scientific knowledge to advance the Agency’s mission. <b>Follow us on <a href="http://twitter.com/NASAGoddardPix" rel="nofollow">Twitter</a></b> <b>Like us on <a href="http://www.facebook.com/pages/Greenbelt-MD/NASA-Goddard/395013845897?ref=tsd" rel="nofollow">Facebook</a></b> <b>Find us on <a href="http://instagrid.me/nasagoddard/?vm=grid" rel="nofollow">Instagram</a></b>
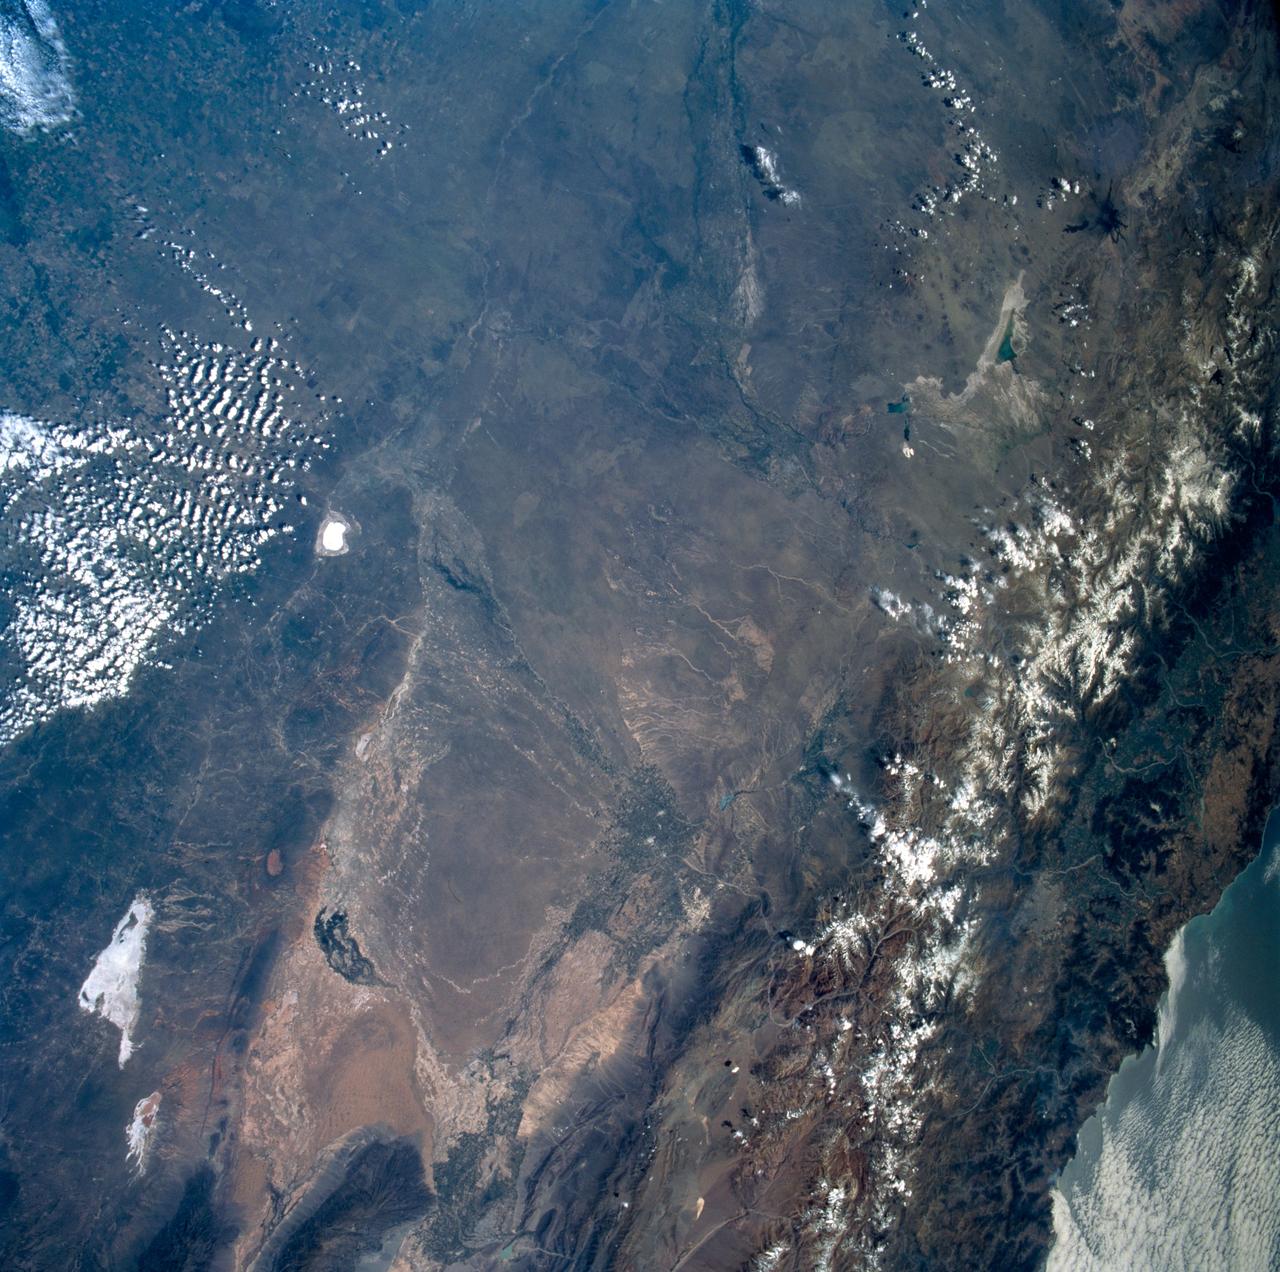
STS089-742-014 (22-31 Jan. 1998) --- This near-nadir picture of the central Andes, showing Santiago and other parts of Chile and Argentina, was photographed with a 70mm handheld camera from the Earth-orbiting space shuttle Endeavour. Santiago (population 4.7 million) is visible to the right of center, west of the snow-capped Andes Mountains. Mendoza, Argentina is the light spot in the upper center of the image in the eastern foothills of the Andes. Cerro Aconcagua, the highest peak in South America (22,834 feet) is due west of Mendoza. Note the sharp bend in the river valley to the junction with a straight north-trending valley. Aconcagua is the large, rounded mass with a bit of cloud just northwest of the valley junction. Bright white spots on the left of the image are salars, or dry lake beds of gypsum and/or salt. Usually dry, some contain water due to recent rains generated by the record El Nino this year. The Pacific Ocean is to the upper right. The continental shelf is very steep in this region and water depths drop (to almost 17,000 feet over a distance of about 60 miles) over the same distance inland from the coast, the Andes rise +17,000 to almost 23,000 feet. The reason for this is the very rapid plate motion between the Pacific Ocean plate and South America. According to NASA scientists, over the last 140 million years, South America has been overriding the Pacific plate resulting in the rapid rise in the Andes and the rapid subduction of the Pacific plate, along with any sediments that are shed into the ocean along the continental margin. The dark, linear mountain ranges east of the high Andes (right center) constitute the Precordillera block; rock strata there have been correlated with the Ordovician (approximately 470 million years old) rocks near El Paso, Texas. The rocks and the fossils within them are virtually identical in the two areas, which are now widely separated. This region would be considered a "remnant terrain" from the time when this portion of South America and Texas were once joined. Photo credit: NASA
Hurricane Celia is currently in the Eastern Pacific Ocean, but once it passes west of 140 degrees west longitude, warnings on the system will be issued by NOAA's Central Pacific Hurricane Center. On July 11 at 22:05 UTC (6:05 p.m. EDT) the Visible Infrared Imaging Radiometer Suite (VIIRS) instrument aboard NASA-NOAA-DOD's Suomi NPP satellite captured a visible light image of Hurricane Celia that showed a cloud-filled eye with powerful bands of thunderstorms wrapping around the low level center. The VIIRS image also showed a large band of thunderstorms that extended to the south, wrapping into the storms' eastern quadrant. At 5 a.m. EDT (0900 UTC) on July 12 the center of Hurricane Celia was located near 16.2 north latitude and 127.9 west longitude. That's about 1,260 miles (2,025 km) west-southwest of the southern tip of Baja California, Mexico. It was moving to the west-northwest at 10 mph (17 kph) and NOAA's National Hurricane Center (NHC) expects Celia to turn toward the northwest later today, with this motion continuing Tuesday night and Wednesday. Maximum sustained winds were near 100 mph (155 kph). NHC forecasts weakening over the next two days and Celia could weaken to a tropical storm on Wednesday. Read more: NASA Sees Hurricane Celia Headed for Central Pacific Credit: NASA/Goddard/Jeff Schmaltz/MODIS Land Rapid Response Team <b><a href="http://www.nasa.gov/audience/formedia/features/MP_Photo_Guidelines.html" rel="nofollow">NASA image use policy.</a></b> <b><a href="http://www.nasa.gov/centers/goddard/home/index.html" rel="nofollow">NASA Goddard Space Flight Center</a></b> enables NASA’s mission through four scientific endeavors: Earth Science, Heliophysics, Solar System Exploration, and Astrophysics. Goddard plays a leading role in NASA’s accomplishments by contributing compelling scientific knowledge to advance the Agency’s mission. <b>Follow us on <a href="http://twitter.com/NASAGoddardPix" rel="nofollow">Twitter</a></b> <b>Like us on <a href="http://www.facebook.com/pages/Greenbelt-MD/NASA-Goddard/395013845897?ref=tsd" rel="nofollow">Facebook</a></b> <b>Find us on <a href="http://instagrid.me/nasagoddard/?vm=grid" rel="nofollow">Instagram</a></b>

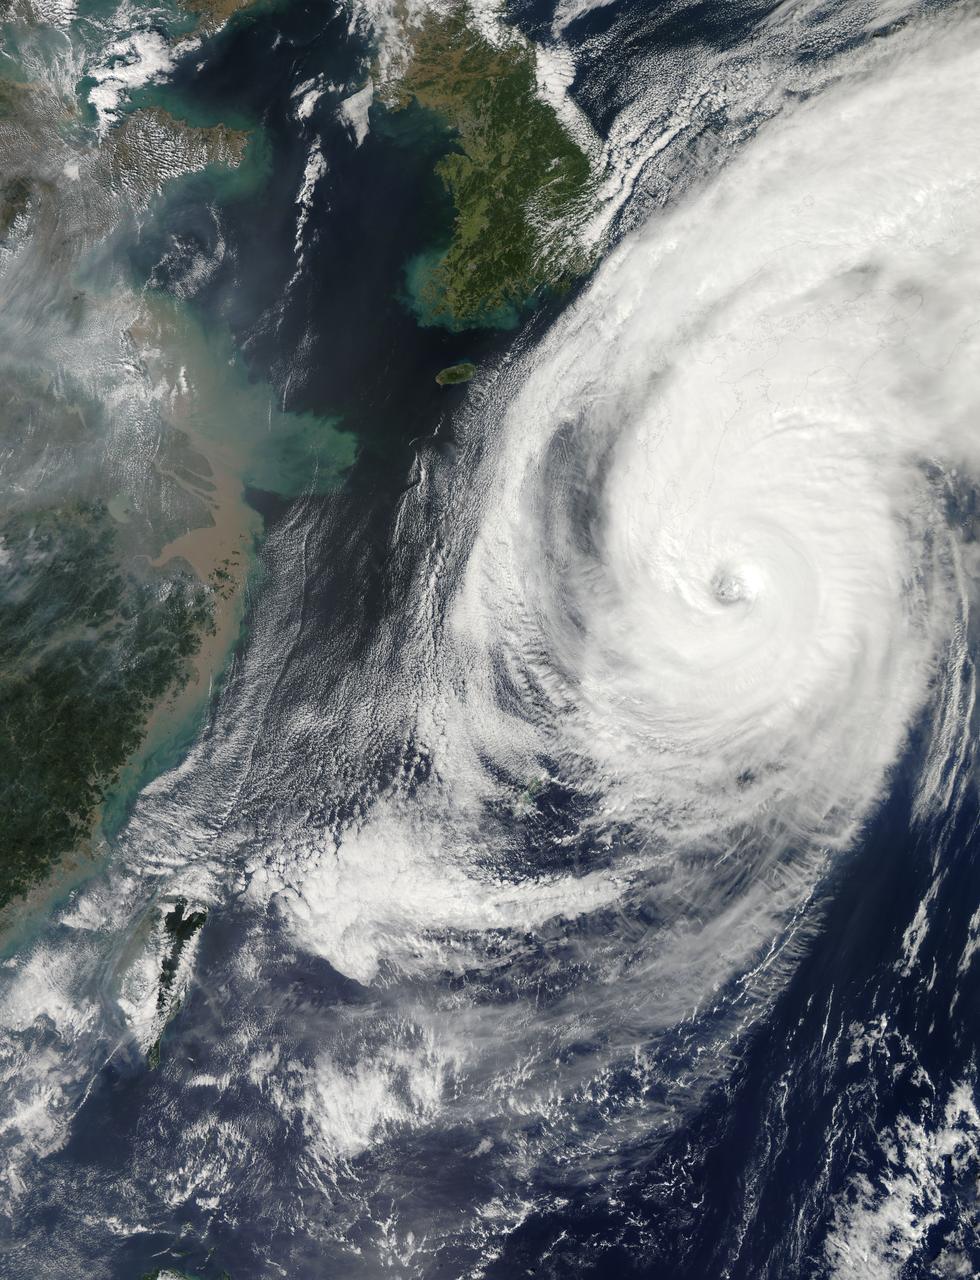
NASA satellite imagery from July 10 revealed a very clear and cloudless eye in the Northwestern Pacific’s Typhoon Soulik as it moves toward a landfall in China by the end of the week. The Moderate Resolution Imaging Spectroradiometer (MODIS) instrument aboard NASA’s Terra satellite captured a visible image of Typhoon Soulik and its clear eye on July 10, 2013 at 2:10 UTC as it continues to move through the northwestern Pacific Ocean. Soulik’s round eye is about 25 nautical miles (28.7 miles/46.3 km) wide. Typhoon Soulik’s maximum sustained winds have increased dramatically over the last 24 hours and at 1500 UTC (11 a.m. EDT) on July 10, were blowing at 120 knots (138 mph/222 kph). According to the Joint Typhoon Warning Center, Soulik’s powerful winds are creating seas over 40 feet (12.2 meters) high in the northwestern Pacific Ocean. Soulik’s center was near 21.9 north latitude and 132.9 east longitude, about 420 nautical miles (483.3 miles/777.7 km) southeast of Kadena Air Base, Japan. Soulik is moving to the west-northwest at 13 knots (15 mph/24 kph). Soulik is tracking west-northwest along the southern edge of a subtropical ridge (elongated area) of high pressure. The ridge of high pressure stretches from east to west and westward over the Ryukyu Islands and into the East China Sea along about 30 north latitude. Soulik is still expected to make a landfall in southeastern China on July 12 or 13 after passing north of Taiwan. Text credit: Rob Gutro More info about the storm: <a href="http://1.usa.gov/12mvQcC" rel="nofollow">1.usa.gov/12mvQcC</a> <b><a href="http://www.nasa.gov/audience/formedia/features/MP_Photo_Guidelines.html" rel="nofollow">NASA image use policy.</a></b> <b><a href="http://www.nasa.gov/centers/goddard/home/index.html" rel="nofollow">NASA Goddard Space Flight Center</a></b> enables NASA’s mission through four scientific endeavors: Earth Science, Heliophysics, Solar System Exploration, and Astrophysics. Goddard plays a leading role in NASA’s accomplishments by contributing compelling scientific knowledge to advance the Agency’s mission. <b>Follow us on <a href="http://twitter.com/NASA_GoddardPix" rel="nofollow">Twitter</a></b> <b>Like us on <a href="http://www.facebook.com/pages/Greenbelt-MD/NASA-Goddard/395013845897?ref=tsd" rel="nofollow">Facebook</a></b> <b>Find us on <a href="http://instagram.com/nasagoddard?vm=grid" rel="nofollow">Instagram</a></b>
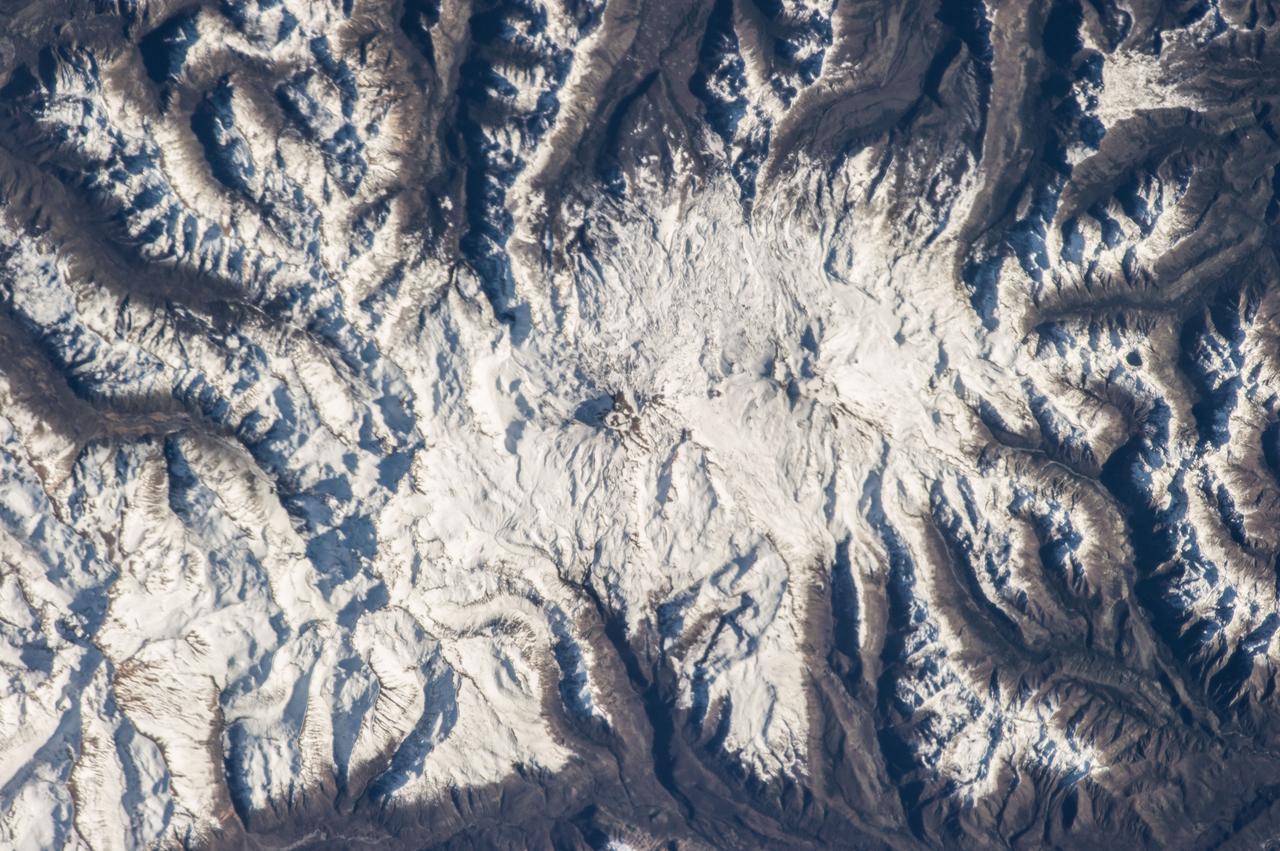
ISS036-E-007165 (11 June 2013) --- Nevados de Chillan, Chile is featured in this image photographed by an Expedition 36 crew member on the International Space Station. This photograph highlights a large volcanic area located near the Chile-Argentina border. Like other historically active volcanoes in the central Andes ranges, the Nevados de Chillan were created by upwelling magma generated by eastward subduction of the dense oceanic crust of the Pacific basin beneath the less dense continental crust of South America. Rising magmas associated with this type of tectonic environment frequently erupt explosively, forming widespread ash and ignimbrite layers. They can also produce less explosive eruptions that form voluminous lava flows – layering together with explosively erupted deposits to build the classic cone-shaped edifice of a stratovolcano over geologic time. The Nevados de Chillan includes three distinct volcanic structures, built within three overlapping calderas that extend along a north-northwest to south-southeast line. The snow-capped volcanic complex sits within the glaciated terrain of the central Andes – glacial valleys are visible at upper left, upper right, and lower right. The northwestern end of the chain is occupied by the 3,212-meter-high Cerro Blanco (also known as Volcan Nevado). The 3,089-meter-high Volcan Viejo (also known as Volcan Chillan) sits at the southeastern end; this volcano was active during the 17th-19th centuries. A group of lava domes known as Volcan Nuevo formed to the northwest of Volcan Viejo between 1906-1945, followed by an even younger dome complex that formed between 1973-1986 (Volcan Arrau; not indicated on the image). The last reported volcanic activity at Nevados de Chillan took place in 2009 (according to the Smithsonian Institution’s Global Volcanism Network).
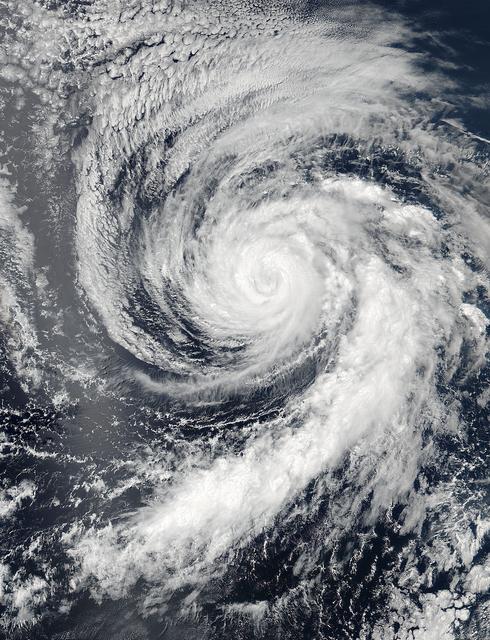
Hurricane Darby as observed by the Atmospheric Infrared Sounder AIRS onboard NASA Aqua in July, 2004. This daylight image of Hurricane Darby on July 28 was made with the visible sensor in the AIRS instrument suite. After reaching sustained winds on July 27 of 100 knots (115 mph) with gusts to 120 knots (138 mph), the intensity of the storm is now lowered to 75 knots (86 mph). Located in the eastern north Pacific Ocean located about 1,165 miles west-southwest of the southern tip of Baja California, the storm continues its west/northwest path at 14 knots (16mph). Figure 1 is a daylight snapshot from AIRS visible/near-infrared sensor before Darby became a tropical storm. Darby is in the upper right-hand corner. Circulation is not apparent because the storm was not organized sufficiently to allow the nascent eye to appear. At this time, winds were approximately 35 mph. Figure 2 is an AIRS infrared image. Darby falls on the edge of two AIRS data granules, which have been "stitched" together in this image. Storm intensity is lowered to 75 knots (86 mph), down from 100 knots (115 mph). http://photojournal.jpl.nasa.gov/catalog/PIA00439
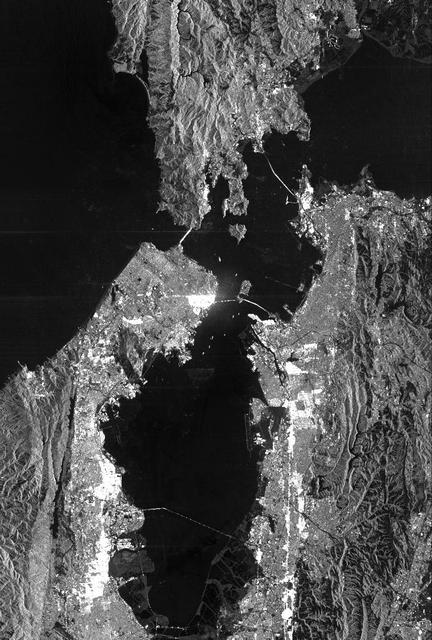
This is a radar image of San Francisco, California, taken on October 3,1994. The image is about 40 kilometers by 55 kilometers (25 miles by 34 miles) with north toward the upper right. Downtown San Francisco is visible in the center of the image with the city of Oakland east (to the right) across San Francisco Bay. Also visible in the image is the Golden Gate Bridge (left center) and the Bay Bridge connecting San Francisco and Oakland. North of the Bay Bridge is Treasure Island. Alcatraz Island appears as a small dot northwest of Treasure Island. This image was acquired by the Spaceborne Imaging Radar-C and X-band Synthetic Aperture Radar (SIR-C/X-SAR) aboard the space shuttle Endeavour on orbit 56. The image is centered at 37 degrees north latitude, 122degrees west longitude. This single-frequency SIR-C image was obtained by the L-band (24 cm) radar channel, horizontally transmitted and received. Portions of the Pacific Ocean visible in this image appear very dark as do other smooth surfaces such as airport runways. Suburban areas, with the low-density housing and tree-lined streets that are typical of San Francisco, appear as lighter gray. Areas with high-rise buildings, such as those seen in the downtown areas, appear in very bright white, showing a higher density of housing and streets which run parallel to the radar flight track. http://photojournal.jpl.nasa.gov/catalog/PIA01751

This false-color image of Jupiter was taken on May 18, 2017, with a mid-infrared filter centered at a wavelength of 8.8 microns, at the Subaru Telescope in Hawaii, in collaboration with observations of Jupiter by NASA's Juno mission. The selected wavelength is sensitive to Jupiter's tropospheric temperatures and the thickness of a cloud near the condensation level of ammonia gas. The Great Red Spot appears distinctively at the lower center of the planet as a cold region with a thick cloud layer. It is surrounded by a warm and relatively clear periphery. To its northwest is a turbulent and chaotic region where bands of gas that is warm and dry alternate with bands of gas that is cold and moist. This image, taken a few hours before Juno's sixth close approach to Jupiter, shows the detailed atmospheric structure of the Great Red Spot and its surroundings that the Juno mission will encounter on its seventh closest approach to Jupiter on July 10, 2017, Pacific Time (July 11, Universal Time). The instrument used to take this image is Cooled Mid-Infrared Camera and Spectrometer (COMICS) of the National Astronomical Observatory of Japan's Subaru Telescope on Hawaii's Maunakea peak. https://photojournal.jpl.nasa.gov/catalog/PIA21714
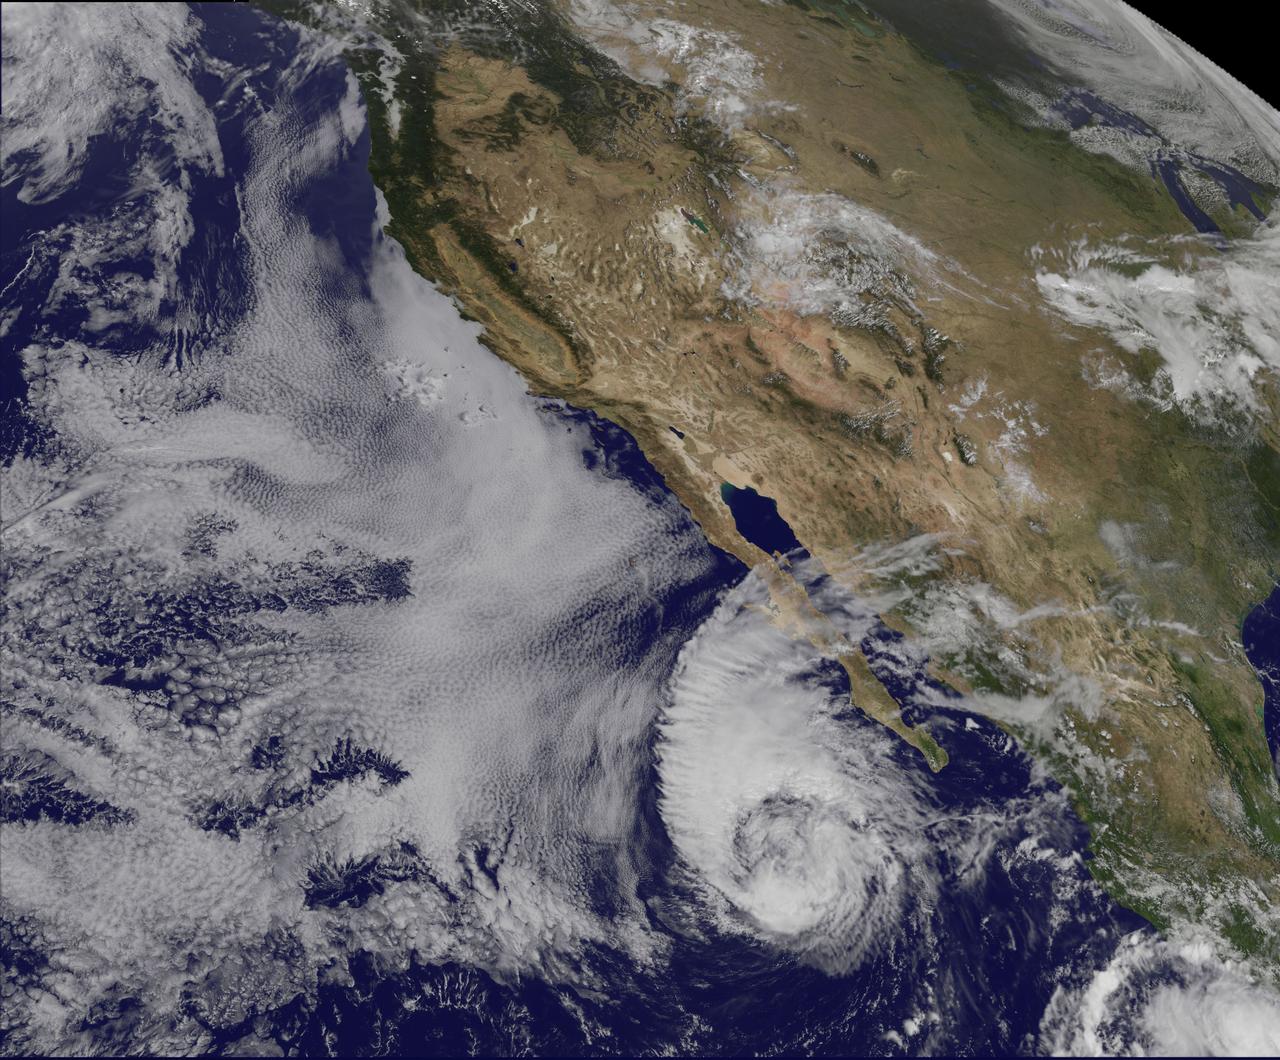
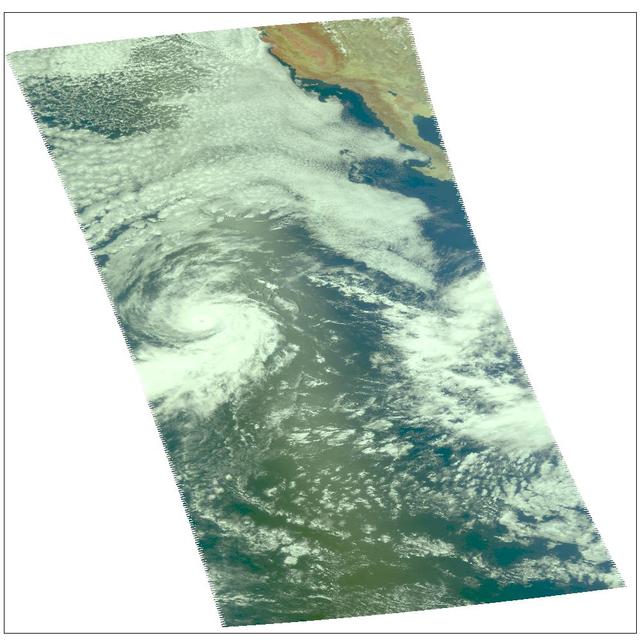
This visible image of Tropical Storm Miriam was captured by NOAA's GOES-15 satellite on Sept. 26, 2012 at 10:45 a.m. EDT off the coast of Baja California. The strongest thunderstorms were in a large band of thunderstorms north and northwest of the center. Miriam is banked to the north and west by an extensive field of stratocumulus clouds. Credit: NASA/NOAA GOES Project ---- Once a powerful hurricane, Miriam is now a tropical storm off the coast of Baja California, Mexico. Tropical Storm Miriam was seen in the Eastern Pacific Ocean by NOAA's GOES-15 satellite, and the visible image revealed that the strongest part of the storm was north and west of the center. NOAA's GOES-15 satellite sits in a fixed position over the western U.S. that allows it to monitor the Eastern Pacific Ocean and it captured a visible image of Tropical Storm Miriam on Sept. 26, 2012 at 10:45 a.m. EDT off the coast of Baja California. The strongest thunderstorms were north and northwest of the center in a large band, wrapping around the center of the tropical storm. Miriam is banked to the north and west by an extensive field of stratocumulus clouds Wind shear is taking its toll on Miriam. The National Hurricane Center noted there is an increasing "separation between the low- to mid-level centers of the storm (think of the storm as having multiple layers) due to 20-25 knots of southwesterly shear associated with a shortwave trough (elongated area of low pressure) rotating around the northwestern side of the storm. At 11 a.m. EDT on Sept. 26, Tropical Storm Miriam had maximum sustained winds near 65 mph (100 kph), dropping from 70 mph (100 kmh) just six hours before. It was located about 425 miles (680 km) west-southwest of the southern tip of Baja California Miriam was moving slowly at 6 mph (9 kmh) to the north-northwest and away from the coast. Miriam's minimum central pressure was near 992 millibars. A Miriam continues to pull away from Baja California, rough ocean swells will keep affecting the south and west coasts today, Sept. 26, and tomorrow, Sept. 27. By Sept. 28, Friday, the ocean swells will gradually begin to subside. Miriam is moving into a region where wind shear is forecast to increase and sea surface temperatures will fall. Those are two factors that will contribute to the weakening of the tropical storm over the next several days. Rob Gutro NASA's Goddard Space Flight Center Image: NASA GOES Project <b><a href="http://www.nasa.gov/audience/formedia/features/MP_Photo_Guidelines.html" rel="nofollow">NASA image use policy.</a></b> <b><a href="http://www.nasa.gov/centers/goddard/home/index.html" rel="nofollow">NASA Goddard Space Flight Center</a></b> enables NASA’s mission through four scientific endeavors: Earth Science, Heliophysics, Solar System Exploration, and Astrophysics. Goddard plays a leading role in NASA’s accomplishments by contributing compelling scientific knowledge to advance the Agency’s mission. <b>Follow us on <a href="http://twitter.com/NASA_GoddardPix" rel="nofollow">Twitter</a></b> <b>Like us on <a href="http://www.facebook.com/pages/Greenbelt-MD/NASA-Goddard/395013845897?ref=tsd" rel="nofollow">Facebook</a></b> <b>Find us on <a href="http://instagrid.me/nasagoddard/?vm=grid" rel="nofollow">Instagram</a></b>
STS098-712-091 (7-20 February 2001) --- The forested area of the Panama Canal Zone can be seen near the center of this north-looking image, photographed with a 70mm handheld camera from the Earth-orbiting Space Shuttle Atlantis. (NOTE: The image should be oriented with Panama running horizontally and the majority of the clouds at the top). The Panama Canal Zone extends 5 miles (8 kilometers) on either side of the Panama Canal. The forested zone acts as a buffer for the canal to help prevent erosion and sediment from clogging the canal. Most of the countryside on both sides of the Canal Zone has been deforested to make way for large ranches and the raising of cattle. Though some sedimentation is occurring, dredging of the canal keeps the passage clear. The Panama Canal is 40 miles (64 kilometers) long including dredged approach channels at each end. With the Caribbean Sea covering the upper portion of the image and the Pacific Ocean covering the lower portion of the image, the canal traverses the Isthmus of Panama in a northwest to southeast direction. Gatun Lake, one of the largest artificial lakes in the world, is visible at the north end of the Canal Zone. Panama City (light-colored grayish area) is discernible to the right of the canal at its southern entrance from the Pacific Ocean. In 1996, 15,000 ships traveled through the canal, an average of 42 ships per day. Passage through the canal requires 7 to 8 hours.
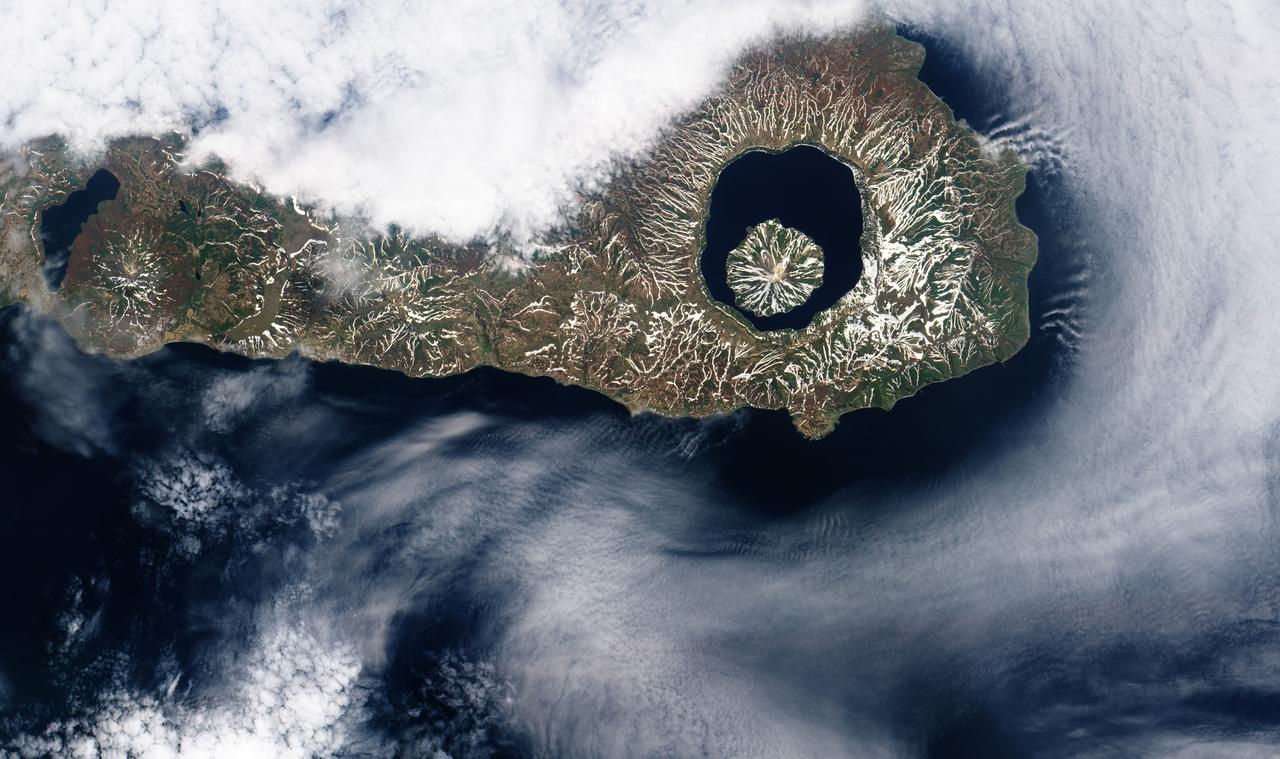
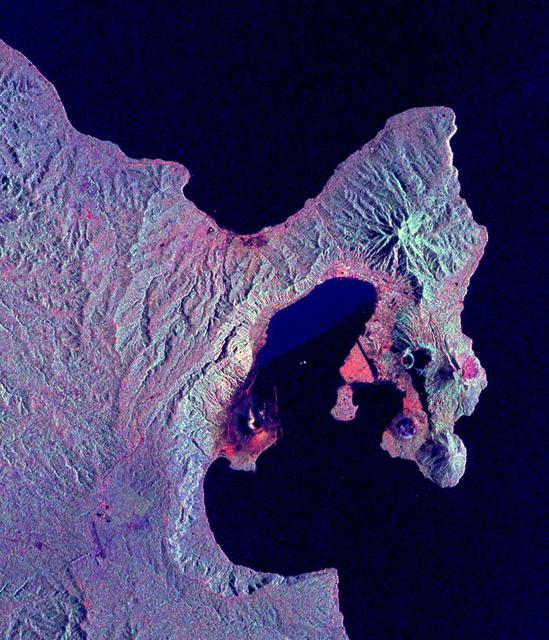
More than 9,000 years ago, a catastrophic volcanic eruption created a huge caldera on the southern end of Onekotan Island, one of the Kuril Islands, located off the southern tip of Russia’s Kamchatka Peninsula. Today, the ancient Tao-Rusyr Caldera is filled by the deep blue waters of Kal’tsevoe Lake. The Advanced Land Imager (ALI) on NASA’s Earth Observing-1 (EO-1) satellite acquired this true-color image of southern Onekotan on June 10, 2009. In this late-spring shot, snow or ice lingers on the land, forming white streaks on a brown-and-green land surface. In the northwest quadrant of the caldera is Krenitzyn Peak, which rises to a height of 1,325 meters (4,347 feet). Like the other Kuril Islands, Onekotan lies along the Pacific “Ring of Fire.” The Kuril Island volcanoes are fueled by magma generated by the subduction of the Pacific Plate under the Eurasian Plate, which takes place along a deep trench about 200 kilometers (120 miles) to the islands’ east. The only historical eruption at Krenitzyn Peak occurred in 1952, a week after a magnitude 9.0 earthquake along the subduction fault. NASA Earth Observatory image created by Robert Simmon, using EO-1 ALI data provided courtesy of the NASA EO-1 team. Caption by Michon Scott and Rebecca Lindsey. <b><a href="http://www.nasa.gov/audience/formedia/features/MP_Photo_Guidelines.html" rel="nofollow">NASA image use policy.</a></b> <b><a href="http://www.nasa.gov/centers/goddard/home/index.html" rel="nofollow">NASA Goddard Space Flight Center</a></b> enables NASA’s mission through four scientific endeavors: Earth Science, Heliophysics, Solar System Exploration, and Astrophysics. Goddard plays a leading role in NASA’s accomplishments by contributing compelling scientific knowledge to advance the Agency’s mission. <b>Follow us on <a href="http://twitter.com/NASAGoddardPix" rel="nofollow">Twitter</a></b> <b>Like us on <a href="http://www.facebook.com/pages/Greenbelt-MD/NASA-Goddard/395013845897?ref=tsd" rel="nofollow">Facebook</a></b> <b>Find us on <a href="http://instagrid.me/nasagoddard/?vm=grid" rel="nofollow">Instagram</a></b>
ISS031-E-041635 (20 May 2012) --- Photographed by the Expedition 31 crew aboard the International Space Station and easily spotted at top center in this image is the gray shadow of the moon, cast on bright clouds of the northern Pacific Ocean, as the May 20 solar eclipse point tracked towards the Aleutian Islands and then on to northern California. The eclipse is seen obliquely so it appears as a flattened circle. The eclipse was visible for about 3.5 hours, and since the ISS orbits Earth every 90 minutes there was a chance that the ISS crew would see (if not the total eclipse by looking directly overhead), some evidence at least in the form of a partial eclipse. Only since the start of human spaceflight could such an image have been shot, looking back at the moon’s shadow projected against Earth. As it happened, say NASA scientists, the timing was almost as good as if it had been planned. The space station passed “behind” the eclipse on May 20, that is, the shadow of the eclipse passed the point in the Northwest Pacific Ocean only three minutes before the station crossed the same point. But the crew was still able to see the densest part of the shadow a little more than 600 kilometers to the northeast of their position when they shot this photograph. The edge of the shadow looks diffused because of the partial eclipse zone—the wide area where more or less of the sun can be seen around the edge of the moon. The zone of partial eclipse covers a far wider area than the area covered by the total eclipse. Twenty-six minutes later, as they approached Antarctica in the other hemisphere, the six-member crew saw the sun set as they passed onto the dark side of the planet.
This is a radar image of the Rabaul volcano on the island of New Britain, Papua, New Guinea taken almost a month after its September 19, 1994, eruption that killed five people and covered the town of Rabaul and nearby villages with up to 75 centimeters (30 inches) of ash. More than 53,000 people have been displaced by the eruption. The image was acquired by the Spaceborne Imaging Radar-C/X-band Synthetic Aperture Radar (SIR-C/X-SAR) aboard the space shuttle Endeavour on its 173rd orbit on October 11, 1994. This image is centered at 4.2 degrees south latitude and 152.2 degrees east longitude in the southwest Pacific Ocean. The area shown is approximately 21 kilometers by 25 kilometers (13 miles by 15.5 miles). North is toward the upper right. The colors in this image were obtained using the following radar channels: red represents the L-band (horizontally transmitted and received); green represents the L-band (horizontally transmitted and vertically received); blue represents the C-band (horizontally transmitted and vertically received). Most of the Rabaul volcano is underwater and the caldera (crater) creates Blanche Bay, the semi-circular body of water that occupies most of the center of the image. Volcanic vents within the caldera are visible in the image and include Vulcan, on a peninsula on the west side of the bay, and Rabalanakaia and Tavurvur (the circular purple feature near the mouth of the bay) on the east side. Both Vulcan and Tavurvur were active during the 1994 eruption. Ash deposits appear red-orange on the image, and are most prominent on the south flanks of Vulcan and north and northwest of Tavurvur. A faint blue patch in the water in the center of the image is a large raft of floating pumice fragments that were ejected from Vulcan during the eruption and clog the inner bay. Visible on the east side of the bay are the grid-like patterns of the streets of Rabaul and an airstrip, which appears as a dark northwest-trending band at the right-center of the image. Ashfall and subsequent rains caused the collapse of most buildings in the town of Rabaul. Mudflows and flooding continue to pose serious threats to the town and surrounding villages. Volcanologists and local authorities expect to use data such as this radar image to assist them in identifying the mechanisms of the eruption and future hazardous conditions that may be associated with the vigorously active volcano. http://photojournal.jpl.nasa.gov/catalog/PIA01767

Composite image of category 5 Hurricane Patricia, off the Pacific coast of Mexico, from 06:00 UTC on Friday, 23 October 2015. At 8 a.m. EDT on October 23, 2015, the National Hurricane Center said that Hurricane Patricia had grown into a monster hurricane. In fact, it is the strongest eastern north pacific hurricane on record. At 8 a.m. EDT (1200 UTC) on Oct. 23, the eye of Hurricane Patricia was located near latitude 17.3 North, longitude 105.6 West. That's about 145 miles (235 km) southwest of Manzanillo, Mexico and about 215 miles (345 km) south of Cabo Corrientes, Mexico. Patricia was moving toward the north-northwest near 12 mph (19 kph) and a turn toward the north is expected later this morning, followed by a turn toward the north-northeast this afternoon. On the forecast track, the core of Patricia will make landfall in the hurricane warning area today, October 23, 2015 during the afternoon or evening. Maximum sustained winds remain near 200 mph (325 kph) with higher gusts. The National Hurricane Center (NHC) said that Patricia is a category 5 hurricane on the Saffir-Simpson Hurricane Wind Scale. Some fluctuations in intensity are possible today, but Patricia is expected to remain an extremely dangerous category 5 hurricane through landfall. Hurricane force winds extend outward up to 30 miles (45 km) from the center and tropical storm force winds extend outward up to 175 miles (280 km). The estimated minimum central pressure is 880 millibars. Copyright: 2015 EUMETSAT. Infrared data from the geostationary satellites of EUMETSAT and NOAA overlays a computer-generated model of the Earth, containing NASA's Blue Marble Next Generation imagery <b><a href="http://www.nasa.gov/audience/formedia/features/MP_Photo_Guidelines.html" rel="nofollow">NASA image use policy.</a></b> <b><a href="http://www.nasa.gov/centers/goddard/home/index.html" rel="nofollow">NASA Goddard Space Flight Center</a></b> enables NASA’s mission through four scientific endeavors: Earth Science, Heliophysics, Solar System Exploration, and Astrophysics. Goddard plays a leading role in NASA’s accomplishments by contributing compelling scientific knowledge to advance the Agency’s mission. <b>Follow us on <a href="http://twitter.com/NASAGoddardPix" rel="nofollow">Twitter</a></b> <b>Like us on <a href="http://www.facebook.com/pages/Greenbelt-MD/NASA-Goddard/395013845897?ref=tsd" rel="nofollow">Facebook</a></b> <b>Find us on <a href="http://instagrid.me/nasagoddard/?vm=grid" rel="nofollow">Instagram</a></b>
Over the weekend of Oct. 5 and 6, Typhoon Phanfone's center made landfall just south of Tokyo and passed over the city before exiting back into the Northwestern Pacific Ocean. NASA's Aqua satellite captured a picture of the typhoon as Tokyo braced for its large eye. On its way to mainland Japan, Phanfone struck Kadena Air Base on the island of Okinawa. According to the website for U.S. Air Force Kadena Air Base (<a href="http://www.kadena.af.mil" rel="nofollow">www.kadena.af.mil</a>), "One Airman is confirmed deceased and two more are missing after they were washed out to sea from the northwest coast of Okinawa at about 3:45 p.m. Oct. 5. An Airman that was found by the Japanese Coast Guard and pulled from the sea was later pronounced dead at a local hospital. HH-60s from Kadena Air Base and Japanese Coast Guard are continuing to search for the remaining two Airmen. Rough seas are complicating rescue efforts." Typhoon Phanfone's large eye made landfall near the city of Hamamatsu on Oct. 5 around 8 a.m. local time and then tracked north before turning eastward into the Pacific Ocean north of Tokyo. The MODIS instrument known as the Moderate Resolution Imaging Spectroradiometer captures amazing pictures from its orbit aboard NASA's Aqua satellite. MODIS snapped a picture of Typhoon Phanfone approaching Japan on Oct. 5 at 12:55 a.m. EDT. At that time, the Typhoon had already passed north of Okinawa, and was just south of the large island of Kyushu. The MODIS image revealed a large eye with powerful bands of thunderstorms spiraling into the center. On Oct. 6 by 0900 UTC (5 a.m. EDT), Phanfone had weakened from a typhoon to a tropical storm back over open waters of the Northwestern Pacific Ocean. Maximum sustained winds were near 60 knots (69.0 mph/111.1 kph). Phanfone was located near 38.0 north longitude and 145.0 east latitude. That's about 201 nautical miles (271 miles/372 km) south-southeast of Misawa Air Base, Japan. Phanfone was moving to the northeast at 40 knots (46 mph/74 kph). Forecasters at the Joint Typhoon Warning Center (JTWC) using animated multispectral satellite imagery noted that Phanfone is being affected by strong wind shear. The wind shear has stretched the tropical storm out, and pushed the bulk of thunderstorms northeast of the center. In addition, Phanfone has transitioned into an extra-tropical storm, which means that its core transitioned from warm to cold. JTWC called for Phanfone to continue accelerating northeastward and weaken as an extra-tropical cyclone over water. <b><a href="http://www.nasa.gov/audience/formedia/features/MP_Photo_Guidelines.html" rel="nofollow">NASA image use policy.</a></b> <b><a href="http://www.nasa.gov/centers/goddard/home/index.html" rel="nofollow">NASA Goddard Space Flight Center</a></b> enables NASA’s mission through four scientific endeavors: Earth Science, Heliophysics, Solar System Exploration, and Astrophysics. Goddard plays a leading role in NASA’s accomplishments by contributing compelling scientific knowledge to advance the Agency’s mission. <b>Follow us on <a href="http://twitter.com/NASAGoddardPix" rel="nofollow">Twitter</a></b> <b>Like us on <a href="http://www.facebook.com/pages/Greenbelt-MD/NASA-Goddard/395013845897?ref=tsd" rel="nofollow">Facebook</a></b> <b>Find us on <a href="http://instagram.com/nasagoddard?vm=grid" rel="nofollow">Instagram</a></b>
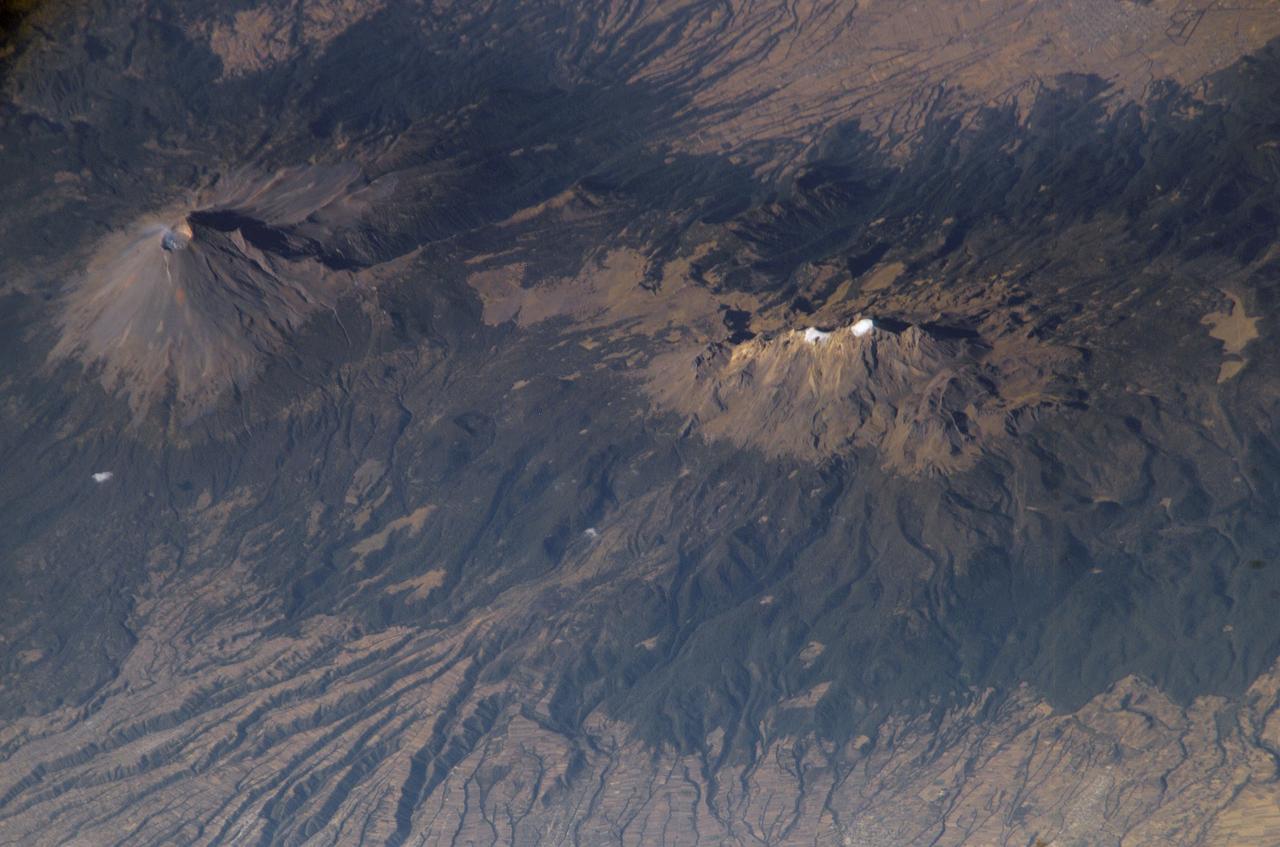
ISS006-E-28546 (16 February 2003) --- Popocatepetl and Iztaccíhuatl Volcanoes in Mexico are featured in this digital image photographed by an Expedition 6 crewmember on the International Space Station (ISS). As part of the circum-Pacific “Ring of Fire”, Mexico hosts several of the world’s most continually active volcanoes including the massive Popocatepetl (Aztec for “Smoking Mountain”). This detailed oblique photograph also depicts a neighboring volcano, Iztaccíhuatl (the “Woman in White”). Popocatepetl has produced small, intermittent eruptions since 1994. In addition to the constant potential of eruptions producing ash deposits, pyroclastic flows, and lava, the summit of Popocatepetl also hosts glaciers. These can melt during eruptions to form mudflows that blanket areas to the south. In contrast to Popocatepetl’s well-defined symmetrical cone, Iztaccíhuatl is formed from several overlapping smaller cones that trend north-northwest to south-southeast. Glaciers and year-round snow are also present on Iztaccíhuatl (white regions along the peaks). According to NASA scientists, deep valleys have been eroded into the massive apron of ash and pumice deposits, glacial outwash, and alluvium to the east of the volcano. Despite its close proximity, similar age, and similar geologic character to Popocatepetl, Iztaccíhuatl has not erupted in historic times. This has encouraged the establishment of numerous agricultural fields (visible as faint rectilinear patterns in the lower half of the image) on the eastern flank of the mountain.
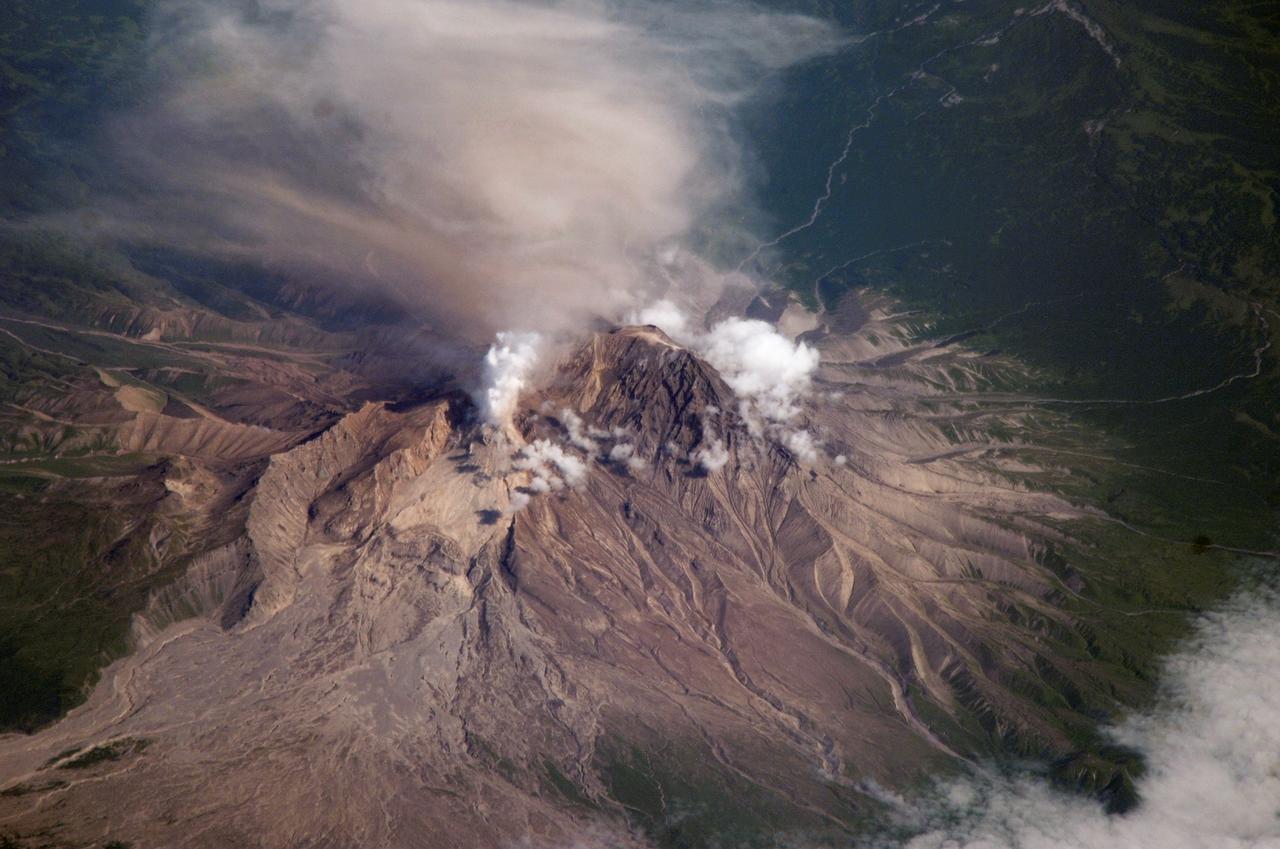
ISS015-E-16913 (10 July 2007) --- Shiveluch Volcano, Kamchatka, Russian Far East is featured in this image photographed by an Expedition 15 crewmember on the International Space Station. Shiveluch is one of the biggest and most active of a line of volcanoes along the spine of the Kamchatka peninsula in easternmost Russia. In turn the volcanoes and peninsula are part of the tectonically active "Ring of Fire" that almost surrounds the Pacific Ocean, denoted by active volcanoes and frequent earthquakes. Shiveluch occupies the point where the northeast-trending Kamchatka volcanic line intersects the northwest-trending Aleutian volcanic line. Junctions such as this are typically points of intense volcanic activity. According to scientists, the summit rocks of Shiveluch have been dated at approximately 65,000 years old. Lava layers on the sides of the volcano reveal at least 60 major eruptions in the last 10,000 years, making it the most active volcano in the 2,200 kilometer distance that includes the Kamchatka peninsula and the Kuril island chain. Shiveluch rises from almost sea level to well above 3,200 miles (summit altitude 3,283 miles) and is often capped with snow. In this summer image however, the full volcano is visible, actively erupting ash and steam in late June or early July, 2007. The dull brown plume extending from the north of the volcano summit is most likely a combination of ash and steam (top). The two larger white plumes near the summit are dominantly steam, a common adjunct to eruptions, as rain and melted snow percolate down to the hot interior of the volcano. The sides of the volcano show many eroded stream channels. The south slope also reveals a long sloping apron of collapsed material, or pyroclastic flows. Such debris flows have repeatedly slid down and covered the south side of the volcano during major eruptions when the summit lava domes explode and collapse (this occurred during major eruptions in 1854 and 1964). Regrowth of the forest on the south slope (note the contrast with the eastern slope) has been foiled by the combined effects of continued volcanic activity, instability of the debris flows and the short growing season.
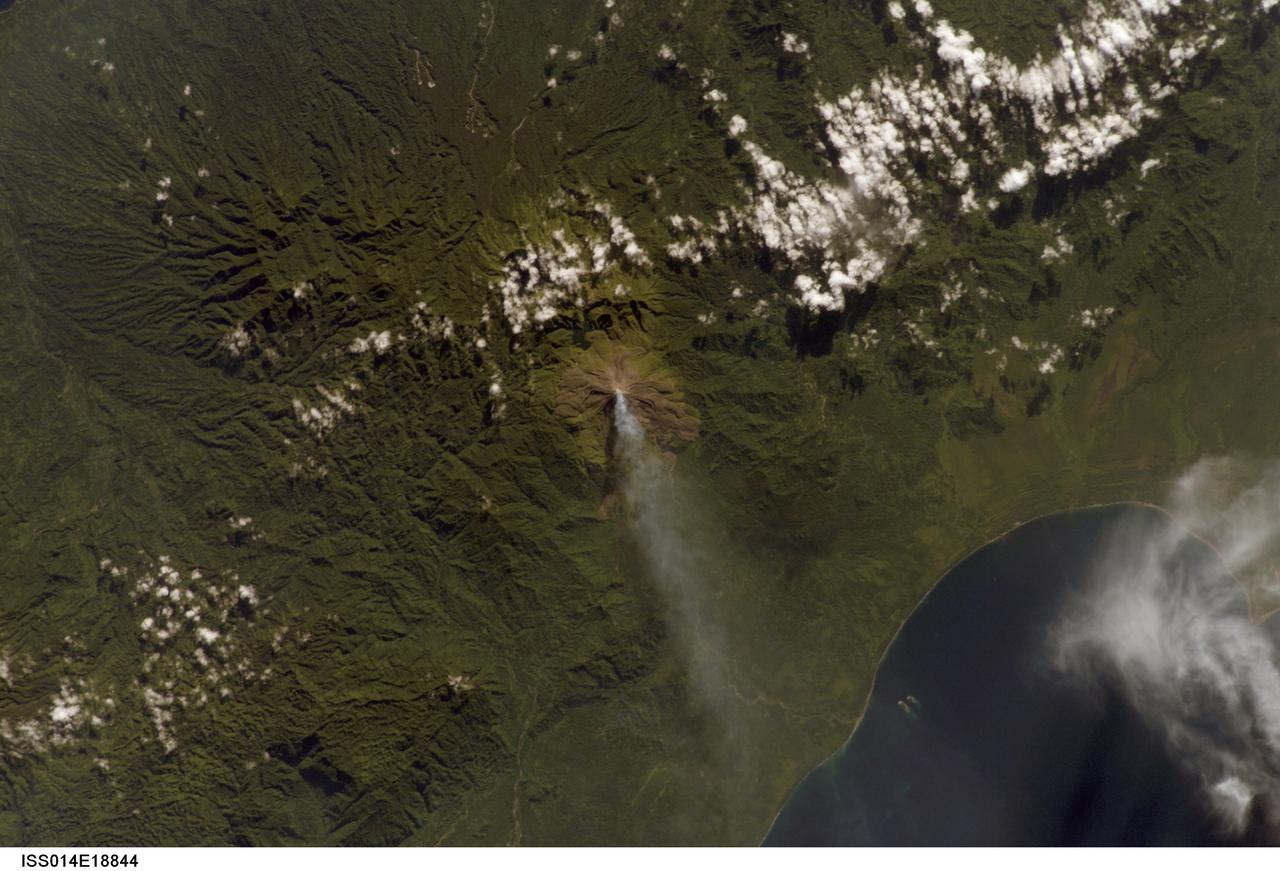
ISS014-E-18844 (2 April 2007) --- A plume at Mt. Bagana, Bougainville Island is featured in this image photographed by an Expedition 14 crewmember on the International Space Station. Bougainville Island, part of the Solomon Islands chain to the east of Papua New Guinea, is typical of many Pacific Rim islands in that volcanism has played a large part in both its geological and recorded history. The island hosts three large volcanoes along its northwest-southeast trending axis: Mt. Balbi, Mt. Bagana, and the Mt. Takuan volcanic complex. Mt. Bagana (near center) is the only volcano on the island that has been historically active. Light green stressed vegetation, and brown lobate lava flows mark the 1,750 meter high lava cone of Mt. Bagana within the verdant landscape of Bougainville Island. The eruptive style of the volcano is typically non-explosive, producing thick lobes of andesitic lava that run down the flanks and maintain a dome in the summit crater. Occasional pyroclastic flows have also been noted. The most recent phase of activity, which began on March 7, has been characterized by vapor plumes with occasional ash-producing emissions. This photograph, acquired almost one month (twenty days) after the last reported activity at Bagana, records a diffuse white vapor plume extending west-southwest from the summit. The Solomon Island region experiences other effects due to the geologic setting: earlier this week, a large but shallow earthquake shook the region and induced a tsunami that hit the western part of the Solomon Island chain.

STS078-S-001 (March 1998) --- The STS-78 mission links the past with the present through a crew patch influenced by Pacific Northwest Native American art. Central to the design is the space shuttle Columbia, whose shape evokes the image of the eagle, an icon of power and prestige and the national symbol of the United States. The eagle?s feathers, representing both peace and friendship, symbolize the spirit of international unity on STS-78. An orbit surrounding the mission number recalls the traditional NASA emblem. The Life Sciences and Microgravity Spacelab (LMS) is housed in Columbia?s payload bay and is depicted in a manner reminiscent of totem art. The pulsating sun, a symbol of life, displays three crystals representing STS-78?s three high-temperature microgravity materials processing facilities. The constellation Delphinus recalls the dolphin, friend of sea explorers. Each star represents one member of STS-78?s international crew including the alternate payload specialists Pedro Duque and Luca Urbani. The colored thrust rings at the base of Columbia signify the five continents of Earth united in global cooperation for the advancement of all humankind. The NASA insignia design for space shuttle flights is reserved for use by the astronauts and for other official use as the NASA Administrator may authorize. Public availability has been approved only in the forms of illustrations by the various news media. When and if there is any change in this policy, which is not anticipated, the change will be publicly announced. Photo credit: NASA
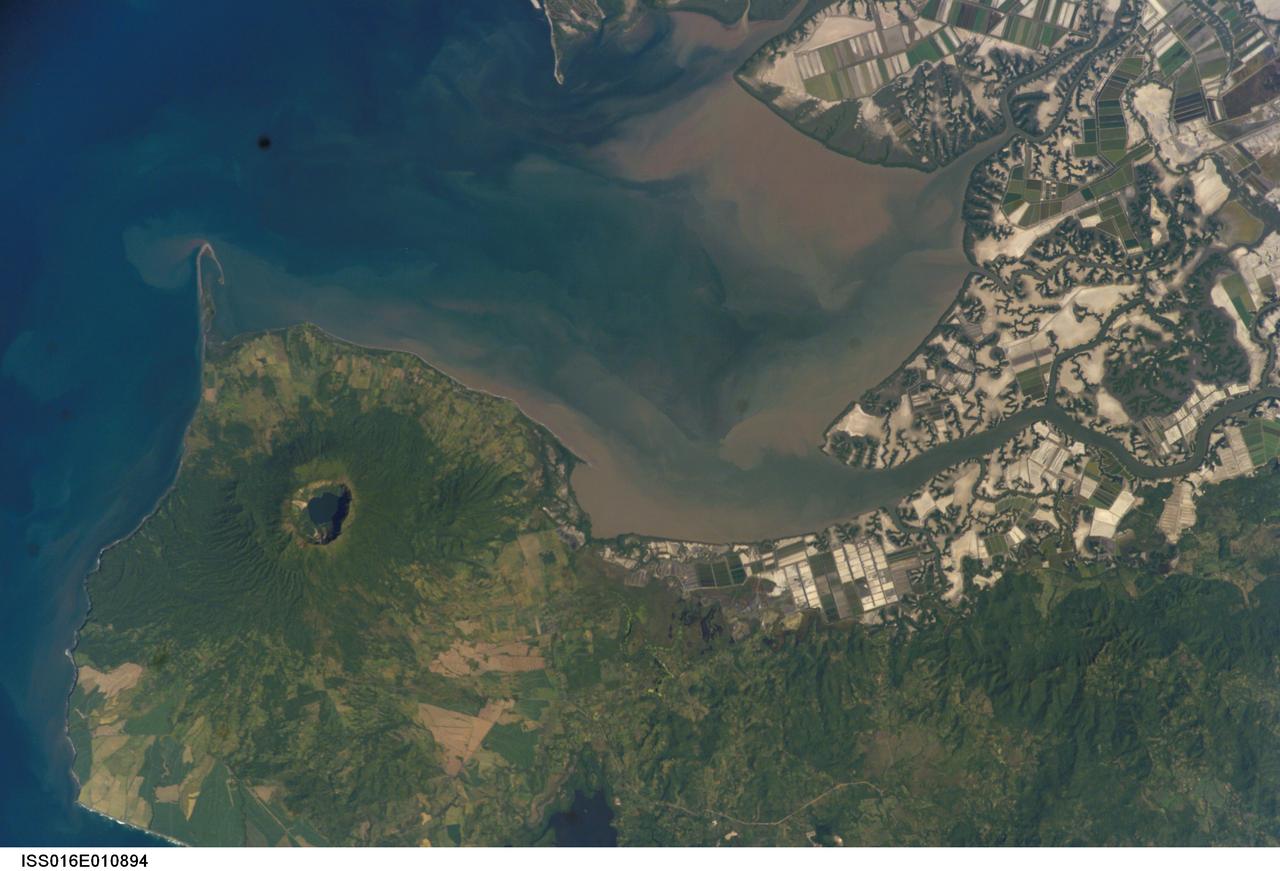
ISS016-E-010894 (17 Nov. 2007) --- Cosiguina Volcano, Nicaragua is featured in this image photographed by an Expedition 16 crewmember on the International Space Station. Three Central American countries (El Salvador, Honduras, and Nicaragua) include coastline along the Gulf of Fonseca that opens into the Pacific Ocean. The southern boundary of the Gulf is a peninsula formed by the Cosiguina volcano illustrated in this view. Cosiguina is a stratovolcano, typically tall cone-shaped structures formed by alternating layers of solidified lava and volcanic rocks (ash, pyroclastic flows, breccias) produced by explosive eruptions. The summit crater is filled with a lake (Laguna Cosiguina). The volcano last erupted in 1859, but its most famous activity occurred in 1835 when it produced the largest historical eruption in Nicaragua. Ash from the 1835 eruption has been found in Mexico, Costa Rica, and Jamaica. The volcano has been quiet since 1859, only an instant in terms of geological time. An earthquake swarm was measured near Cosiguina in 2002, indicating that tectonic forces are still active in the region although the volcano is somewhat isolated from the line of more recently active Central American volcanoes to the northwest and southeast. Intermittently observed gas bubbles in Laguna Cosiguina, and a hot spring along the eastern flank of the volcano are the only indicators of hydrothermal activity at the volcano. The fairly uniform vegetation cover (green) on the volcano's sides also attest to a general lack of gas emissions or "hot spots" on the 872 meter high cone, according to NASA scientists who study the photos downlinked from the orbital outpost.
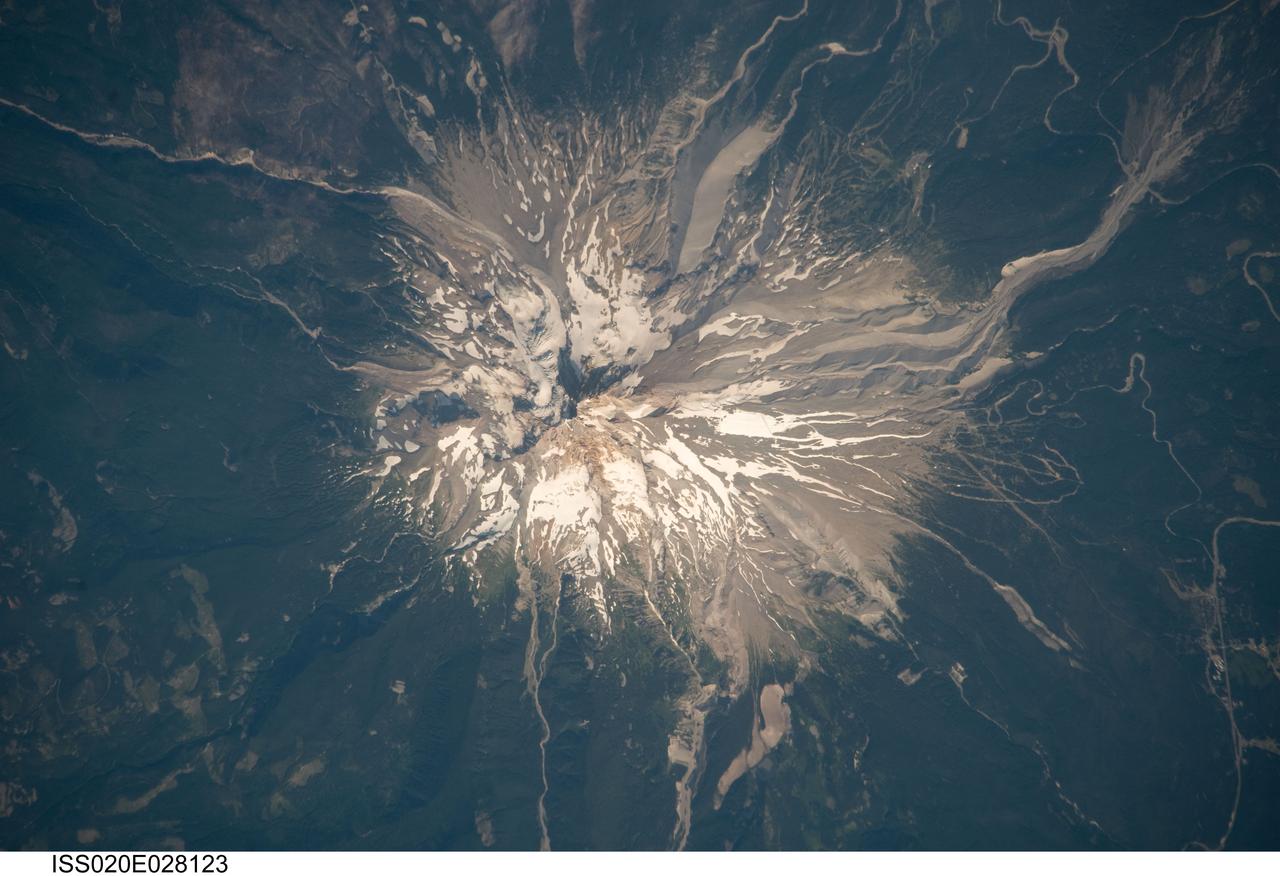
ISS020-E-028123 (5 Aug. 2009) --- Mount Hood, Oregon is featured in this image photographed by an Expedition 20 crew member on the International Space Station. Mount Hood is located within the Cascade Range of the western United States, and is the highest peak (3,426 m) in Oregon. The Cascade Range is characterized by a line of volcanoes associated with a slab of oceanic crust that is subducting, or descending underneath, the westward moving continental crust of North America. Magma generated by the subduction process rises upward through the crust and feeds a line of active volcanoes that extends from northern California in the United States to southern British Columbia in Canada. While hot springs and steam vents are still active on Mount Hood, the last eruption from the volcano occurred in 1866. The volcano is considered dormant, but still actively monitored. Separate phases of eruptive activity produced pyroclastic flows and lahars ? mudflows ? that carried erupted materials down all of the major rivers draining the volcano. Gray volcanic deposits extend southwards along the banks of the White River (upper right), and form several prominent ridges along the southeast to southwest flanks of the volcano. The deposits contrast sharply with the green vegetated lower flanks of the volcano. The Mount Hood stratovolcano ? a typically cone-shaped volcanic structure formed by interlayered lava flows and explosive eruption deposits ? hosts twelve mapped glaciers along its upper flanks (center). Like other glaciers in the Pacific Northwest, the Hood glaciers have been receding due to global warming, and have lost an estimated 61 percent of their volume over the past century. The predicted loss of glacial meltwater under future warming scenarios will have significant effects on regional hydrology and water supplies.
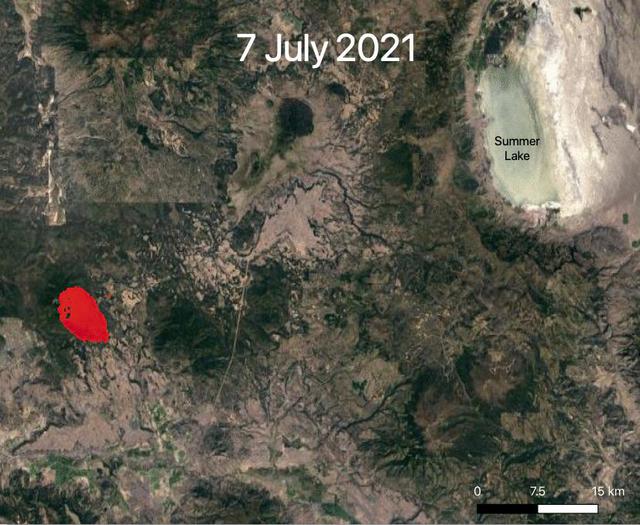
NASA's ECOsystem Spaceborne Thermal Radiometer Experiment on Space Station (ECOSTRESS) is aiding in the fight against fires in the Western U.S. As of July 27, 2021, the Bootleg Fire in southern Oregon had ballooned to more than 410,000 acres, damaging hundreds of buildings and vehicles in its path. ECOSTRESS measures surface temperature from the vantage point of the International Space Station. Researchers of the RADR-Fire team at Pacific Northwest National Laboratory have been experimenting with ECOSTRESS data as part of a new tool now being implemented for first responders like the U.S. Forest Service. In the visualization, ECOSTRESS is tracking the movement of the Bootleg Fire between July 7 and July and identifying its proximity to critical infrastructure — areas in red represent the hottest pixels ECOSTRESS detected. The extreme heat in those areas indicates the fire front, or where resources are most needed. Tasked with detecting plant water use and stress, ECOSTRESS's primary mission is to measure the temperature of plants heating up as they run out of water. But it can also measure and track heat-related phenomena like wildfires, heat waves, and volcanoes. ECOSTRESS observations have a spatial resolution of about 77 by 77 yards (70 by 70 meters), which enables researchers to study surface-temperature conditions down to the size of a football field. Due to the space station's unique orbit, the mission can acquire images of the same regions at different times of the day, as opposed to crossing over each area at the same time of day like satellites in other orbits do. This is advantageous when monitoring plant stress in the same area throughout the day, for example. Movie available at https://photojournal.jpl.nasa.gov/catalog/PIA23695
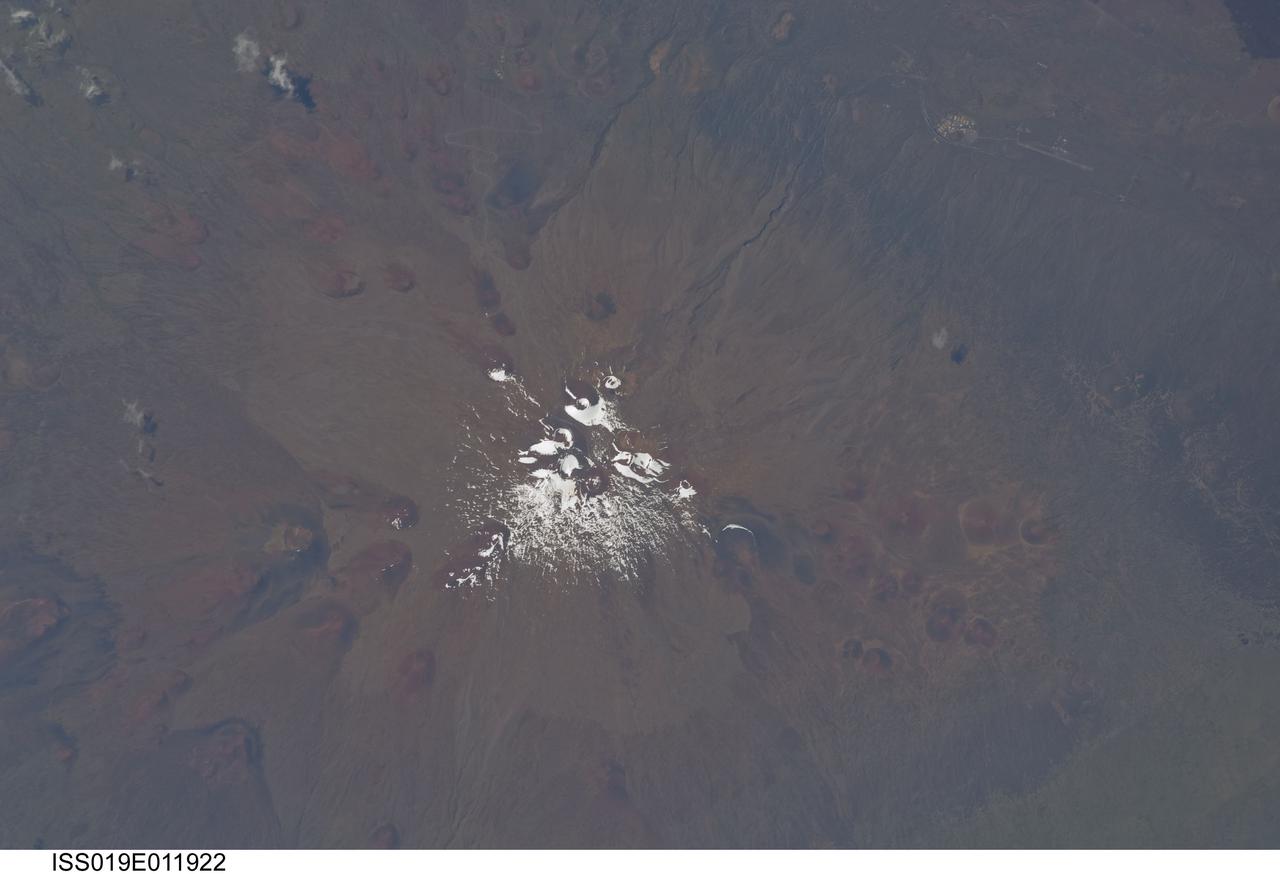
ISS019-E-011922 (28 April 2009) --- Mauna Kea Volcano in Hawaii is featured in this image photographed by an Expedition 19 crewmember on the International Space Station. The island of Hawaii is home to four volcanoes monitored by volcanologists ? Mauna Loa, Hualalai, Kilauea, and Mauna Kea. Mauna Kea is depicted in this view; of the four volcanoes, it is the only one that has not erupted during historical times. The Hawaiian Islands chain, together with the submerged Emperor Chain to the northwest, form an extended line of volcanic islands and seamounts that is thought to record passage of the Pacific Plate over a ?hotspot? (or thermal plume) in the Earth?s mantle. Areas of active volcanism in the southern Hawaiian Islands today mark the general location of the hotspot. This detailed photograph illustrates why the volcano is called Mauna Kea (?white mountain? in Hawaiian). While the neighboring Mauna Loa volcano is a classic shield volcano comprised of dark basaltic lava flows, Mauna Kea experienced more explosive activity during its last eruptive phase. This covered its basalt lava flows with pyroclastic deposits that are visible as the light brown area surrounding snow on the summit (center). Numerous small red to dark gray cinder cones are another distinctive feature of Mauna Loa. The cinder cones represent the most recent type of volcanic activity at the volcano. A small area of buildings and roadways at upper right is the Pohakuloa Training Area. This is the largest US Department of Defense facility in the state of Hawaii. The site is used for U.S. Army and Marine Corps exercises.
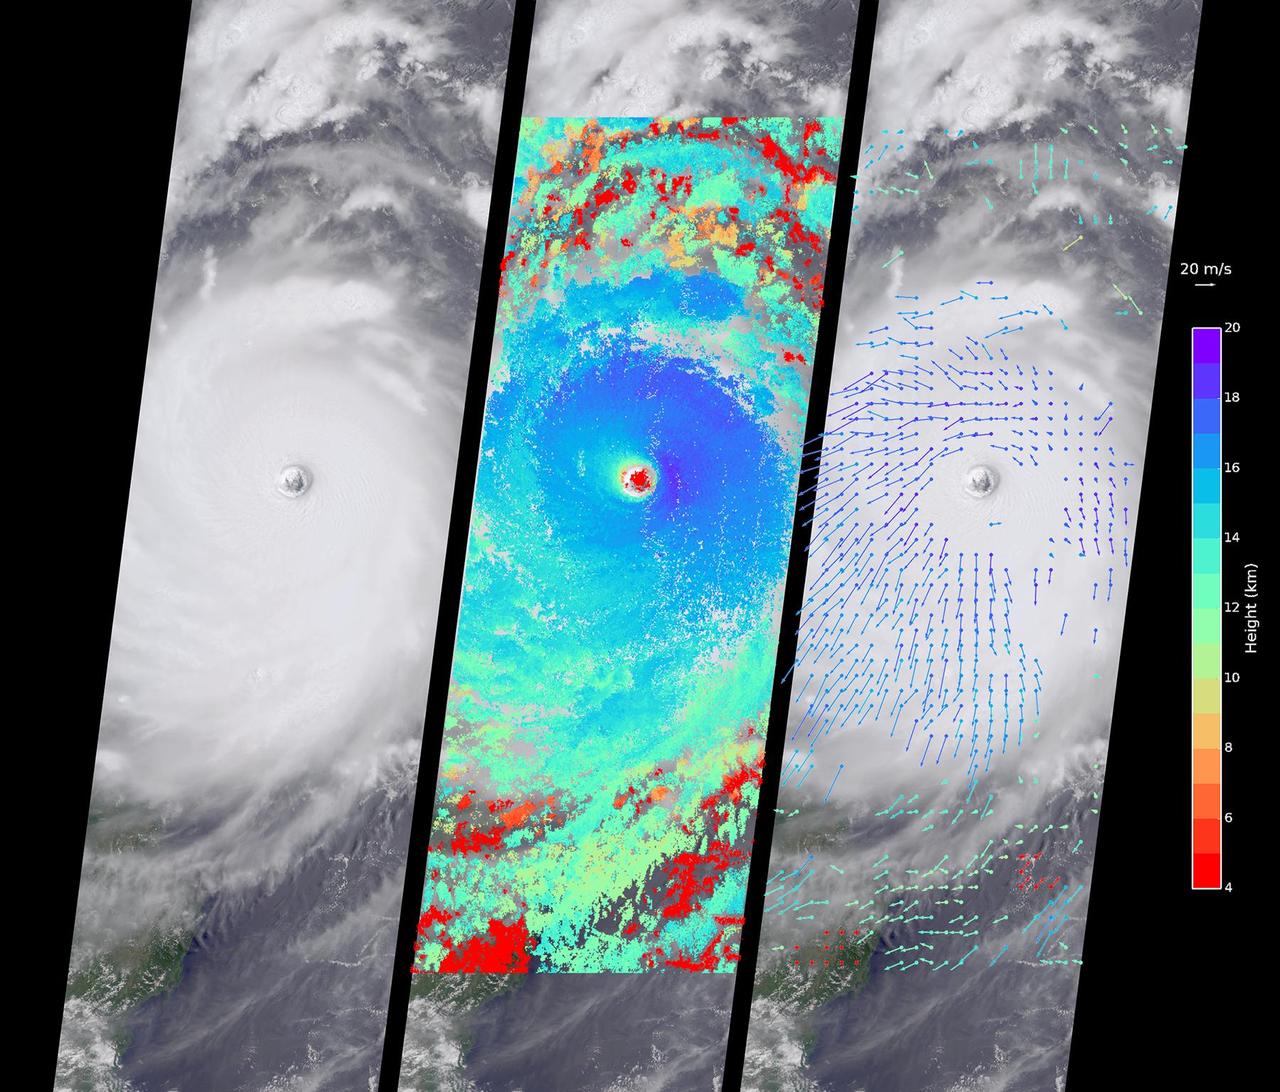
Typhoon Nepartak, the first large typhoon in the northwest Pacific this season, is currently taking aim at the east coast of Taiwan. Over the past few days, Nepartak has rapidly gained strength, growing from a tropical storm to the equivalent of a Category 5 hurricane with sustained wind speeds of more than 160 miles (258 kilometers) per hour. Taiwan's Central Weather Bureau has issued a torrential rain warning, bracing for likely flooding as 5 to 15 inches (13 to 38 centimeters) of rain are expected to fall over Taiwan during the storm's passage. Waves of up to 40 feet (12 meters) are predicted on the coast as the typhoon approaches, and air and train travel have been severely impacted. The typhoon is currently moving at about 10 miles per hour (16 kilometers) to the west-northwest, and is predicted to pass over Taiwan within the next day and then hit the coast of mainland China. Central and eastern China are poorly situated to absorb the rainfall from Nepartak after suffering the effects of severe monsoon flooding, which has killed at least 140 people in the past week. The Multi-angle Imaging SpectroRadiometer (MISR) instrument aboard NASA's Terra satellite captured this view of Typhoon Nepartak on July 7, 2016, at 10:30 a.m. local time (2:30 a.m. UTC). On the left is an image from the nadir (vertical pointing) camera, which shows the central portion of Nepartak and the storm's eye. The image is about 235 miles (378 kilometers) across. The island of Manila in the Philippines, about 250 miles (400 kilometers) south of Taiwan, is visible to the southwest of the eye. The image shows that Nepartak's center is extremely compact, rather than broken up into spiral bands as is more typical of typhoons. This means that the storm may retain more of its strength as it passes over land. MISR uses nine cameras to capture images of the typhoon from different angles. This provides a stereographic view, which can be used to determine the height of the storm's cloud tops. These heights are plotted in the middle panel, superimposed on the image. This shows that the cloud tops are relatively low, about 2.5 miles (4 kilometers), in the eye, but much higher, up to 12.5 miles (20 kilometers), just outside it. By tracking the motion of clouds as they are viewed by each of the nine cameras over about seven minutes, it is possible to also derive how fast the clouds are moving due to wind. These wind vectors are superimposed on the image in the right panel. The length of each arrow shows the wind speed at that location (compare to the 45 miles per hour or 20 meters per second arrow in the legend), and the color shows the height at which the wind is being computed. The motion of the low-level winds (red and yellow arrows) is counterclockwise, while the motion of the high winds (blue and purple arrows) is mostly clockwise. This is because hurricanes draw in warm, moist air at low altitudes, which then flows upward around the eye, releases its moisture as rain, and moves outward at high altitudes. As is typical of these types of storm systems, the inflowing low winds and the outflowing high winds spin in different directions. http://photojournal.jpl.nasa.gov/catalog/PIA20719
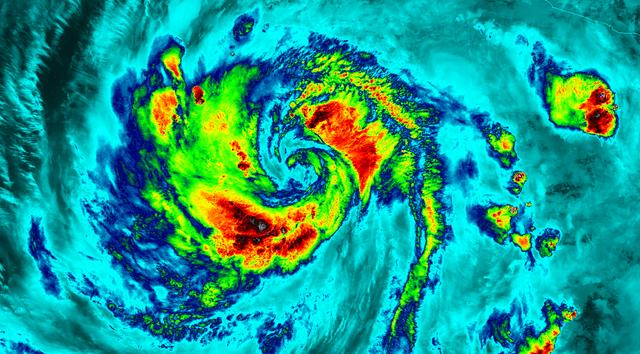
NASA-NOAA's Suomi NPP satellite flew over Hurricane Blanca in the Eastern Pacific Ocean and gathered infrared data on the storm that was false-colored to show locations of the strongest thunderstorms within the storm. The Visible Infrared Imaging Radiometer Suite or VIIRS instrument aboard the satellite gathered infrared data of the storm that was made into an image at the University of Wisconsin-Madison. The image was false-colored to show temperature. Coldest cloud top temperatures indicate higher, stronger, thunderstorms within a tropical cyclone. Those are typically the strongest storms with potential for heavy rainfall. VIIRS is a scanning radiometer that collects visible and infrared imagery and "radiometric" measurements. Basically it means that VIIRS data is used to measure cloud and aerosol properties, ocean color, sea and land surface temperature, ice motion and temperature, fires, and Earth's albedo (reflected light). The VIIRS image from June 5 at 8:11 UTC (4:11 a.m. EDT) showed two areas of coldest cloud top temperatures and strongest storms were west-southwest and east-northeast of the center of Blanca's circulation center. On June 5 at 5 a.m. EDT (0900 UTC) Blanca's maximum sustained winds were near 105 mph (165 kph) with higher gusts. The National Hurricane Center (NHC) forecast expects some strengthening during the next day or so. Weakening is forecast to begin by late Saturday. At that time, NHC placed the center of Hurricane Blanca near latitude 14.3 North, longitude 106.2 West. That puts the center about 350 miles (560 km) south-southwest of Manzanillo, Mexico and about 640 miles (1,030 km) south-southeast of Cabo San Lucas, Mexico. The estimated minimum central pressure is 968 millibars (28.59 inches). Blanca is moving toward the northwest near 10 mph (17 kph). A northwestward to north-northwestward motion at a similar forward speed is expected to continue through Saturday night. Blanca has been stirring up surf along the coast of southwestern Mexico and will reach the Pacific coast of the Baja California peninsula and the southern Gulf of California later today, June 5. These swells are likely to cause life-threatening surf and rip current conditions. On the forecast track, the center of Blanca will approach the southern Baja California peninsula on Sunday. NHC cautions that "Interests in the southern Baja California peninsula should monitor the progress of Blanca. A tropical storm or hurricane watch will likely be required for a portion of Baja California Sur later today." The NHC forecast track shows Blanca making landfall in the southeastern tip of Baja California on Sunday, June 7 and tracking north-northeast along the Baja California peninsula, for several days following. Image credit: Credits: NASA/NOAA/UW-CIMSS <b><a href="http://www.nasa.gov/audience/formedia/features/MP_Photo_Guidelines.html" rel="nofollow">NASA image use policy.</a></b> <b><a href="http://www.nasa.gov/centers/goddard/home/index.html" rel="nofollow">NASA Goddard Space Flight Center</a></b> enables NASA’s mission through four scientific endeavors: Earth Science, Heliophysics, Solar System Exploration, and Astrophysics. Goddard plays a leading role in NASA’s accomplishments by contributing compelling scientific knowledge to advance the Agency’s mission. <b>Follow us on <a href="http://twitter.com/NASAGoddardPix" rel="nofollow">Twitter</a></b> <b>Like us on <a href="http://www.facebook.com/pages/Greenbelt-MD/NASA-Goddard/395013845897?ref=tsd" rel="nofollow">Facebook</a></b> <b>Find us on <a href="http://instagrid.me/nasagoddard/?vm=grid" rel="nofollow">Instagram</a></b>
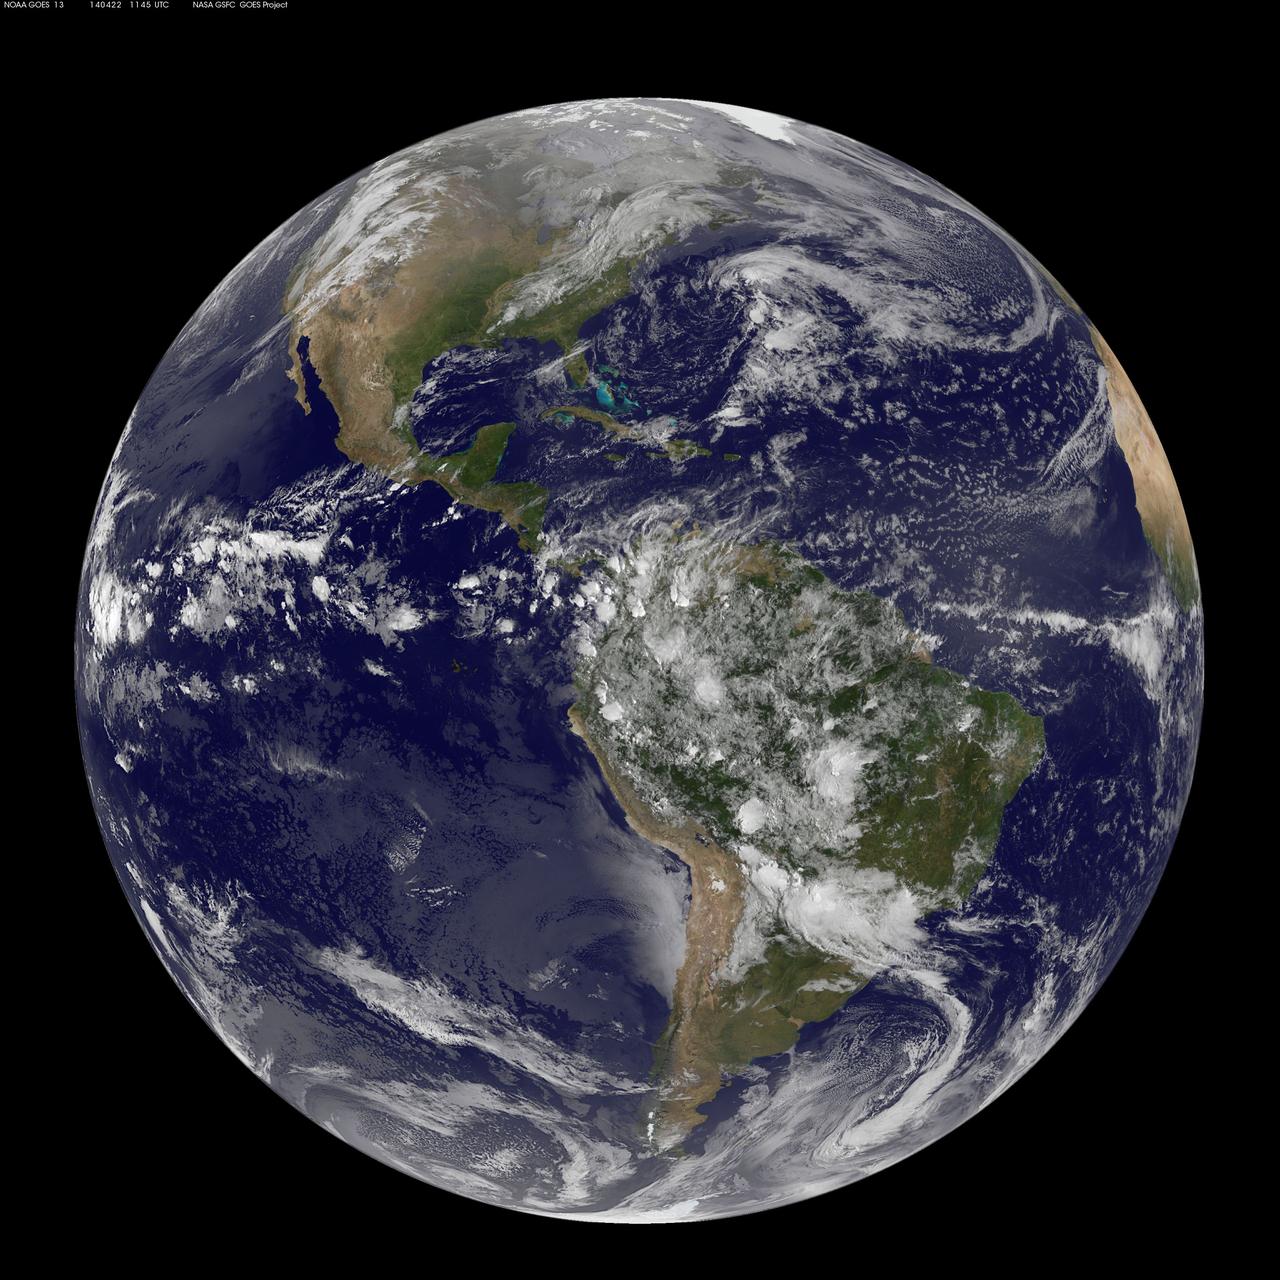
Today, April 22, 2014 is Earth Day, and what better way to celebrate than taking a look at our home planet from space. NOAA's GOES-East satellite captured this stunning view of the Americas on Earth Day, April 22, 2014 at 11:45 UTC/7:45 a.m. EDT. The data from GOES-East was made into an image by the NASA/NOAA GOES Project at NASA's Goddard Space Flight Center in Greenbelt, Md. In North America, clouds associated with a cold front stretch from Montreal, Canada, south through the Tennessee Valley, and southwest to southern Texas bringing rain east of the front today. A low pressure area in the Pacific Northwest is expected to bring rainfall in Oregon, Washington, Idaho, stretching into the upper Midwest, according to NOAA's National Weather Service. That low is also expected to bring precipitation north into the provinces of British Columbia and Alberta, Canada. Another Pacific low is moving over southern Nevada and the National Weather Service expects rain from that system to fall in central California, Nevada, and northern Utah. Near the equator, GOES imagery shows a line of pop up thunderstorms. Those thunderstorms are associated with the Intertropical Convergence Zone (ITCZ). The ITCZ encircles the Earth near the equator. In South America, convective (rapidly rising air that condenses and forms clouds) thunderstorms pepper Colombia, Venezuela, Ecuador, Peru, Bolivia, Paraguay and northwestern and southeastern Brazil. GOES satellites provide the kind of continuous monitoring necessary for intensive data analysis. Geostationary describes an orbit in which a satellite is always in the same position with respect to the rotating Earth. This allows GOES to hover continuously over one position on Earth's surface, appearing stationary. As a result, GOES provide a constant vigil for the atmospheric "triggers" for severe weather conditions such as tornadoes, flash floods, hail storms and hurricanes. For more information about GOES satellites, visit: <a href="http://www.goes.noaa.gov/" rel="nofollow">www.goes.noaa.gov/</a> or <a href="http://goes.gsfc.nasa.gov/" rel="nofollow">goes.gsfc.nasa.gov/</a> Rob Gutro NASA's Goddard Space Flight Center <b><a href="http://www.nasa.gov/audience/formedia/features/MP_Photo_Guidelines.html" rel="nofollow">NASA image use policy.</a></b> <b><a href="http://www.nasa.gov/centers/goddard/home/index.html" rel="nofollow">NASA Goddard Space Flight Center</a></b> enables NASA’s mission through four scientific endeavors: Earth Science, Heliophysics, Solar System Exploration, and Astrophysics. Goddard plays a leading role in NASA’s accomplishments by contributing compelling scientific knowledge to advance the Agency’s mission. <b>Follow us on <a href="http://twitter.com/NASAGoddardPix" rel="nofollow">Twitter</a></b> <b>Like us on <a href="http://www.facebook.com/pages/Greenbelt-MD/NASA-Goddard/395013845897?ref=tsd" rel="nofollow">Facebook</a></b> <b>Find us on <a href="http://instagram.com/nasagoddard?vm=grid" rel="nofollow">Instagram</a></b>
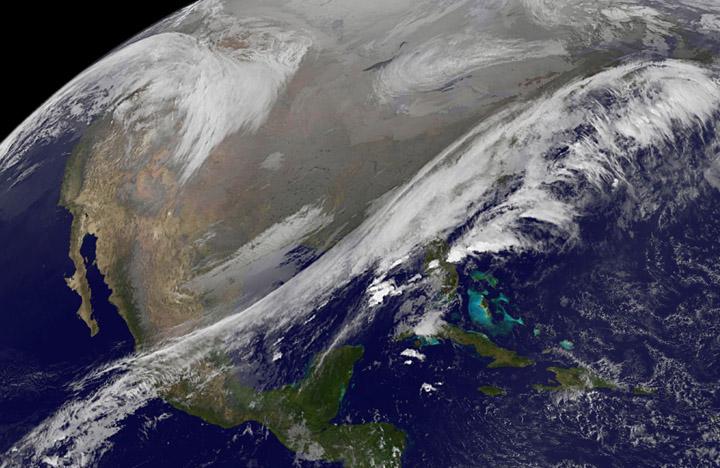
This NOAA's GOES satellite infrared image taken on Nov. 25 at 11:45 UTC (6:45 a.m. EST) shows two main weather systems over the U.S. Credit: NASA/NOAA GOES Project As the U.S. Thanksgiving holiday approaches this Thursday, November 27, NOAA's GOES-East and GOES-West satellites are keeping a weather eye out for storms that may affect early travelers. In an image from Nov. 25, the satellites show an active weather pattern is in place for travelers across the central and eastern U.S. NOAA's GOES-East satellite provides visible and infrared images over the eastern U.S. and the Atlantic Ocean, while NOAA's GOES-West satellite covers the western U.S. and Pacific Ocean from its fixed orbit in space. Data from both satellites were combined at NASA's GOES Project to create a full view of the U.S. on Nov. 25 at 11:45 UTC (6:45 a.m. EST). The image shows clouds associated with cold front stretching from the Gulf of Mexico over northern Florida and along the U.S. East coast to eastern Canada. Clouds associated with another area of low pressure are in the northern Rockies and northwestern U.S. To create the image, NASA/NOAA's GOES Project takes the cloud data from NOAA's GOES-East satellite and overlays it on a true-color image of land and ocean created by data from the Moderate Resolution Imaging Spectroradiometer, or MODIS, instrument that flies aboard NASA's Aqua and Terra satellites. Together, those data created the entire picture of the storm and show its movement. After the storm system passes, the snow on the ground becomes visible. NOAA's National Weather Service Weather Prediction Center said "a storm system will develop off the coast of the Carolinas early Wednesday (Nov. 25) and strengthen as it moves rapidly up the East Coast Wednesday into early Thursday (Nov. 26). Heavy snow is likely to begin in the central Appalachians early Wednesday morning, spreading northeast through the interior Mid-Atlantic into New England by Wednesday night. Winter Storm Watches are in effect for these areas." For travelers in the western U.S., the Northern Rocky Mountains are expected to receive more snow from the north side of a stationary frontal boundary. South of the boundary rain showers will affect the lower valley. The National Weather Service calls for cold weather to continue in the northern Plains and Upper Midwest as a Canadian surface high pressure rules the weather. The U.S. Southwest will experience nice weather for mid-week. In the Pacific Northwest, the National Weather Service noted that a warm front will bring rain, heavy at times, to the Cascades today and tonight. There will be a break in the heavier rains on Wednesday, then another period of heavy rain for the Cascades Wednesday night through Friday morning as a cold front slowly drags through the area. NOAA's GOES satellites provide the kind of continuous monitoring necessary for intensive data analysis. Geostationary describes an orbit in which a satellite is always in the same position with respect to the rotating Earth. This allows GOES to hover continuously over one position on Earth's surface, appearing stationary. As a result, GOES provide a constant vigil for the atmospheric triggers for severe weather conditions such as tornadoes, flash floods, hail storms and hurricanes.
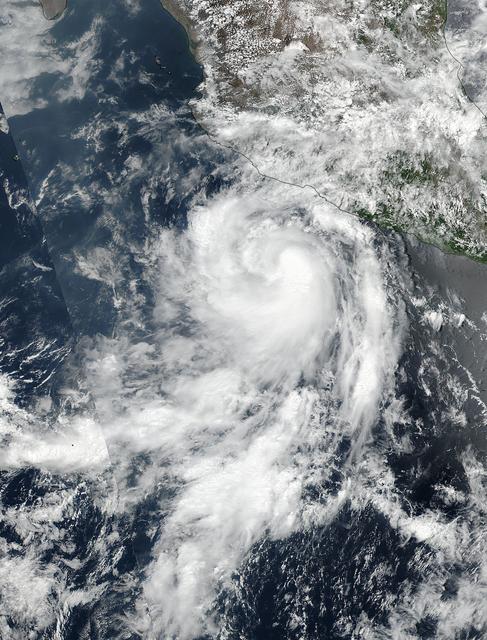
The fourth tropical cyclone of the Eastern Pacific Ocean season formed on June 25 and by June 26 it was already a hurricane. NASA-NOAA's Suomi NPP satellite passed over Dora on June 25 when it was a tropical storm and the next day it became the first hurricane of the season. Tropical Depression Dora developed around 11 p.m. EDT on Saturday, June 24 about 180 miles (290 km) south of Acapulco, Mexico. By 5 a.m. EDT on June 25, the depression had strengthened into a tropical storm and was named Dora. At 19:36 UTC (3:36 p.m. EDT), the Visible Infrared Imaging Radiometer Suite (VIIRS) instrument aboard NASA-NOAA's Suomi NPP satellite provided a visible-light image of the storm. The VIIRS imagery showed well-defined convective spiral bands of thunderstorms with a developing central dense overcast or CDO cloud feature. Seven and a half hours later, Dora showed signs of better organization. At 11 p.m. EDT, the National Hurricane Center or NHC noted "Dora's cloud pattern has continued to quickly improve this evening. Several well-defined spiral bands wrap around the center and the CDO has become more symmetric and expanded since the previous advisory." At 5 a.m. EDT on Monday, June 26, Dora became the first hurricane of the Eastern Pacific Ocean hurricane season. Satellite data indicate that maximum sustained winds have increased to near 80 mph (130 kph) with higher gusts. The NHC said the eye of Hurricane Dora was located near latitude 16.7 degrees North and longitude 105.3 degrees West. That's about 170 miles (275 km) south-southwest of Manzanillo, Mexico. Dora was moving toward the west-northwest near 13 mph (20 kph), and the NHC forecast said that general motion with some decrease in forward speed is expected over the next 48 hours. On the forecast track, the center of Dora is expected to remain offshore of the coast of southwestern Mexico. Some strengthening is likely today before weakening is forecast to begin on Tuesday, June 27. For updated forecasts, visit: <a href="http://www.nhc.noaa.gov" rel="nofollow">www.nhc.noaa.gov</a>. Credit: NASA/NOAA <b><a href="http://www.nasa.gov/audience/formedia/features/MP_Photo_Guidelines.html" rel="nofollow">NASA image use policy.</a></b> <b><a href="http://www.nasa.gov/centers/goddard/home/index.html" rel="nofollow">NASA Goddard Space Flight Center</a></b> enables NASA’s mission through four scientific endeavors: Earth Science, Heliophysics, Solar System Exploration, and Astrophysics. Goddard plays a leading role in NASA’s accomplishments by contributing compelling scientific knowledge to advance the Agency’s mission. <b>Follow us on <a href="http://twitter.com/NASAGoddardPix" rel="nofollow">Twitter</a></b> <b>Like us on <a href="http://www.facebook.com/pages/Greenbelt-MD/NASA-Goddard/395013845897?ref=tsd" rel="nofollow">Facebook</a></b> <b>Find us on <a href="http://instagrid.me/nasagoddard/?vm=grid" rel="nofollow">Instagram</a></b>
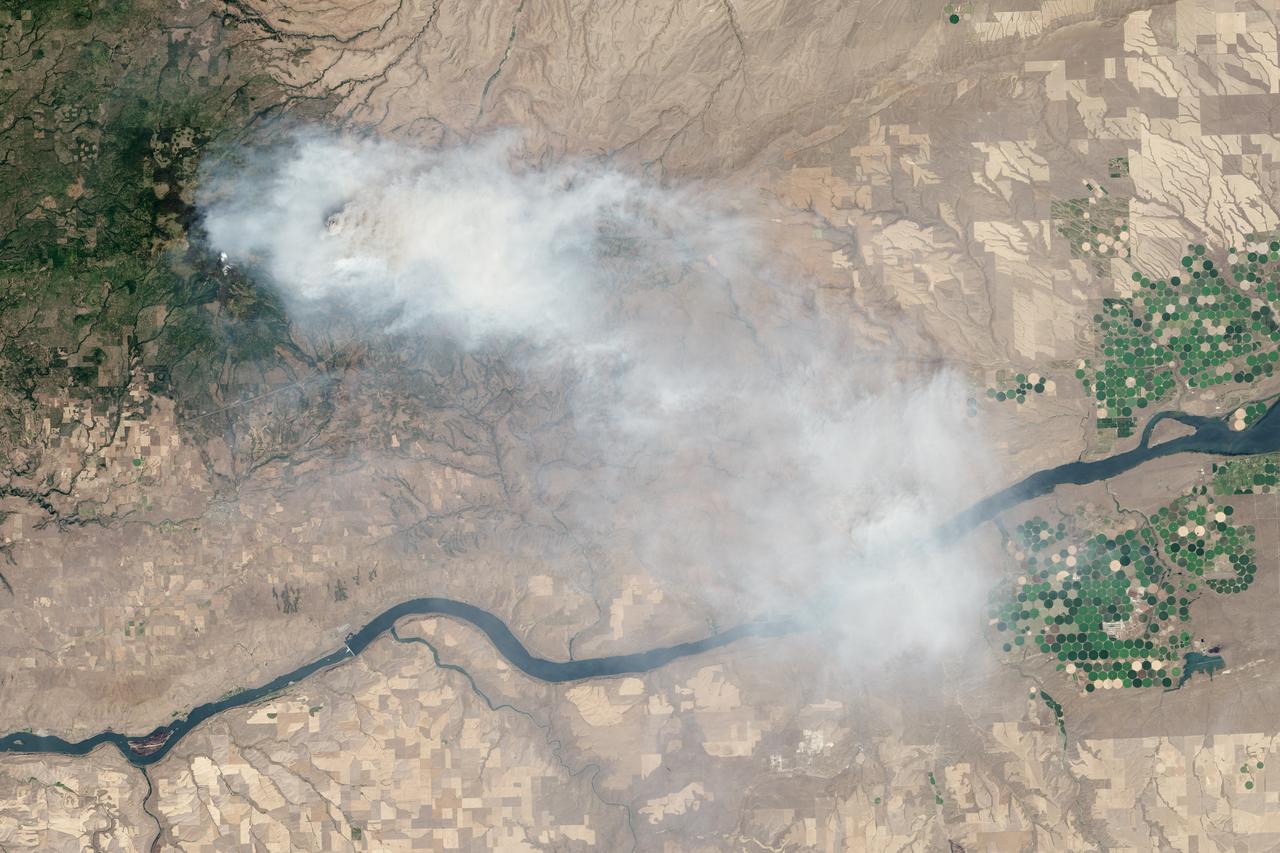
Eight major wildfires burned through forests and grasslands in the Pacific Northwest in late-July 2013, threatening homes and forcing road closings and evacuations. Many parts of Washington and Oregon faced extreme fire threats, as strong thunderstorms lined up to hit parched forests and grasslands with lightning. On July 28, 2013, the Operational Land Imager (OLI) on Landsat 8 captured these images of the Mile Marker 28 fire in the Simcoe Mountains northeast of Goldendale, Washington. Smoke blew east toward Kennewick, Pasco, and Richland. The lower image shows a closer view of smoke billowing up from the most active part of the fire. Ignited on July 24, 2013, the fire charred more than 22,000 acres (8,900 hectares) by July 30, when more than 1,000 firefighters achieved 40 percent containment. The blaze forced the evacuation of dozens of homes and the closure of US Highway 97. Through July 25, 450 wildfires had burned 10,220 acres (4,136 hectares) in Washington, while Oregon saw 603 fires that burned 63,135 acres (25,549 hectares). In all, 2.3 million acres burned across the United States by late-July, below the national average. Over the past ten years, an average of 4.2 million acres had burned in the United States by the end of each July. While coastal and western Washington receive heavy rain throughout the year, the rain shadow caused by the Cascades leaves central Washington quite dry. The mountains force moist air from the Pacific to rise, causing it to cool and condense into rain or snow on the windward side of the Cascades. So little moisture is left by the time air passes over the Cascades, that the area around Mile Marker 28 typically receives just 8 inches (20 centimeters) of precipitation per year. NASA Earth Observatory image by Jesse Allen and Robert Simmon, using Landsat data from the U.S. Geological Survey. Caption by Adam Voiland Instrument: Landsat 8 - OLI More info: <a href="http://earthobservatory.nasa.gov/IOTD/view.php?id=81738" rel="nofollow">earthobservatory.nasa.gov/IOTD/view.php?id=81738</a> Credit: <b><a href="http://www.earthobservatory.nasa.gov/" rel="nofollow"> NASA Earth Observatory</a></b> <b><a href="http://www.nasa.gov/audience/formedia/features/MP_Photo_Guidelines.html" rel="nofollow">NASA image use policy.</a></b> <b><a href="http://www.nasa.gov/centers/goddard/home/index.html" rel="nofollow">NASA Goddard Space Flight Center</a></b> enables NASA’s mission through four scientific endeavors: Earth Science, Heliophysics, Solar System Exploration, and Astrophysics. Goddard plays a leading role in NASA’s accomplishments by contributing compelling scientific knowledge to advance the Agency’s mission. <b>Follow us on <a href="http://twitter.com/NASA_GoddardPix" rel="nofollow">Twitter</a></b> <b>Like us on <a href="http://www.facebook.com/pages/Greenbelt-MD/NASA-Goddard/395013845897?ref=tsd" rel="nofollow">Facebook</a></b> <b>Find us on <a href="http://instagram.com/nasagoddard?vm=grid" rel="nofollow">Instagram</a></b>
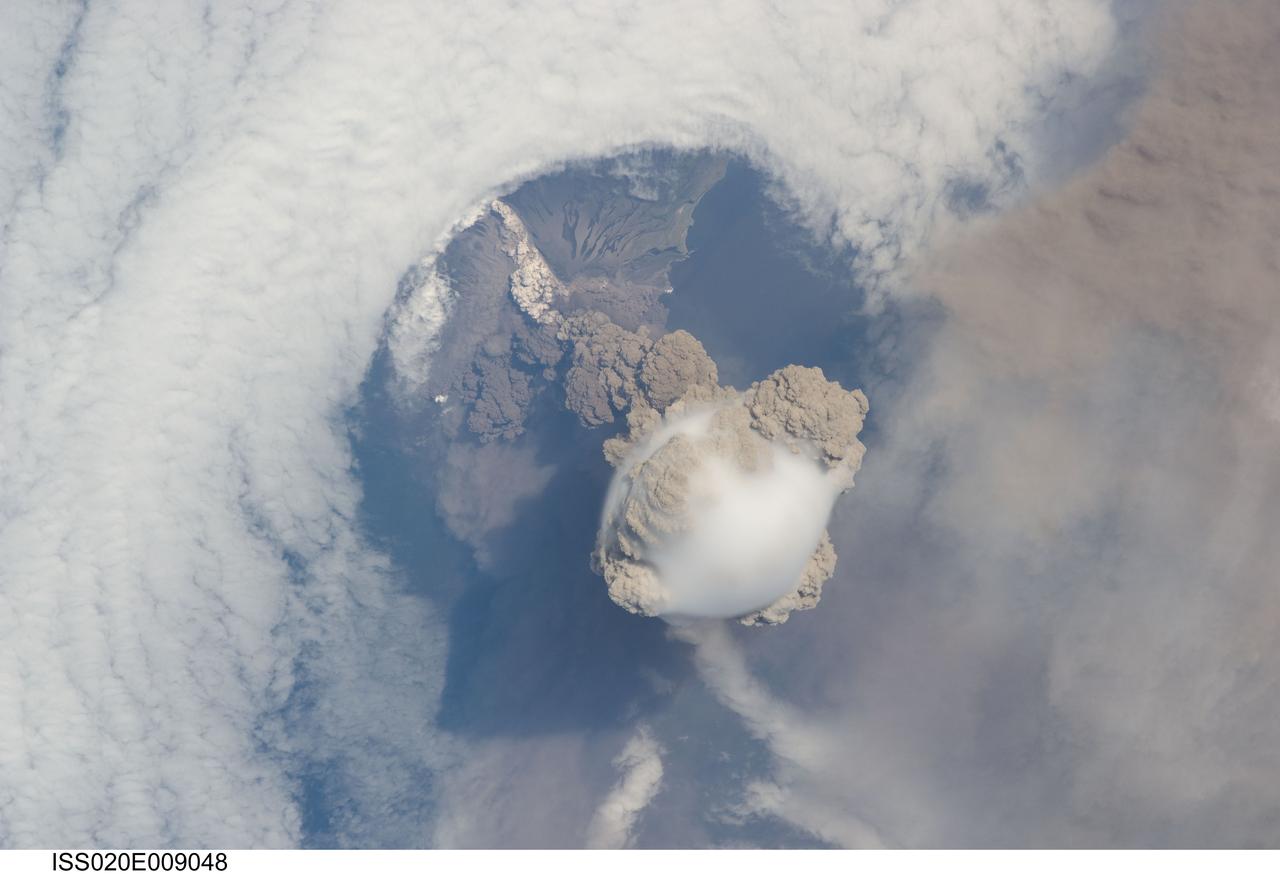
ISS020-E-009048 (12 June 2009) --- Sarychev Peak Volcano eruption, Kuril Islands, is featured in this image photographed by an Expedition 20 crew member on the International Space Station. A fortuitous orbit of the International Space Station allowed the astronauts this striking view of Sarychev volcano (Russia?s Kuril Islands, northeast of Japan) in an early stage of eruption on June 12, 2009. Sarychev Peak is one of the most active volcanoes in the Kuril Island chain and is located on the northwestern end of Matua Island. Prior to June 12, the last explosive eruption had occurred in 1989 with eruptions in 1986, 1976, 1954, and 1946 also producing lava flows. Ash from the June 2009 eruption has been detected 2407 kilometers ESE and 926 kilometers WNW of the volcano, and commercial airline flights are being diverted away from the region to minimize the danger of engine failures from ash intake. This detailed photograph is exciting to volcanologists because it captures several phenomena that occur during the earliest stages of an explosive volcanic eruption. The main column is one of a series of plumes that rose above Matua Island (48.1 degrees north latitude and 153.2 degrees east longitude) on June 12. The plume appears to be a combination of brown ash and white steam. The vigorously rising plume gives the steam a bubble-like appearance; the surrounding atmosphere has been shoved up by the shock wave of the eruption. The smooth white cloud on top may be water condensation that resulted from rapid rising and cooling of the air mass above the ash column, and is probably a transient feature (the eruption plume is starting to punch through). The structure also indicates that little to no shearing winds were present at the time to disrupt the plume. Another series of images, acquired 2-3 days after the start of eruptive activity, illustrate the effect of shearing winds on extent of the ash plumes across the Pacific Ocean. By contrast, a cloud of denser, gray ash ? most probably a pyroclastic flow -- appears to be hugging the ground, descending from the volcano summit. The rising eruption plume casts a shadow to the northwest of the island (bottom center). Brown ash at a lower altitude of the atmosphere spreads out above the ground at upper right. Low-level stratus clouds approach Matua Island from the east, wrapping around the lower slopes of the volcano. Only about 1.5 kilometers of the coastline of Matua Island (upper center) can be seen beneath the clouds and ash.
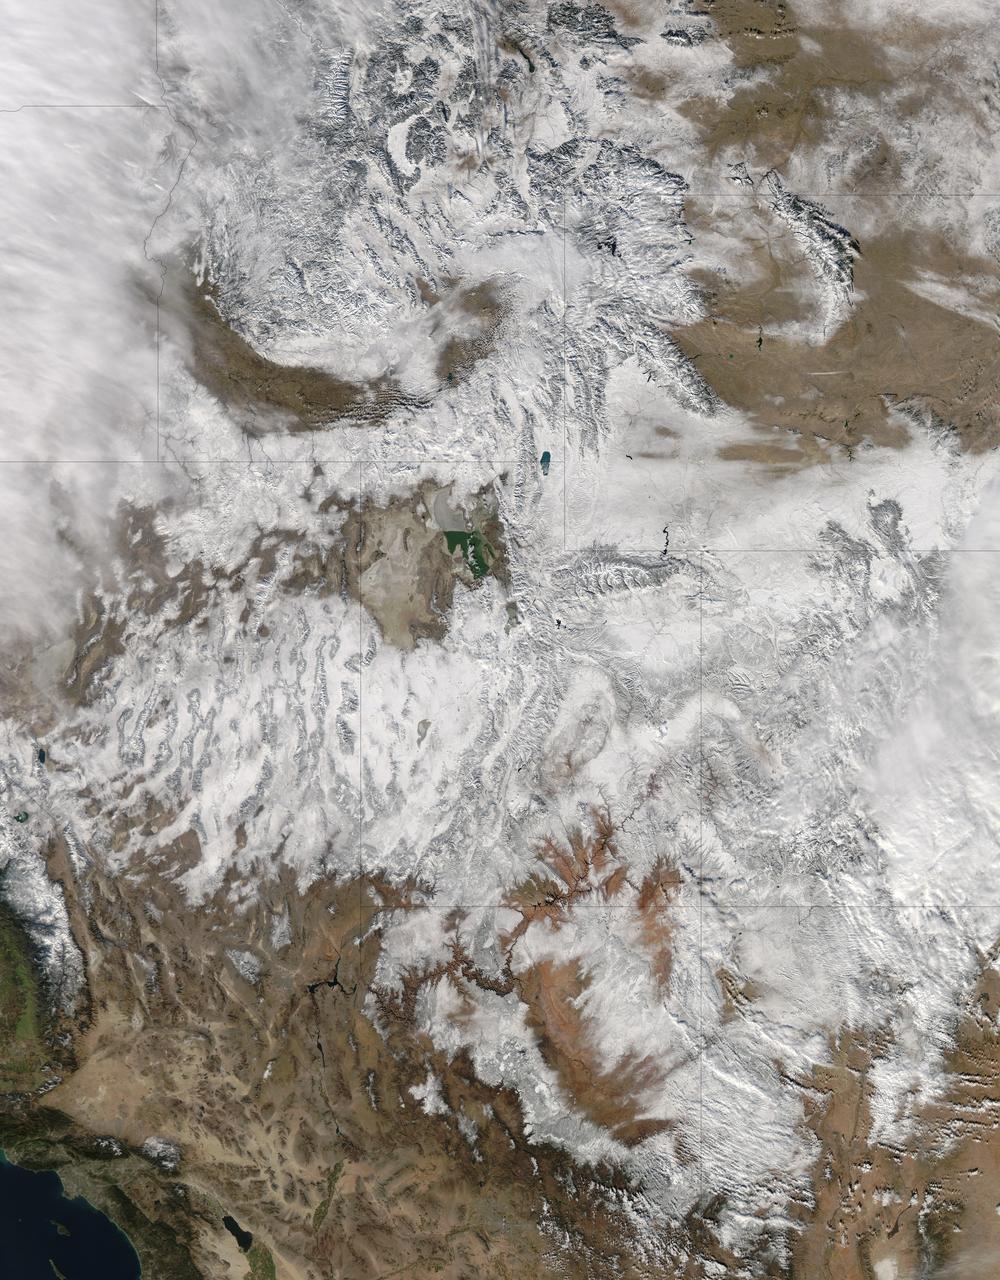
NASA image acquired December 19, 2012 In time for the 2012 winter solstice, a storm dropped snow over most of the Rocky Mountains in the United States. On December 20, the National Weather Service reported snow depths exceeding 100 centimeters (39 inches) in some places—the result of the recent snowfall plus accumulation from earlier storms. The Moderate Resolution Imaging Spectroradiometer (MODIS) on NASA’s Aqua satellite captured this natural-color image on December 19, 2012. Clouds had mostly cleared from the region, though some cloud cover lingered over parts of the Pacific Northwest and Colorado. Showing more distinct contours than the clouds, the snow cover stretched across the Rocky Mountains and the surrounding region, from Idaho to Arizona and from California to Colorado. Snowfall did not stop in Colorado, as the storm continued moving eastward across the Midwest. By December 20, 2012, a combination of heavy snow and strong winds had closed schools, iced roads, and delayed flights, complicating plans for holiday travelers. Though troublesome for travel, the snow brought much-needed moisture; multiple cities had set new records for consecutive days without measurable snow, CBS news reported. As of December 18, the U.S. Drought Monitor stated that a substantial portion of the continental United States continued to suffer from drought, and “exceptional” drought conditions extended from South Dakota to southern Texas. NASA image courtesy Jeff Schmaltz, LANCE MODIS Rapid Response. Caption by Michon Scott. Instrument: Aqua - MODIS To read more go to: <a href="http://earthobservatory.nasa.gov/IOTD/view.php?id=80035" rel="nofollow">earthobservatory.nasa.gov/IOTD/view.php?id=80035</a> Credit: <b><a href="http://www.earthobservatory.nasa.gov/" rel="nofollow"> NASA Earth Observatory</a></b> <b><a href="http://www.nasa.gov/audience/formedia/features/MP_Photo_Guidelines.html" rel="nofollow">NASA image use policy.</a></b> <b><a href="http://www.nasa.gov/centers/goddard/home/index.html" rel="nofollow">NASA Goddard Space Flight Center</a></b> enables NASA’s mission through four scientific endeavors: Earth Science, Heliophysics, Solar System Exploration, and Astrophysics. Goddard plays a leading role in NASA’s accomplishments by contributing compelling scientific knowledge to advance the Agency’s mission. <b>Follow us on <a href="http://twitter.com/NASA_GoddardPix" rel="nofollow">Twitter</a></b> <b>Like us on <a href="http://www.facebook.com/pages/Greenbelt-MD/NASA-Goddard/395013845897?ref=tsd" rel="nofollow">Facebook</a></b> <b>Find us on <a href="http://instagram.com/nasagoddard?vm=grid" rel="nofollow">Instagram</a></b>
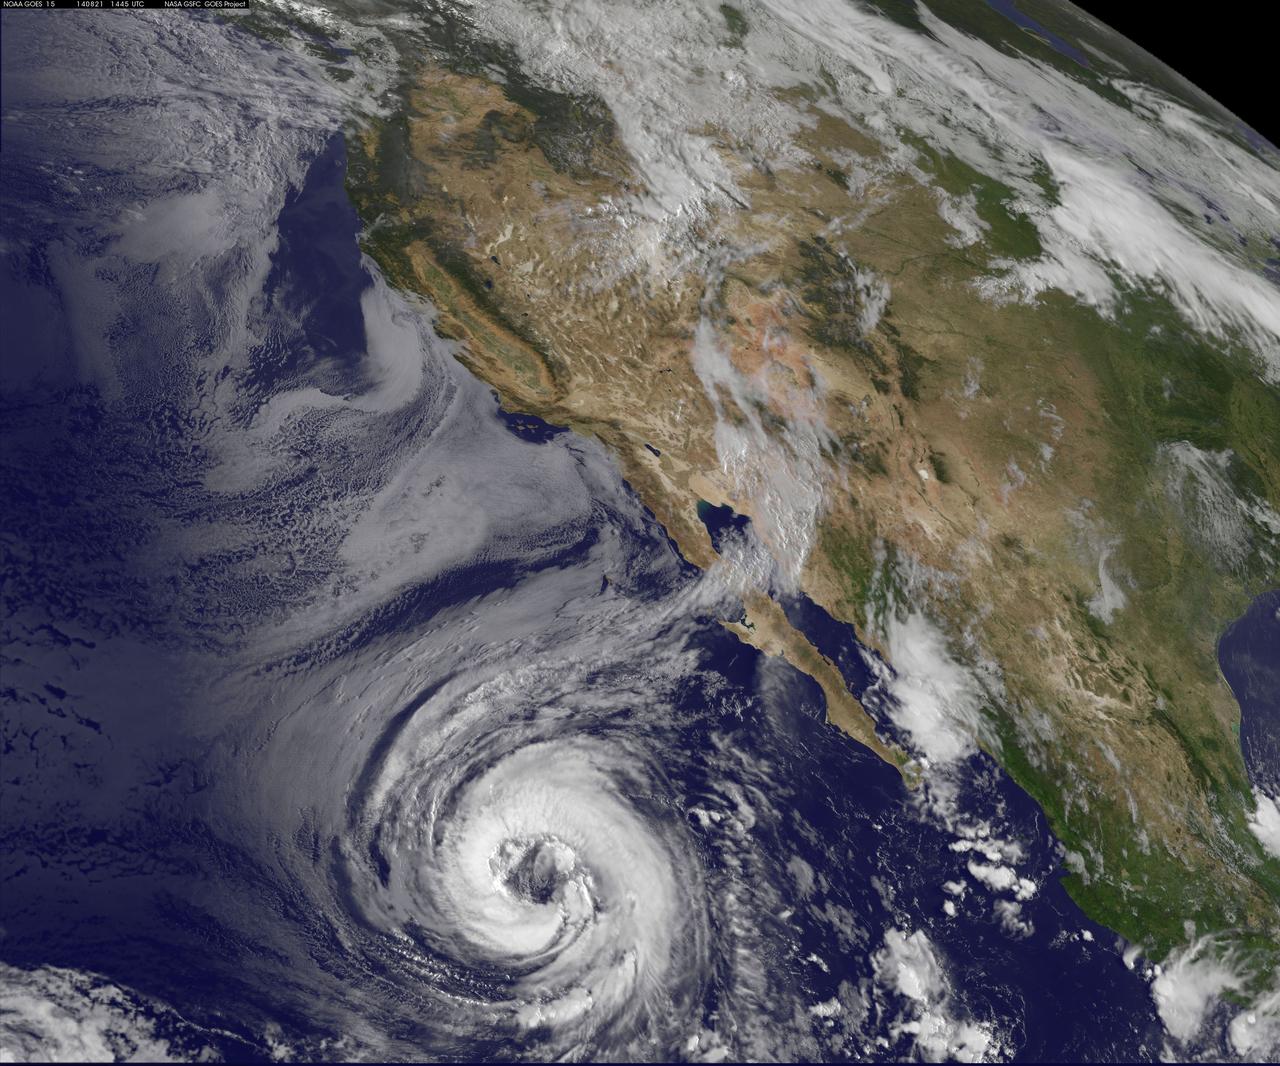
NOAA's GOES-West satellite watched as Tropical Storm Lowell strengthened into a large hurricane during the morning of August 21 and opened its eye. Hurricane force winds extend outward up to 60 miles (95 km) from the center, while tropical storm force winds extend outward up to 185 miles (295 km). The storm stretches over a greater distance. Lowell became the seventh hurricane of the Eastern Pacific Ocean season today, August 21 at 11 a.m. EDT (1500 UTC). Maximum sustained winds had increased to 75 mph (120 kph) making Lowell a Category One hurricane on the Saffir-Simpson Wind Scale. Little change in intensity is forecast by the National Hurricane Center (NHC) today, and NHC forecasters expect a slow weakening trend later today through August 22. It was centered near latitude 20.0 north and longitude 122.1 west, about 810 miles (1,300 km) west-southwest of the southern tip of Baja California, Mexico. It is moving to the northwest near 3 mph (4 kph) and is expected to move faster in that direction over the next two days. The NHC said that Lowell should begin to slowly weaken by August 22 as it moves over progressively cooler waters and into a drier and more stable air mass. Since Lowell is such a large cyclone, it will likely take longer than average to spin down. The GOES-West image of Lowell was created at the NASA/NOAA GOES Project, located at NASA's Goddard Space Flight Center in Greenbelt, Maryland. Rob Gutro NASA's Goddard Space Flight Center <b><a href="http://goes.gsfc.nasa.gov/" rel="nofollow">Credit: NOAA/NASA GOES Project</a></b> <b><a href="http://www.nasa.gov/audience/formedia/features/MP_Photo_Guidelines.html" rel="nofollow">NASA image use policy.</a></b> <b><a href="http://www.nasa.gov/centers/goddard/home/index.html" rel="nofollow">NASA Goddard Space Flight Center</a></b> enables NASA’s mission through four scientific endeavors: Earth Science, Heliophysics, Solar System Exploration, and Astrophysics. Goddard plays a leading role in NASA’s accomplishments by contributing compelling scientific knowledge to advance the Agency’s mission. <b>Follow us on <a href="http://twitter.com/NASAGoddardPix" rel="nofollow">Twitter</a></b> <b>Like us on <a href="http://www.facebook.com/pages/Greenbelt-MD/NASA-Goddard/395013845897?ref=tsd" rel="nofollow">Facebook</a></b> <b>Find us on <a href="http://instagram.com/nasagoddard?vm=grid" rel="nofollow">Instagram</a></b>
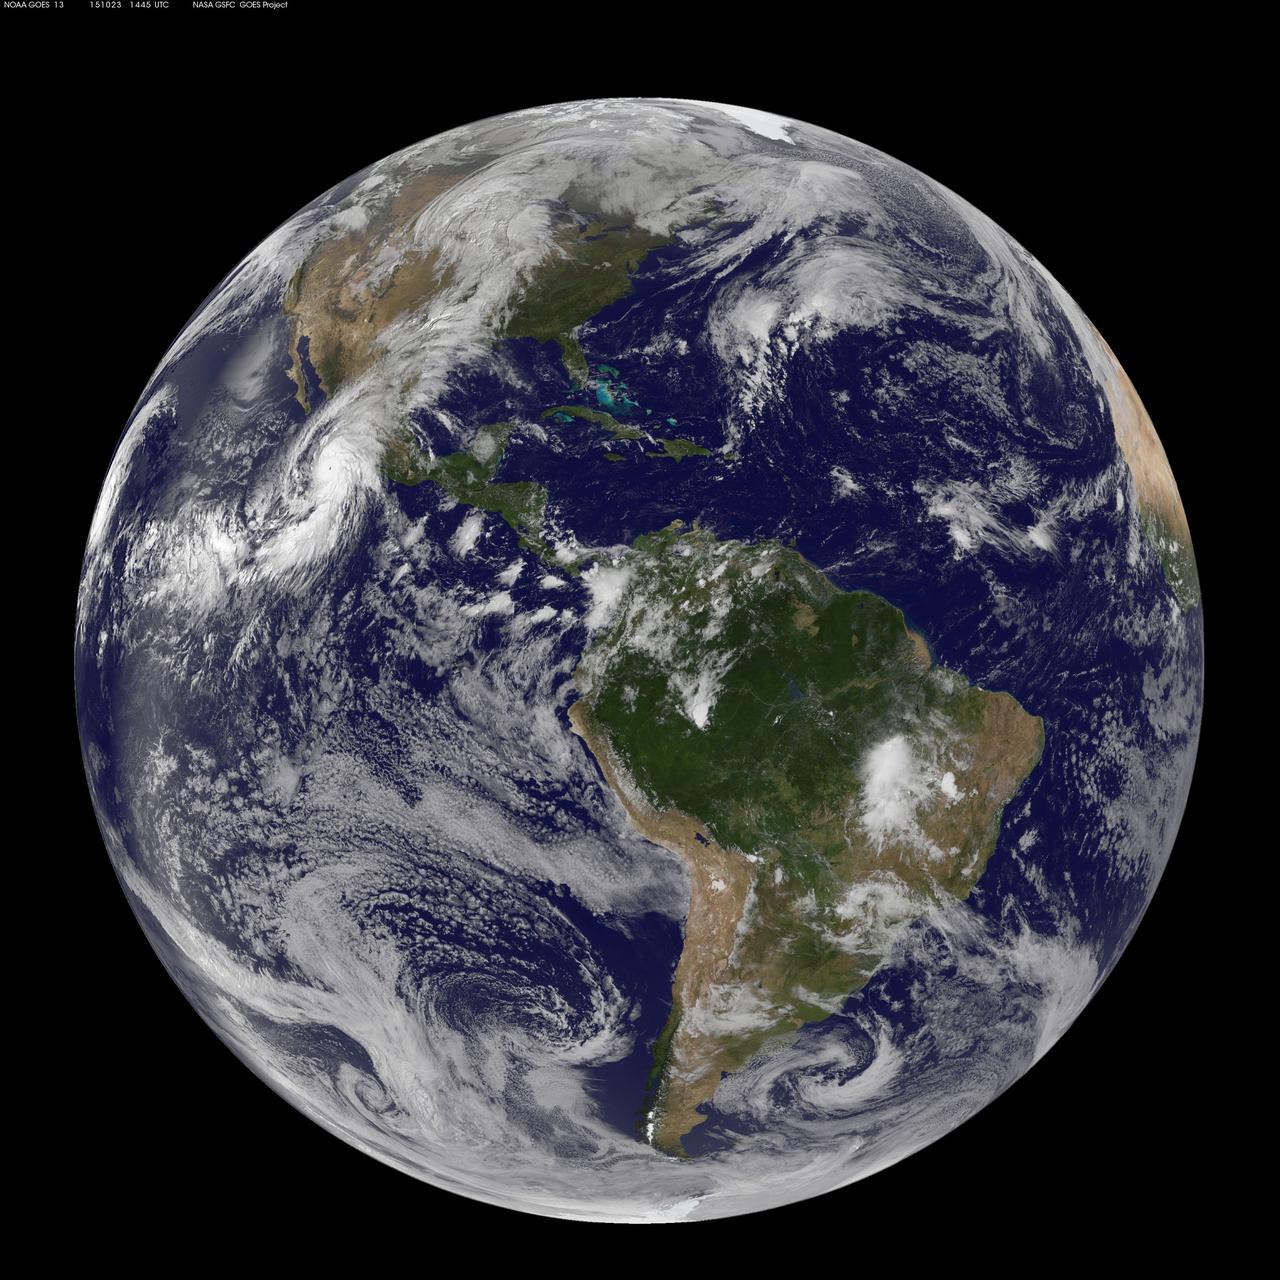
This full-disk image from NOAA’s GOES-13 satellite was captured at 14:45 UTC (10:45 a.m. EDT) and shows Hurricane Patricia off the coast of Mexico on September 23, 2015. At 8 a.m. EDT on October 23, 2015, the National Hurricane Center said that Hurricane Patricia had grown into a monster hurricane. In fact, it is the strongest eastern north pacific hurricane on record. At 8 a.m. EDT (1200 UTC) on Oct. 23, the eye of Hurricane Patricia was located near latitude 17.3 North, longitude 105.6 West. That's about 145 miles (235 km) southwest of Manzanillo, Mexico and about 215 miles (345 km) south of Cabo Corrientes, Mexico. Patricia was moving toward the north-northwest near 12 mph (19 kph) and a turn toward the north is expected later this morning, followed by a turn toward the north-northeast this afternoon. On the forecast track, the core of Patricia will make landfall in the hurricane warning area today, October 23, 2015 during the afternoon or evening. Maximum sustained winds remain near 200 mph (325 kph) with higher gusts. The National Hurricane Center (NHC) said that Patricia is a category 5 hurricane on the Saffir-Simpson Hurricane Wind Scale. Some fluctuations in intensity are possible today, but Patricia is expected to remain an extremely dangerous category 5 hurricane through landfall. Hurricane force winds extend outward up to 30 miles (45 km) from the center and tropical storm force winds extend outward up to 175 miles (280 km). The estimated minimum central pressure is 880 millibars. <b><a href="http://www.nasa.gov/audience/formedia/features/MP_Photo_Guidelines.html" rel="nofollow">NASA image use policy.</a></b> <b><a href="http://www.nasa.gov/centers/goddard/home/index.html" rel="nofollow">NASA Goddard Space Flight Center</a></b> enables NASA’s mission through four scientific endeavors: Earth Science, Heliophysics, Solar System Exploration, and Astrophysics. Goddard plays a leading role in NASA’s accomplishments by contributing compelling scientific knowledge to advance the Agency’s mission. <b>Follow us on <a href="http://twitter.com/NASAGoddardPix" rel="nofollow">Twitter</a></b> <b>Like us on <a href="http://www.facebook.com/pages/Greenbelt-MD/NASA-Goddard/395013845897?ref=tsd" rel="nofollow">Facebook</a></b> <b>Find us on <a href="http://instagrid.me/nasagoddard/?vm=grid" rel="nofollow">Instagram</a></b>

Typhoon Kilo continues to thrive in the Northwestern Pacific and imagery from NASA's Terra satellite late on September 7 showed that the storm still maintained a clear eye. The MODIS or Moderate Resolution Imaging Spectroradiometer instrument that flies aboard Terra provided a visible-light image of Kilo on September 7 at 23:50 UTC (7:50 p.m. EDT). The image showed thick bands of thunderstorms wrapping around the eastern and northern quadrants of the visible eye. At 0900 UTC (5 a.m. EDT) on September 9, Typhoon Kilo had maximum sustained winds near 65 knots (74.8 mph/120.4 kph). Kilo is expected to strengthen to 75 knots (86.3 mph/ 138.9 kph) later in the day before weakening. It was centered near 26.8 North latitude and 158.5 East longitude, about 289 nautical miles northeast of Minami Tori Shima, Japan. Kilo was moving to the west-northwest at 18 knots (20.7 mph/33.3 kph). The Joint Typhoon Warning Center noted that Kilo is expected to take more of a northerly track by September 10. Thereafter, Kilo is expected to become extra-tropical and curve to the northeast near the Kuril Islands in Russia's Sakhalin Oblast region. The islands form an 808 mile (1,300 kilometer) volcanic archipelago that stretches northeast from Hokkaido, Japan, to Kamchatka, Russia. For updated watches and warnings from the Japan Meteorological Agency, visit: <a href="http://www.jma.go.jp/en/warn/" rel="nofollow">www.jma.go.jp/en/warn/</a> <b><a href="http://www.nasa.gov/audience/formedia/features/MP_Photo_Guidelines.html" rel="nofollow">NASA image use policy.</a></b> <b><a href="http://www.nasa.gov/centers/goddard/home/index.html" rel="nofollow">NASA Goddard Space Flight Center</a></b> enables NASA’s mission through four scientific endeavors: Earth Science, Heliophysics, Solar System Exploration, and Astrophysics. Goddard plays a leading role in NASA’s accomplishments by contributing compelling scientific knowledge to advance the Agency’s mission. <b>Follow us on <a href="http://twitter.com/NASAGoddardPix" rel="nofollow">Twitter</a></b> <b>Like us on <a href="http://www.facebook.com/pages/Greenbelt-MD/NASA-Goddard/395013845897?ref=tsd" rel="nofollow">Facebook</a></b> <b>Find us on <a href="http://instagrid.me/nasagoddard/?vm=grid" rel="nofollow">Instagram</a></b>