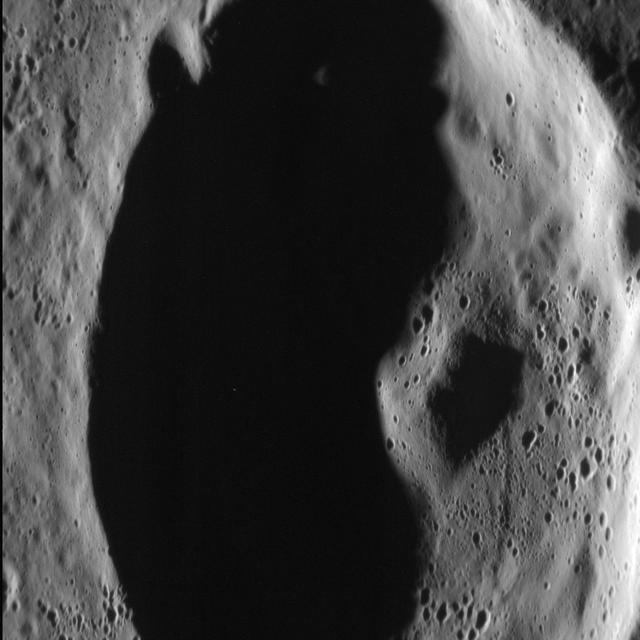
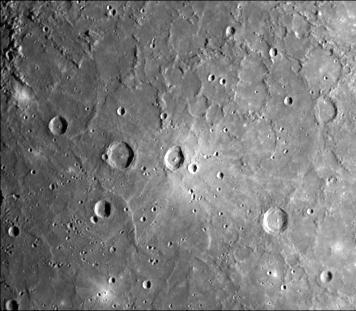
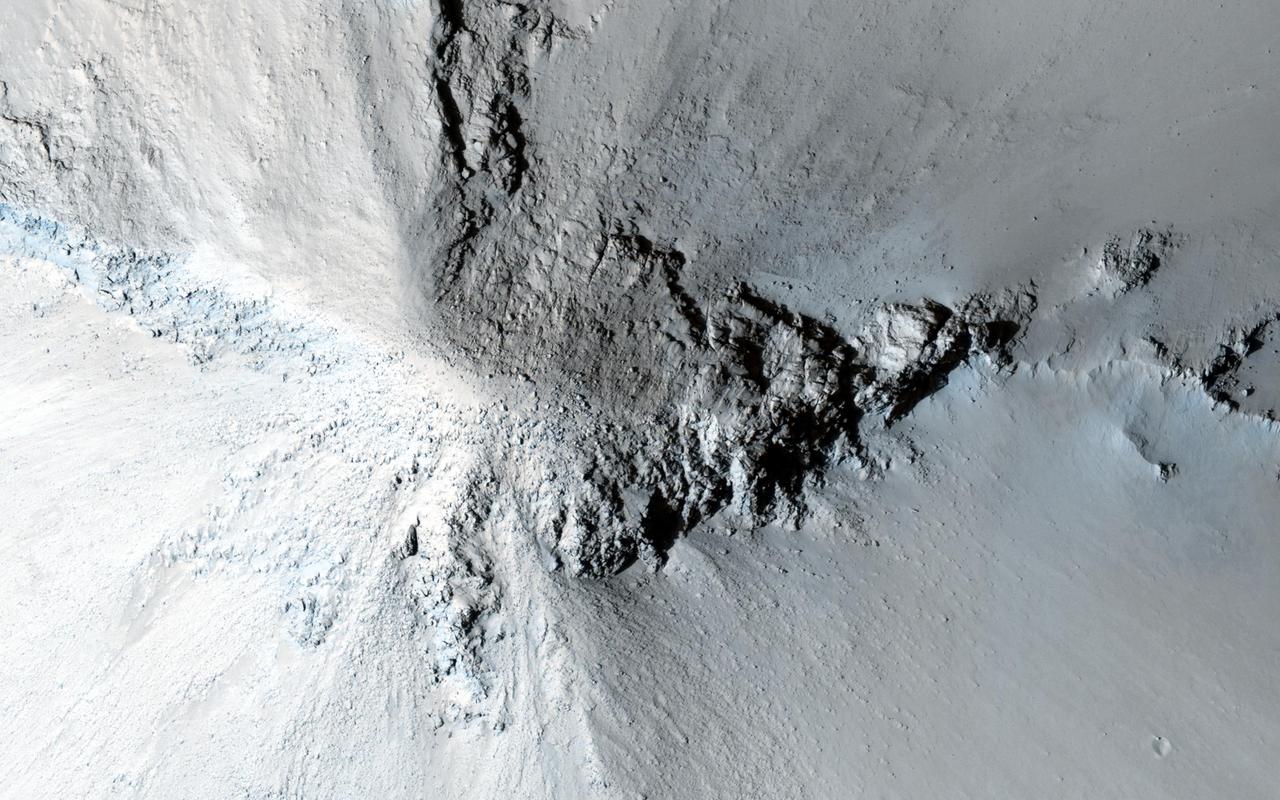
In this dramatic scene, an unnamed crater in Mercury's northern volcanic plains is bathed in darkness as the sun sits low on the horizon. Rising from the floor of the crater is its central peak, a small mountain resulting from the crater's formation. A central peak is a type of crater morphology that lies between "simple" and "peak ring" in the range of crater morphology on Mercury. This image was acquired as a high-resolution targeted observation. Targeted observations are images of a small area on Mercury's surface at resolutions much higher than the 200-meter/pixel morphology base map. It is not possible to cover all of Mercury's surface at this high resolution, but typically several areas of high scientific interest are imaged in this mode each week. The MESSENGER spacecraft is the first ever to orbit the planet Mercury, and the spacecraft's seven scientific instruments and radio science investigation are unraveling the history and evolution of the Solar System's innermost planet. During the first two years of orbital operations, MESSENGER acquired over 150,000 images and extensive other data sets. MESSENGER is capable of continuing orbital operations until early 2015. Credit: NASA/Johns Hopkins University Applied Physics Laboratory/Carnegie Institution of Washington <b><a href="http://www.nasa.gov/audience/formedia/features/MP_Photo_Guidelines.html" rel="nofollow">NASA image use policy.</a></b> <b><a href="http://www.nasa.gov/centers/goddard/home/index.html" rel="nofollow">NASA Goddard Space Flight Center</a></b> enables NASA’s mission through four scientific endeavors: Earth Science, Heliophysics, Solar System Exploration, and Astrophysics. Goddard plays a leading role in NASA’s accomplishments by contributing compelling scientific knowledge to advance the Agency’s mission. <b>Follow us on <a href="http://twitter.com/NASA_GoddardPix" rel="nofollow">Twitter</a></b> <b>Like us on <a href="http://www.facebook.com/pages/Greenbelt-MD/NASA-Goddard/395013845897?ref=tsd" rel="nofollow">Facebook</a></b> <b>Find us on <a href="http://instagram.com/nasagoddard?vm=grid" rel="nofollow">Instagram</a></b>
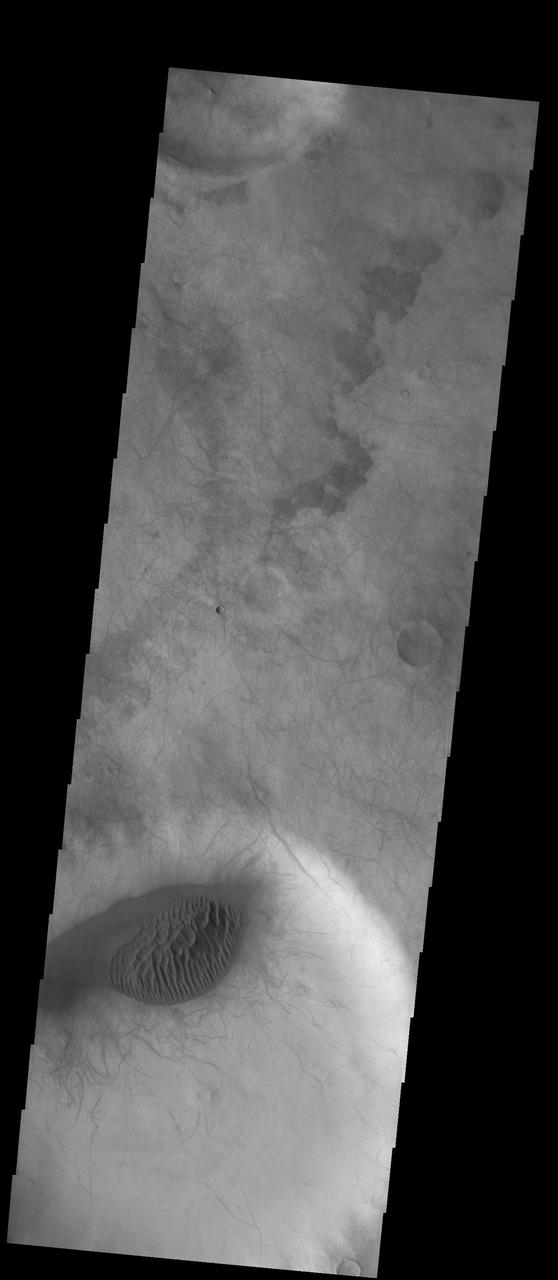
Dark slope streaks mark the side of the central peak on the floor of Cobres Crater in this image captured by NASA 2001 Mars Odyssey spacecraft.
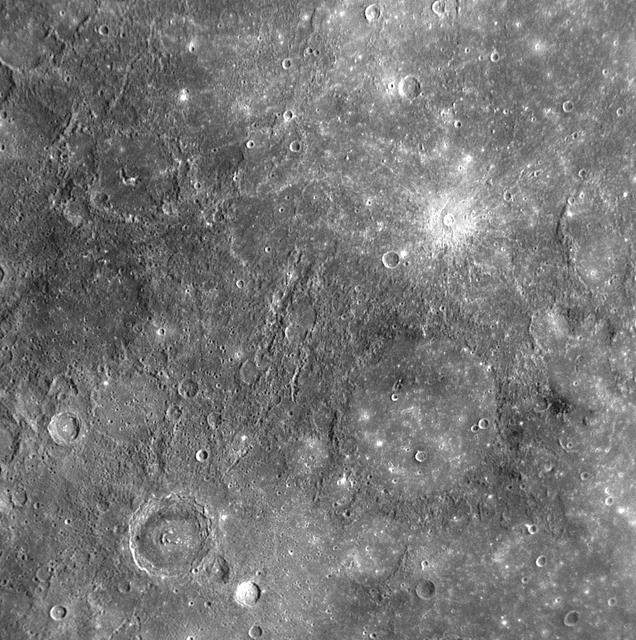
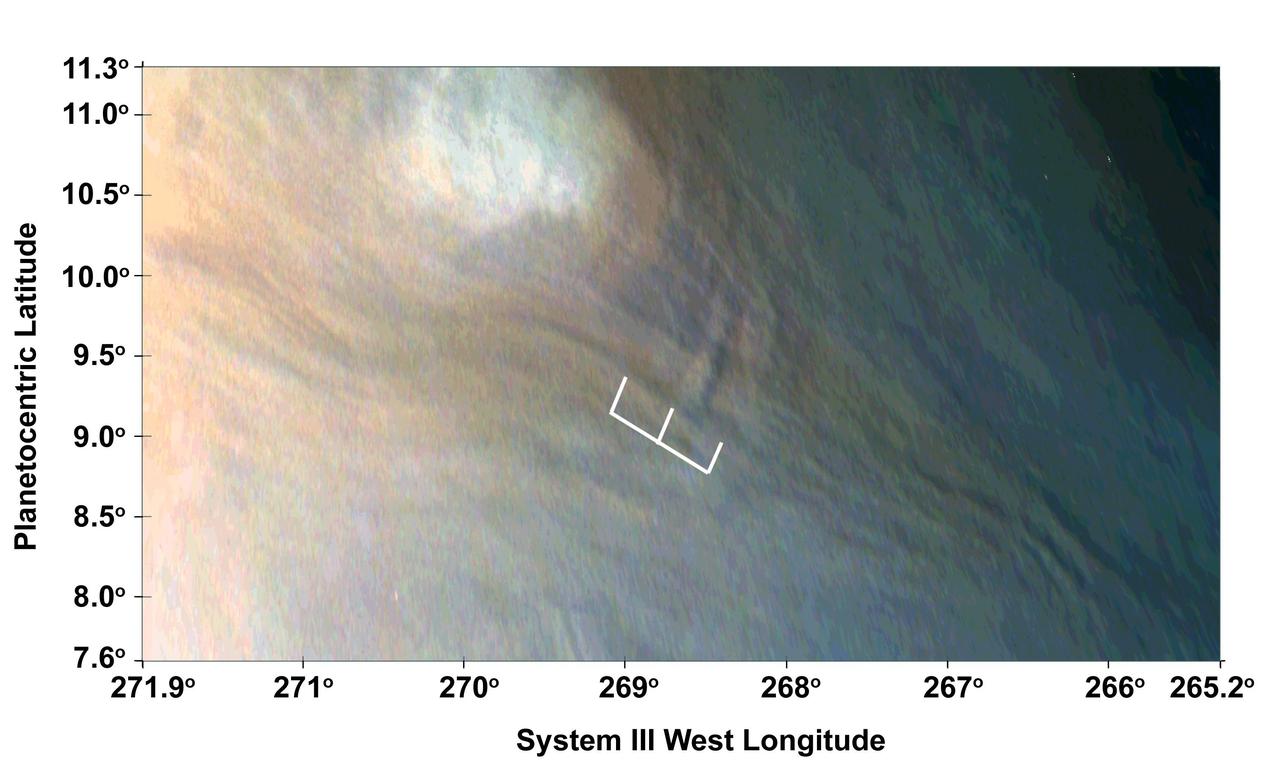
The crater identified in this NAC image was named in November 2008 for Ronald Moody, a 20th century Jamaican sculptor and painter. Moody features a central peak or peak-ring structure and an annulus of dark material on its outer floor green arrows.
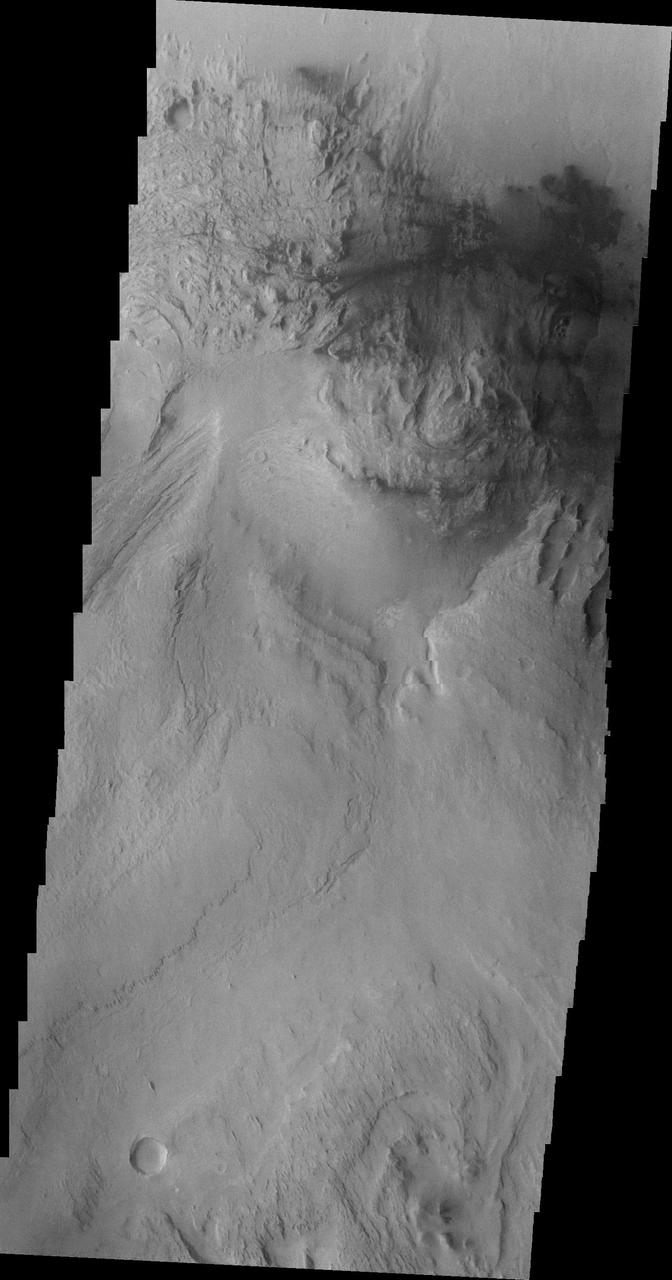
Continuing westward, this image from NASA Mars Odyssey spacecraft shows Mt. Sharp just east of the highest peak of the deposit. The dark material near the top of the image is likely sand. This image shows the dark material on the floor and on Mt. Sharp.
A dark, smooth, relatively uncratered area on Mercury was photographed two hours after NASA Mariner 10 flew by the planet. The prominent, sharp crater with a central peak is 30 kilometers 19 miles across.
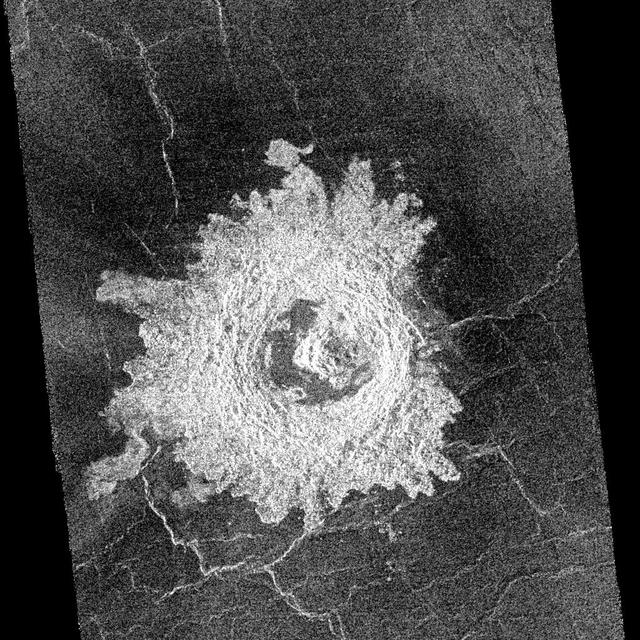
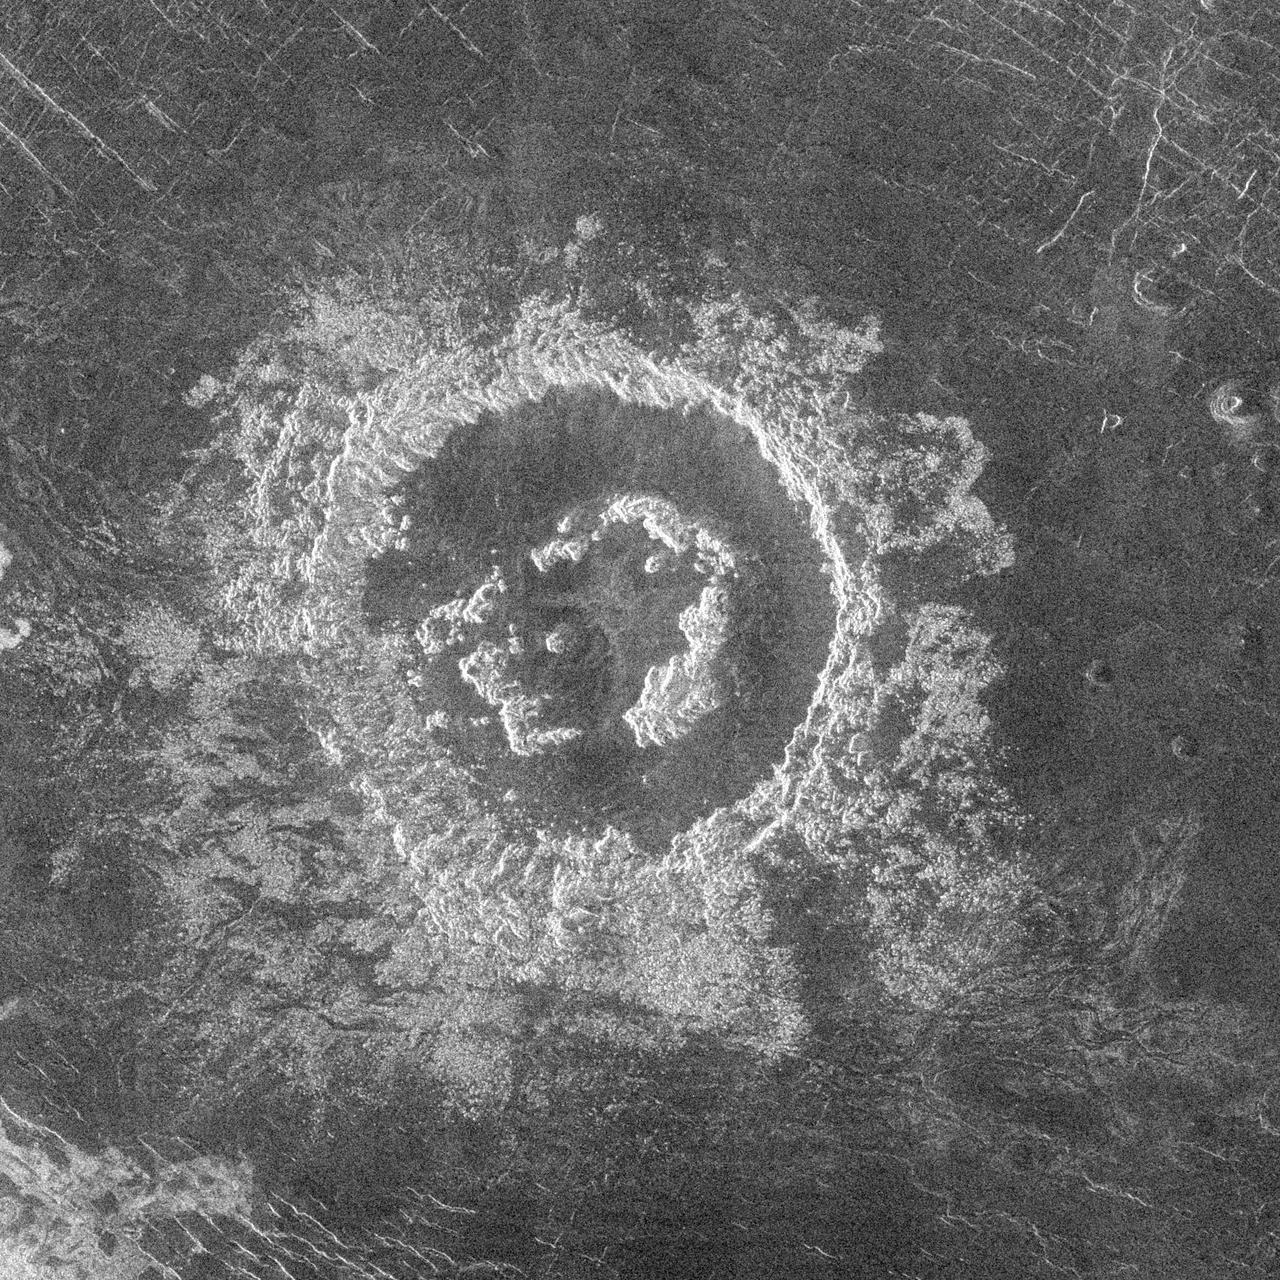
This complex crater in the Navka region of Venus was mapped by Magellan on September 26-27, 1990 during orbits 459 and 460. The crater has a diameter of 22 kilometers (13.6 miles) and is located at latitude 5.75 degrees south, longitude 349.6 degrees east. It has the terraced walls, flat radar-dark floor, and central peak that are characteristic of craters classified as 'complex.' The central peak on its floor is unusually large. Flow-like deposits extend beyond the limits of the coarser rim deposits on its west and southwest. Like about half of the craters mapped by Magellan to date, it is surrounded by a local, radar-dark halo. Buck, the proposed name for this crater honors Pearl S. Buck, American author (1892-1973). Proposed names for all features on planetary bodies are provisional until formally adopted by the International Astronomical Union. http://photojournal.jpl.nasa.gov/catalog/PIA00470
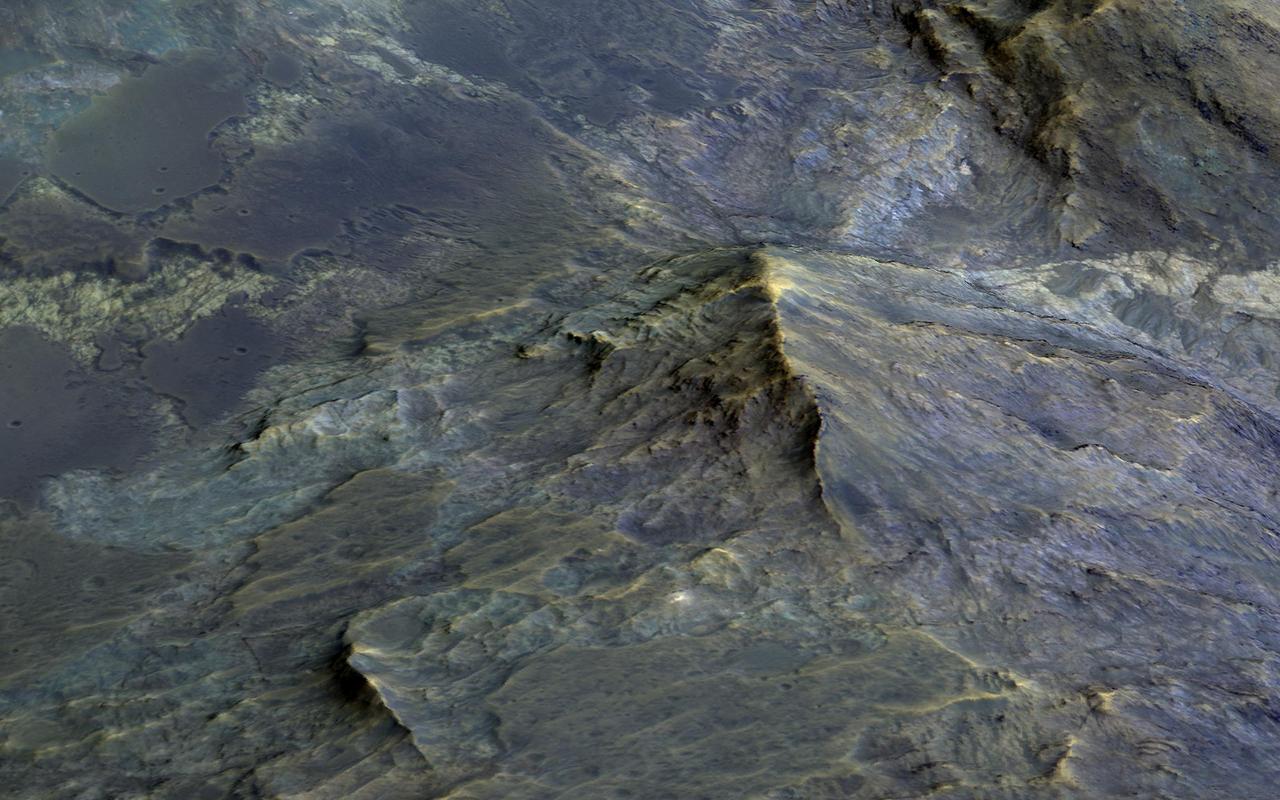
Large craters, like this 50-kilometer diameter one, can uplift material from below and form a mountain-like central peak. Craters of this size on Mars become unstable as they form and collapse due to gravity. Craters with central peaks and terraced rims are referred to as "complex" craters. Geologists study these central peaks because the uplifted bedrock was once deep within the Martian crust. A 3D perspective shows heavily-fractured bedrock exposed within the peak, and also dark-toned and fragmental rocks that formed during the impact process. Sometimes, we observe similar rocks in the crater wall terraces. Some areas of the terrace show dark-toned materials coating and surrounding the white- and green-colored bedrock. This dark-toned rock was the once-molten material that was produced by the tremendous energy generated during the formation of the crater. Similarly, the impact melt material coats and surrounds the higher-standing bedrock of the peak. There are additional exposures of bedrock in the northern wall-terraces of the crater. Previous HiRISE images have focused largely on central structures, but clearly the wall-terraces of these craters may also be informative in our exploration of the Martian subsurface. More information is available at https://photojournal.jpl.nasa.gov/catalog/PIA22784
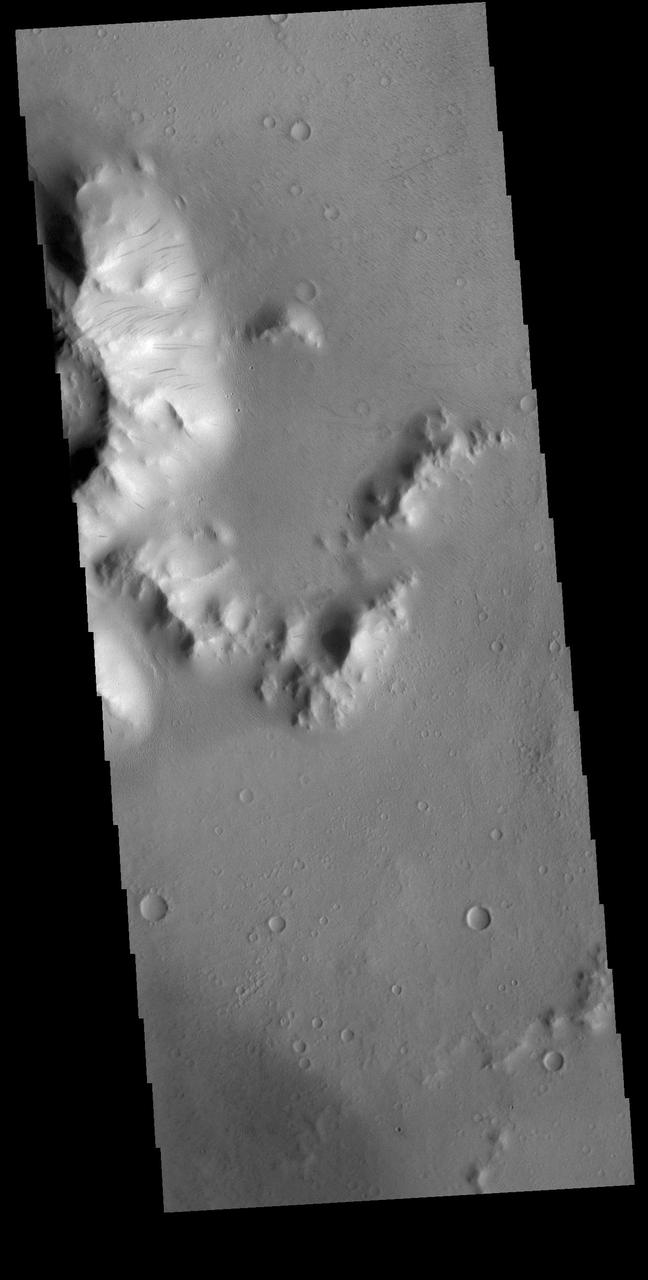
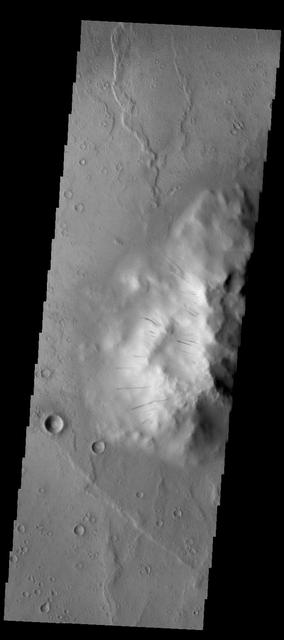
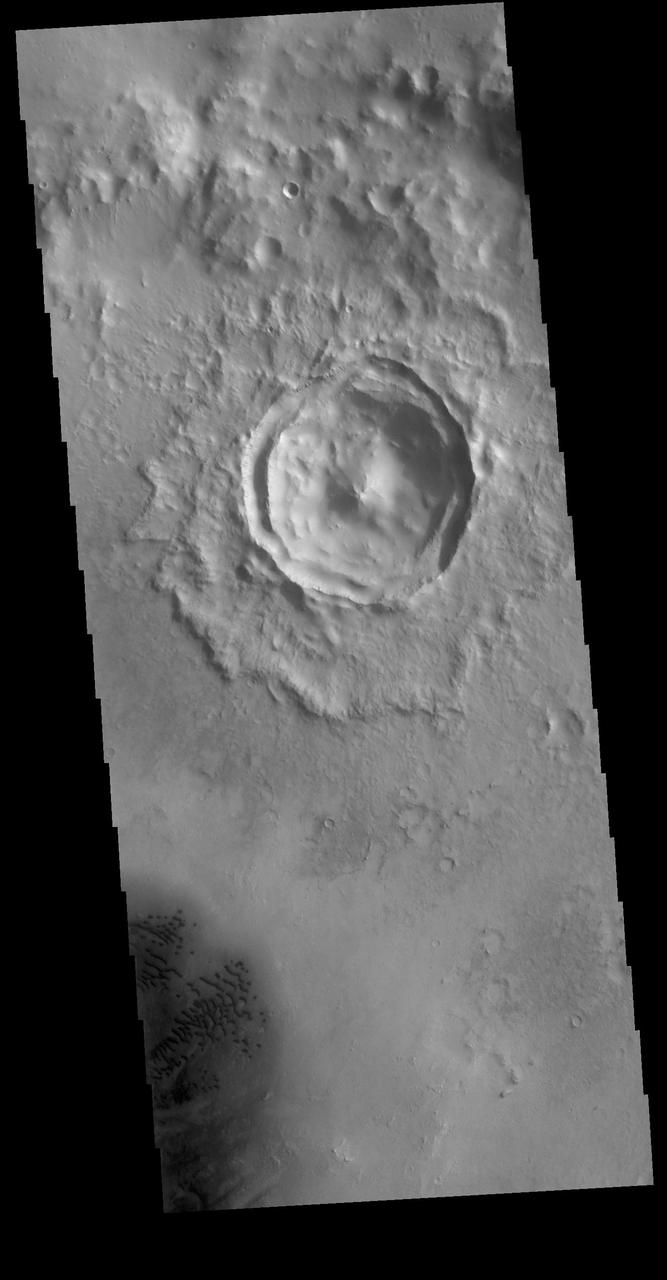
Today's VIS image covers part of the central peak and floor of Burton Crater. The central peak slopes are covered with numerous dark streaks. There are several suggested mechanisms to form these features. Two of the mechanisms are that the dusty surface has been altered to reveal darker rock beneath from motion of downward moving dust, or the surface is darkening by fluid or other surface staining. Orbit Number: 81727 Latitude: -14.0279 Longitude: 203.923 Instrument: VIS Captured: 2020-05-17 17:09 https://photojournal.jpl.nasa.gov/catalog/PIA24005
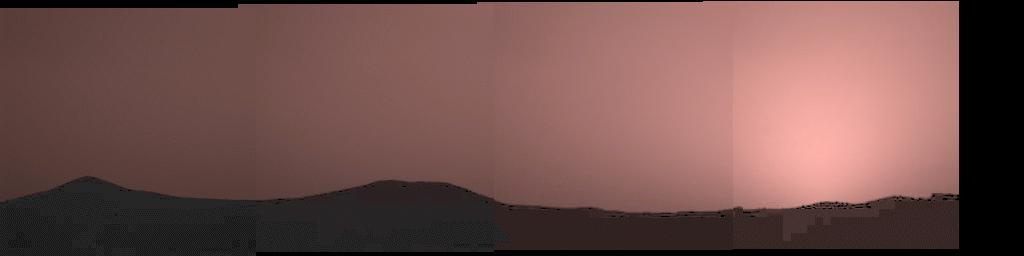
This image was taken by the Imager for Mars Pathfinder (IMP) about one minute after sunset on Mars on Sol 21. The prominent hills dubbed "Twin Peaks" form a dark silhouette at the horizon, while the setting sun casts a pink glow over the darkening sky. The image was taken as part of a twilight study which indicates how the brightness of the sky fades with time after sunset. Scientists found that the sky stays bright for up to two hours after sunset, indicating that Martian dust extends very high into the atmosphere. http://photojournal.jpl.nasa.gov/catalog/PIA00783
This image shows a cross-section of a complex crater in Terra Cimmeria. Starting in the center, we see a series of peaks with exposed bedrock. These peaks formed during the impact event when material that was originally several kilometers below the surface was uplifted and exposed. The impact also melted the rocks. This eventually cooled, forming the pitted materials that coat the crater floor around the uplift. The rim of the crater was unstable, and collapsed inwards to form terraces, and we see additional pitted materials between the terraces and the rim. Just outside the crater we can see dark-toned material that was excavated and thrown out after the impact. https://photojournal.jpl.nasa.gov/catalog/PIA23022
During orbits 404 through 414 on 19-20 September 1990, NASA's Magellan imaged a peak-ring crater that is 50 kilometers in diameter located at latitude 27.4 degrees north and longitude 337.5 degrees east. The name Barton has been proposed by the Magellan Science Team for this crater, after Clara Barton, founder of the Red Cross; however, the name is tentative pending approval by the International Astronomical Union. Barton is just at the diameter size that Venus craters appear to begin to possess peak-rings instead of a single central peak or central peak complex like does 75 percent of the craters with diameters between 50 and about 15 kilometers. The floor of the crater is flat and radar-dark, indicating possible infilling by volcanic deposits sometime following the impact event. Barton's central peak ring is discontinuous and appears to have been disrupted or separated during or following the cratering process. The extremely blocky crater deposits (ejecta) surrounding Barton appear to be most extensive on the southwest to southeast (lower left to right) side of the crater. http://photojournal.jpl.nasa.gov/catalog/PIA00463
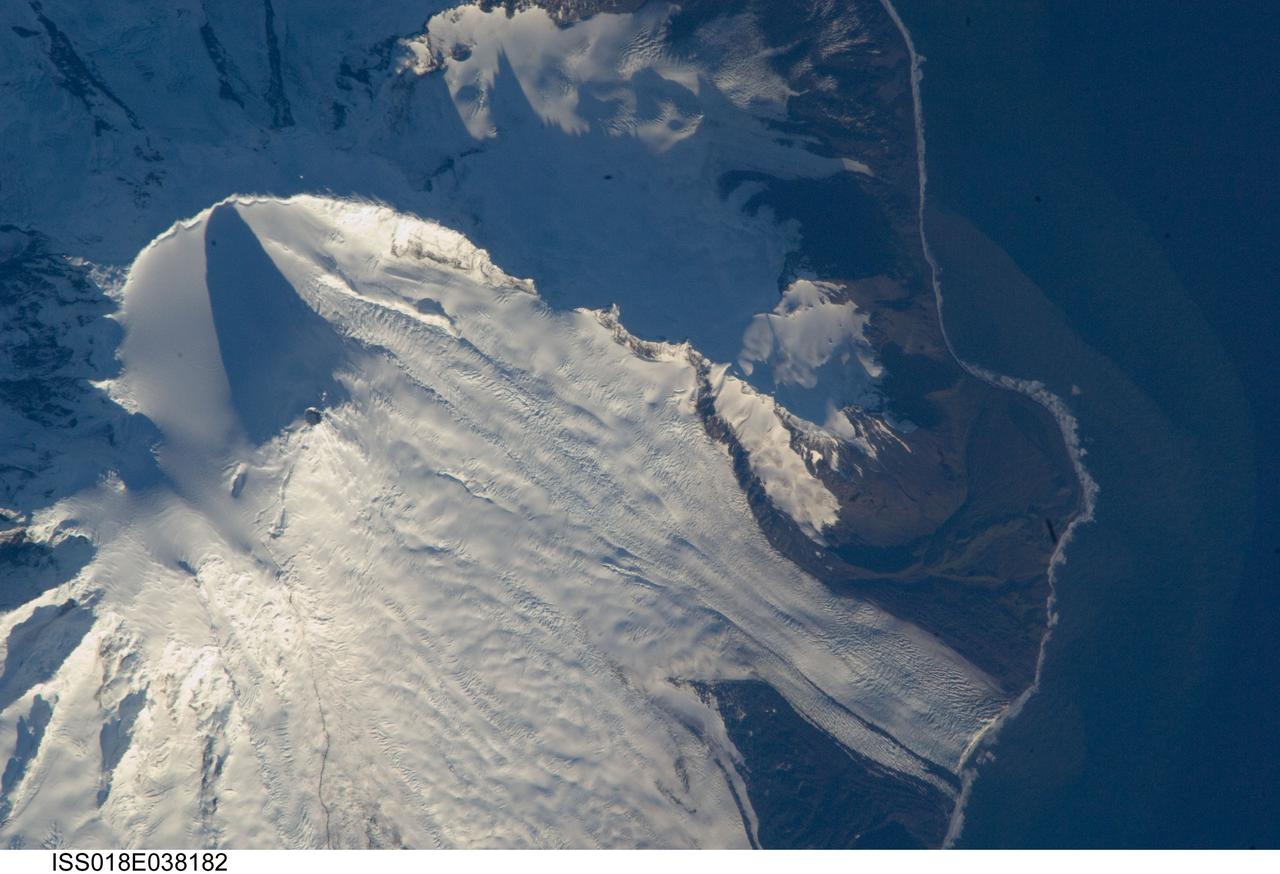
ISS018-E-038182 (28 Feb. 2009) --- Mawson Peak, Heard Island is featured in this image photographed by an Expedition 18 crewmember on the International Space Station. Heard Island is located in the southern Indian Ocean, approximately 1,550 kilometers to the north of Antarctica. The island is a visible part of the Kerguelen Plateau, a submerged feature on the seafloor formed by large amounts of volcanic rock erupted over a geologically short time period within an oceanic tectonic plate ? features like these are termed large igneous provinces by geologists. Most of Heard Island is formed from volcanic rocks associated with the Big Ben stratovolcano. The northeastern slopes of the volcano are visible in shadow at the top left of this detailed astronaut photograph. Recent observed volcanic activity at Heard Island has occurred at 2,745 meters high Mawson Peak, which sits within a breached caldera (collapsed and empty magma chamber beneath a volcano) on the southwestern side of the Big Ben volcano ? the shadow cast by Mawson Peak in the image points directly to the crescent-shaped caldera rim. Detailed geologic study of the Big Ben volcano is made difficult by the presence of several glaciers, including Gotley and Lied Glaciers on the southwestern slopes. This image, taken during Southern Hemisphere summer, also reveals some of the non-glaciated, light to dark brown volcanic rock forming the island on either side of Gotley Glacier.
Three waves can be seen in this image, which is an excerpt of a JunoCam image taken on Feb. 2, 2017, during Juno's fourth flyby of Jupiter (perijove 4). The region imaged in this picture is part of the visibly dark band just north of Jupiter's equator known as the North Equatorial Belt. Most of this belt is characterized by downwelling motions, but during perijove 4 it had several bright areas of upwelling clouds. One of those upwelling clouds appears to be accompanied by dark regions, which are most likely shadows. The shadow associated with the center of the three waves is about 25 miles (40 kilometers) long; from the angle of illumination, we can deduce that the shadowed part of the wave must be around 4 miles (7 kilometers) above the main cloud deck, with the peak of the wave probably close to 6 miles (10 kilometers) above the main cloud deck. https://photojournal.jpl.nasa.gov/catalog/PIA22796
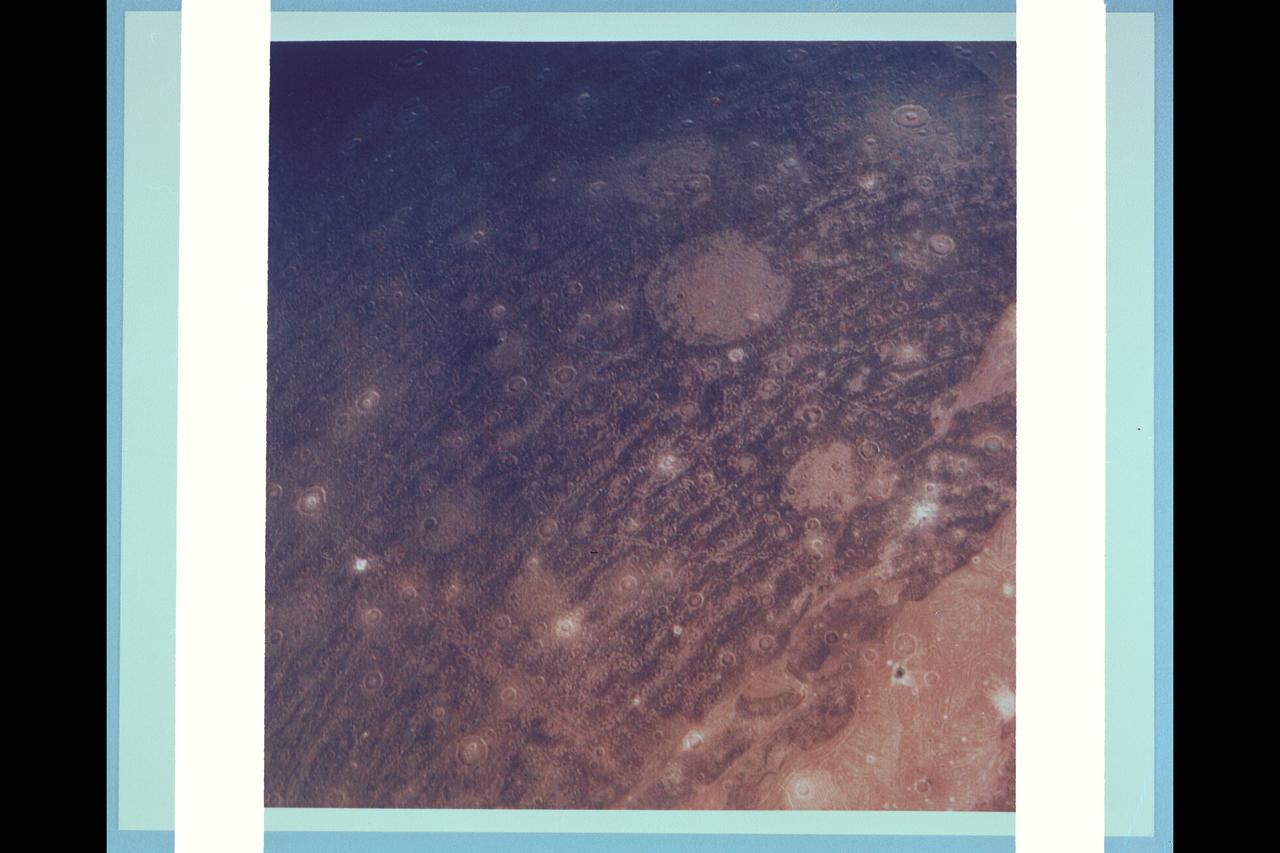
P-21761 C Range: 313,000 kilometers (194,000 miles) This color reconstruction of part of the northern hemisphere of Ganymede shows a scene approximately 1,300 kilometers (806 miles) across. It shows part of dark, densely cratered block which is bound on the south by lighter, and less cratered grooved terrain. The dark blocks are believed to be the oldest parts of Ganymede's surface. Numerous craters are visible, many with central peaks. The large bright circular features have little relief and are probably the remnants of old, large craters that have been annealed by flow of the icy near-surface material. The closely-spaced arcuate, linear features are probably analogous to similiar features on Ganymede which surround a large impact basin. The linear features here may indicate the former presence of a large impact basin to the southwest.

NASA's ASTER (Advanced Spaceborne Thermal Emission and Reflection Radiometer)captured these images of Guatemala's Fuego volcano on Nov. 24, following a recent eruption. The main image shows the lava flows on the flanks of Fuego (upper left corner) in light gray. Vegetation is shown in red, clouds in white, and city and fields in dark gray. A thick ash plume rising from the peak of the volcano and more diffuse ash clouds over the southern part of the scene are also visible. The thermal infrared composite highlights the ash clouds in orange, with a dark orange cloud over the summit where the ash is thickest. White areas are relatively warmer; Fuego's summit is bright white at the active crater. https://photojournal.jpl.nasa.gov/catalog/PIA22820
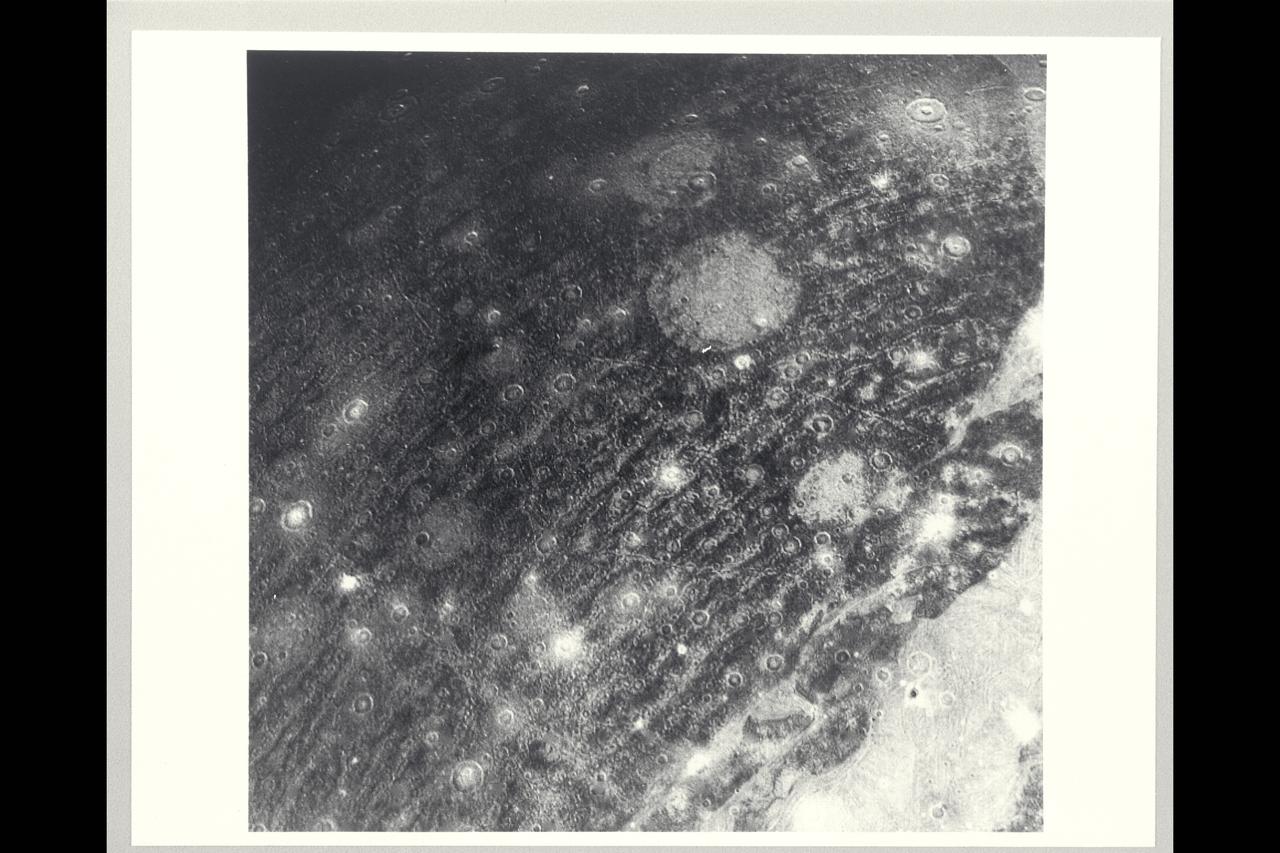
This color reconstruction of part of the northern hemisphere of Ganymede was made from pictures taken at a range of 313,000 km (194,000 mi.). The scene is approx. 1,300 km (806 mi.) across. It shows part of dark, densely cratered block which is bound on the south by lighter, and less cratered, grooved terrain. The dark blocks are believed to be the oldest parts of Ganymede's surface. Numerous craters are visible, many with central peaks. The large bright circular features have little relief and are probably the remnants of old, large craters that have been annealed by flow of the icy near-surface material. The closely-spaced arcuate, linear features are probably analogous to similar features on Ganymede which surround a large impact basin. The linear features here may indicate the former presence of a large impact basin to the southwest.
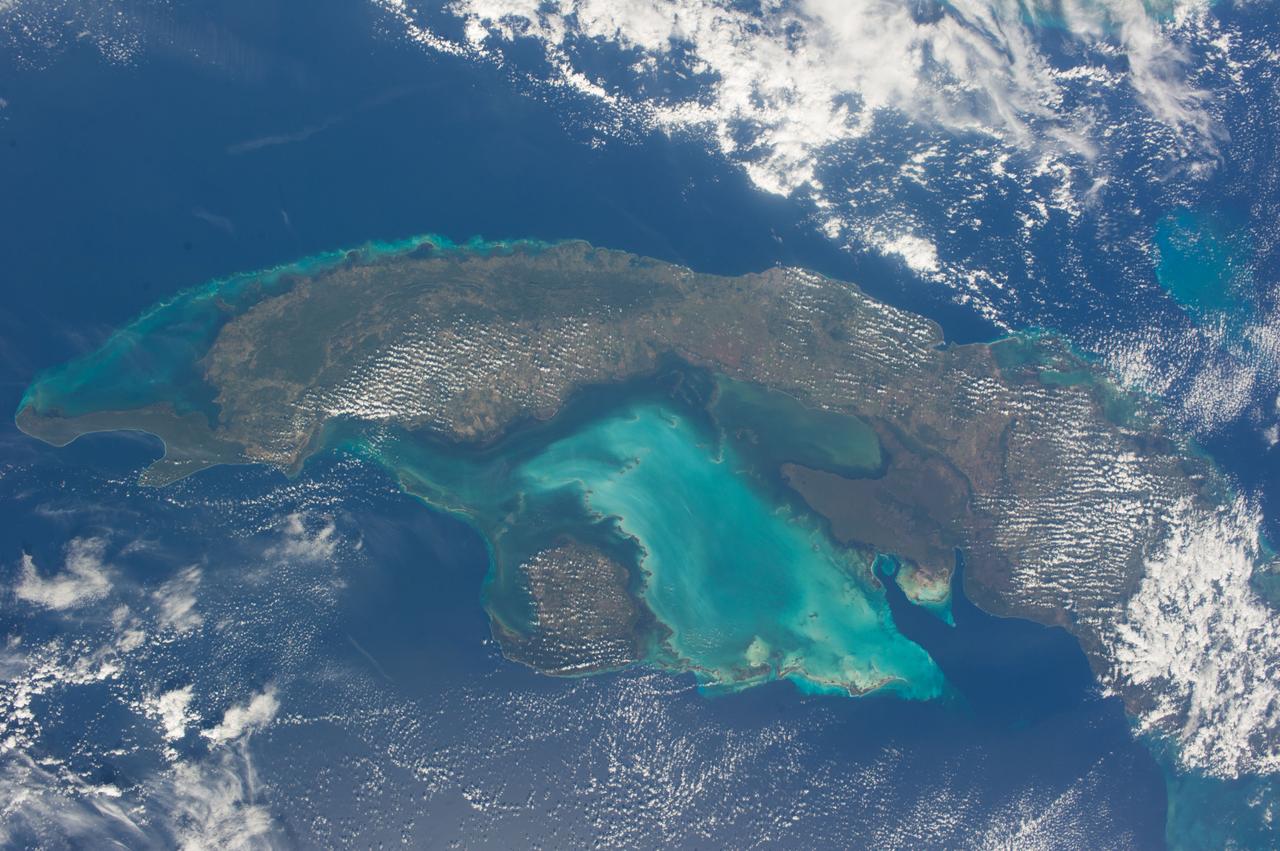
ISS038-E-021397 (24 Dec. 2013) --- The Caribbean country of Cuba is pictured in this nadir image, photographed by one of the Expedition 38 crew members aboard the International Space Station. (Note: North is at the top of the picture.) Cuba is an archipelago of islands in the northern Caribbean Sea at the confluence with the Gulf of Mexico and the Atlantic Ocean. In the southeast, the dark coastal area is home to the Sierra Maestra mountains. It is the highest mountain range on the island, with Pico Turquino reaching nearly 2000 meters. On the central southern coast of the island is the Sierra Del Escambray mountain range, including the 1160 meter-high Pico San Juan, Cuba's second highest peak.
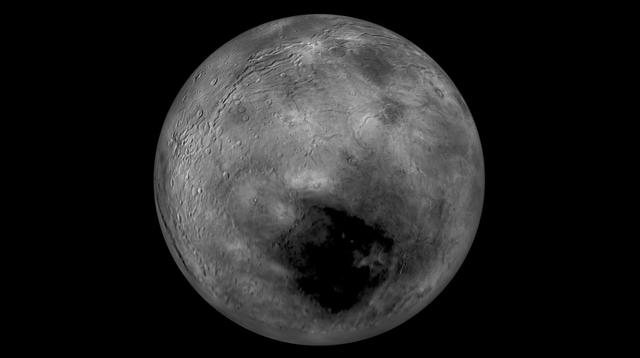
Images from NASA New Horizons spacecraft were used to create a flyover video (PIA19965) of Pluto largest moon, Charon. The flight starts with the informally named Mordor dark region near Charon north pole. In the video, the camera then moves south to a vast chasm, descending from 1,100 miles (1,800 kilometers) to just 40 miles (60 kilometers) above the surface to fly through the canyon system. From there it's a turn to the south to view the plains and "moat mountain," informally named Kubrick Mons, a prominent peak surrounded by a topographic depression. http://photojournal.jpl.nasa.gov/catalog/PIA19965
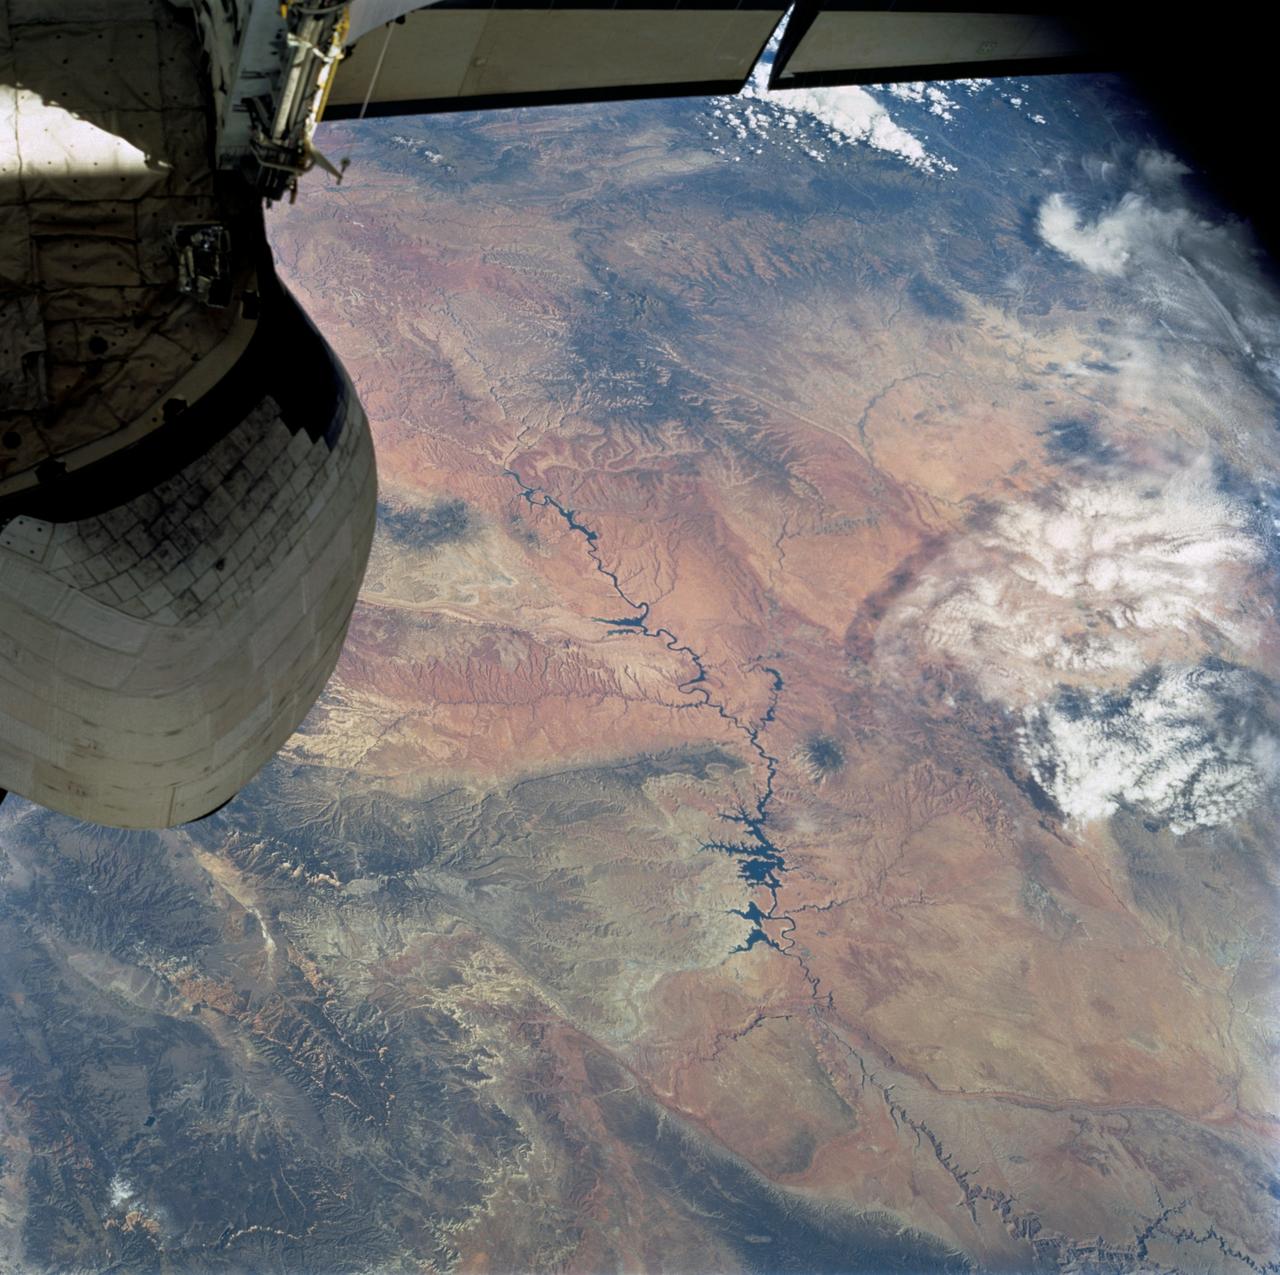
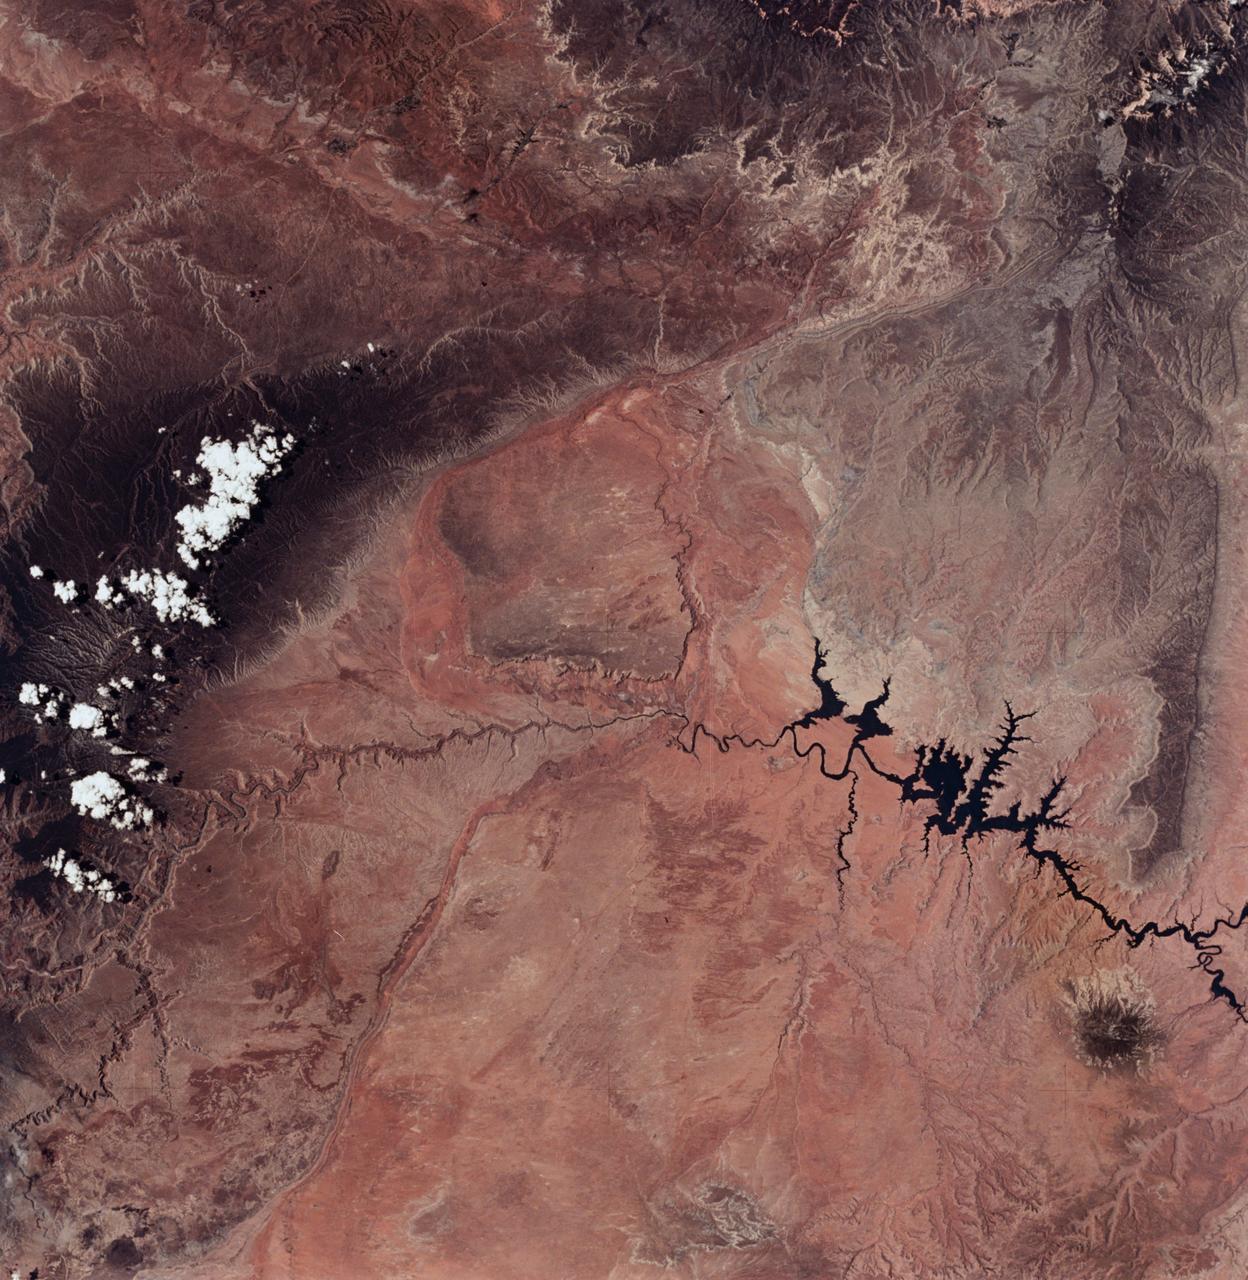
STS112-707-035 (7-18 October 2002) --- The Colorado River snakes across this view, photographed from the Space Shuttle Atlantis, from top left (near the vehicle’s vertical stabilizer), to the lower right, where the Grand Canyon gorge can be detected. The wider blue parts of the Colorado in the center of the view are Lake Powell, an artificial lake more than 120 miles long. The dark green areas are wooded slopes generally above 6000 feet. The Kaibab Plateau (lower left) and the range with Abajo Peak (11,360 feet, Utah-Colorado border region) cross the top of the view. The red areas are lower and semiarid, dominated by desert scrub vegetation.
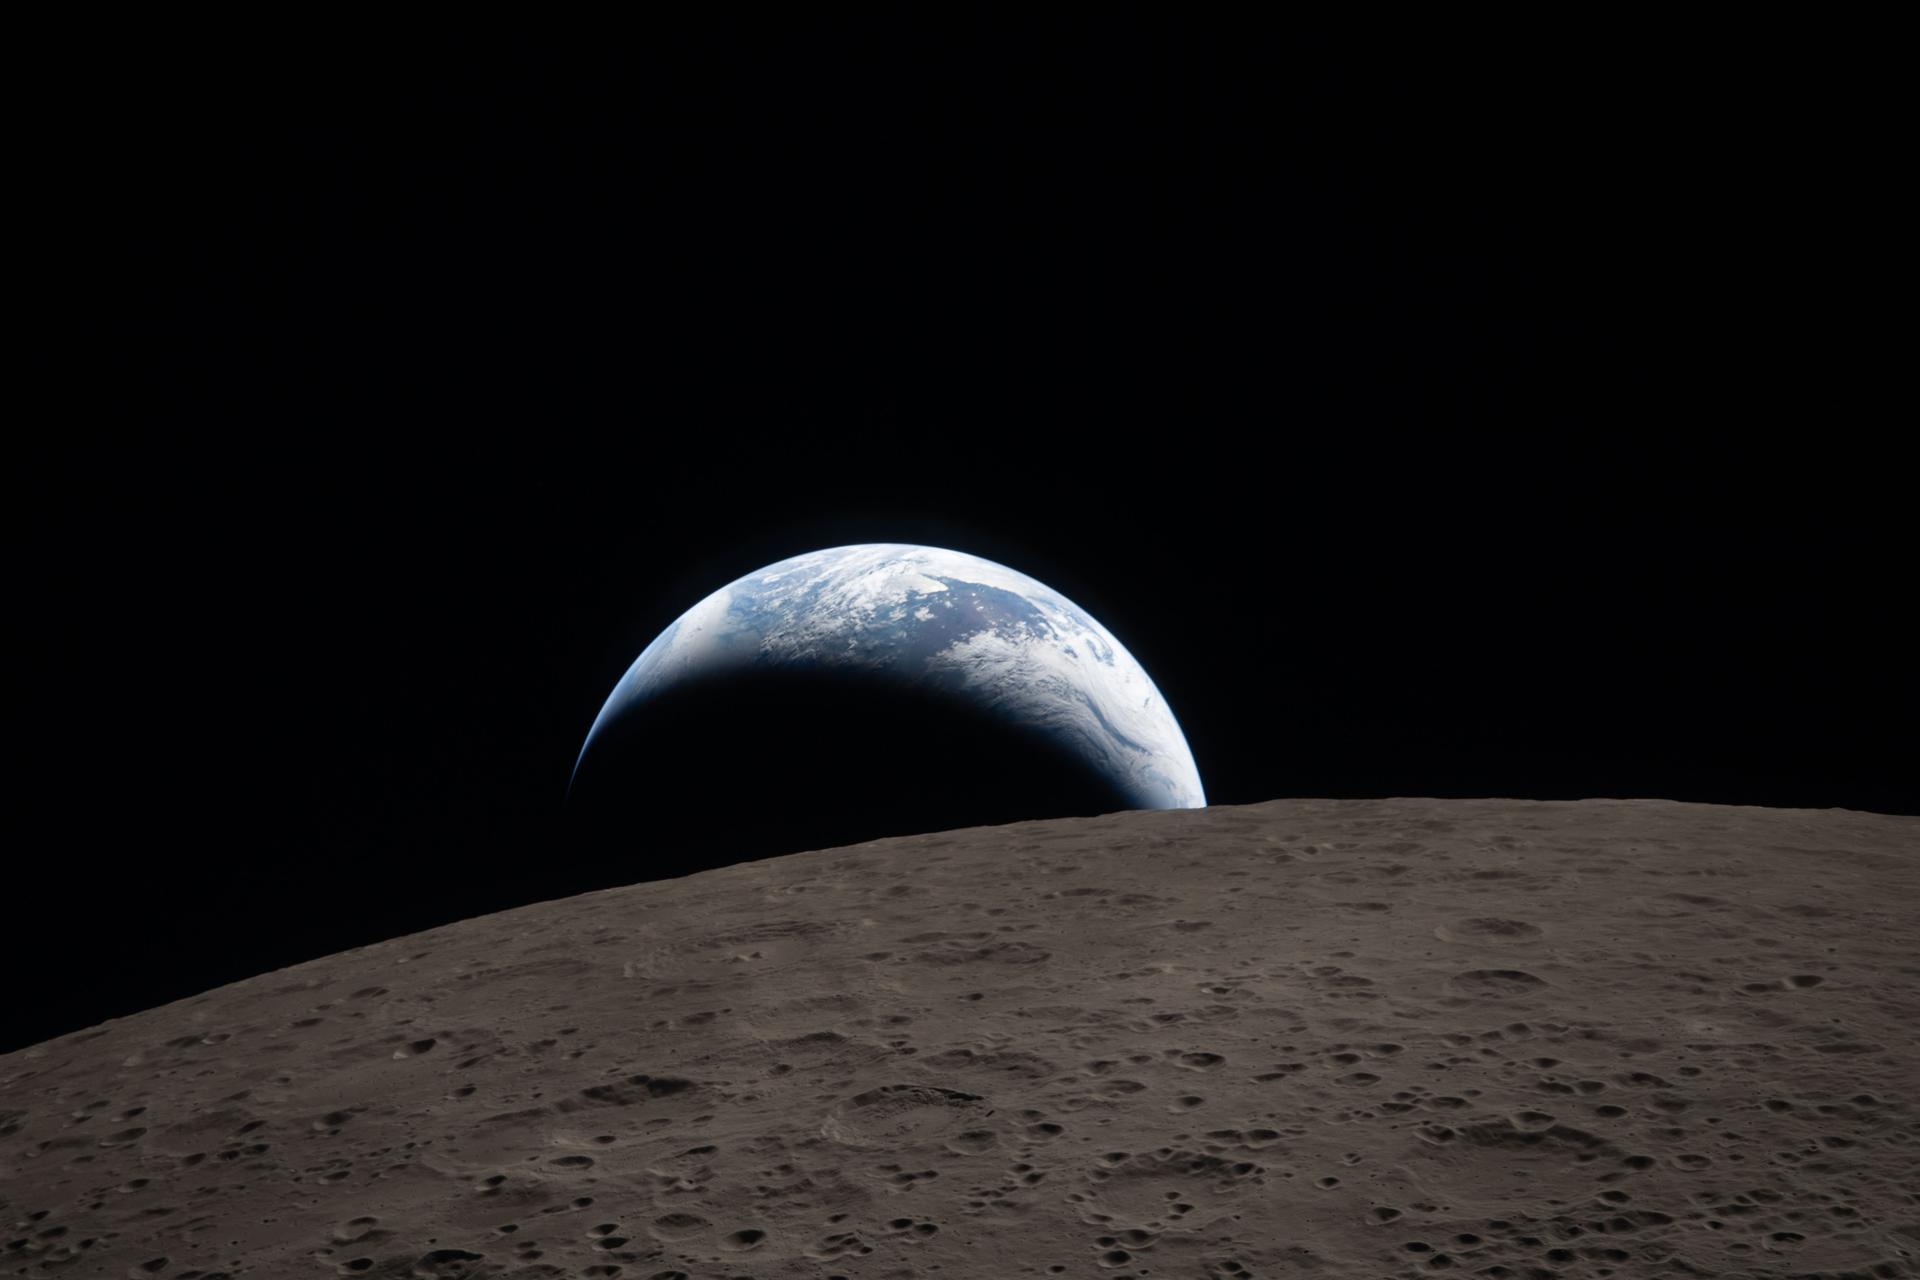
art002e009286 (April 6, 2026) – As the Artemis II crew came close to passing behind the Moon and experiencing a planned loss of signal, they captured this image of a crescent Earth setting on the Moon’s limb. The edge of the visible surface of the Moon is called the “lunar limb.” Seen from afar, it almost looks like a circular arc – except when backlit, as in other images captured by the Artemis II crew. In this photo, the dark portion of Earth is experiencing nighttime, while Australia and Oceania are in the daylight. In the foreground, the Ohm crater is visible, with terraced edges and a flat floor interrupted by central peaks—formed when the surface rebounded upward during the impact that created the crater.
art002e009288 (April 6, 2026) – Earthset captured through the Orion spacecraft window at 6:41 p.m. EDT, April 6, 2026, during the Artemis II crew’s flyby of the Moon. A muted blue Earth with bright white clouds sets behind the cratered lunar surface. The dark portion of Earth is experiencing nighttime. On Earth’s day side, swirling clouds are visible over the Australia and Oceania region. In the foreground, Ohm crater has terraced edges and a flat floor interrupted by central peaks—formed when the surface rebounded upward during the impact that created the crater.
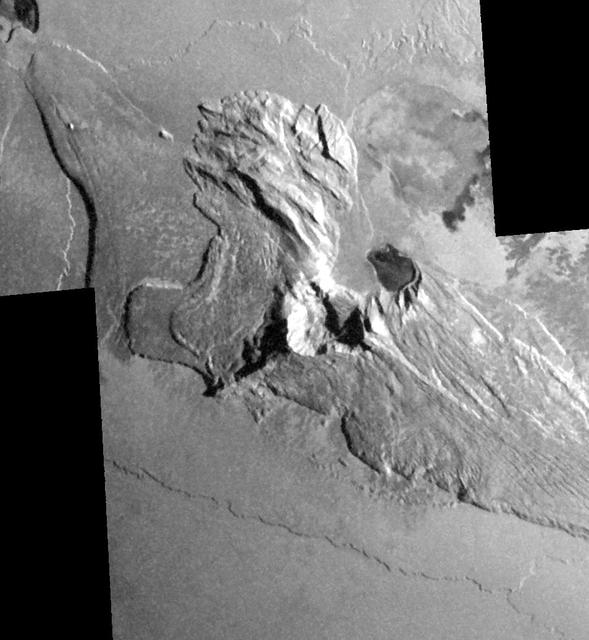
Dramatic shadows across a mountainous landscape on Jupiter's moon Io reveal details of the topography around a peak named Tohil Mons in this mosaic created from images taken by NASA's Galileo spacecraft in October 2001. Tohil Mons rises 5.4 kilometers (18,000 feet) above Io's surface, according to analysis of stereo imaging from earlier Galileo flybys of Io. The new images, with a resolution of 327 meters (1,070 feet) per picture element, were taken when the Sun was low in the sky, producing informative shadows. North is to the top and the Sun illuminates the surface from the upper right. The topographic features revealed include a very straight ridge extending southwest from the peak, 500- to 850-meter-high (1,640- to 2,790-foot-high) cliffs to the northwest and a curious pit immediately east of the peak. Major questions remain about how Io's mountains form and how they are related to Io's ubiquitous volcanoes. Although Io is extremely active volcanically, few of its mountains appear to be volcanoes. However, two volcanic craters do lie directly to the northeast of Tohil's peak, a smaller dark-floored one and a larger one at the very edge of the mosaic. Furthermore, the shape of the pit directly east of the peak suggests a volcanic origin. Galileo scientists will use these images to investigate the geologic history of Tohil Mons and its relationship to the neighboring volcanic features. The image is centered at 28 degrees south latitude and 161 degrees west longitude. http://photojournal.jpl.nasa.gov/catalog/PIA03600
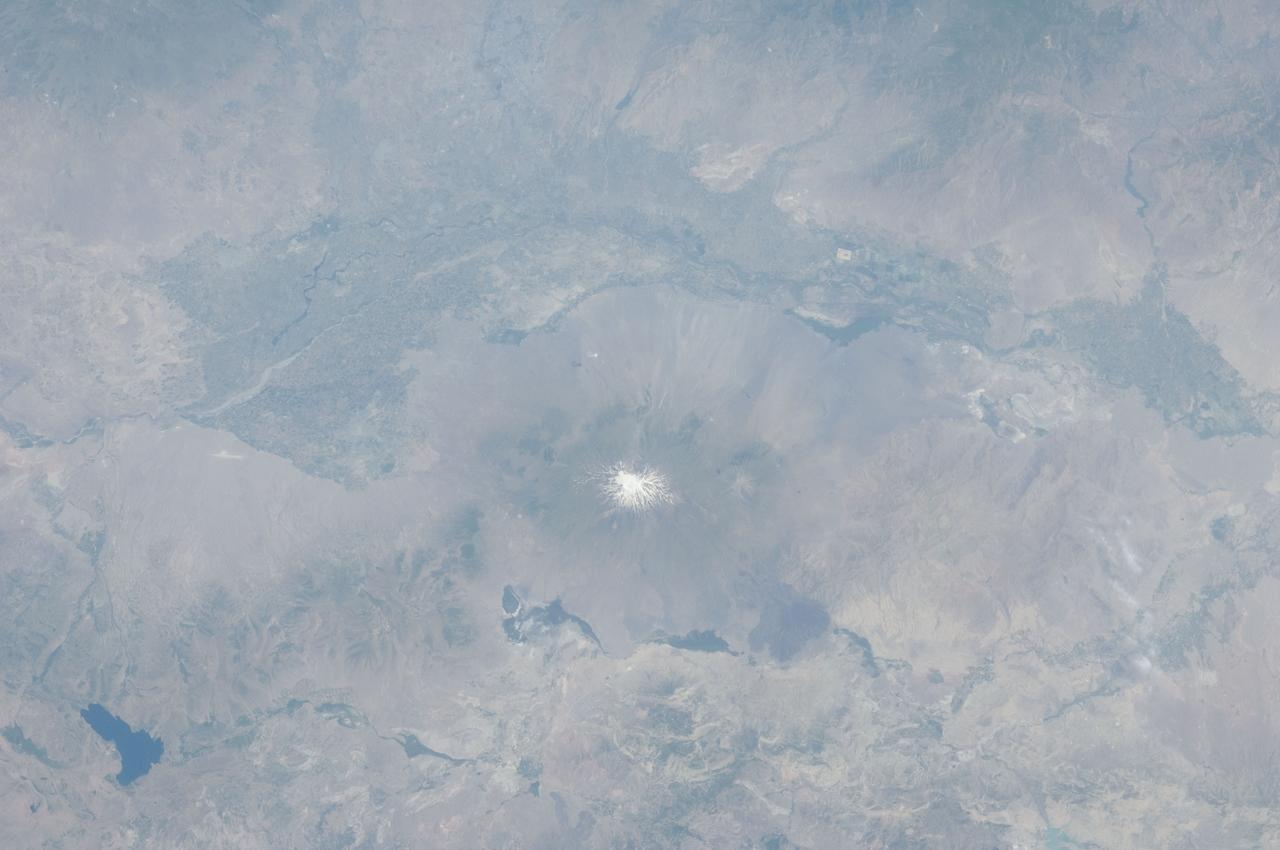
ISS028-E-015023 (8 July 2011) --- The Aras River and Turkey-Armenia-Iran border region are featured in this image photographed by an Expedition 28 crew member on the International Space Station. This photograph highlights a segment of the international border between Turkey to the south-southwest and Armenia to the north-northeast. The Aras River is the physical expression of the closed border between the two countries. Extensive green agricultural fields are common on both sides of the river (top), as well as a number of gray to tan urban areas including Artashat and Armavir in Armenia and Igdir in Turkey. While there have been efforts to normalize diplomatic relations between the two countries in recent years, the Armenia-Turkey border remains officially closed. The dominant geographic feature in the region is Mt. Ararat, also known as Agri Dagi. The peak of Ararat, a large stratovolcano that last erupted in 1840 according to historical records, is located approximately 40 kilometers to the south of the Armenia-Turkey border. A lower peak to the east, known as Lesser or Little Ararat, is also volcanic in origin. Dark gray lava flows to the south of Mt. Ararat are located near the Turkish border with Iran. While this border is also closed along much of its length, official crossing points allow relatively easy travel between the two countries. The white, glacier-clad peak of Mt. Ararat is evident at center; dark green areas on the lower slopes indicate where vegetation cover is abundant. A large lake, Balik Golu or Fish Lake, is visible to the west (lower left).
STS060-85-000AH (3-11 Feb 1994) --- This view is centered at about 44 degrees south along the Chilean continental margin of South America. The dark-colored coastal region is heavily forested by dense old-growth forests that are now being cut, but east of the mountains in Argentina the dry climate supports very little vegetation. This desert region known as Patagonia appears as light brown colors. The coastline is especially dramatic because it is shaped by the tortuous channels carved by glaciers which have left fjords. These fjords have effectively cut across the continental divide, and are bordered by active volcanoes which reach elevations between 2, 000 - 3,000 meters. The prominent volcanic peak in the center of the frame is Mt. Melimoya. To the north is a long, snow-covered volcanic ridge called Cerro Yantales. Cerro Yantales recently reported greatly increased fumarolic activity, including the emission of yellow gases near the summit. Russian and American scientists will use this photography to look for further evidence of increased activity like snow melt around the peak. Other Russian and American scientists are particularly interested in mapping the summertime snowline and firm (permanent snow field) elevations as early indications of any potential climatic variation in the making.
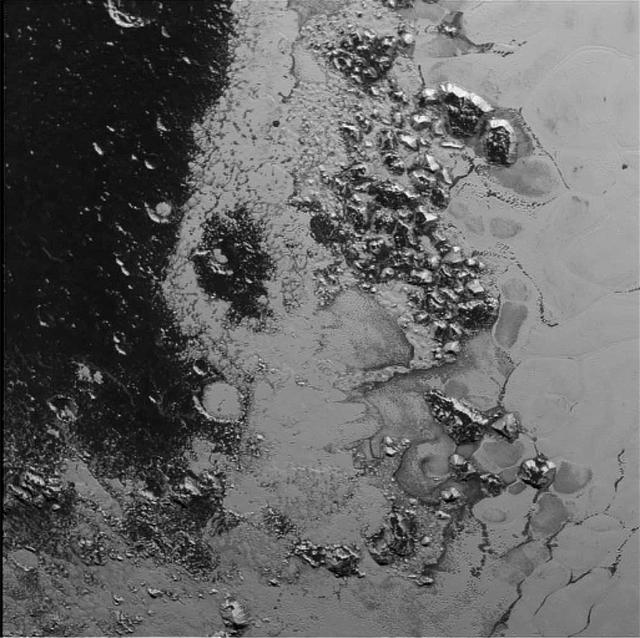
A newly discovered mountain range lies near the southwestern margin of Pluto heart-shaped Tombaugh Regio Tombaugh Region, situated between bright, icy plains and dark, heavily-cratered terrain. This image was acquired by NASA's New Horizons' Long Range Reconnaissance Imager (LORRI) on July 14, 2015, from a distance of 48,000 miles (77,000 kilometers) and sent back to Earth on July 20. Features as small as a half-mile (1 kilometer) across are visible. These frozen peaks are estimated to be one-half mile to one mile (1-1.5 kilometers) high, about the same height as the United States' Appalachian Mountains. The Norgay Montes (Norgay Mountains) discovered by New Horizons on July 15 more closely approximate the height of the taller Rocky Mountains The names of features on Pluto have all been given on an informal basis by the New Horizons team. http://photojournal.jpl.nasa.gov/catalog/PIA19842
This unnamed crater in Terra Cimmeria has both a sand sheet with dune forms and a multitude of dust devil tracks. The linear and scalloped dark marks are created by dust devils removing surface dust and revealing the darker surface beneath the dust. It is common for sand to accumulate in the floor of crater. Changes in the wind occur due to the crater shape and possible internal peak or pit features. As the winds are deflected by this type of feature the sand and dust carried by the wind will settle out. The extensive number of dust devil tracks indicate that surface winds are pervasive in this region. Orbit Number: 75246 Latitude: -58.8609 Longitude: 172.829 Instrument: VIS Captured: 2018-12-01 00:11 https://photojournal.jpl.nasa.gov/catalog/PIA23024
SL2-04-018 (June 1973) --- A vertical view of the Arizona-Utah border area showing the Colorado River and Grand Canyon photographed from the Skylab 1/2 space station in Earth orbit. This picture was taken by one of the six lenses of the Itek-furnished S190-A Multispectral Photographic Facility Experiment in the Multiple Docking Adapter of the space station. Type S0-356 film was used. The row of white clouds extend north-south over the dark colored Kaibab Plateau. The junction of the Colorado and Little Colorado rivers is in the southwest corner of the picture. The body of water is Lake Powell on the Colorado River upstream from the Grand Canyon. The lone peak at the eastern edge of the photograph south of Colorado River is the 10,416-foot Navajo Mountain. The S190-A experiment is part of the Skylab Earth Resources Experiments Package(EREP). Photo credit: NASA
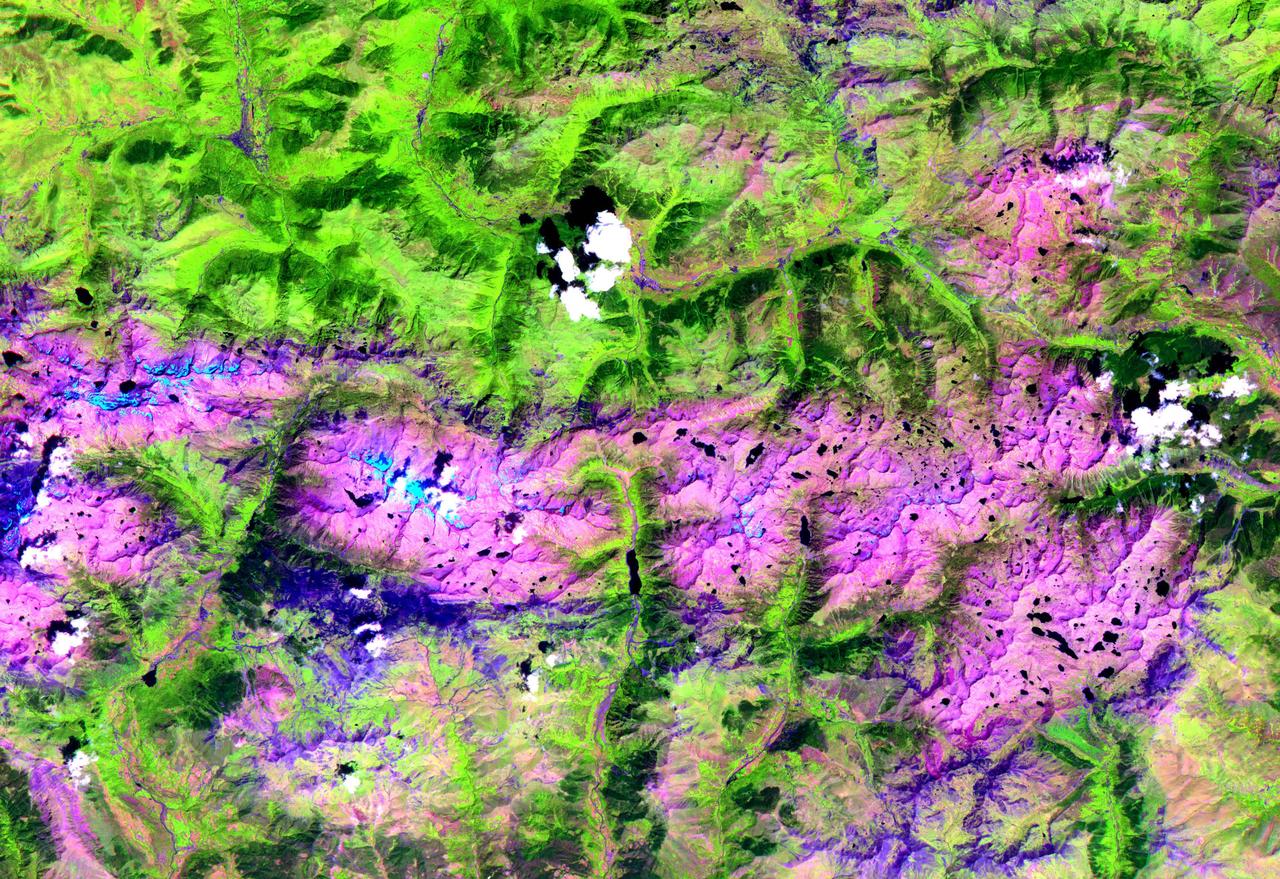
This ASTER image, acquired on August 1, 2000, covers an area of 57 by 29 km and covers part of the central Pyrenees in Spain. The Pyrenees in southwestern Europe extend for about 435 kilometers (about 270 miles) from the Bay of Biscay to the Mediterranean Sea, separating the Iberian Peninsula from the rest of Europe. The Pyrenees form most of the boundary between France and Spain, and encompass the tiny principality of Andorra. Approximately two-thirds of the mountains lie in Spain. The central Pyrenees extend to the Collines du Perche and contain the highest peaks of the system, including Pico de Aneto, the highest at 3,404 meters (11,168 feet). ASTER bands 4, 3 and 2 were displayed in red, green and blue. In this combination, snow is blue, vegetation is green, bare rocks are pink and dark blue, and clouds are white. The image is located at 42.6 degrees north latitude and 0.6 degrees east longitude. http://photojournal.jpl.nasa.gov/catalog/PIA11162
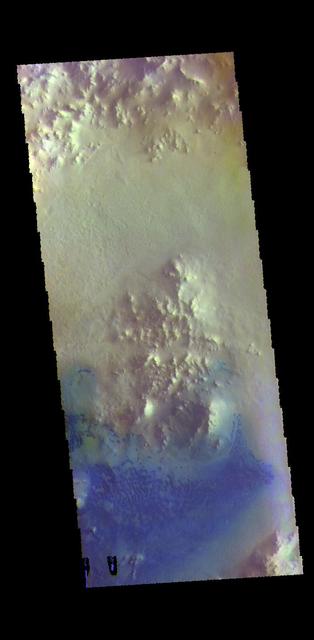
This VIS image shows the floor of an unnamed crater in Arabia Terra. The peaks in the center of the crater floor were formed by the rebound of melted rock at the time of the impact. There are individual sand dunes in the southern half of the crater. The dark blue tone in this filter combination indicates that the dunes are made of basaltic sand. The THEMIS VIS camera contains 5 filters. The data from different filters can be combined in multiple ways to create a false color image. These false color images may reveal subtle variations of the surface not easily identified in a single band image. Orbit Number: 60976 Latitude: 10.0004 Longitude: 8.21209 Instrument: VIS Captured: 2015-09-12 12:29 https://photojournal.jpl.nasa.gov/catalog/PIA23054
Today's image shows an unnamed crater located in Arabia Terra. The small crater seen in the image is located on the floor of a much larger crater. The details visible in the crater indicate that it is a relatively youthful crater exhibiting pre-erosion morphology. This crater shape is a central peak with two rims that are close together. The inner ring is actually part of the original rim that slumped downward during the impact event. The inner rim is mostly a flat terrace, giving this a crater morphology type the name terraced wall crater. Small dark dunes are visible in the lower left corner of the image. Orbit Number: 78901 Latitude: 10.8884 Longitude: 9.16256 Instrument: VIS Captured: 2019-09-28 00:39 https://photojournal.jpl.nasa.gov/catalog/PIA23537
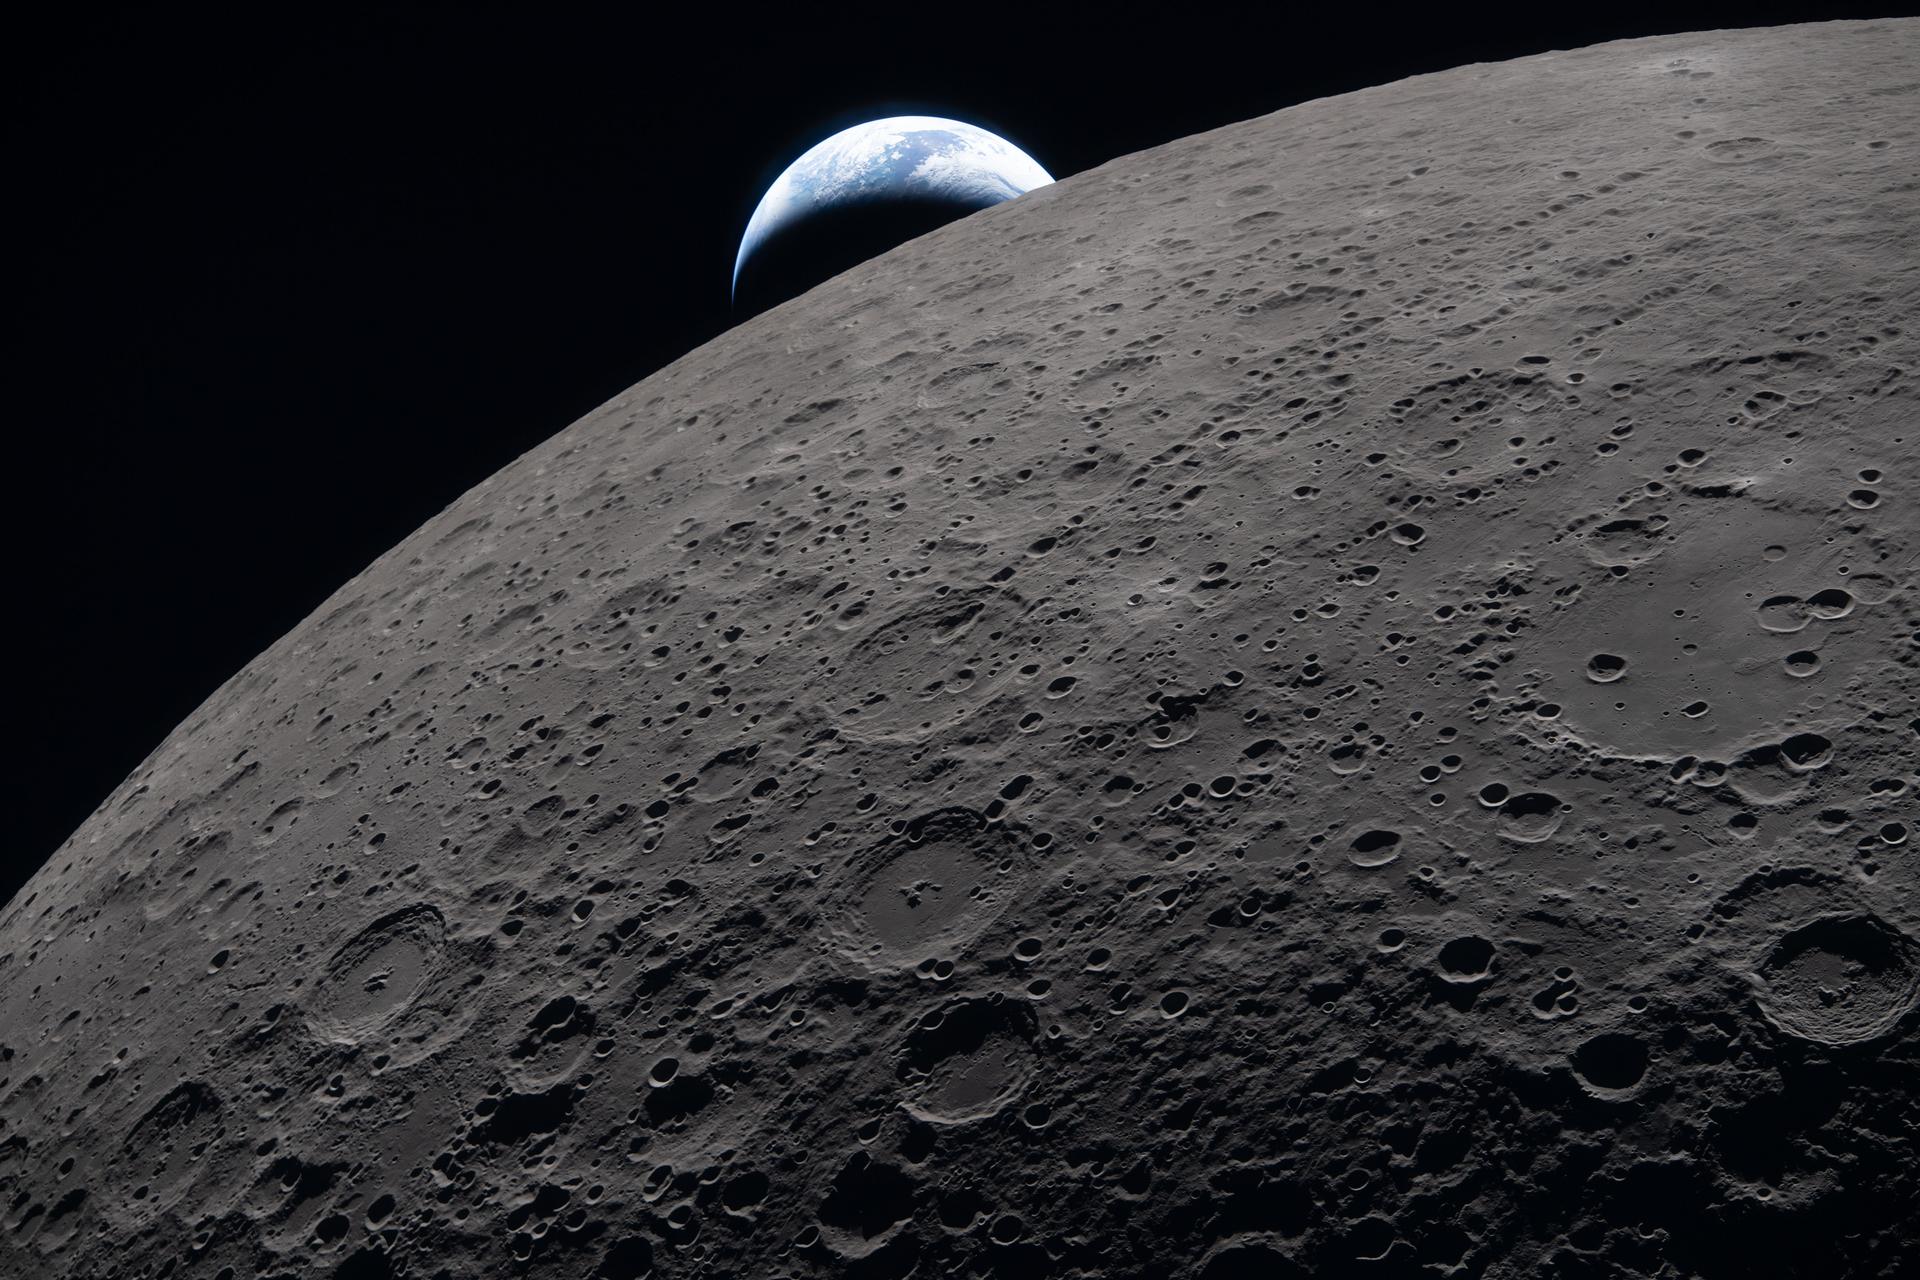
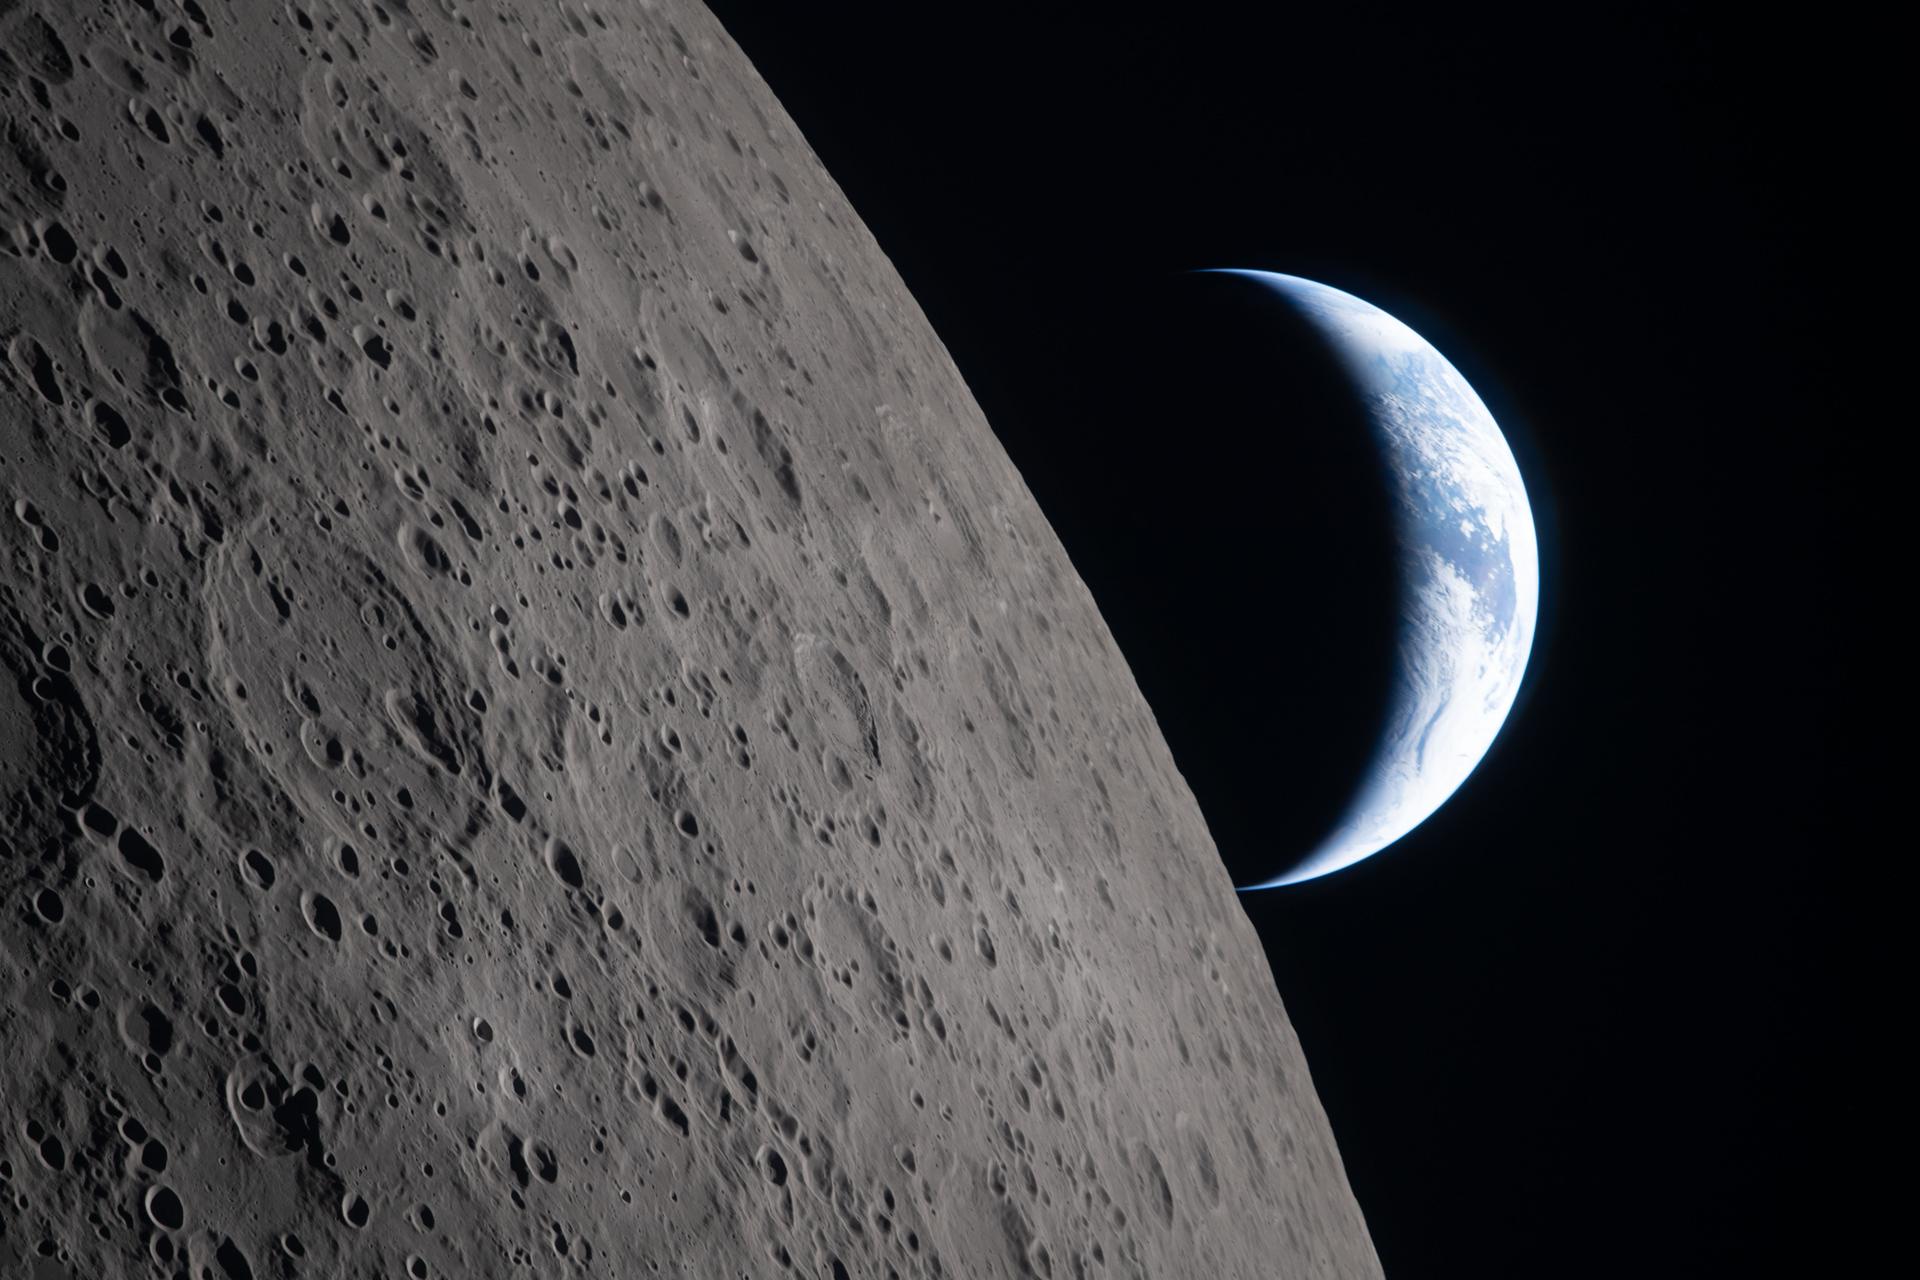
art002e009289 (April 6, 2026) – The lunar surface fills the frame in sharp detail, as seen during the Artemis II lunar flyby, while a distant Earth sets in the background. This image was captured at 6:41 p.m. EDT, on April 6, 2026, just three minutes before the Orion spacecraft and its crew went behind the Moon and lost contact with Earth for 40 minutes before emerging on the other side. In this image, the dark portion of Earth is experiencing nighttime, while on its day side, swirling clouds are visible over the Australia and Oceania region. In the foreground, Ohm crater shows terraced edges and a relatively flat floor marked by central peaks — formed when the surface rebounded upward during the impact that created the crater.
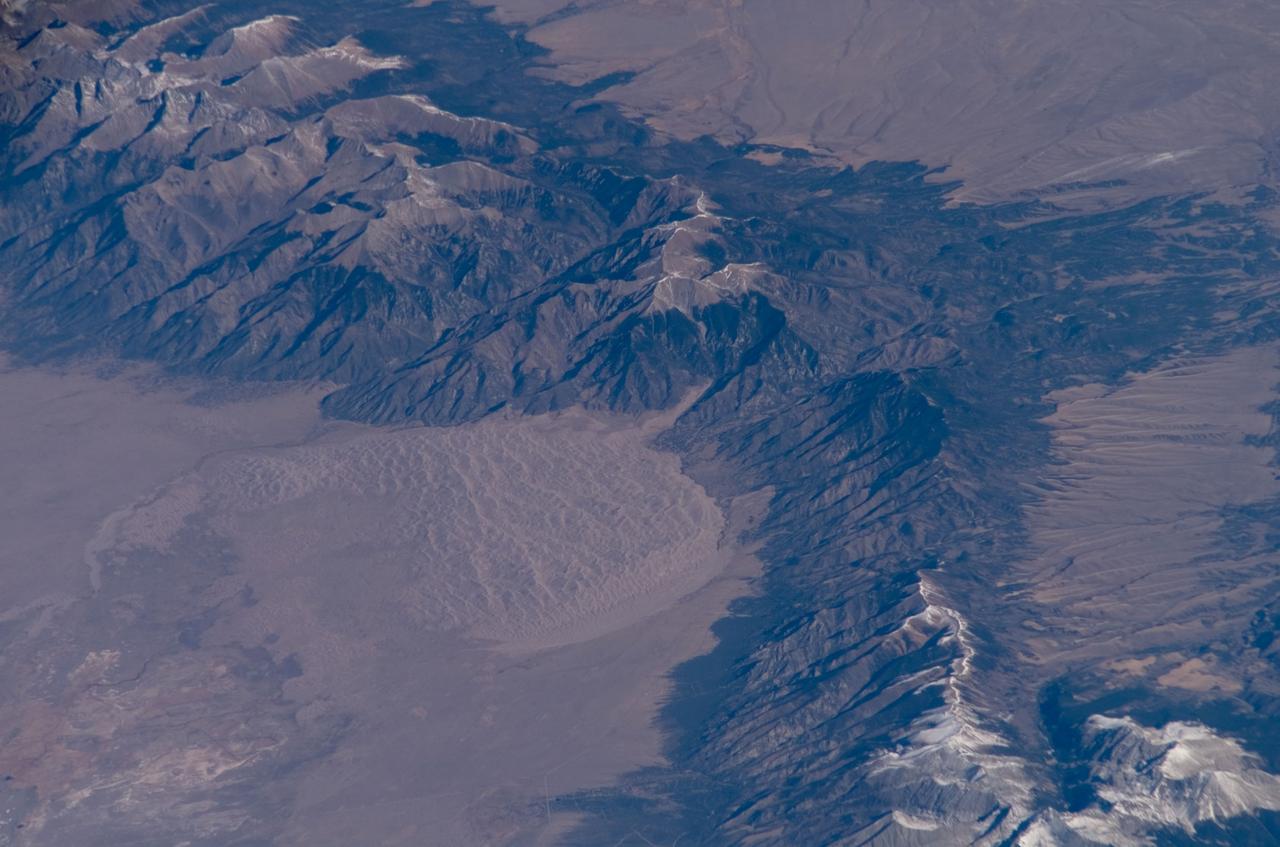
ISS016-E-006986 (26 Oct. 2007) --- Great Sand Dunes National Park and Preserve, Colorado is featured in this image photographed by an Expedition 16 crewmember on the International Space Station. The Sangre de Cristo Mountains of south-central Colorado stretch dramatically from top left to lower right of this image, generally outlined by the dark green of forests with white snow-capped peaks on the highest elevations. Dun-colored dunes, covering an area of 80 square kilometers, are banked up on the west side of the mountains and comprise the Great Sand Dunes National Park and Preserve. Originally established in 1932 as a National Monument, it was reauthorized as a National Park in 2004. The park contains dunes over 750 feet (227 meters) high -- among the highest in North America. Sand grains that make up the dunes are small enough to be moved along by the wind (a process known as saltation), although much of the dunefield is now anchored by vegetation. Predominant winds blow broadly to the east, so that sand in the San Luis valley (part of which appears at lower left) is driven towards and piled against the Sangre de Cristo Mts. The sand of the dunes is mostly derived from ancient exposed lakebed sediments - now the floor of the San Luis valley - formed by erosion of rocks in the Sangre de Cristo and San Juan Mountains (located to the west). The action of streams and occasional storms today returns some of the impounded sand back to the valley, where the prevailing winds begin the sand's migration to the dunefield anew. Interestingly, the specific location of the sand field appears to be related to a locally lower altitude sector of the Sangre de Cristo Mts. Altitudes can be inferred from the distribution of snow cover on the day this image was taken. Areas to the north (Cleveland Peak and northward) of the dunefield, and to the south around Blanca Peak, are higher than the ridgeline next to the dune field where almost no snow is visible. Since winds are preferentially channeled over the lower parts of any range (hundreds of meters lower here than ridgelines to north and south), sand grains are carried up to (but not over) the low point of the range.
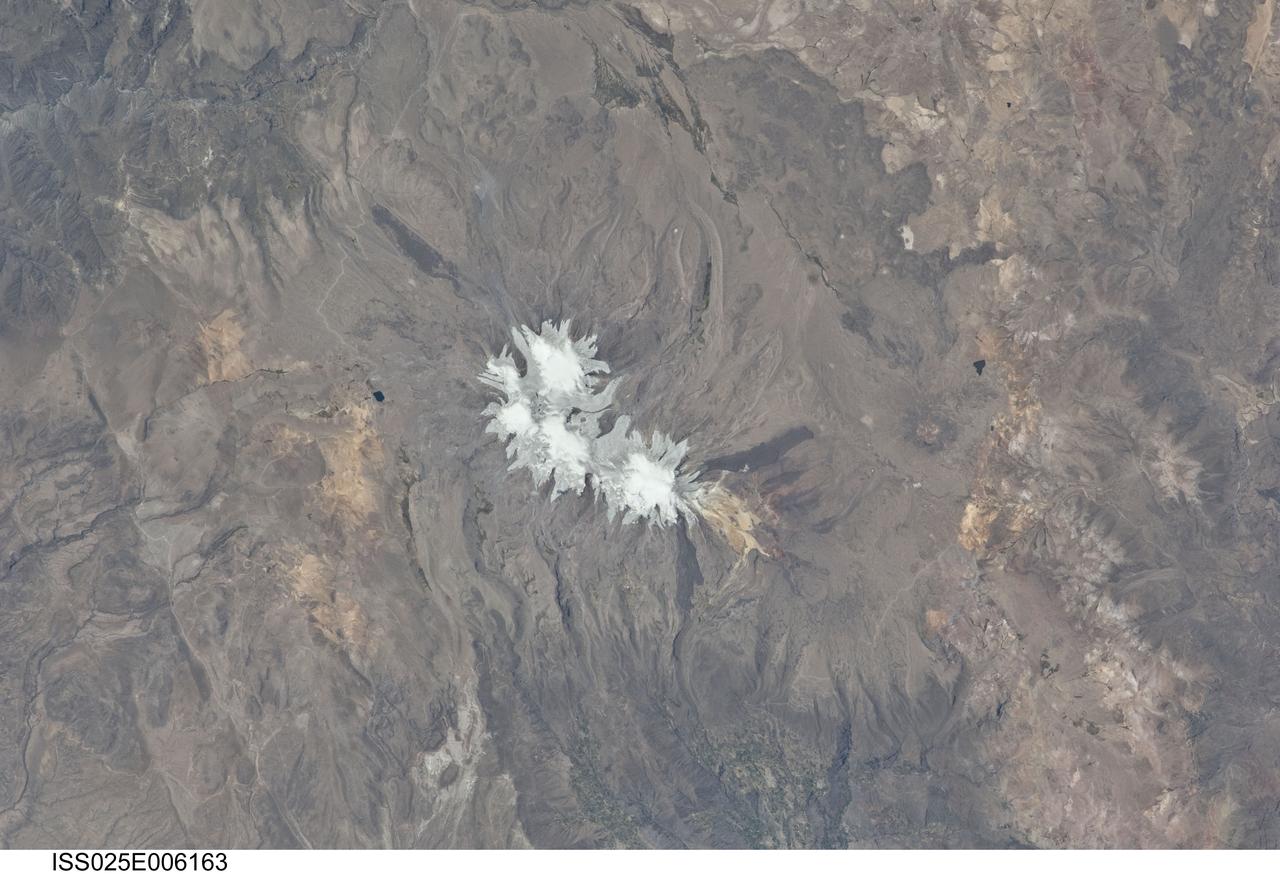
ISS025-E-006163 (6 Oct. 2010) --- Nevado Coropuna, Peru is featured in this image photographed by an Expedition 25 crew member on the International Space Station. Nevado (“snowy” or “snowy peak” in Spanish) Coropuna is the highest volcanic peak in Peru – the summit elevation is 6,377 meters above sea level. Rather than being a single stratovolcano, Coropuna is a volcanic complex of numerous summit cones. The complex covers an area of 240 square kilometers within the Ampato mountain range (Cordillera Ampato) in southeast-central Peru. While the exact date of the volcano’s last eruption is not known, lava flows (black, at center and upper left) along the northern, southern, and western flanks of the complex are thought to have been emplaced during the early Holocene Epoch – the current geologic time period which began approximately 12,000 years ago, according to scientists. Coropuna also hosts several summit glaciers and icefields (white to gray, center) that contrast sharply with the dark rock outcrops and surface deposits at lower elevations. Glacial deposits and lateral moraines on the flanks of Coropuna indicate that glaciers once extended to much lower elevations than are observed today. Scientists believe that careful mapping and surface exposure age-dating of these glacial deposits and landforms provides data on the timing of ice advances and retreats in the tropics near the end of the Pleistocene Epoch (extending from approximately 2.5 million to approximately 12,000 years ago). In turn, this information can be compared with other paleoclimate records to obtain a better understanding of how Earth’s global climate has changed over geologic time.
This Magellan image mosaic shows the impact crater Golubkina, first identified in Soviet Venera 15/16 data. The crater is names after Anna Golubkina (1864-1927), a Soviet sculptor. The crater is about 34 km (20.4 mi.) across, similar to the size of the West Clearwater impact structure in Canada. The crater Golubkina is located at about 60.5 degrees north latitude, 286.7 degrees est longitude. Magellan data reveal that Golubkina has many characteristics typical of craters formed by a mereorite impact including terraced inner walls, a central peak, and radar-bright rough ejecta surrounding the crater. The extreme darkness of the crater floor indicates a smooth surface, perhaps formed by the ponding of lava flows in the crater floor as seen in may lunar impact craters. The radar-bright ejecta surrounding the crater indicates a relatively fresh or young crater. Craters with centeral peaks in the Soviet data range in size from about 10-60 km (6-36 mi.) across. The largest crater identifed in the Soviet Venera data is 140 km (84 mi) in diameter. This Magellan image strip in approx. 100 km (62 mi.) long. The image is a mosaic of two orbits obtained in the first Magellan radar test and played back to Earth to the Deep Space Network stations near Goldstone, CA and Canberra, Australia, respectively. The resolution of this image is approximately 120 meters (400 feet). The see-saw margins result from the offset of individual radar frames obtained along the orbit. The spacecraft moved from the north (top) to the south, looking to the left.
SL4-138-3875 (February 1974) --- A color oblique photograph looking east over the Rocky Mountains and Great Plains. This view covers a portion of the States of Colorado, Wyoming, and Nebraska. A Skylab 4 crewmen took this picture with a hand-held 70mm Hasselblad camera. This entire region, covered with a blanket of snow, depicts much of the structural and topographic features of the Rocky Mountain chain. Man's only apparent change to the snow pattern seen here is the (right center) metropolitan areas of Denver and Colorado Springs, Colorado, which can be observed along the eastern edge of the mountain front. Grand Junction, Colorado on the western slope of the Rocky Mountains is just off the photograph at left center bottom. The major inter-montane valleys of South Park (right center), Middle Park (center), and North Park (left center) are clearly visible and separate the Colorado Rockies Front Range from the high rugged mountains can be discovered such as Pikes Peak near right border (center), Mt. Cunnison region, circular feature accentuated by the Cunnison River (dark) in the right center (bottom) of the photograph. The snow covered peaks of Mts. Harvard, Princeton and Yale form the high region of the Collegiate Range which is the pronounced mountain area in the right center. Snow cover not only enhances mountain features but also the drainage patterns. East of Denver (right corner) the sinuous trace of the South Platte River (center) and its junction with the North Platte River near North Platte, Nebraska. Lake McConaughy in Nebraska is the body of water (black) near the river intersection. The trace of the Republic River in southern Nebraska is visible near the right corner of the photography. Geologic and hydro logic studies using this photograph will be conducted by Dr. Roger Morrison, U.S. Geological Survey. Photo credit: NASA
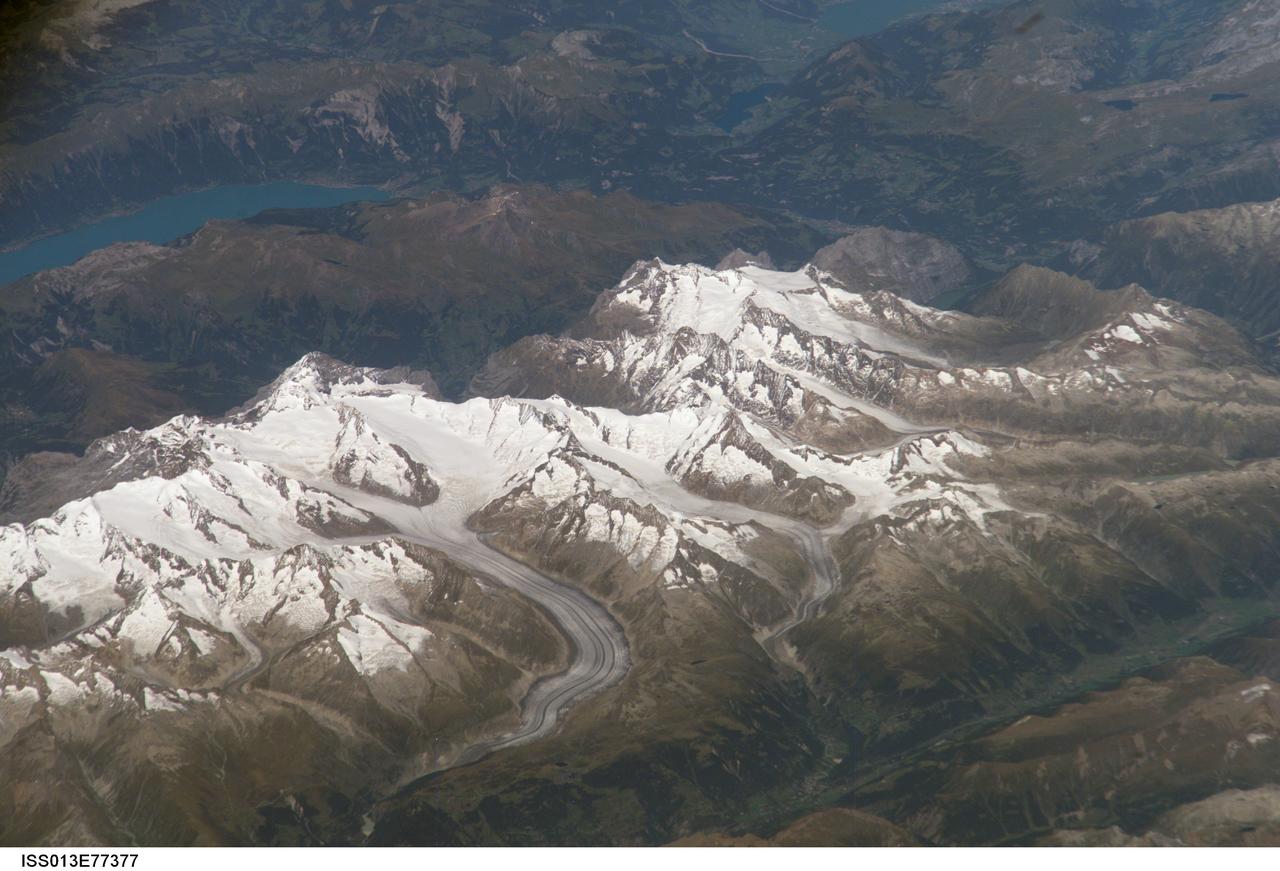
ISS013-E-77377 (5 Sept. 2006) --- Bernese Alps, Switzerland is featured in this image photographed by an Expedition 13 crewmember onboard the International Space Station. The formidable mountain system of the Alps stretches across much of central Europe, with seven countries claiming portions of the mountains within their borders (Germany, France, Switzerland, Italy, Liechtenstein, Austria, and Slovenia). The glacial landscape of the Bernese Alps, located in southwestern Switzerland, is well illustrated by this view. The image was taken by a crewmember looking north-northwest while the station was located over the Mediterranean Sea between Corsica and Italy -- this oblique viewing angle imparts a sense of perspective to the image. This type of viewing angle complements more nadir (downward)--viewing imagery of the region. Three of the higher peaks of the central Alps are visible--Jungfrau (4,158 meters), Moench (4,089 meters), and Eiger (3,970 meters). To the east and south of the Jungfrau is the Aletsch Glacier, clearly marked by dark medial moraines extending along the glacier's length parallel to the valley axis. The moraines are formed from rock and soil debris collected along the sides of three mountain glaciers located near the Jungfrau and Moench peaks -- as these flowing ice masses merge to form the Aletsch Glacier, the debris accumulates in the middle of the glacier and is carried along the flow direction. According to geologists, Lake Brienz to the northwest was formed by the actions of both glacial ice and the flowing waters of the Aare and Lutschine rivers, and has a maximum depth of 261 meters. The lake has a particularly fragile ecosystem, as demonstrated by the almost total collapse of the whitefish population in 1999. Possible causes for the collapse, according to the scientists, include increased water turbidity associated with upstream hydropower plant operations, and reduction of phosphorus (a key nutrient for lake algae, a basic element of the local food web) due to water quality concerns.
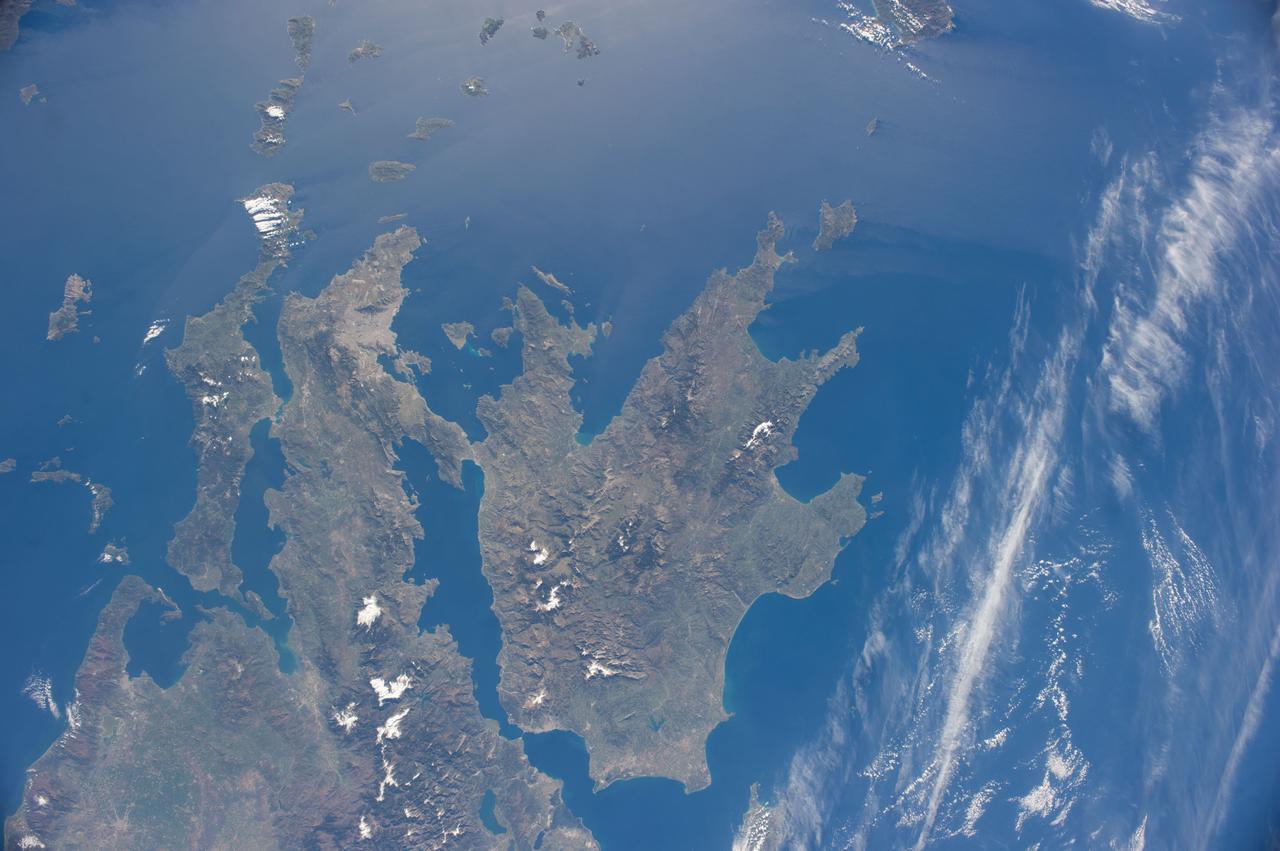
ISS039-E-003505 (21 March 2014) --- The Peloponnese, Greece is featured in this image photographed by an Expedition 39 crew member on the International Space Station. This view shows most of Greece. The urban region of Athens is readily recognizable due to its size and light tone compared to the surrounding landscape, although smaller Megara and Lamia also stand out. The dark-toned mountains with snow-covered peaks contrast with the warmer, greener valleys where agriculture takes place. The intense blue of the Mediterranean Sea fades near the sun?s reflection point, where numerous wind streaks in the lee of the island become visible along the right side of the image. The Peloponnese, ancient Sparta, is the great peninsula separated from the mainland by the narrow Isthmus of Corinth. Several times over the centuries the narrows have acted as a defensive point against attack from the mainland. More recently in 1893 the narrows provided a point of connection when a ship canal was excavated between the gulfs to the west and to the east.
There are many hills and knobs on Mars that reveal aspects of the local geologic history. Typically, the hills in the relatively-smooth region surrounding this image are flat topped erosional remnants or mesas with irregular or even polyhedral margins. These landforms suggest wide spread erosion of the soft or weakly-cemented sedimentary layers. This hill stands out because of is circular inverted-cone shape and apparent dark streaks along its flanks visible in lower resolution images. Close inspection from HiRISE reveals that the fine soils sloping down from the peak are intersected with radiating lines of rock and eroding rubble. This formation is similar to lava intrusions that form in the core of a volcano. As lava is squeezed up into a central conduit, radiating fractures fill with lava forming rock units called dikes. As the lava cools inside the ground and in the fractures, it forms into a harder rock that is more resistant to erosion. Later, as the surrounding sediments and soils erode, the resistant volcanic rock remains standing to tell a story of what happened underground long ago. http://photojournal.jpl.nasa.gov/catalog/PIA20003
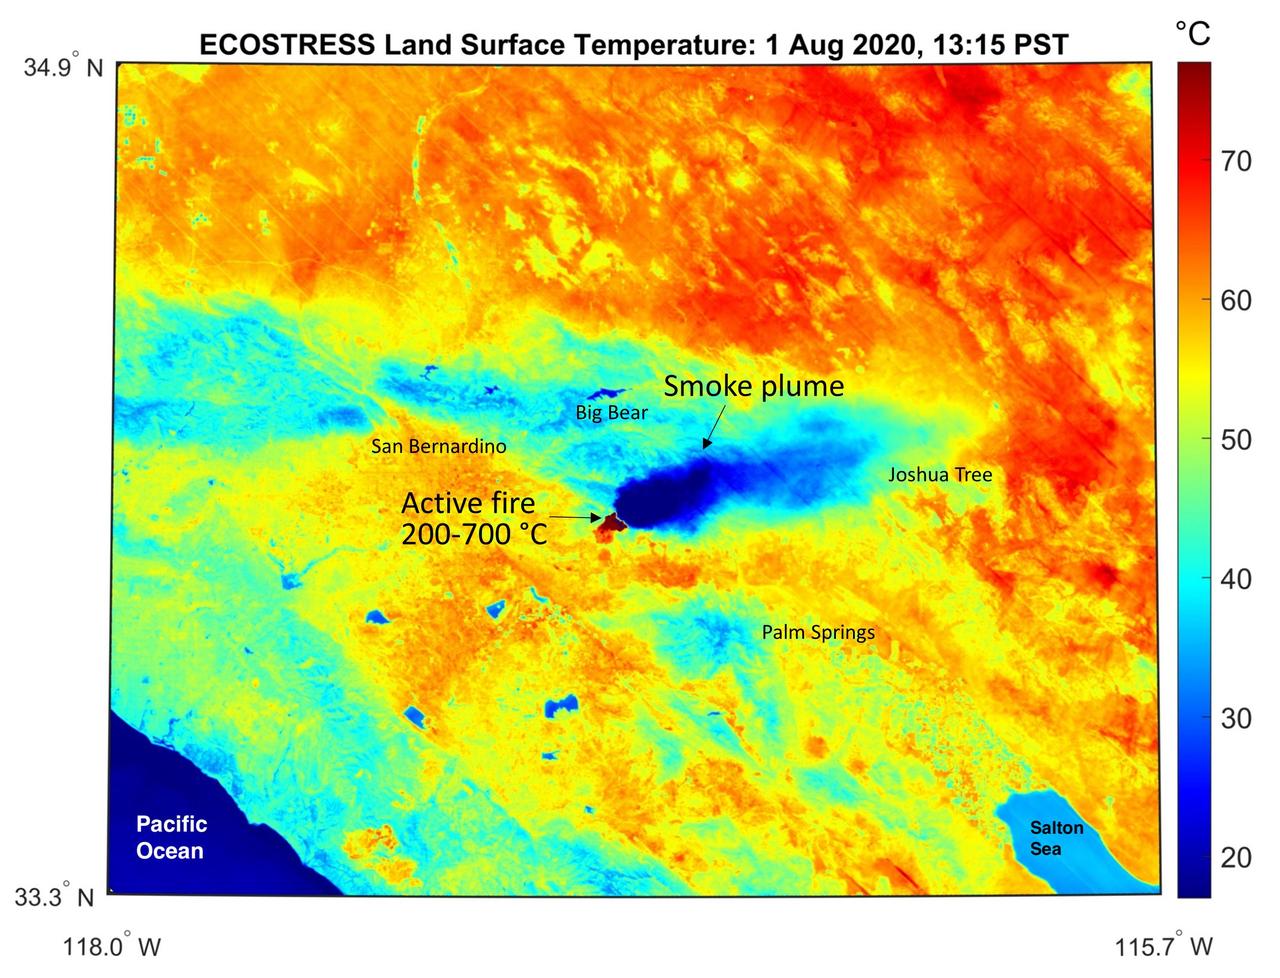
This temperature map shows the stressed and dry vegetation surrounding the Apple fire in Southern California on Aug. 1, 2020. The observation was made possible by NASA's Ecosystem Spaceborne Thermal Radiometer Experiment on Space Station (ECOSTRESS) that measured the temperature of the burn area and tracked the dark smoke plume drifting east from California to Arizona. ECOSTRESS collected this data when the space station passed over the region at about 1:15 p.m. PST on Saturday, Aug. 1, 2020, when the burn area was approximately 4,000 acres in size. Black smoke can be seen drifting east and over Joshua Tree National Park in the Mojave Desert. With a resolution of about 77 by 77 yards (70 by 70 meters), the image enables surface-temperature conditions down to the size of a football field to be studied. In the active burn area, temperatures of between 390-1290 F (200-700 C) were recorded, and in one pixel in the ECOSTRESS image of the burn zone, a peak temperature of 1387 F (753 C) was detected. Tasked with detecting plant water use and stress, ECOSTRESS measures the temperature of plants as they heat up when they run out of water. But it can also measure and track heat-related phenomena like fires, heat waves, and volcanoes. https://photojournal.jpl.nasa.gov/catalog/PIA23798
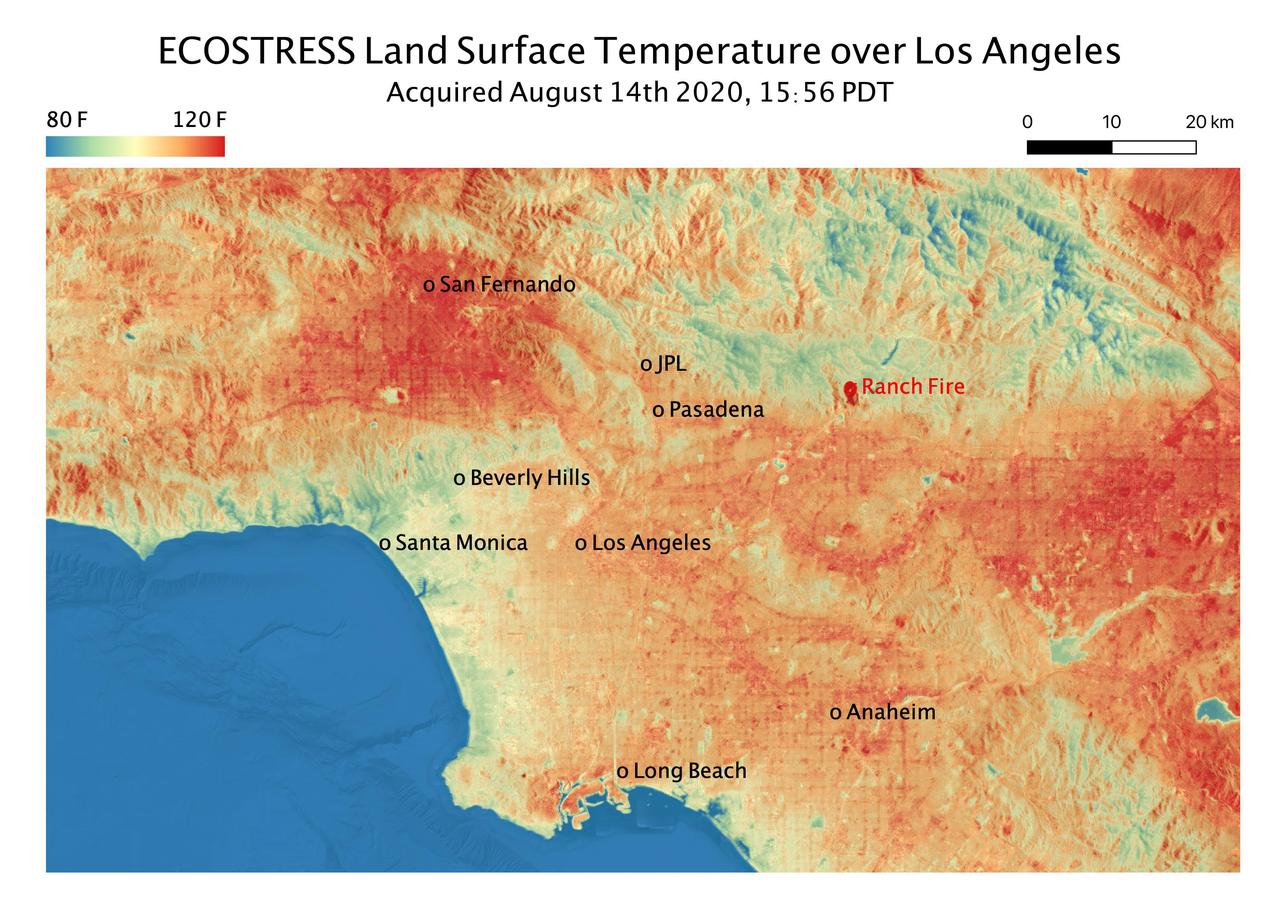
This temperature map shows the land surface temperatures throughout Los Angeles County on Aug. 14, 2020. The observation was made possible by NASA's Ecosystem Spaceborne Thermal Radiometer Experiment on Space Station (ECOSTRESS), which measured a peak land surface temperature in the San Fernando Valley, northwest of downtown Los Angeles, of 128.3 degrees Fahrenheit (53.5 degrees Celsius). ECOSTRESS collected this data as the space station passed over California at about 3:56 p.m. PDT (6:56 p.m. EDT) during a record-breaking heat wave that gripped the region. The Ranch fire, that burned near the city of Azuza was also detected by ECOSTRESS. With a resolution of about 77 by 77 yards (70 by 70 meters), the image enables the study of surface-temperature conditions down to the size of a football field. The hottest temperatures are shown in dark red, with the coolest temperatures in blue. ECOSTRESS measures the temperature of plants as they heat up when they run out of water. But it can also measure and track heat-related phenomena like heat waves, fires, and volcanoes. https://photojournal.jpl.nasa.gov/catalog/PIA23786
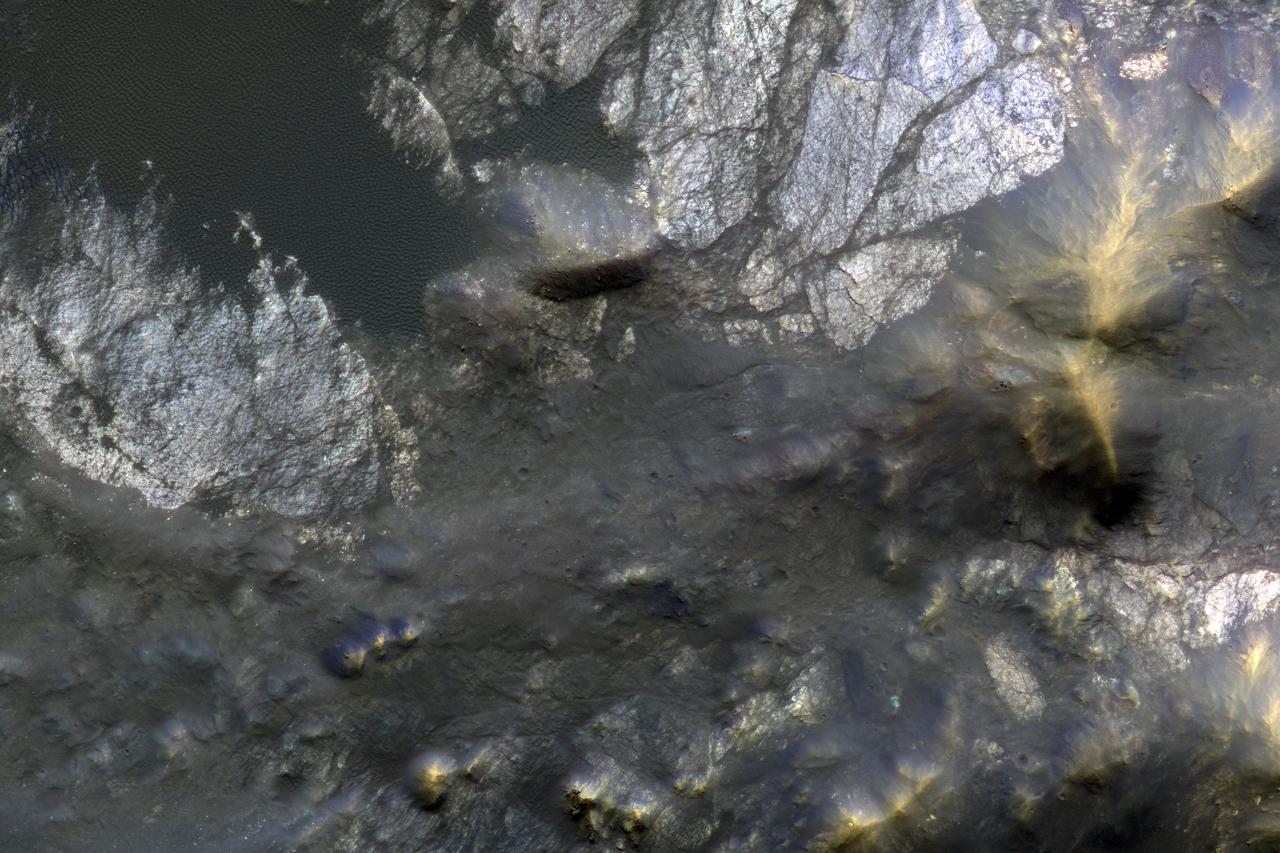
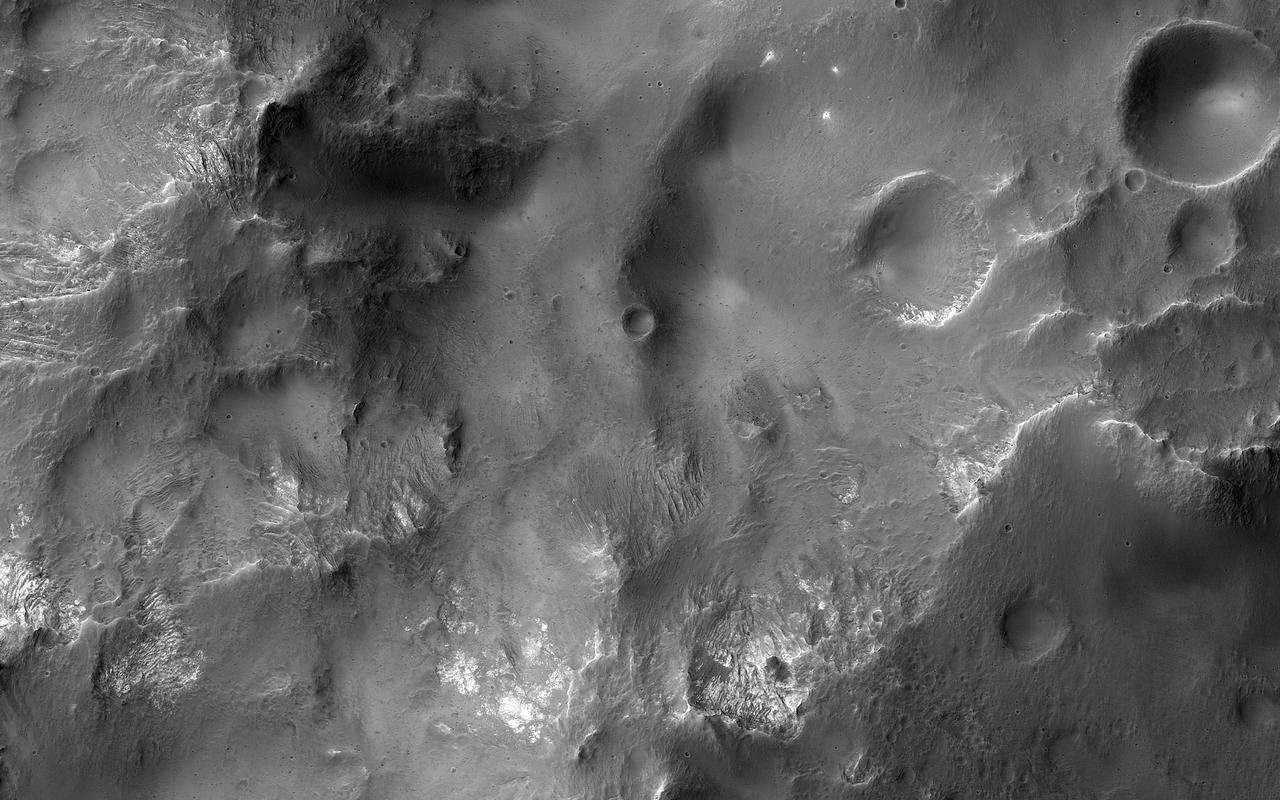
Roadside bedrock outcrops are all too familiar for many who have taken a long road trip through mountainous areas on Earth. Martian craters provide what tectonic mountain building and man's TNT cannot: crater-exposed bedrock outcrops. Although crater and valley walls offer us roadside-like outcrops from just below the Martian surface, their geometry is not always conducive to orbital views. On the other hand, a crater central peak -- a collection of mountainous rocks that have been brought up from depth, but also rotated and jumbled during the cratering process -- produce some of the most spectacular views of bedrock from orbit. This color composite cutout shows an example of such bedrock that may originate from as deep as 2 miles beneath the surface. The bedrock at this scale is does not appear to be layered or made up of grains, but has a massive appearance riddled with cross-cutting fractures, some of which have been filled by dark materials and rock fragments (impact melt and breccias) generated by the impact event. A close inspection of the image shows that these light-toned bedrock blocks are partially to fully covered by sand dunes and coated with impact melt bearing breccia flows. http://photojournal.jpl.nasa.gov/catalog/PIA12291
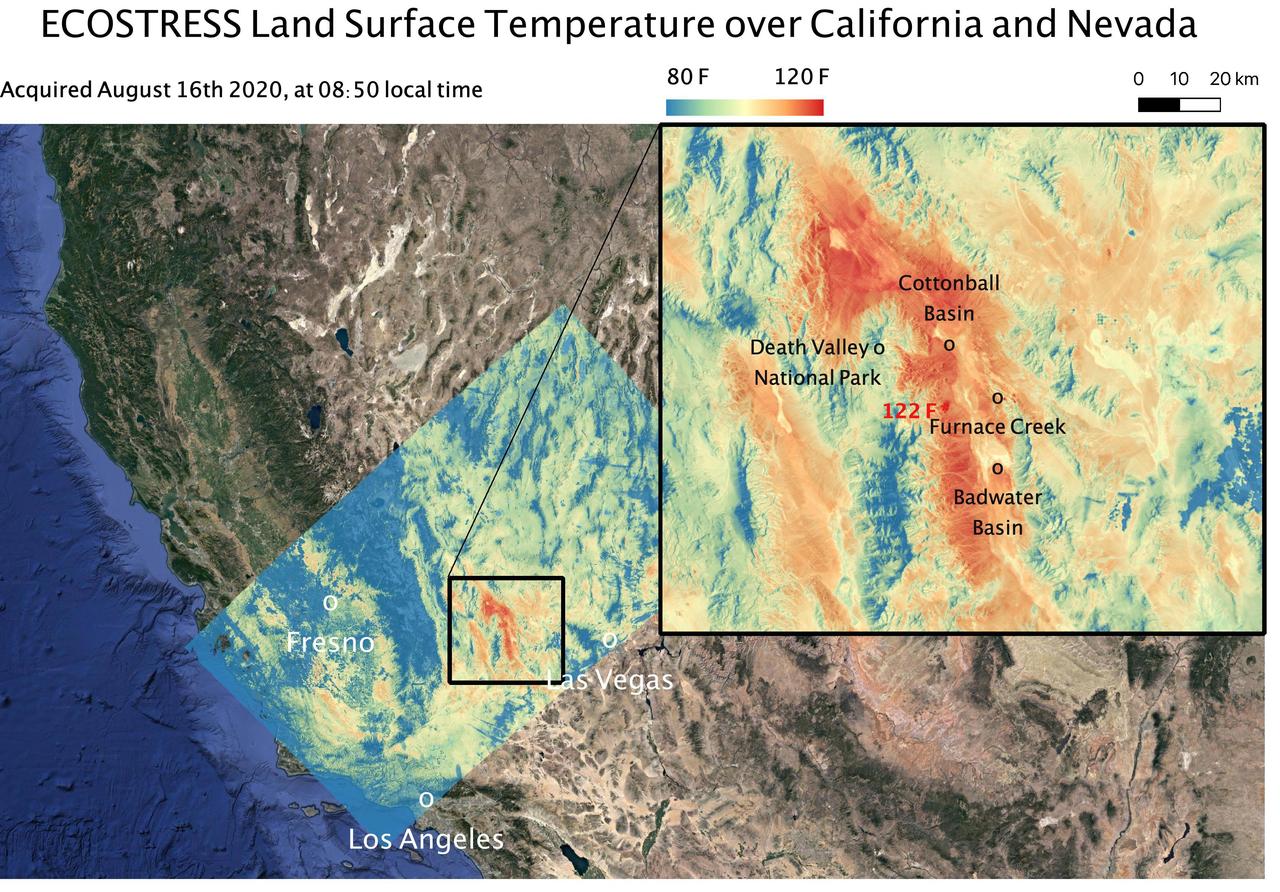
This temperature map shows the land surface temperatures around Death Valley in California's Mojave Desert on Aug. 16, 2020. The observation was made possible by NASA's Ecosystem Spaceborne Thermal Radiometer Experiment on Space Station (ECOSTRESS), which measured a peak land surface temperature of 122.52 degrees Fahrenheit (50.29 degrees Celsius) near Furnace Creek. ECOSTRESS collected this data when the space station passed over California at about 8:50 a.m. PDT (11:50 a.m. EDT) during a record-breaking heat wave that gripped the region. With a resolution of about 77 by 77 yards (70 by 70 meters), the image enables the study of surface-temperature conditions down to the size of a football field. The hottest temperatures are shown in dark red, with the coolest temperatures in blue. ECOSTRESS measures the temperature of plants as they heat up when they run out of water. But it can also measure and track heat-related phenomena like heat waves, fires, and volcanoes. https://photojournal.jpl.nasa.gov/catalog/PIA23787
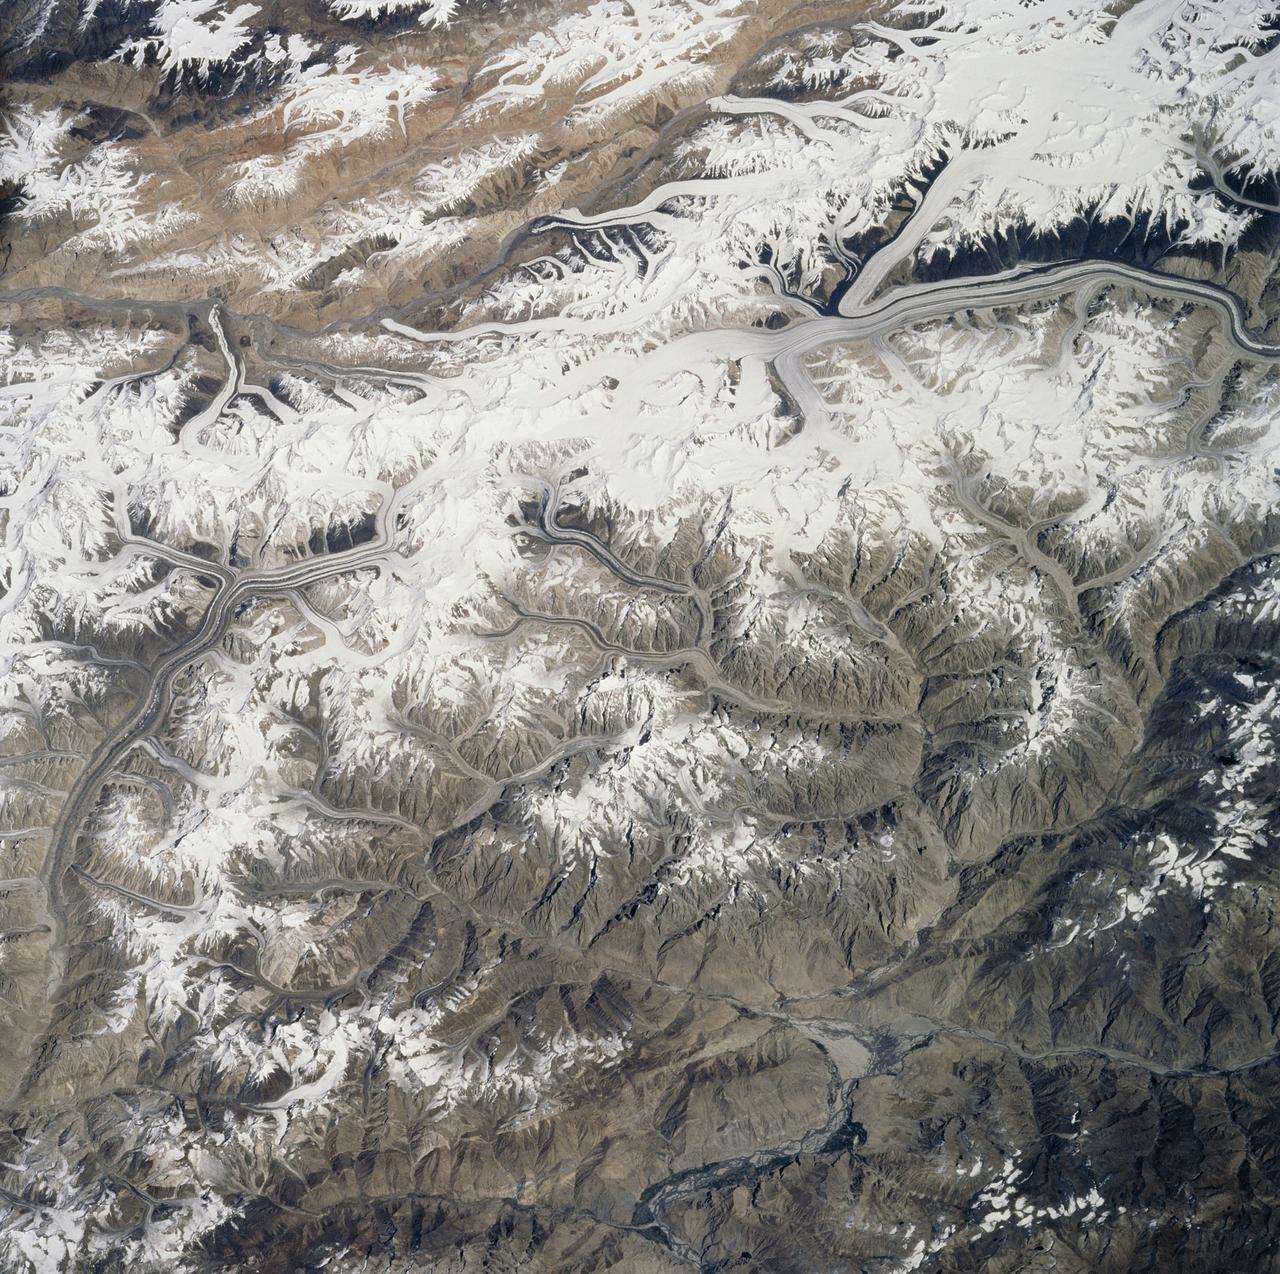
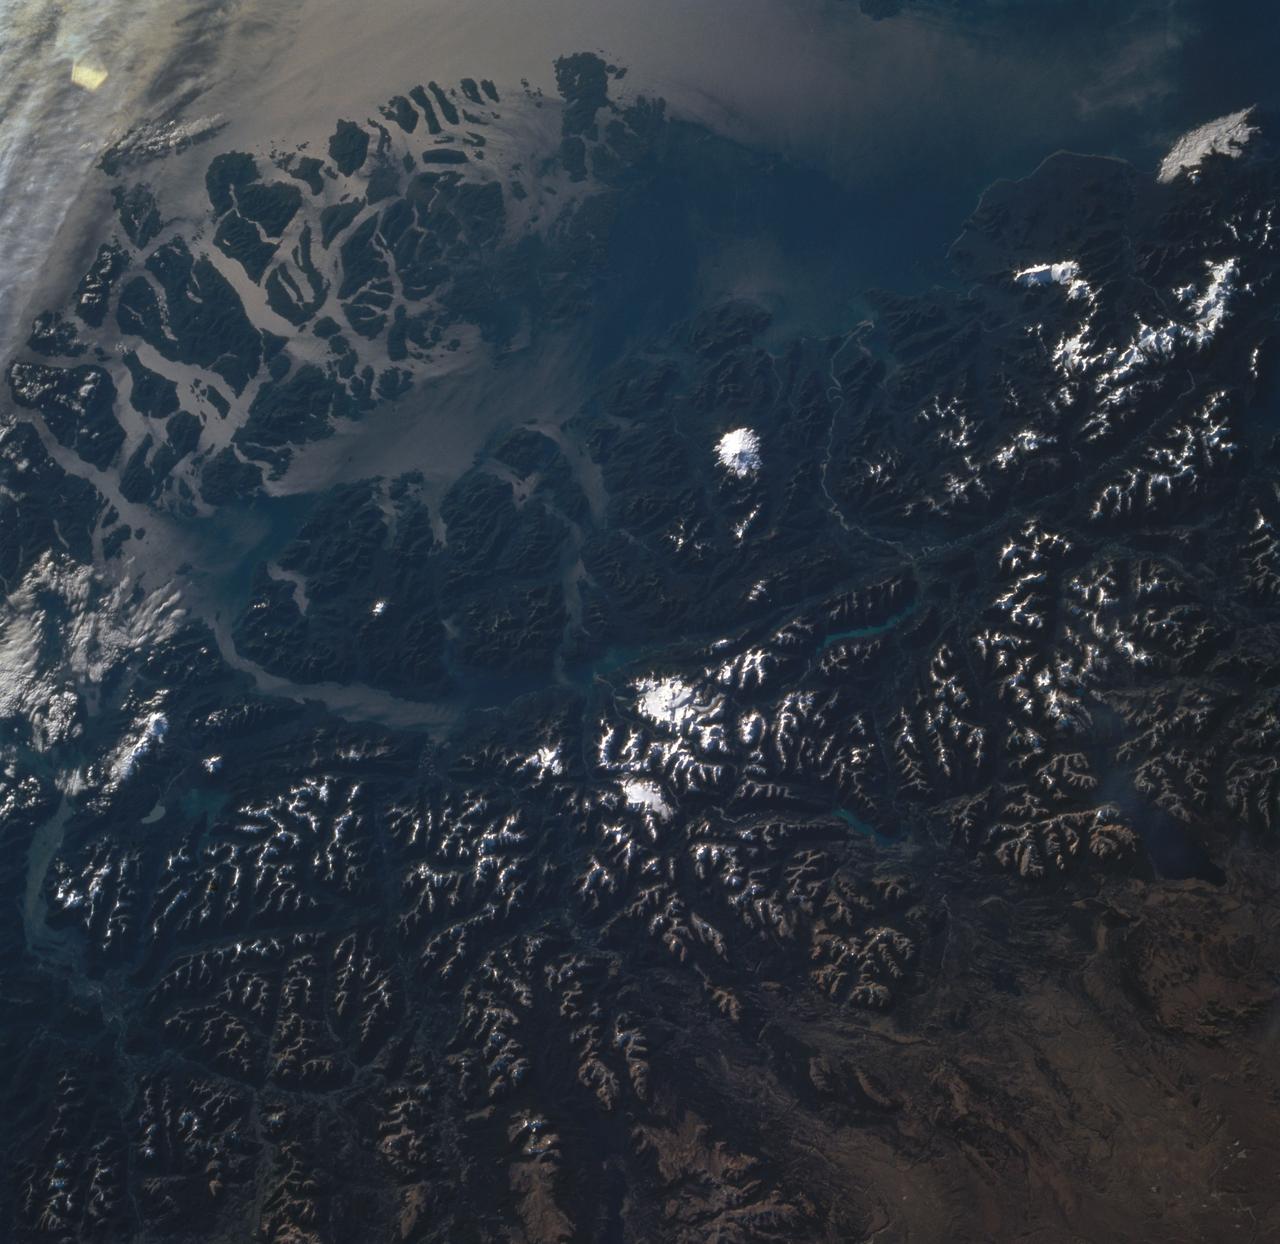
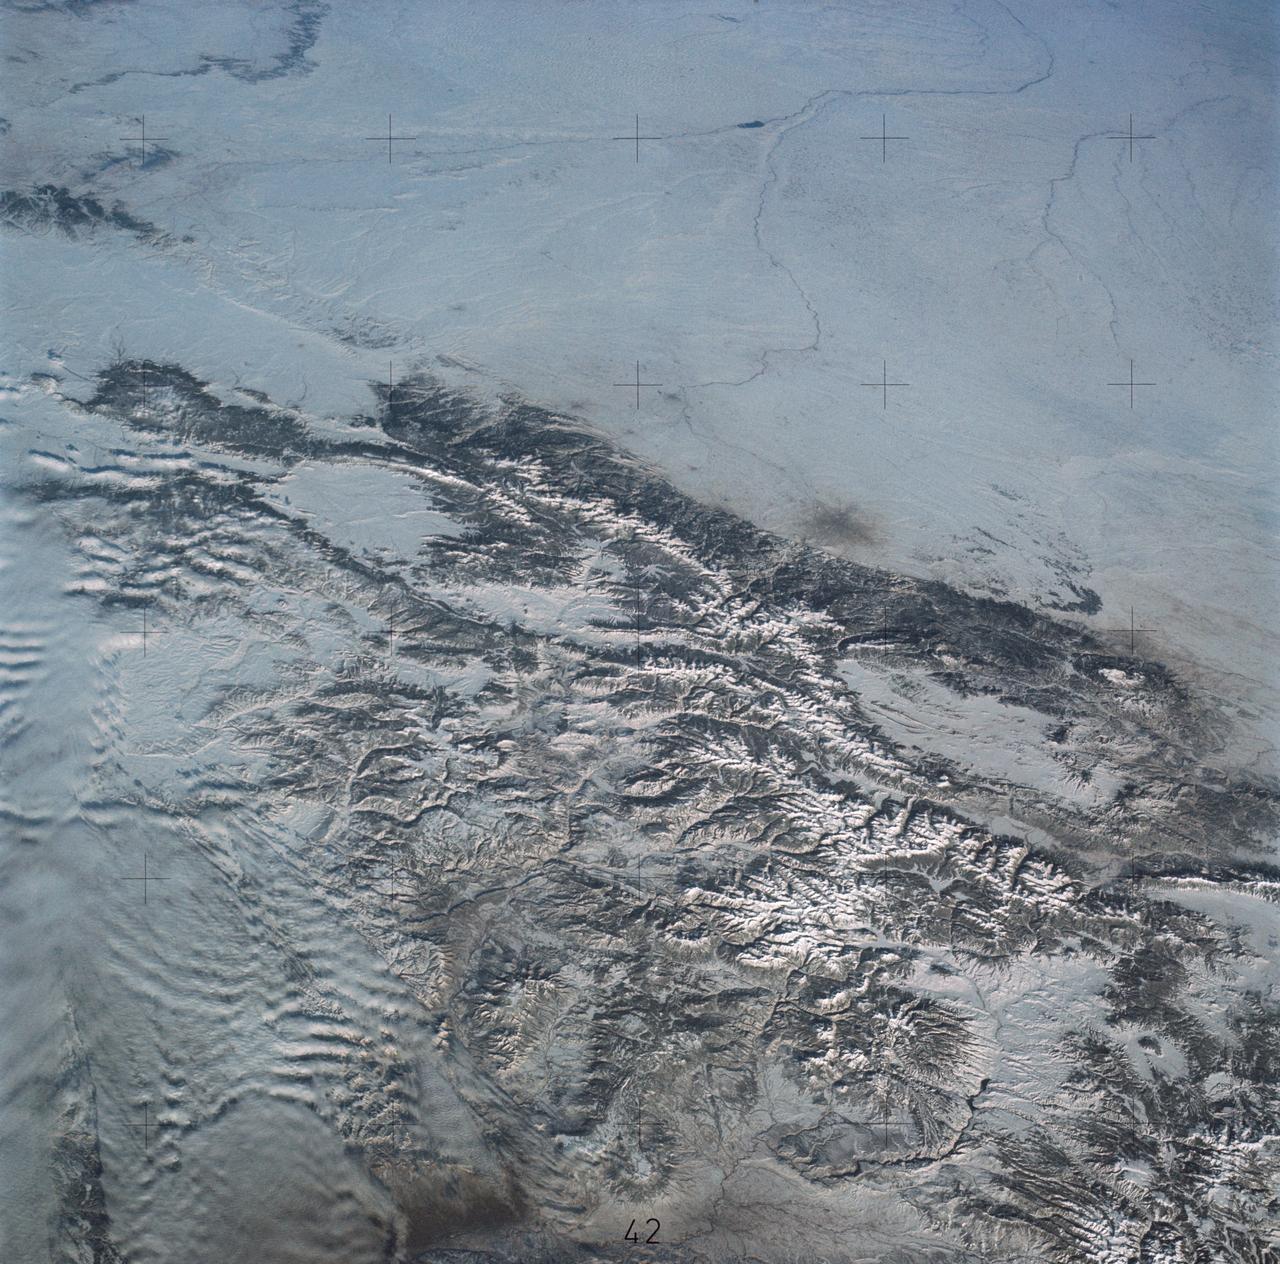
STS106-705-009 (8-20 September 2000) --- One of the STS-106 crew members on board the Space Shuttle Atlantis used a handheld 70mm camera to photograph this image of Qogir Feng (8,611 meters), which appears at the far upper left in this view of the northwestern Karakoram Range. Also called K2 or Mt. Godwin Austen, the mountain is the second highest peak in the world. The Tarim sedimentary basin borders the range on the north and the Lesser Himalayas on the south. Melt waters from vast glaciers, such as those south and east of K2, feed agriculture in the valleys (dark green) and contribute significantly to the regional fresh-water supply. The Karakoram Range lies along the southern edge of the Eurasian tectonic plate and is made up of ancient sedimentary rocks (more than 390 million years old, according to geologists studying the shuttle imagery). Those strata were folded and thrust-faulted, and granite masses were intruded, say the geologists, when the Indo-Pakistan plate collided with Eurasia, beginning more than 100 million years ago.

ISS031-E-116058 (13 June 2012) --- Polar mesospheric clouds in the Northern Hemisphere are featured in this image photographed by an Expedition 31 crew member on the International Space Station. In both the Northern and Southern Hemisphere, during their respective late spring and early summer seasons, polar mesospheric clouds are at the peak of their visibility. Visible from the ground during twilight, aircraft in flight, and the International Space Station, they typically appear as delicate shining threads against the darkness of space?hence their other name of noctilucent or ?night-shining? clouds. On the same day this image was taken from the space station while it was passing over the night-darkened Tibetan Plateau, polar mesospheric clouds were also visible to aircraft flying above Canada. In addition to this still image, the space station crew took a time-lapse image sequence of polar mesospheric clouds several days earlier (June 5, 2012) while passing over western Asia; this is first such sequence of images of the phenomena taken from orbit. Polar mesospheric clouds form between 76-85 kilometers above the Earth?s surface, when there is sufficient water vapor at these high altitudes to freeze into ice crystals. The clouds are illuminated by the setting sun while the ground surface below is in darkness, lending them their night-shining properties. In addition to the illuminated tracery of polar mesospheric clouds trending across the center of the image, lower layers of the atmosphere are also illuminated; the lowest layer of the atmosphere, the stratosphere, is indicated by dim orange and red tones. While the exact cause of formation of polar mesospheric clouds is still debated?dust from meteors, global warming, and rocket exhaust have all been suggested as contributing factors?recent research suggests that changes in atmospheric gas composition or temperature has caused the clouds to become brighter over time.
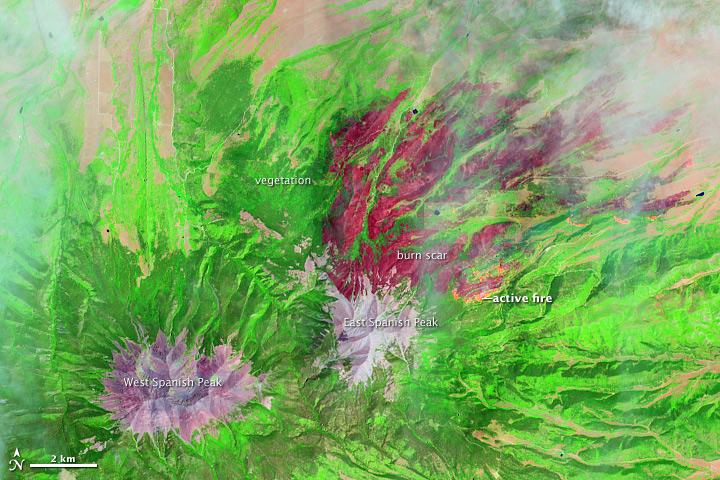
On June 22, 2013, the Operational Land Imager (OLI) on Landsat 8 captured this false-color image of the East Peak fire burning in southern Colorado near Trinidad. Burned areas appear dark red, while actively burning areas look orange. Dark green areas are forests; light green areas are grasslands. Lightning ignited the blaze on June 19, 2013. By June 25, it had burned nearly 13,500 acres (5,500 hectares). NASA Earth Observatory image by Jesse Allen and Robert Simmon, using Landsat data from the U.S. Geological Survey. Caption by Adam Voiland. Instrument: Landsat 8 - OLI More images from this event: <a href="http://1.usa.gov/14DesQC" rel="nofollow">1.usa.gov/14DesQC</a> Credit: <b><a href="http://www.earthobservatory.nasa.gov/" rel="nofollow"> NASA Earth Observatory</a></b> <b><a href="http://www.nasa.gov/audience/formedia/features/MP_Photo_Guidelines.html" rel="nofollow">NASA image use policy.</a></b> <b><a href="http://www.nasa.gov/centers/goddard/home/index.html" rel="nofollow">NASA Goddard Space Flight Center</a></b> enables NASA’s mission through four scientific endeavors: Earth Science, Heliophysics, Solar System Exploration, and Astrophysics. Goddard plays a leading role in NASA’s accomplishments by contributing compelling scientific knowledge to advance the Agency’s mission. <b>Follow us on <a href="http://twitter.com/NASA_GoddardPix" rel="nofollow">Twitter</a></b> <b>Like us on <a href="http://www.facebook.com/pages/Greenbelt-MD/NASA-Goddard/395013845897?ref=tsd" rel="nofollow">Facebook</a></b> <b>Find us on <a href="http://instagram.com/nasagoddard?vm=grid" rel="nofollow">Instagram</a></b>
On June 22, 2013, the Operational Land Imager (OLI) on Landsat 8 captured this false-color image of the East Peak fire burning in southern Colorado near Trinidad. Burned areas appear dark red, while actively burning areas look orange. Dark green areas are forests; light green areas are grasslands. Lightning ignited the blaze on June 19, 2013. By June 25, it had burned nearly 13,500 acres (5,500 hectares). NASA Earth Observatory image by Jesse Allen and Robert Simmon, using Landsat data from the U.S. Geological Survey. Caption by Adam Voiland. Instrument: Landsat 8 - OLI More images from this event: <a href="http://1.usa.gov/14DesQC" rel="nofollow">1.usa.gov/14DesQC</a> Credit: <b><a href="http://www.earthobservatory.nasa.gov/" rel="nofollow"> NASA Earth Observatory</a></b> <b><a href="http://www.nasa.gov/audience/formedia/features/MP_Photo_Guidelines.html" rel="nofollow">NASA image use policy.</a></b> <b><a href="http://www.nasa.gov/centers/goddard/home/index.html" rel="nofollow">NASA Goddard Space Flight Center</a></b> enables NASA’s mission through four scientific endeavors: Earth Science, Heliophysics, Solar System Exploration, and Astrophysics. Goddard plays a leading role in NASA’s accomplishments by contributing compelling scientific knowledge to advance the Agency’s mission. <b>Follow us on <a href="http://twitter.com/NASA_GoddardPix" rel="nofollow">Twitter</a></b> <b>Like us on <a href="http://www.facebook.com/pages/Greenbelt-MD/NASA-Goddard/395013845897?ref=tsd" rel="nofollow">Facebook</a></b> <b>Find us on <a href="http://instagram.com/nasagoddard?vm=grid" rel="nofollow">Instagram</a></b>
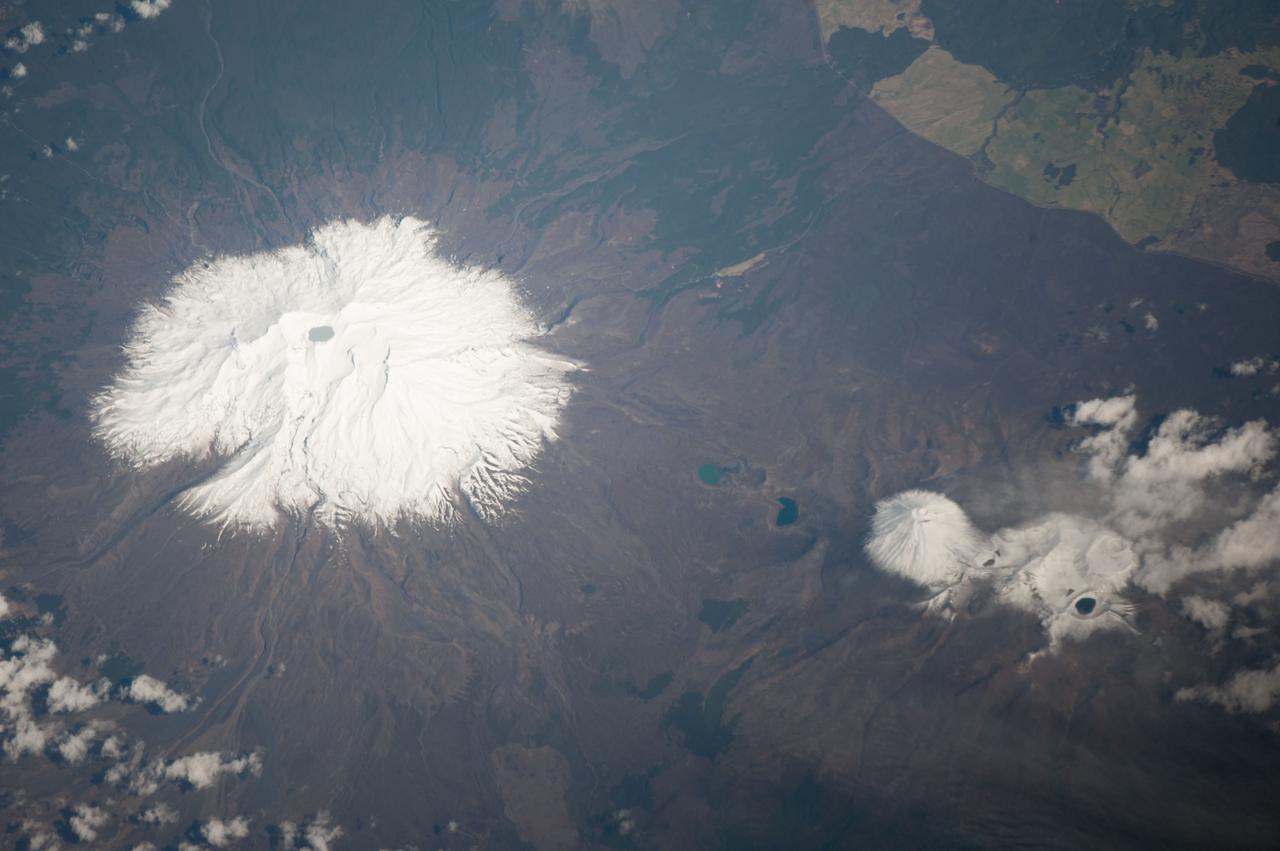
ISS037-E-005089 (30 Sept. 2013) --- Ruapehu volcano and Tongariro volcanic complex in New Zealand are featured in this image photographed by an Expedition 37 crew member on the International Space Station. Mount Ruapehu is one of several volcanic centers on the North Island of New Zealand, but is the largest and historically most active. The 2,797-meter elevation volcano is also the highest mountain on North Island and is covered with snow on its upper slopes. Scientists believe while there are three summit craters that have been active during the last 10,000 years, South Crater is the only historically active one. This vent is currently filled with a lake (Crater Lake), visible at left; eruptions from the vent, mixed with water from the lake can lead to the formation of lahars – destructive gravity flows of mixed fluid and volcanic debris that form a hazard to ski areas on the upper slopes and lower river valleys. The most recent significant eruption of Ruapehu took place in 2007 and formed both an eruption plume and lahars. The volcano is surrounded by a 100-cubic-kilometer ring plain of volcaniclastic debris that appears dark grey in the image, whereas vegetated areas appear light to dark green. Located to the northeast of the Ruapehu volcanic structure, the Tongariro volcanic complex (lower right) is currently in an active eruptive phase – the previous eruptive phase ended in 1897. Explosive eruptions occurred in 2012, which have been followed by steam and gas plumes observed almost daily. According to scientists, the volcanic complex contains multiple cones constructed over the past 275,000 years. The most prominent of these, Mount Ngauruhoe, last erupted in 1975. Like Ruapehu, the upper slopes of both Ngauruhoe and the upper peaks of Tongariro are snow-covered. Scattered cloud cover is also visible near Tongariro at lower right.

This is a Hubble Space Telescope composite image of a supernova explosion designated SN 2014J in the galaxy M82. At a distance of approximately 11.5 million light-years from Earth it is the closest supernova of its type discovered in the past few decades. The explosion is categorized as a Type Ia supernova, which is theorized to be triggered in binary systems consisting of a white dwarf and another star — which could be a second white dwarf, a star like our sun, or a giant star. Astronomers using a ground-based telescope discovered the explosion on January 21, 2014. This Hubble photograph was taken on January 31, as the supernova approached its peak brightness. The Hubble data are expected to help astronomers refine distance measurements to Type Ia supernovae. In addition, the observations could yield insights into what kind of stars were involved in the explosion. Hubble’s ultraviolet-light sensitivity will allow astronomers to probe the environment around the site of the supernova explosion and in the interstellar medium of the host galaxy. Because of their consistent peak brightness, Type Ia supernovae are among the best tools to measure distances in the universe. They were fundamental to the 1998 discovery of the mysterious acceleration of the expanding universe. A hypothesized repulsive force, called dark energy, is thought to cause the acceleration. Among the other major NASA space-based observatories used in the M82 viewing campaign are Spitzer Space Telescope, Chandra X-ray Observatory, Nuclear Spectroscopic Telescope Array (NuSTAR), Fermi Gamma-ray Space Telescope, Swift Gamma Ray Burst Explorer, and the Stratospheric Observatory for Infrared Astronomy (SOFIA). Image Credit: NASA, ESA, A. Goobar (Stockholm University), and the Hubble Heritage Team (STScI/AURA) <b><a href="http://www.nasa.gov/audience/formedia/features/MP_Photo_Guidelines.html" rel="nofollow">NASA image use policy.</a></b> <b><a href="http://www.nasa.gov/centers/goddard/home/index.html" rel="nofollow">NASA Goddard Space Flight Center</a></b> enables NASA’s mission through four scientific endeavors: Earth Science, Heliophysics, Solar System Exploration, and Astrophysics. Goddard plays a leading role in NASA’s accomplishments by contributing compelling scientific knowledge to advance the Agency’s mission. <b>Follow us on <a href="http://twitter.com/NASAGoddardPix" rel="nofollow">Twitter</a></b> <b>Like us on <a href="http://www.facebook.com/pages/Greenbelt-MD/NASA-Goddard/395013845897?ref=tsd" rel="nofollow">Facebook</a></b> <b>Find us on <a href="http://instagram.com/nasagoddard?vm=grid" rel="nofollow">Instagram</a></b>
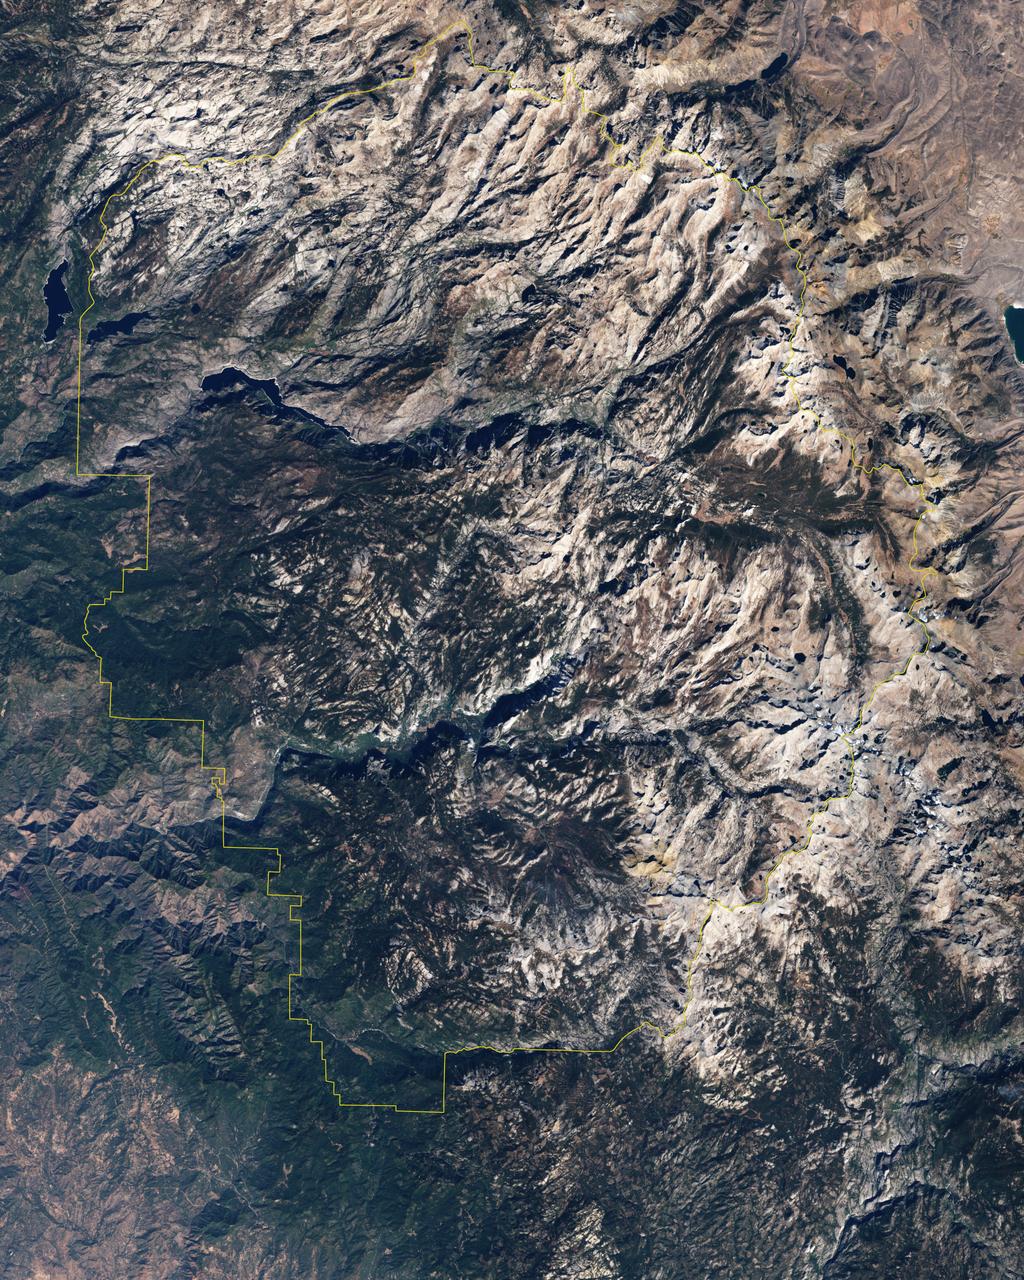
Naked summits alternate with forested lowlands in Yosemite Valley, part of California’s Yosemite National Park. During the Pleistocene Ice Age, glaciers sculpted the underlying rocks in this region, leaving behind canyons, waterfalls, rugged peaks, and granite domes. As the ice retreated, forests grew, but forests only extend as high as 2,900 meters (9,500 feet) above sea level. Above the tree line are rocky landscapes with sparse alpine vegetation. So from the sky, Yosemite Valley appears as a light-and-dark patchwork of forest, rock, and shadow. The Enhanced Thematic Mapper Plus on NASA’s Landsat 7 satellite captured this true-color image of part of Yosemite Valley on August 18, 2001. The valley runs roughly east-west, and tall granite peaks lining the valley’s southern side cast long shadows across the valley floor. On the valley’s northern side, steep slopes appear almost white. Along the valley floor, roadways form narrow, meandering lines of off-white, past parking lots, buildings, and meadows. On the north side of Yosemite Valley is El Capitan. Shooting straight up more than 915 meters (3,000 feet) above the valley floor, El Capitan is considered the largest granite monolith in the world. This granite monolith sits across the valley from Bridalveil Fall, one of the valley’s most prominent waterfalls. Read more: <a href="http://go.nasa.gov/2bzGo3d" rel="nofollow">go.nasa.gov/2bzGo3d</a> Credit: NASA/Landsat7 <b><a href="http://www.nasa.gov/audience/formedia/features/MP_Photo_Guidelines.html" rel="nofollow">NASA image use policy.</a></b> <b><a href="http://www.nasa.gov/centers/goddard/home/index.html" rel="nofollow">NASA Goddard Space Flight Center</a></b> enables NASA’s mission through four scientific endeavors: Earth Science, Heliophysics, Solar System Exploration, and Astrophysics. Goddard plays a leading role in NASA’s accomplishments by contributing compelling scientific knowledge to advance the Agency’s mission. <b>Follow us on <a href="http://twitter.com/NASAGoddardPix" rel="nofollow">Twitter</a></b> <b>Like us on <a href="http://www.facebook.com/pages/Greenbelt-MD/NASA-Goddard/395013845897?ref=tsd" rel="nofollow">Facebook</a></b> <b>Find us on <a href="http://instagrid.me/nasagoddard/?vm=grid" rel="nofollow">Instagram</a></b>

ISS032-E-024687 (3 Sept. 2012) --- Idaho fires are featured in this image photographed by an Expedition 32 crew member on the International Space Station. Taken with a short lens (45 mm), this west-looking photograph has a field of view covering much of the forested region of central Idaho. The dark areas are all wooded mountains—the Salmon River Mountains (left), Bitterroot Mountains (lower right) and Clearwater Mountains (right). All three areas experienced wildfires in September 2012—this image illustrates the situation early in the month. Smaller fire ‘complexes” appear as tendrils of smoke near the sources (e.g. Halstead complex at left), and as major white smoke plumes from the Mustang fire complex in the densest forests (darkest green, center) of the Clearwater Mountains. This was the largest plume noted in the region with thick smoke blowing eastward over the Beaverhead Mountains at bottom. The linear shape of the smoke plumes gives a sense of the generally eastward smoke transport on this day in early September. The smoke distribution shows another kind of transport: at night, when winds are weak, cooling of the atmosphere near the ground causes drainage of cooled (denser) air down into the major valleys. Here the smoke can be seen flowing west down into the narrow Salmon and Lochsa River valleys (at a local time of 12:18:50 p.m.) – in the opposite direction to the higher winds and the thick smoke masses. The bright yellow-tan areas at top left and top right contrasting with the mountains are grasslands of the Snake River in southern Idaho around Boise, and the Palouse region in western Idaho–SE Washington state. This latter area is known to ecologists as the Palouse Grasslands Ecoregion. Light green areas visible in the center of many of the valleys are agricultural crops including barley, alfalfa, and wheat. The image also shows several firsts of which Idaho can boast. The Snake River between Boise and the Palouse region has cut Hells Canyon (top), the deepest gorge in the U.S. at almost 2,436 meters (8,000 feet). The largest single wilderness area in the contiguous U.S., the Frank Church-River of No Return Wilderness occupies the wooded zones of the Salmon River Mountains and the Clearwater Mountains, i.e. most of the area shown in the middle of the image. Idaho’s highest peak is Borah Peak (lower left) at 3,860 meters above sea level (12,662 feet ASL). The Continental Divide cuts through the bottom of the image—rivers on the eastern slopes of the Beaverhead Mountains drain to the Atlantic Ocean, whereas rivers in the rest of the area drain to the Pacific Ocean.
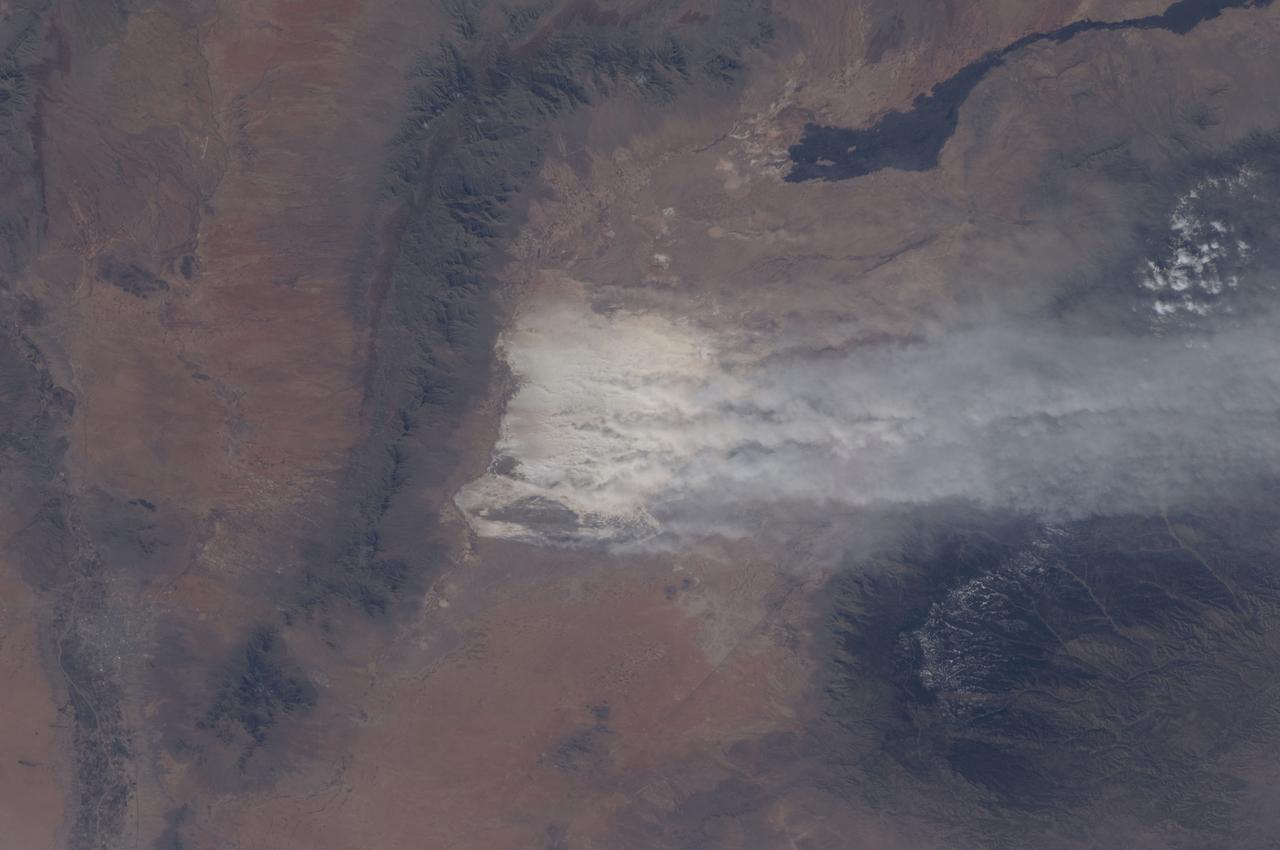
ISS030-E-174652 (28 Feb. 2012) --- A dust storm near the White Sands National Monument, New Mexico, USA is featured in this image photographed by an Expedition 30 crew member on the International Space Station. Driven by winter winds from the southwest, white dust from the White Sands dune field (center) in New Mexico rises thousands of feet from the valley floor, up and over the snowy peaks of the Sacramento Mts. downwind (right). White Sands National Monument lies in the 50 kilometers-wide Tularosa valley, between the dark rocks and forested slopes of the Sacramento Mts. and the San Andres Mts. (left center). The lower and warmer ridge line of the San Andres was without snow on this day. The striking black lava flows of the Carrizozo lava field also occupy the valley floor (top right). The darker tones of agriculture in the Rio Grande floodplain can be seen along the left margin of the image. The length of the dust plumes in this photograph is more than 120 kilometers. The vigor of the winds on this day can be judged also from the fact that they are lifting the dust particles from the valley floor more than 1,200 meters over the mountains. Winds channel the dust through a low point on the Sacramento Mts., some 800 meters below the ridge crests to north and south (right). The Moderate Resolution Imaging Spectroradiometer (MODIS) on the NASA Aqua satellite also captured a wider regional view of the extent of the plumes on the same day. In most parts of the world blowing dust is some shade of light brown or red. It is interesting to observe two colors of dust that contribute to this dust plume: redder dust from the local hillsides north of White Sands (seen by the small brown zone along the northern margin of the dust mass), and the white dust from the dune field. The sand dunes of the Monument are white since they are composed of the mineral gypsum, a relatively rare dune-forming mineral. The gypsum is deposited during evaporation of mineral-rich waters in an ephemeral lake located in the western part of the Monument. Erosion of the deposits, together with wind transport, provides the granular material for the dunes. The dunes? brilliance, especially contrasted against the nearby dark mountain slopes, makes the dunes easily identifiable at great distances by orbiting astronauts. The white speck of the dunes is even visible in images taken looking back at Earth by crews on the way to the moon.
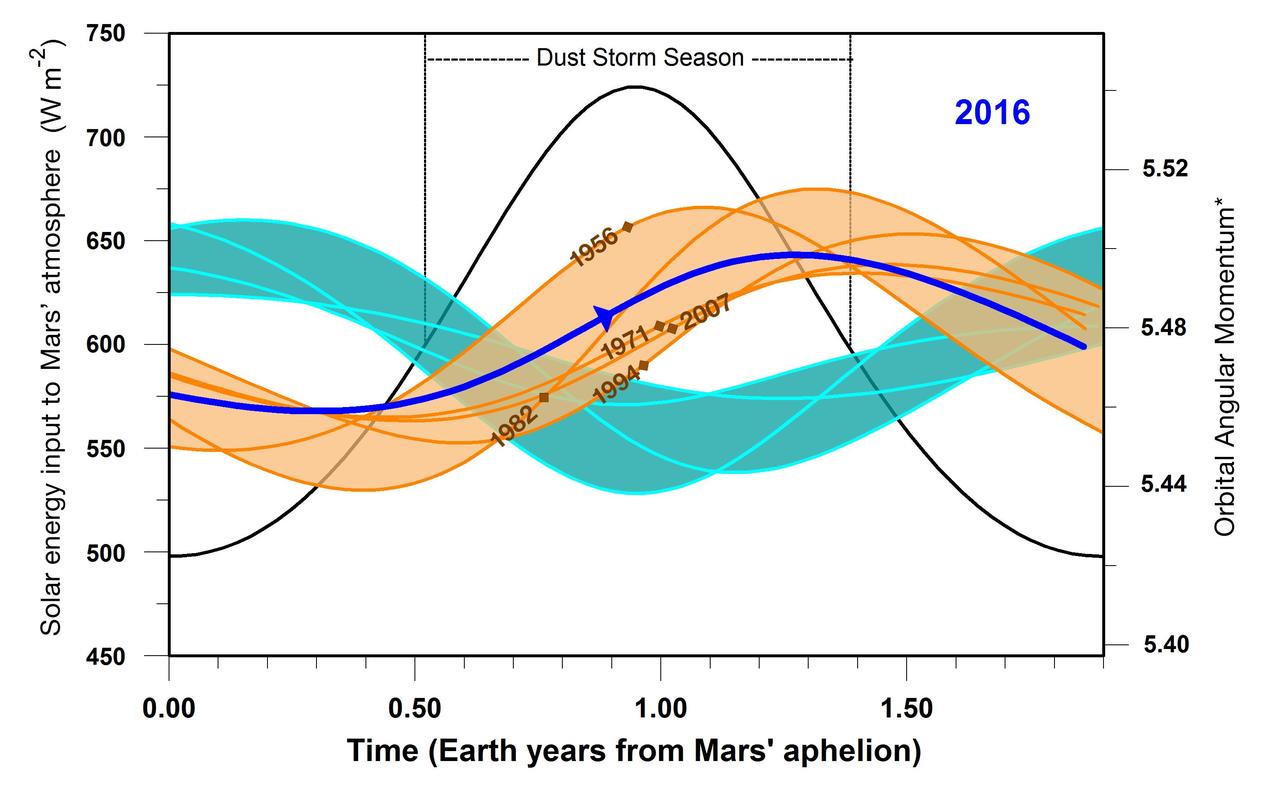
This graphic indicates a similarity between 2016 (dark blue line) and five past years in which Mars has experienced a global dust storm (orange lines and band), compared to years with no global dust storm (blue-green lines and band). The arrow nearly midway across in the dark blue line indicates the Mars time of year in late September 2016. A key factor in the graph is the orbital angular momentum of Mars, which would be steady in a system of only one planet orbiting the sun, but varies due to relatively small effects of having other planets in the solar system. The horizontal scale is time of year on Mars, starting at left with the planet's farthest distance from the sun in each orbit. This point in the Mars year, called "Mars aphelion," corresponds to late autumn in the southern hemisphere. Numeric values on the horizontal axis are in Earth years; each Mars year lasts for about 1.9 Earth years. The vertical scale bar at left applies only to the black-line curve on the graph. The amount of solar energy entering Mars' atmosphere (in watts per square meter) peaks at the time of year when Mars is closest to the sun, corresponding to late spring in the southern hemisphere. The duration of Mars' dust storm season, as indicated, brackets the time of maximum solar input to the atmosphere. The scale bar at right, for orbital angular momentum, applies to the blue, brown and blue-green curves on the graph. The values are based on mass, velocity and distance from the gravitational center of the solar system. Additional information on the units is in a 2015 paper in the journal Icarus, from which this graph is derived. The band shaded in orange is superimposed on the curves of angular momentum for five Mars years that were accompanied by global dust storms in 1956, 1971, 1982, 1994 and 2007. Brown diamond symbols on the curves for these years in indicate the times when the global storms began. The band shaded blue-green lies atop angular momentum curves for six years when no global dust storms occurred: 1939, 1975, 1988, 1998, 2000 and 2011. Note that in 2016, as in the pattern of curves for years with global dust storms, the start of the dust storm season corresponded to a period of increasing orbital angular momentum. In years with no global storm, angular momentum was declining at that point. Observations of whether dust from regional storms on Mars spreads globally in late 2016 or early 2017 will determine whether this correspondence holds up for the current Mars year. http://photojournal.jpl.nasa.gov/catalog/PIA20855
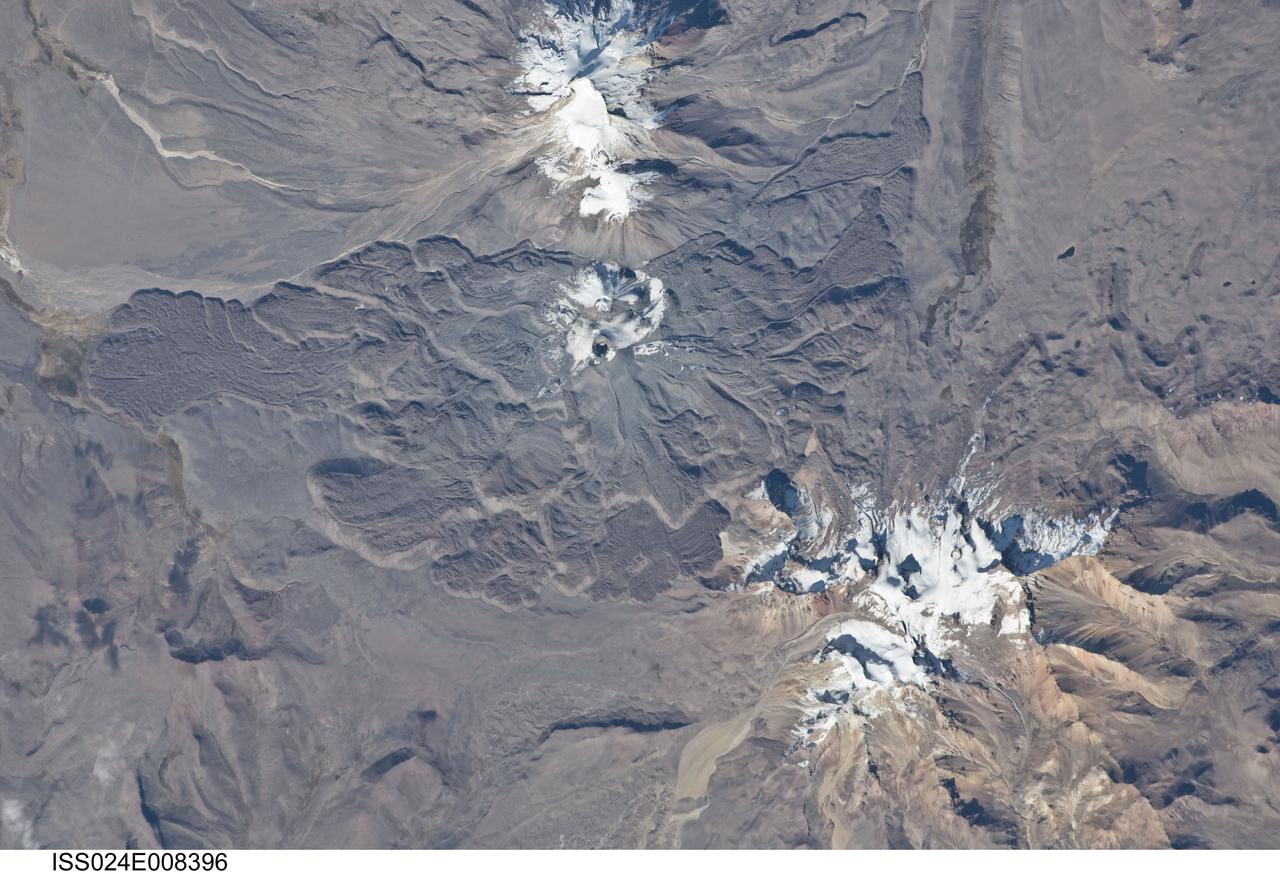
ISS024-E-008396 (15 July 2010) --- Sabancaya volcano in Peru is featured in this image photographed by an Expedition 24 crew member on the International Space Station. The 5,967-meter-high Sabancaya stratovolcano (or Nevado Sabancaya) is located in southern Peru approximately 70 kilometers to the northwest of the city of Arequipa. The name Sabancaya means ?tongue of fire? in the Quechua Indian language. Sabancaya is part of a volcanic complex that includes two other nearby (and older) volcanoes, neither of which has been active historically; in this detailed photograph, Nevado Ampato is visible to the south (top center) and the lower flanks of Nevado Hualca Hualca are visible to the north (bottom right). The snowy peaks of the three volcanoes provide a stark contrast to the surrounding desert of the Puna Plateau. Sabancaya?s first historical record of an eruption dates to 1750. The most recent eruptive activity at the volcano occurred in July 2003 and deposited ash on the volcano?s summit and northeastern flank. Volcanism at Sabancaya is fueled by magma generated at the subduction zone between the Nazca and South American tectonic plates. Magma can erupt to the surface and form lava flows through the volcano?s summit (frequently forming a crater) but can also erupt from lava domes and flank vents along the volcano?s sides. Lava has issued from all of these points at Sabancaya, forming numerous gray to dark brown lobate flows that extend in all directions except southwards (center).
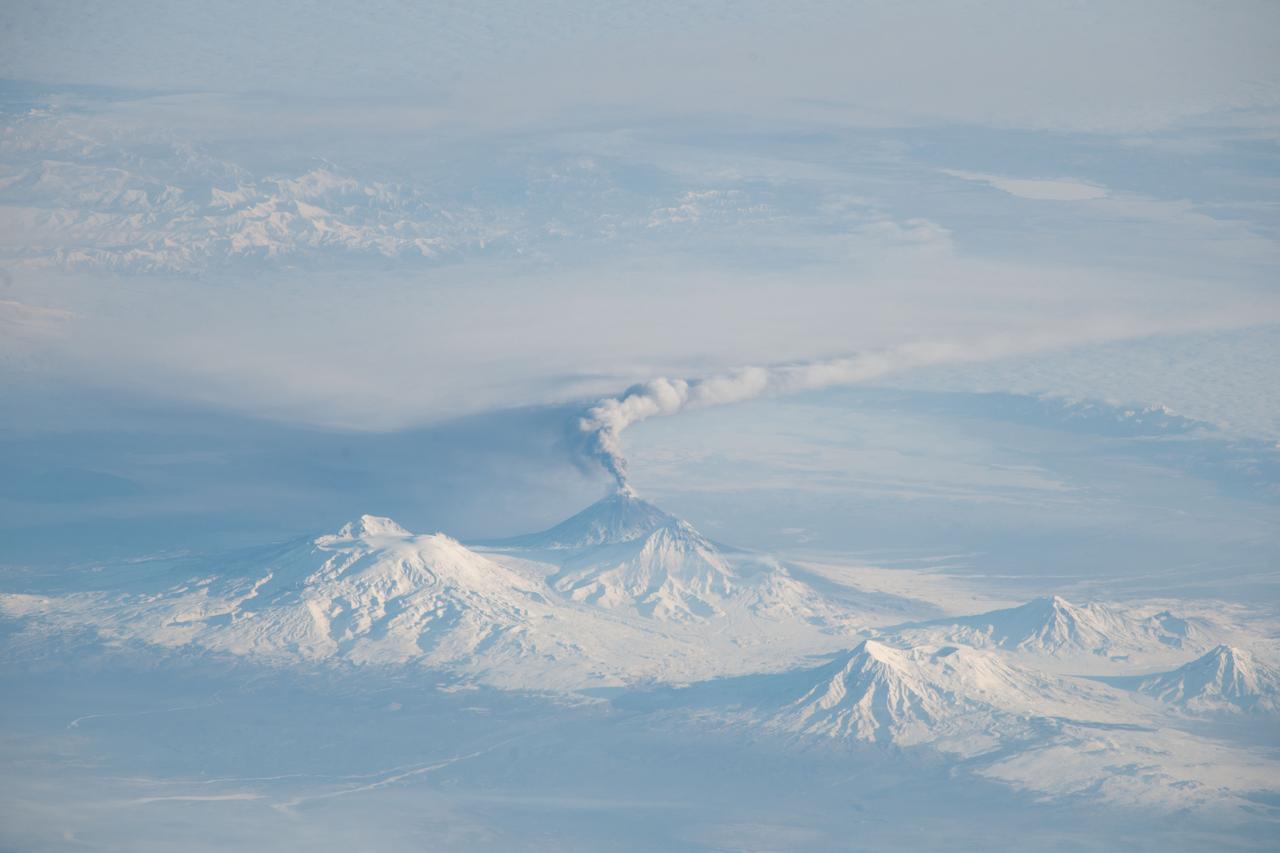
ISS038-E-005515 (16 Nov. 2013) --- Activity at Kliuchevskoi Volcano on Kamchatka Peninsula in the Russian Federation is featured in this image photographed by an Expedition 38 crew member on the International Space Station. When viewing conditions are favorable, crew members onboard the space station can take unusual and striking images of Earth. This photograph provides a view of an eruption plume emanating from Kliuchevskoi Volcano, one of the many active volcanoes on the Kamchatka Peninsula. Nadir views – looking “straight down”—that are typical of orbital satellite imagery tend to flatten the appearance of the landscape by reducing the sense of three dimensions of the topography. In contrast, this image was taken from the ISS with a very oblique viewing angle that gives a strong sense of three dimensions, which is accentuated by the shadows cast by the volcanic peaks. This resulted in a view similar to what a person might see from a low-altitude airplane. The image was taken when the space station was located over a ground position more than 1,500 kilometers to the southwest. The plume – likely a combination of steam, volcanic gases, and ash – is extended to the east-southeast by prevailing winds; the dark region to the north-northwest of the plume is likely a product of both shadow and ash settling out. Several other volcanoes are visible in the image, including Ushkovsky, Tolbachik, Zimina, and Udina. To the south-southwest of Kliuchevskoi lies Bezymianny Volcano which appears to be emitting a small steam plume (visible at center).
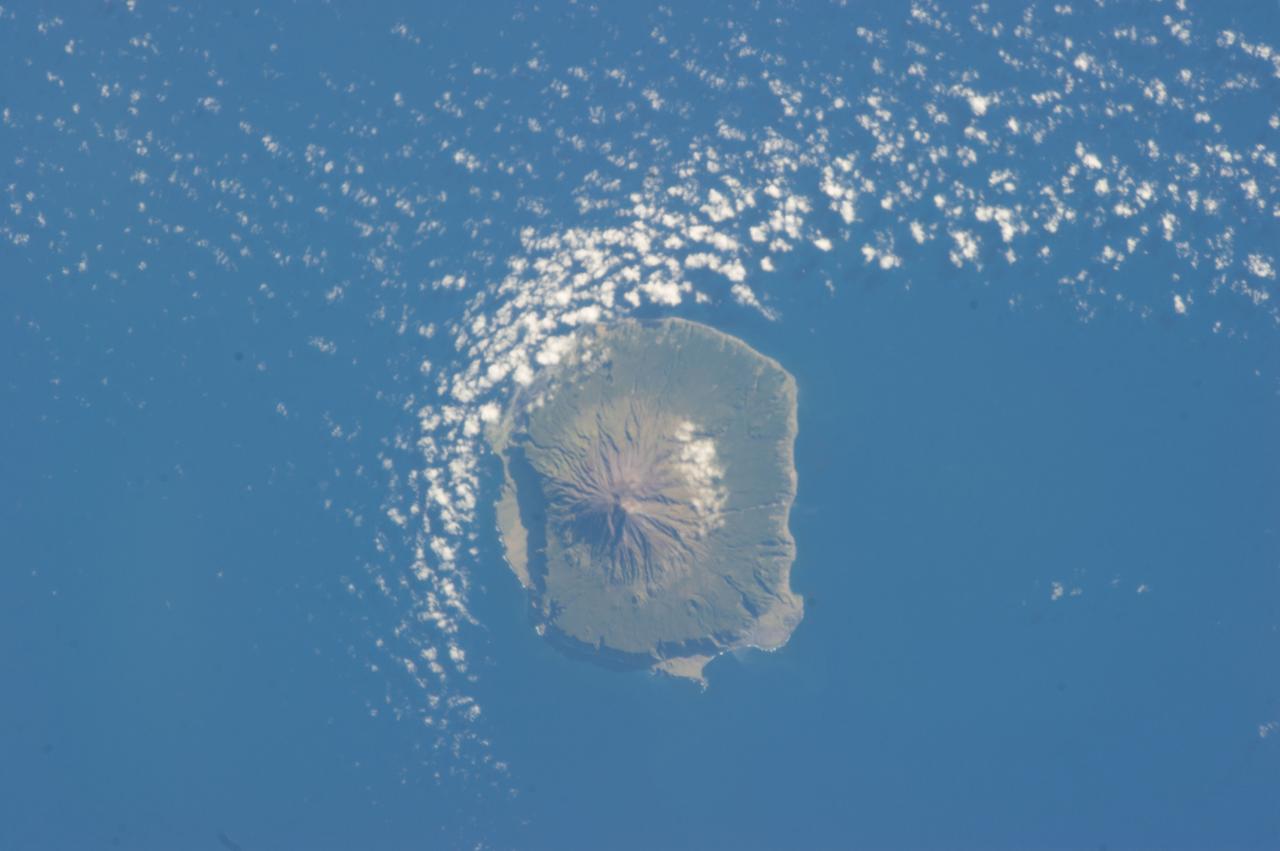
ISS034-E-041528 (6 Feb. 2013) --- Tristan da Cunha is featured in this image photographed by an Expedition 34 crew member on the International Space Station. The island is located in the southern Atlantic Ocean; more than 3,700 kilometers from the northern coastline of Antarctica, approximately 2,800 kilometers to the southern tip of Africa, and more than 3,000 kilometers from the eastern coastline of South America. The island forms part of the British Overseas Territory of Saint Helena, Ascension, and Tristan da Cunha. The shoreline of the 13-kilometer-wide island is marked on most sides by steep cliffs, with lower beach areas on the southern and north-northwestern sides. The island is notable for its bird population, including important breeding grounds for a variety of petrels, albatrosses, penguins and shearwaters. Tristan da Cunha is a shield volcano; a type of volcanic structure usually recognized by a low, broad profile and composed of silica-poor lavas (such as basalt). The upper surface of this low base appears dark green in this photograph. Steeper, brown to tan colored slopes mark the central cone of the volcano at the island?s center. The summit crater, Queen Mary?s Peak, sits at an elevation of 2,060 meters above sea level. While geologic evidence indicates that eruptions have occurred from the central crater, lavas have also erupted from flank vents along the sides of the volcano as well as smaller cinder cones. The last known eruption of Tristan da Cunha took place 1961-1962 and forced evacuation of the only settlement on the island, Edinburgh of the Seven Seas. The settlement is located along the northern coastline of the island (obscured by clouds in this image). This is considered to be the most remote permanent settlement on Earth, with its citizen?s nearest neighbors located 2,173 kilometers to the northeast on the island of St. Helena.
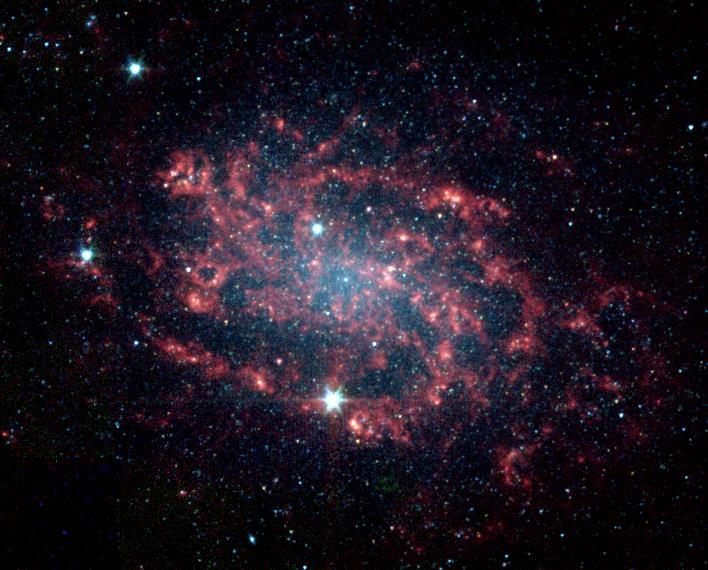
Sometimes, the best way to understand how something works is to take it apart. The same is true for galaxies like NGC 300, which NASA's Spitzer Space Telescope has divided into its various parts. NGC 300 is a face-on spiral galaxy located 7.5 million light-years away in the southern constellation Sculptor. This false-color image taken by the infrared array camera on Spitzer readily distinguishes the main star component of the galaxy (blue) from its dusty spiral arms (red). The star distribution peaks strongly in the central bulge where older stars congregate, and tapers off along the arms where younger stars reside. Thanks to Spitzer's unique ability to sense the heat or infrared emission from dust, astronomers can now clearly trace the embedded dust structures within NGC 300's arms. When viewed at visible wavelengths, the galaxy's dust appears as dark lanes, largely overwhelmed by bright starlight. With Spitzer, the dust - in particular organic compounds called polycyclic aromatic hydrocarbons - can be seen in vivid detail (red). These organic molecules are produced, along with heavy elements, by the stellar nurseries that pepper the arms. The findings provide a better understanding of spiral galaxy mechanics and, in the future, will help decipher more distant galaxies, whose individual components cannot be resolved. This image was taken on Nov. 21, 2003 and is composed of photographs obtained at four wavelengths: 3.6 microns (blue), 4.5 microns (green), 5.8 microns (orange) and 8 microns (red). http://photojournal.jpl.nasa.gov/catalog/PIA05879
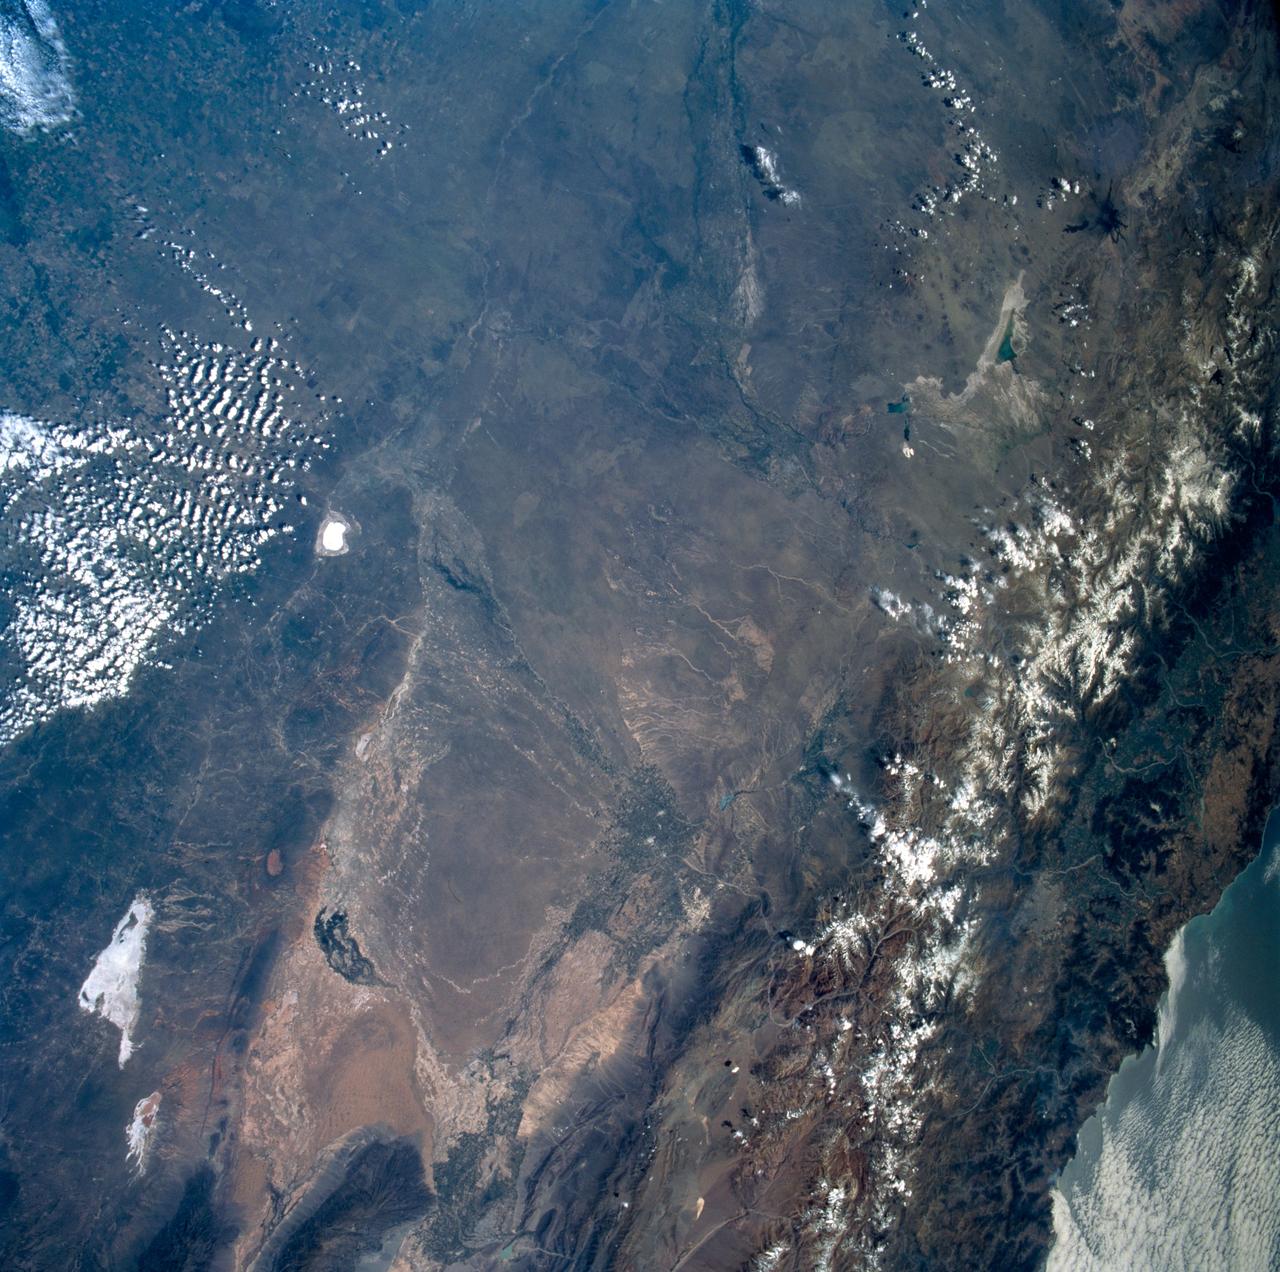
STS089-742-014 (22-31 Jan. 1998) --- This near-nadir picture of the central Andes, showing Santiago and other parts of Chile and Argentina, was photographed with a 70mm handheld camera from the Earth-orbiting space shuttle Endeavour. Santiago (population 4.7 million) is visible to the right of center, west of the snow-capped Andes Mountains. Mendoza, Argentina is the light spot in the upper center of the image in the eastern foothills of the Andes. Cerro Aconcagua, the highest peak in South America (22,834 feet) is due west of Mendoza. Note the sharp bend in the river valley to the junction with a straight north-trending valley. Aconcagua is the large, rounded mass with a bit of cloud just northwest of the valley junction. Bright white spots on the left of the image are salars, or dry lake beds of gypsum and/or salt. Usually dry, some contain water due to recent rains generated by the record El Nino this year. The Pacific Ocean is to the upper right. The continental shelf is very steep in this region and water depths drop (to almost 17,000 feet over a distance of about 60 miles) over the same distance inland from the coast, the Andes rise +17,000 to almost 23,000 feet. The reason for this is the very rapid plate motion between the Pacific Ocean plate and South America. According to NASA scientists, over the last 140 million years, South America has been overriding the Pacific plate resulting in the rapid rise in the Andes and the rapid subduction of the Pacific plate, along with any sediments that are shed into the ocean along the continental margin. The dark, linear mountain ranges east of the high Andes (right center) constitute the Precordillera block; rock strata there have been correlated with the Ordovician (approximately 470 million years old) rocks near El Paso, Texas. The rocks and the fossils within them are virtually identical in the two areas, which are now widely separated. This region would be considered a "remnant terrain" from the time when this portion of South America and Texas were once joined. Photo credit: NASA
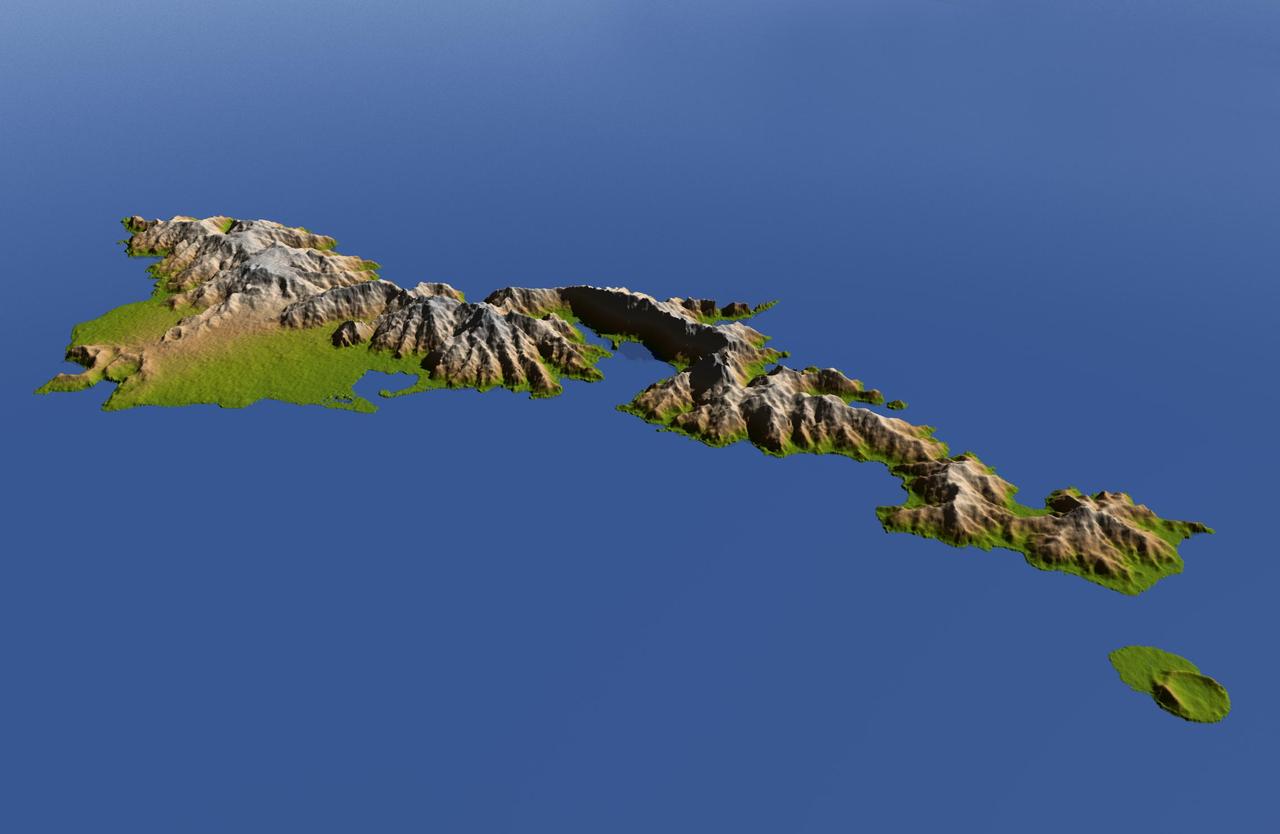
The topography of Tutuila, largest of the islands of American Samoa, is well shown in this color-coded perspective view generated with digital elevation data from the Shuttle Radar Topography Mission (SRTM.) The total area of Tutuila is about 141.8 square kilometers (54.8 square miles), slightly larger than San Francisco. The large bay near the center in this view is Pago Pago Harbor, actually a submerged volcanic crater whose south wall collapsed millions of years ago. Adjacent to the harbor is Pago Pago, the capital of American Samoa, and to the left (west) of the harbor in this view is Matafao Peak, Tutuila’s highest point at 653 meters (2,142 feet). On September 29, 2009, a tsunami generated by a major undersea earthquake located about 200 kilometers (120 miles) southwest of Tutuila inundated the more heavily populated southern coast of the island with an ocean surge more than 3 meters (10 feet) deep, causing scores of casualties. Digital topographic data such as those produced by SRTM aid researchers and planners in predicting which coastal regions are at the most risk from such waves, as well as from the more common storm surges caused by tropical storms and even sea level rise. Two visualization methods were combined to produce the image: shading and color coding of topographic height. The shaded image was derived by computing topographic slope in the northeast-southwest direction, so that northeast slopes appear bright and southwest slopes appear dark. Color coding is directly related to topographic height, with green at the lower elevations, rising through yellow and tan, to white at the highest elevations. The image was then projected using the elevation data to produce this perspective view, with the topography exaggerated by a factor of two. http://photojournal.jpl.nasa.gov/catalog/PIA11965
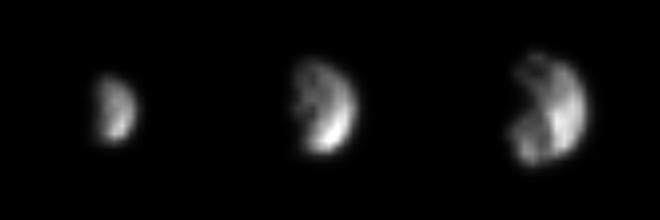
The Cassini spacecraft is closing in fast on its first target of observation in the Saturn system: the small, mysterious moon Phoebe, only 220 kilometers (137 miles) across. The three images shown here, the latest of which is twice as good as any image returned by the Voyager 2 spacecraft in 1981, were captured in the past week on approach to this outer moon of Saturn. Phoebe's surface is already showing a great deal of contrast, most likely indicative of topography, such as tall sunlit peaks and deep shadowy craters, as well as genuine variation in the reflectivity of its surface materials. Left to right, the three views were captured at a phase (Sun-Saturn-spacecraft) angle of 87 degrees between June 4 and June 7, from distances ranging from 4.1 million kilometers (2.6 million miles) to 2.5 million kilometers (1.5 million miles). The image scale ranges from 25 to 15 kilometers per pixel. Phoebe rotates once every nine hours and 16 minutes; each of these images shows a different region on Phoebe. Phoebe was the discovered in 1898. It has a very dark surface. Cassini's powerful cameras will provide the best-ever look at this moon on Friday, June 11, when the spacecraft will streak past Phoebe at a distance of only about 2,000 kilometers (1,240 miles) from the moon's surface. The current images, and the presence of large craters, promise a heavily cratered surface which will come into sharp view over the next few days when image scales should get as small as a few tens of meters. Phoebe orbits Saturn in a direction opposite to that of the larger interior Saturnian moons. Because of its small size and retrograde orbit Phoebe is believed to be a body from the distant outer solar system, perhaps one of the building blocks of the outer planets that were captured into orbit around Saturn. If true, the little moon will provide information about these primitive pieces of material. http://photojournal.jpl.nasa.gov/catalog/PIA06062
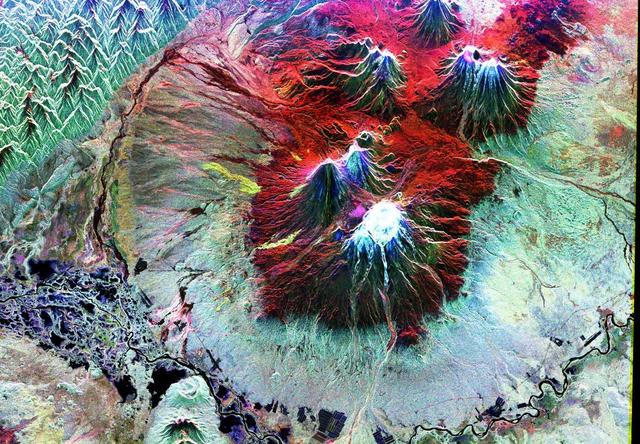
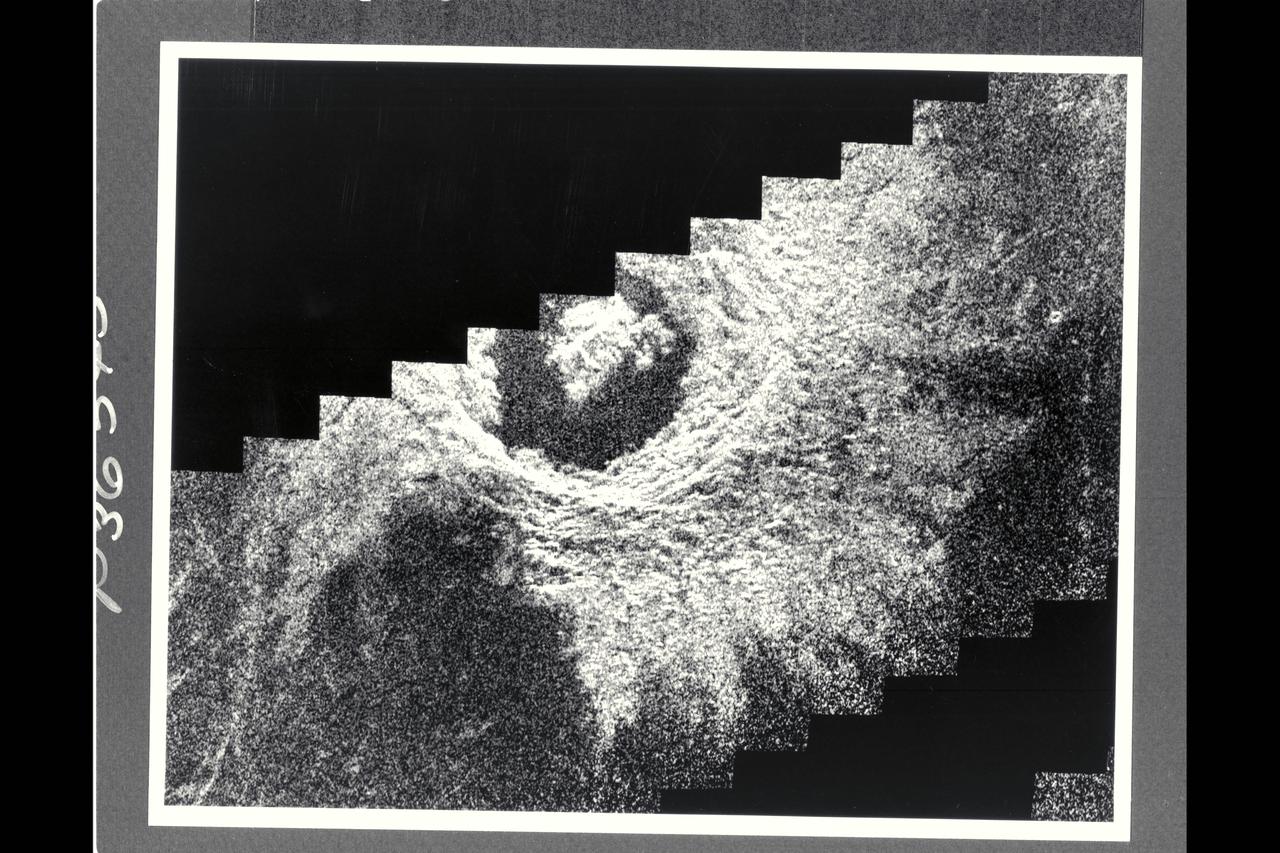
This is an image of the area of Kliuchevskoi volcano, Kamchatka, Russia, which began to erupt on September 30, 1994. Kliuchevskoi is the blue triangular peak in the center of the image, towards the left edge of the bright red area that delineates bare snow cover. The image was acquired by the Spaceborne Imaging Radar-C/X-band Synthetic Aperture Radar (SIR-C/X-SAR) aboard the space shuttle Endeavour on its 88th orbit on October 5, 1994. The image shows an area approximately 75 kilometers by 100 kilometers (46 miles by 62 miles) that is centered at 56.07 degrees north latitude and 160.84 degrees east longitude. North is toward the bottom of the image. The radar illumination is from the top of the image. The Kamchatka volcanoes are among the most active volcanoes in the world. The volcanic zone sits above a tectonic plate boundary, where the Pacific plate is sinking beneath the northeast edge of the Eurasian plate. The Endeavour crew obtained dramatic video and photographic images of this region during the eruption, which will assist scientists in analyzing the dynamics of the recent activity. The colors in this image were obtained using the following radar channels: red represents the L-band (horizontally transmitted and received); green represents the L-band (horizontally transmitted and vertically received); blue represents the C-band (horizontally transmitted and vertically received). In addition to Kliuchevskoi, two other active volcanoes are visible in the image. Bezymianny, the circular crater above and to the right of Kliuchevskoi, contains a slowly growing lava dome. Tolbachik is the large volcano with a dark summit crater near the upper right edge of the red snow covered area. The Kamchatka River runs from right to left across the bottom of the image. The current eruption of Kliuchevskoi included massive ejections of gas, vapor and ash, which reached altitudes of 15,000 meters (50,000 feet). Melting snow mixed with volcanic ash triggered mud flows on the flanks of the volcano. Paths of these flows can be seen as thin lines in various shades of blue and green on the north flank in the center of the image. http://photojournal.jpl.nasa.gov/catalog/PIA01765

These four panels show the Whirlpool galaxy — which is actually a pair of galaxies also known as Messier 51 and NGC 5194/5195 — and how different wavelengths of light can reveal different features of a cosmic object. Located approximately 23 million light-years away, it resides in the constellation Canes Venatici. The left image (a) shows the galaxy in visible light, from the Kitt Peak National Observatory 2.1-meter (6.8-foot) telescope and shows light at 0.4 microns (blue) and 0.7 microns (green). The next image (b) combines two visible-light wavelengths (in blue and green) and infrared light (in red). The infrared was captured by NASA's Spitzer Space Telescope and emphasizes how the dark dust veins that block our view in visible light begin to light up at these longer, infrared wavelengths. The right two panels are composed entirely of Spitzer data. In the middle-right panel (c), we see three wavelengths of infrared light: 3.6 microns (shown in blue), 4.5 microns (green) and 8 microns (red). The blended light from the billions of stars in the Whirlpool is brightest at the shorter infrared wavelengths and appear as as a blue haze. The individual blue dots across the image are mostly nearby stars and a few distant galaxies. Red features (at 8 microns) show us dust composed mostly of carbon that is illuminated by the stars in the galaxy. The far-right panel (d) expands our infrared view to include light at a wavelength of 24 microns (in red), which is particularly good for highlighting areas where the dust is especially hot. The bright reddish-white spots trace regions where new stars are forming and, in the process, heating their surroundings. All of the data shown here were released as part of the Spitzer Infrared Nearby Galaxies Survey (SINGS) project, captured during Spitzer's cryogenic and warm missions. https://photojournal.jpl.nasa.gov/catalog/PIA23128
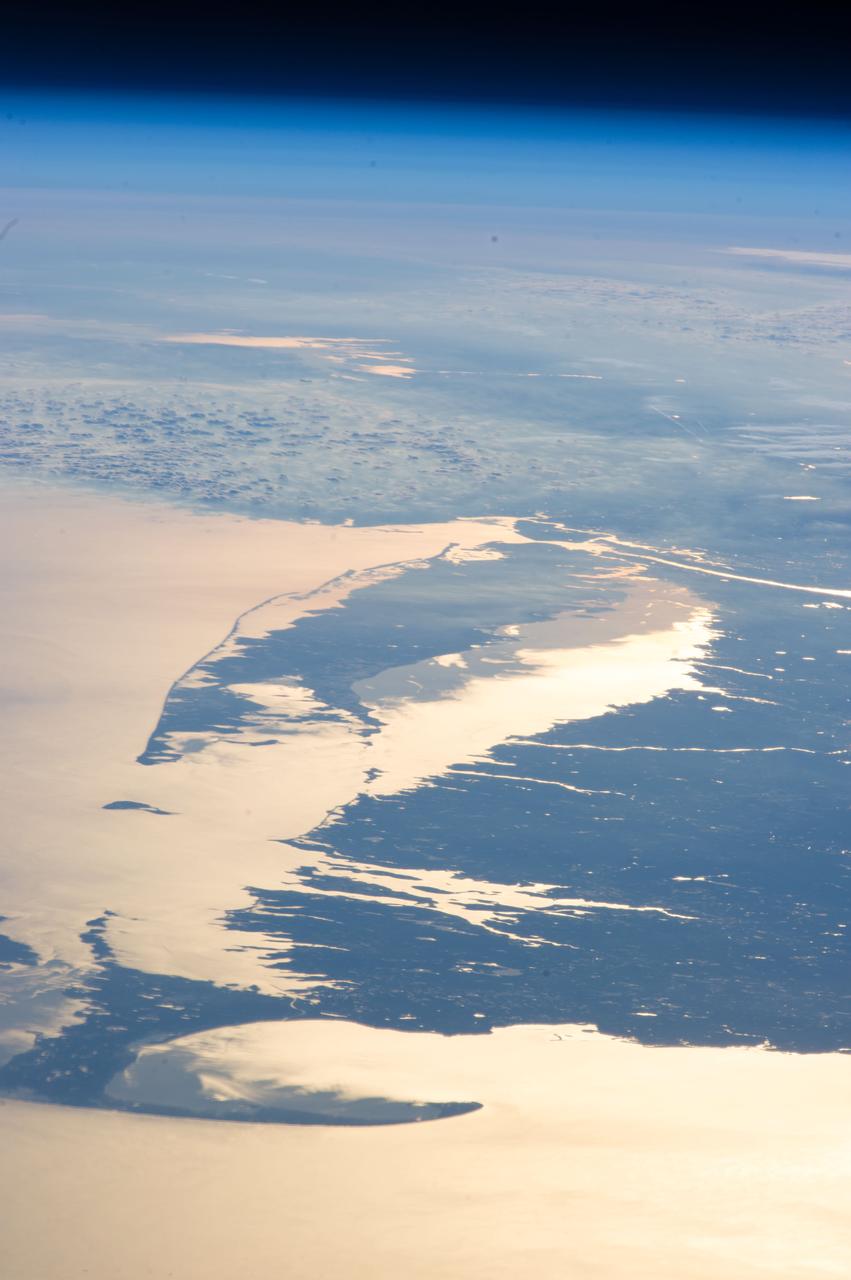
ISS034-E-48455 (14 Feb. 2013) --- Looking out at Earth?s surface from the International Space Station (ISS), astronauts and cosmonauts frequently observe sunglint highlighting both ocean and inland water surfaces. The Atlantic Ocean, including Cape Cod Bay and Buzzards Bay, along the coastlines of Massachusetts and Rhode Island, has a burnished, mirror-like appearance in this image. This is due to sunlight reflected off the water surface back towards the station crew member who took the photo. The peak reflection point is towards the right side of the image, lending the waters of Long Island Sound and the upper Massachusetts coastline an even brighter appearance. Sunglint also illuminates the surface waters of Chesapeake Bay, located over 400 kilometers (250 miles) to the southwest of the tip of Long Island. This suggests that the Sun was low on the horizon due to the observed extent of the sunglint effect. The time of image acquisition, approximately 4:26 p.m. Eastern Standard Time, was about one hour before local sunset. There is little in this image to indicate that the region was still recovering from a major winter storm that dropped almost one meter (three feet) of snow over much of the northeastern USA less than a week earlier. The high viewing angle from the space station also allows Earth?s curvature, or limb, to be seen; blue atmospheric layers gradually fade into the darkness of space across the top part of the image. Low clouds near Cape Cod, Long Island, and further down the Atlantic coastline cast shadows over the water surfaces, reducing the sunglint in some areas.
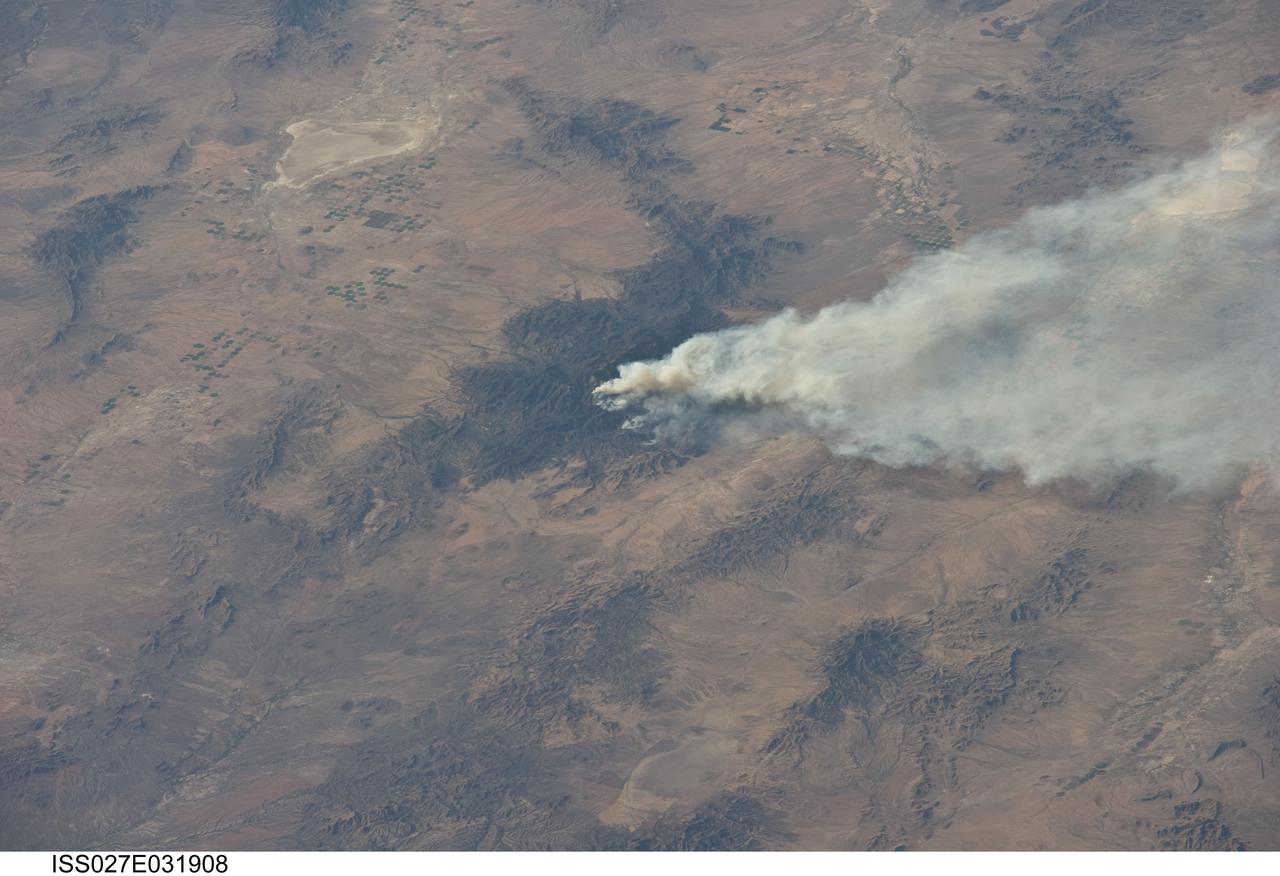
ISS027-E-031908 (15 May 2011) --- The Horseshoe 2 fire is featured in this image photographed by an Expedition 27 crew member on the International Space Station. The Horseshoe 2 fire, located along the southeastern flank of the Chiricahua Mountains in southeastern Arizona, began on May 8, 2011 at approximately 11:00 a.m. The fire is thought to have been started by human activities. This photograph illustrates the area (approximately 8,900 hectares, or 22,110 acres) and position of the fire within the mountains on May 15, 2011, as well as an extensive smoke plume extending to the east-northeast over a distance of at least 60 kilometers (approximately 40 miles). As of May 19, 2011, the fire had burned an area of nearly 14,000 hectares (approximately 34,400 acres) of grasses, shrubs, and trees along the mountain slopes. The Chiricahua Mountains are included within the Chiricahua National Monument located near the borders of Arizona, USA; New Mexico, USA; and Chihuahua, United Mexican States. Elevations in the mountains range from approximately 914 – 3,267 meters (300 – 10,720 feet) above sea level. The higher elevations—known regionally as “sky islands”—allow for biologically diverse plant and animal communities, adapted to cooler and wetter conditions, to survive while surrounded by semi-arid to arid desert conditions at lower elevations. The image highlights this contrast in environments; pine and oak forest contributes to the dark coloration of the upper slopes and peaks of the Chiricahuas at center, while the flat, gray to tan surface of Willcox Playa (an interior-draining basin or dry lake) to the northwest is indicative of the adjacent desert environment.
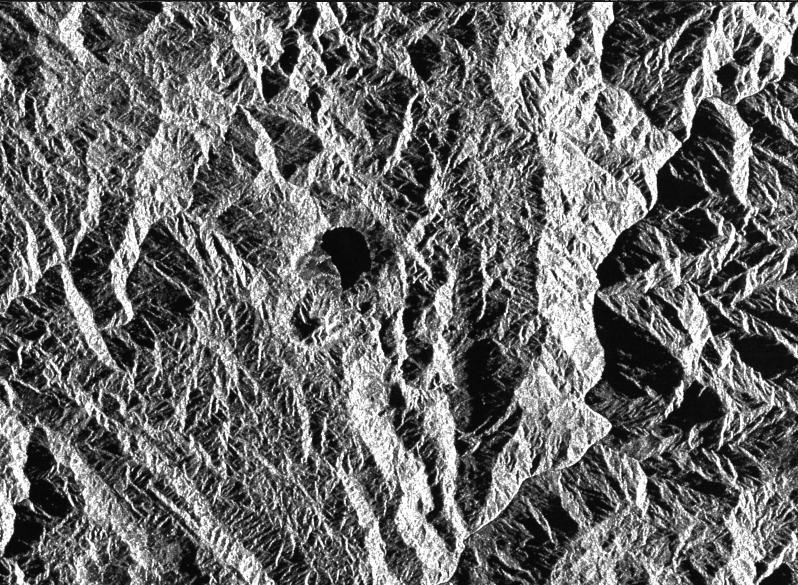
This is a radar image of a little known volcano in northern Colombia. The image was acquired on orbit 80 of space shuttle Endeavour on April 14, 1994, by NASA Spaceborne Imaging Radar C/X-Band Synthetic Aperture Radar SIR-C/X-SAR. The volcano near the center of the image is located at 5.6 degrees north latitude, 75.0 degrees west longitude, about 100 kilometers (65 miles) southeast of Medellin, Colombia. The conspicuous dark spot is a lake at the bottom of an approximately 3-kilometer-wide (1.9-mile) volcanic collapse depression or caldera. A cone-shaped peak on the bottom left (northeast rim) of the caldera appears to have been the source for a flow of material into the caldera. This is the northern-most known volcano in South America and because of its youthful appearance, should be considered dormant rather than extinct. The volcano's existence confirms a fracture zone proposed in 1985 as the northern boundary of volcanism in the Andes. The SIR-C/X-SAR image reveals another, older caldera further south in Colombia, along another proposed fracture zone. Although relatively conspicuous, these volcanoes have escaped widespread recognition because of frequent cloud cover that hinders remote sensing imaging in visible wavelengths. Four separate volcanoes in the Northern Andes nations of Colombia and Ecuador have been active during the last 10 years, killing more than 25,000 people, including scientists who were monitoring the volcanic activity. Detection and monitoring of volcanoes from space provides a safe way to investigate volcanism. The recognition of previously unknown volcanoes is important for hazard evaluations because a number of major eruptions this century have occurred at mountains that were not previously recognized as volcanoes. http://photojournal.jpl.nasa.gov/catalog/PIA01722
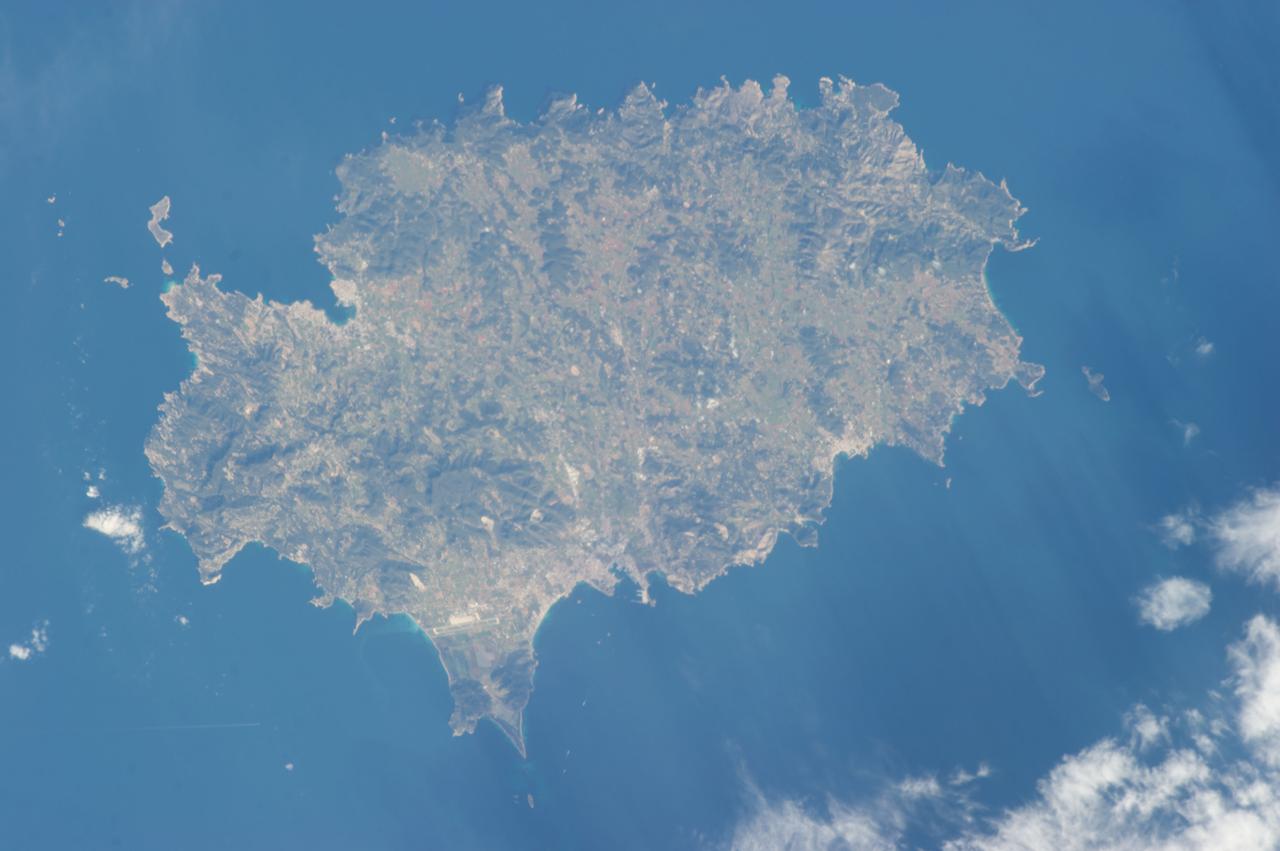
ISS035-E-007431 (22 March 2013) --- One of the Expedition 35 crew members aboard the Earth-orbiting International Space Station used a digital camera equipped with a 400 millimeter lens to capture this image of the island of Ibiza (Eivissa in the native Catalan language), located off of the southeastern coast of Spain. Ibiza is part of the Balearic archipelago. Together with the neighboring island of Formentera (not shown), it comprises the Pine Islands of the western archipelago. The largest cities on the island, Ibiza Town, Sant Antoni de Portmany, and Santa Eularia des Riu, appear as white to pink regions near coastal bays in the image. Much of the lowland interior of the island is covered with green to light brown agricultural fields; some are still in active production for such crops as wheat, olives, and grapes but many fields are inactive and experiencing regrowth of native trees such as pine (Pinus halpensis) and savine (Juniperus phoenicea). The northern and southwestern coastlines are hilly (grey-brown regions), with the highest peak (Sa Talaia, 475 meters above sea level) located in the southwestern region. Like many of the Balearic Islands, the major industry of Ibiza is European tourism, and it is particularly well known for the nightlife of Ibiza Town and Sant Antoni de Portmany. Ships near Ibiza Town and a ship wake off the southwestern coastline are visible at image lower left. The island hosts a large variety of birds and lizards; however no large land fauna are present. The Mediterranean Sea to the southeast of the island appears dark in the image due to shadowing by clouds, just visible at the lower right corner of the image.
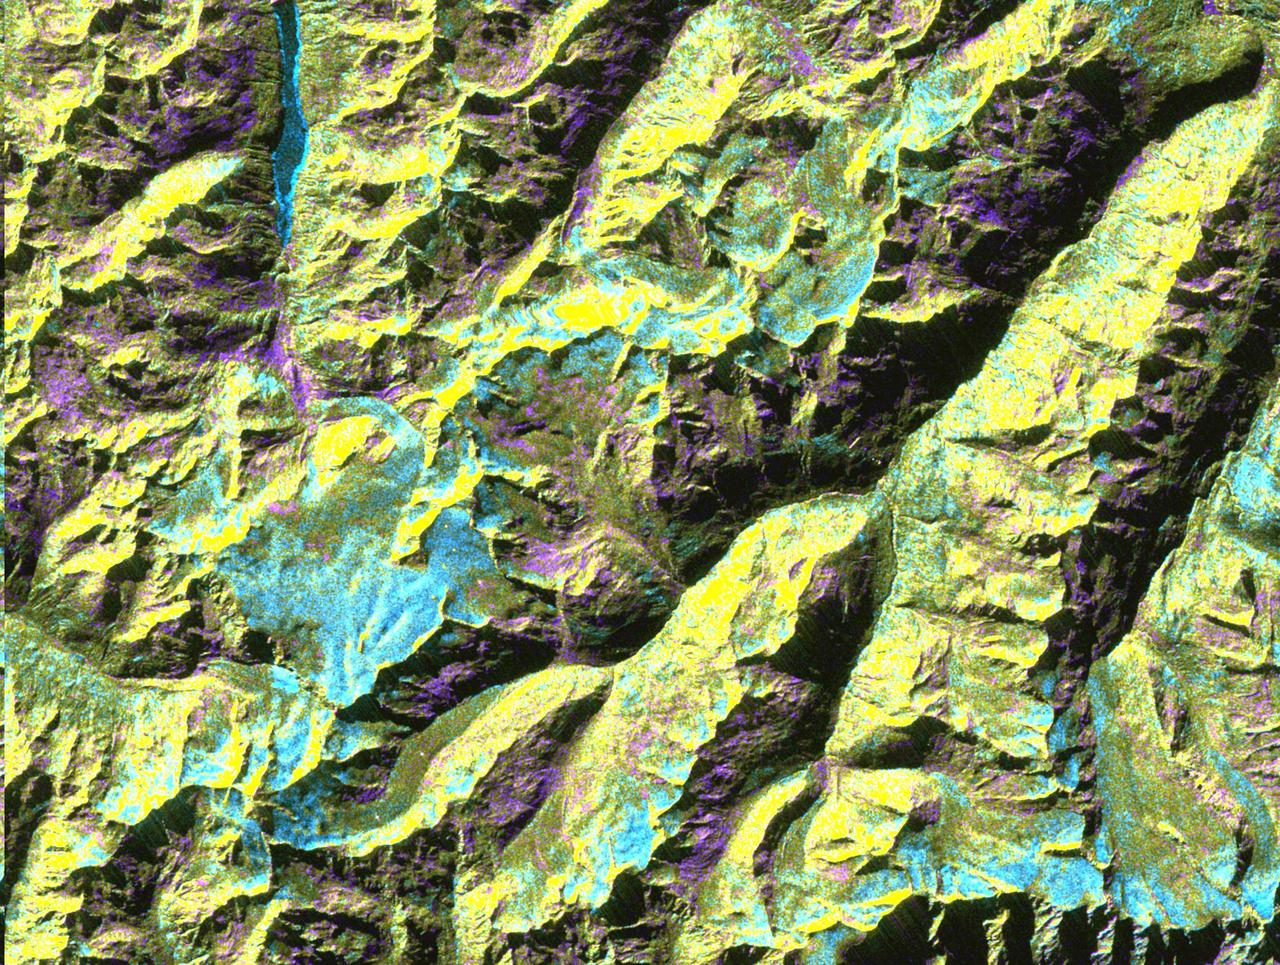
This is a digital elevation model that was geometrically coded directly onto an X-band seasonal change image of the Oetztal supersite in Austria. The image is centered at 46.82 degrees north latitude and 10.79 degrees east longitude. This image is located in the Central Alps at the border between Switzerland, Italy and Austria, 50 kilometers (31 miles) southwest of Innsbruck. It was acquired by the Spaceborne Imaging Radar-C/X-band Synthetic Aperture aboard the space shuttle Endeavour on April 14, 1994 and on October 5, 1994. It was produced by combining data from these two different data sets. Data obtained in April is green; data obtained in October appears in red and blue, and was used as an enhancement based on the ratio of the two data sets. Areas with a decrease in backscatter from April to October appear in light blue (cyan), such as the large Gepatschferner glacier seen at the left of the image center, and most of the other glaciers in this view. A light blue hue is also visible at the east border of the dark blue Lake Reschensee at the upper left side. This shows a significant rise in the water level. Magenta represents areas with an increase of backscatter from April 10 to October 5. Yellow indicates areas with high radar signal response during both passes, such as the mountain slopes facing the radar. Low radar backscatter signals refer to smooth surface (lakes) or radar grazing areas to radar shadow areas, seen in the southeast slopes. The area is approximately 29 kilometers by 21 kilometers (18 miles by 13.5 miles). The summit of the main peaks reaches elevations of 3,500 to 3,768 meters (xx feet to xx feet) above sea level. The test site's core area is the glacier region of Venter Valley, which is one of the most intensively studied areas for glacier research in the world. Research in Venter Valley (below center) includes studies of glacier dynamics, glacier-climate regions, snowpack conditions and glacier hydrology. About 25 percent of the core test site is covered by glaciers. Corner reflectors are set up for calibration. Five corner reflectors can be seen on the Gepatschferner and two can be seen on the Vernagtferner. http://photojournal.jpl.nasa.gov/catalog/PIA01760

NASA image release April 22, 2010 NASA's Hubble Space Telescope captured this billowing cloud of cold interstellar gas and dust rising from a tempestuous stellar nursery located in the Carina Nebula, 7,500 light-years away in the southern constellation Carina. This pillar of dust and gas serves as an incubator for new stars and is teeming with new star-forming activity. Hot, young stars erode and sculpt the clouds into this fantasy landscape by sending out thick stellar winds and scorching ultraviolet radiation. The low-density regions of the nebula are shredded while the denser parts resist erosion and remain as thick pillars. In the dark, cold interiors of these columns new stars continue to form. In the process of star formation, a disk around the proto-star slowly accretes onto the star's surface. Part of the material is ejected along jets perpendicular to the accretion disk. The jets have speeds of several hundreds of miles per second. As these jets plow into the surround nebula, they create small, glowing patches of nebulosity, called Herbig-Haro (HH) objects. Long streamers of gas can be seen shooting in opposite directions off the pedestal on the upper right-hand side of the image. Another pair of jets is visible in a peak near the top-center of the image. These jets (known as HH 901 and HH 902, respectively) are common signatures of the births of new stars. This image celebrates the 20th anniversary of Hubble's launch and deployment into an orbit around Earth. Hubble's Wide Field Camera 3 observed the pillar on Feb. 1-2, 2010. The colors in this composite image correspond to the glow of oxygen (blue), hydrogen and nitrogen (green), and sulfur (red). Object Names: HH 901, HH 902 Image Type: Astronomical Credit: NASA, ESA, and M. Livio and the Hubble 20th Anniversary Team (STScI) To read learn more about this image go to: <a href="http://www.nasa.gov/mission_pages/hubble/science/hubble20th-img.html" rel="nofollow">www.nasa.gov/mission_pages/hubble/science/hubble20th-img....</a> <b><a href="http://www.nasa.gov/centers/goddard/home/index.html" rel="nofollow">NASA Goddard Space Flight Center</a></b> is home to the nation's largest organization of combined scientists, engineers and technologists that build spacecraft, instruments and new technology to study the Earth, the sun, our solar system, and the universe.
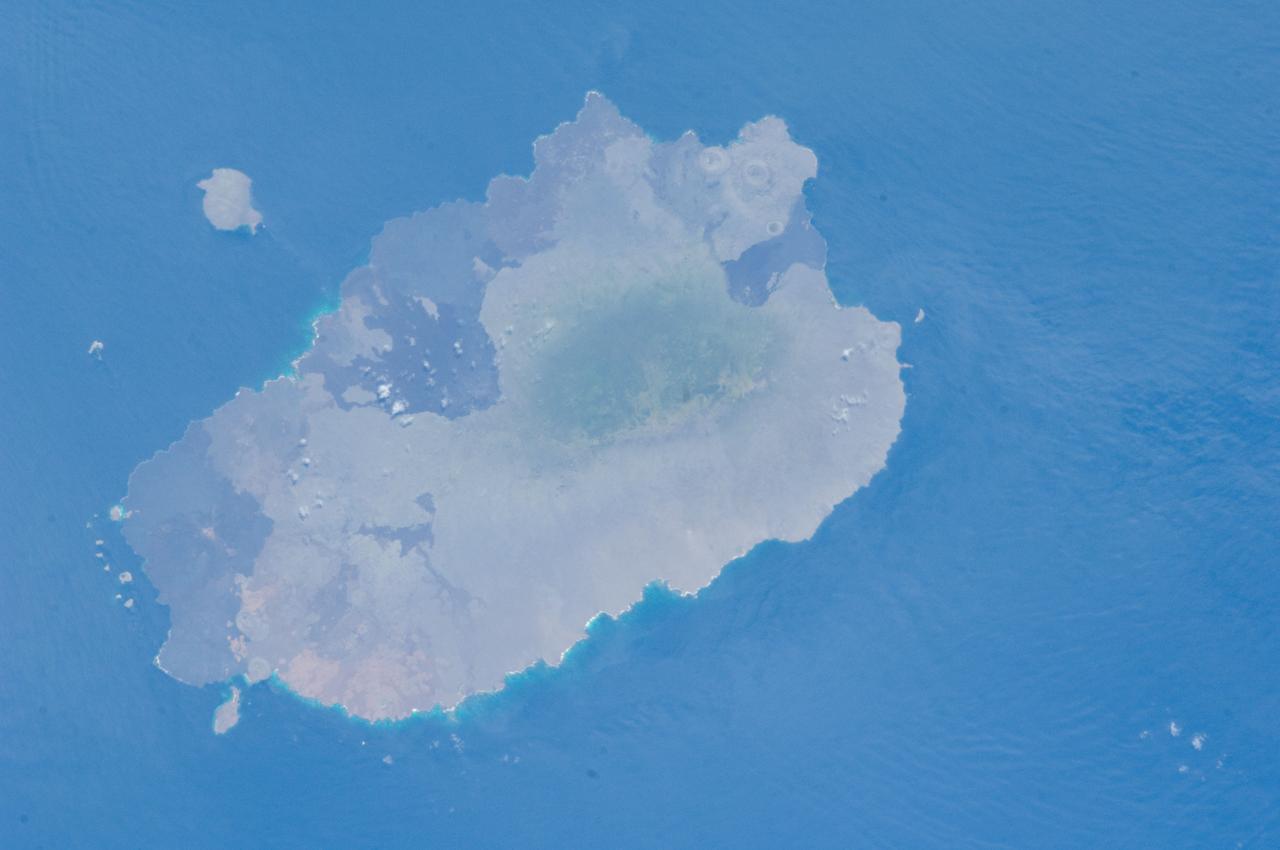
ISS033-E-012648 (18 Oct. 2012) --- Isla Santiago is featured in this image photographed by an Expedition 33 crew member on the International Space Station. The island of Santiago is located near the center of the Galapagos Islands off the coast of Ecuador. The Galapagos Islands are situated near the equator, and were formed from volcanism related to a large mantle plume (also known as a hot spot). This hot spot is very close to the tectonic boundary between the Galapagos Ridge, a plate boundary that is also an oceanic spreading center, and the Nazca and Cocos plates. This combination of mantle plumes and tectonic plate movements produces a unique geological environment, including underwater ridges of volcanoes that influence the water circulation around the Galapagos. All of these aspects contribute to the geology and biology of the Galapagos. Isla Santiago itself is formed from a shield volcano also called Santiago. This type of volcanic structure is recognized by low, flat summits surrounded by extensive flow fields of lava; the lava is not very viscous, so it can flow for great distances from the source vents. Several dark lava flow fields are visible in this photograph, the largest along the eastern, western, and southern coastlines. The small Isla Rabida to the south of Isla Santiago is the peak of another, mostly submerged shield volcano. In addition to the lava flows, other volcanic features known as tuff cones are visible on the eastern and western sides of the island. These cones are formed from the rapid interaction of hot flowing lava and water. The water underneath the lava flow flashes to steam explosively, and this both fragments the lava and rapidly cools it, leading to the formation of cones of glassy, relatively fine-grained volcanic material. The most recent volcanic activity on Isla Santiago occurred during 1904 – 1906. The summit ridge of the Santiago shield volcano is located in the northwestern part of the island (center). Also at center is a large but isolated region of green vegetation primarily located on the south-facing slope below the summit ridge. This image was taken during the dry, or garua, season that lasts from June to November. The season is dominated by cooler air transported by the Southeast Trade winds and cooler waters from the Humboldt and Cromwell currents. The combination of cool air and water results in rain falling only in the island highlands, with south- and east-facing slopes receiving the most precipitation. Despite the favorable topographic location, the yellow green color of the vegetation may indicate water (or other) stress.

Supernova Supernovae can occur one of two ways. The first occurs when a white dwarf—the vestigial ember of a dead star—passes so close to a living star that its matter leaks into the white dwarf. This causes a catastrophic explosion. However most people understand supernovae as the death of a massive star. When the star runs out of fuel toward the end of its life, the gravity at its heart sucks the surrounding mass into its center. At temperatures rocketing above 100 billion degrees Fahrenheit, all the layers of the star abruptly explode outward. The explosions produced by supernovae are so brilliant that astronomers use their luminosity to measure the distance between galaxies, the scale of the universe and the effects of dark energy. For a short period of time, one dying star can appear to shine as brightly as an entire galaxy. Supernovae are relatively common events, one occurring in our own galaxy once every 100 years. In 2014, a person could see the supernova M82 with a pair of binoculars. The cosmologist Tycho Brahe’s observation of a supernova in 1572 allowed him to disprove Aristotle’s theory that the heavens never changed. After a supernova, material expelled in the explosion can form a nebula—an interstellar pile of gas and dust. Over millions of years, gravity pulls the nebula’s materials into a dense orb called a protostar, which will become a new star. Within a few million years, this new star could go supernova as well. ------------------------------ Original Caption: NASA image release Feb. 24, 2012 At the turn of the 19th century, the binary star system Eta Carinae was faint and undistinguished. In the first decades of the century, it became brighter and brighter, until, by April 1843, it was the second brightest star in the sky, outshone only by Sirius (which is almost a thousand times closer to Earth). In the years that followed, it gradually dimmed again and by the 20th century was totally invisible to the naked eye. The star has continued to vary in brightness ever since, and while it is once again visible to the naked eye on a dark night, it has never again come close to its peak of 1843. NASA's Hubble Telescope captured an image of Eta Carinae. This image consists of ultraviolet and visible light images from the High Resolution Channel of Hubble's Advanced Camera for Surveys. The field of view is approximately 30 arcseconds across. The larger of the two stars in the Eta Carinae system is a huge and unstable star that is nearing the end of its life, and the event that the 19th century astronomers observed was a stellar near-death experience. Scientists call these outbursts supernova impostor events, because they appear similar to supernovae but stop just short of destroying their star. Although 19th century astronomers did not have telescopes powerful enough to see the 1843 outburst in detail, its effects can be studied today. The huge clouds of matter thrown out a century and a half ago, known as the Homunculus Nebula, have been a regular target for Hubble since its launch in 1990. This image, taken with the Advanced Camera for Surveys High Resolution Channel, is the most detailed yet, and shows how the material from the star was not thrown out in a uniform manner, but forms a huge dumbbell shape. Eta Carinae is not only interesting because of its past, but also because of its future. It is one of the closest stars to Earth that is likely to explode in a supernova in the relatively near future (though in astronomical timescales the "near future" could still be a million years away). When it does, expect an impressive view from Earth, far brighter still than its last outburst: SN 2006gy, the brightest supernova ever observed, came from a star of the same type, though from a galaxy over 200 million light-years away. Credit: ESA/NASA More information: <a href="http://www.spacetelescope.org/images/potw1208a/" rel="nofollow">www.spacetelescope.org/images/potw1208a/</a> <b><a href="http://www.nasa.gov/audience/formedia/features/MP_Photo_Guidelines.html" rel="nofollow">NASA image use policy.</a></b> <b><a href="http://www.nasa.gov/centers/goddard/home/index.html" rel="nofollow">NASA Goddard Space Flight Center</a></b> enables NASA’s mission through four scientific endeavors: Earth Science, Heliophysics, Solar System Exploration, and Astrophysics. Goddard plays a leading role in NASA’s accomplishments by contributing compelling scientific knowledge to advance the Agency’s mission. <b>Follow us on <a href="http://twitter.com/NASAGoddardPix" rel="nofollow">Twitter</a></b> <b>Like us on <a href="http://www.facebook.com/pages/Greenbelt-MD/NASA-Goddard/395013845897?ref=tsd" rel="nofollow">Facebook</a></b> <b>Find us on <a href="http://instagrid.me/nasagoddard/?vm=grid" rel="nofollow">Instagram</a></b>
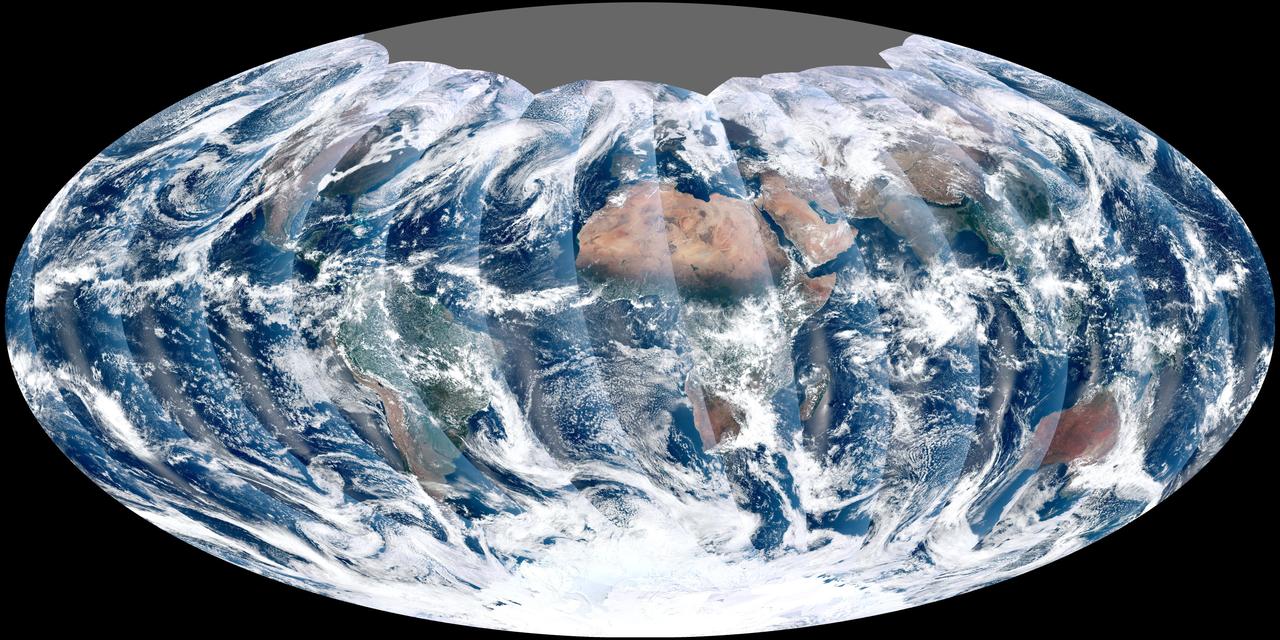
NASA acquired November 24, 2011 From its vantage 824 kilometers (512 miles) above Earth, the Visible Infrared Imager Radiometer Suite (VIIRS) on the NPOESS Preparatory Project (NPP) satellite gets a complete view of our planet every day. This image from November 24, 2011, is the first complete global image from VIIRS. The NPP satellite launched on October 28, 2011, and VIIRS acquired its first measurements on November 21. To date, the images are preliminary, used to gauge the health of the sensor as engineers continue to power it up for full operation. Rising from the south and setting in the north on the daylight side of Earth, VIIRS images the surface in long wedges measuring 3,000 kilometers (1,900 miles) across. The swaths from each successive orbit overlap one another, so that at the end of the day, the sensor has a complete view of the globe. The Arctic is missing because it is too dark to view in visible light during the winter. The NPP satellite was placed in a Sun-synchronous orbit, a unique path that takes the satellite over the equator at the same local (ground) time in every orbit. So, when NPP flies over Kenya, it is about 1:30 p.m. on the ground. When NPP reaches Gabon—about 3,000 kilometers to the west—on the next orbit, it is close to 1:30 p.m. on the ground. This orbit allows the satellite to maintain the same angle between the Earth and the Sun so that all images have similar lighting. The consistent lighting is evident in the daily global image. Stripes of sunlight (sunglint) reflect off the ocean in the same place on the left side of every swath. The consistent angle is important because it allows scientists to compare images from year to year without worrying about extreme changes in shadows and lighting. The image also shows a band of haze along the right side of every orbit swath. When light travels through the atmosphere, it bounces off particles or scatters, making the atmosphere look hazy. The scattering effect is most pronounced along the edge of the swath, where the sensor is looking at an angle through more of the atmosphere. Scientists can correct for this scattering effect, but need measurements from a range of wavelengths to do so. The degree to which light scatters depends partly on the wavelength of the light. Blue light scatters more than red light, for example, which is why the sky is blue. VIIRS measures 22 different wavelengths of light, but not all of the sensor’s detectors are operating at peak performance yet. Those measuring thermal infrared light are not yet cold enough to collect reliable measurements. Once VIIRS begins full operations, it will produce a range of measurements from ocean temperature to clouds to the locations of fires. These measurements will help extend the record from earlier sensors like the Moderate Resolution Imaging Spectroradiometer (MODIS). VIIRS is very similar to MODIS, but flies at a higher altitude to measure the whole planet without gaps. (MODIS daily measurements have gaps at the equator. See the MODIS image from November 24.) VIIRS also sees the Earth in less detail, 375 meters per pixel, compared to 250 meters per pixel for MODIS. Image by NASA’s NPP Land Product Evaluation and Testing Element. Caption by Holli Riebeek. Credit: <b><a href="http://www.earthobservatory.nasa.gov/" rel="nofollow"> NASA Earth Observatory</a></b> <b><a href="http://www.nasa.gov/audience/formedia/features/MP_Photo_Guidelines.html" rel="nofollow">NASA image use policy.</a></b> <b><a href="http://www.nasa.gov/centers/goddard/home/index.html" rel="nofollow">NASA Goddard Space Flight Center</a></b> enables NASA’s mission through four scientific endeavors: Earth Science, Heliophysics, Solar System Exploration, and Astrophysics. Goddard plays a leading role in NASA’s accomplishments by contributing compelling scientific knowledge to advance the Agency’s mission. <b>Follow us on <a href="http://twitter.com/NASA_GoddardPix" rel="nofollow">Twitter</a></b> <b>Like us on <a href="http://www.facebook.com/pages/Greenbelt-MD/NASA-Goddard/395013845897?ref=tsd" rel="nofollow">Facebook</a></b> <b>Find us on <a href="http://instagrid.me/nasagoddard/?vm=grid" rel="nofollow">Instagram</a></b>