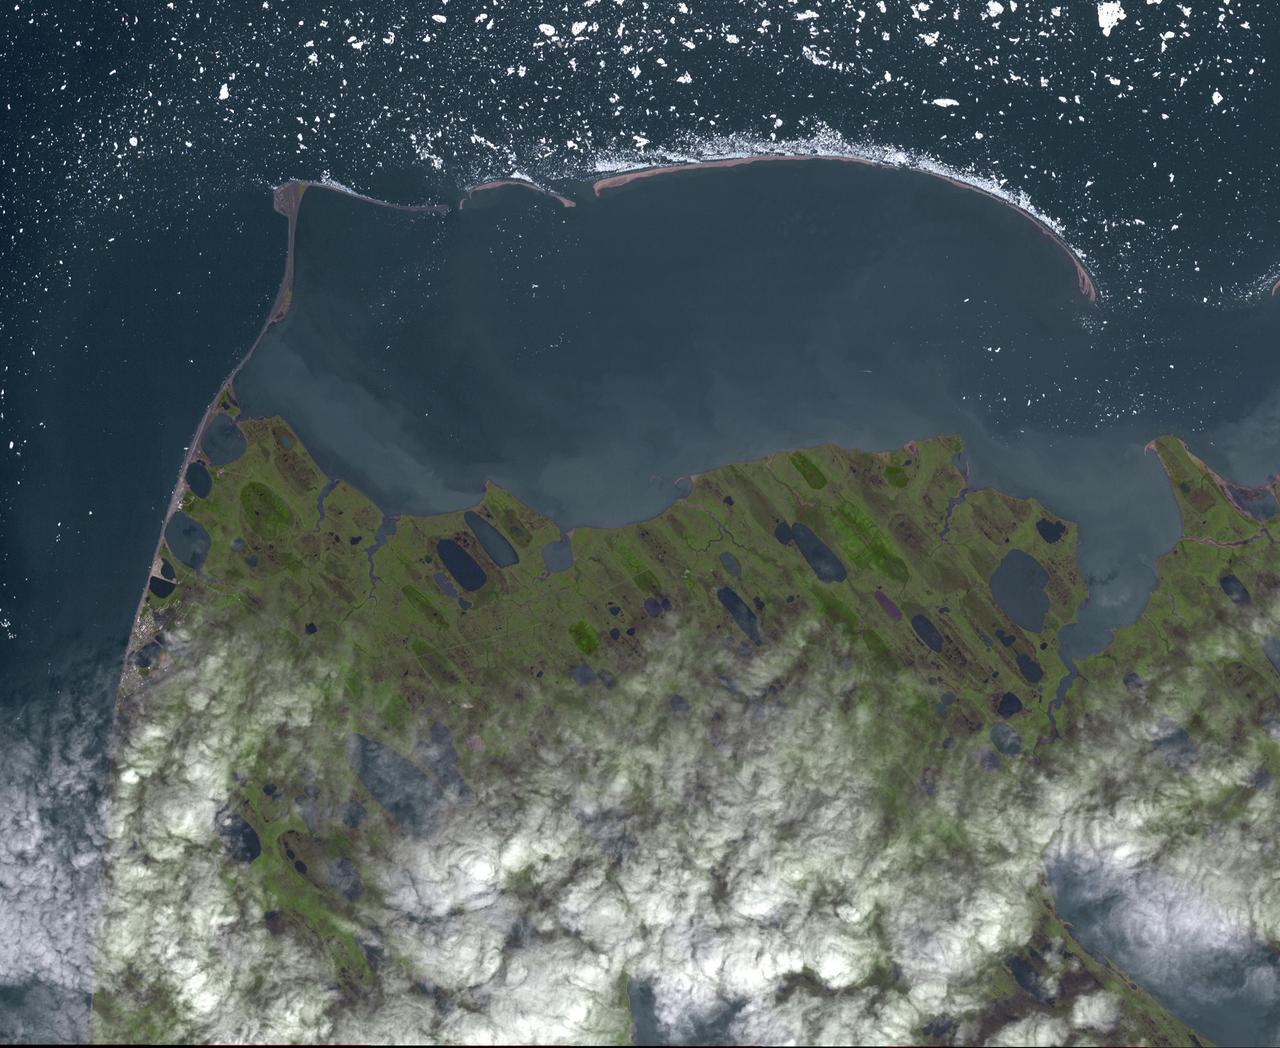
Point Barrow or Nuvuk, Alaska is the northernmost point of all territory of the United States. It also marks the limit between the Chukchi Sea to the west, and the Beaufort Sea to the east. Archaeological evidence indicates that Point Barrow was occupied about 500 CE, probably as hunting camps for whales. The image covers an area of 32 by 38 km, was acquired July 29, 2015, and is located at 71.6 degrees north, 156.45 degrees west. http://photojournal.jpl.nasa.gov/catalog/PIA19775
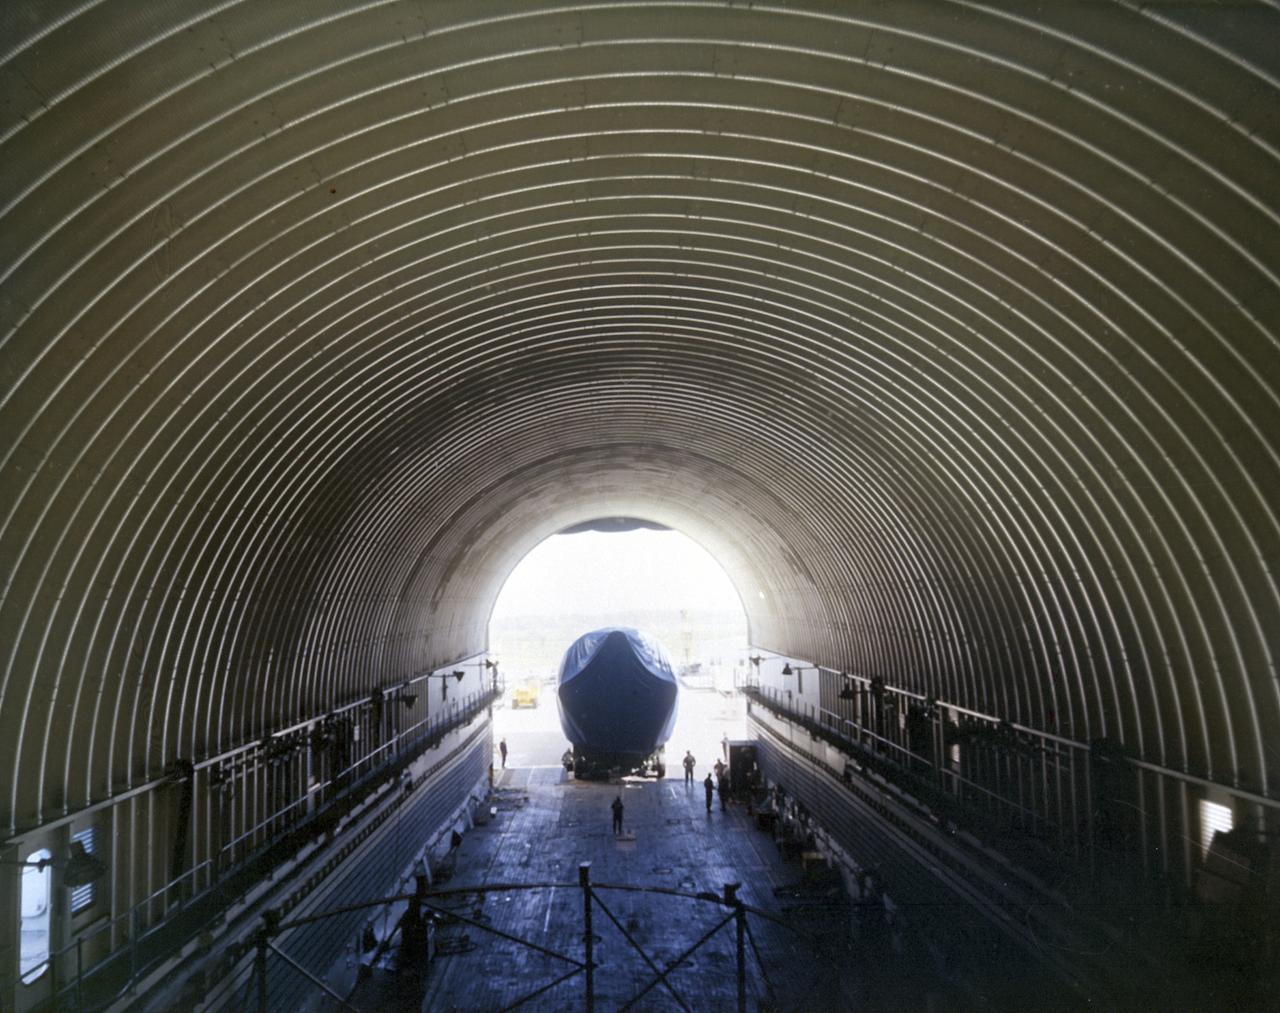
The Saturn 1B first stage (S-IB) enters the NASA barge Point Barrow, in March 1968. The Marshall Space Flight Center (MSFC) utilized a number of water transportation craft to transport the Saturn stages to-and-from the manufacturing facilities and test sites, as well as delivery to the Kennedy Space Center for launch. Developed by the Marshall Space Flight Center and built by the Chrysler Corporation at Michoud Assembly Facility (MAF), the S-IB utilized the eight H-1 engines and each produced 200,000 pounds of thrust, a combined thrust of 1,600,000 pounds.
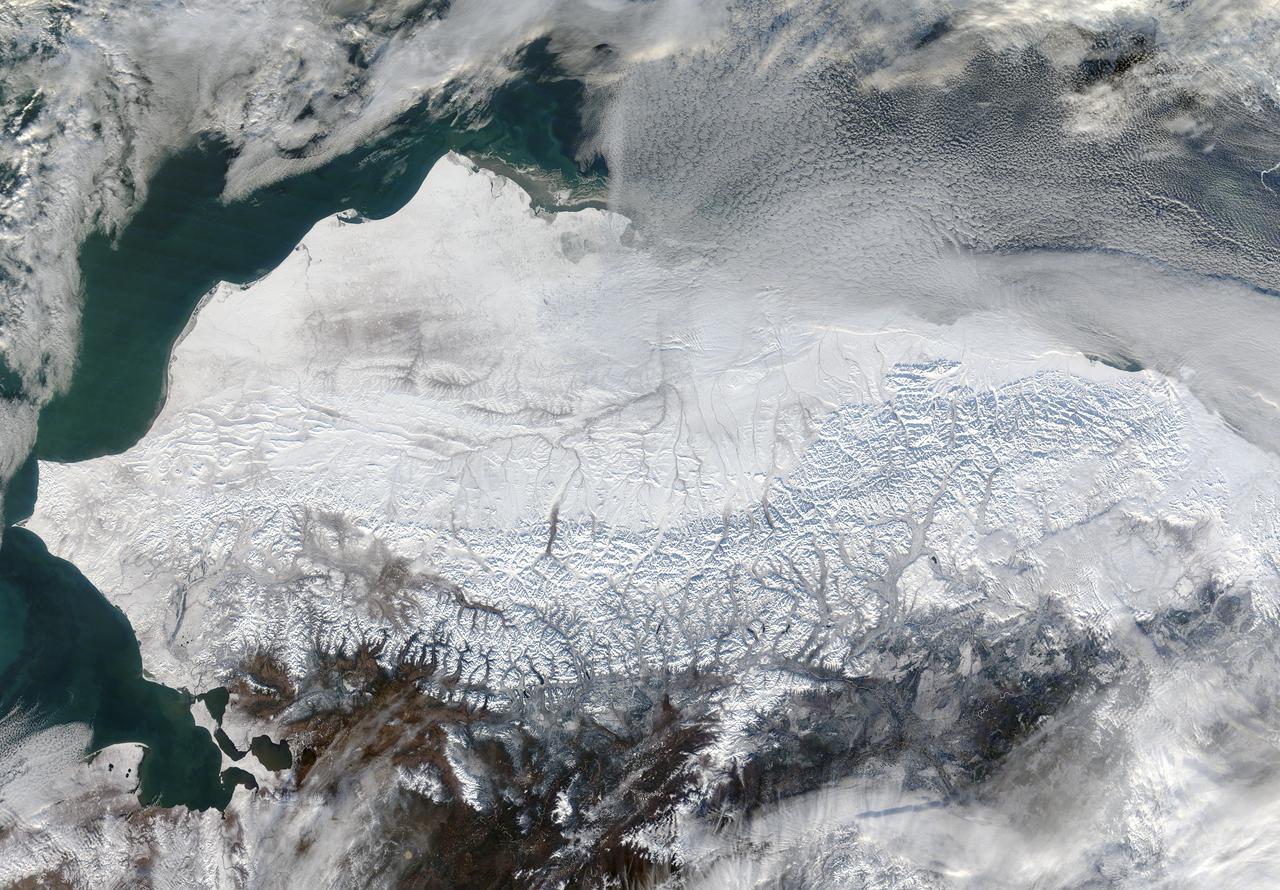
As autumn colors moved across much of the lower forty-eight states in mid-October 2015, winter weather had already arrived in Alaska. The Moderate Resolution Imaging Spectroradiometer (MODIS) aboard NASA’s Terra satellite captured this true-color image of the icy scene on October 16 as it passed over the region. Point Barrow, the northern-most location in the United States sits between the Chukchi Sea (west) and the Beaufort Sea on the east. The rugged peaks of the Brooks Range can be seen along the southern section of the image. North of the Brooks Range the land is almost entirely covered with snow; to the south the tan and browns visible between snow marks uncovered land. Sea ice lies over the waters near the coasts of much of Alaska’s North Slope, especially east of Point Barrow. White cloud banks are notable in the northeast and southeast sections of the image. Credit: NASA/GSFC/Jeff Schmaltz/MODIS Land Rapid Response Team <b><a href="http://www.nasa.gov/audience/formedia/features/MP_Photo_Guidelines.html" rel="nofollow">NASA image use policy.</a></b> <b><a href="http://www.nasa.gov/centers/goddard/home/index.html" rel="nofollow">NASA Goddard Space Flight Center</a></b> enables NASA’s mission through four scientific endeavors: Earth Science, Heliophysics, Solar System Exploration, and Astrophysics. Goddard plays a leading role in NASA’s accomplishments by contributing compelling scientific knowledge to advance the Agency’s mission. <b>Follow us on <a href="http://twitter.com/NASAGoddardPix" rel="nofollow">Twitter</a></b> <b>Like us on <a href="http://www.facebook.com/pages/Greenbelt-MD/NASA-Goddard/395013845897?ref=tsd" rel="nofollow">Facebook</a></b> <b>Find us on <a href="http://instagrid.me/nasagoddard/?vm=grid" rel="nofollow">Instagram</a></b>

The Visible Infrared Imaging Radiometer Suite (VIIRS) on the Suomi NPP satellite captured this view of extensive sea-ice fracturing off the northern coast of Alaska. The event began in late-January and spread west toward Banks Island throughout February and March 2013. Visualizations of the Arctic often give the impression that the ice cap is a continuous sheet of stationary, floating ice. In fact, it is a collection of smaller pieces that constantly shift, crack, and grind against one another as they are jostled by winds and ocean currents. Especially during the summer—but even during the height of winter—cracks—or leads—open up between pieces of ice. That was what was happening on the left side of the animation (seen here: <a href="http://bit.ly/10kE7sh" rel="nofollow">bit.ly/10kE7sh</a>) in late January. A high-pressure weather system was parked over the region, producing warmer temperatures and winds that flowed in a southwesterly direction. That fueled the Beaufort Gyre, a wind-driven ocean current that flows clockwise. The gyre was the key force pulling pieces of ice west past Point Barrow, the northern nub of Alaska that protrudes into the Beaufort Sea. “A fracturing event in this area is not unusual because the Beaufort Gyre tends to push ice away from Banks Island and the Canadian Archipelago,” explained Walt Meier of the National Snow & Ice Data Center (NSIDC). “Point Barrow can act like a ‘pin point’ where the ice catches and fractures to the north and east.” In February, however, a series of storms passing over central Alaska exacerbated the fracturing. Strong westerly winds prompted several large pieces of ice to break away in an arc-shaped wave that moved progressively east. By the end of February, large pieces of ice had fractured all the way to the western coast of Banks Island, a distance of about 1,000 kilometers (600 miles). The data used to create the animation came from the longwave infrared (thermal) portion of the electromagnetic spectrum, so the animation illustrates how much heat the surface was emitting as VIIRS surveyed the area. Cooler areas (sea ice) appear white, while warmer areas (open water) are dark. The light gray plume near the cracks is warmer, moister air escaping from the ocean and blowing downwind. Clouds do not show up well in the VIIRS thermal band, so the storms that fueled the fracturing are not readily visible. While fracturing events are common, few events sprawl across such a large area or produce cracks as long and wide as those seen here. The age of the sea ice in this area was one of the key reasons this event became so widespread. “The region is covered almost completely by seasonal or first-year ice—ice that has formed since last September,” said Meier. “This ice is thinner and weaker than the older, multi-year ice, so it responds more readily to winds and is more easily broken up.” NASA Earth Observatory images by Jesse Allen using VIIRS day-night band data from the Suomi National Polar-orbiting Partnership. Suomi NPP is the result of a partnership between NASA, the National Oceanic and Atmospheric Administration, and the Department of Defense. Caption by Adam Voiland. Instrument: Suomi NPP - VIIRS For more info go to: <a href="http://earthobservatory.nasa.gov/IOTD/view.php?id=80752" rel="nofollow">earthobservatory.nasa.gov/IOTD/view.php?id=80752</a> Credit: <b><a href="http://www.earthobservatory.nasa.gov/" rel="nofollow"> NASA Earth Observatory</a></b> <b><a href="http://www.nasa.gov/audience/formedia/features/MP_Photo_Guidelines.html" rel="nofollow">NASA image use policy.</a></b> <b><a href="http://www.nasa.gov/centers/goddard/home/index.html" rel="nofollow">NASA Goddard Space Flight Center</a></b> enables NASA’s mission through four scientific endeavors: Earth Science, Heliophysics, Solar System Exploration, and Astrophysics. Goddard plays a leading role in NASA’s accomplishments by contributing compelling scientific knowledge to advance the Agency’s mission. <b>Follow us on <a href="http://twitter.com/NASA_GoddardPix" rel="nofollow">Twitter</a></b> <b>Like us on <a href="http://www.facebook.com/pages/Greenbelt-MD/NASA-Goddard/395013845897?ref=tsd" rel="nofollow">Facebook</a></b> <b>Find us on <a href="http://instagram.com/nasagoddard?vm=grid" rel="nofollow">Instagram</a></b>

The Visible Infrared Imaging Radiometer Suite (VIIRS) on the Suomi NPP satellite captured this view of extensive sea-ice fracturing off the northern coast of Alaska. The event began in late-January and spread west toward Banks Island throughout February and March 2013. Visualizations of the Arctic often give the impression that the ice cap is a continuous sheet of stationary, floating ice. In fact, it is a collection of smaller pieces that constantly shift, crack, and grind against one another as they are jostled by winds and ocean currents. Especially during the summer—but even during the height of winter—cracks—or leads—open up between pieces of ice. That was what was happening on the left side of the animation (seen here: <a href="http://bit.ly/10kE7sh" rel="nofollow">bit.ly/10kE7sh</a>) in late January. A high-pressure weather system was parked over the region, producing warmer temperatures and winds that flowed in a southwesterly direction. That fueled the Beaufort Gyre, a wind-driven ocean current that flows clockwise. The gyre was the key force pulling pieces of ice west past Point Barrow, the northern nub of Alaska that protrudes into the Beaufort Sea. “A fracturing event in this area is not unusual because the Beaufort Gyre tends to push ice away from Banks Island and the Canadian Archipelago,” explained Walt Meier of the National Snow & Ice Data Center (NSIDC). “Point Barrow can act like a ‘pin point’ where the ice catches and fractures to the north and east.” In February, however, a series of storms passing over central Alaska exacerbated the fracturing. Strong westerly winds prompted several large pieces of ice to break away in an arc-shaped wave that moved progressively east. By the end of February, large pieces of ice had fractured all the way to the western coast of Banks Island, a distance of about 1,000 kilometers (600 miles). The data used to create the animation came from the longwave infrared (thermal) portion of the electromagnetic spectrum, so the animation illustrates how much heat the surface was emitting as VIIRS surveyed the area. Cooler areas (sea ice) appear white, while warmer areas (open water) are dark. The light gray plume near the cracks is warmer, moister air escaping from the ocean and blowing downwind. Clouds do not show up well in the VIIRS thermal band, so the storms that fueled the fracturing are not readily visible. While fracturing events are common, few events sprawl across such a large area or produce cracks as long and wide as those seen here. The age of the sea ice in this area was one of the key reasons this event became so widespread. “The region is covered almost completely by seasonal or first-year ice—ice that has formed since last September,” said Meier. “This ice is thinner and weaker than the older, multi-year ice, so it responds more readily to winds and is more easily broken up.” NASA Earth Observatory images by Jesse Allen using VIIRS day-night band data from the Suomi National Polar-orbiting Partnership. Suomi NPP is the result of a partnership between NASA, the National Oceanic and Atmospheric Administration, and the Department of Defense. Caption by Adam Voiland. Instrument: Suomi NPP - VIIRS For more info go to: <a href="http://earthobservatory.nasa.gov/IOTD/view.php?id=80752" rel="nofollow">earthobservatory.nasa.gov/IOTD/view.php?id=80752</a> Credit: <b><a href="http://www.earthobservatory.nasa.gov/" rel="nofollow"> NASA Earth Observatory</a></b> <b><a href="http://www.nasa.gov/audience/formedia/features/MP_Photo_Guidelines.html" rel="nofollow">NASA image use policy.</a></b> <b><a href="http://www.nasa.gov/centers/goddard/home/index.html" rel="nofollow">NASA Goddard Space Flight Center</a></b> enables NASA’s mission through four scientific endeavors: Earth Science, Heliophysics, Solar System Exploration, and Astrophysics. Goddard plays a leading role in NASA’s accomplishments by contributing compelling scientific knowledge to advance the Agency’s mission. <b>Follow us on <a href="http://twitter.com/NASA_GoddardPix" rel="nofollow">Twitter</a></b> <b>Like us on <a href="http://www.facebook.com/pages/Greenbelt-MD/NASA-Goddard/395013845897?ref=tsd" rel="nofollow">Facebook</a></b> <b>Find us on <a href="http://instagram.com/nasagoddard?vm=grid" rel="nofollow">Instagram</a></b>

The Visible Infrared Imaging Radiometer Suite (VIIRS) on the Suomi NPP satellite captured this view of extensive sea-ice fracturing off the northern coast of Alaska. The event began in late-January and spread west toward Banks Island throughout February and March 2013. Visualizations of the Arctic often give the impression that the ice cap is a continuous sheet of stationary, floating ice. In fact, it is a collection of smaller pieces that constantly shift, crack, and grind against one another as they are jostled by winds and ocean currents. Especially during the summer—but even during the height of winter—cracks—or leads—open up between pieces of ice. That was what was happening on the left side of the animation (seen here: <a href="http://bit.ly/10kE7sh" rel="nofollow">bit.ly/10kE7sh</a>) in late January. A high-pressure weather system was parked over the region, producing warmer temperatures and winds that flowed in a southwesterly direction. That fueled the Beaufort Gyre, a wind-driven ocean current that flows clockwise. The gyre was the key force pulling pieces of ice west past Point Barrow, the northern nub of Alaska that protrudes into the Beaufort Sea. “A fracturing event in this area is not unusual because the Beaufort Gyre tends to push ice away from Banks Island and the Canadian Archipelago,” explained Walt Meier of the National Snow & Ice Data Center (NSIDC). “Point Barrow can act like a ‘pin point’ where the ice catches and fractures to the north and east.” In February, however, a series of storms passing over central Alaska exacerbated the fracturing. Strong westerly winds prompted several large pieces of ice to break away in an arc-shaped wave that moved progressively east. By the end of February, large pieces of ice had fractured all the way to the western coast of Banks Island, a distance of about 1,000 kilometers (600 miles). The data used to create the animation came from the longwave infrared (thermal) portion of the electromagnetic spectrum, so the animation illustrates how much heat the surface was emitting as VIIRS surveyed the area. Cooler areas (sea ice) appear white, while warmer areas (open water) are dark. The light gray plume near the cracks is warmer, moister air escaping from the ocean and blowing downwind. Clouds do not show up well in the VIIRS thermal band, so the storms that fueled the fracturing are not readily visible. While fracturing events are common, few events sprawl across such a large area or produce cracks as long and wide as those seen here. The age of the sea ice in this area was one of the key reasons this event became so widespread. “The region is covered almost completely by seasonal or first-year ice—ice that has formed since last September,” said Meier. “This ice is thinner and weaker than the older, multi-year ice, so it responds more readily to winds and is more easily broken up.” NASA Earth Observatory images by Jesse Allen using VIIRS day-night band data from the Suomi National Polar-orbiting Partnership. Suomi NPP is the result of a partnership between NASA, the National Oceanic and Atmospheric Administration, and the Department of Defense. Caption by Adam Voiland. Instrument: Suomi NPP - VIIRS For more info go to: <a href="http://earthobservatory.nasa.gov/IOTD/view.php?id=80752" rel="nofollow">earthobservatory.nasa.gov/IOTD/view.php?id=80752</a> Credit: <b><a href="http://www.earthobservatory.nasa.gov/" rel="nofollow"> NASA Earth Observatory</a></b> <b><a href="http://www.nasa.gov/audience/formedia/features/MP_Photo_Guidelines.html" rel="nofollow">NASA image use policy.</a></b> <b><a href="http://www.nasa.gov/centers/goddard/home/index.html" rel="nofollow">NASA Goddard Space Flight Center</a></b> enables NASA’s mission through four scientific endeavors: Earth Science, Heliophysics, Solar System Exploration, and Astrophysics. Goddard plays a leading role in NASA’s accomplishments by contributing compelling scientific knowledge to advance the Agency’s mission. <b>Follow us on <a href="http://twitter.com/NASA_GoddardPix" rel="nofollow">Twitter</a></b> <b>Like us on <a href="http://www.facebook.com/pages/Greenbelt-MD/NASA-Goddard/395013845897?ref=tsd" rel="nofollow">Facebook</a></b> <b>Find us on <a href="http://instagram.com/nasagoddard?vm=grid" rel="nofollow">Instagram</a></b>