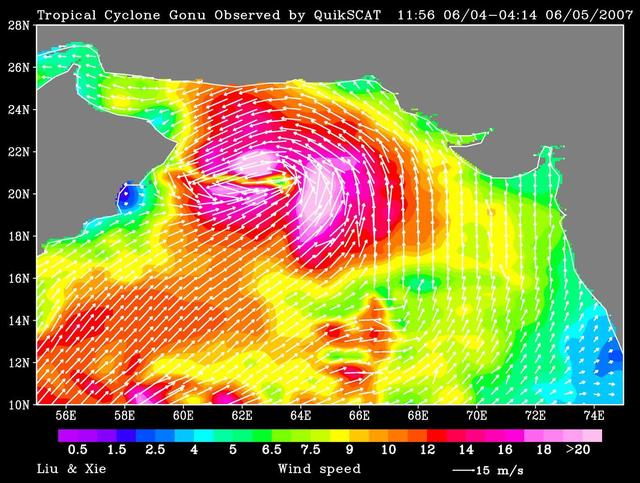
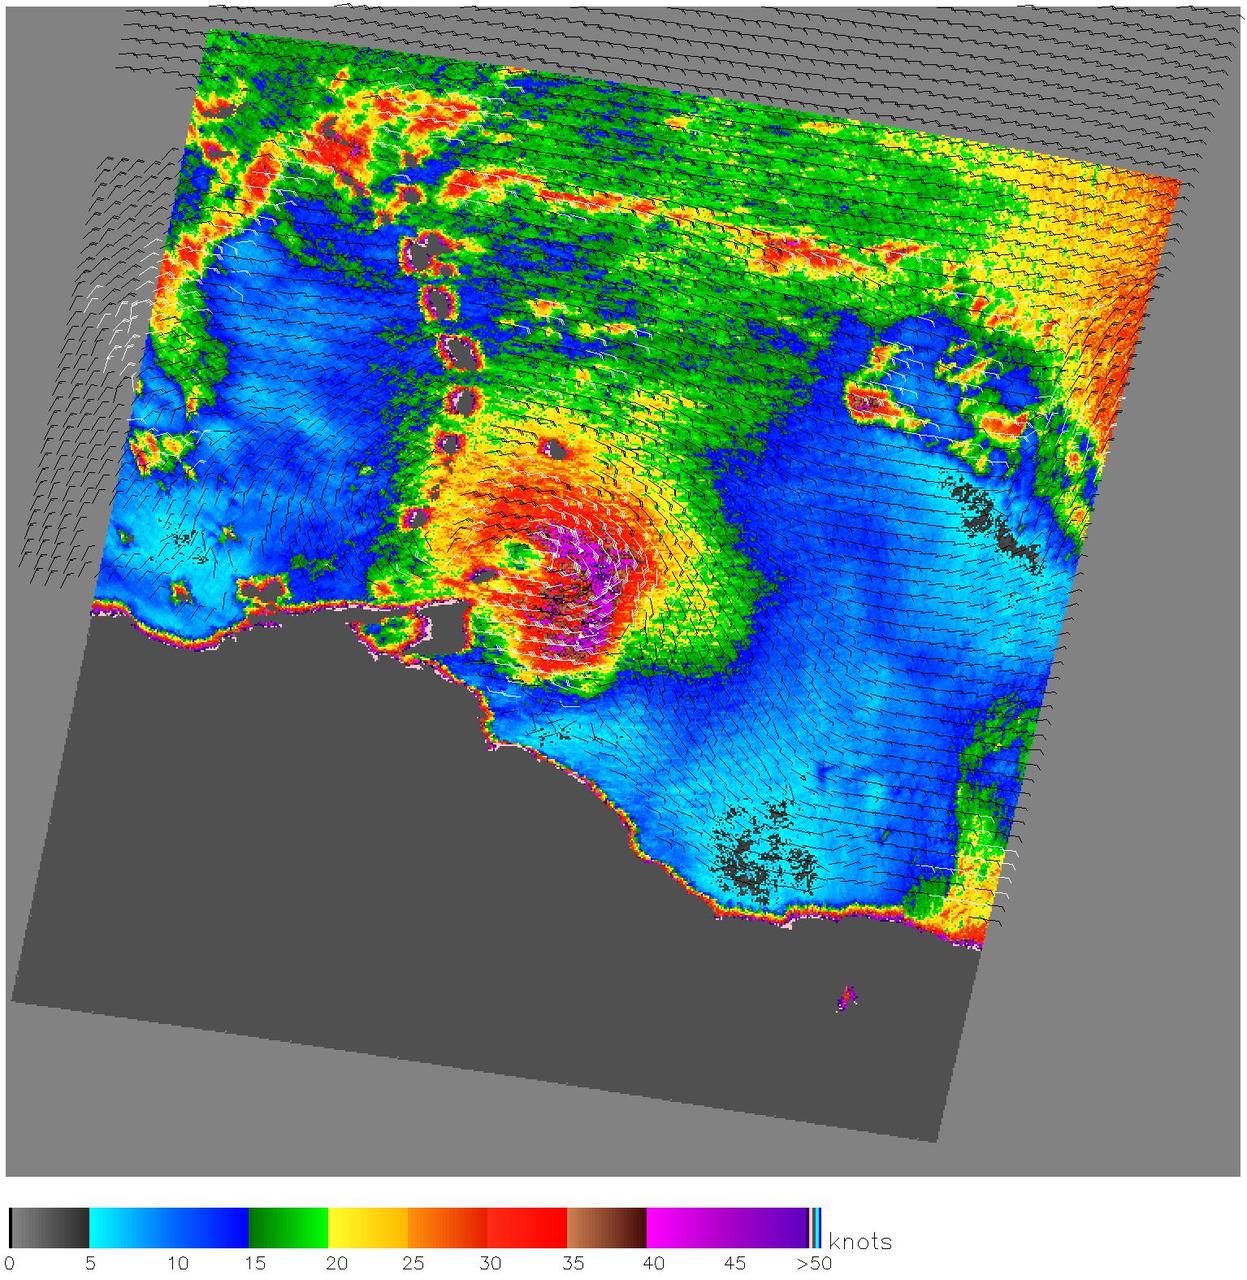
NASA QuikScat observed a rare tropical cyclone in the northern part of the Arabian Sea, threatening the petroleum shipping lanes and the Gulf States e.g. Oman that are unprepared for such an event.
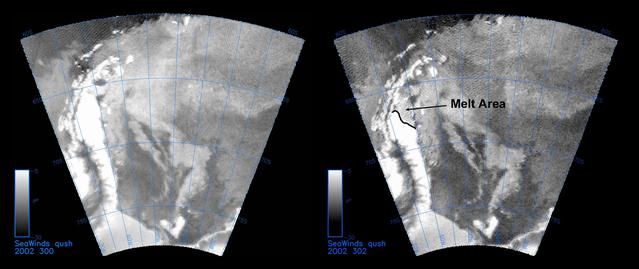
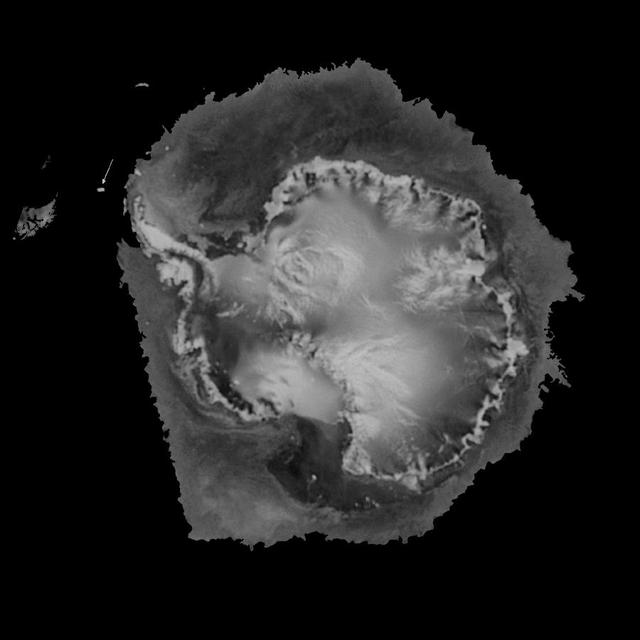
The SeaWinds instrument on NASA Quick Scatterometer QuikScat spacecraft captured these near-real-time backscatter images of melting on the Larsen C ice shelf in Antarctica Weddell Sea between October 27 left and October 29 right.
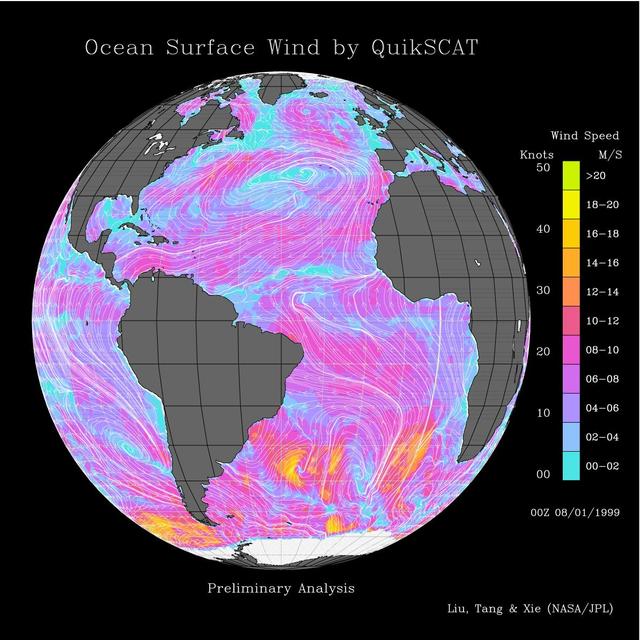
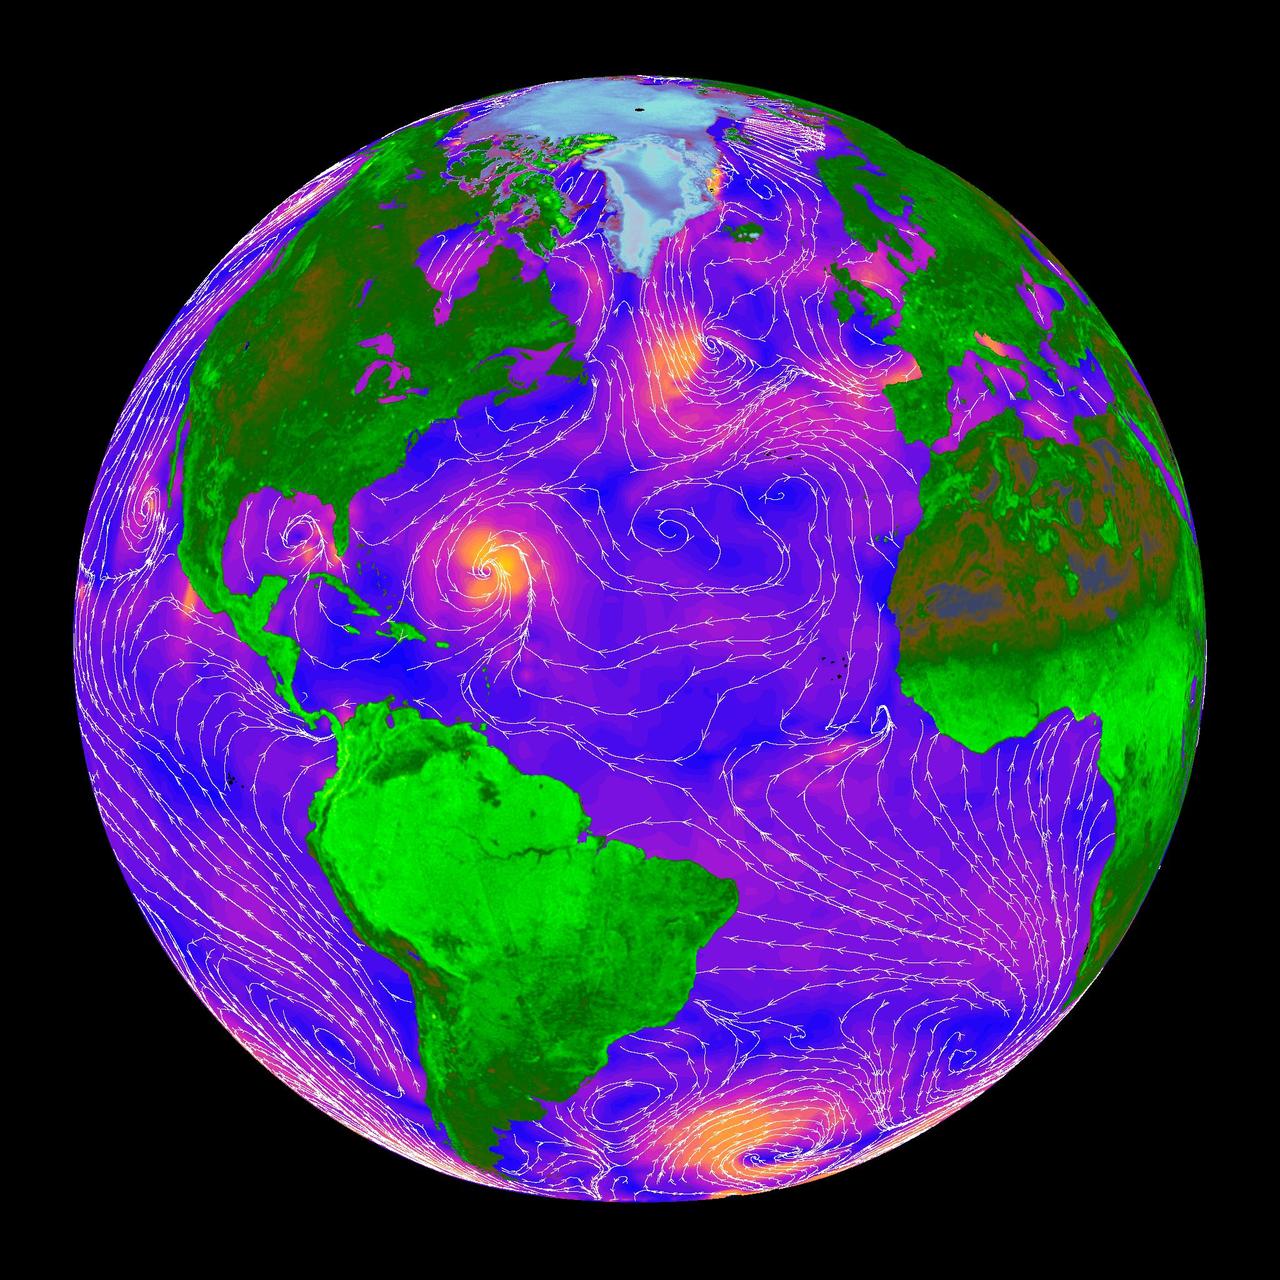
This image shows wind speeds and direction in the Atlantic Ocean on August 1, 1999, gathered by NASA Seawinds radar instrument flying onboard NASA QuikScat satellite.

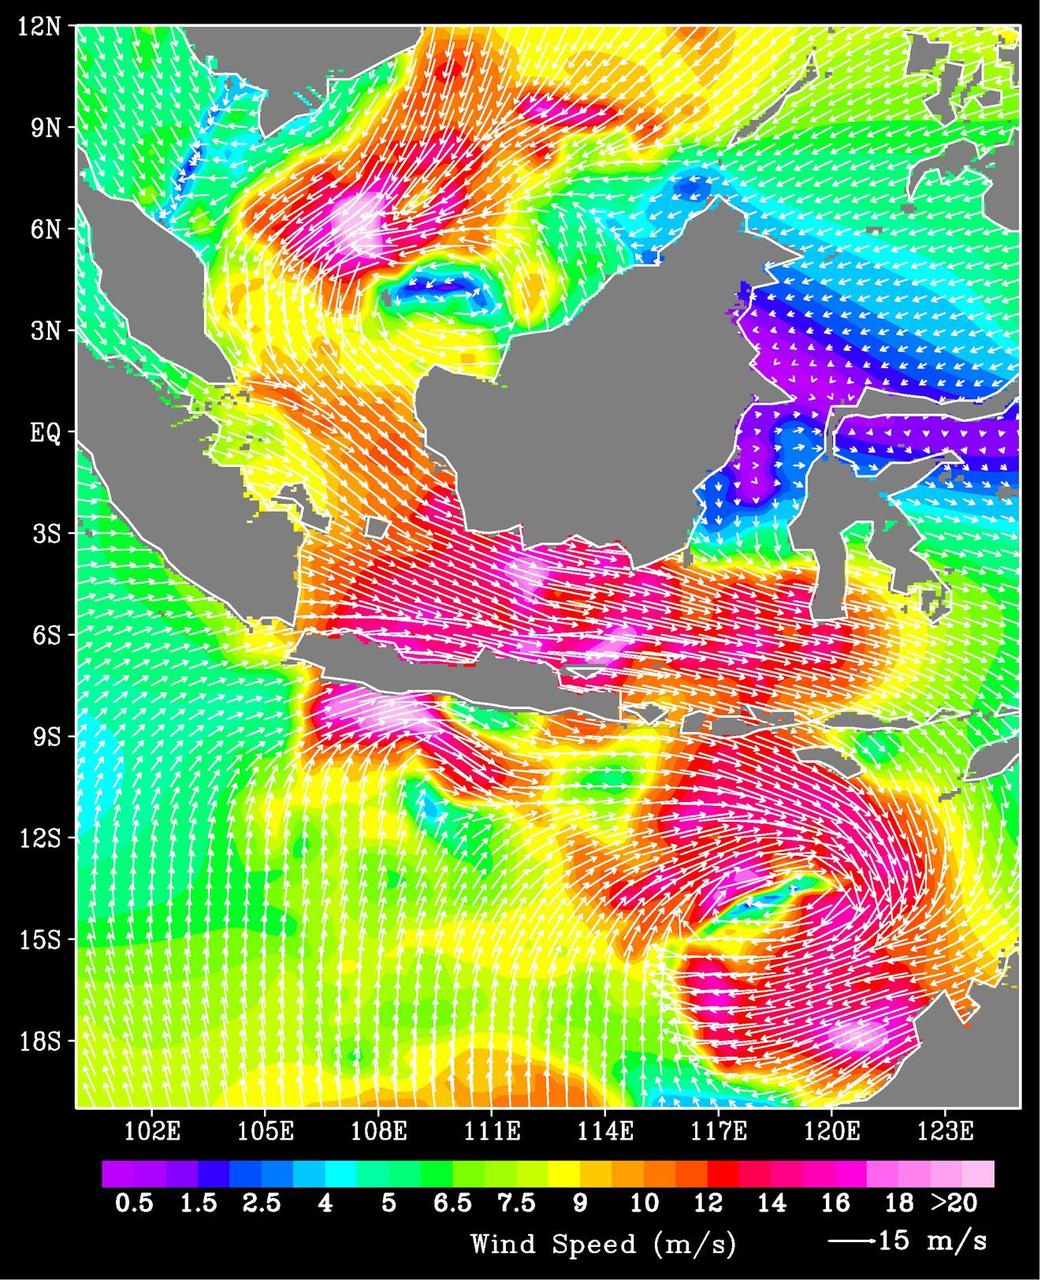
This image shows wind speeds and direction in the Pacific Ocean on August 1, 1999, gathered by NASA Seawinds radar instrument flying onboard NASA QuikScat satellite.
The scope and extent of the strong Santa Ana wind event in Southern California the week of Oct. 21, 2007, is visible in this image from NASA QuikScat satellite.
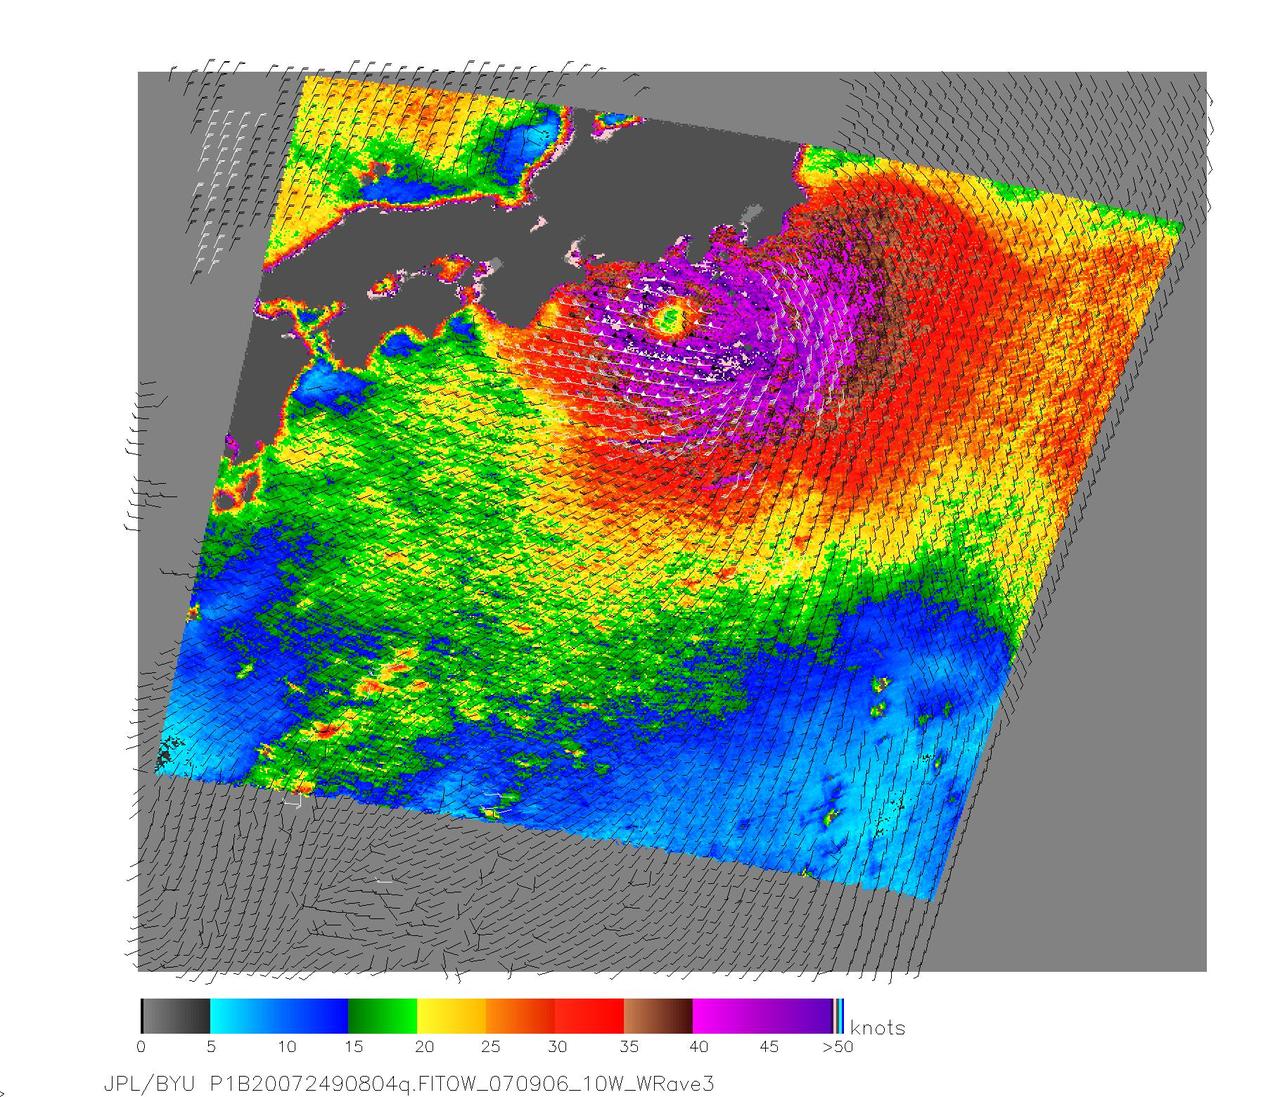
NASA QuikScat satellite acquired this image of Category One Typhoon Fitow on Sept. 6, 2007, prior to the storm making landfall in Japan.
When NASA Quick Scatterometer QuikScat captured this image on July 13, 2005, Emily was just a few hours away from becoming a hurricane.

The SeaWinds scatterometer aboard NASA QuikScat satellite collected the data used to create this colorful image of Cyclone Olaf churning in the South Pacific on February 16, 2005.
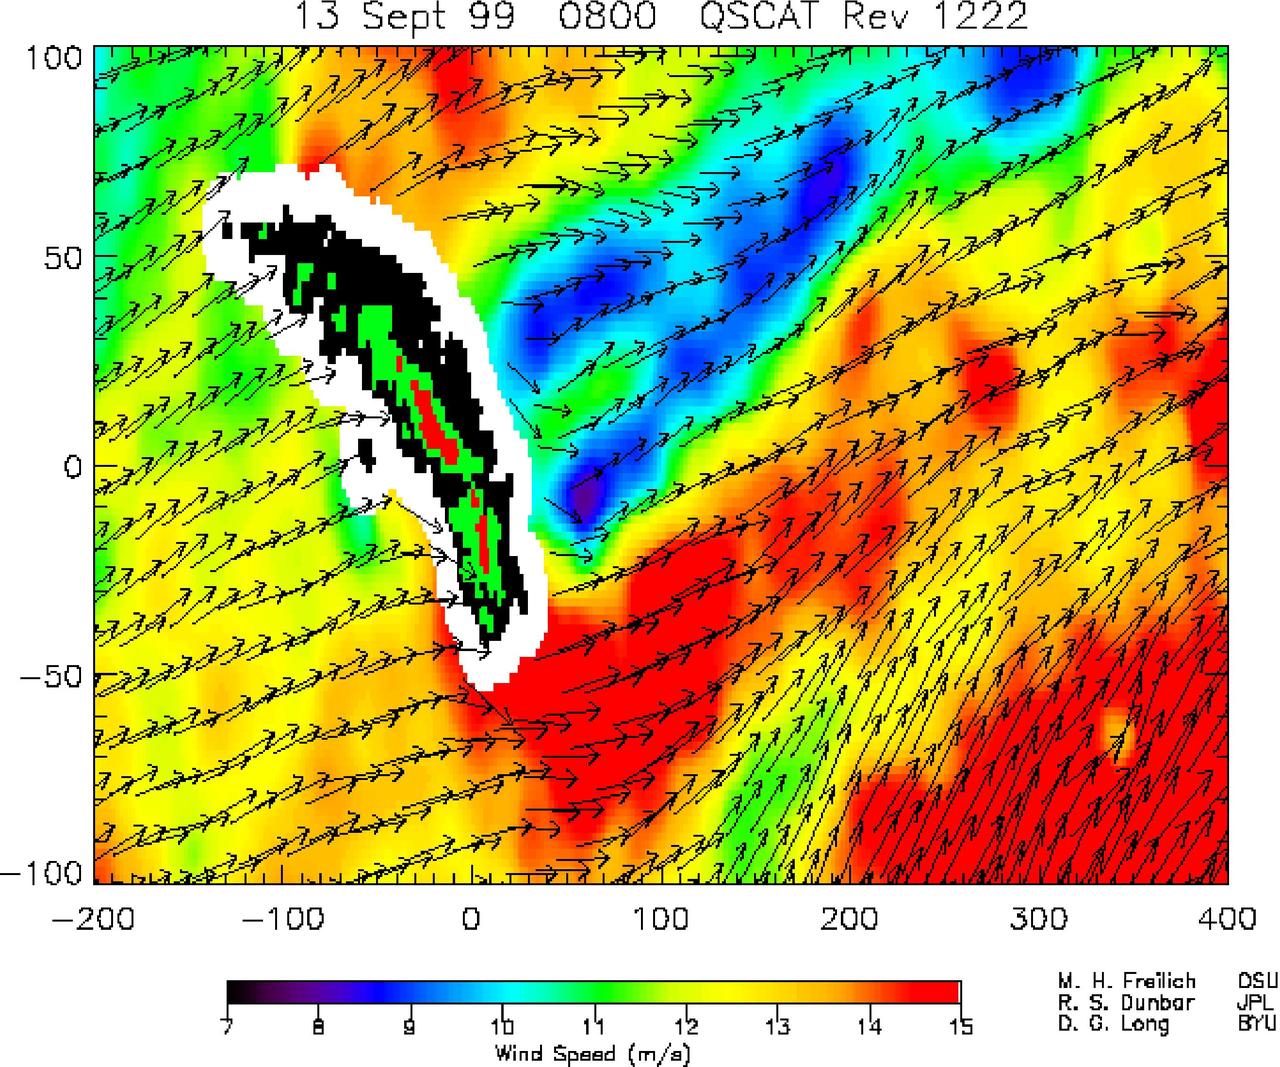
NASA SeaWinds instrument on the QuikScat satellite shows winds are blocked by an island mountain barrier on South Georgia Island, in the South Atlantic Ocean in the year 2000.
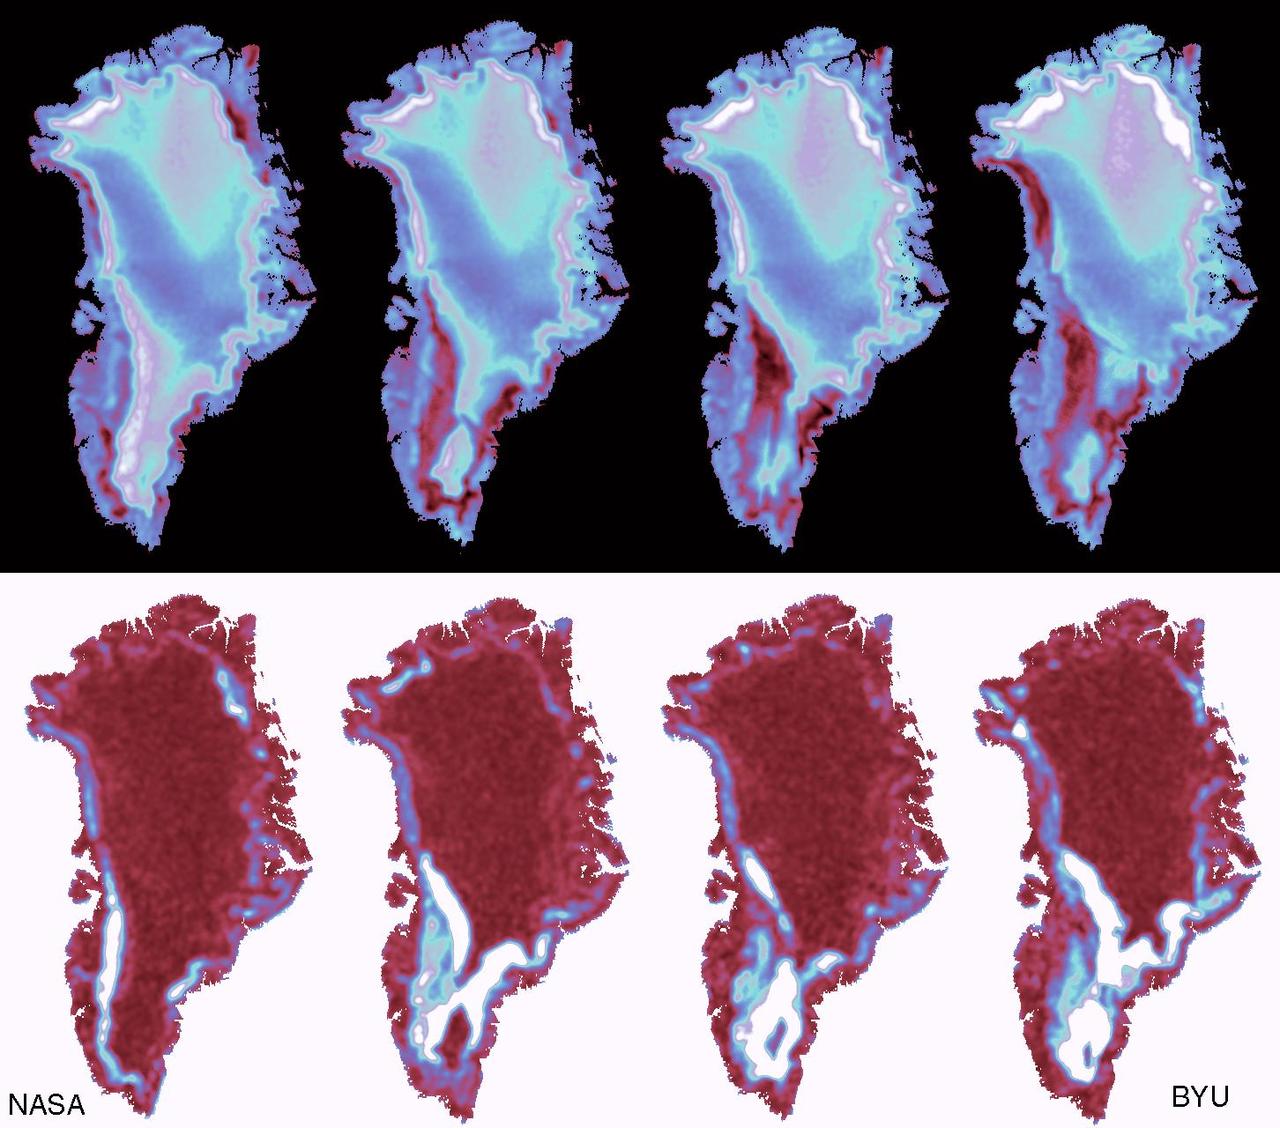
The frequent coverage provided by NASA SeaWinds instrument on the QuikScat satellite in 1999 provided unprecedented capability to monitor daily and seasonal changes in the key melt zones of Greenland.
Nearly the whole of the Gulf of Mexico was churning with the powerful winds and rains of Hurricane Katrina on August 28, 2005, when NASA QuikScat satellite captured this image.
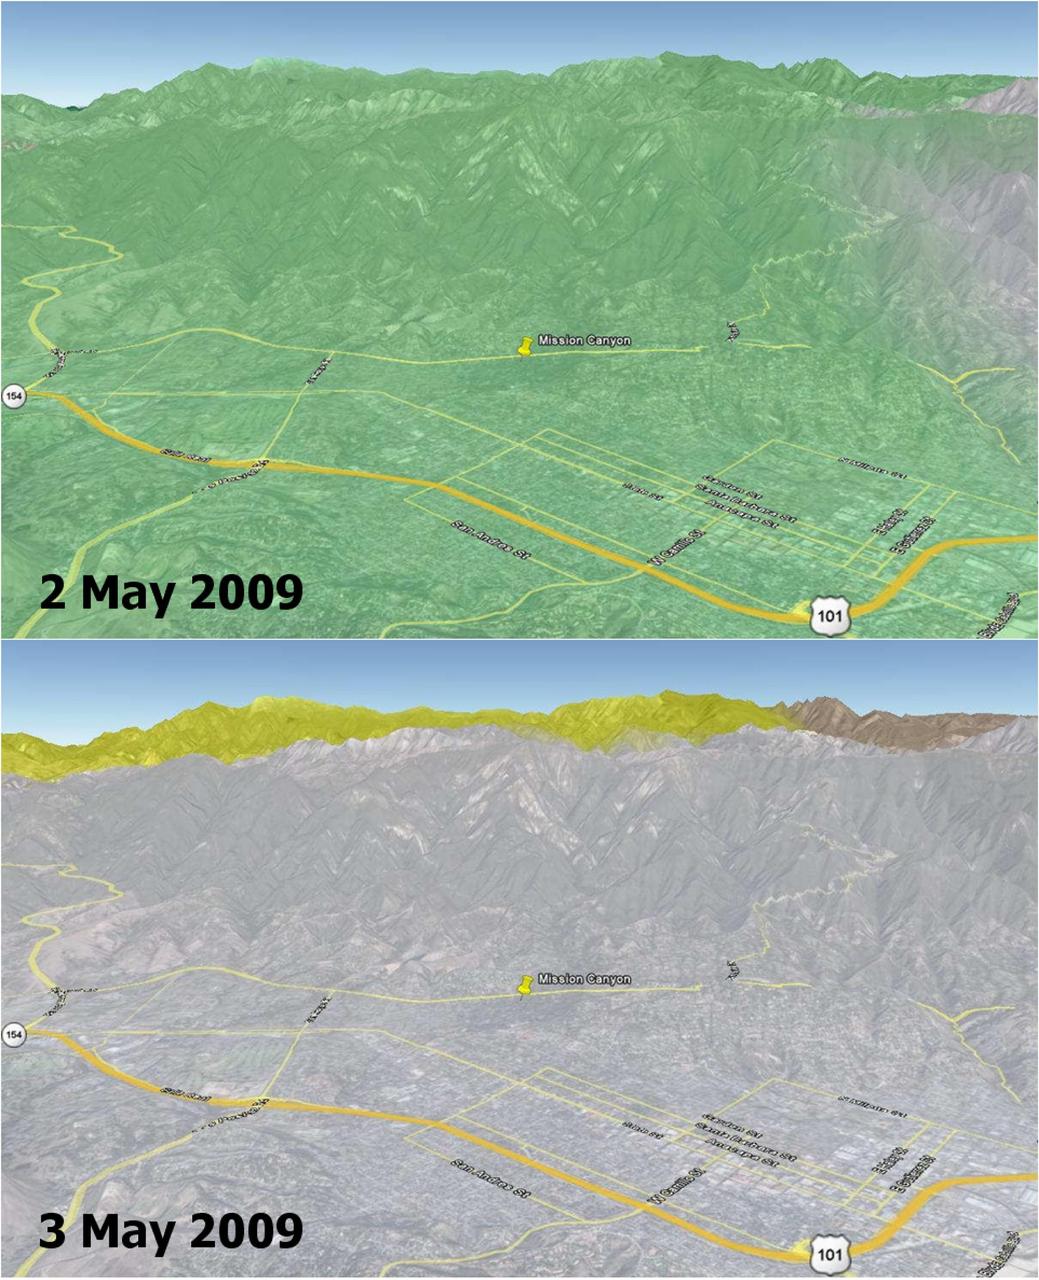
Wildfires are a recurring natural hazard faced by Californians. In Santa Barbara County, a wildfire, called the Jesusita fire, ignited on May 5, 2009 in the Cathedral Peak area northwest of Mission Canyon. As of midday May 8, the fire, which was 10-percent contained, had scorched 3,500 acres, damaged or destroyed 75 structures, and had forced the evacuation of tens of thousands of residents. This image shows soil moisture change in the top soil layer (2-inches deep) on 2 and 3 May 2009, as measured by the NASA QuikSCAT satellite scatterometer (radar). Rainwater increased the amount of moisture in the soil by a moderate 4 percent (represented by the green color) on May 2, which rapidly dried up on the next day (0 percent, as depicted by the grey color on May 3). Son Nghiem of JPL is leading a science team to develop wildfire applications using QuikScat data. “Information critical to assessing the conditions leading to wildfires can be obtained from NASA’s SeaWinds scatterometer, a stable and accurate radar aboard the QuikScat satellite,” says Dr. Son Nghiem, a JPL scientist in remote sensing. This is accomplished by using QuikScat data to map moisture changes in the topsoil. As such, QuikScat can detect rainwater that actually reaches the land surface and accumulates on it, rather than raindrops in the air. While rain radars may detect a significant rain rate, rainwater may evaporate in part before reaching the surface. For example, in the case of dry thunderstorm (known as virga), raindrops disappear on the way down, leaving the land dry, while the associated lightning ignites fires. For the case of the current fire in Santa Barbara, QuikScat detected a moderate increase of 4 percent in soil moisture on May 2, while rain radar data seemed to indicate a significant and extensive rain. The next day, QuikScat revealed that whatever rainwater that had accumulated earlier quickly dried up over the whole area. The maximum temperature in Santa Barbara approached 90 degrees Fahrenheit and broke the record set in 1984. An important characteristic of QuikScat measurements is that they represent the average conditions over the whole area, rather than some disparate data collected at a few localized points. The rapid dry-up in Santa Barbara together with high temperatures and high winds led to the devastating Jesusita fire. http://photojournal.jpl.nasa.gov/catalog/PIA12006

Typhoon Haitang is shown here churning steadily towards Taiwan and China. This image shows the storm swirling wind patterns as observed by NASA QuikScat satellite on July 14, 2005, at 19:19 UTC 14:19 Eastern Daylight Time.

The figure demonstrates of the capability of the SeaWinds instrument on NASA QuikScat satellite in monitoring both sea ice and ocean surface wind, thus helping to further our knowledge in wind-ice interaction and its effect on climate change.
This image, produced from data collected by the SeaWinds scatterometer instrument onboard NASA QuikScat mission reveals the details of the surface winds and rain in Typhoon Nanmadol as it moves westward.
The SeaWinds scatterometer on NASA QuikScat satellite makes global radar measurements day and night, in clear sky and through clouds. Greenland and the polar ice cap are shown here on September 20, 1999.
NASA QuikScat satellite instrument kept an eye on an iceberg the size of Rhode Island, the first time this space technology had been used to track a potential threat to international shipping.
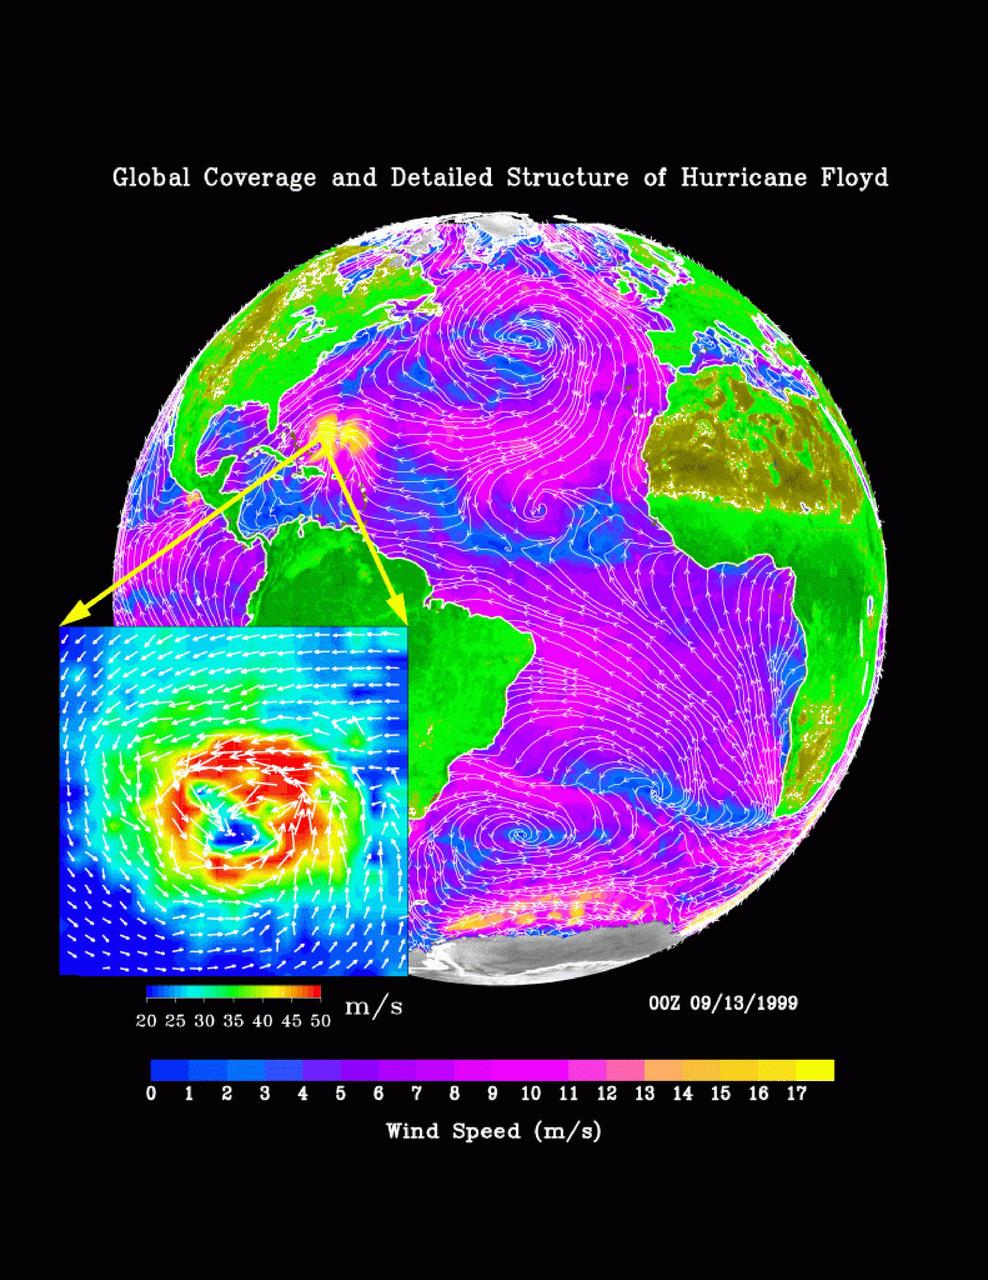
The distribution of ocean surface winds over the Atlantic Ocean, based on September 1999 data from NASA SeaWinds instrument on the QuikScat satellite, shows wind direction, superimposed on the color image indicating wind speed.
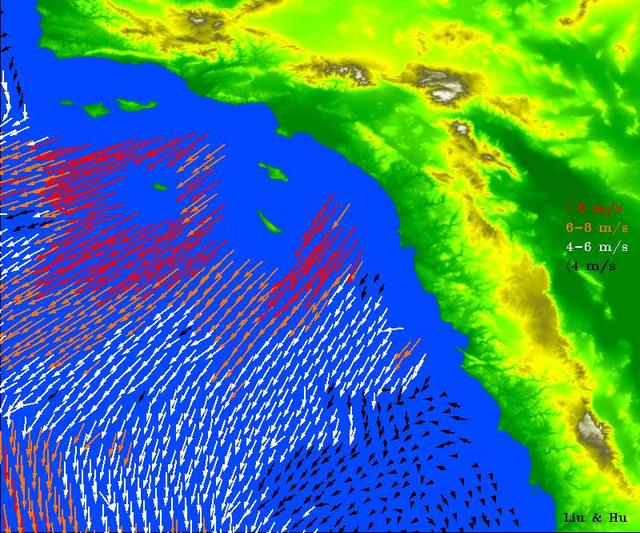
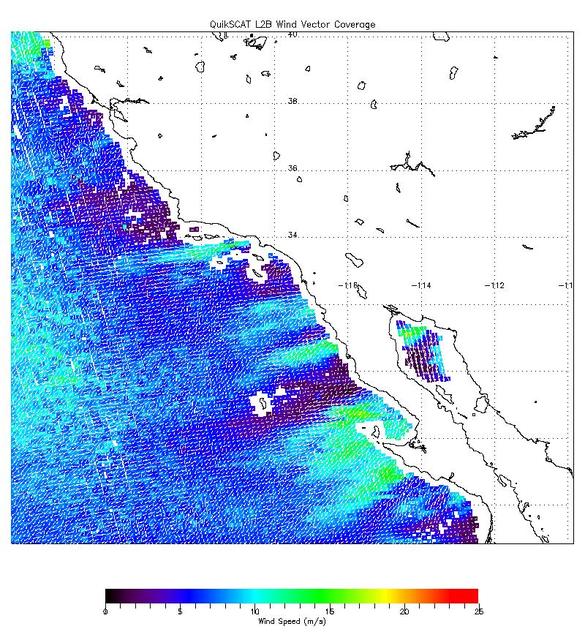
High-resolution ocean surface wind data from NASA's Quick Scatterometer (QuikScat) illustrate the strength of Santa Ana winds that pounded Southern California this week, causing damage and spreading brush fires. The colored arrows represent various ranges of wind speed, which were still well in excess of 30 knots (34 miles per hour), even after reaching the ocean and weakening. Santa Ana winds are offshore and down-slope winds unique to Southern California that are usually channeled through mountain gaps. These Santa Ana winds extend more than 500 kilometers (310 miles) offshore before changing direction to flow along the shore. The wind speeds and directions are retrieved from range-compressed backscatter data measured by QuikScat that has much higher spatial resolution than QuikScat's standard data products. Useful applications of high-resolution science-quality wind products derived from range-compressed backscatter have been demonstrated in two scientific papers: one on Hurricane Floyd and the other on Catalina Eddies. This is the first demonstration on near-real-time retrieval applications. http://photojournal.jpl.nasa.gov/catalog/PIA03892
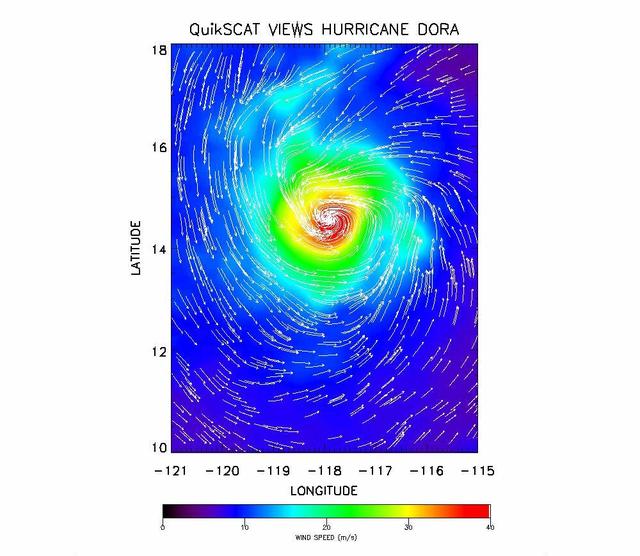
The SeaWinds instrument onboard NASA new QuikScat ocean-viewing satellite captured this image of Hurricane Dora in the eastern tropical Pacific Ocean on August 10, as it was blowing at speeds of nearly 40 meters per second 90 miles per hour.
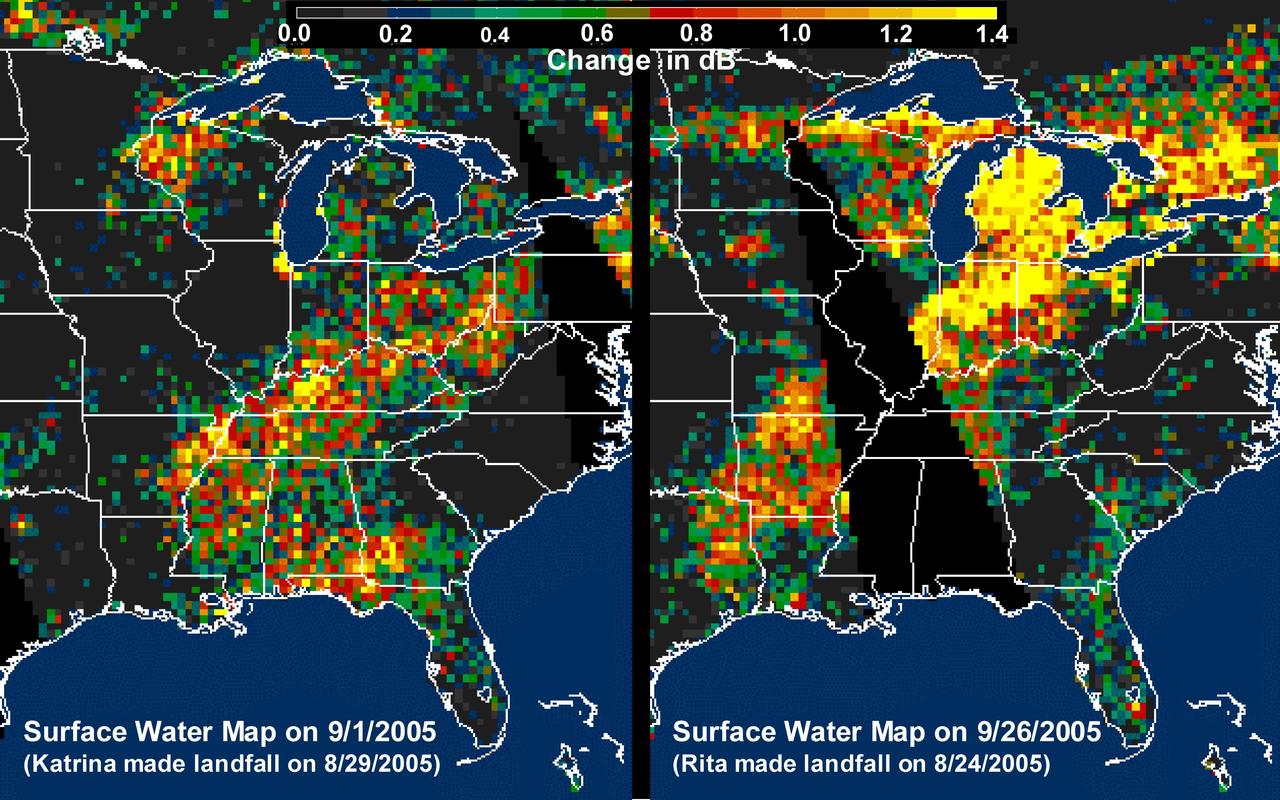
The above images, derived from NASA QuikScat satellite data, show the extensive pattern of rain water deposited by Hurricanes Katrina and Rita on land surfaces over several states in the southern and eastern United States. These results demonstrate the capability of satellite scatterometers to monitor changes in surface water on land. The color scale depicts increases in radar backscatter (in decibels) between the current measurement and the mean of measurements obtained during the previous two weeks. The backscatter can be calibrated to measure increases in surface soil moisture resulting from rainfall. The yellow color corresponds to an increase of approximately 10 percent or more in surface soil moisture according to the calibration site of Lonoke, Ark. The two hurricanes deposited excessive rainfall over extensive regions of the Mississippi River basin. Basins the size of the Mississippi can take up to several weeks before such excess rainfall significantly increases the amount of river discharge in large rivers such as the Mississippi. With hurricane season not over until November 30, the potential exists for significant flooding, particularly if new rain water is deposited by new hurricanes when river discharge peaks up as a result of previous rainfalls. River discharge should be closely monitored to account for this factor in evaluating potential flood conditions in the event of further hurricanes. http://photojournal.jpl.nasa.gov/catalog/PIA03029
A ferry carrying more than 600 passengers sank in the Java Sea between the island of Java and Borneo just before midnight on December 29, 2006, during high winds and rough seas.
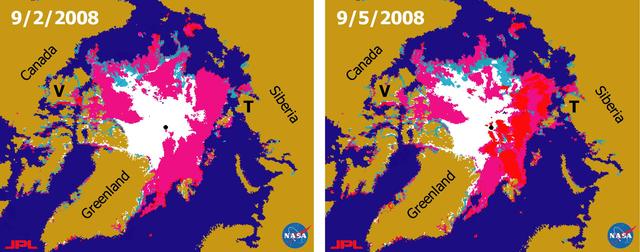
There has been considerable interest in the recent state of Arctic sea ice for scientific research and for operational applications especially along the Northern Sea Route and the Northwest Passage.
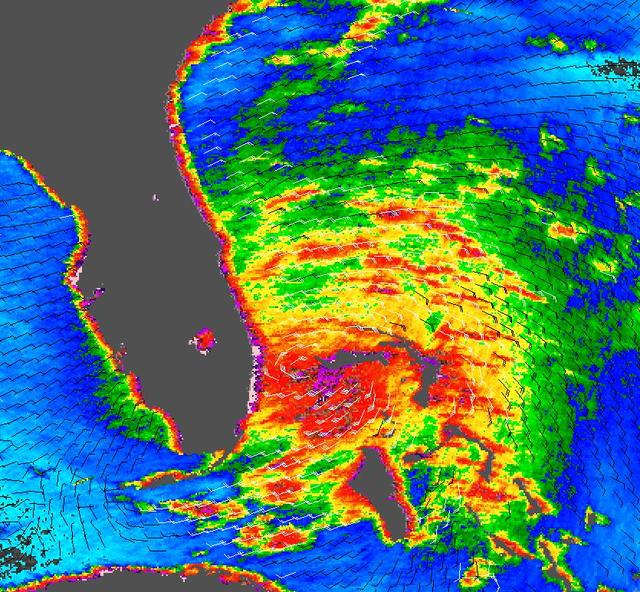
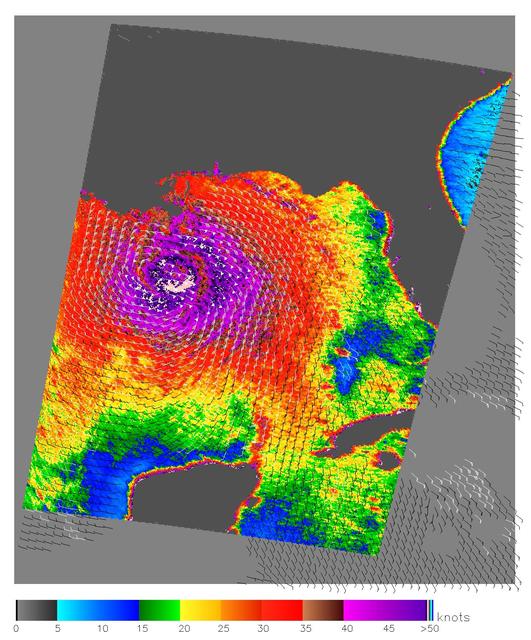
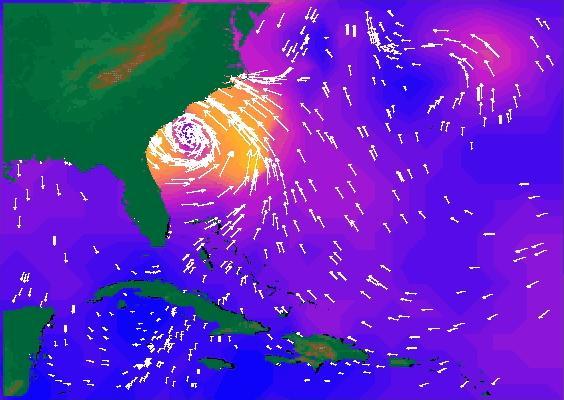
Tropical Storm Katrina is shown here as observed by NASA QuikScatsatellite on August 25, 2005, at 08:37 UTC 4:37 a.m. in Florida. At this time, the storm had 80 kilometers per hour 50 miles per hour; 43 knots sustained winds.
These two images show Hurricane Isabel as viewed by AIRS and SeaWinds scatterometers on NASA ADEOS-2 and QuikScat satellites in September, 2003. AIRS data are used to create global three-dimensional maps of temperature, humidity and clouds, while scatterometers measure surface wind speed and direction. http://photojournal.jpl.nasa.gov/catalog/PIA00429
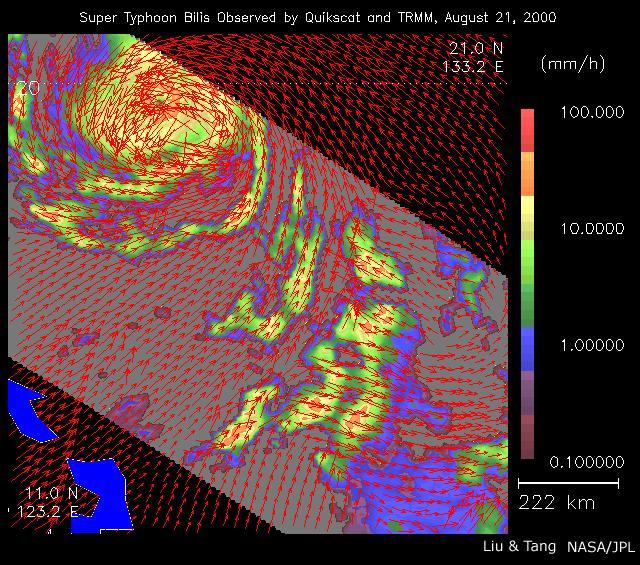
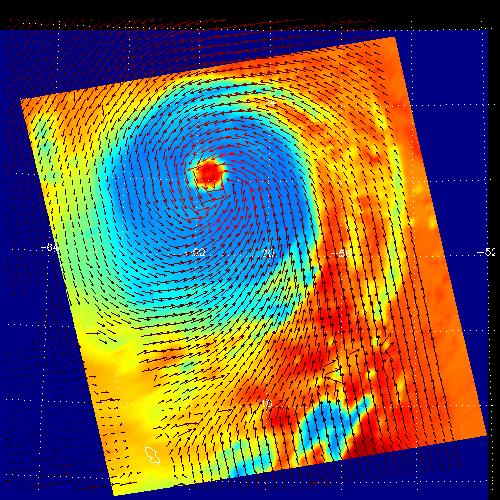
As super Typhoon Bilis, equal in strength to a category 5 hurricane, bore down on Taiwan, these images from August 21, 2000, show the massive storm most devastating components: rain and wind.
NASA SeaWinds radar instrument eyed the center of a massive hurricane -- Floyd -- as it ripped past Georgia and the Carolinas Wednesday afternoon, September 15, then marched toward a midnight strike at Cape Fear, North Carolina.
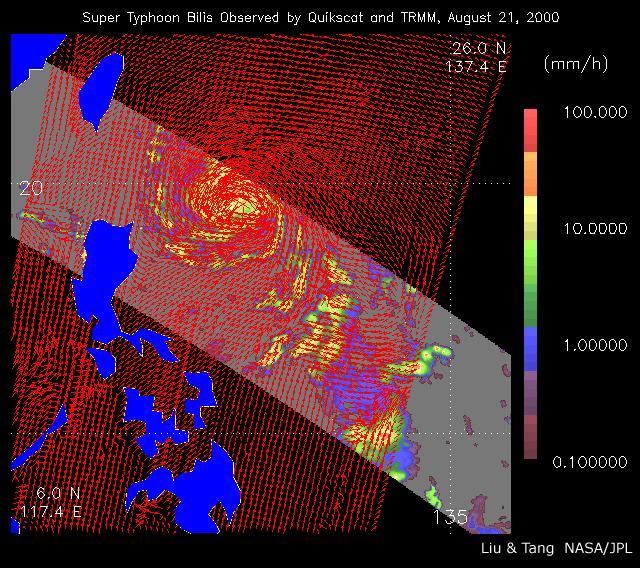
As super Typhoon Bilis, equal in strength to a category 5 hurricane, bore down on Taiwan, these images from August 21, 2000, show the massive storm most devastating components: rain and wind.
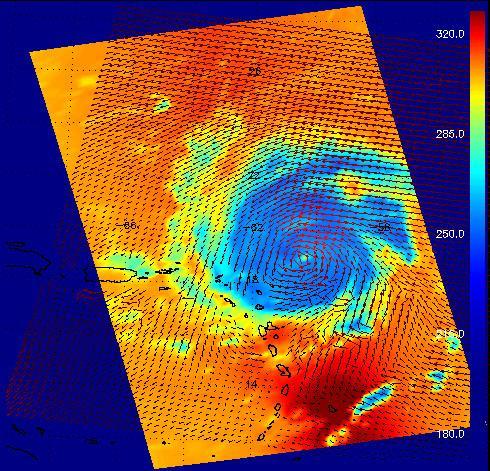
This image shows Hurricane Frances in August 2004 as captured by instruments onboard two different NASA satellites: the AIRS infrared instrument onboard Aqua, and the SeaWinds scatterometer onboard QuikSCAT. Both are JPL-managed instruments. AIRS data are used to create global three-dimensional maps of temperature, humidity and clouds, while scatterometers measure surface wind speed and direction over the ocean. The red vectors in the image show Frances' surface winds as measured by SeaWinds on QuikSCAT. The background colors show the temperature of clouds and surface as viewed in the infrared by AIRS, with cooler areas pushing to purple and warmer areas are pushing to red. The color scale on the right gives the temperatures in degrees Kelvin. (The top of the scale, 320 degrees Kelvin, corresponds to 117 degrees Fahrenheit, and the bottom, 180 degrees K is -135 degrees F.) The powerful circulation of this storm is evident from the combined data as well as the development of a clearly-defined central "eye." The infrared signal does not penetrate through clouds, so the light blue areas reveal the cold clouds tops associated with strong thunderstorms embedded within the storm. In cloud-free areas the infrared signal comes from Earth's surface, revealing warmer temperatures. http://photojournal.jpl.nasa.gov/catalog/PIA00435