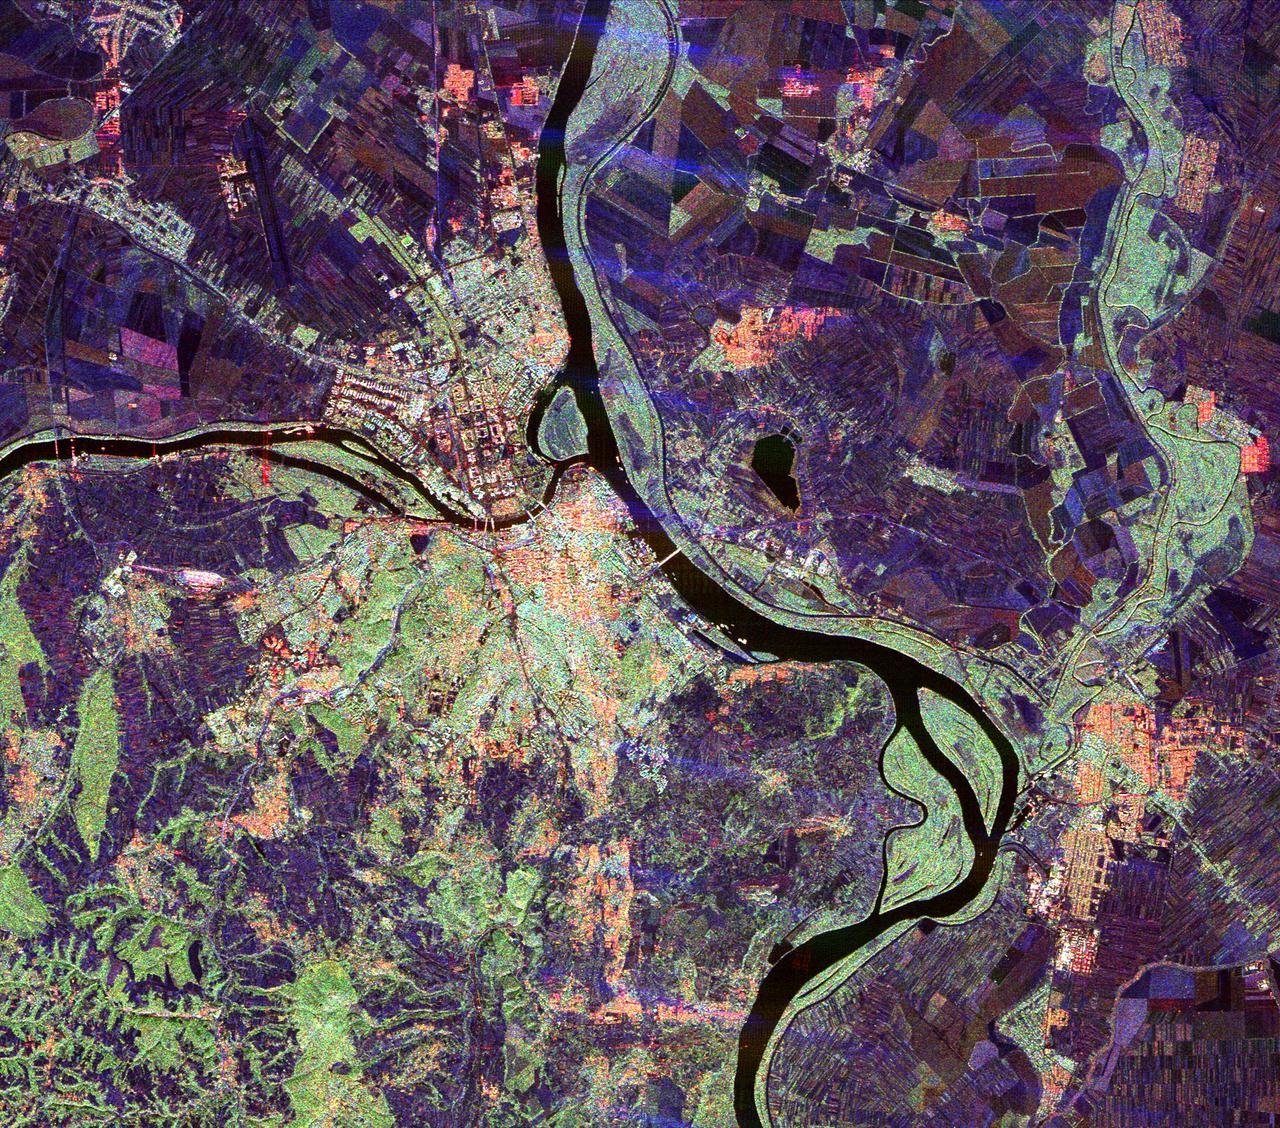
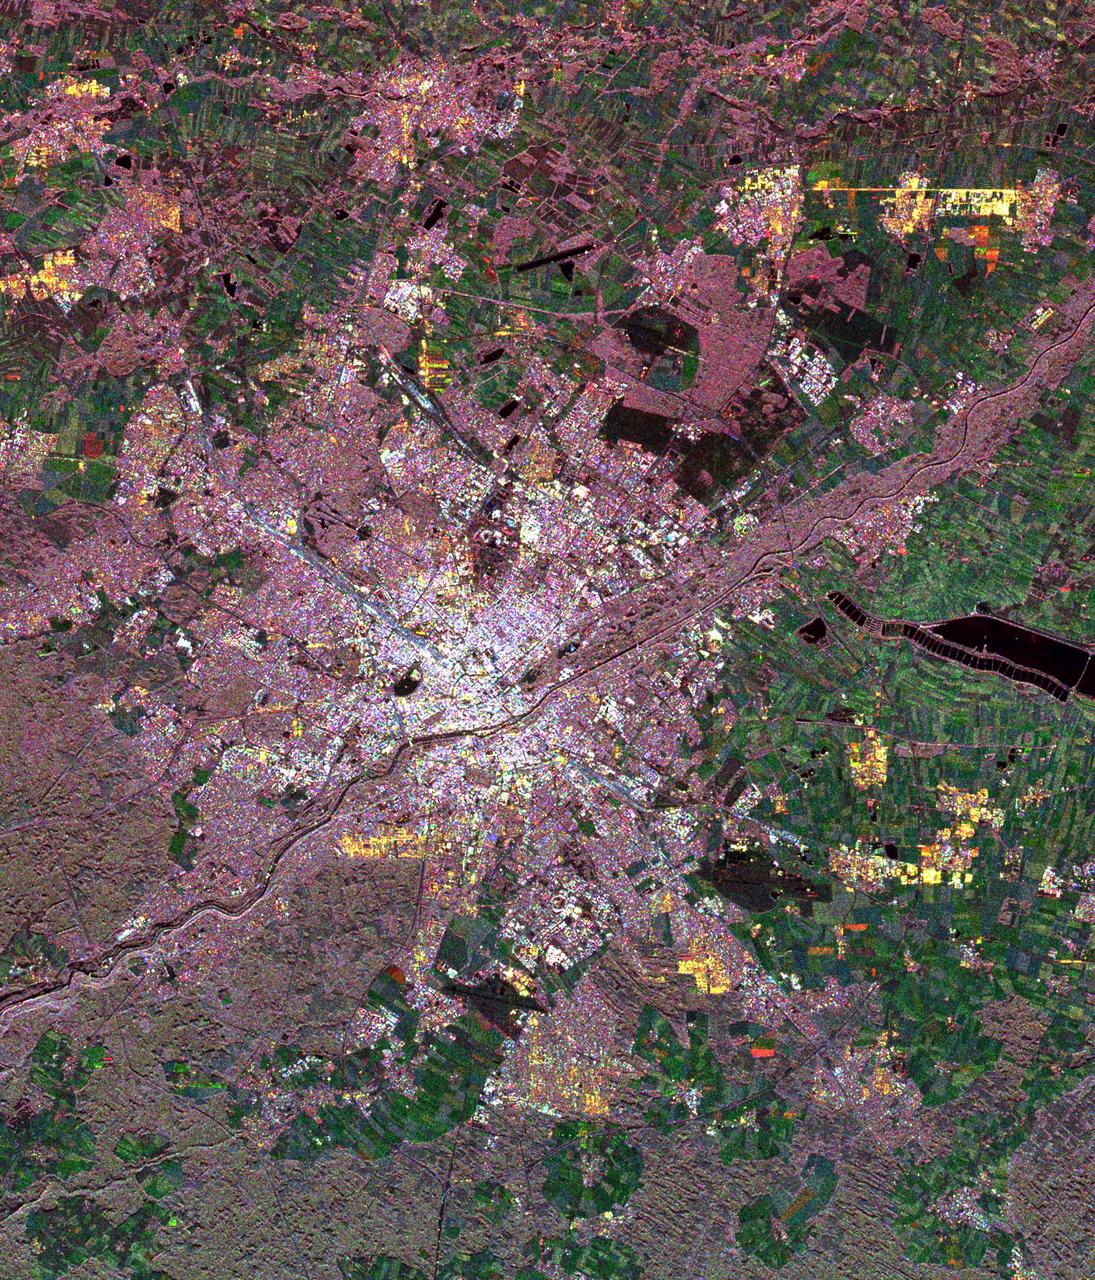
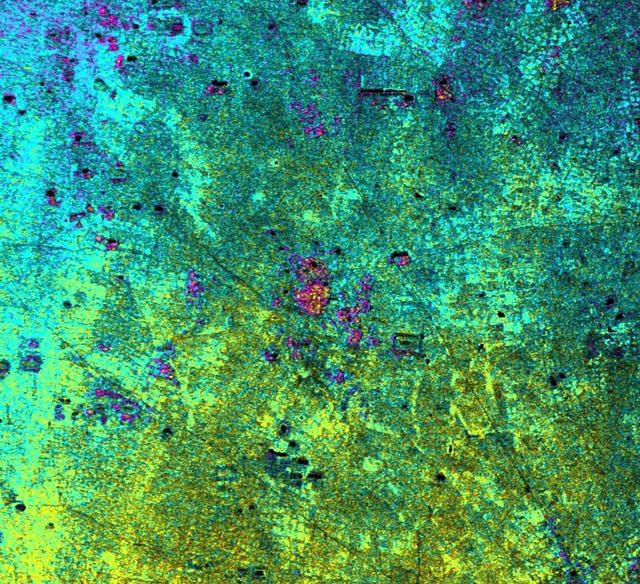
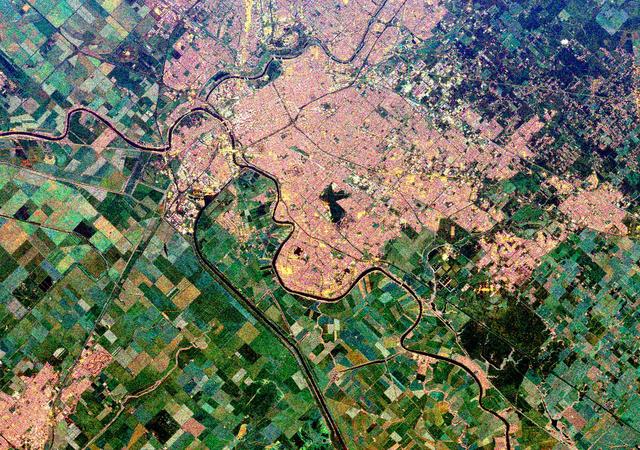
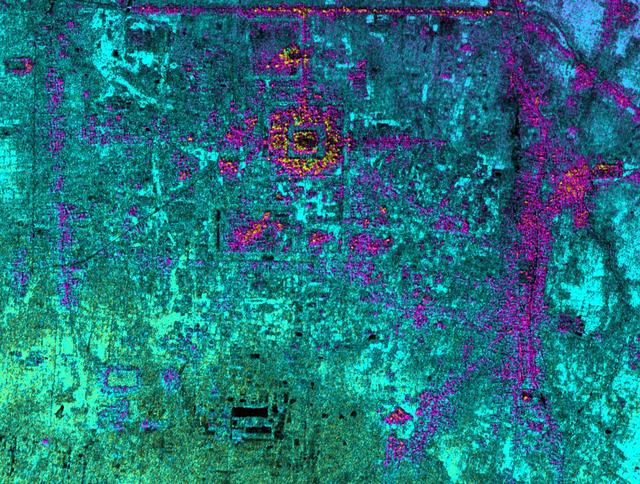
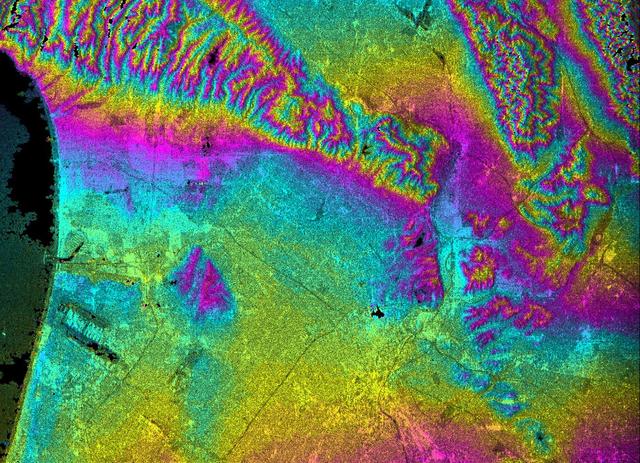
This spaceborne radar image of Belgrade, Serbia, illustrates the variety of land use patterns that can be observed with a multiple wavelength radar system.
Two radar images are shown in this composite to compare the size of a standard spaceborne radar image small inset to the image that is created when the radar instrument is used in the ScanSAR mode large image.
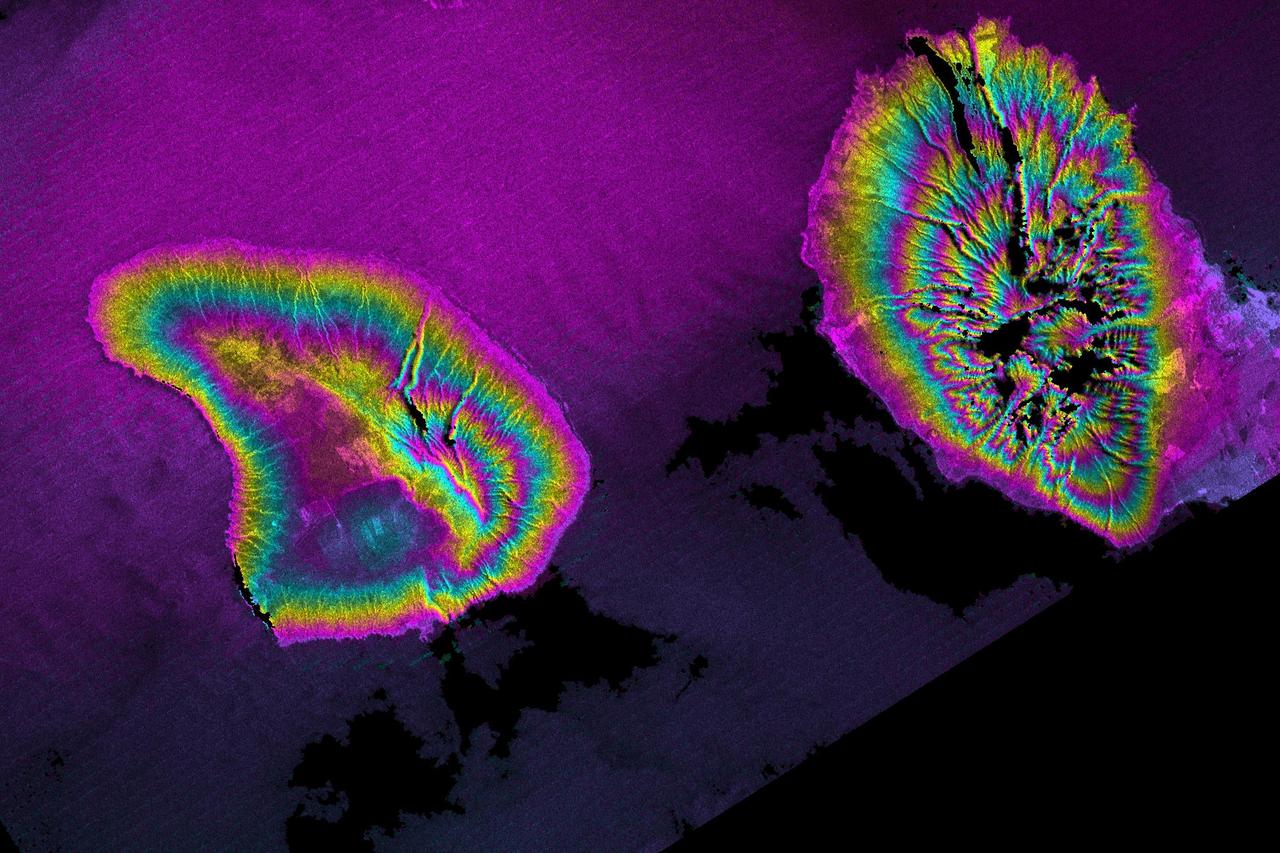
This is an image showing part of Isla Isabella in the western Galapagos Islands. It was taken by the L-band radar in HH polarization from the Spaceborne Imaging Radar C/X-Band Synthetic Aperture Radar on the 40th orbit of NASA’s space shuttle Endeavour.
The objective of NASA Shuttle Imaging Radar A SIR-A was to observe the Earth by use of radar imagery, acquire and transmit data of different geologic regions. This is a view of China in 2000.
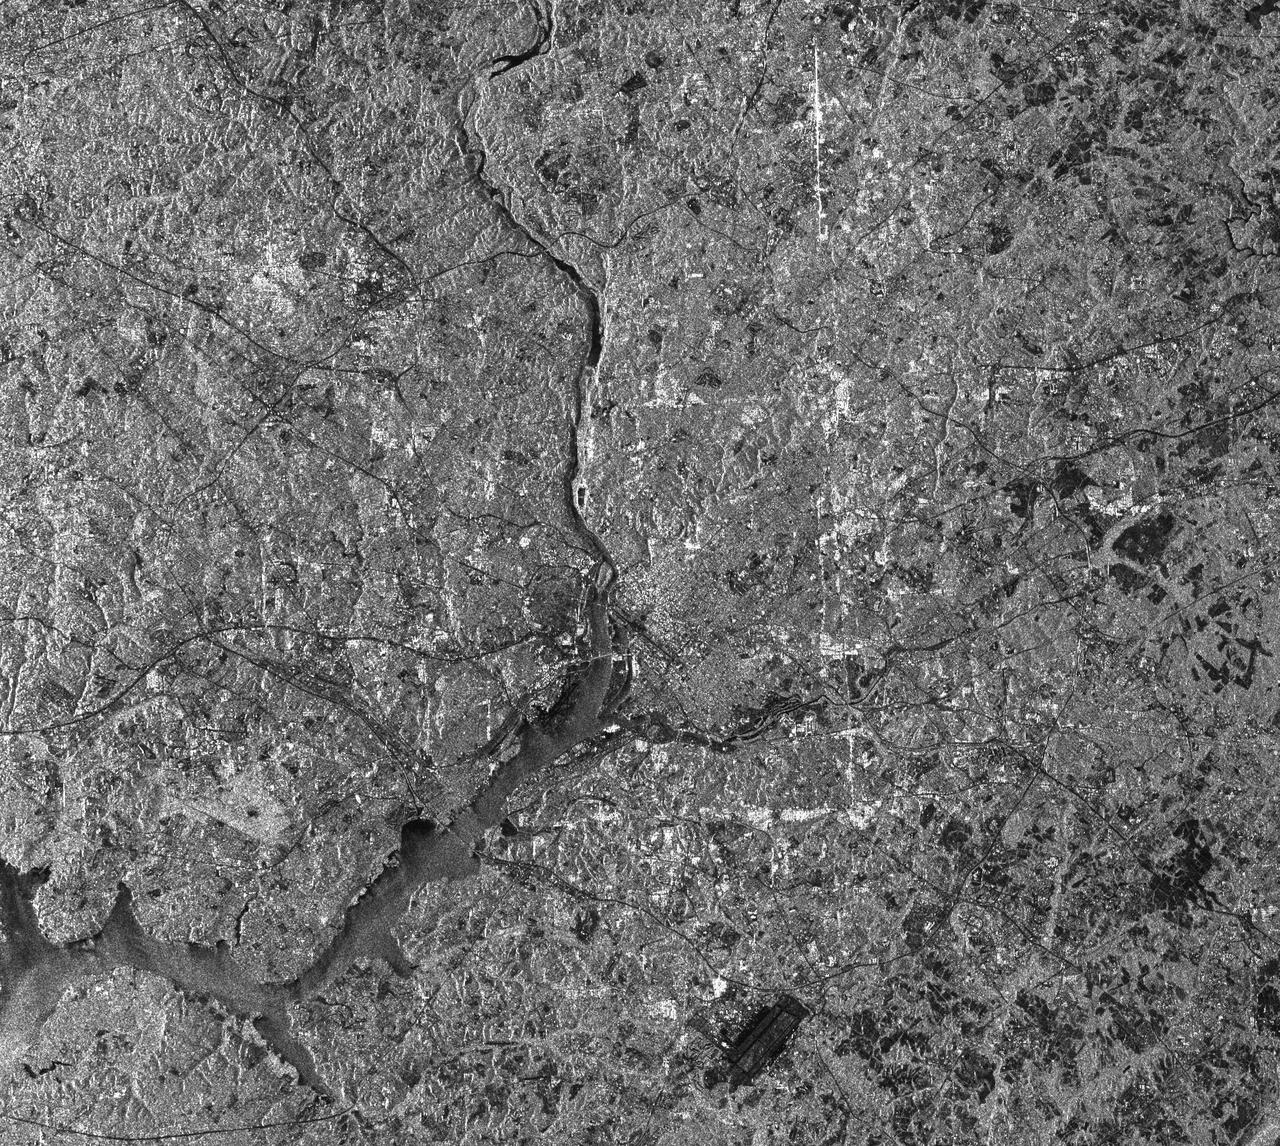
This radar image of the Washington, D.C. area demonstrates the capability of imaging radar as a useful tool for urban planners and managers to map and monitor land use patterns.
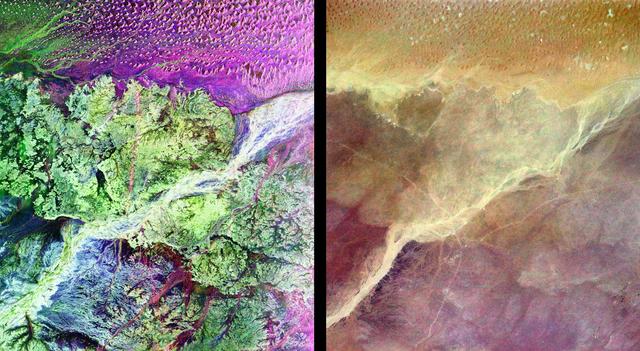
This pair of images from space shows a portion of the southern Empty Quarter of the Arabian Peninsula in the country of Oman. On the left is a radar image of the region around the site of the fabled Lost City of Ubar, discovered in 1992 with the aid of remote sensing data. On the right is an enhanced optical image taken by the shuttle astronauts. Ubar existed from about 2800 BC to about 300 AD. and was a remote desert outpost where caravans were assembled for the transport of frankincense across the desert. The actual site of the fortress of the Lost City of Ubar, currently under excavation, is too small to show in either image. However, tracks leading to the site, and surrounding tracks, show as prominent, but diffuse, reddish streaks in the radar image. Although used in modern times, field investigations show many of these tracks were in use in ancient times as well. Mapping of these tracks on regional remote sensing images provided by the Landsat satellite was a key to recognizing the site as Ubar. The prominent magenta colored area is a region of large sand dunes. The green areas are limestone rocks, which form a rocky desert floor. A major wadi, or dry stream bed, runs across the scene and appears as a white line. The radar images, and ongoing field investigations, will help shed light on an early civilization about which little in known. The radar image was taken by the Spaceborne Imaging Radar C/X-Band Synthetic Aperture Radar (SIR-C/X-SAR) and is centered at 18 degrees North latitude and 53 degrees East longitude. The image covers an area about 50 kilometers by 100 kilometers (31 miles by 62 miles). The colors in the image are assigned to different frequencies and polarizations of the radar as follows: red is L-band, horizontally transmitted, horizontally received; blue is C-band horizontally transmitted, horizontally received; green is L-band horizontally transmitted, vertically received. SIR-C/X-SAR, a joint mission of the German, Italian and the United States space agencies, is part of NASA's Mission to Planet Earth. http://photojournal.jpl.nasa.gov/catalog/PIA01302
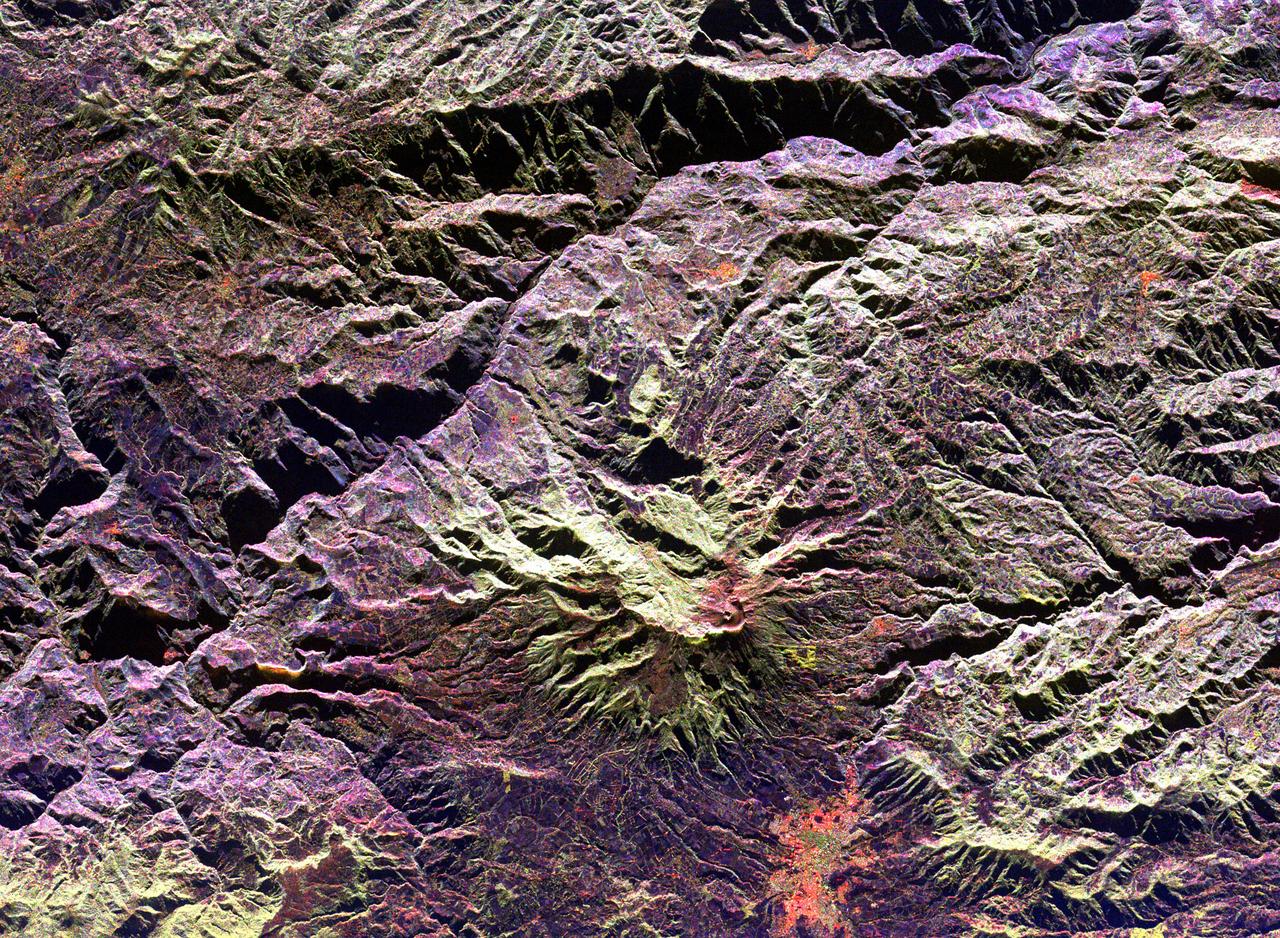
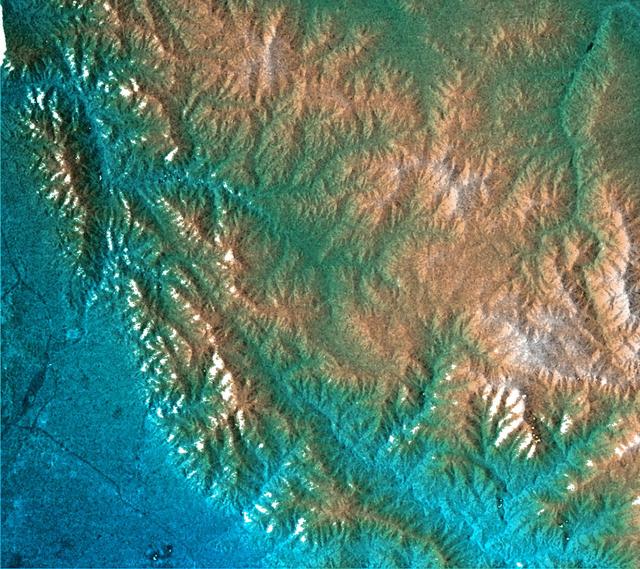
This radar image of the area surrounding the Galeras volcano in southern Colombia shows the ability of a multi-frequency radar to map volcanic structures that can be dangerous to study on the ground.
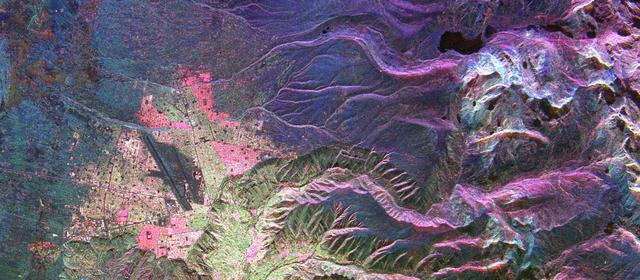
This spaceborne radar image is dominated by the metropolitan area of Australia largest city, Sydney.
The objective of NASA Shuttle Imaging Radar A SIR-A was to observe the Earth by use of radar imagery, acquire and transmit data of different geologic regions. This is a view of New Guinea in 2000.
This radar image of Dublin, Ireland, shows how the radar distinguishes between densely populated urban areas and nearby areas that are relatively unsettled. In the center of the image is the city natural harbor along the Irish Sea.
This radar image of the area surrounding Boston, Mass., shows how a spaceborne radar system distinguishes between densely populated urban areas and nearby areas that are relatively unsettled.
This spaceborne radar image shows the Valley Island of Maui, Hawaii. The cloud-penetrating capabilities of radar provide a rare view of many parts of the island, since the higher elevations are frequently shrouded in clouds.
These two images were created using data from NASA Spaceborne Imaging Radar C/X-Band Synthetic Aperture Radar SIR-C/X-SAR.
This spaceborne radar image of Munich, Germany illustrates the capability of a multi-frequency radar system to highlight different land use patterns in the area surrounding Bavaria largest city.
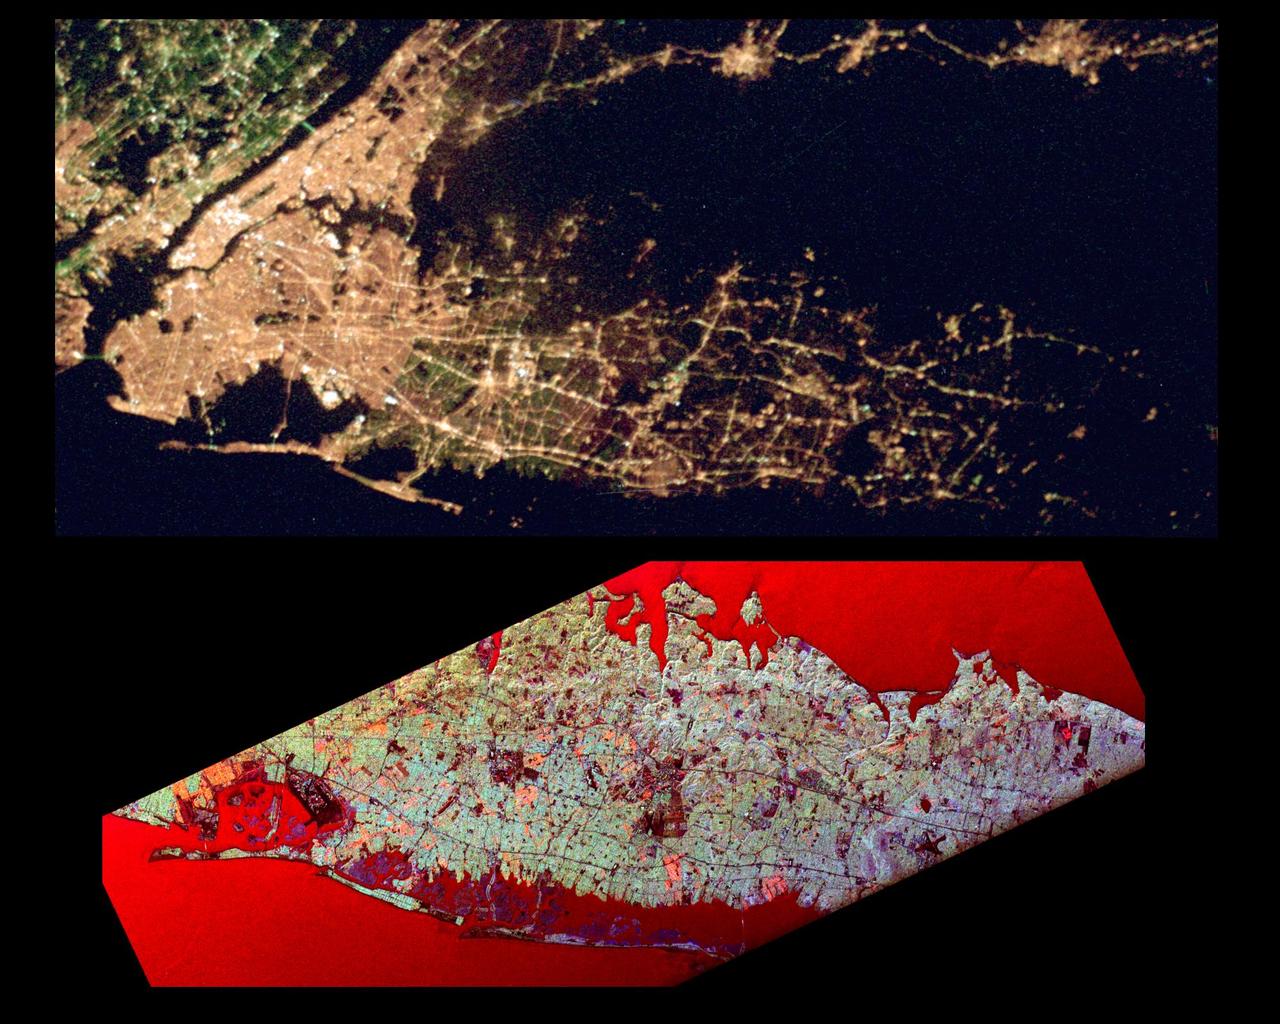
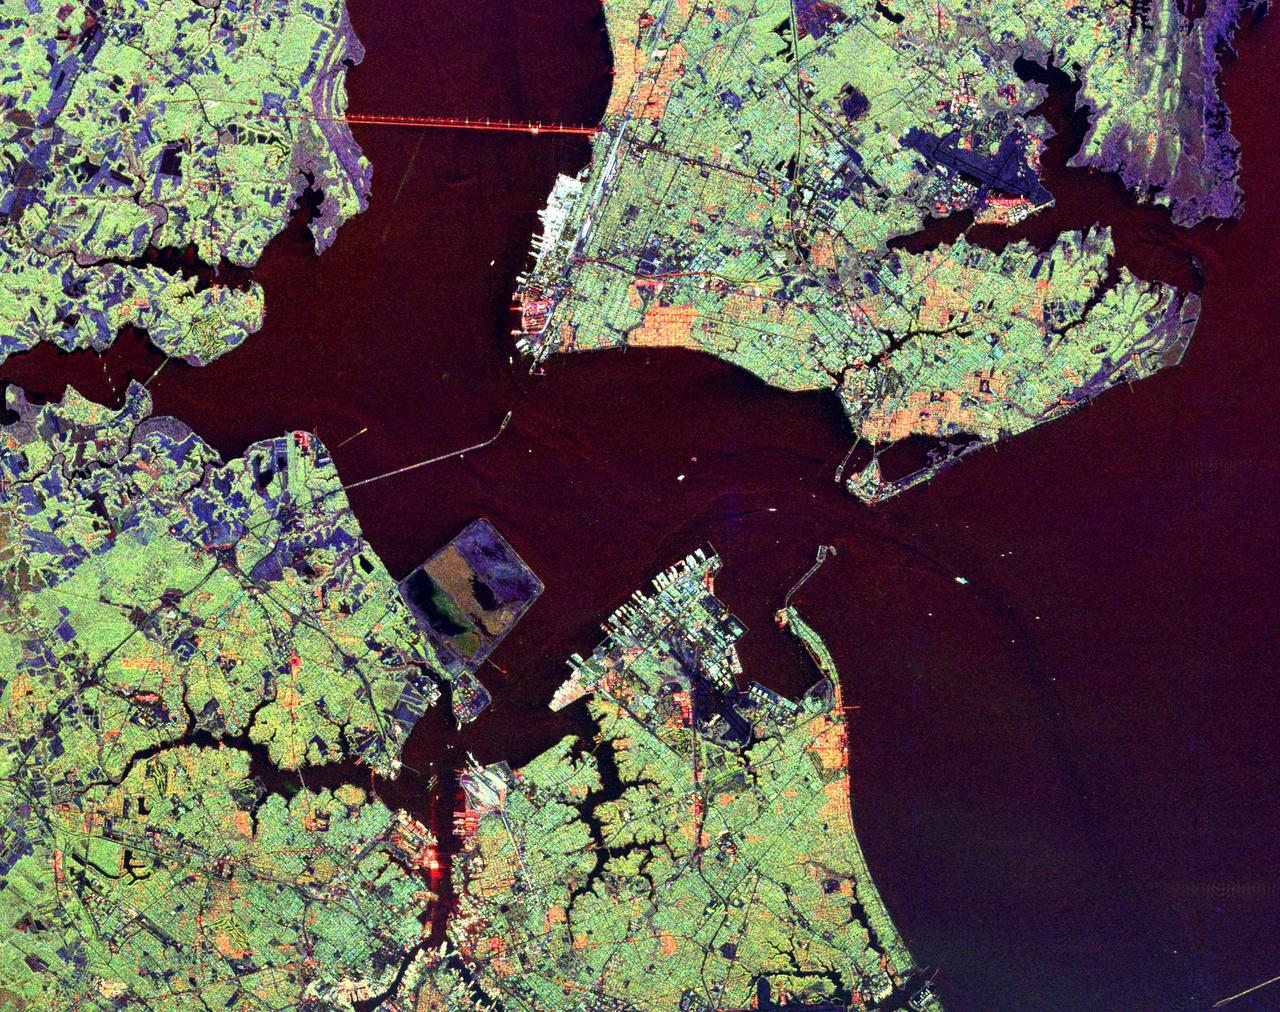
This pair of images of the Long Island, New York region is a comparison of an optical photograph (top) and a radar image (bottom), both taken in darkness in April 1994. The photograph at the top was taken by the Endeavour astronauts at about 3 a.m. Eastern time on April 20, 1994. The image at the bottom was acquired at about the same time four days earlier on April 16,1994 by the Spaceborne Imaging Radar-C/X-Band Synthetic Aperture Radar (SIR-C/X-SAR) system aboard the space shuttle Endeavour. Both images show an area approximately 100 kilometers by 40 kilometers (62 miles by 25 miles) that is centered at 40.7 degrees North latitude and 73.5 degrees West longitude. North is toward the upper right. The optical image is dominated by city lights, which are particularly bright in the densely developed urban areas of New York City located on the left half of the photo. The brightest white zones appear on the island of Manhattan in the left center, and Central Park can be seen as a darker area in the middle of Manhattan. To the northeast (right) of the city, suburban Long Island appears as a less densely illuminated area, with the brightest zones occurring along major transportation and development corridors. Since radar is an active sensing system that provides its own illumination, the radar image shows a great amount of surface detail, despite the night-time acquisition. The colors in the radar image were obtained using the following radar channels: red represents the L-band (horizontally transmitted and received); green represents the L-band (horizontally transmitted and vertically received); blue represents the C-band (horizontally transmitted and vertically received). In this image, the water surface - the Atlantic Ocean along the bottom edge and Long Island Sound shown at the top edge - appears red because small waves at the surface strongly reflect the horizontally transmitted and received L-band radar signal. Networks of highways and railroad lines are clearly visible in the radar image; many of them can also be seen as bright lines i the optical image. The runways of John F. Kennedy International Airport appear as a dark rectangle in Jamaica Bay on the left side of the image. Developed areas appear generally as bright green and orange, while agricultural, protected and undeveloped areas appear darker blue or purple. This contrast can be seen on the barrier islands along the south coast of Long Island, which are heavily developed in the Rockaway and Long Beach areas south and east of Jamaica Bay, but further to the east, the islands are protected and undeveloped. http://photojournal.jpl.nasa.gov/catalog/PIA01785
This radar image, taken by NASA Airborne Synthetic Aperture Radar AIRSAR in 2002, shows Lovea, Cambodia.
This radar image, taken by NASA Airborne Synthetic Aperture Radar AIRSAR in 2002, shows Ancharn Kuy, Cambodia.
This radar image acquired in February 2000 by NASA Shuttle Radar Topography Mission SRTM shows an area in the state of Bahia in Brazil.
This image was produced during radar observations taken by the Spaceborne Imaging Radar-C/X-band Synthetic Aperture Radar as it flew over the Gulf Stream, Florida, and past the Atlantic Ocean on October 7, 1994. The data were produced using the X-band radar frequency. Knowing ahead of time that this region would be included in a regularly scheduled radar pass, the Kennedy Space Center team, who assembled and integrated the SIR-C/X-SAR equipment with the Spacelab pallet system, designed a set of radar reflectors from common construction materials and formed the letters "KSC" on the ground adjacent to the main headquarters building at the entrance to the Cape Canaveral launch facility. The point of light formed by the bright return from these reflectors are visible in the image. Other more diffuse bright spots are reflections from building faces, roofs and other large structures at the Kennedy Space Center complex. This frame covers an area of approximately 6 kilometers by 8 kilometers (4 miles by 5 miles), which was just a small portion of the data taken on this particular pass. http://photojournal.jpl.nasa.gov/catalog/PIA01747
This radar image shows the ocean surface in a portion of the Western Pacific Ocean.
This is a radar image of Los Angeles, California, taken on October 2, 1994.
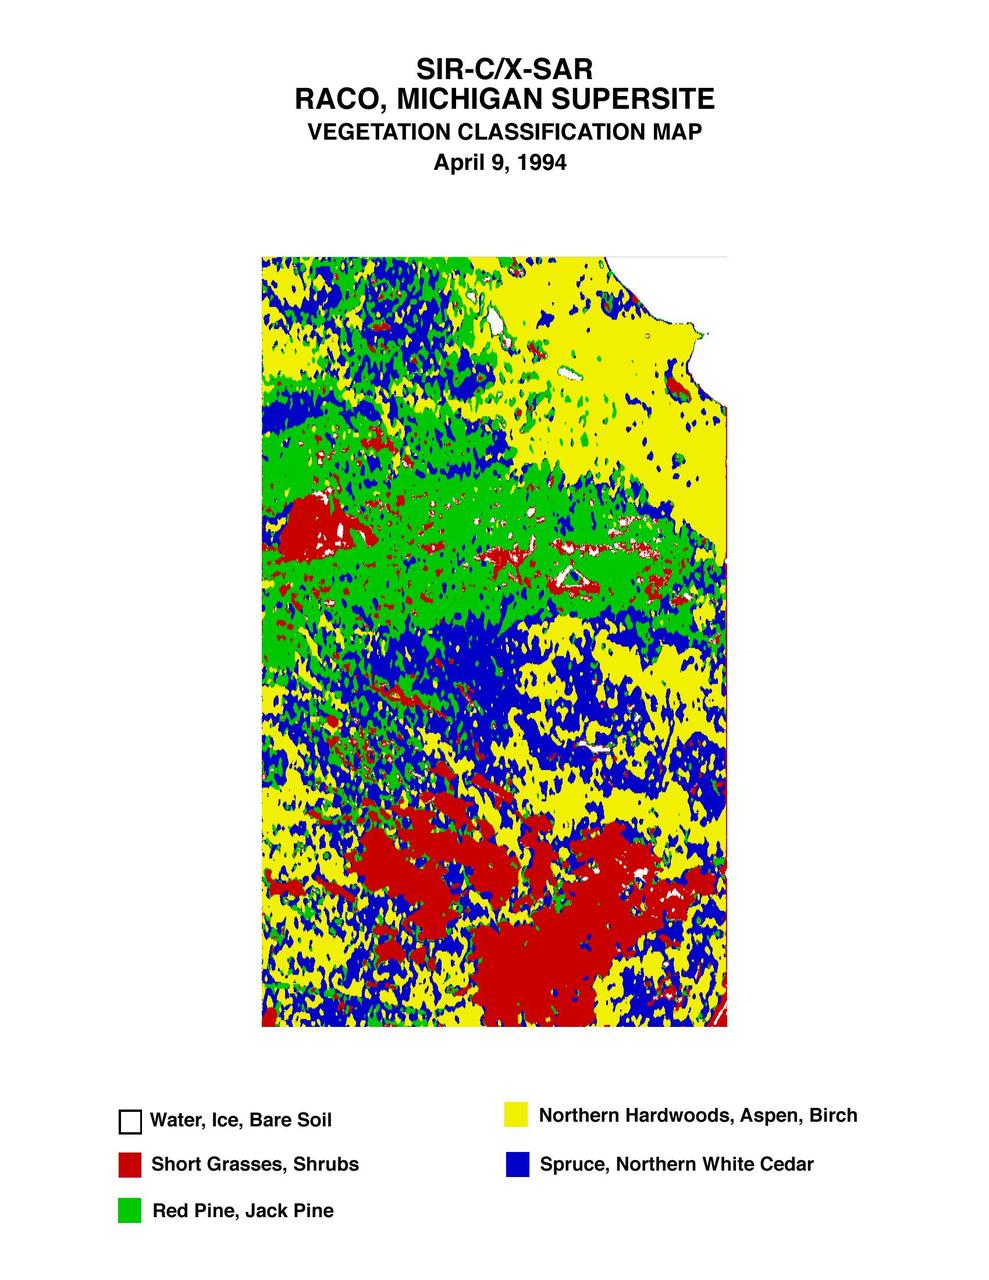
This is a vegetation map of the Raco, Michigan area produced from data acquired by NASA Spaceborne Imaging Radar C/X-Band Synthetic Aperture Radar SIR-C/X-SAR onboard space shuttle Endeavour.

This three-frequency space radar image of south-central Egypt demonstrates the unique capability of imaging radar to penetrate thin sand cover in arid regions to reveal hidden details below the surface.
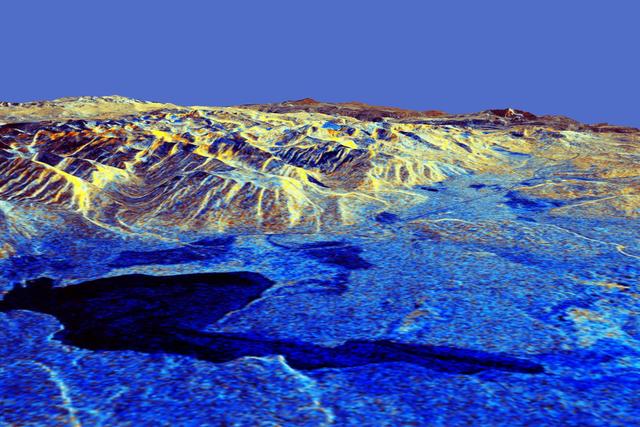
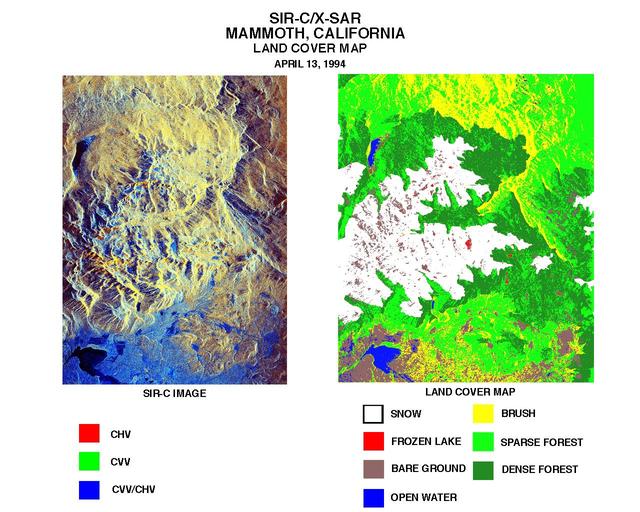
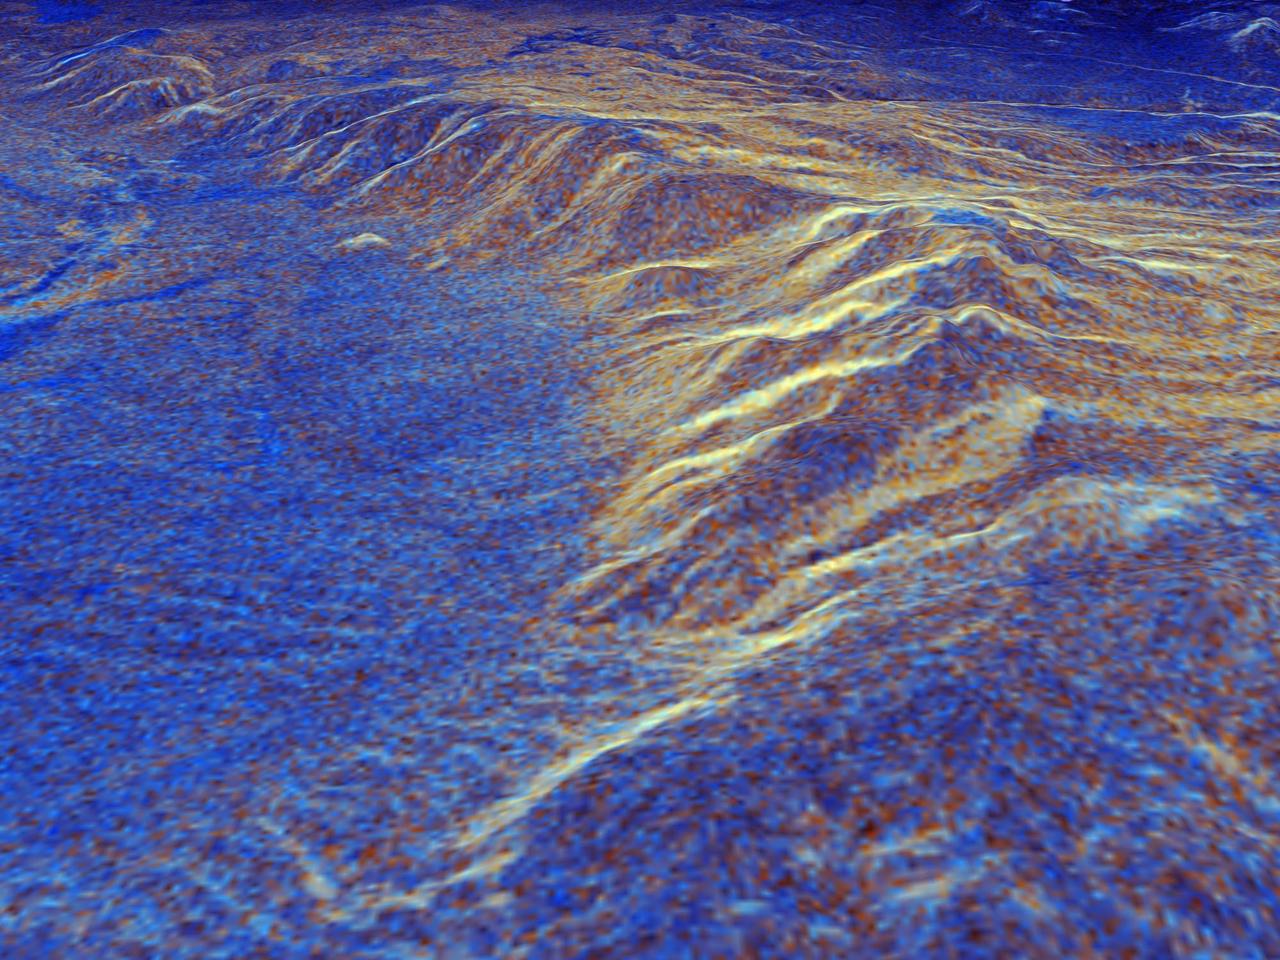
This is a three-dimensional perspective of Mammoth Mountain, California. This view was constructed by overlaying a NASA Spaceborne Imaging Radar-C SIR-C radar image on a U.S. Geological Survey digital elevation map.
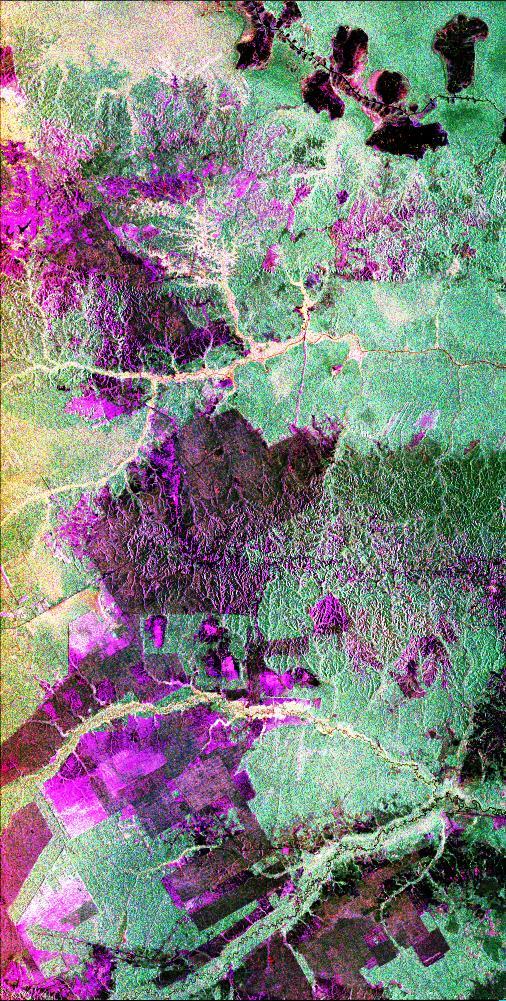
This multi-frequency space radar image of a tropical rainforest in western Brazil shows rapidly changing land use patterns and it also demonstrates the capability of the different radar frequencies to detect and penetrate heavy rainstorms.
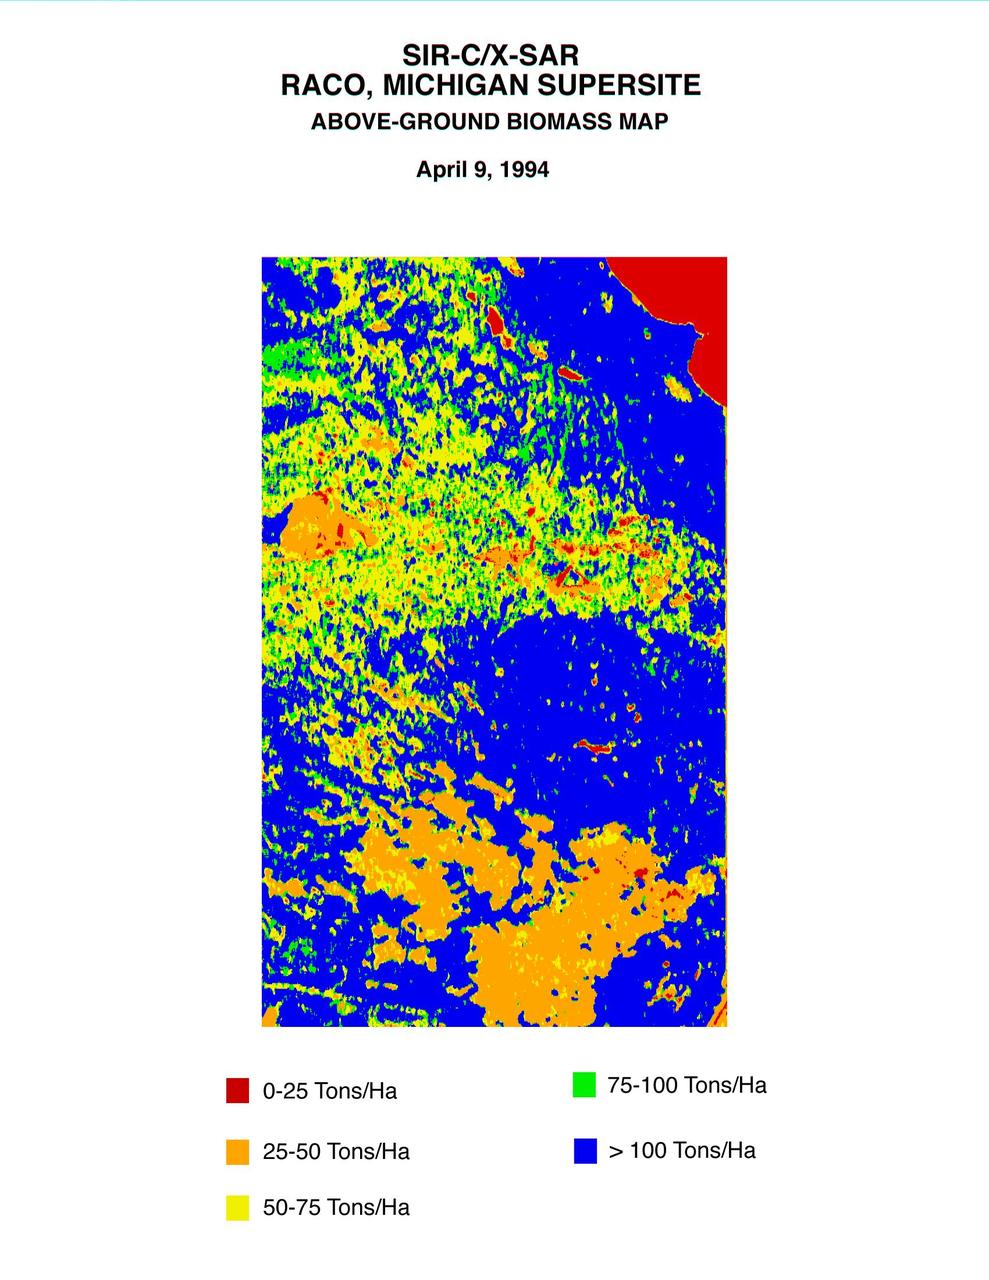
This biomass map of the Raco, Michigan, area was produced from data acquired by NASA Spaceborne Imaging Radar C/X-Band Synthetic Aperture Radar SIR-C/X-SAR onboard space shuttle Endeavour.
This false-color L-band image of the Manaus region of Brazil was acquired by NASA Spaceborne Imaging Radar-C and X-Band Synthetic Aperture Radar SIR-C/X-SAR aboard the space shuttle Endeavour on orbit 46 of the mission.
This color composite C-band and L-band image of the Kilauea volcano on the Big Island of Hawaii was acquired by NASA Spaceborne Imaging Radar-C/X-band Synthetic Aperture Radar SIR-C/X-SAR flying on space shuttle Endeavour.
This spaceborne radar image shows how the Atlas Mountains in northwestern Africa dominate the geography of Morocco.
This is a spaceborne radar image of the city of Sacramento, the capital of California. Urban areas appear pink and the surrounding agricultural areas are green and blue.
This radar image acquired in February 2000 by NASA Shuttle Radar Topography Mission SRTM shows an area south of the Sao Francisco River in Brazil.
In addition to an elevation model of most of Earth landmass, NASA Shuttle Radar Topography Mission will produce C-band radar imagery of the same area.
This radar image, taken by NASA Airborne Synthetic Aperture Radar AIRSAR in 2002, shows Nokor Pheas Trapeng, Cambodia.
This X-band image of the volcano Kilauea was taken on October 4, 1994, by the Spaceborne Imaging Radar-C/X-band Synthetic Aperture Radar. The area shown is about 9 kilometers by 13 kilometers (5.5 miles by 8 miles) and is centered at about 19.58 degrees north latitude and 155.55 degrees west longitude. This image and a similar image taken during the first flight of the radar instrument on April 13, 1994 were combined to produce the topographic information by means of an interferometric process. This is a process by which radar data acquired on different passes of the space shuttle is overlaid to obtain elevation information. Three additional images are provided showing an overlay of radar data with interferometric fringes; a three-dimensional image based on altitude lines; and, finally, a topographic view of the region. http://photojournal.jpl.nasa.gov/catalog/PIA01763
Radar Love
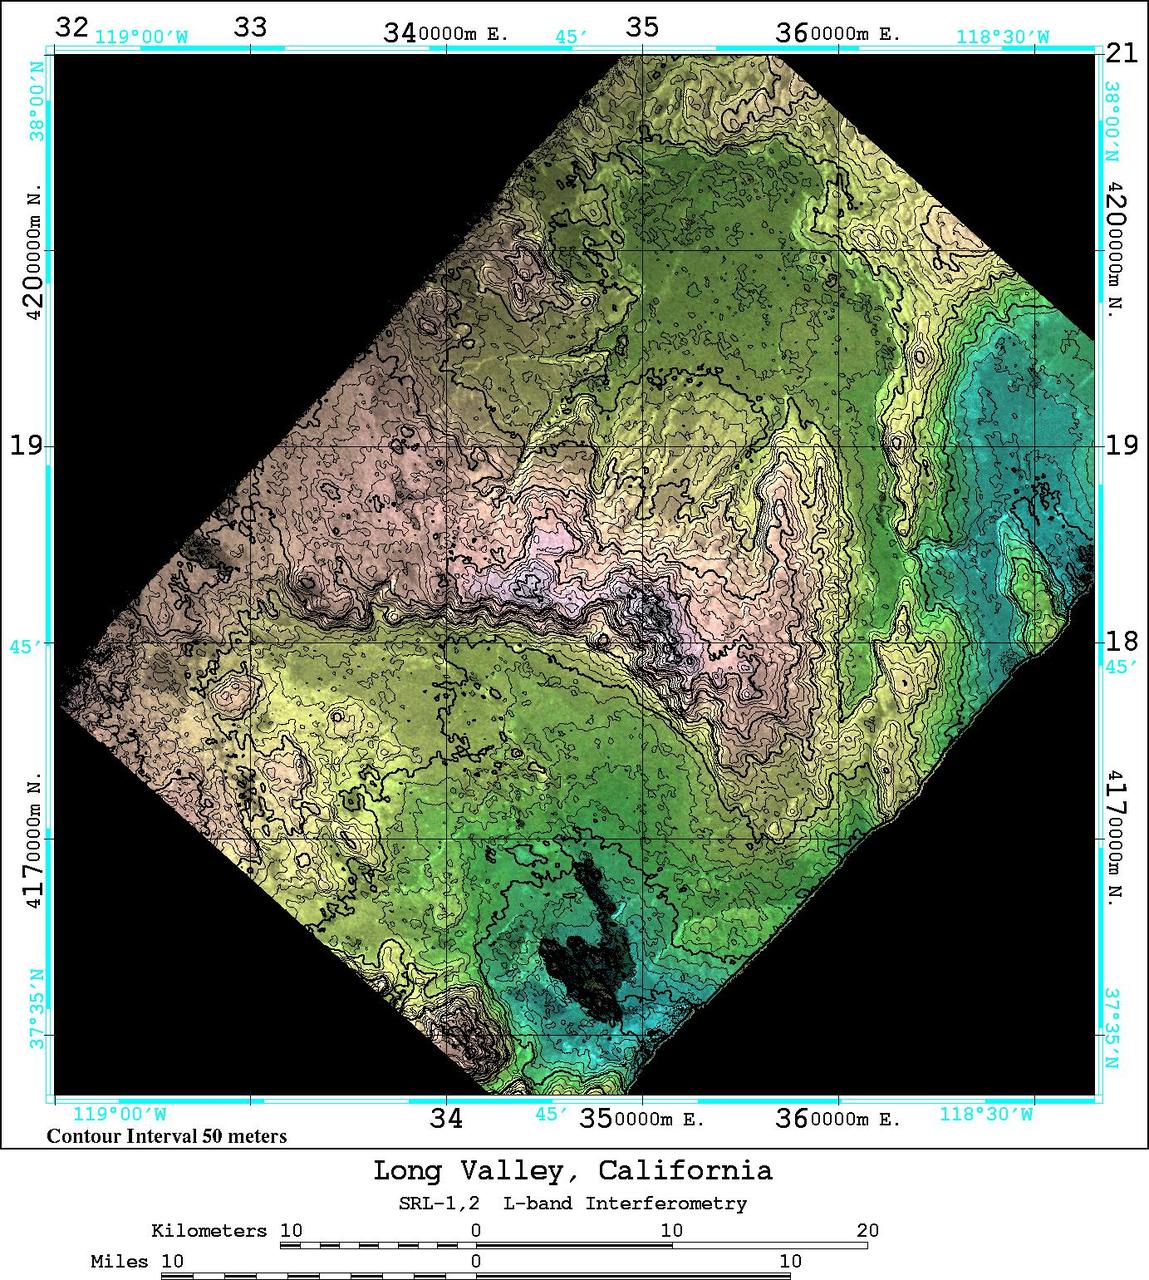
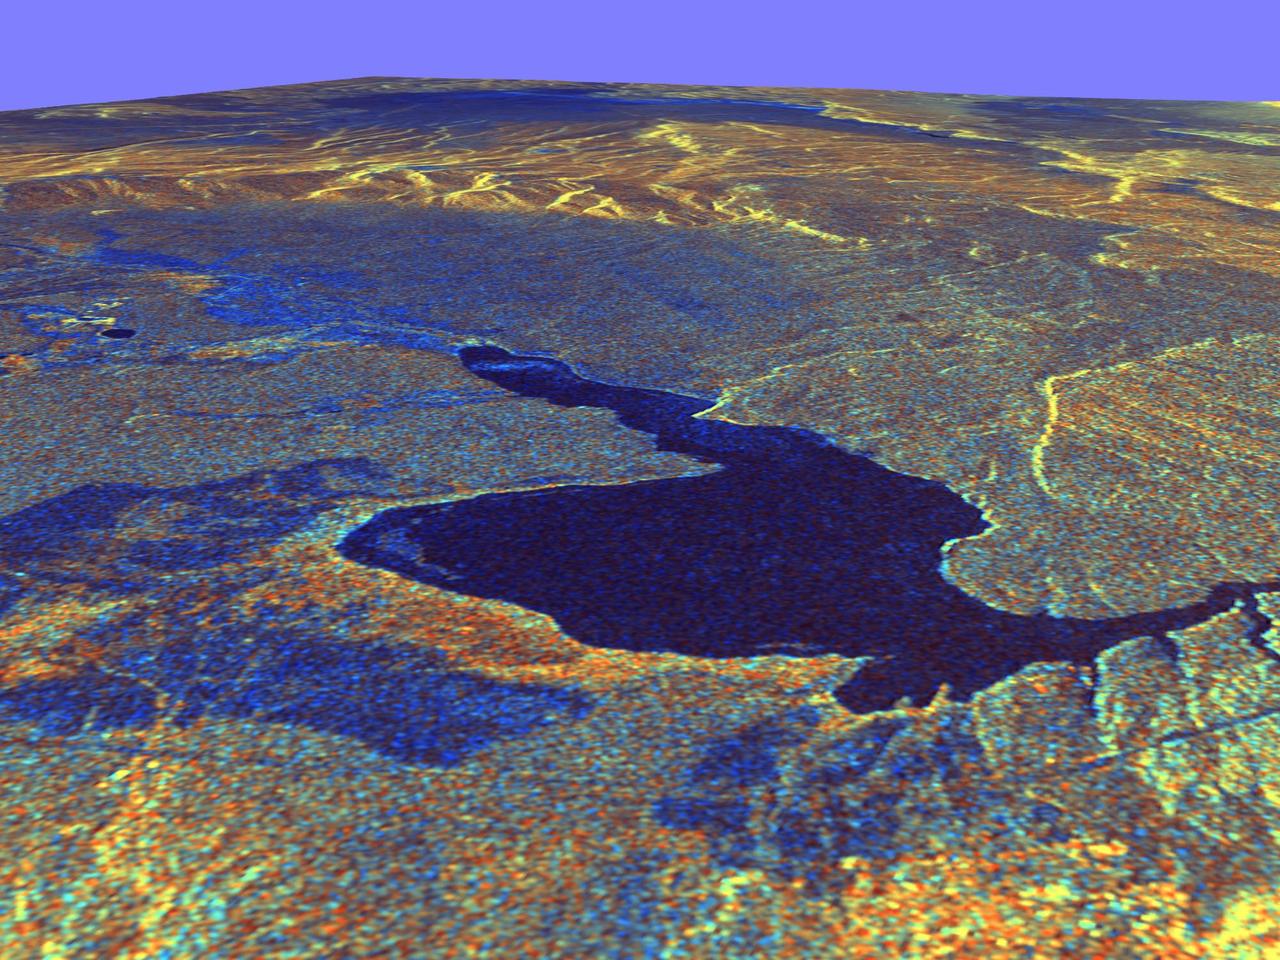
An area near Long Valley, California, was mapped by the Spaceborne Imaging Radar-C and X-band Synthetic Aperture Radar aboard the space shuttle Endeavor on April 13, 1994, during the first flight of the radar instrument, and on October 4, 1994, during the second flight of the radar instrument. The orbital configurations of the two data sets were ideal for interferometric combination -- that is overlaying the data from one image onto a second image of the same area to create an elevation map and obtain estimates of topography. Once the topography is known, any radar-induced distortions can be removed and the radar data can be geometrically projected directly onto a standard map grid for use in a geographical information system. The 50 kilometer by 50 kilometer (31 miles by 31 miles) map shown here is entirely derived from SIR-C L-band radar (horizontally transmitted and received) results. The color shown in this image is produced from the interferometrically determined elevations, while the brightness is determined by the radar backscatter. The map is in Universal Transverse Mercator (UTM) coordinates. Elevation contour lines are shown every 50 meters (164 feet). Crowley Lake is the dark feature near the south edge of the map. The Adobe Valley in the north and the Long Valley in the south are separated by the Glass Mountain Ridge, which runs through the center of the image. The height accuracy of the interferometrically derived digital elevation model is estimated to be 20 meters (66 feet) in this image. http://photojournal.jpl.nasa.gov/catalog/PIA01749
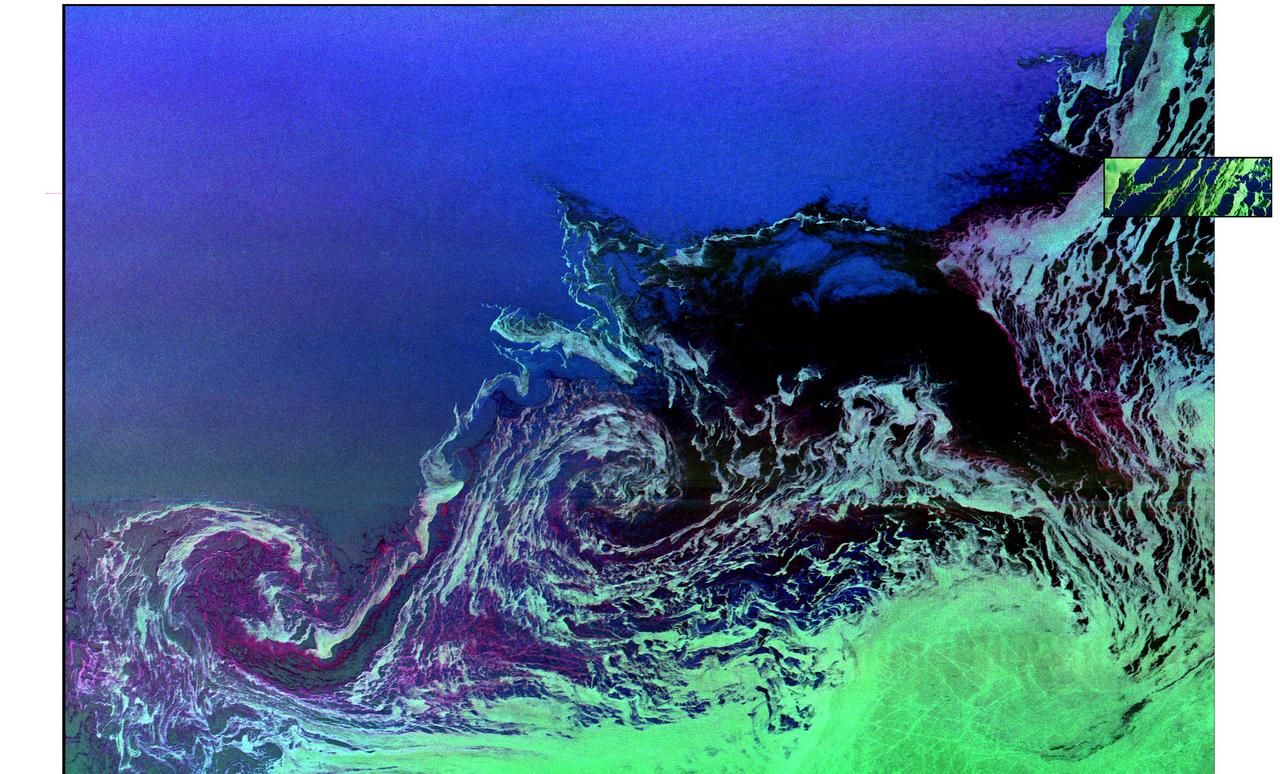
This is a radar image showing surface features on the open ocean in the northeast Atlantic Ocean. There is no land mass in this image. The purple line in the lower left of the image is the stern wake of a ship. The ship creating the wake is the bright white spot on the middle, left side of the image. The ship's wake is about 28 kilometers (17 miles) long in this image and investigators believe that is because the ship may be discharging oil. The oil makes the wake last longer and causes it to stand out in this radar image. A fairly sharp boundary or front extends from the lower left to the upper right corner of the image and separates two distinct water masses that have different temperatures. The different water temperature affects the wind patterns on the ocean. In this image, the light green area depicts rougher water with more wind, while the purple area is calmer water with less wind. The dark patches are smooth areas of low wind, probably related to clouds along the front, and the bright green patches are likely due to ice crystals in the clouds that scatter the radar waves. The overall "fuzzy" look of this image is caused by long ocean waves, also called swells. Ocean radar imagery allows the fine detail of ocean features and interactions to be seen, such as the wake, swell, ocean front and cloud effects, which can then be used to enhance the understanding of ocean dynamics on smaller and smaller scales. The image is centered at 42.8 degrees north latitude, 26.2 degrees west longitude and shows an area approximately 35 kilometers by 65 kilometers (22 by 40 miles). The colors in the image are assigned to different frequencies and polarizations of the radar as follows: red is L-band horizontally transmitted, horizontally received; green is C-band horizontally transmitted, horizontally received; blue is L-band vertically transmitted, vertically received. This image was acquired by the Spaceborne Imaging Radar-C/X-band Synthetic Aperture Radar (SIR-C/X-SAR) imaging radar when it flew aboard the space shuttle Endeavour on April 11, 1994. SIR-C/X-SAR, a joint mission of the German, Italian and United States space agencies, is part of NASA's Mission to Planet Earth. http://photojournal.jpl.nasa.gov/catalog/PIA01799
This spaceborne radar image shows part of the Mojave Desert in the vicinity of Barstow, California and reveals evidence of human activities in the arid environment of the southern California deserts.
This spaceborne radar image shows part of the British territory of Hong Kong, adjacent to mainland China. The South China Sea is shown in dark blue and red on the image.
This spaceborne radar image shows a segment of the Columbia River as it passes through the area of Wenatchee, Washington, about 220 kilometers 136 miles east of Seattle.
Australia capital city, Canberra, is shown in the center of this spaceborne radar image. Images like this can help urban planners assess land use patterns.
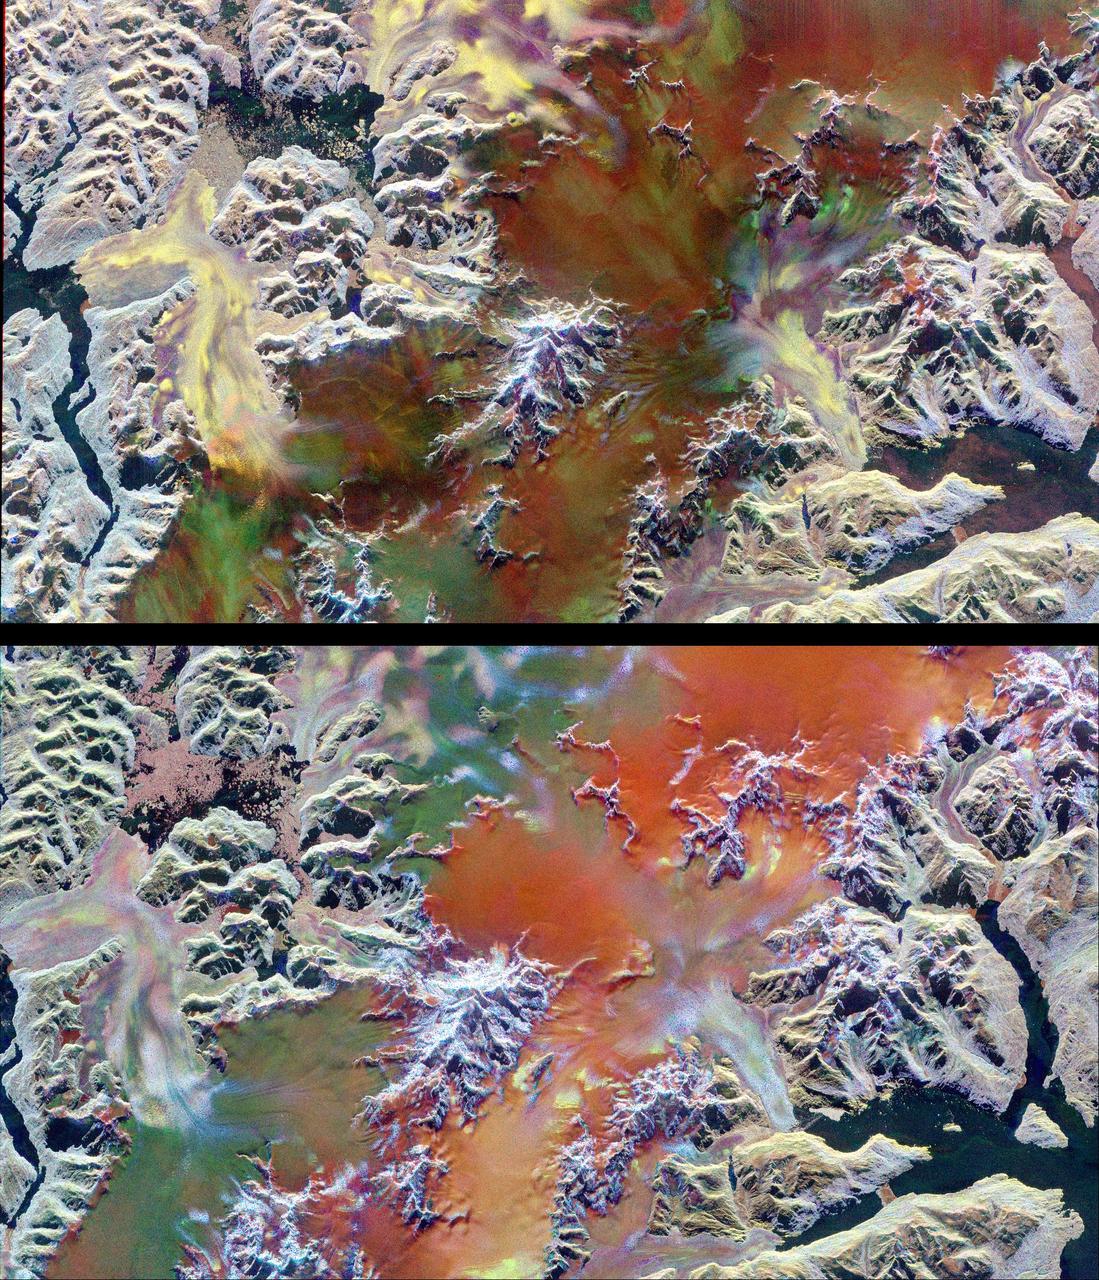
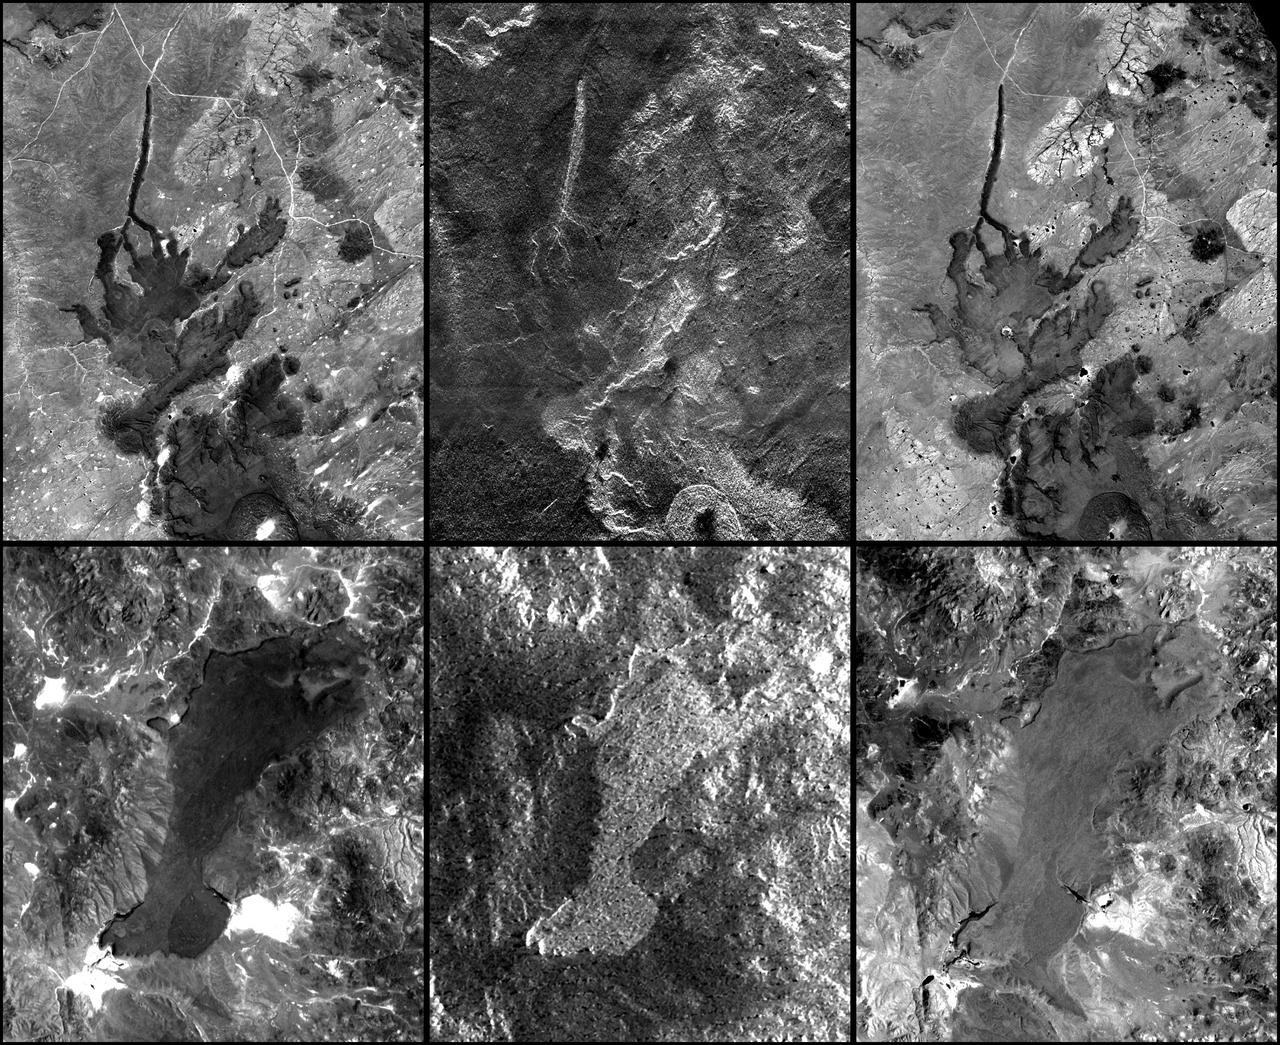
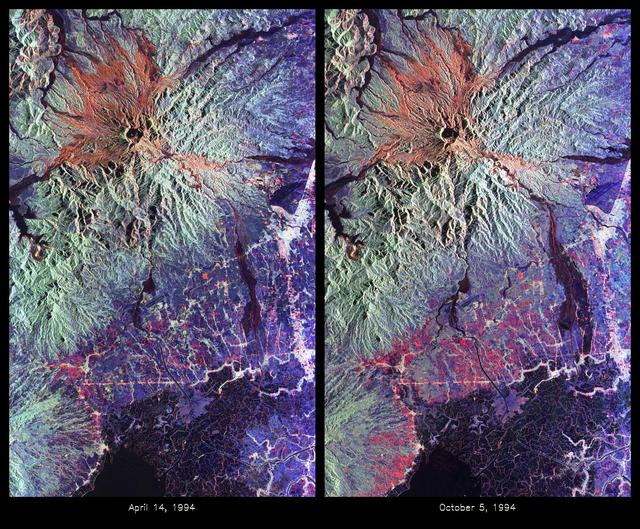
This pair of images illustrates the ability of multi-parameter radar imaging sensors such as the Spaceborne Imaging Radar-C/X-band Synthetic Aperture radar to detect climate-related changes on the Patagonian ice fields in the Andes Mountains of Chile and Argentina. The images show nearly the same area of the south Patagonian ice field as it was imaged during two space shuttle flights in 1994 that were conducted five-and-a-half months apart. The images, centered at 49.0 degrees south latitude and 73.5degrees west longitude, include several large outlet glaciers. The images were acquired by SIR-C/X-SAR on board the space shuttle Endeavour during April and October 1994. The top image was acquired on April 14, 1994, at 10:46 p.m. local time, while the bottom image was acquired on October 5,1994, at 10:57 p.m. local time. Both were acquired during the 77th orbit of the space shuttle. The area shown is approximately 100 kilometers by 58 kilometers (62 miles by 36 miles) with north toward the upper right. The colors in the images were obtained using the following radar channels: red represents the C-band (horizontally transmitted and received); green represents the L-band (horizontally transmitted and received); blue represents the L-band (horizontally transmitted and vertically received). The overall dark tone of the colors in the central portion of the April image indicates that the interior of the ice field is covered with thick wet snow. The outlet glaciers, consisting of rough bare ice, are the brightly colored yellow and purple lobes which terminate at calving fronts into the dark waters of lakes and fiords. During the second mission the temperatures were colder and the corresponding change in snow and ice conditions is readily apparent by comparing the images. The interior of the ice field is brighter because of increased radar return from the dryer snow. The distinct green/orange boundary on the ice field indicates an abrupt change in the structure of the snowcap, a direct indication of the steep meteorological gradients known to exist in this region. The bluer color of the outlet glaciers is probably due to a thin snow cover. A portion of the terminus of the outlet glacier at the top left center of the images has advanced approximately 600 meters (1,970 feet) in the five-and-a-half months between the two missions. Because of the persistent cloud cover this observation was only possible by using the orbiting, remote imaging radar system. http://photojournal.jpl.nasa.gov/catalog/PIA01778
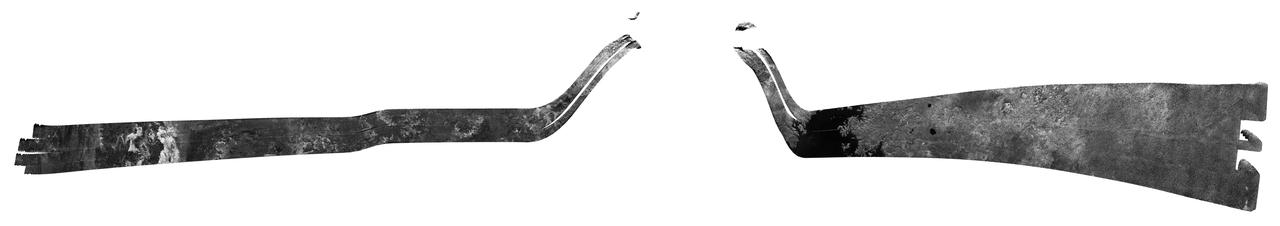
This radar image of the Midland/Odessa region of West Texas, demonstrates an experimental technique, called ScanSAR, that allows scientists to rapidly image large areas of the Earth's surface. The large image covers an area 245 kilometers by 225 kilometers (152 miles by 139 miles). It was obtained by the Spaceborne Imaging Radar-C/X-Band Synthetic Aperture Radar (SIR-C/X-SAR) flying aboard the space shuttle Endeavour on October 5, 1994. The smaller inset image is a standard SIR-C image showing a portion of the same area, 100 kilometers by 57 kilometers (62 miles by 35 miles) and was taken during the first flight of SIR-C on April 14, 1994. The bright spots on the right side of the image are the cities of Odessa (left) and Midland (right), Texas. The Pecos River runs from the top center to the bottom center of the image. Along the left side of the image are, from top to bottom, parts of the Guadalupe, Davis and Santiago Mountains. North is toward the upper right. Unlike conventional radar imaging, in which a radar continuously illuminates a single ground swath as the space shuttle passes over the terrain, a Scansar radar illuminates several adjacent ground swaths almost simultaneously, by "scanning" the radar beam across a large area in a rapid sequence. The adjacent swaths, typically about 50 km (31 miles) wide, are then merged during ground processing to produce a single large scene. Illumination for this L-band scene is from the top of the image. The beams were scanned from the top of the scene to the bottom, as the shuttle flew from left to right. This scene was acquired in about 30 seconds. A normal SIR-C image is acquired in about 13 seconds. The ScanSAR mode will likely be used on future radar sensors to construct regional and possibly global radar images and topographic maps. The ScanSAR processor is being designed for 1996 implementation at NASA's Alaska SAR Facility, located at the University of Alaska Fairbanks, and will produce digital images from the forthcoming Canadian RADARSAT satellite. http://photojournal.jpl.nasa.gov/catalog/PIA01787
This is a three-dimensional perspective view of Missoula, Montana, created by combining two spaceborne radar images using a technique known as interferometry.
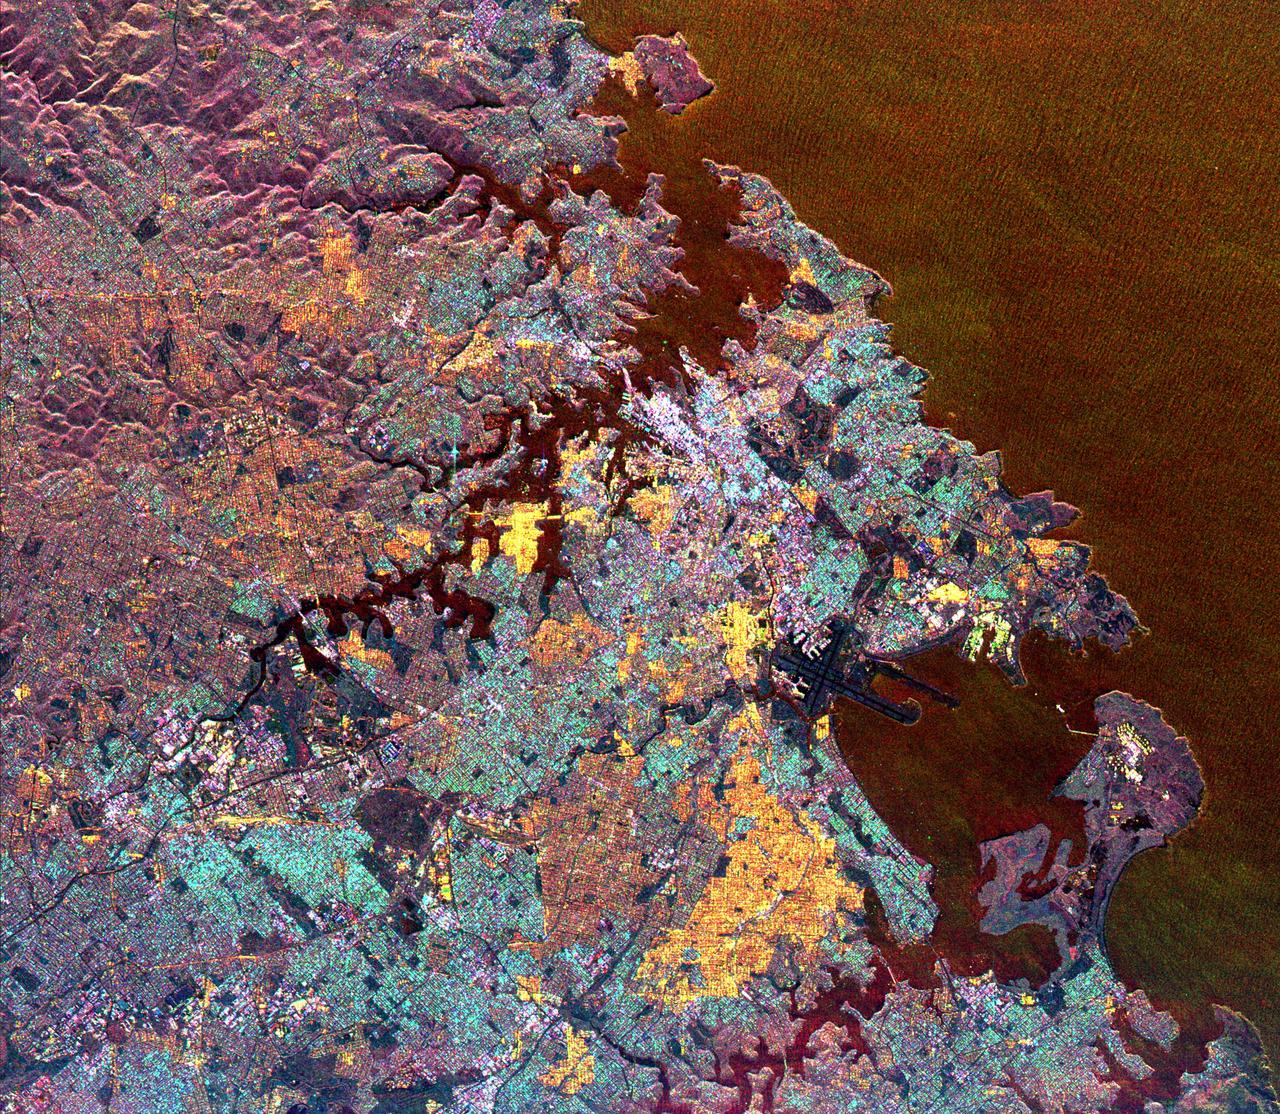
This radar image shows the Hampton Roads, Virginia region, where the James River upper left center flows into the Chesapeake Bay.
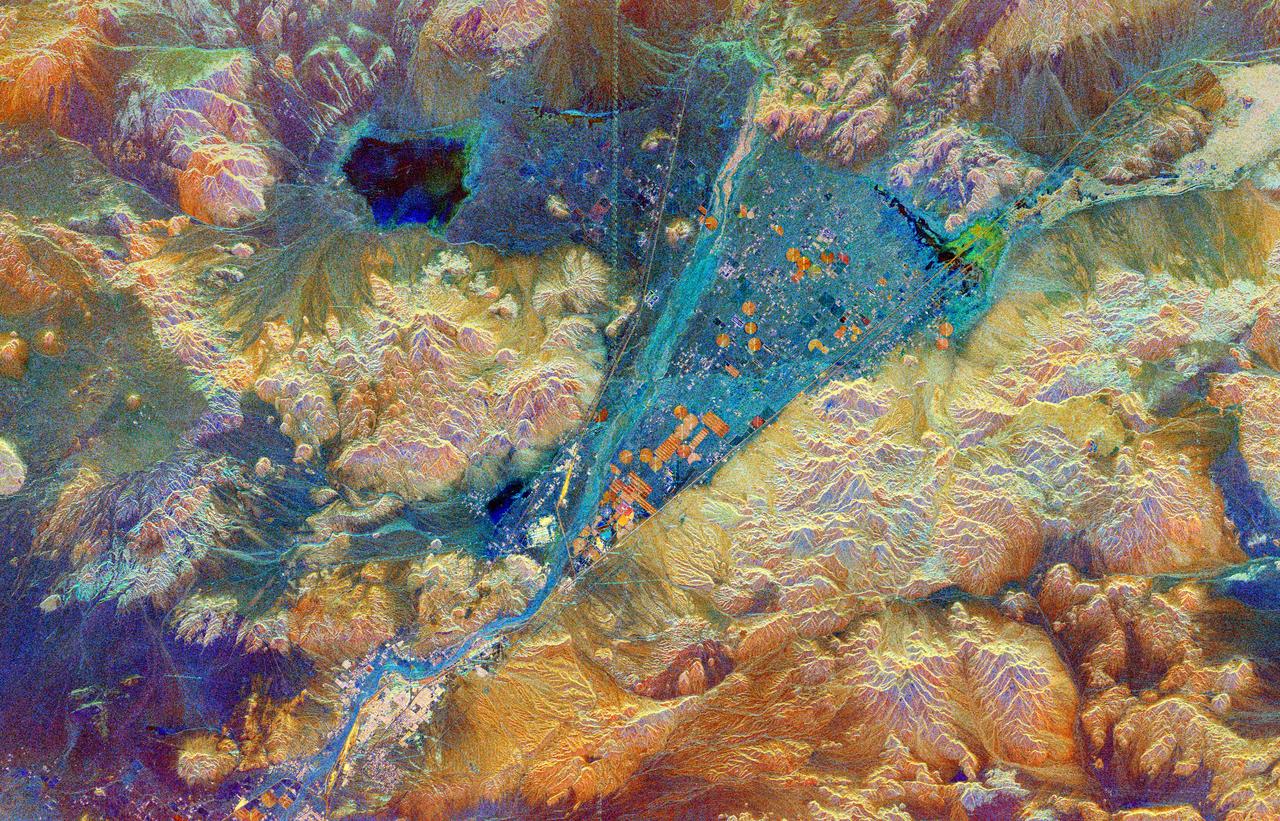
This is an image of the Bolivian capital city of La Paz that was created using three radar frequencies.
This topographic radar image acquired by NASA Shuttle Radar Topography Mission SRTM in Feb. 2000 shows the city of Honolulu, Hawaii and adjacent areas on the island of Oahu. Honolulu lies on the south shore of the island.
This radar image acquired by NASA Shuttle Radar Topography Mission SRTM from data collected on February 15, 2000 includes the city of Salalah, the second largest city in Oman.
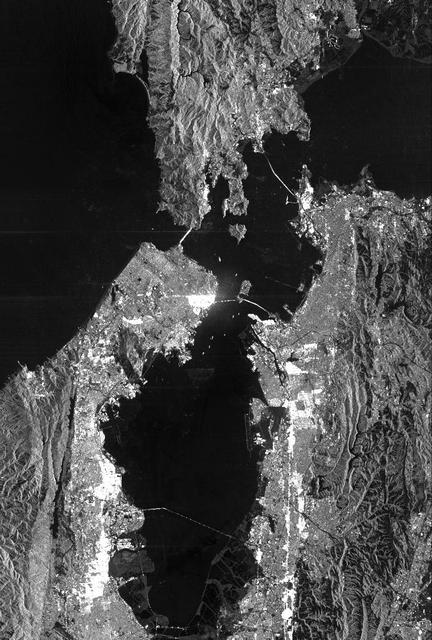
This radar image acquired by NASA Shuttle Radar Topography Mission SRTM from data collected on February 16, 2000 shows the San Francisco Bay Area in California.
This radar image, taken by NASA Airborne Synthetic Aperture Radar AIRSAR in 2002, shows Hariharalaya, the ancient 9th Century A.D. capitol of the Khmer in Cambodia in the upper center portion.
This radar image, taken by NASA Airborne Synthetic Aperture Radar AIRSAR in 2002, shows the Old Khmer Road Inrdratataka-Bakheng causeway in Cambodia.
This topographic radar image acquired by NASA Shuttle Radar Topography Mission SRTM in Feb. 2000 shows the Lanai left and western Maui right islands of Hawaii.
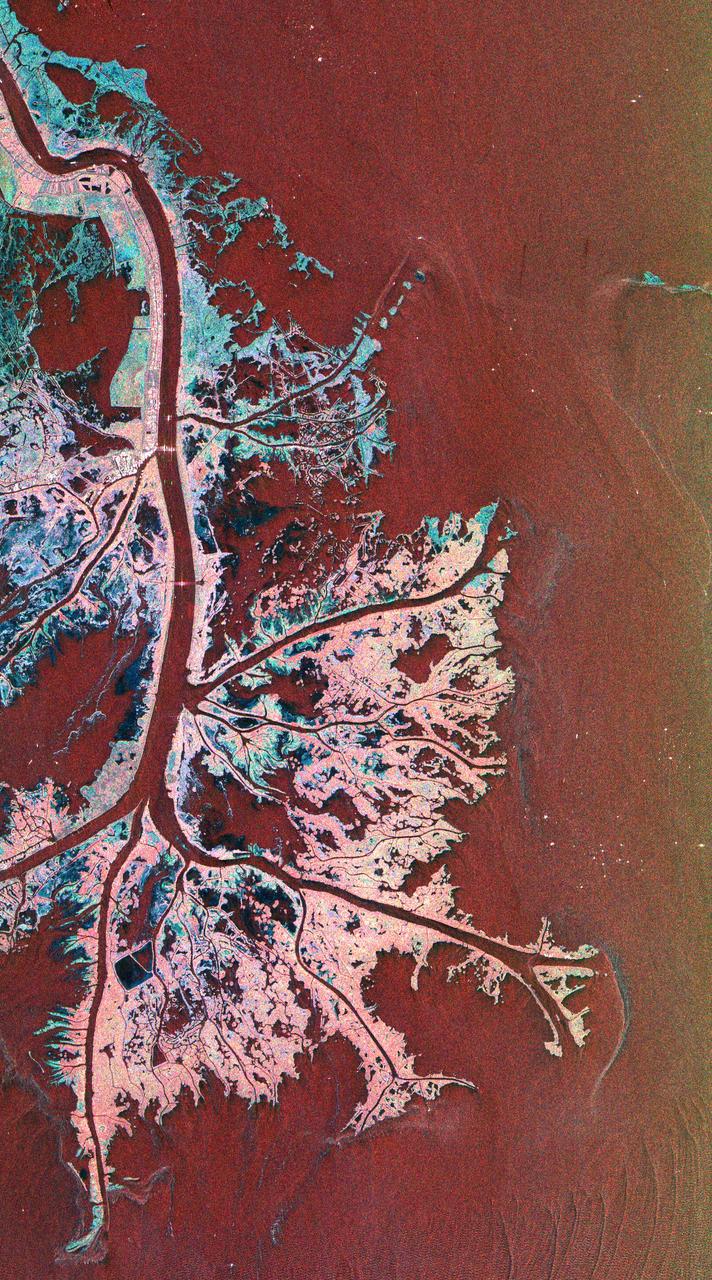
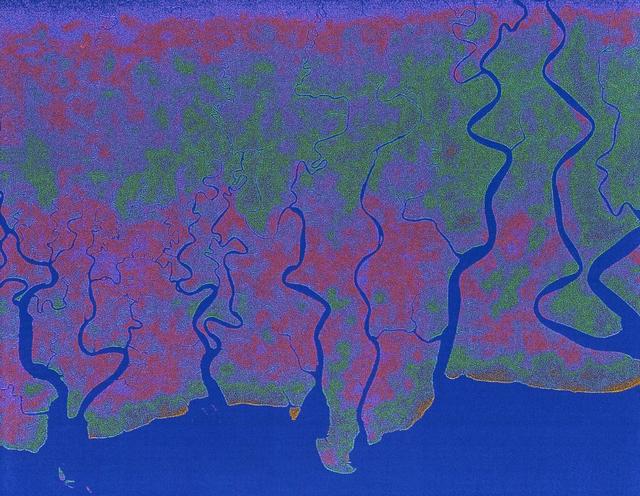
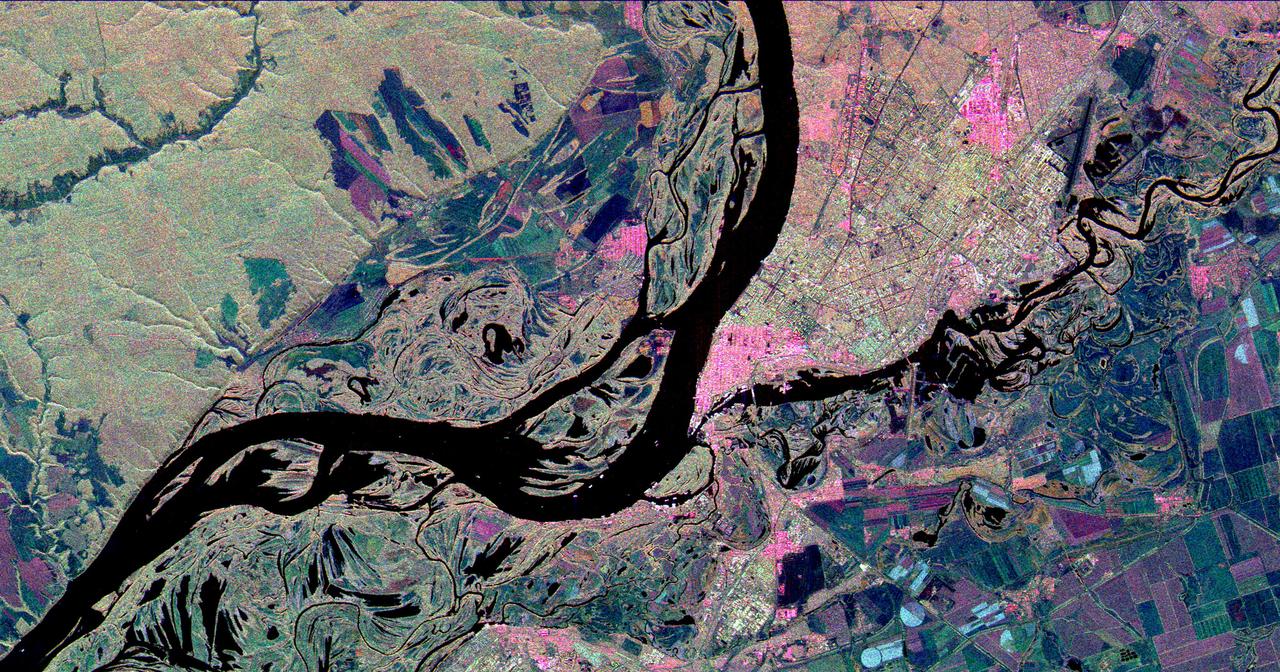
This is a radar image of the Mississippi River Delta where the river enters into the Gulf of Mexico along the coast of Louisiana. This multi-frequency image demonstrates the capability of the radar to distinguish different types of wetlands surfaces in river deltas. This image was acquired by the Spaceborne Imaging Radar-C/X-Band Synthetic Aperture Radar (SIR-C/X-SAR) aboard the space shuttle Endeavour on October 2, 1995. The image is centered on latitude 29.3 degrees North latitude and 89.28 degrees West longitude. The area shown is approximately 63 kilometers by 43 kilometers (39 miles by 26 miles). North is towards the upper right of the image. As the river enters the Gulf of Mexico, it loses energy and dumps its load of sediment that it has carried on its journey through the mid-continent. This pile of sediment, or mud, accumulates over the years building up the delta front. As one part of the delta becomes clogged with sediment, the delta front will migrate in search of new areas to grow. The area shown on this image is the currently active delta front of the Mississippi. The migratory nature of the delta forms natural traps for oil and the numerous bright spots along the outside of the delta are drilling platforms. Most of the land in the image consists of mud flats and marsh lands. There is little human settlement in this area due to the instability of the sediments. The main shipping channel of the Mississippi River is the broad red stripe running northwest to southeast down the left side of the image. The bright spots within the channel are ships. The colors in the image are assigned to different frequencies and polarizations of the radar as follows: red is L-band vertically transmitted, vertically received; green is C-band vertically transmitted, vertically received; blue is X-band vertically transmitted, vertically received. http://photojournal.jpl.nasa.gov/catalog/PIA01784
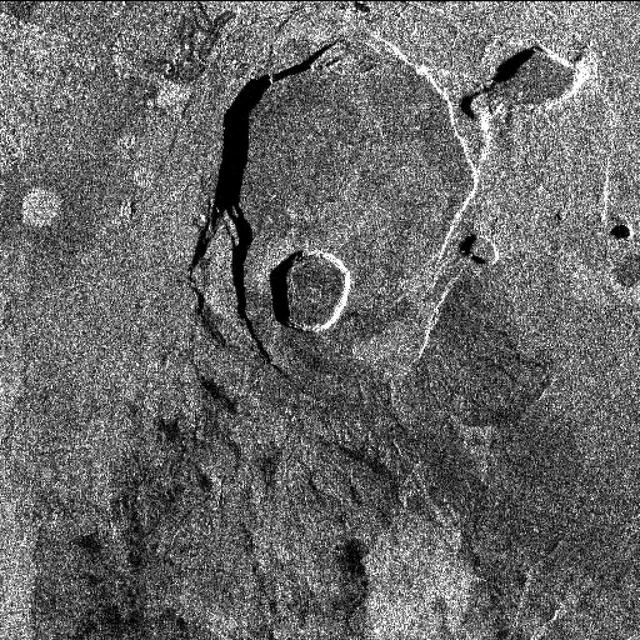
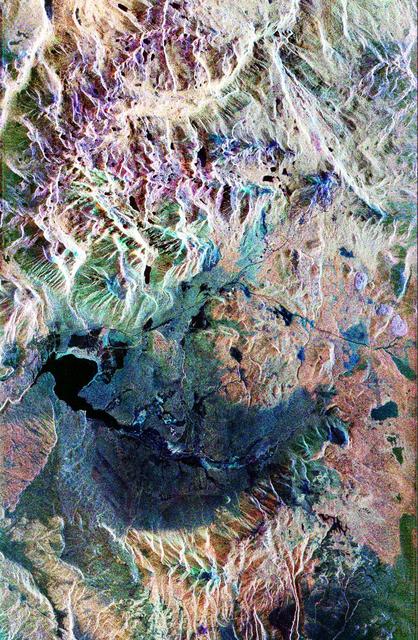
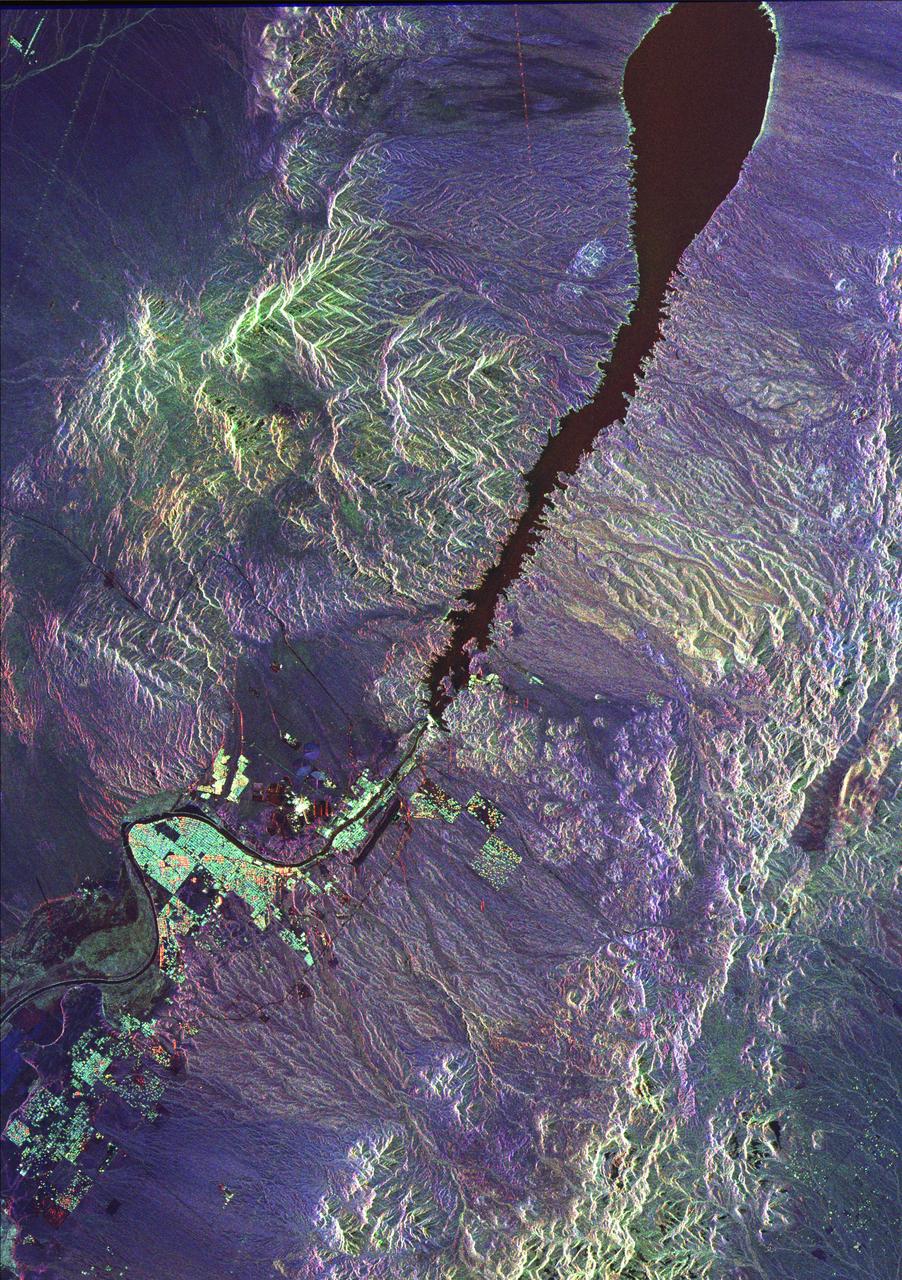
This is a three-dimensional perspective view of Long Valley, California by the Spaceborne Imaging Radar-C/X-band Synthetic Aperture Radar on board the space shuttle Endeavour. This view was constructed by overlaying a color composite SIR-C image on a digital elevation map. The digital elevation map was produced using radar interferometry, a process by which radar data are acquired on different passes of the space shuttle and, which then, are compared to obtain elevation information. The data were acquired on April 13, 1994 and on October 3, 1994, during the first and second flights of the SIR-C/X-SAR radar instrument. The color composite radar image was produced by assigning red to the C-band (horizontally transmitted and vertically received) polarization; green to the C-band (vertically transmitted and received) polarization; and blue to the ratio of the two data sets. Blue areas in the image are smooth and yellow areas are rock outcrops with varying amounts of snow and vegetation. The view is looking north along the northeastern edge of the Long Valley caldera, a volcanic collapse feature created 750,000 years ago and the site of continued subsurface activity. Crowley Lake is off the image to the left. http://photojournal.jpl.nasa.gov/catalog/PIA01757
This three-dimensional perspective view of Long Valley, California was created from data taken by the Spaceborne Imaging Radar-C/X-band Synthetic Aperture Radar on board the space shuttle Endeavour. This image was constructed by overlaying a color composite SIR-C radar image on a digital elevation map. The digital elevation map was produced using radar interferometry, a process by which radar data are acquired on different passes of the space shuttle. The two data passes are compared to obtain elevation information. The interferometry data were acquired on April 13,1994 and on October 3, 1994, during the first and second flights of the SIR-C/X-SAR instrument. The color composite radar image was taken in October and was produced by assigning red to the C-band (horizontally transmitted and vertically received) polarization; green to the C-band (vertically transmitted and received) polarization; and blue to the ratio of the two data sets. Blue areas in the image are smooth and yellow areas are rock outcrops with varying amounts of snow and vegetation. The view is looking north along the northeastern edge of the Long Valley caldera, a volcanic collapse feature created 750,000 years ago and the site of continued subsurface activity. Crowley Lake is the large dark feature in the foreground. http://photojournal.jpl.nasa.gov/catalog/PIA01769
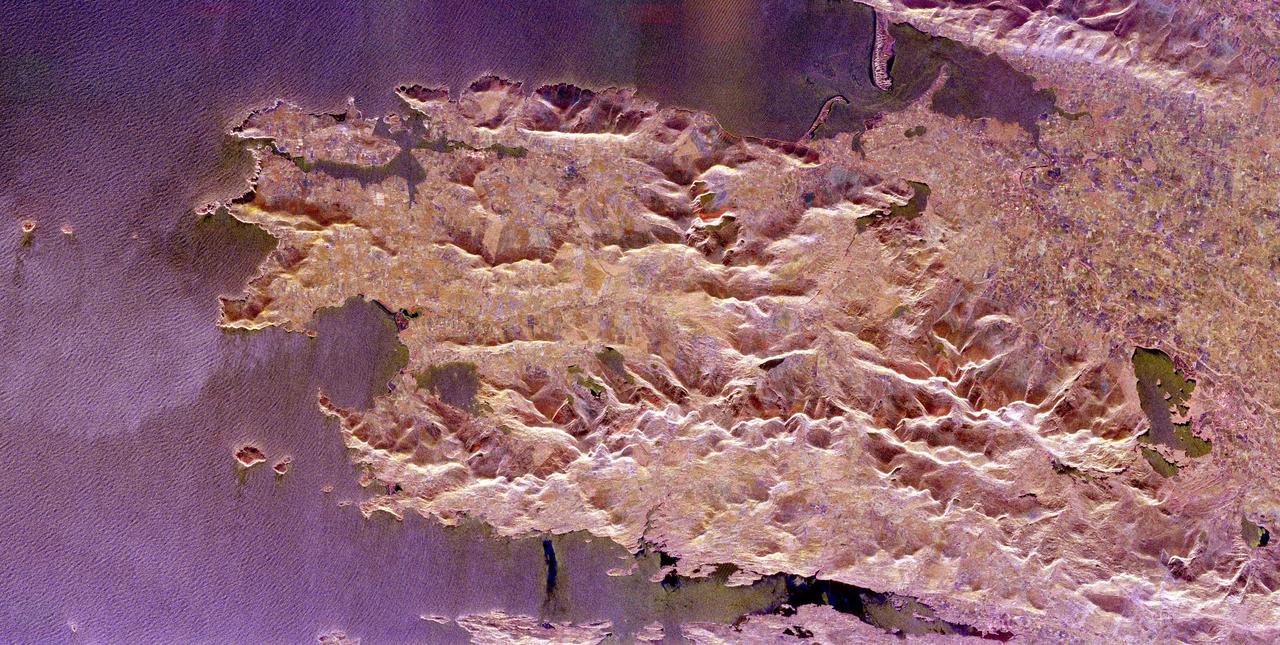
This false-color composite radar image of the Mammoth Mountain area in the Sierra Nevada Mountains, California, was acquired by the Spaceborne Imaging Radar-C and X-band Synthetic Aperture Radar aboard the space shuttle Endeavour on its 67th orbit on October 3, 1994. The image is centered at 37.6 degrees north latitude and 119.0 degrees west longitude. The area is about 39 kilometers by 51 kilometers (24 miles by 31 miles). North is toward the bottom, about 45 degrees to the right. In this image, red was created using L-band (horizontally transmitted/vertically received) polarization data; green was created using C-band (horizontally transmitted/vertically received) polarization data; and blue was created using C-band (horizontally transmitted and received) polarization data. Crawley Lake appears dark at the center left of the image, just above or south of Long Valley. The Mammoth Mountain ski area is visible at the top right of the scene. The red areas correspond to forests, the dark blue areas are bare surfaces and the green areas are short vegetation, mainly brush. The purple areas at the higher elevations in the upper part of the scene are discontinuous patches of snow cover from a September 28 storm. New, very thin snow was falling before and during the second space shuttle pass. In parallel with the operational SIR-C data processing, an experimental effort is being conducted to test SAR data processing using the Jet Propulsion Laboratory's massively parallel supercomputing facility, centered around the Cray Research T3D. These experiments will assess the abilities of large supercomputers to produce high throughput Synthetic Aperture Radar processing in preparation for upcoming data-intensive SAR missions. The image released here was produced as part of this experimental effort. http://photojournal.jpl.nasa.gov/catalog/PIA01746
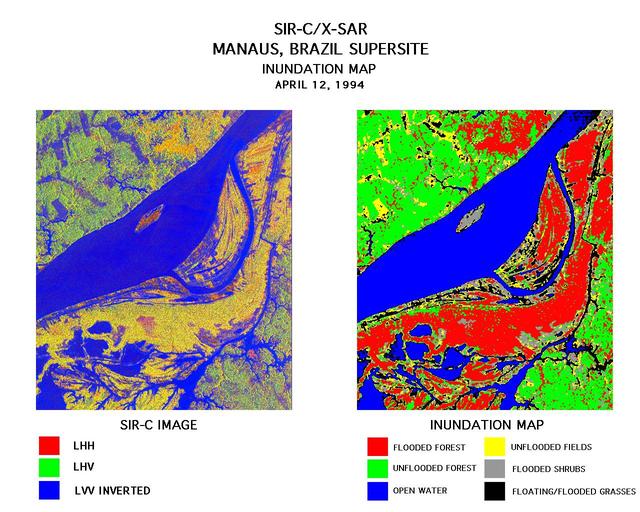
These two images were created using data from the Spaceborne Imaging Radar-C/X-Band Synthetic Aperture Radar (SIR-C/X-SAR). On the left is a false-color image of Manaus, Brazil acquired April 12, 1994, onboard space shuttle Endeavour. In the center of this image is the Solimoes River just west of Manaus before it combines with the Rio Negro to form the Amazon River. The scene is around 8 by 8 kilometers (5 by 5 miles) with north toward the top. The radar image was produced in L-band where red areas correspond to high backscatter at HH polarization, while green areas exhibit high backscatter at HV polarization. Blue areas show low backscatter at VV polarization. The image on the right is a classification map showing the extent of flooding beneath the forest canopy. The classification map was developed by SIR-C/X-SAR science team members at the University of California,Santa Barbara. The map uses the L-HH, L-HV, and L-VV images to classify the radar image into six categories: Red flooded forest Green unflooded tropical rain forest Blue open water, Amazon river Yellow unflooded fields, some floating grasses Gray flooded shrubs Black floating and flooded grasses Data like these help scientists evaluate flood damage on a global scale. Floods are highly episodic and much of the area inundated is often tree-covered. http://photojournal.jpl.nasa.gov/catalog/PIA01712
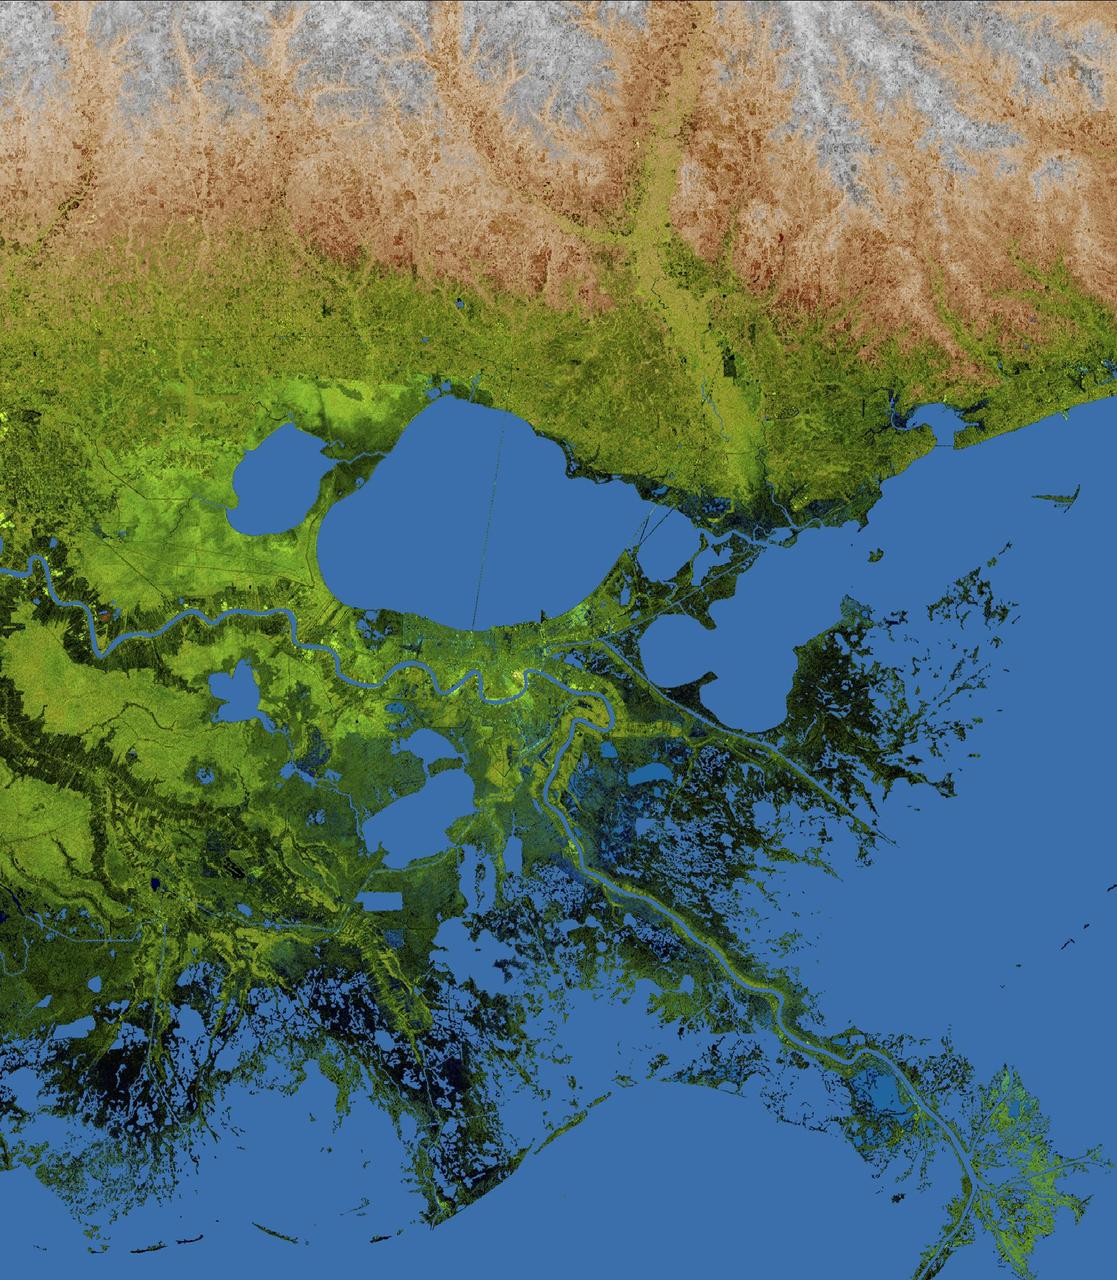
The geography of the New Orleans and Mississippi delta region is well shown in this radar image from the Shuttle Radar Topography Mission. In this image, bright areas show regions of high radar reflectivity, such as from urban areas, and elevations have been coded in color using height data also from the mission. Dark green colors indicate low elevations, rising through yellow and tan, to white at the highest elevations. New Orleans is situated along the southern shore of Lake Pontchartrain, the large, roughly circular lake near the center of the image. The line spanning the lake is the Lake Pontchartrain Causeway, the world's longest over water highway bridge. Major portions of the city of New Orleans are below sea level, and although it is protected by levees and sea walls, flooding during storm surges associated with major hurricanes is a significant concern. http://photojournal.jpl.nasa.gov/catalog/PIA04175
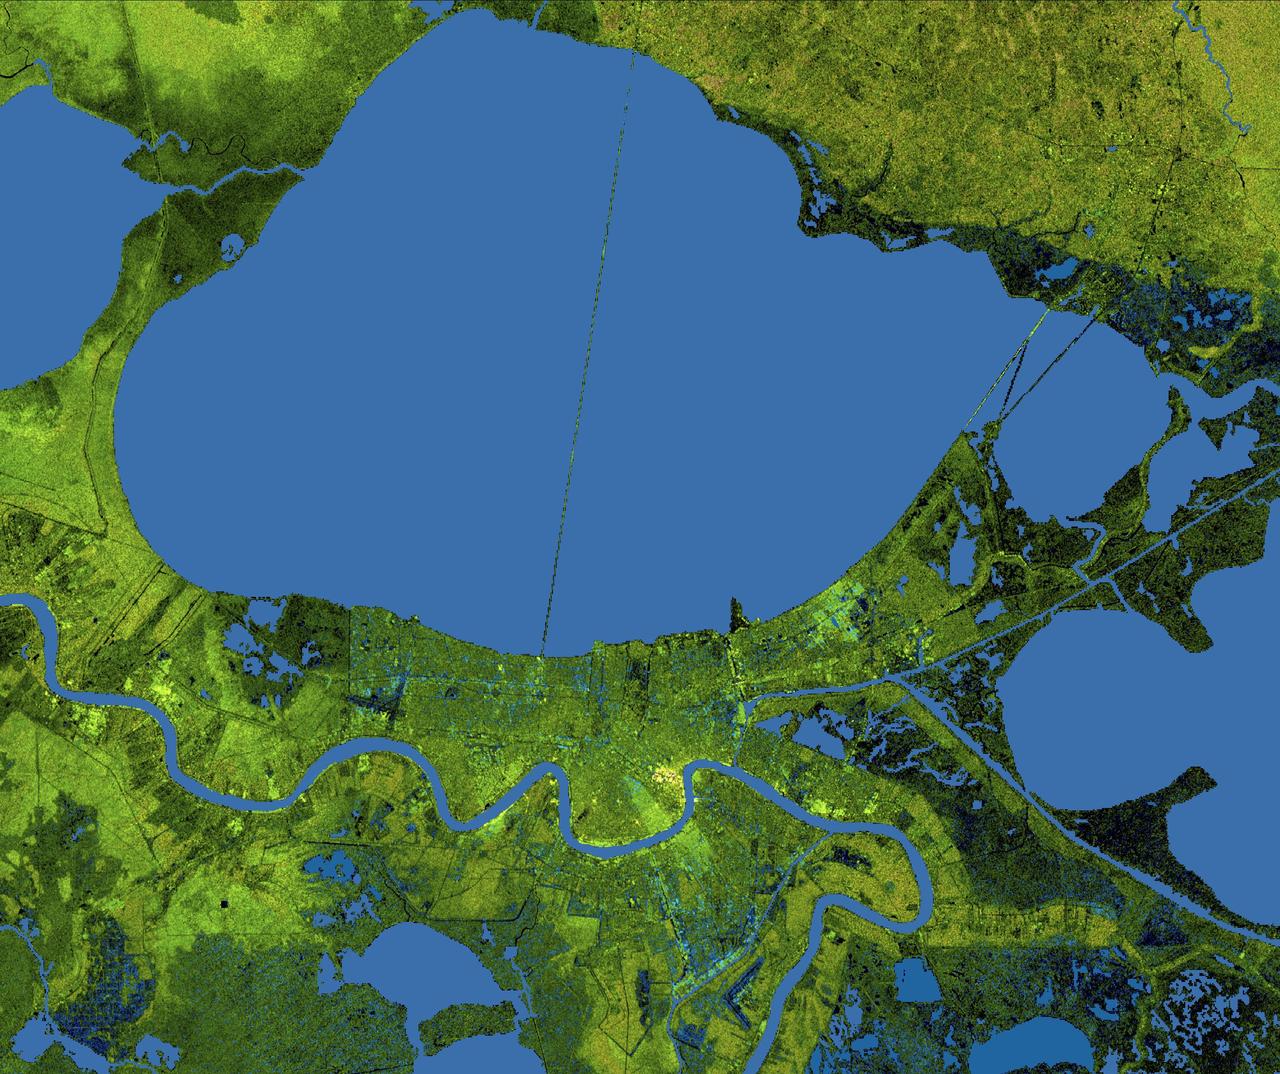
The city of New Orleans, situated on the southern shore of Lake Pontchartrain, is shown in this radar image from the Shuttle Radar Topography Mission (SRTM). In this image bright areas show regions of high radar reflectivity, such as from urban areas, and elevations have been coded in color using height data also from the SRTM mission. Dark green colors indicate low elevations, rising through yellow and tan, to white at the highest elevations. New Orleans is near the center of this scene, between the lake and the Mississippi River. The line spanning the lake is the Lake Pontchartrain Causeway, the world’s longest overwater highway bridge. Major portions of the city of New Orleans are actually below sea level, and although it is protected by levees and sea walls that are designed to protect against storm surges of 18 to 20 feet, flooding during storm surges associated with major hurricanes is a significant concern. http://photojournal.jpl.nasa.gov/catalog/PIA04174
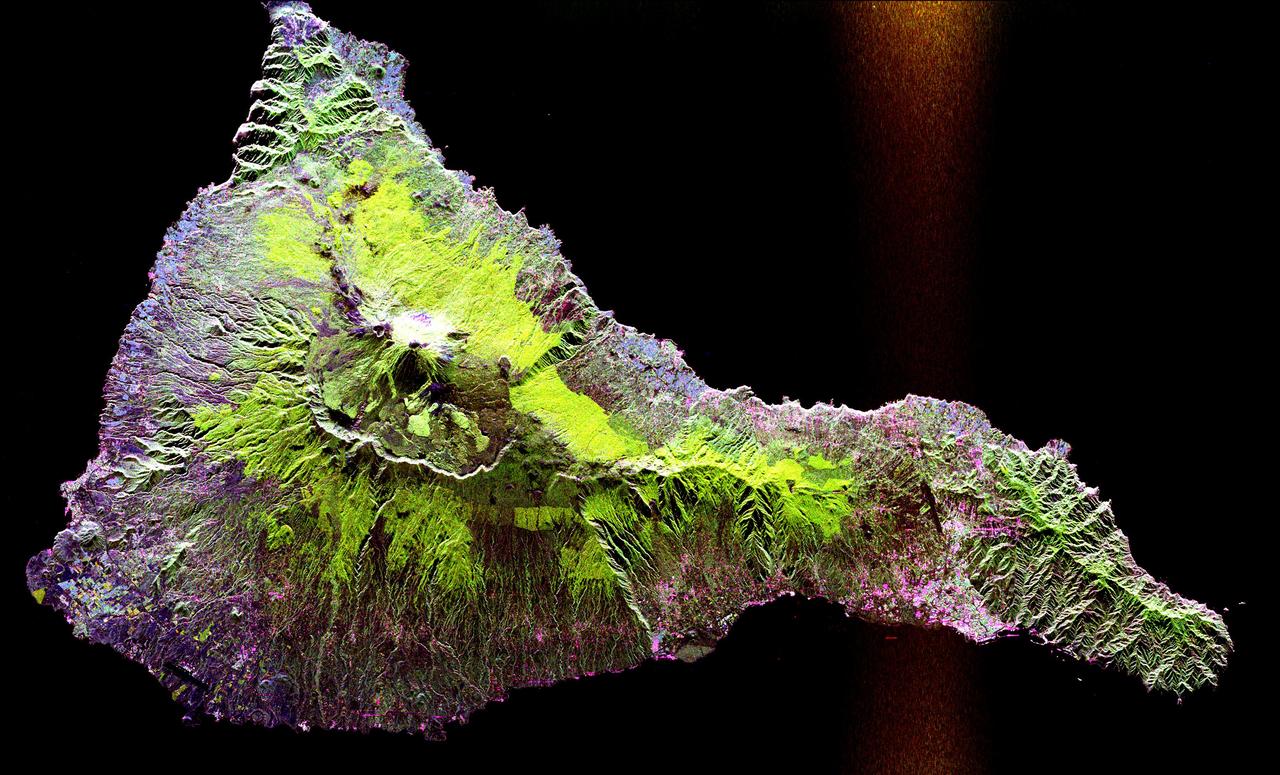
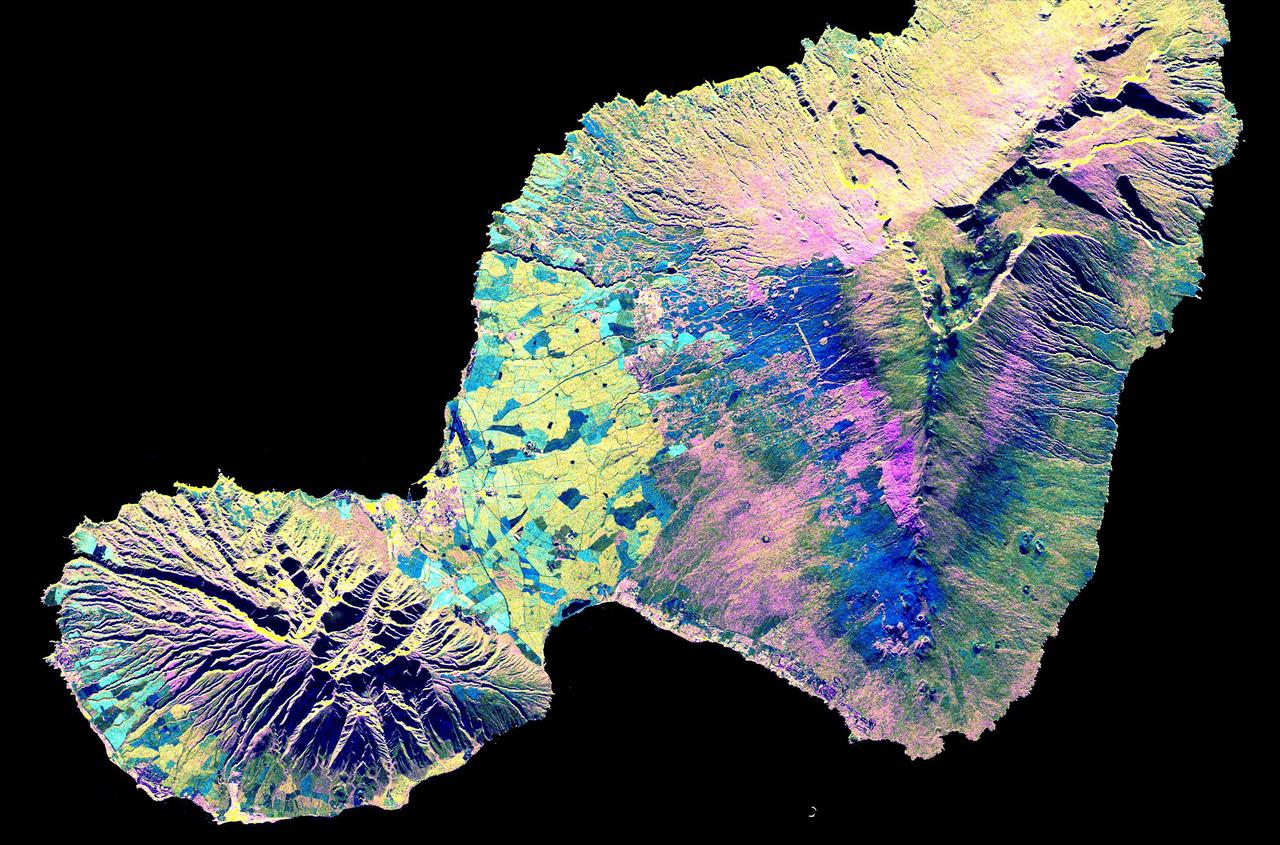
This radar image shows the Teide volcano on the island of Tenerife in the Canary Islands. The Canary Islands, part of Spain, are located in the eastern Atlantic Ocean off the coast of Morocco. Teide has erupted only once in the 20th Century, in 1909, but is considered a potentially threatening volcano due to its proximity to the city of Santa Cruz de Tenerife, shown in this image as the purple and white area on the lower right edge of the island. The summit crater of Teide, clearly visible in the left center of the image, contains lava flows of various ages and roughnesses that appear in shades of green and brown. Different vegetation zones, both natural and agricultural, are detected by the radar as areas of purple, green and yellow on the volcano's flanks. Scientists are using images such as this to understand the evolution of the structure of Teide, especially the formation of the summit caldera and the potential for collapse of the flanks. The volcano is one of 15 identified by scientists as potentially hazardous to local populations, as part of the international The image was acquired by the Spaceborne Imaging Radar-C/X-Band Synthetic Aperture Radar (SIR-C/X-SAR) onboard the space shuttle Endeavour on October 11, 1994. SIR-C/X-SAR, a joint mission of the German, Italian and the United States space agencies, is part of NASA's Mission to Planet Earth. The image is centered at 28.3 degrees North latitude and 16.6 degrees West longitude. North is toward the upper right. The area shown measures 90 kilometers by 54.5 kilometers (55.8 miles by 33.8 miles). The colors in the image are assigned to different frequencies and polarizations of the radar as follows: red is L-band horizontally transmitted, horizontally received; green is L-band horizontally transmitted, vertically received; blue is C-band horizontally transmitted, vertically received. http://photojournal.jpl.nasa.gov/catalog/PIA01779
This radar image shows the area west of the Nile River near Cairo, Egypt. The Nile River is the dark band along the right side of the image and it flows approximately due North from the bottom to the right. The boundary between dense urbanization and the desert can be clearly seen between the bright and dark areas in the center of the image. This boundary represents the approximate extent of yearly Nile flooding which played an important part in determining where people lived in ancient Egypt. This land usage pattern persists to this day. The pyramids at Giza appear as three bright triangles aligned with the image top just at the boundary of the urbanized area. They are also shown enlarged in the inset box in the top left of the image. The Great Pyramid of Khufu (Cheops in Greek) is the northern most of the three Giza pyramids. The side-looking radar illuminates the scene from the top, the two sides of the pyramids facing the radar reflect most of the energy back to the antenna and appear radar bright; the two sides away from the radar reflect less energy back and appear dark Two additional pyramids can be seen left of center in the lower portion of the image. The modern development in the desert on the left side of the image is the Sixth of October City, an area of factories and residences started by Anwar Sadat to relieve urban crowding. The image was taken on April 19, 1994 by the Spaceborne Imaging Radar-C/X-Band Synthetic Aperture Radar (SIR-C/X-SAR) aboard the shuttle Endeavour. SIR-C/X-SAR, a joint mission of the German, Italian and the United States space agencies, is part of NASA's Mission to Planet Earth. The image is centered on latitude 29.72 degrees North latitude and 30.83 degrees East longitude. The area shown is approximately 20 kilometers by 30 kilometers. The colors in the image are assigned to different frequencies and polarizations of the radar as follows: red is L-band horizontally transmitted, horizontally received; green is C-band horizontally transmitted, horizontally received; blue is C-band horizontally transmitted, vertically received. http://photojournal.jpl.nasa.gov/catalog/PIA01793
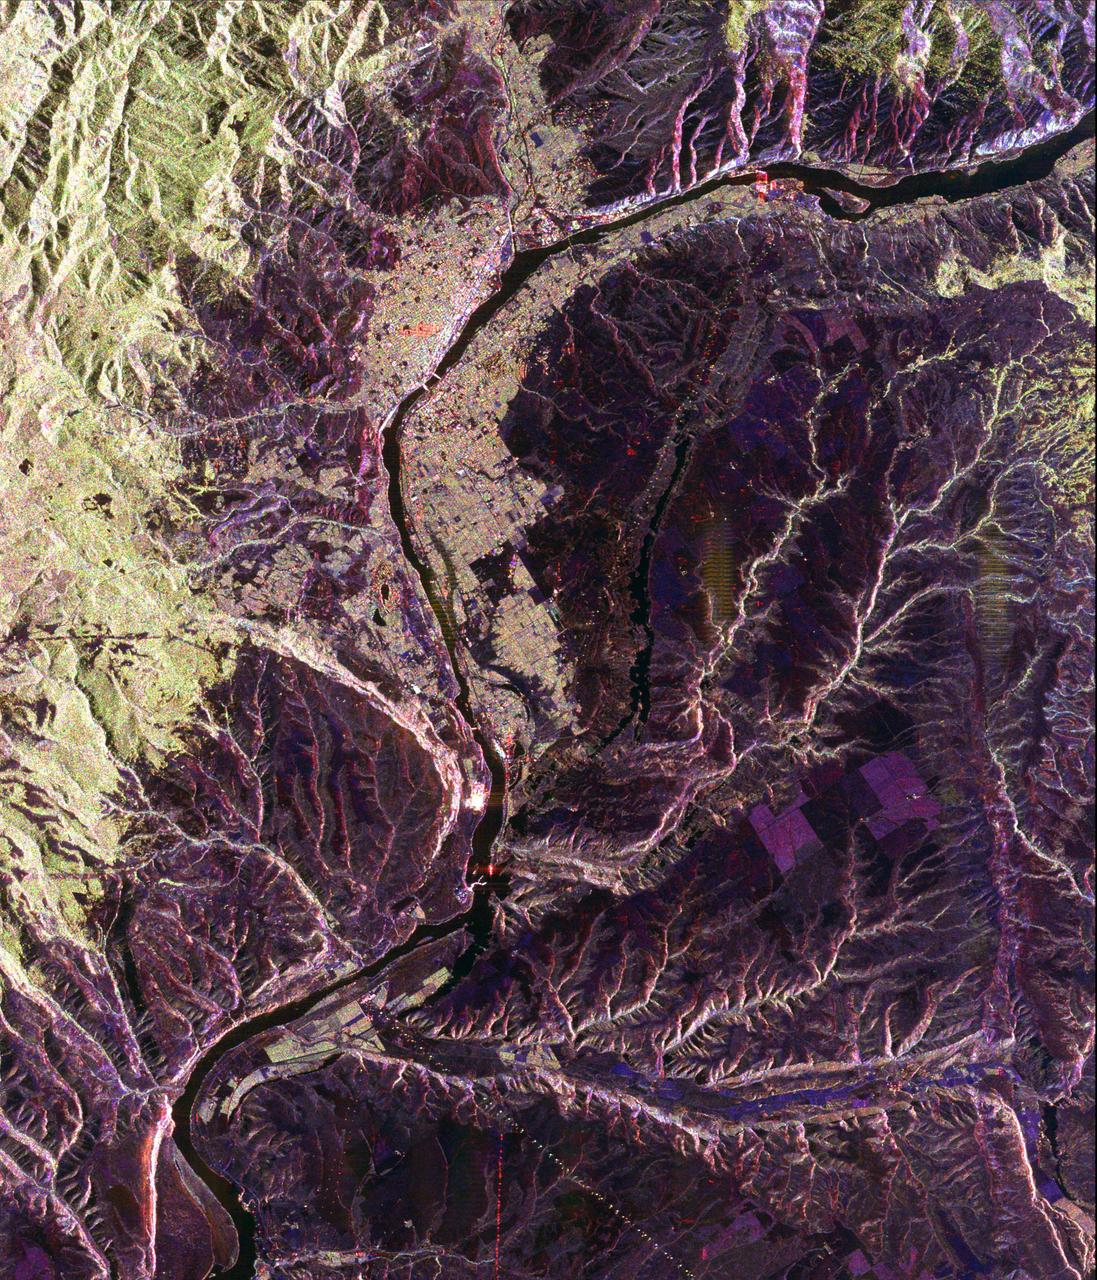
This three-frequency space radar image shows the city of Samara, Russia in pink and light green right of center. Samara is at the junction of the Volga and Samara Rivers approximately 800 kilometers 500 miles southeast of Moscow.
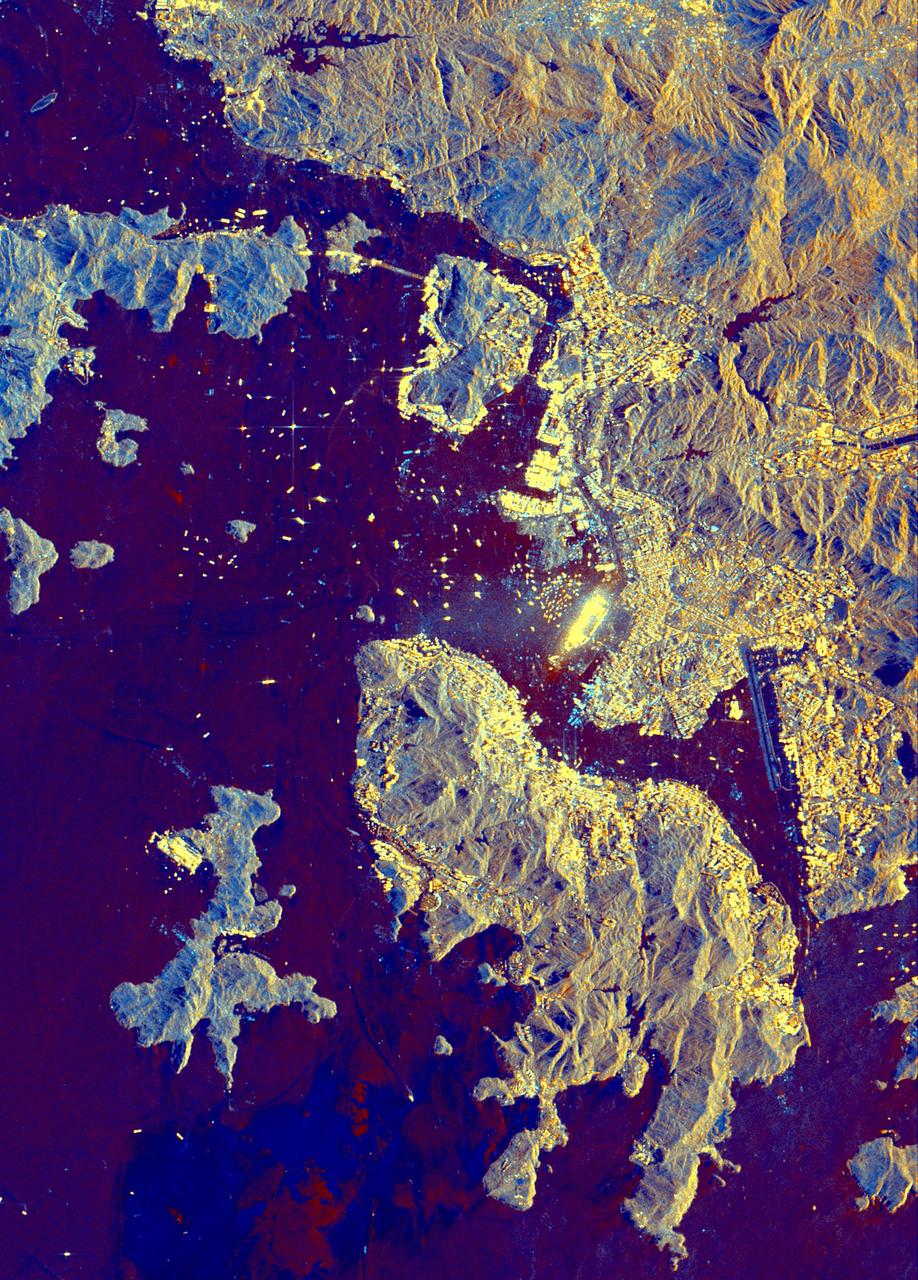
The northern end of the island country of Taiwan, including the capital city of Taipei, is shown in this spaceborne radar image. Taipei is the bright blue and red area in the lower center of the image.
This three-frequency spaceborne radar image shows the southern end of Vancouver Island on the west coast of Canada. The white area in the lower right is the city of Victoria, the capital of the province of British Columbia.
This space radar image of Athens, Greece, shows the sprawling, modern development of this ancient capital city. Densely populated urban areas appear in shades of pink and light green.
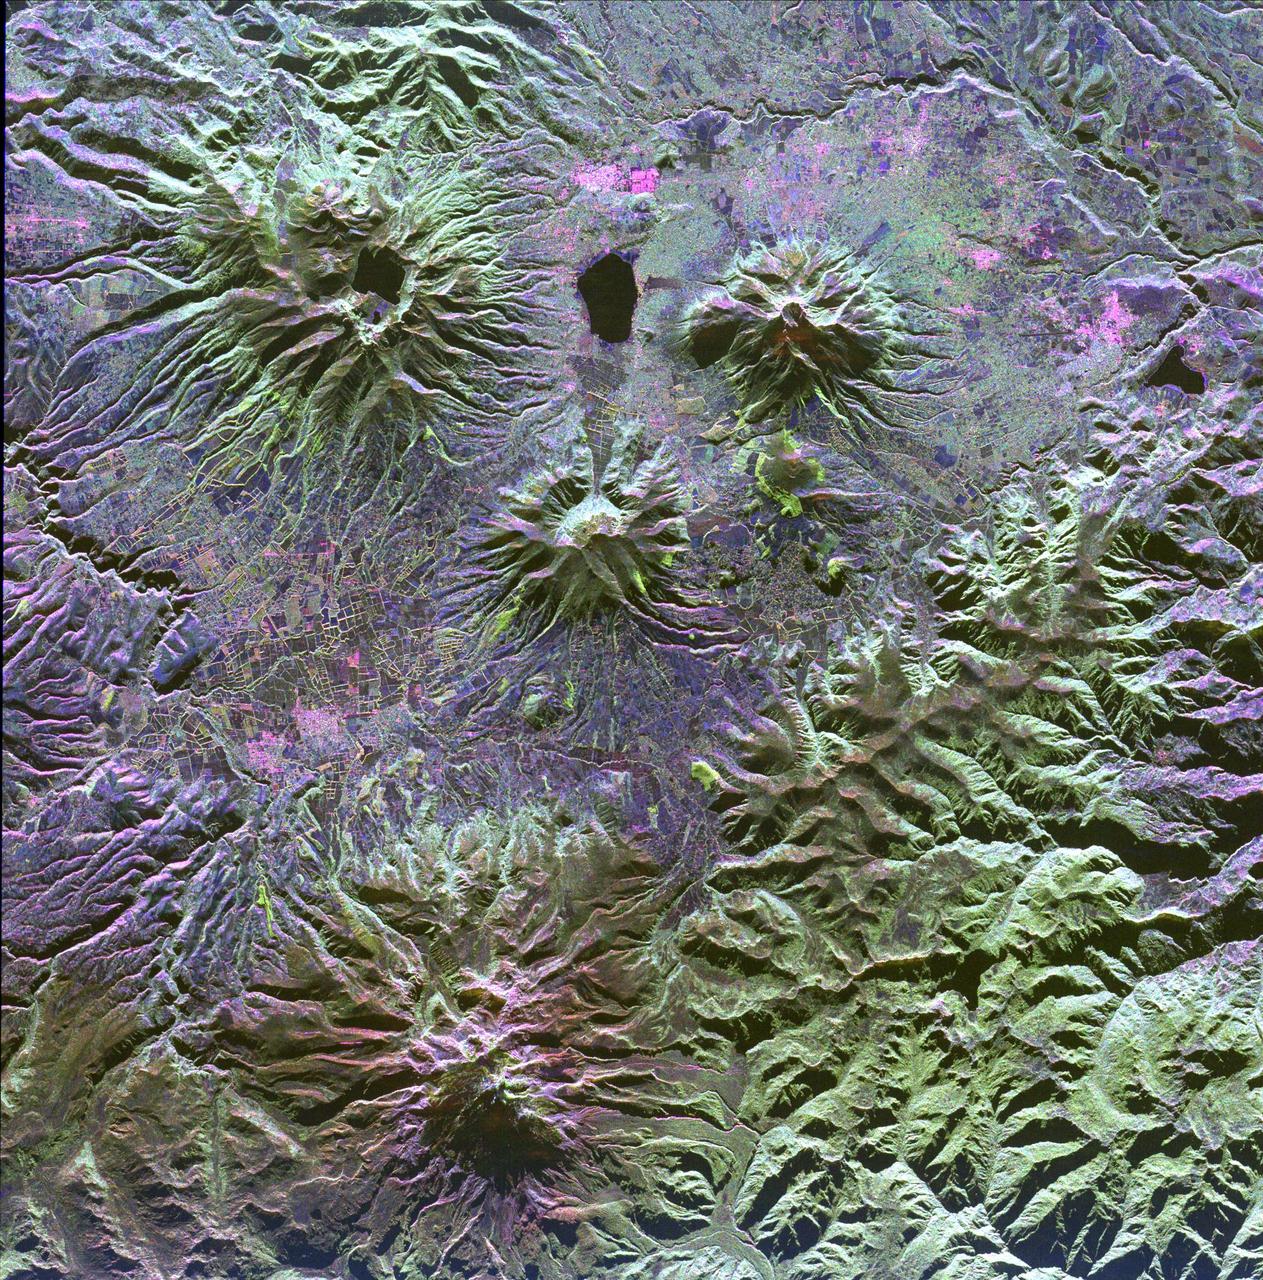
A family of dormant volcanoes dominates the landscape in this radar image of the Andes Mountains in northern Ecuador. The city of Otavalo, shown in pink, and Lake Otavalo lie within the triangle formed by three volcanoes in the upper part of the image.
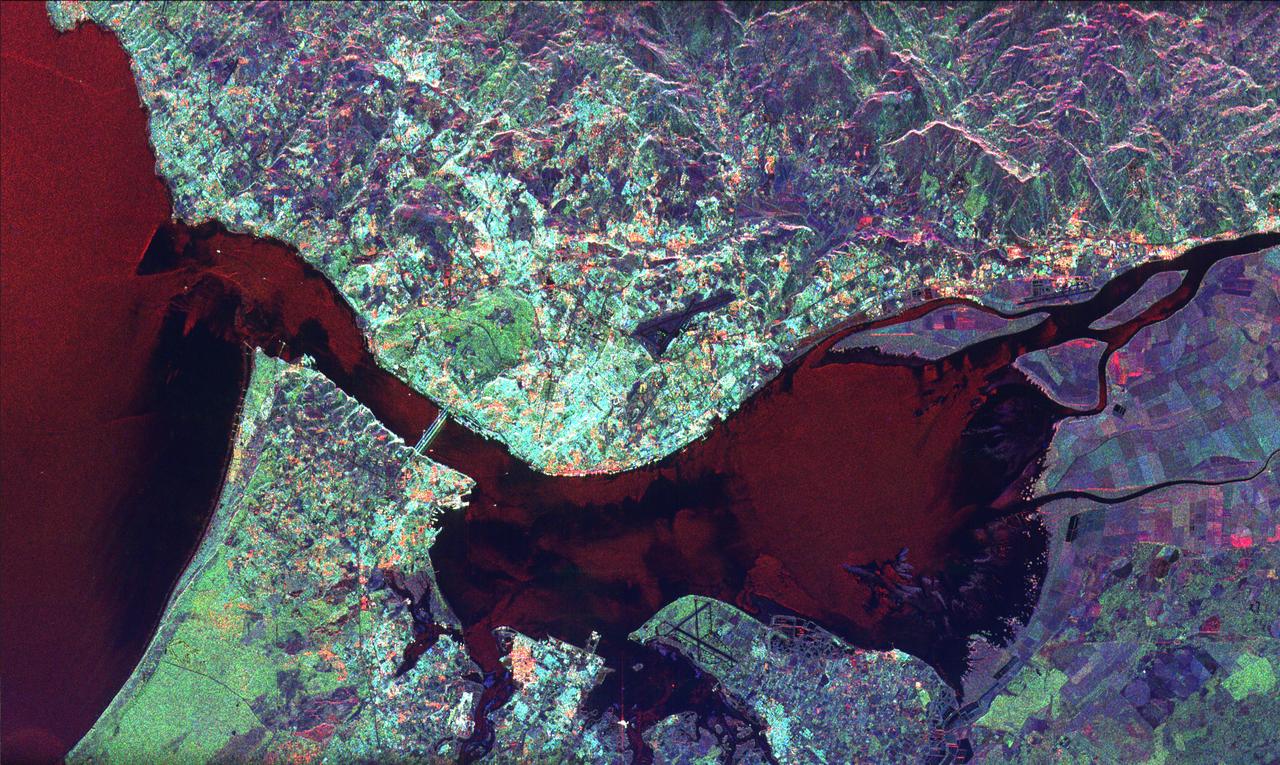
This radar image of Lisbon, Portugal illustrates the different land use patterns that are present in coastal Portugal. Lisbon, the national capital, lies on the north bank of the Rio Tejo where the river enters the Atlantic Ocean.
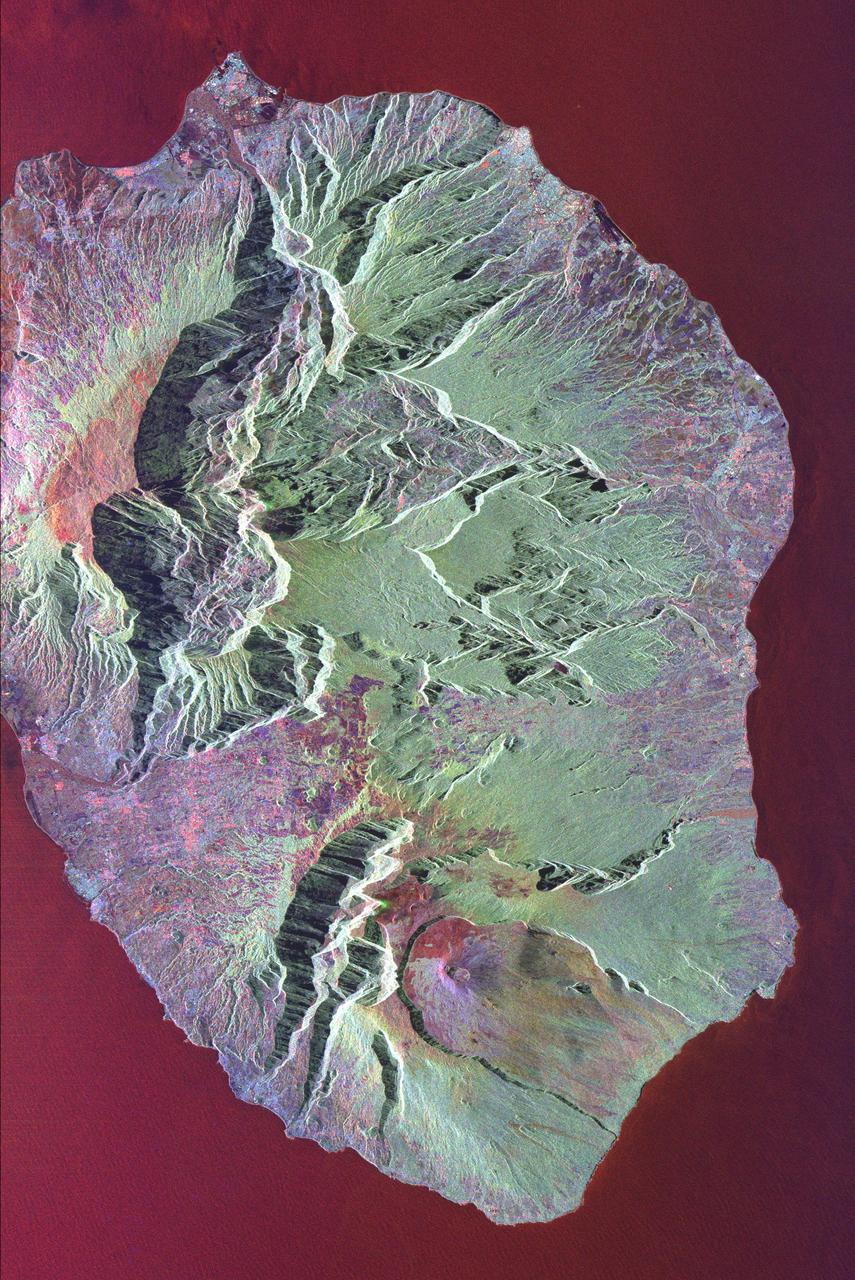
This radar image shows the volcanic island of Reunion, about 700 km 434 miles east of Madagascar in the southwest Indian Ocean. The southern half of the island is dominated by the active volcano, Piton de la Fournaise.
This is a false-color, three-frequency image of the Oberpfaffenhofen supersite, southwest of Munich in southern Germany, which shows the differences in what the three radar bands can see on the ground.
This space radar image illustrates the recent rapid urban development occurring along the lower Colorado River at the Nevada/Arizona state line. Lake Mojave is the dark feature that occupies the river valley in the upper half of the image.
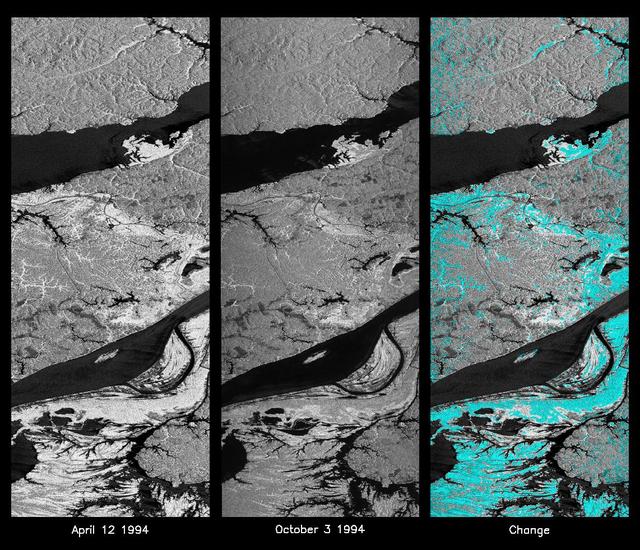
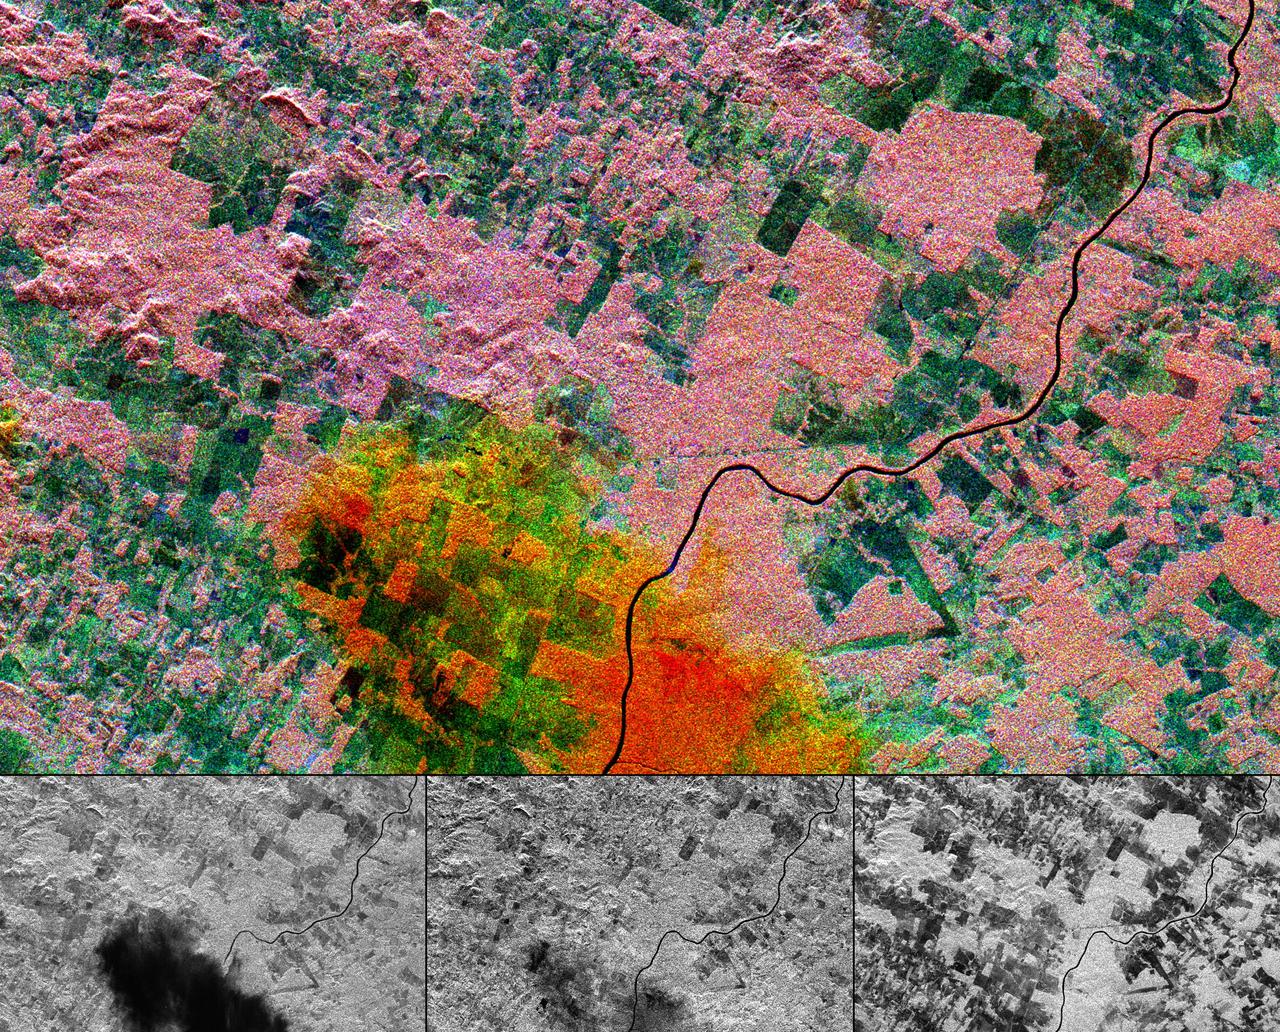
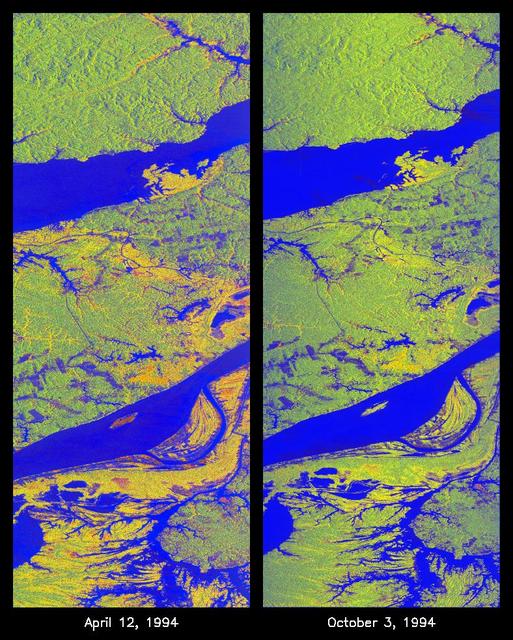
These L-band images of the Manaus region of Brazil were acquired by the Spaceborne Imaging Radar-C and X-band Synthetic Aperture Radar (SIR-C/X-SAR) aboard the space shuttle Endeavour. The left image was acquired on April 12, 1994, and the middle image was acquired on October 3, 1994. The area shown is approximately 8 kilometers by 40 kilometers (5 miles by 25 miles). The two large rivers in this image, the Rio Negro (top) and the Rio Solimoes (bottom), combine at Manaus (west of the image) to form the Amazon River. The image is centered at about 3 degrees south latitude and 61 degrees west longitude. North is toward the top left of the images. The differences in brightness between the images reflect changes in the scattering of the radar channel. In this case, the changes are indicative of flooding. A flooded forest has a higher backscatter at L-band (horizontally transmitted and received) than an unflooded river. The extent of the flooding is much greater in the April image than in the October image, and corresponds to the annual, 10-meter (33-foot) rise and fall of the Amazon River. A third image at right shows the change in the April and October images and was created by determining which areas had significant decreases in the intensity of radar returns. These areas, which appear blue on the third image at right, show the dramatic decrease in the extent of flooded forest, as the level of the Amazon River falls. The flooded forest is a vital habitat for fish and floating meadows are an important source of atmospheric methane. This demonstrates the capability of SIR-C/X-SAR to study important environmental changes that are impossible to see with optical sensors over regions such as the Amazon, where frequent cloud cover and dense forest canopies obscure monitoring of floods. Field studies by boat, on foot and in low-flying aircraft by the University of California at Santa Barbara, in collaboration with Brazil's Instituto Nacional de Pesguisas Estaciais, during the first and second flights of the SIR-C/X-SAR system have validated the interpretation of the radar images. http://photojournal.jpl.nasa.gov/catalog/PIA01740
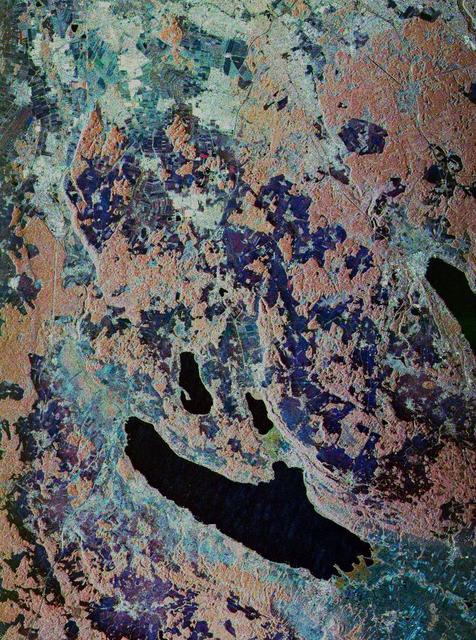
The Iveragh Peninsula, one of the four peninsulas in southwestern Ireland, is shown in this spaceborne radar image. The lakes of Killarney National Park are the green patches on the left side of the image.
These spaceborne radar images show a segment of the Great Wall of China in a desert region of north-central China, about 700 kilometers 434 miles west of Beijing.
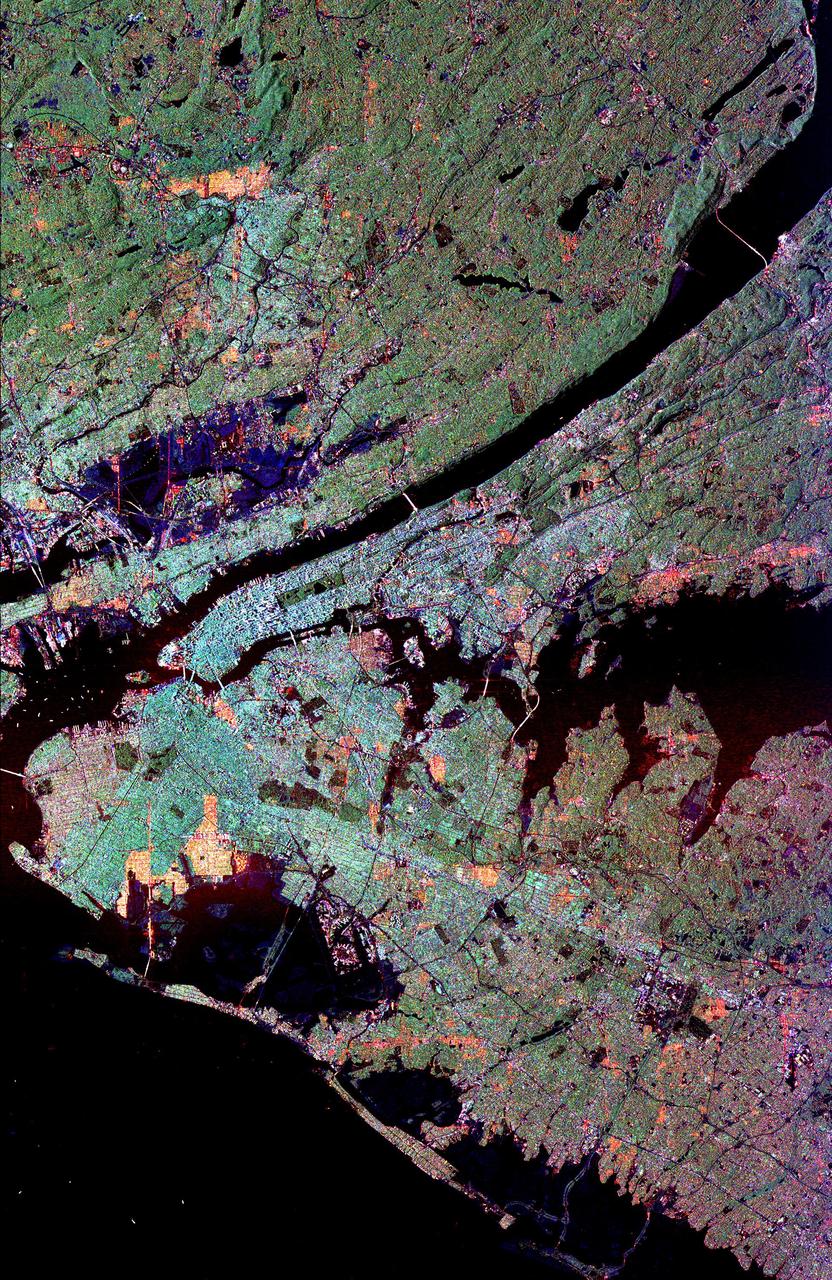
This radar image of the New York city metropolitan area. The island of Manhattan appears in the center of the image. The green-colored rectangle on Manhattan is Central Park.
This spaceborne radar image shows the city of Phnom Penh, the capital of Cambodia. Phnom Penh lies at the confluence of the Mekong River and the Basak Sab.
This spaceborne radar image of a mineral-rich region in southern China is being used by geologists to identify potential new areas for mineral exploration.
This is a three-dimensional perspective view of Owens Valley, near the town of Bishop, California that was created by combining two spaceborne radar images using a technique known as interferometry.
This image of the Mauna Loa volcano on the Big Island of Hawaii shows the capability of imaging radar to map lava flows and other volcanic structures.
This is a radar image of a region in northern Sudan called the Keraf Suture that reveals newly discovered geologic features buried beneath layers of sand.
This spaceborne radar image shows part of the vast Namib Sand Sea on the west coast of southern Africa, just northeast of the city of Luderitz, Namibia.
This spaceborne radar image shows the city of Honolulu, Hawaii and adjacent areas on the island of Oahu. Honolulu lies on the south shore of the island, along the bottom of this image.
This spaceborne radar image shows the area just north of the city of Cairo, Egypt, where the Nile River splits into two main branches.
During its final targeted flyby of Titan on April 22, 2017, Cassini's radar mapper got the mission's last close look at the moon's surface. On this 127th targeted pass by Titan (unintuitively named "T-126"), the radar was used to take two images of the surface, shown at left and right. Both images are about 200 miles (300 kilometers) in width, from top to bottom. Objects appear bright when they are tilted toward the spacecraft or have rough surfaces; smooth areas appear dark. At left are the same bright, hilly terrains and darker plains that Cassini imaged during its first radar pass of Titan, in 2004. Scientists do not see obvious evidence of changes in this terrain over the 13 years since the original observation. At right, the radar looked once more for Titan's mysterious "magic island" (PIA20021) in a portion of one of the large hydrocarbon seas, Ligeia Mare. No "island" feature was observed during this pass. Scientists continue to work on what the transient feature might have been, with waves and bubbles being two possibilities. In between the two parts of its imaging observation, the radar instrument switched to altimetry mode, in order to make a first-ever (and last-ever) measurement of the depths of some of the lakes that dot the north polar region. For the measurements, the spacecraft pointed its antenna straight down at the surface and the radar measured the time delay between echoes from the lakes' surface and bottom. A graph is available at https://photojournal.jpl.nasa.gov/catalog/PIA21626
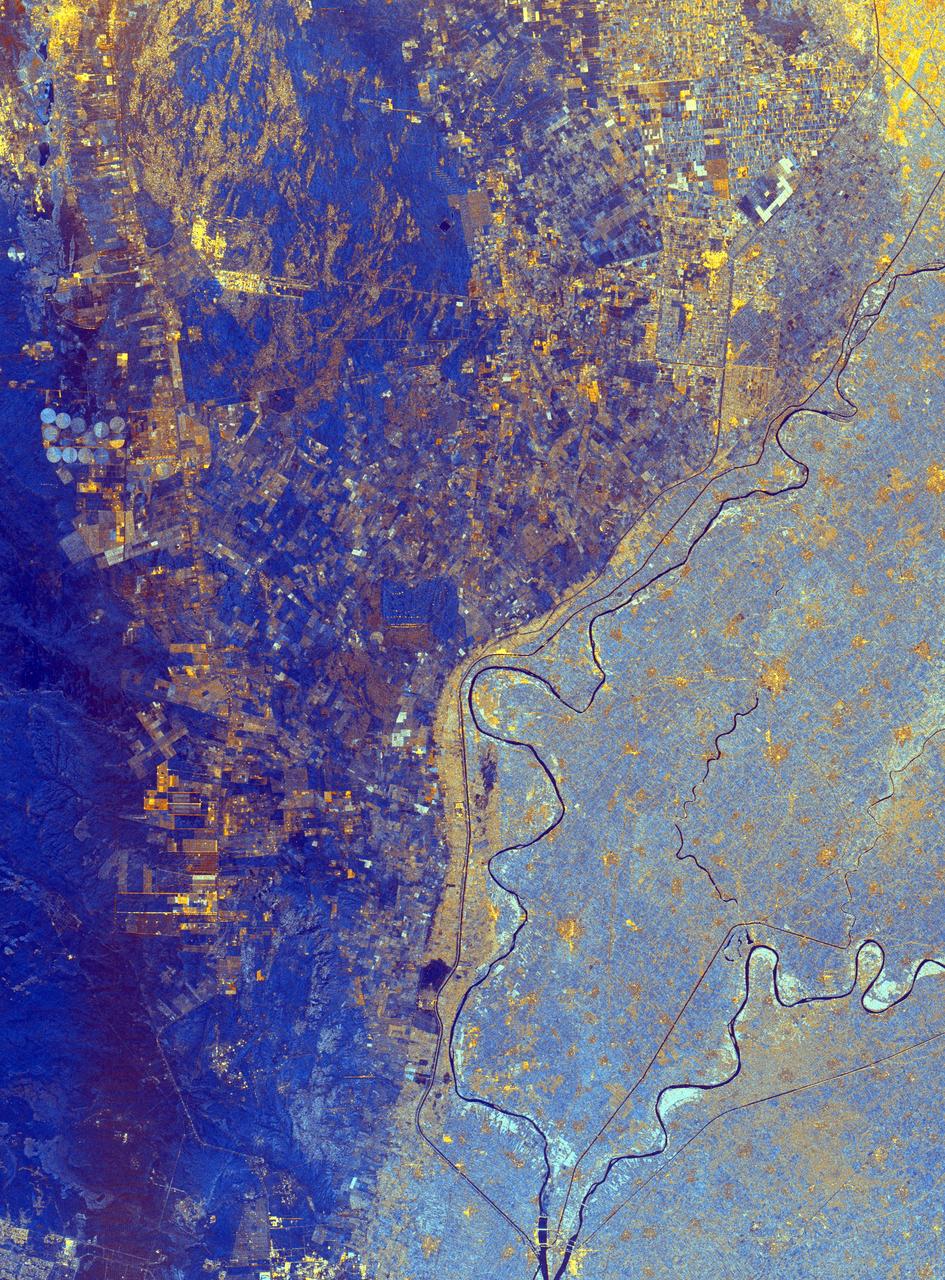
This image of Houston, Texas, shows the amount of detail that is possible to obtain using spaceborne radar imaging. Images such as this -- obtained by the Spaceborne Imaging Radar-C/X-band Synthetic Aperture Radar (SIR-C/X-SAR) flying aboard the space shuttle Endeavor last fall -- can become an effective tool for urban planners who map and monitor land use patterns in urban, agricultural and wetland areas. Central Houston appears pink and white in the upper portion of the image, outlined and crisscrossed by freeways. The image was obtained on October 10, 1994, during the space shuttle's 167th orbit. The area shown is 100 kilometers by 60 kilometers (62 miles by 38 miles) and is centered at 29.38 degrees north latitude, 95.1 degrees west longitude. North is toward the upper left. The pink areas designate urban development while the green-and blue-patterned areas are agricultural fields. Black areas are bodies of water, including Galveston Bay along the right edge and the Gulf of Mexico at the bottom of the image. Interstate 45 runs from top to bottom through the image. The narrow island at the bottom of the image is Galveston Island, with the city of Galveston at its northeast (right) end. The dark cross in the upper center of the image is Hobby Airport. Ellington Air Force Base is visible below Hobby on the other side of Interstate 45. Clear Lake is the dark body of water in the middle right of the image. The green square just north of Clear Lake is Johnson Space Center, home of Mission Control and the astronaut training facilities. The black rectangle with a white center that appears to the left of the city center is the Houston Astrodome. The colors in this image were obtained using the follow radar channels: red represents the L-band (horizontally transmitted, vertically received); green represents the C-band (horizontally transmitted, vertically received); blue represents the C-band (horizontally transmitted and received). http://photojournal.jpl.nasa.gov/catalog/PIA01783
This is a radar image of San Francisco, California, taken on October 3,1994. The image is about 40 kilometers by 55 kilometers (25 miles by 34 miles) with north toward the upper right. Downtown San Francisco is visible in the center of the image with the city of Oakland east (to the right) across San Francisco Bay. Also visible in the image is the Golden Gate Bridge (left center) and the Bay Bridge connecting San Francisco and Oakland. North of the Bay Bridge is Treasure Island. Alcatraz Island appears as a small dot northwest of Treasure Island. This image was acquired by the Spaceborne Imaging Radar-C and X-band Synthetic Aperture Radar (SIR-C/X-SAR) aboard the space shuttle Endeavour on orbit 56. The image is centered at 37 degrees north latitude, 122degrees west longitude. This single-frequency SIR-C image was obtained by the L-band (24 cm) radar channel, horizontally transmitted and received. Portions of the Pacific Ocean visible in this image appear very dark as do other smooth surfaces such as airport runways. Suburban areas, with the low-density housing and tree-lined streets that are typical of San Francisco, appear as lighter gray. Areas with high-rise buildings, such as those seen in the downtown areas, appear in very bright white, showing a higher density of housing and streets which run parallel to the radar flight track. http://photojournal.jpl.nasa.gov/catalog/PIA01751
This is a radar image of the central part of the island of Sumatra in Indonesia that shows how the tropical rainforest typical of this country is being impacted by human activity. Native forest appears in green in this image, while prominent pink areas represent places where the native forest has been cleared. The large rectangular areas have been cleared for palm oil plantations. The bright pink zones are areas that have been cleared since 1989, while the dark pink zones are areas that were cleared before 1989. These radar data were processed as part of an effort to assist oil and gas companies working in the area to assess the environmental impact of both their drilling operations and the activities of the local population. Radar images are useful in these areas because heavy cloud cover and the persistent smoke and haze associated with deforestation have prevented usable visible-light imagery from being acquired since 1989. The dark shapes in the upper right (northeast) corner of the image are a chain of lakes in flat coastal marshes. This image was acquired in October 1994 by the Spaceborne Imaging Radar C/X-Band Synthetic Aperture Radar (SIR-C/X-SAR) onboard the space shuttle Endeavour. Environmental changes can be easily documented by comparing this image with visible-light data that were acquired in previous years by the Landsat satellite. The image is centered at 0.9 degrees north latitude and 101.3 degrees east longitude. The area shown is 50 kilometers by 100 kilometers (31 miles by 62 miles). The colors in the image are assigned to different frequencies and polarizations of the radar as follows: red is L-band horizontally transmitted, horizontally received; green is L-band horizontally transmitted, vertically received; blue is L-band vertically transmitted, vertically received. SIR-C/X-SAR, a joint mission of the German, Italian and United States space agencies, is part of NASA's Mission to Planet Earth program. http://photojournal.jpl.nasa.gov/catalog/PIA01797
This radar image shows the massive urbanization of Los Angeles, California. The image extends from the Santa Monica Bay at the left to the San Gabriel Mountains at the right. Downtown Los Angeles is in the center of the image. The runways of the Los Angeles International Airport appear as black strips at the left center of the image. The waterways of Marina del Rey are seen just above the airport. The San Gabriel Mountains and the city of Pasadena are at the right center of the image. Black areas on the mountains on the right are fire scars from the 1993 Altadena fire. The Rose Bowl is shown as a small circle near the right center. The complex freeway system is visible as dark lines throughout the image. Some city areas, such as Santa Monica in the upper left, appear red due to the alignment of streets and buildings to the incoming radar beam. The image was acquired by the Spaceborne Imaging Radar-C/X-band Synthetic Aperture Radar (SIR-C/X-SAR) onboard the space shuttle Endeavour on October 3, 1994. SIR-C/X-SAR, a joint mission of the German, Italian and the United States space agencies, is part of NASA's Mission to Planet Earth. This image is centered at 34.04 degrees North latitude and 118.2 degrees West longitude with North pointing toward the upper right. The area shown measures 40 kilometers by 50 kilometers (25 miles by 31 miles). http://photojournal.jpl.nasa.gov/catalog/PIA01789
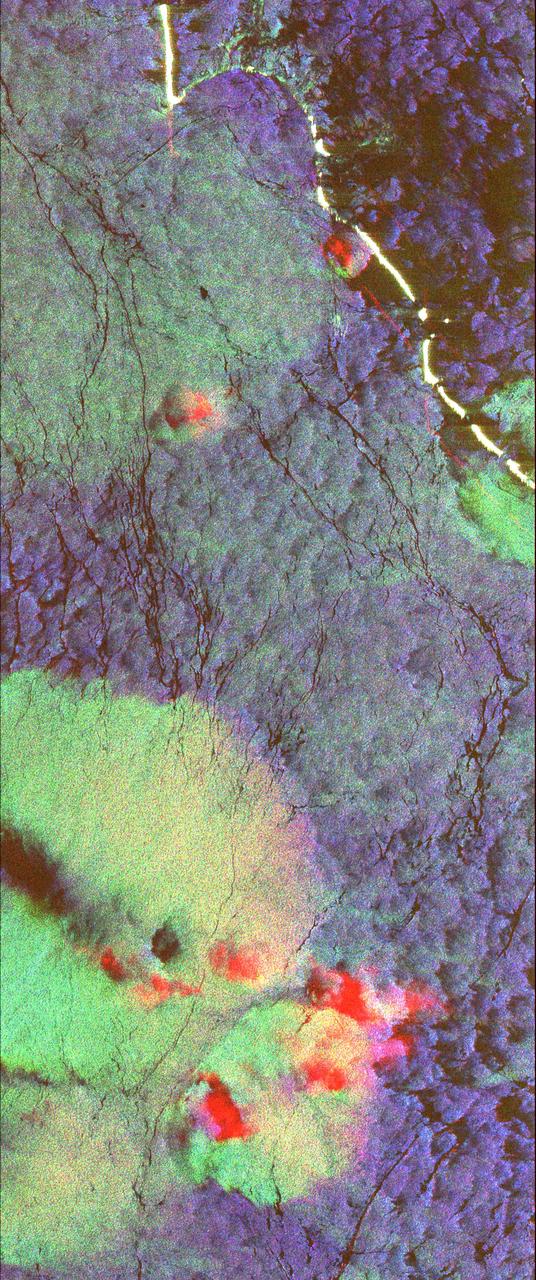
![This radar image is of an area thought to contain the ruins of the ancient settlement of Niya. It is located in the southwestern corner of the Taklamakan Desert in China Sinjiang Province. This oasis was part of the famous Silk Road, an ancient trade route from one of China's earliest capitols, Xian, to the West. The image shows a white linear feature trending diagonally from the upper left to the lower right. Scientists believe this newly [sic] discovered feature is a man-made canal which presumably diverted river waters toward the settlement of Niya for irrigation purposes. The image was acquired by the Spaceborne Imaging Radar-C and X-band Synthetic Aperture Radar (SIR-C/X-SAR) aboard the space shuttle Endeavour on its 106th orbit on April 16, 1994, and is centered at 37.78 degrees north latitude and 82.41 degrees east longitude. The false-color radar image was created by displaying the C-band (horizontally transmitted and received) return in red, the L-band (horizontally transmitted and received) return in green, and the L-band (horizontally transmitted and vertically received) return in blue. Areas in mottled white and purple are low-lying floodplains of the Niya River. Dark green and black areas between river courses are higher ridges or dunes confining the water flow. http://photojournal.jpl.nasa.gov/catalog/PIA01725](https://images-assets.nasa.gov/image/PIA01725/PIA01725~thumb.jpg)
This radar image is of an area thought to contain the ruins of the ancient settlement of Niya. It is located in the southwestern corner of the Taklamakan Desert in China Sinjiang Province. This oasis was part of the famous Silk Road, an ancient trade route from one of China's earliest capitols, Xian, to the West. The image shows a white linear feature trending diagonally from the upper left to the lower right. Scientists believe this newly [sic] discovered feature is a man-made canal which presumably diverted river waters toward the settlement of Niya for irrigation purposes. The image was acquired by the Spaceborne Imaging Radar-C and X-band Synthetic Aperture Radar (SIR-C/X-SAR) aboard the space shuttle Endeavour on its 106th orbit on April 16, 1994, and is centered at 37.78 degrees north latitude and 82.41 degrees east longitude. The false-color radar image was created by displaying the C-band (horizontally transmitted and received) return in red, the L-band (horizontally transmitted and received) return in green, and the L-band (horizontally transmitted and vertically received) return in blue. Areas in mottled white and purple are low-lying floodplains of the Niya River. Dark green and black areas between river courses are higher ridges or dunes confining the water flow. http://photojournal.jpl.nasa.gov/catalog/PIA01725
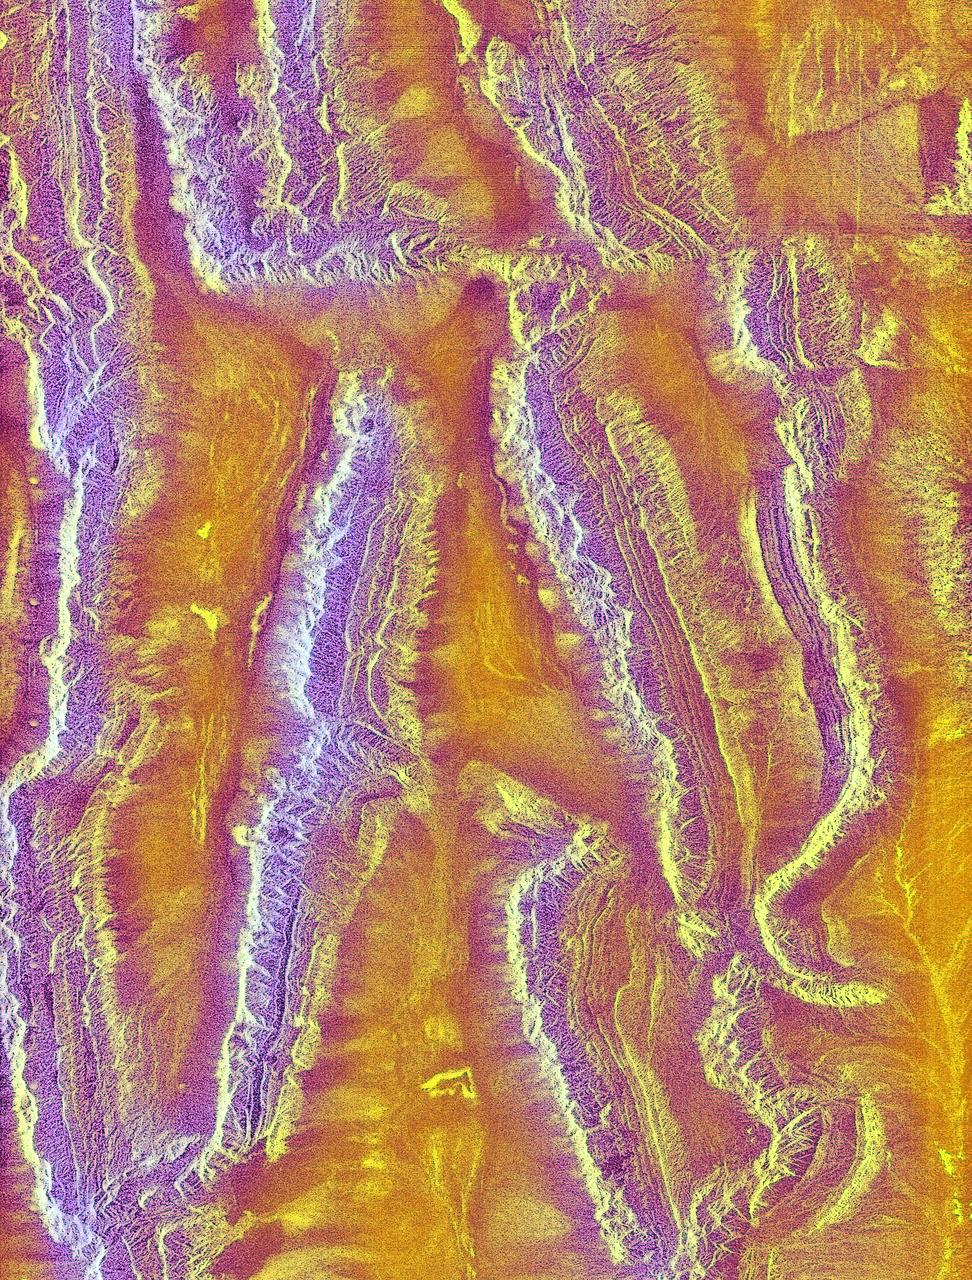
This radar image is centered near the small town of Pishan in northwest China, about 280 km (174 miles) southeast of the city of Kashgar along the ancient Silk Route in the Taklamakan desert of the Xinjiang Province. Geologists are using this radar image as a map to study past climate changes and tectonics of the area. The irregular lavender branching patterns in the center of the image are the remains of ancient alluvial fans, gravel deposits that have accumulated at the base of the mountains during times of wetter climate. The subtle striped pattern cutting across the ancient fans are caused by thrusting of the Kun Lun Mountains north. This motion is caused by the continuing plate-tectonic collision of India with Asia. Modern fans show up as large lavender triangles above the ancient fan deposits. Yellow areas on the modern fans are vegetated oases. The gridded pattern results from the alignment of poplar trees that have been planted as wind breaks. The reservoir at the top of the image is part of a sophisticated irrigation system that supplies water to the oases. This image was acquired by the Spaceborne Imaging Radar-C/X-band Synthetic Aperture Radar (SIR-C/X-SAR) aboard the space shuttle Endeavour in April 1994. This image is centered at 37.4 degrees north latitude, 78.3 degrees east longitude and shows an area approximately 50 km by 100 km (31 miles by 62 miles). The colors are assigned to different frequencies and polarizations of the radar as follows: Red is L-band horizontally transmitted, horizontally received; green is L-band horizontally transmitted, vertically received; and blue is C-band horizontally transmitted and vertically received. SIR-C/X-SAR, a joint mission of the German, Italian, and the United States space agencies, is part of NASA's Mission to Planet Earth. http://photojournal.jpl.nasa.gov/catalog/PIA01796
This is a radar image of the southwest portion of the buried Chicxulub impact crater in the Yucatan Peninsula, Mexico. The radar image was acquired on orbit 81 of space shuttle Endeavour on April 14, 1994 by the Spaceborne Imaging Radar C/X-Band Synthetic Aperture Radar (SIR-C/X-SAR). The image is centered at 20 degrees north latitude and 90 degrees west longitude. Scientists believe the crater was formed by an asteroid or comet which slammed into the Earth more than 65 million years ago. It is this impact crater that has been linked to a major biological catastrophe where more than 50 percent of the Earth's species, including the dinosaurs, became extinct. The 180-to 300-kilometer-diameter (110- to 180-mile) crater is buried by 300 to 1,000 meters (1,000 to 3,000 feet) of limestone. The exact size of the crater is currently being debated by scientists. This is a total power radar image with L-band in red, C-band in green, and the difference between C-band L-band in blue. The 10-kilometer-wide (6-mile) band of yellow and pink with blue patches along the top left (northwestern side) of the image is a mangrove swamp. The blue patches are islands of tropical forests created by freshwater springs that emerge through fractures in the limestone bedrock and are most abundant in the vicinity of the buried crater rim. The fracture patterns and wetland hydrology in this region are controlled by the structure of the buried crater. Scientists are using the SIR-C/X-SAR imagery to study wetland ecology and help determine the exact size of the impact crater. http://photojournal.jpl.nasa.gov/catalog/PIA01723
This topographic radar image acquired by NASA Shuttle Radar Topography Mission SRTM in Feb. 2000 shows the relationships of the dense urban development of Los Angeles, Calif. and the natural contours of the land.
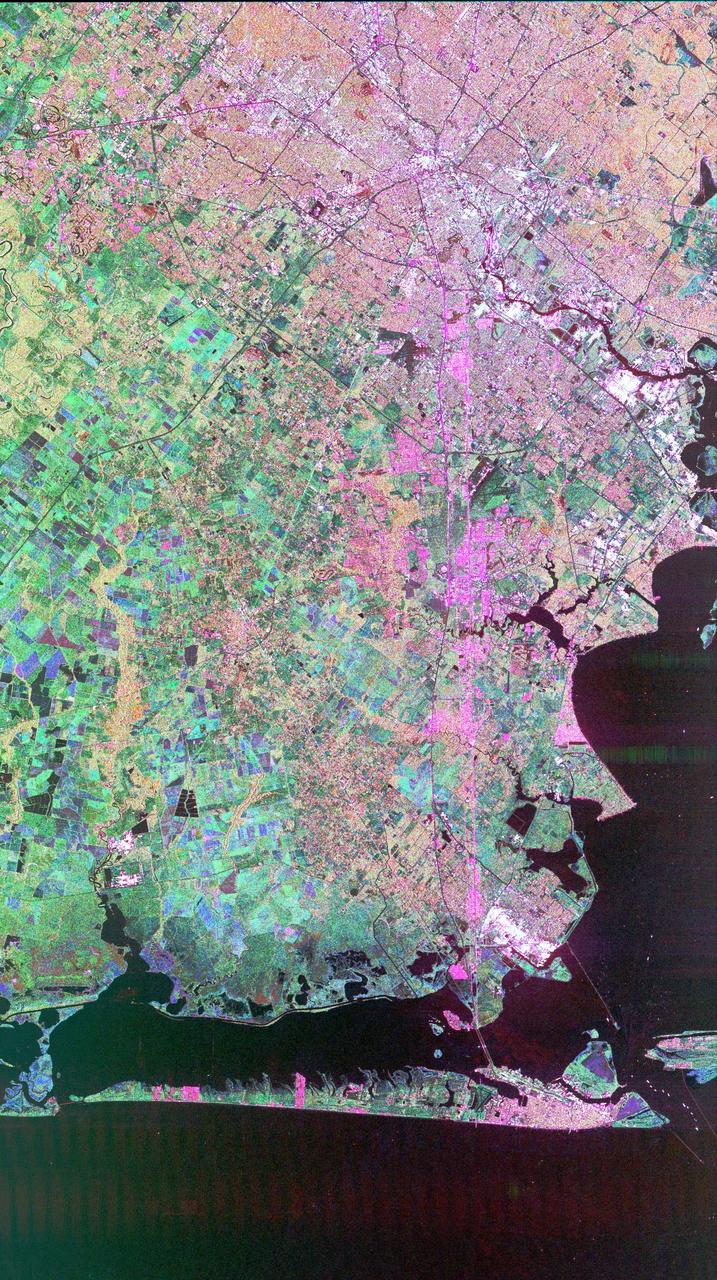
This radar image acquired by NASA Shuttle Radar Topography Mission SRTM from data collected on February 18, 2000 shows the Dallas-Fort Worth metropolitan area in Texas.
This topographic radar image acquired by NASA Shuttle Radar Topography Mission SRTM from data collected on February 16, 2000 shows the relationship of the urban area of Pasadena, California to the natural contours of the land.
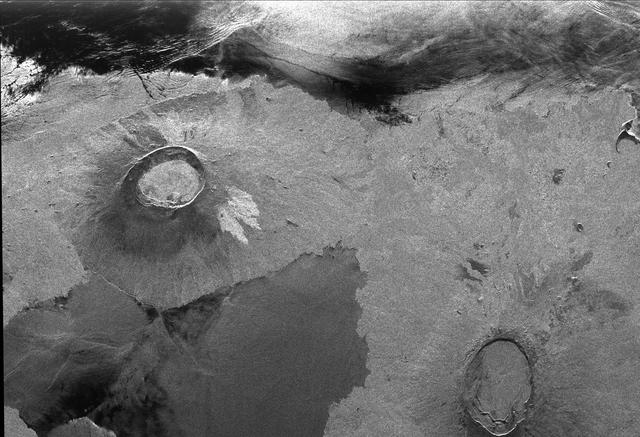
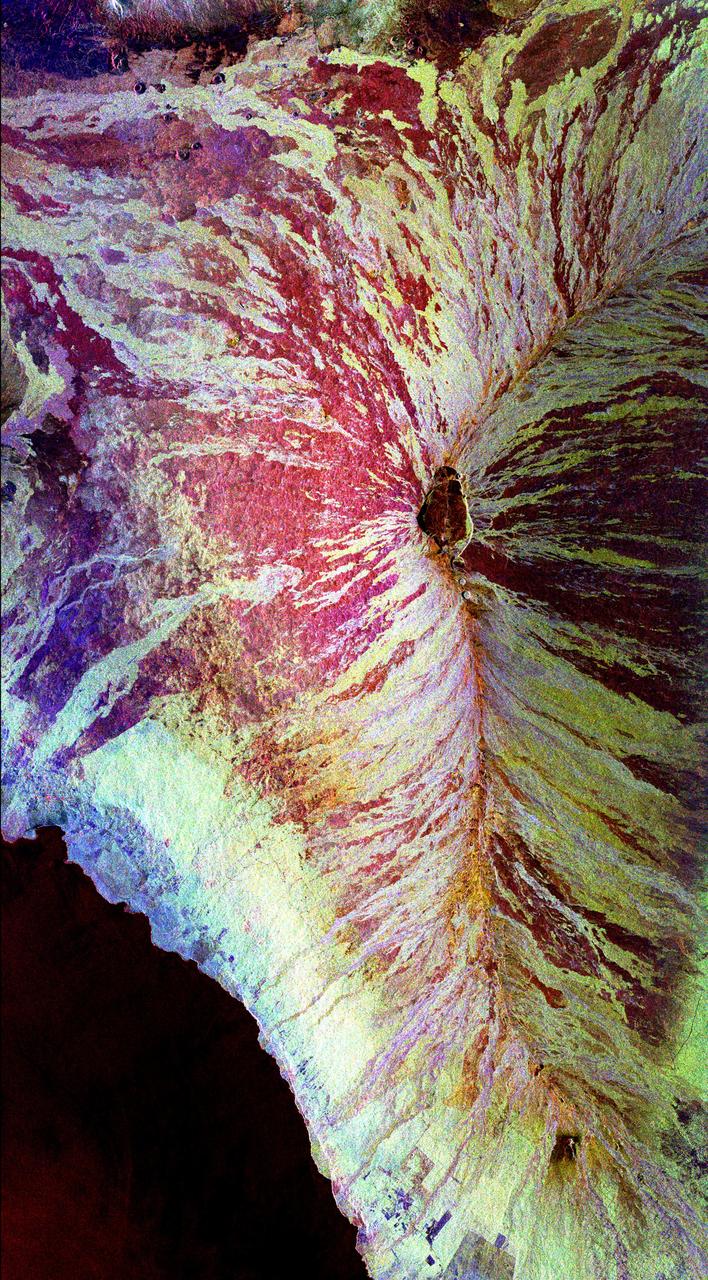
This is a radar image of a little known volcano in northern Colombia. The image was acquired on orbit 80 of space shuttle Endeavour on April 14, 1994, by NASA Spaceborne Imaging Radar C/X-Band Synthetic Aperture Radar SIR-C/X-SAR. The volcano near the center of the image is located at 5.6 degrees north latitude, 75.0 degrees west longitude, about 100 kilometers (65 miles) southeast of Medellin, Colombia. The conspicuous dark spot is a lake at the bottom of an approximately 3-kilometer-wide (1.9-mile) volcanic collapse depression or caldera. A cone-shaped peak on the bottom left (northeast rim) of the caldera appears to have been the source for a flow of material into the caldera. This is the northern-most known volcano in South America and because of its youthful appearance, should be considered dormant rather than extinct. The volcano's existence confirms a fracture zone proposed in 1985 as the northern boundary of volcanism in the Andes. The SIR-C/X-SAR image reveals another, older caldera further south in Colombia, along another proposed fracture zone. Although relatively conspicuous, these volcanoes have escaped widespread recognition because of frequent cloud cover that hinders remote sensing imaging in visible wavelengths. Four separate volcanoes in the Northern Andes nations of Colombia and Ecuador have been active during the last 10 years, killing more than 25,000 people, including scientists who were monitoring the volcanic activity. Detection and monitoring of volcanoes from space provides a safe way to investigate volcanism. The recognition of previously unknown volcanoes is important for hazard evaluations because a number of major eruptions this century have occurred at mountains that were not previously recognized as volcanoes. http://photojournal.jpl.nasa.gov/catalog/PIA01722
These are color composite radar images showing the area around Mount Pinatubo in the Philippines. The images were acquired by the Spaceborne Imaging Radar-C and X-band Synthetic Aperture Radar (SIR-C/X-SAR) aboard the space shuttle Endeavour on April 14, 1994 (left image) and October 5,1994 (right image). The images are centered at about 15 degrees north latitude and 120.5 degrees east longitude. Both images were obtained with the same viewing geometry. The color composites were made by displaying the L-band (horizontally transmitted and received) in red; the L-band (horizontally transmitted and vertically received) in green; and the C-band (horizontally transmitted and vertically received) in blue. The area shown is approximately 40 kilometers by 65 kilometers (25 miles by 40 miles). The main volcanic crater on Mount Pinatubo produced by the June 1991 eruptions and the steep slopes on the upper flanks of the volcano are easily seen in these images. Red on the high slopes shows the distribution of the ash deposited during the 1991 eruption, which appears red because of the low cross-polarized radar returns at C and L bands. The dark drainages radiating away from the summit are the smooth mudflows, which even three years after the eruptions continue to flood the river valleys after heavy rain. Comparing the two images shows that significant changes have occurred in the intervening five months along the Pasig-Potrero rivers (the dark area in the lower right of the images). Mudflows, called "lahars," that occurred during the 1994 monsoon season filled the river valleys, allowing the lahars to spread over the surrounding countryside. Three weeks before the second image was obtained, devastating lahars more than doubled the area affected in the Pasig-Potrero rivers, which is clearly visible as the increase in dark area on the lower right of the images. Migration of deposition to the east (right) has affected many communities. Newly affected areas included the community of Bacolor, Pampanga, where thousands of homes were buried in meters of hot mud and rock as 80,000 people fled the lahar-stricken area. Scientists are closely monitoring the westward migration ( toward the left in this image) of the lahars as the Pasig-Potrero rivers seek to join with the Porac River, an area that has not seen laharic activity since the eruption. This could be devastating because the Pasig-Potrero rivers might be permanently redirected to lower elevations along the Porac River where communities are located. Ground saturation with water during the rainy season reveals inactive channels that were dry in the April image. A small lake has turned into a pond in the lower reaches of the Potrero River because the channels are full of lahar deposits and the surface runoff has no where to flow. Changes in the degree of erosion in ash and pumice deposits from the 1991 eruption can also be seen in the channels that deliver the mudflow material to the Pasig-Potrero rivers. The 1991 Mount Pinatubo eruption is well known for its near-global effects on the atmosphere and short-term climate due to the large amount of sulfur dioxide that was injected into the upper atmosphere. Locally, however, the effects will most likely continue to impact surrounding areas for as long as the next 10 to 15 years. Mudflows, quite certainly, will continue to pose severe hazards to adjacent areas. Radar observations like those obtained by SIR-C/X-SAR will play a key role in monitoring these changes because of the radar's ability to see in daylight or darkness and even in the worst weather conditions. Radar imaging will be particularly useful, for example, during the monsoon season, when the lahars form. Frequent imaging of these lahar fields will allow scientists to better predict when they are likely to begin flowing again and which communities might be at risk. http://photojournal.jpl.nasa.gov/catalog/PIA01743
This is a radar image of the area surrounding the Harvard Forest in north-central Massachusetts that has been operated as a ecological research facility by Harvard University since 1907. At the center of the image is the Quabbin Reservoir, and the Connecticut River is at the lower left of the image. The Harvard Forest itself is just above the reservoir. Researchers are comparing the naturally occurring physical disturbances in the forest and the recent and projected chemical disturbances and their effects on the forest ecosystem. Agricultural land appears dark blue/purple, along with low shrub vegetation and some wetlands. Urban development is bright pink; the yellow to green tints are conifer-dominated vegetation with the pitch pine sand plain at the middle left edge of the image appearing very distinctive. The green tint may indicate pure pine plantation stands, and deciduous broadleaf trees appear gray/pink with perhaps wetter sites being pinker. This image was acquired by the Spaceborne Imaging Radar-C/X-Band Synthetic Aperture Radar (SIR-C/X-SAR) aboard the space shuttle Endeavour. SIR-C/X-SAR, a joint mission of the German, Italian and the United States space agencies, is part of NASA's Mission to Planet Earth. The image is centered at 42.50 degrees North latitude and 72.33 degrees West longitude and covers an area of 53 kilometers 63 by kilometers (33 miles by 39 miles). The colors in the image are assigned to different frequencies and polarizations of the radar as follows: red is L-band horizontally transmitted and horizontally received; green is L-band horizontally transmitted and vertically received; and blue is C-band horizontally transmitted and horizontally received. http://photojournal.jpl.nasa.gov/catalog/PIA01788
These two false-color images of the Manaus region of Brazil in South America were acquired by the Spaceborne Imaging Radar-C and X-band Synthetic Aperture Radar on board the space shuttle Endeavour. The image at left was acquired on April 12, 1994, and the image at right was acquired on October 3, 1994. The area shown is approximately 8 kilometers by 40 kilometers (5 miles by 25 miles). The two large rivers in this image, the Rio Negro (at top) and the Rio Solimoes (at bottom), combine at Manaus (west of the image) to form the Amazon River. The image is centered at about 3 degrees south latitude and 61 degrees west longitude. North is toward the top left of the images. The false colors were created by displaying three L-band polarization channels: red areas correspond to high backscatter, horizontally transmitted and received, while green areas correspond to high backscatter, horizontally transmitted and vertically received. Blue areas show low returns at vertical transmit/receive polarization; hence the bright blue colors of the smooth river surfaces can be seen. Using this color scheme, green areas in the image are heavily forested, while blue areas are either cleared forest or open water. The yellow and red areas are flooded forest or floating meadows. The extent of the flooding is much greater in the April image than in the October image and appears to follow the 10-meter (33-foot) annual rise and fall of the Amazon River. The flooded forest is a vital habitat for fish, and floating meadows are an important source of atmospheric methane. These images demonstrate the capability of SIR-C/X-SAR to study important environmental changes that are impossible to see with optical sensors over regions such as the Amazon, where frequent cloud cover and dense forest canopies block monitoring of flooding. Field studies by boat, on foot and in low-flying aircraft by the University of California at Santa Barbara, in collaboration with Brazil's Instituto Nacional de Pesguisas Estaciais, during the first and second flights of the SIR-C/X-SAR system have validated the interpretation of the radar images. http://photojournal.jpl.nasa.gov/catalog/PIA01735
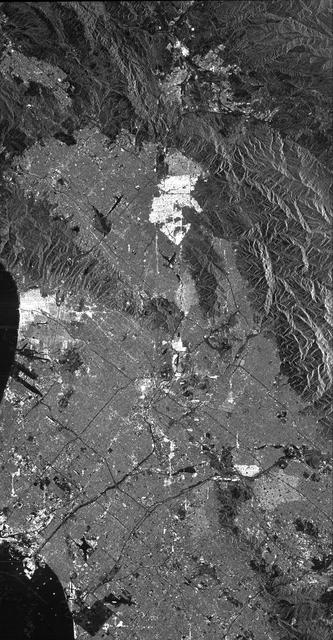
This image is a false-color composite of Raco, Michigan, centered at 46.39 degrees north latitude, 84.88 degrees west longitude. This image was acquired by the Spaceborne Imaging Radar-C and X-Band Synthetic Aperture Radar (SIR-C/X-SAR) aboard the space shuttle Endeavour on its sixth orbit and during the first full-capability test of the instrument on April 9, 1994. This image was produced using both L-band and C-band data. The area shown is approximately 20 kilometers by 50 kilometers (12 by 30 miles). Raco is located at the eastern end of Michigan's upper peninsula, west of Sault Ste. Marie and south of Whitefish Bay on Lake Superior. The site is located at the boundary between the boreal forests and the northern temperate forests, a transitional zone that is expected to be ecologically sensitive to anticipated global changes resulting from climatic warming. On any given day, there is a 60 percent chance that this area will be obscured to some extent by cloud clover which makes it difficult to image using optical sensors. http://photojournal.jpl.nasa.gov/catalog/PIA01700
This is a C-band, VV polarization radar image of the Namib desert in southern Namibia, near the coast of South West Africa. The image is centered at about 25 degrees South latitude, 15.5 degrees East longitude. This image was one of the first acquired by the Spaceborne Imaging Radar-C/X-Band Synthetic Aperture Radar (SIR-C/X-SAR) when it was taken on orbit 4 from the shuttle Endeavour on April 9, 1994. The area shown is approximately 78 kilometers by 20 kilometers. The dominant features in the image are complex sand dune patterns formed by the prevailing winds in this part of the Namib desert. The Namib desert is an extremely dry area formed largely because of the influence of the cold Benguela ocean current that flows northward along the coast of Namibia. The bright areas at the bottom of the image are exposed outcrops of Precambrian rocks. This extremely barren area is a region rich in diamonds that through the centuries have washed down from the mountains. The town of Luderitz is located just to the south of the area shown. http://photojournal.jpl.nasa.gov/catalog/PIA01720
The ability of a sophisticated radar instrument to image large regions of the world from space, using different frequencies that can penetrate dry sand cover, produced the discovery in this image: a previously unknown branch of an ancient river, buried under thousands of years of windblown sand in a region of the Sahara Desert in North Africa. This area is near the Kufra Oasis in southeast Libya, centered at 23.3 degrees north latitude, 22.9 degrees east longitude. The image was acquired by the Spaceborne Imaging Radar-C/X-band Synthetic Aperture (SIR-C/X-SAR) imaging radar when it flew aboard the space shuttle Endeavour on its 60th orbit on October 4, 1994. This SIR-C image reveals a system of old, now inactive stream valleys, called "paleodrainage systems, http://photojournal.jpl.nasa.gov/catalog/PIA01310