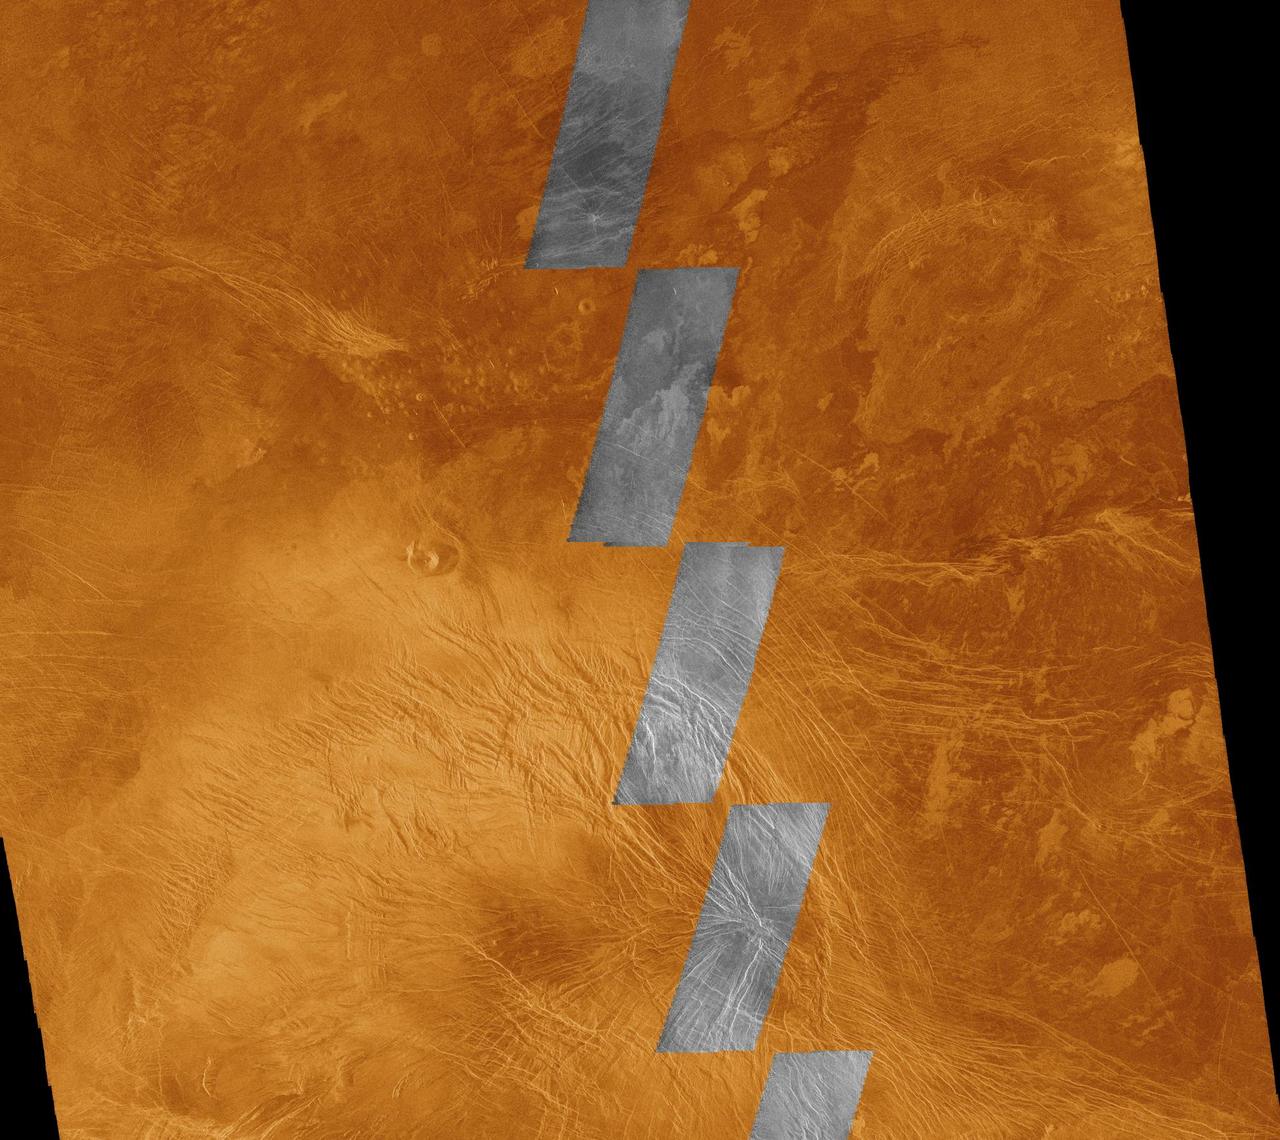
This image compares NASA Magellan data acquired in August 1990 during the initial test of the radar system black and white insets with data acquired by the spacecraft in April 1991 color background. The area is in the southern hemisphere of Venus. http://photojournal.jpl.nasa.gov/catalog/PIA00220
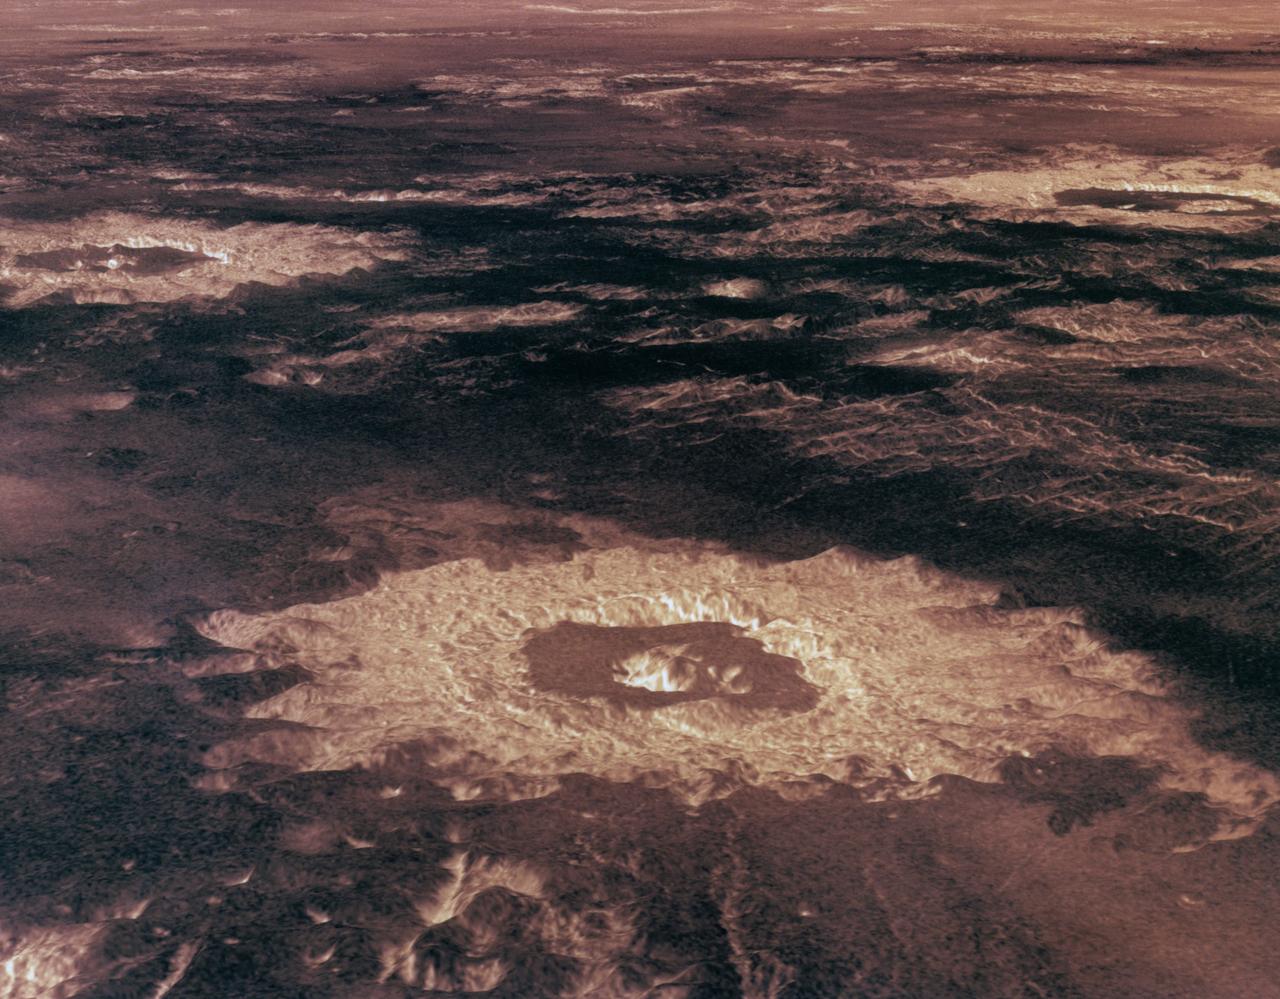
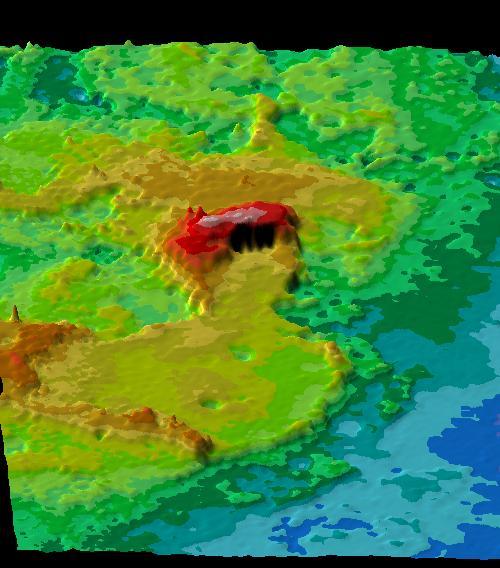
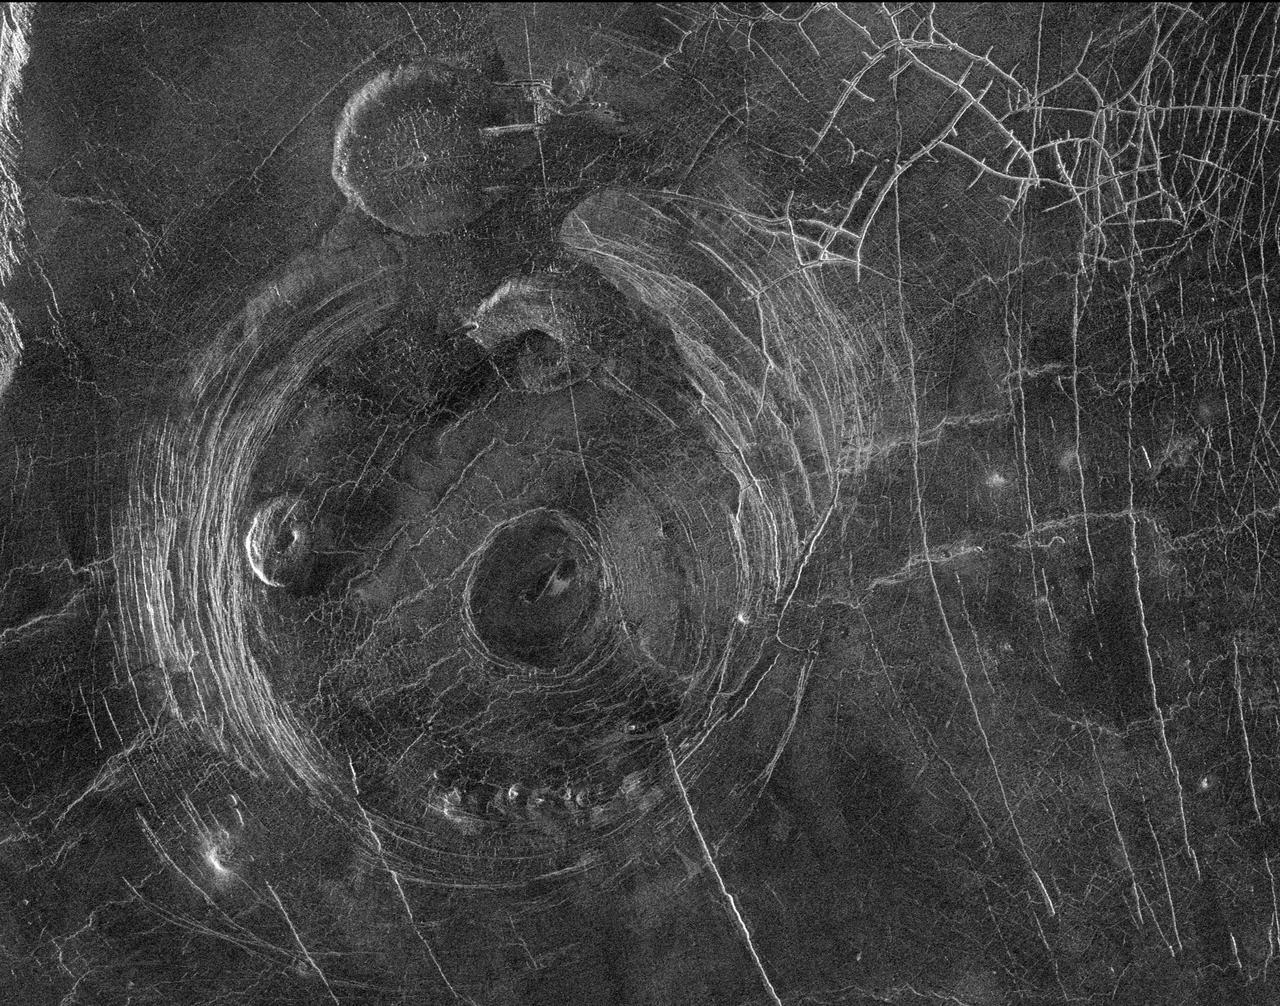
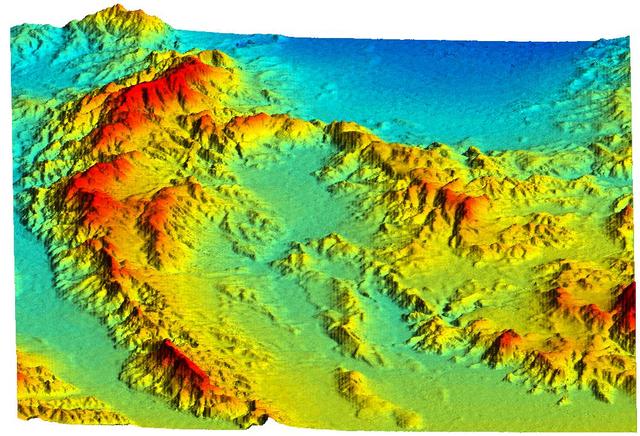
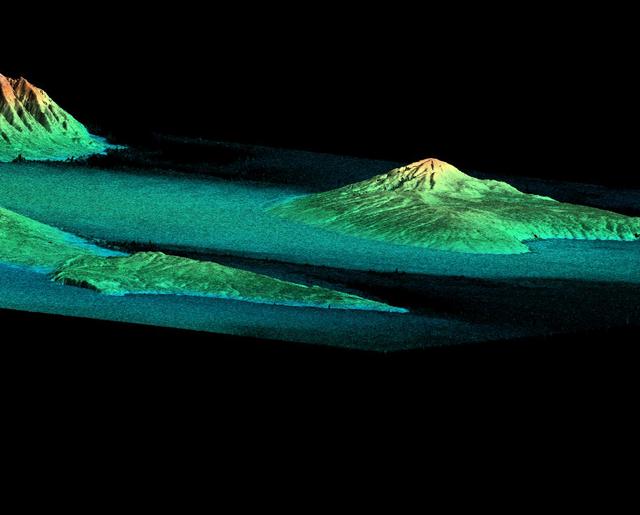
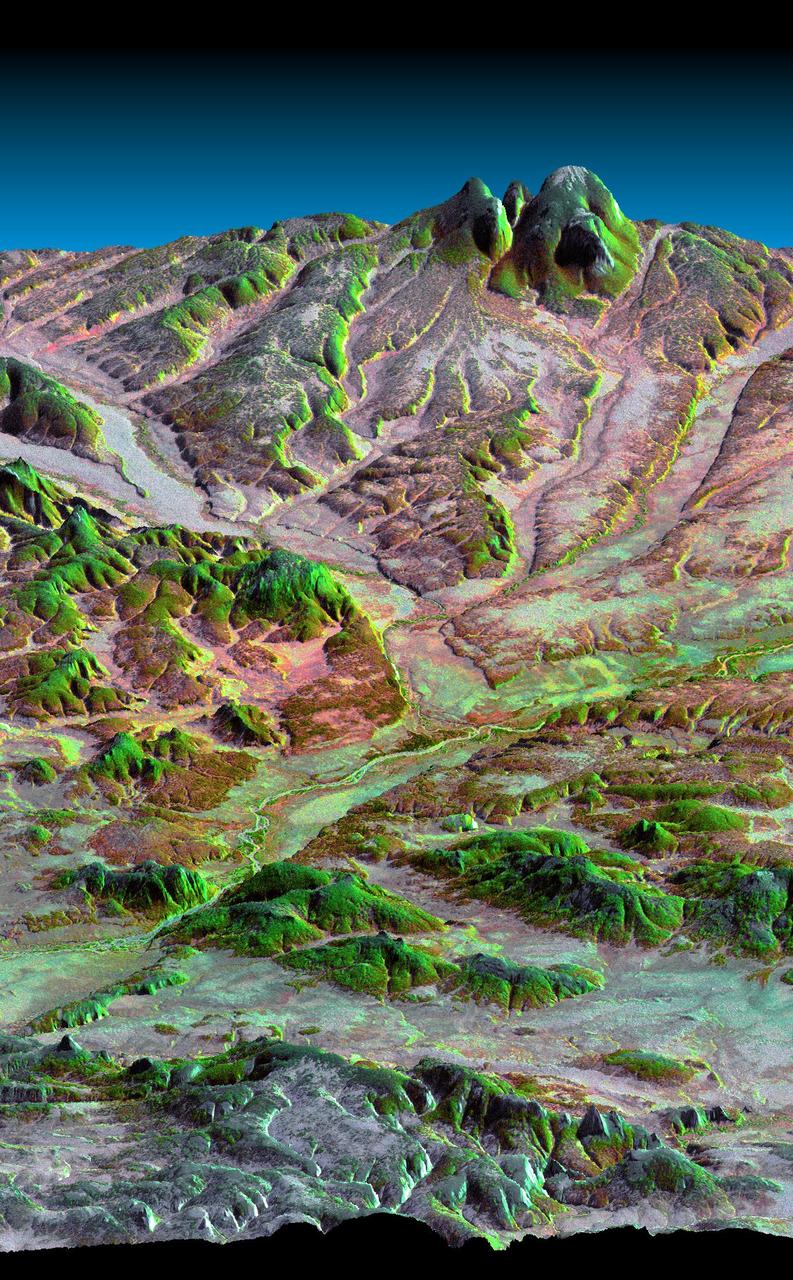
Three impact craters in three-dimensional perspective located approximately 27 degrees south latitude, 339 degrees east longitude in the northwestern portion of Lavinia Planitia. The viewpoint is located southwest of Howe Crater which appears centered in the lower portion of the image. Howe has a diameter of 37.3 kilometers (23.1 miles) located at 28.6 degrees south latitude, 337.1 degrees east longitude. Danilova, a crater with a diameter of 47.6 kilometers (29.5 miles) and located at 26.35 degrees south latitude and 337.5 east longitude, appears above and to the left of Howe in the image. Aglaonice, a crater with a diameter of 62.7 kilometers (38.9 miles) and located at 26.5 degrees south latitude and 340 degrees east longitude is on the right of Danilova. Magellan synthetic aperture radar data is combined with radar altimetry to develop a 3D map of the surface. Rays cast in a computer intersect the surface to create a 3D view. Simulated color and a digital elevation map developed by the United States (U.S.) Geological Survey is used to enhance small-scale structure. The simulated hues are based on color images recorded by the Soviet Venera 13 and 14 spacecraft. The image was processed at the Jet Propulsion Laboratory (JPL) Multimission Image Processing Laboratory and is a single frame from a video released at the JPL news conference 05-29-91. View provided by JPL with alternate number P-39146.
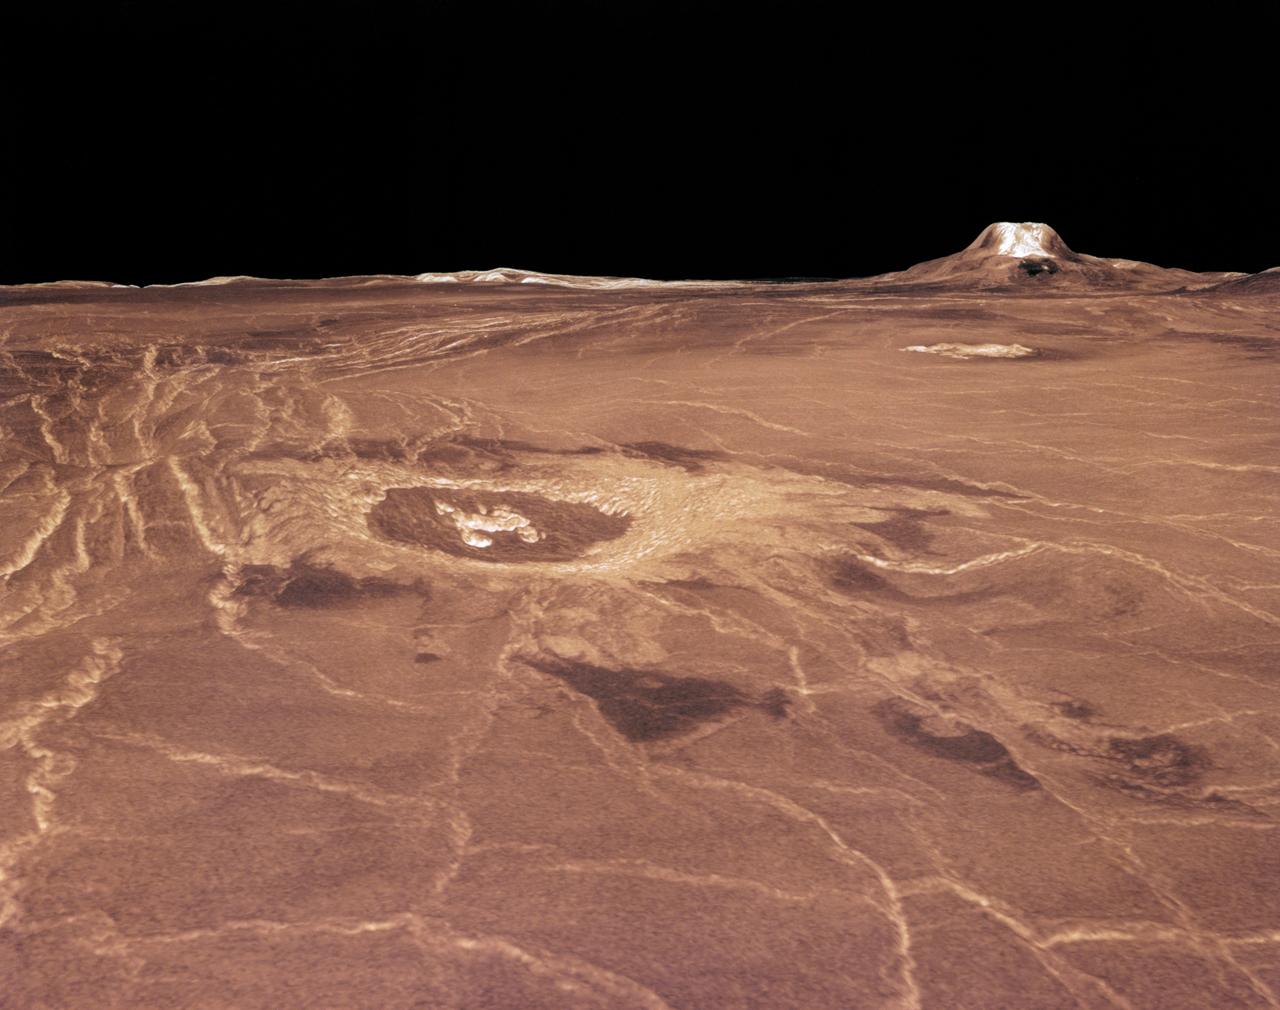
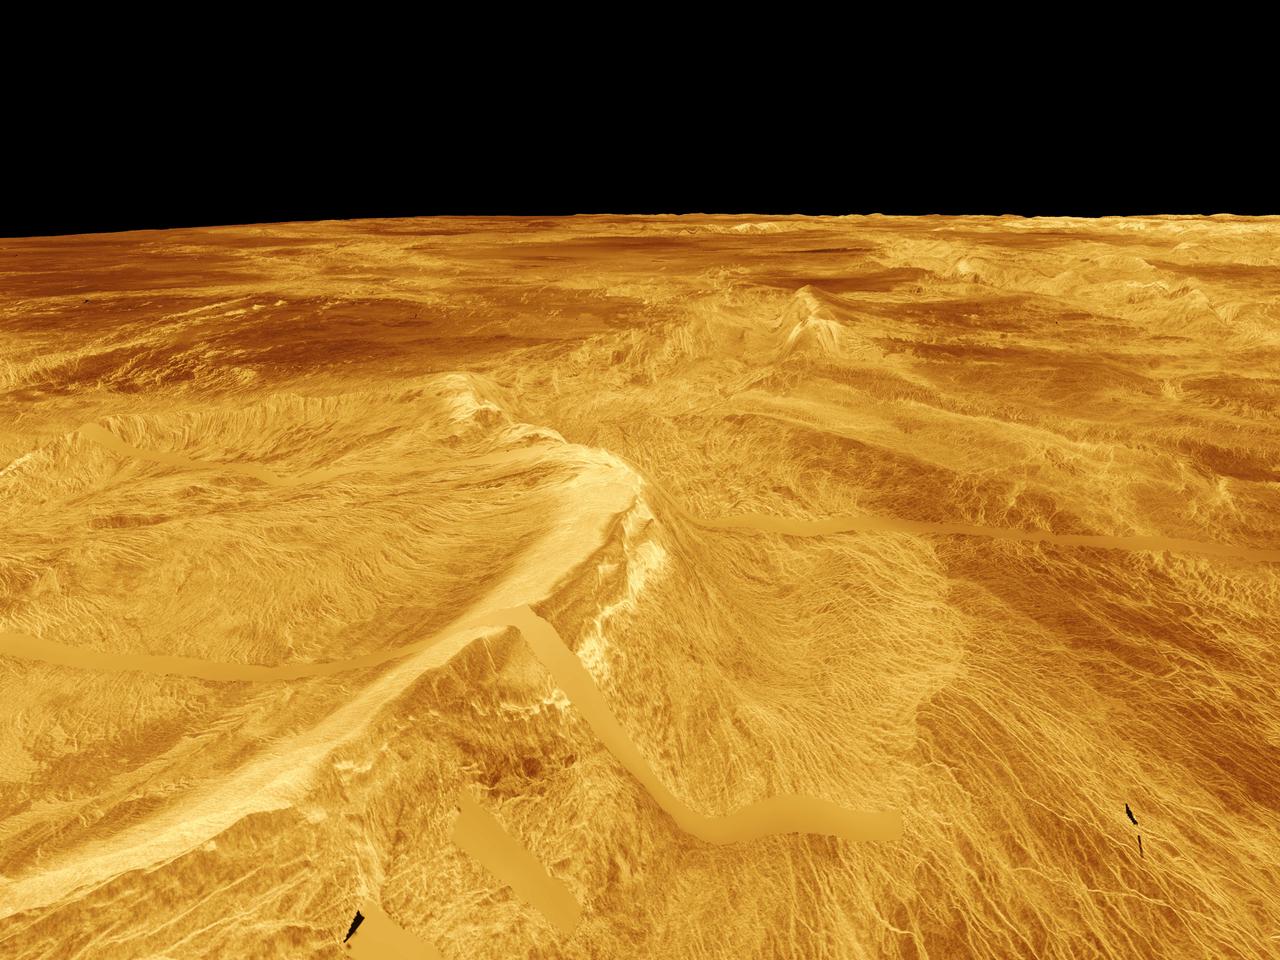
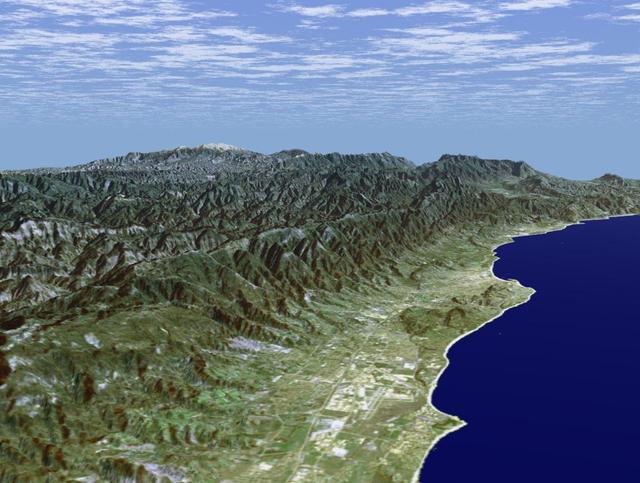
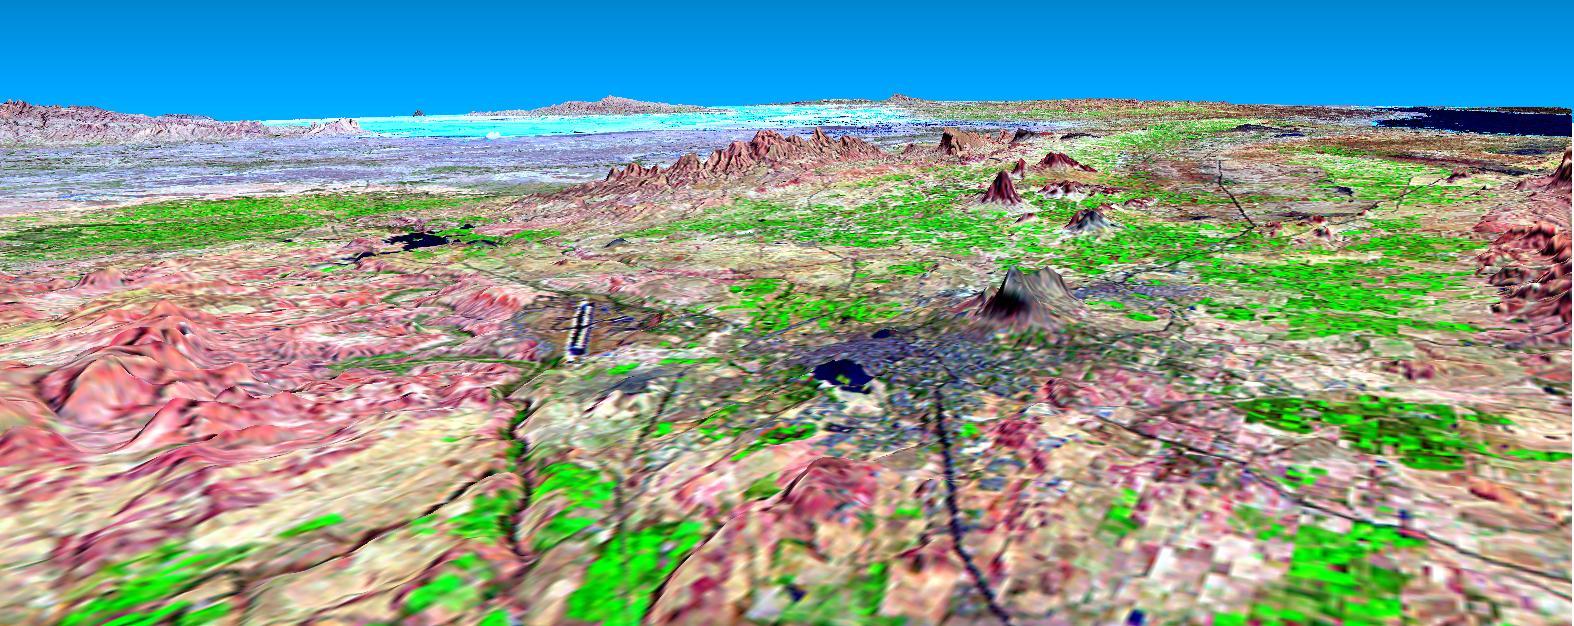
Magellan synthetic aperture radar data was used to create this three- dimensional (3D) perspective view of Venus' western Eistla Regio. This viewpoint is located at 1,310 kilometers (812 miles) southwest of Gula Mons at an elevation of 0.178 kilometers (0.48 miles). The view is of the northeast with Gula Mons appearing on the horizon. Gula Mons, a 3 kilometer (1.86 mile) high volcano, is located at approximately 22 degrees north latitude, 359 degrees east longitude. The impact crater Cunitz, named for the astronomer and mathematician Maria Cunitz, is visible in the center of the image. The crater is 48.5 kilometers (30 miles) in diameter and is 215 kilometers (133 miles) from the viewer's position. Magellan synthetic aperture radar data is combined with radar altimetry to develop a 3D map of the surface. Rays cast in a computer intersect the surface to create a 3D view. Simulated color and a digital elevation map developed by the United States (U.S.) Geological Survey is used to enhance small-scale structure. The simulated hues are based on color images recorded by the Soviet Venera 13 and 14 spacecraft. The image was produced at the Jet Propulsion Laboratory (JPL) Multimission Image Processing Laboratory and is a single frame from a video released at the JPL news conference 03-05-91. View was provided by JPL with alternate number P-38720 MGN76.
The objective of NASA Shuttle Imaging Radar A SIR-A was to observe the Earth by use of radar imagery, acquire and transmit data of different geologic regions. This is a view of China in 2000.
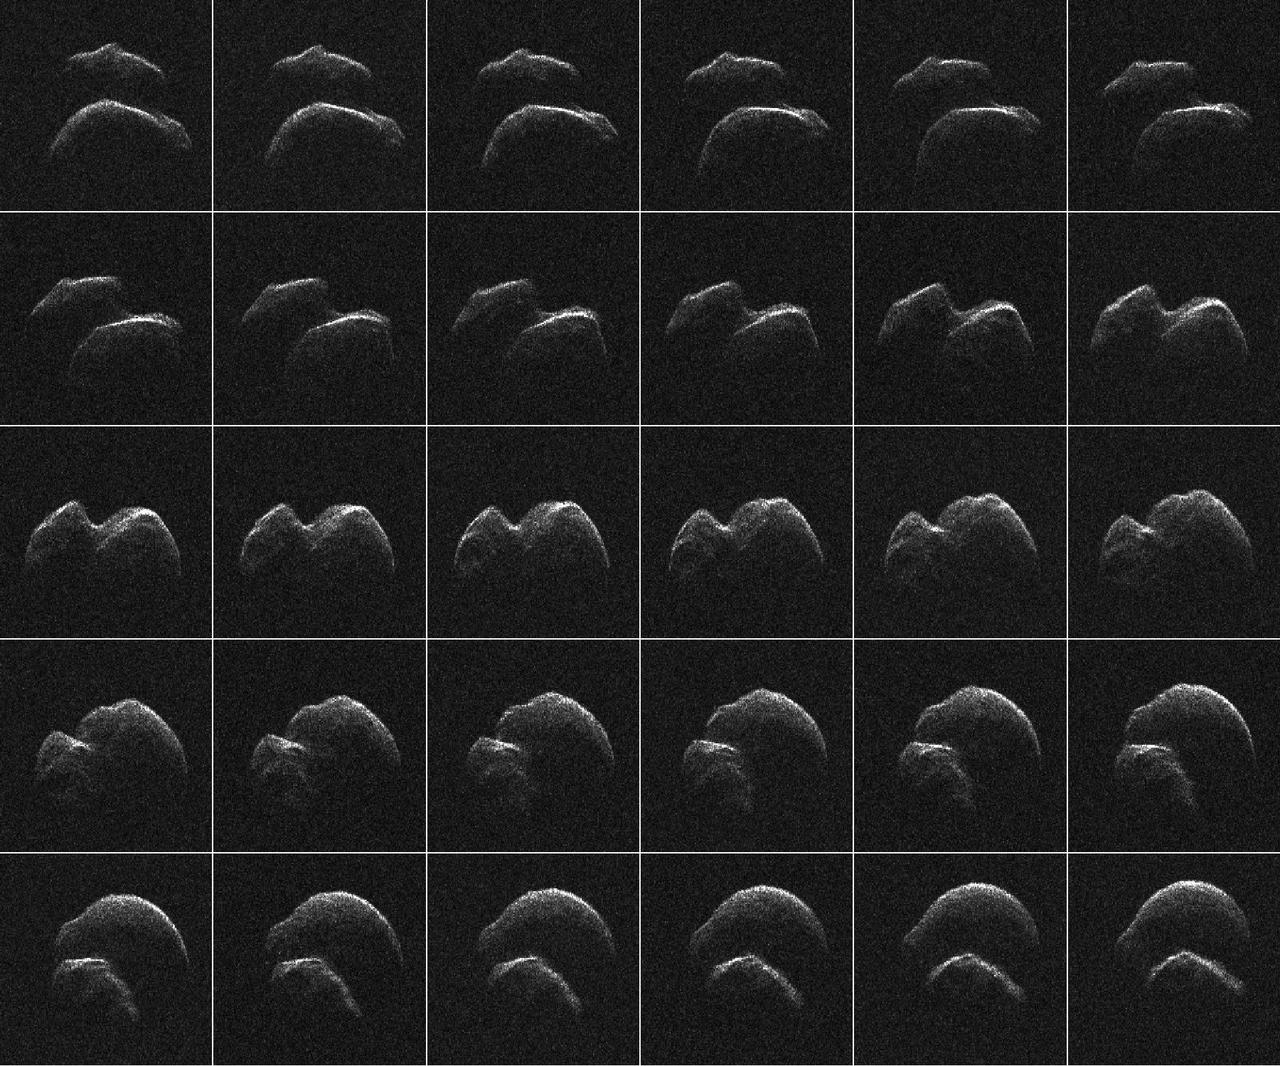
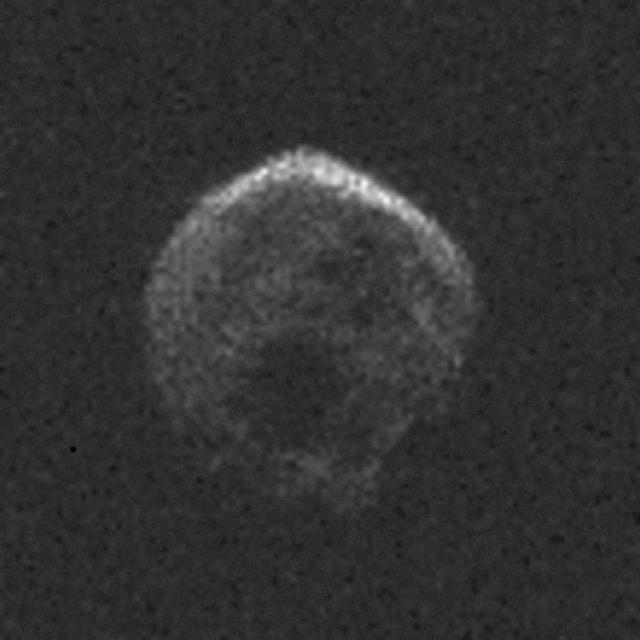
This composite of 30 images of asteroid 2014 JO25 was generated with radar data collected using NASA Goldstone Solar System Radar in California Mojave Desert. https://photojournal.jpl.nasa.gov/catalog/PIA21594

This global view of Venus, centered at 270 degrees east longitude, is a compilation of data from several sources. Magellan synthetic aperature radar mosaics from the first cycle of Magellan mapping are mapped onto a computer-simulated globe to create the image. Data gaps are filled with Pioneer-Venus orbiter data, or a constant mid-range value. Simulated color is used to enhance small-scale structure. The simulated hues are based on color images recorded by the Soviet Venera 13 and 14 spacecraft. The image was produced at the Jet Propulsion Laboratory (JPL) Multimission Image Processing Laboratory and is a single frame from a video released at the JPL news conference, 10-29-91. View provided by JPL with alternate number P-39225 MGN81.
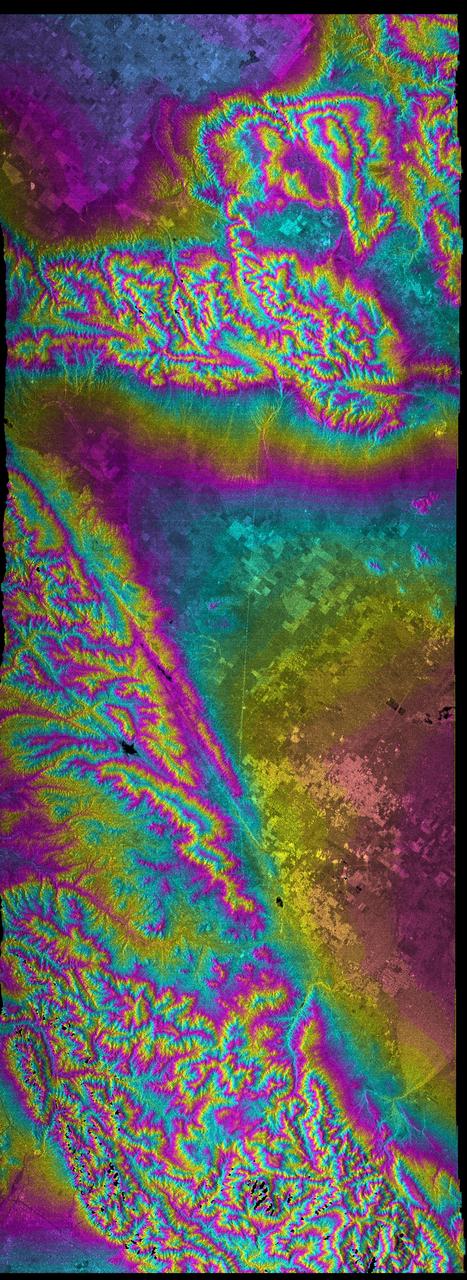
On March 17, 2013, NASA Uninhabited Aerial Vehicle Synthetic Aperture Radar UAVSAR acquired synthetic aperture radar data over the Napo River in Ecuador and Peru.
The objective of NASA Shuttle Imaging Radar A SIR-A was to observe the Earth by use of radar imagery, acquire and transmit data of different geologic regions. This is a view of New Guinea in 2000.
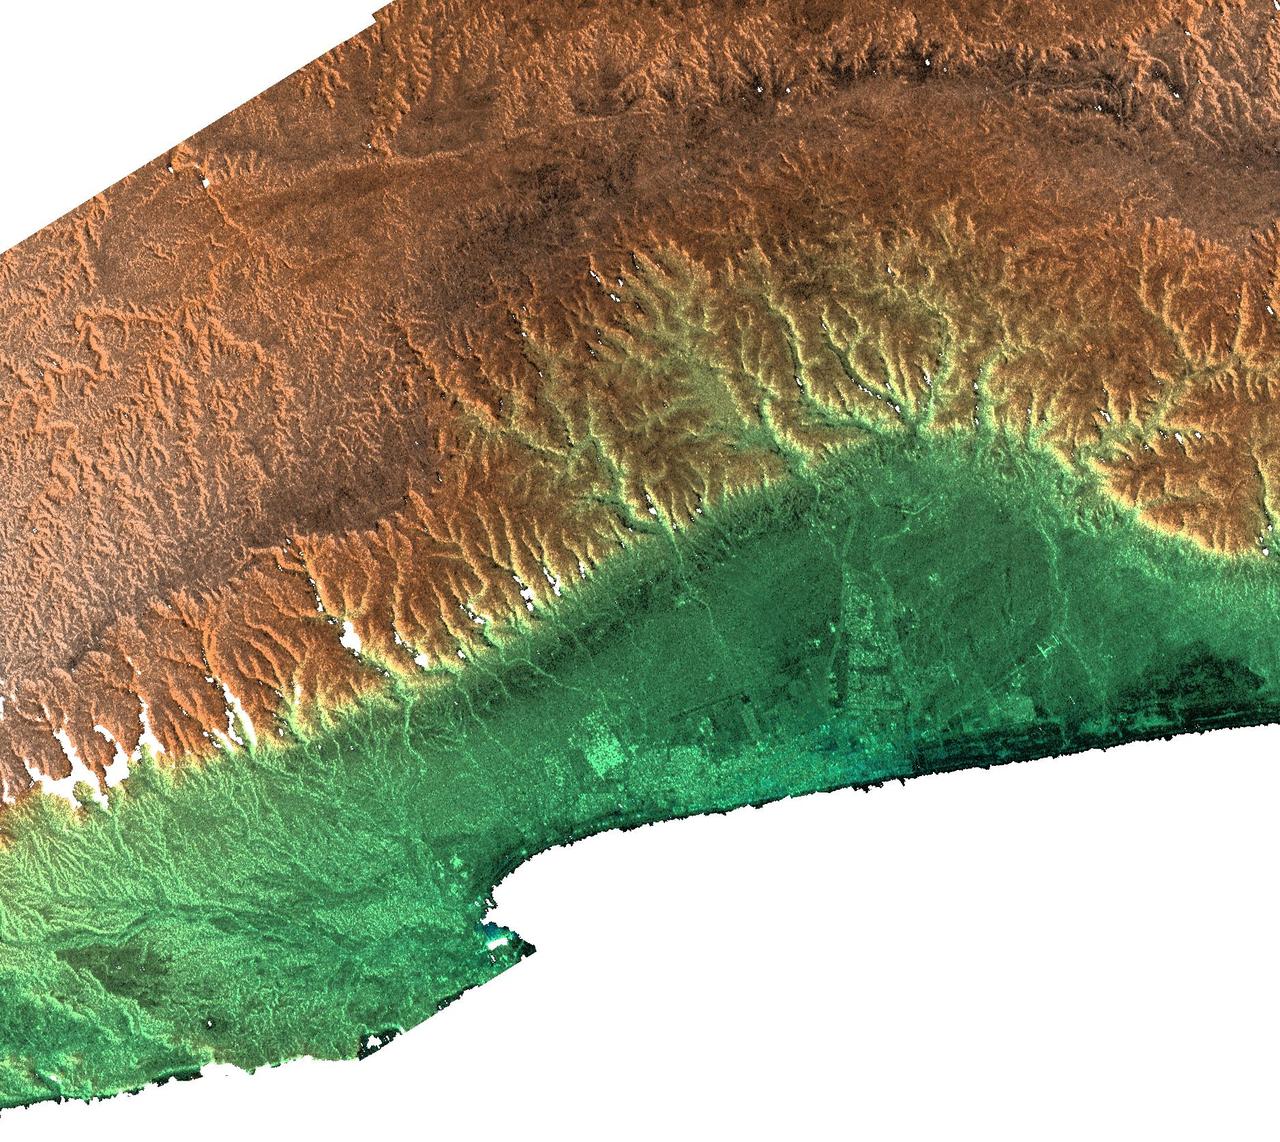
This radar image acquired by NASA Shuttle Radar Topography Mission SRTM from data collected on February 15, 2000 includes the city of Salalah, the second largest city in Oman.
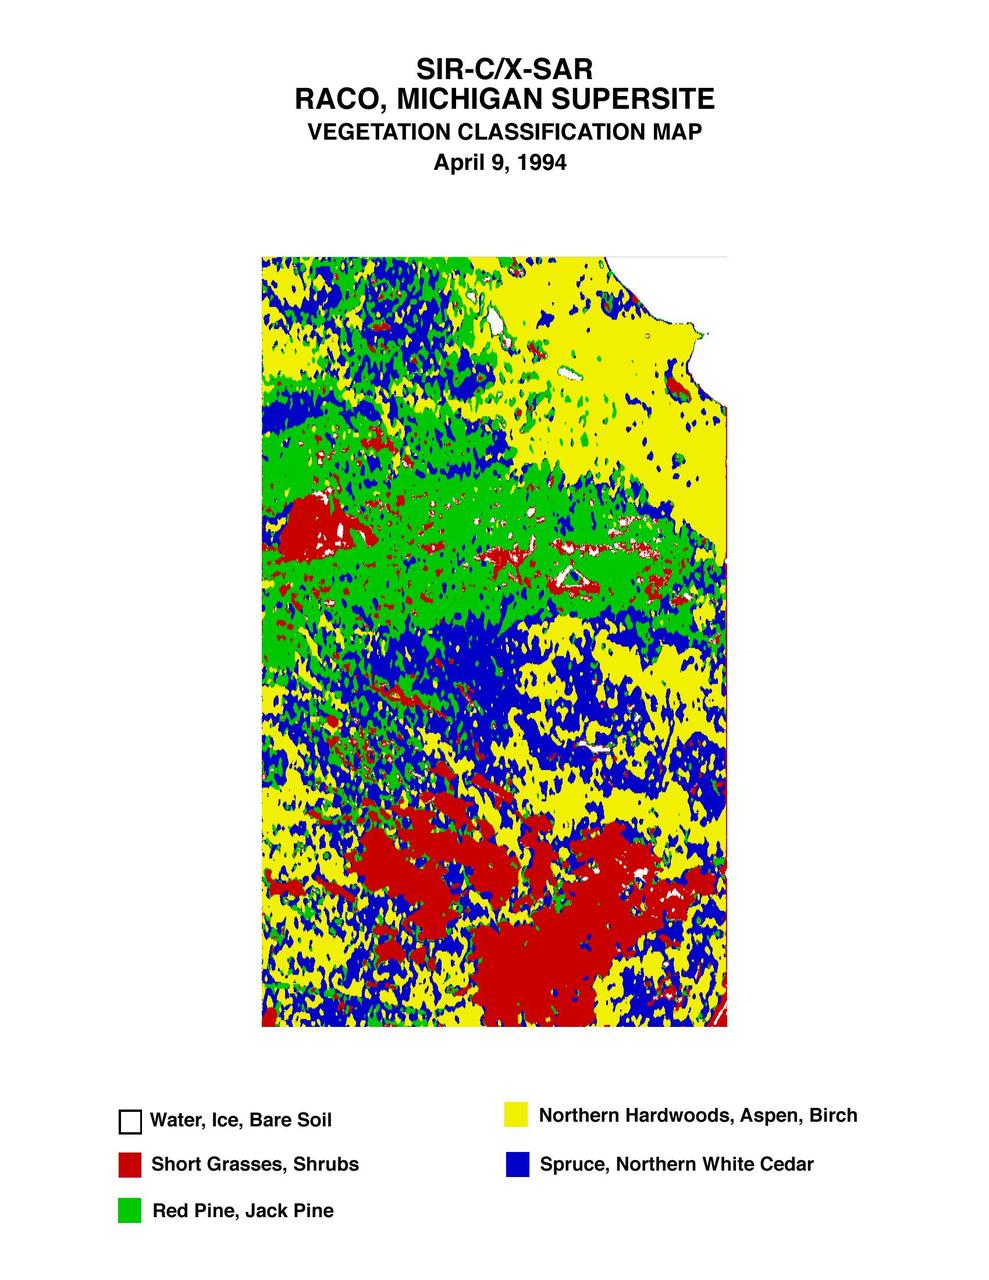
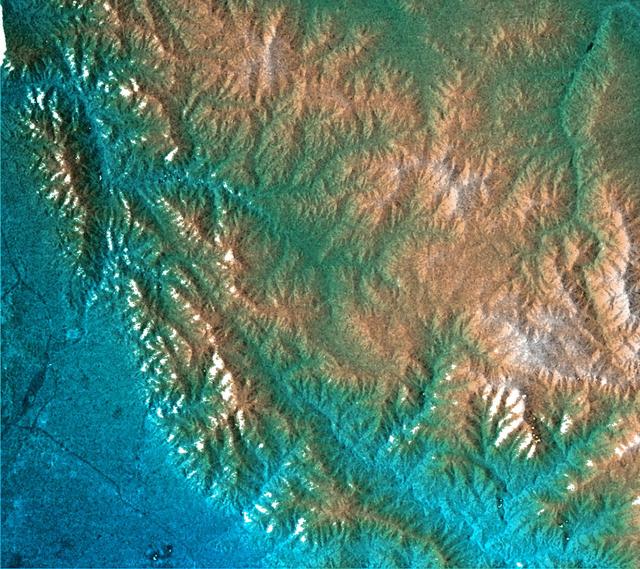
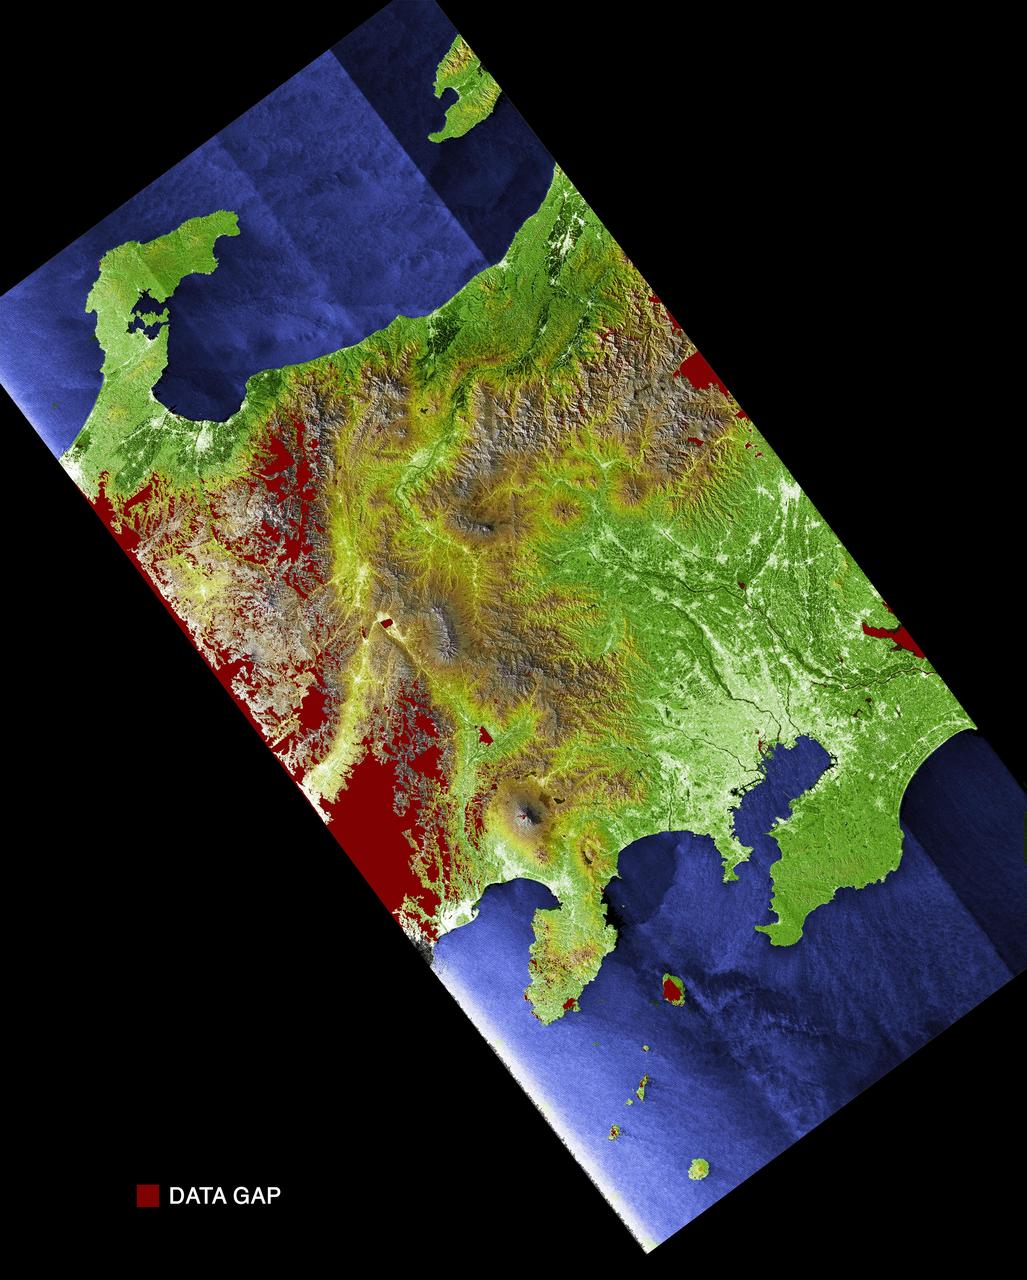
This is a vegetation map of the Raco, Michigan area produced from data acquired by NASA Spaceborne Imaging Radar C/X-Band Synthetic Aperture Radar SIR-C/X-SAR onboard space shuttle Endeavour.
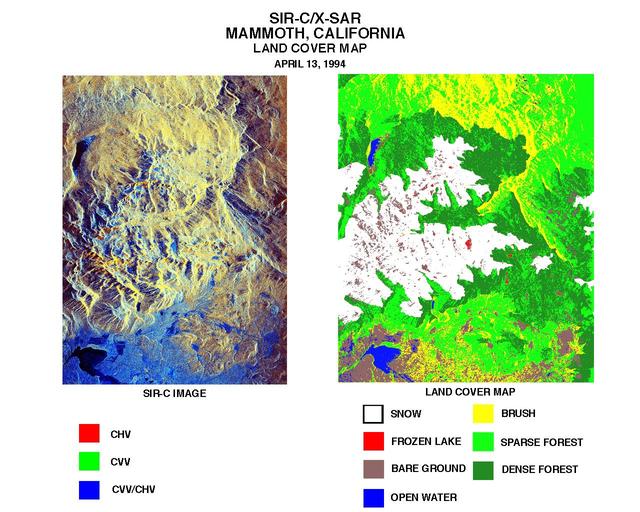
These two images were created using data from NASA Spaceborne Imaging Radar C/X-Band Synthetic Aperture Radar SIR-C/X-SAR.
This radar image acquired by NASA Shuttle Radar Topography Mission SRTM from data collected on February 18, 2000 shows the Dallas-Fort Worth metropolitan area in Texas.
This radar image acquired by NASA Shuttle Radar Topography Mission SRTM from data collected on February 16, 2000 shows the San Francisco Bay Area in California.
This topographic radar image acquired by NASA Shuttle Radar Topography Mission SRTM from data collected on February 16, 2000 shows the relationship of the urban area of Pasadena, California to the natural contours of the land.
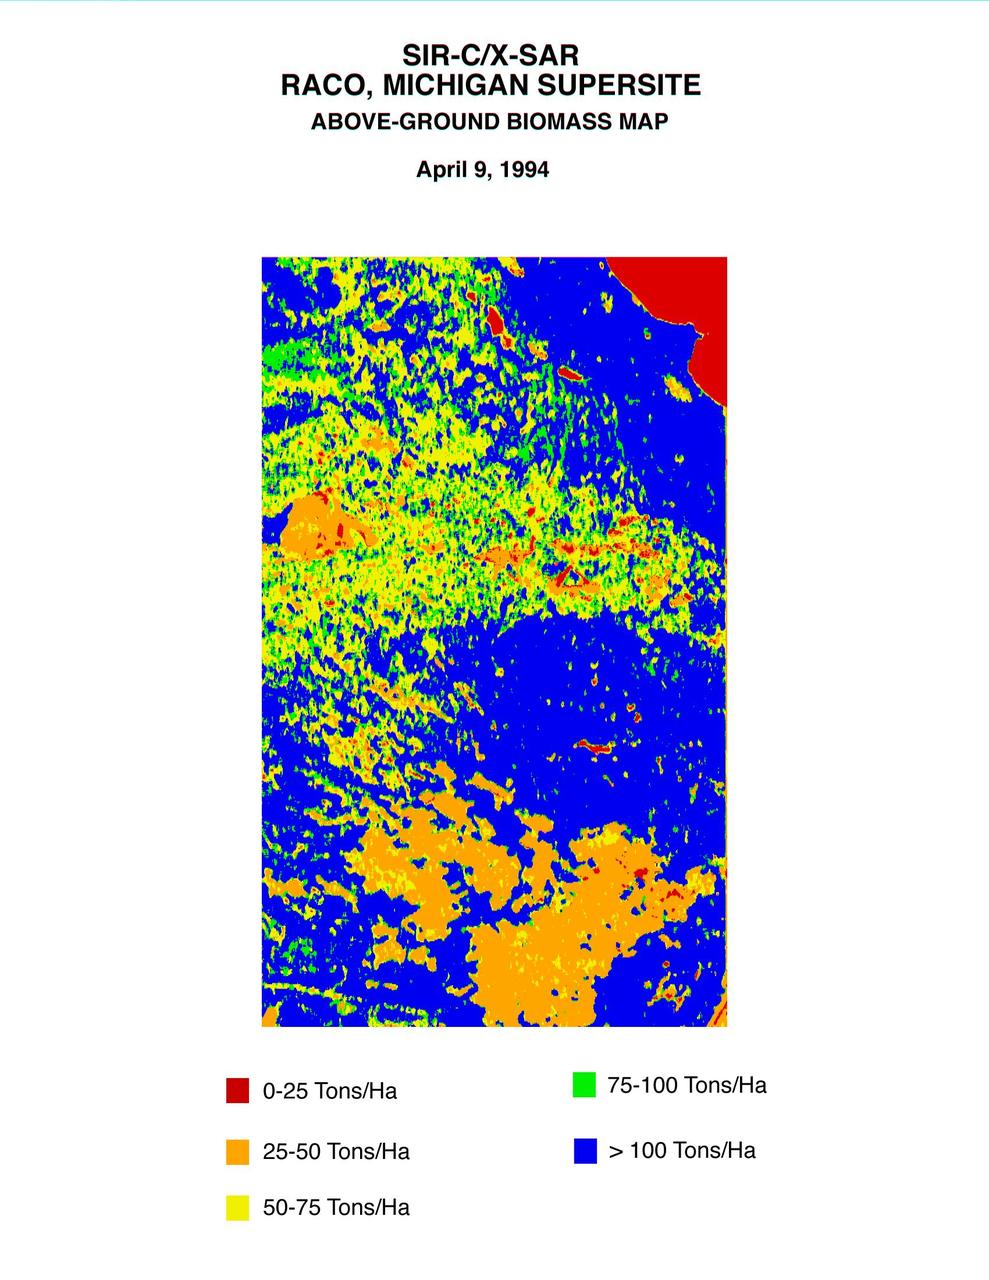
This biomass map of the Raco, Michigan, area was produced from data acquired by NASA Spaceborne Imaging Radar C/X-Band Synthetic Aperture Radar SIR-C/X-SAR onboard space shuttle Endeavour.
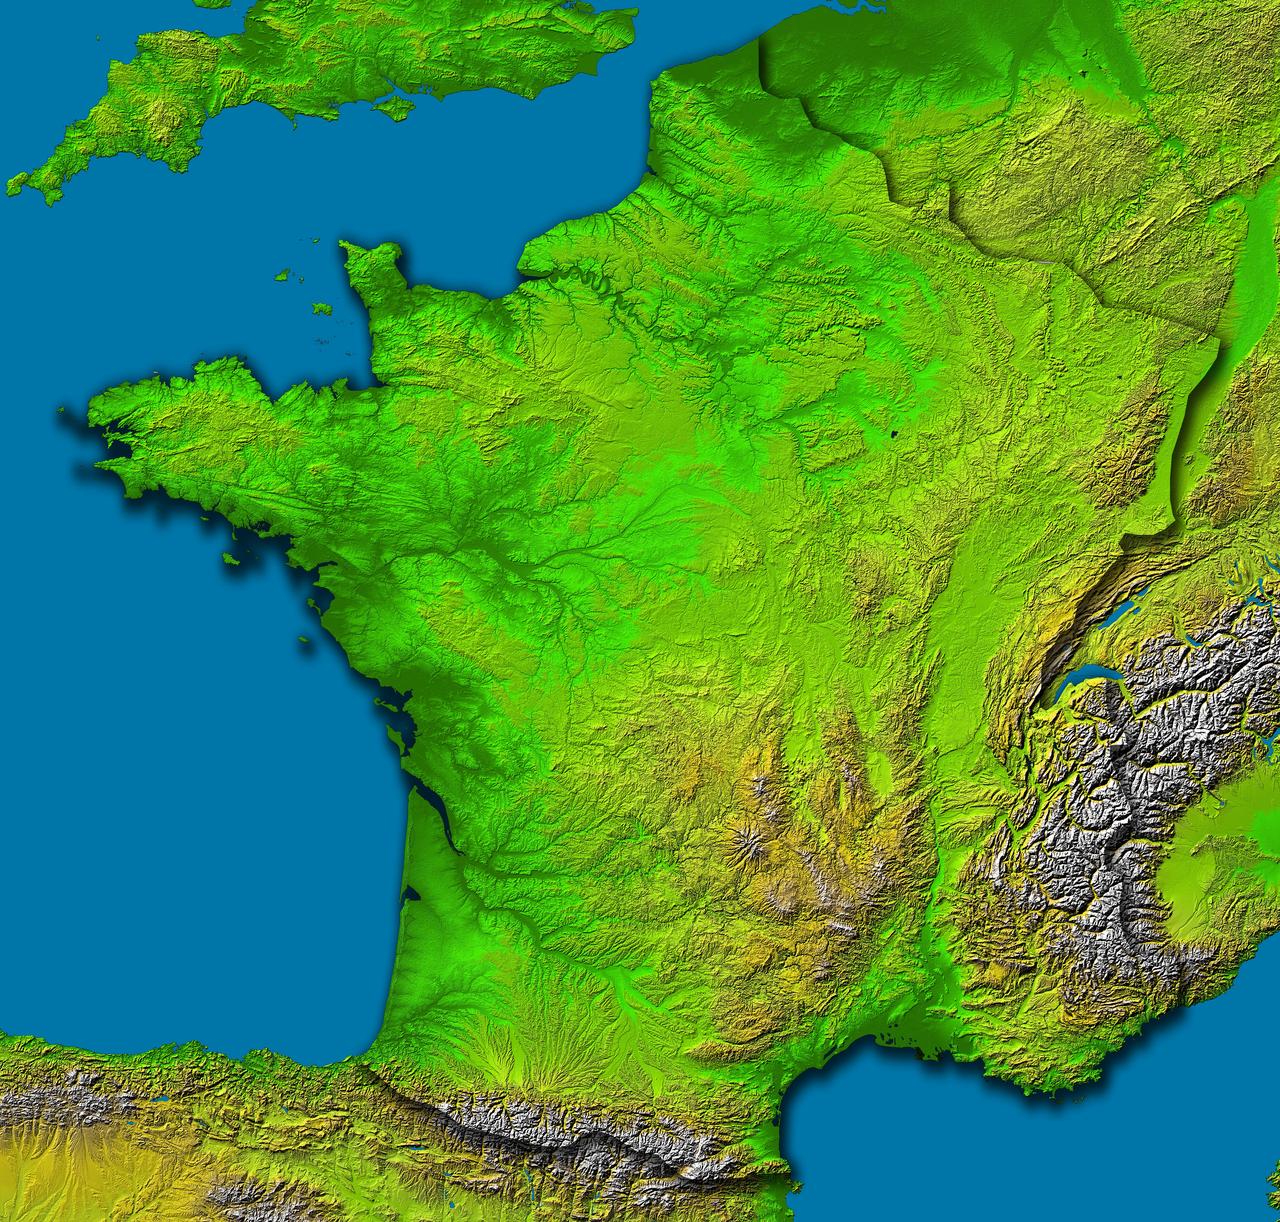
This image of France was generated with data from NASA Shuttle Radar Topography Mission SRTM.
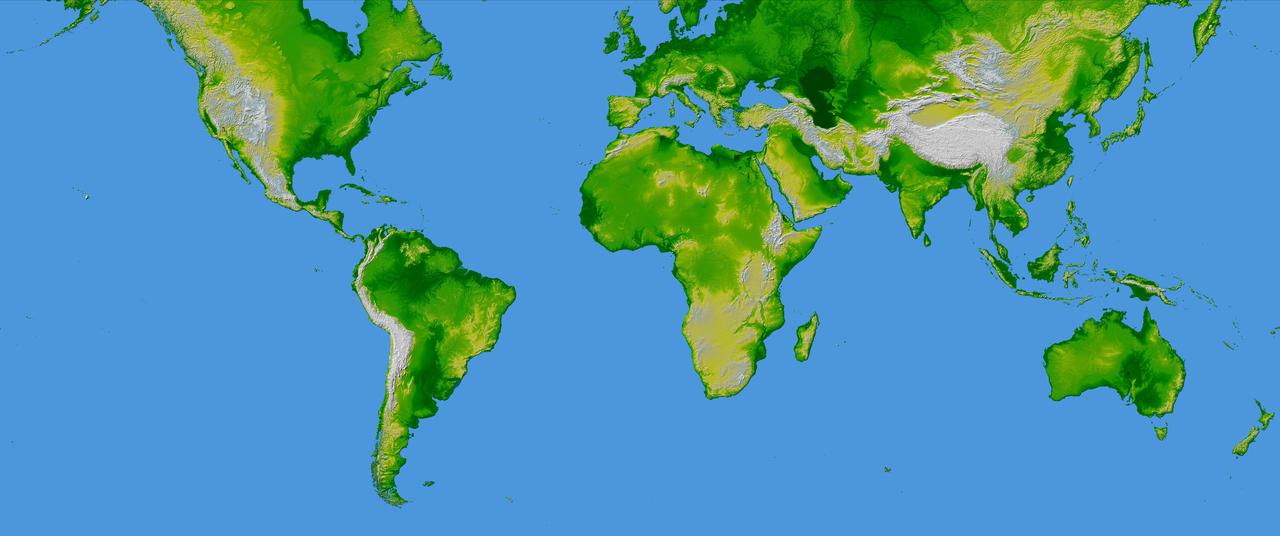
This image of the world was generated with data from NASA Shuttle Radar Topography Mission SRTM.
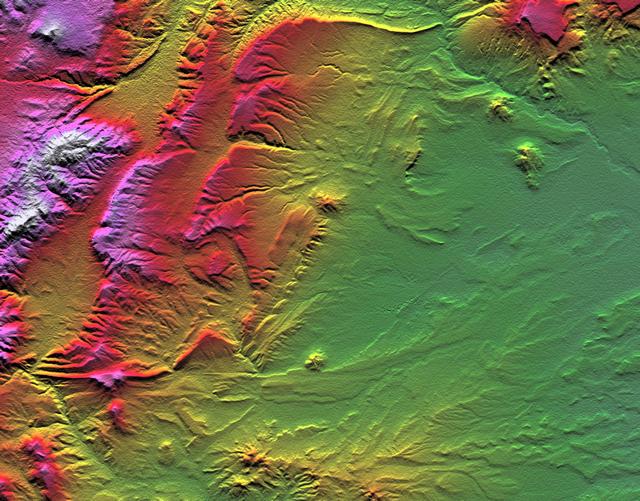
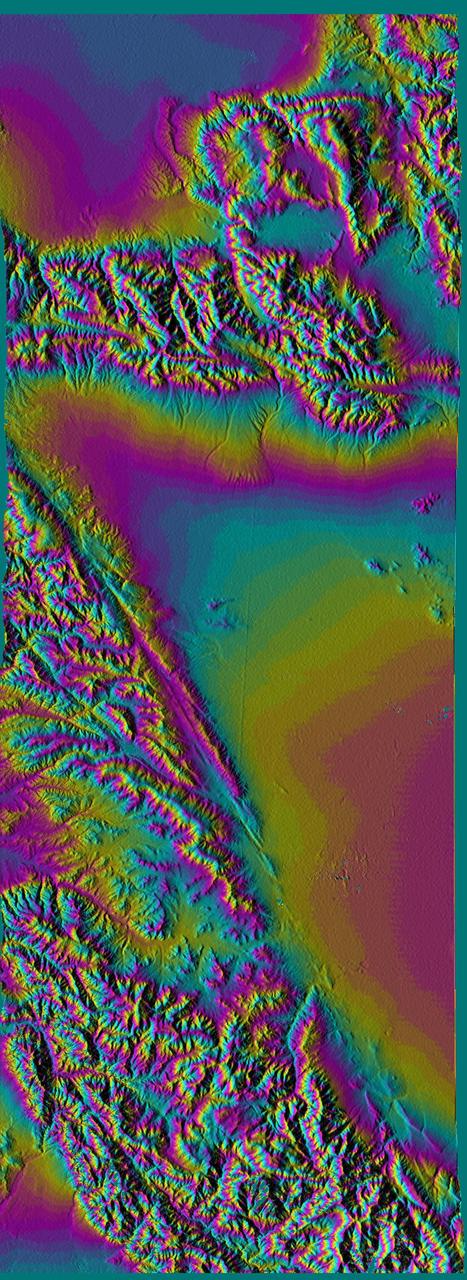
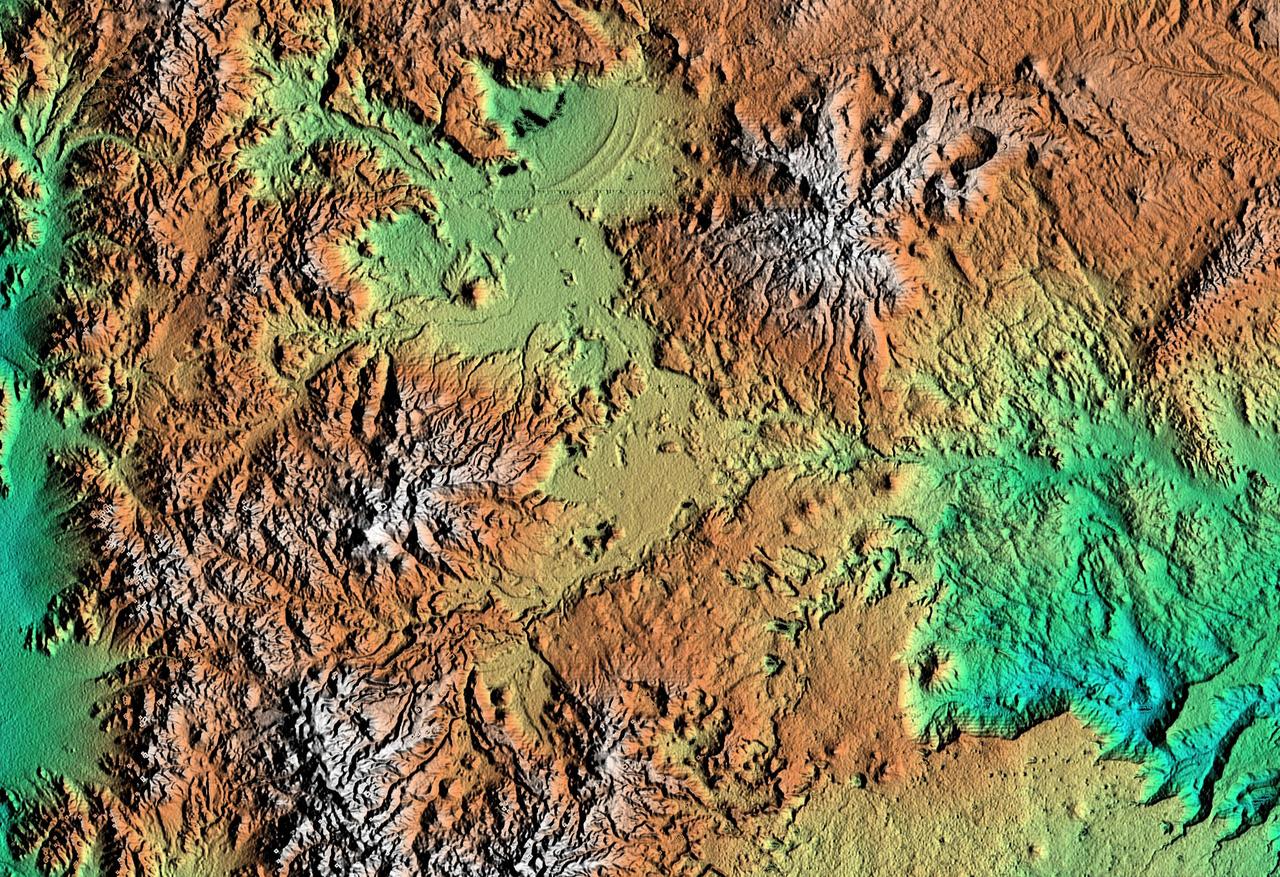
Topographic data provided by NASA Shuttle Radar Topography Mission can provide many clues to geologic history and processes.
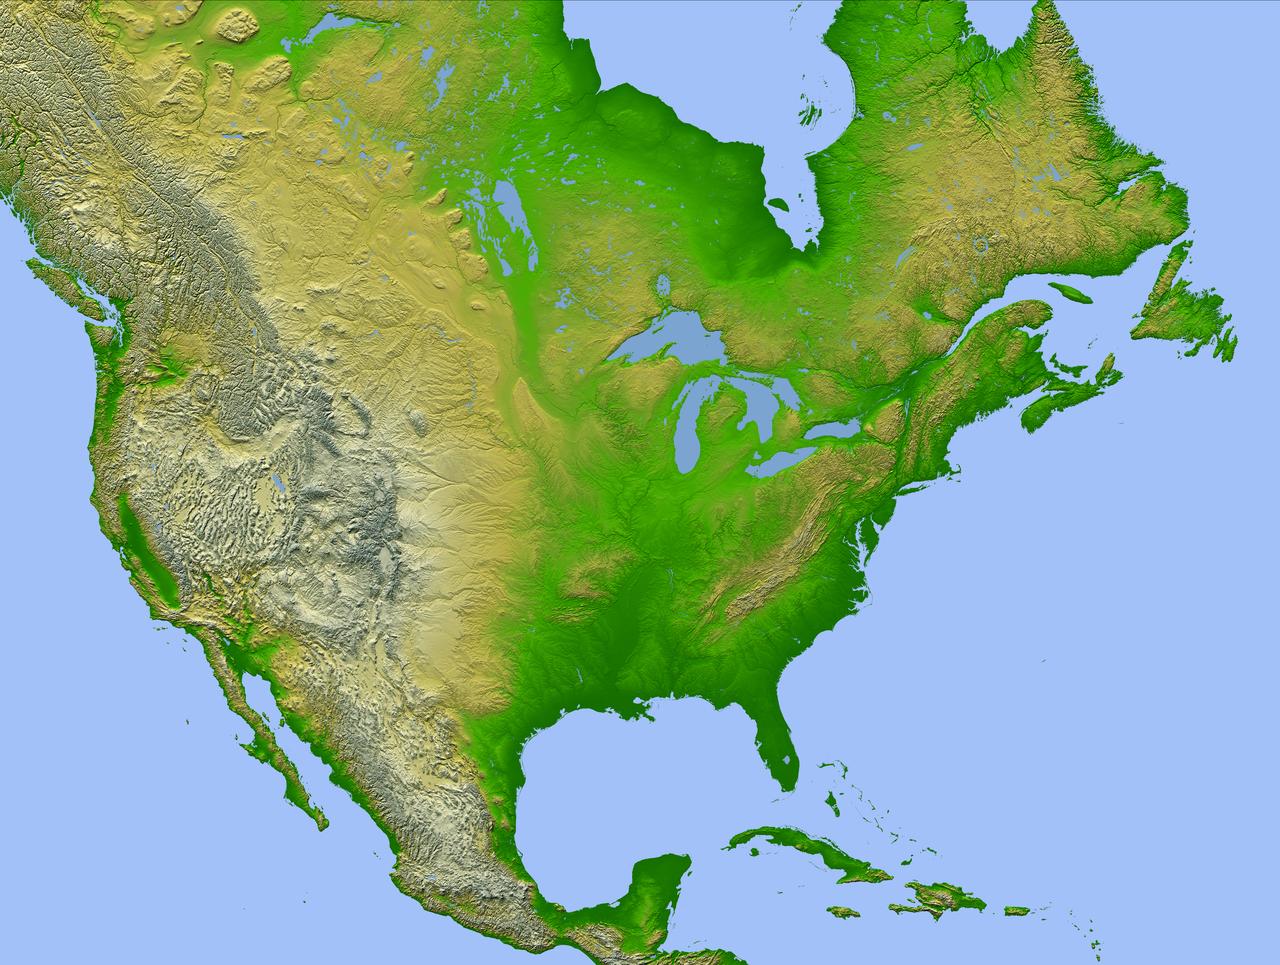
This image of North America was generated with data from NASA Shuttle Radar Topography Mission SRTM.
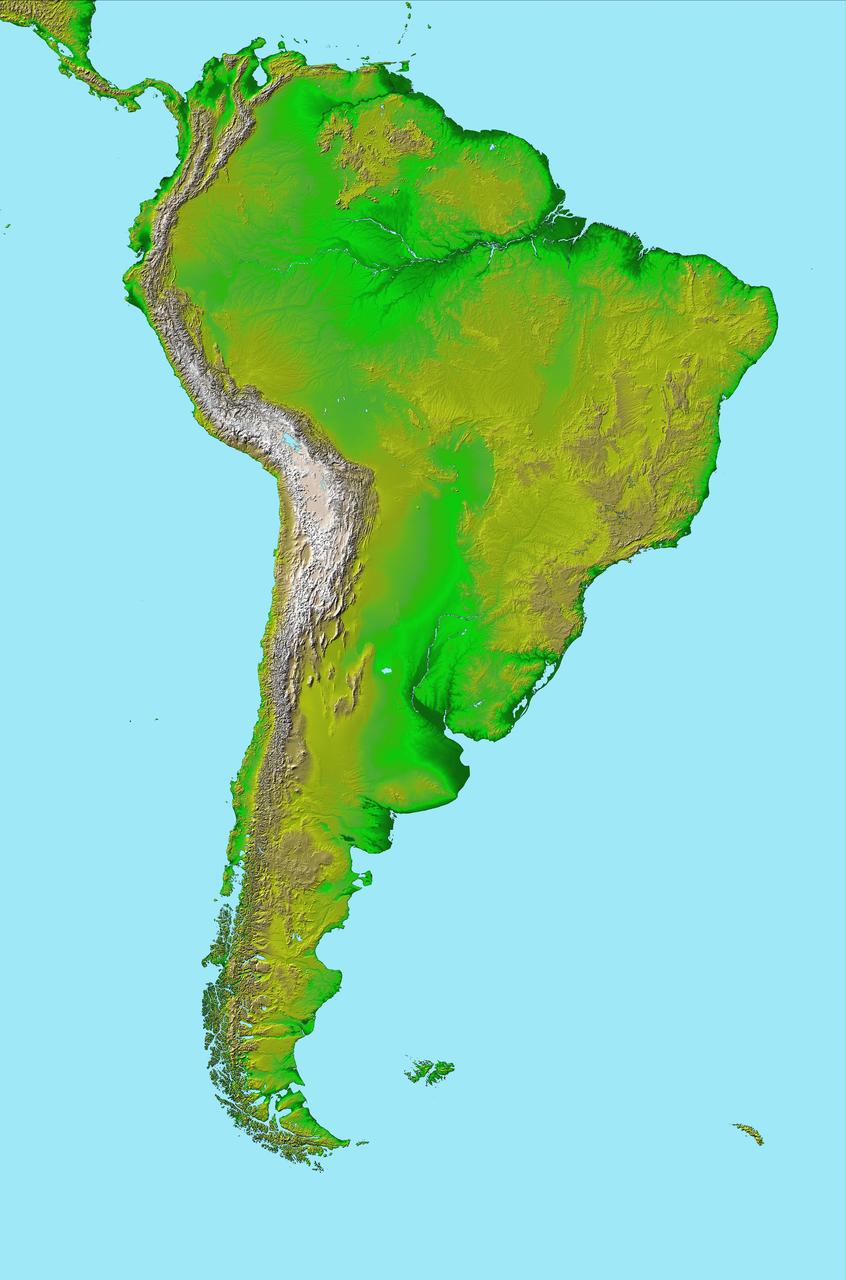
This image of South America was generated with data from NASA Shuttle Radar Topography Mission SRTM.
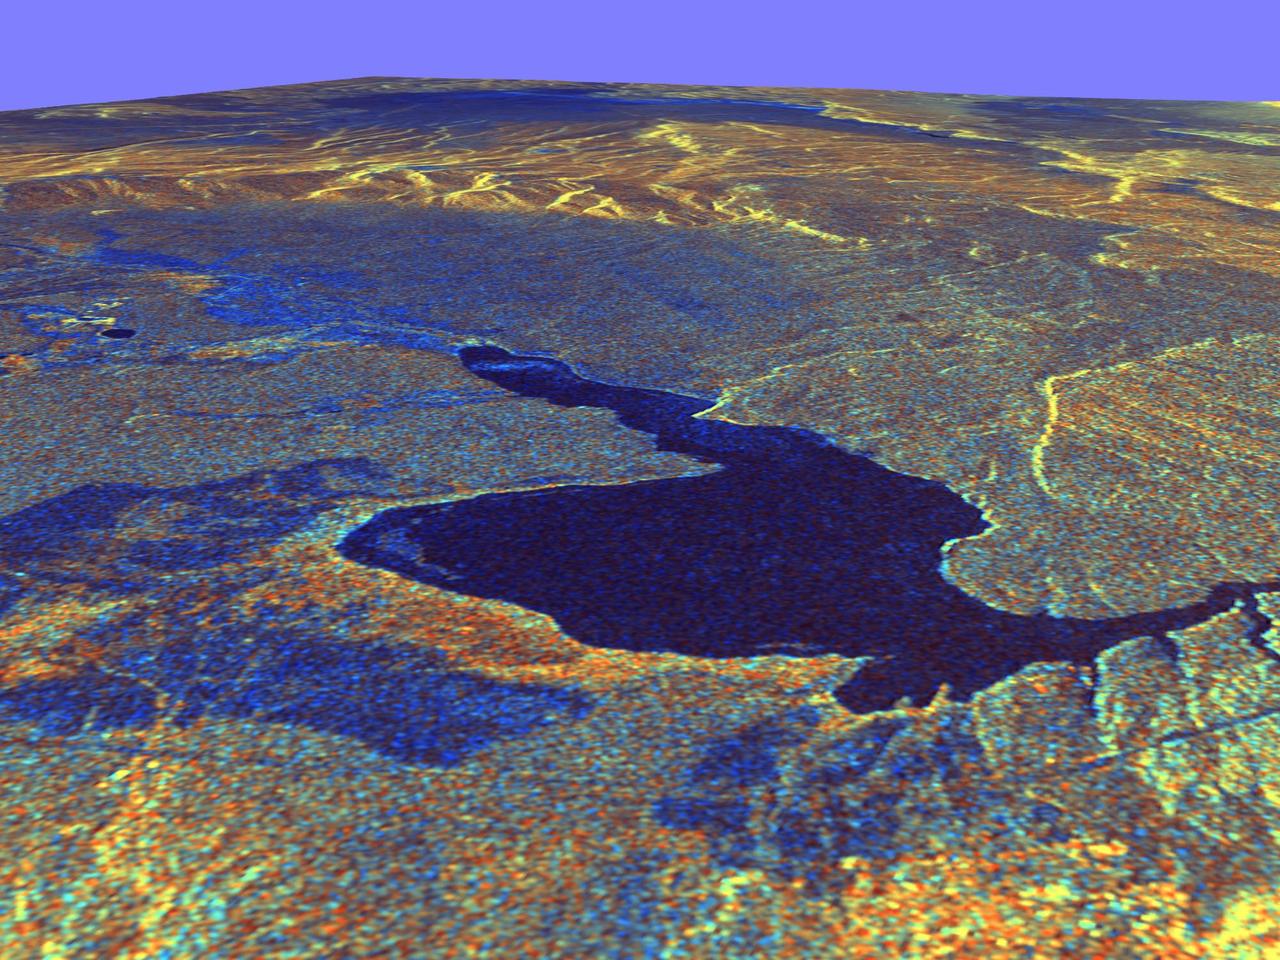
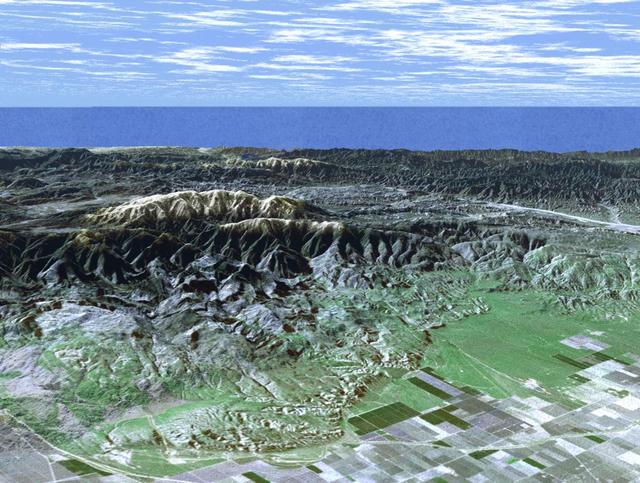
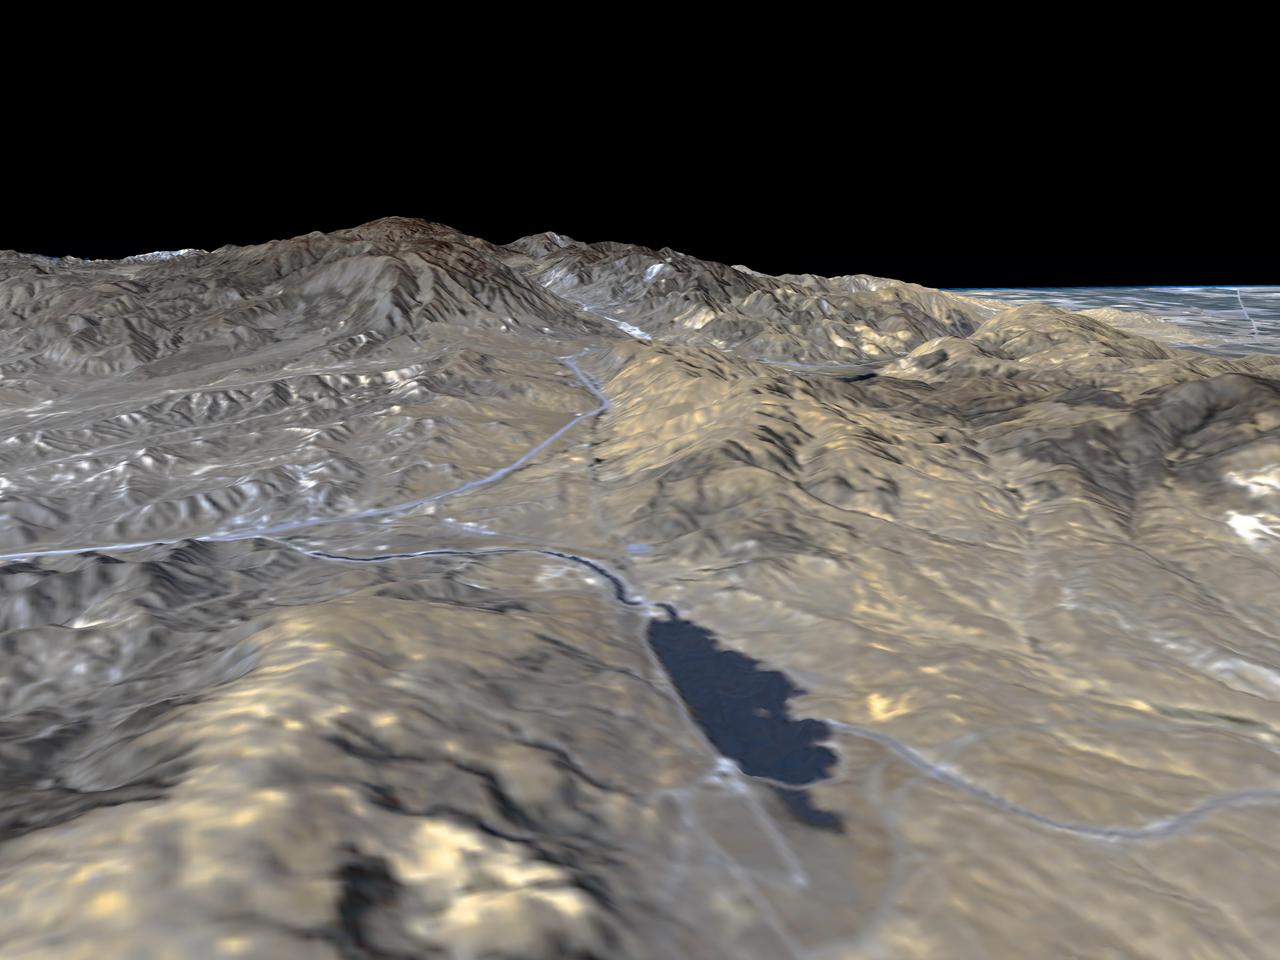
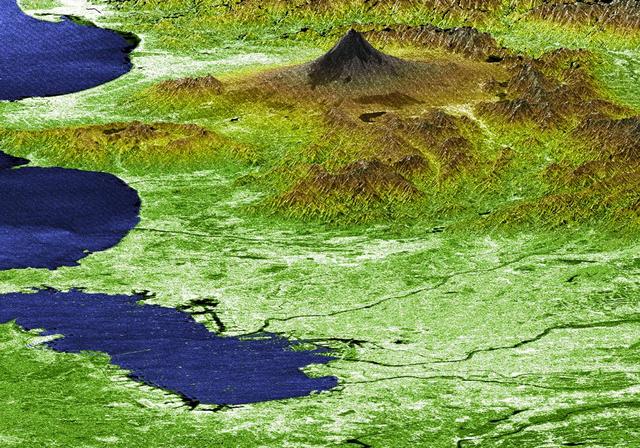
This three-dimensional perspective view of Long Valley, California was created from data taken by the Spaceborne Imaging Radar-C/X-band Synthetic Aperture Radar on board the space shuttle Endeavour. This image was constructed by overlaying a color composite SIR-C radar image on a digital elevation map. The digital elevation map was produced using radar interferometry, a process by which radar data are acquired on different passes of the space shuttle. The two data passes are compared to obtain elevation information. The interferometry data were acquired on April 13,1994 and on October 3, 1994, during the first and second flights of the SIR-C/X-SAR instrument. The color composite radar image was taken in October and was produced by assigning red to the C-band (horizontally transmitted and vertically received) polarization; green to the C-band (vertically transmitted and received) polarization; and blue to the ratio of the two data sets. Blue areas in the image are smooth and yellow areas are rock outcrops with varying amounts of snow and vegetation. The view is looking north along the northeastern edge of the Long Valley caldera, a volcanic collapse feature created 750,000 years ago and the site of continued subsurface activity. Crowley Lake is the large dark feature in the foreground. http://photojournal.jpl.nasa.gov/catalog/PIA01769
This computer-generated perspective view of Latona Corona and Dali Chasma on Venus shows NASA Magellan radar data superimposed on topography. http://photojournal.jpl.nasa.gov/catalog/PIA00268
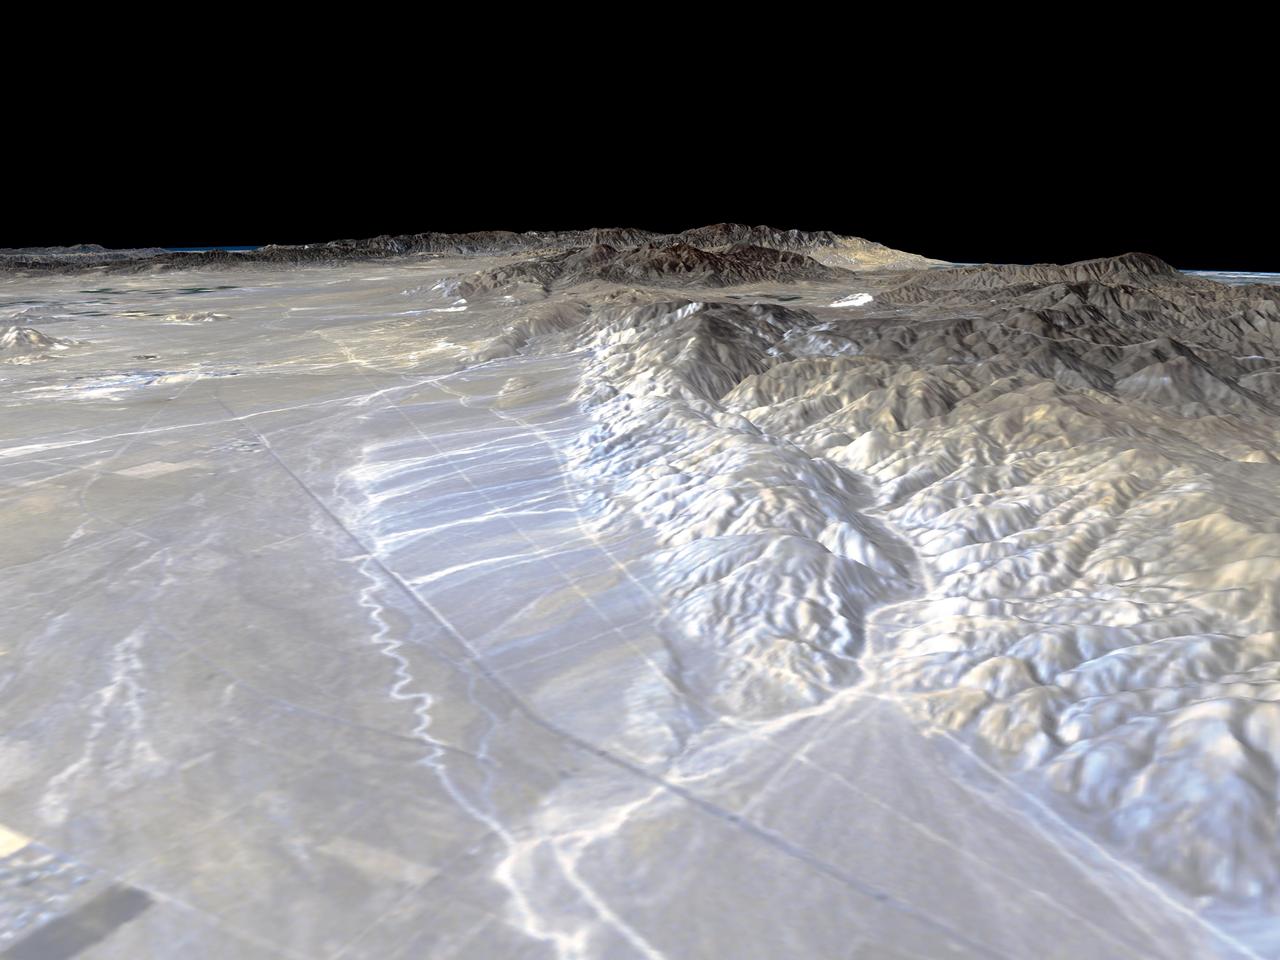
This perspective view of Ishtar Terra was derived from data obtained by NASA's Pioneer Venus spacecraft altimetry radar instrument. http://photojournal.jpl.nasa.gov/catalog/PIA00093

These plots portray data from radar sounding of Mars mid-latitude ionosphere at three times on Oct. 19 and 20, 2014. The data are from the MARSIS instrument on the European Space Agency Mars Express orbiter.
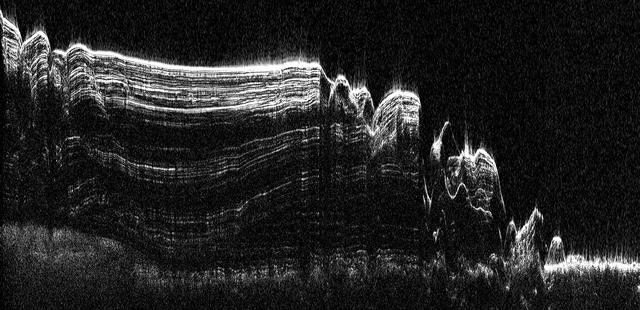
This image shows a cross-section of a portion of the north polar ice cap of Mars, derived from data acquired from NASA Mars Reconnaissance Orbiter Shallow Radar instrument. The data depict the region internal ice structure.
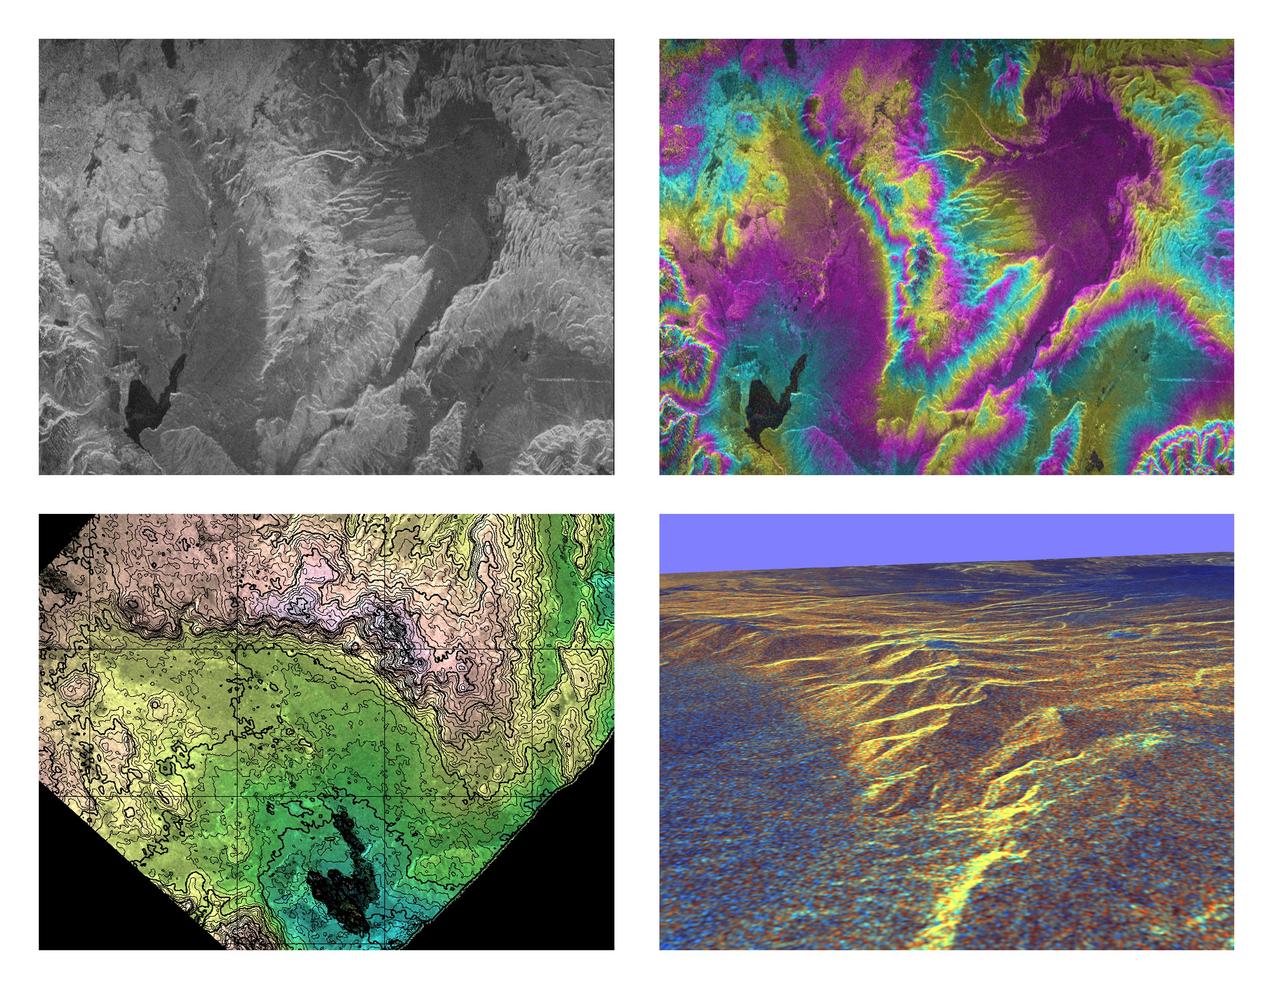
These four images of the Long Valley region of east-central California illustrate the steps required to produced three dimensional data and topographics maps from radar interferometry. All data displayed in these images were acquired by the Spaceborne Imaging Radar-C/X-band Synthetic Aperture Radar (SIR-C/X-SAR) aboard the space shuttle Endeavour during its two flights in April and October, 1994. The image in the upper left shows L-band (horizontally transmitted and received) SIR-C radar image data for an area 34 by 59 kilometers (21 by 37 miles). North is toward the upper right; the radar illumination is from the top of the image. The bright areas are hilly regions that contain exposed bedrock and pine forest. The darker gray areas are the relatively smooth, sparsely vegetated valley floors. The dark irregular patch near the lower left is Lake Crowley. The curving ridge that runs across the center of the image from top to bottom is the northeast rim of the Long Valley Caldera, a remnant crater from a massive volcanic eruption that occurred about 750,000 years ago. The image in the upper right is an interferogram of the same area, made by combining SIR-C L-band data from the April and October flights. The colors in this image represent the difference in the phase of the radar echoes obtained on the two flights. Variations in the phase difference are caused by elevation differences. Formation of continuous bands of phase differences, known as interferometric "fringes," is only possible if the two observations were acquired from nearly the same position in space. For these April and October data takes, the shuttle tracks were less than 100 meters (328 feet) apart. The image in the lower left shows a topographic map derived from the interferometric data. The colors represent increments of elevation, as do the thin black contour lines, which are spaced at 50-meter (164-foot) elevation intervals. Heavy contour lines show 250-meter intervals (820-foot). Total relief in this area is about 1,320 meters (4,330 feet). Brightness variations come from the radar image, which has been geometrically corrected to remove radar distortions and rotated to have north toward the top. The image in the lower right is a three-dimensional perspective view of the northeast rim of the Long Valley caldera, looking toward the northwest. SIR-C C-band radar image data are draped over topographic data derived from the interferometry processing. No vertical exaggeration has been applied. Combining topographic and radar image data allows scientists to examine relationships between geologic structures and landforms, and other properties of the land cover, such as soil type, vegetation distribution and hydrologic characteristics. http://photojournal.jpl.nasa.gov/catalog/PIA01770
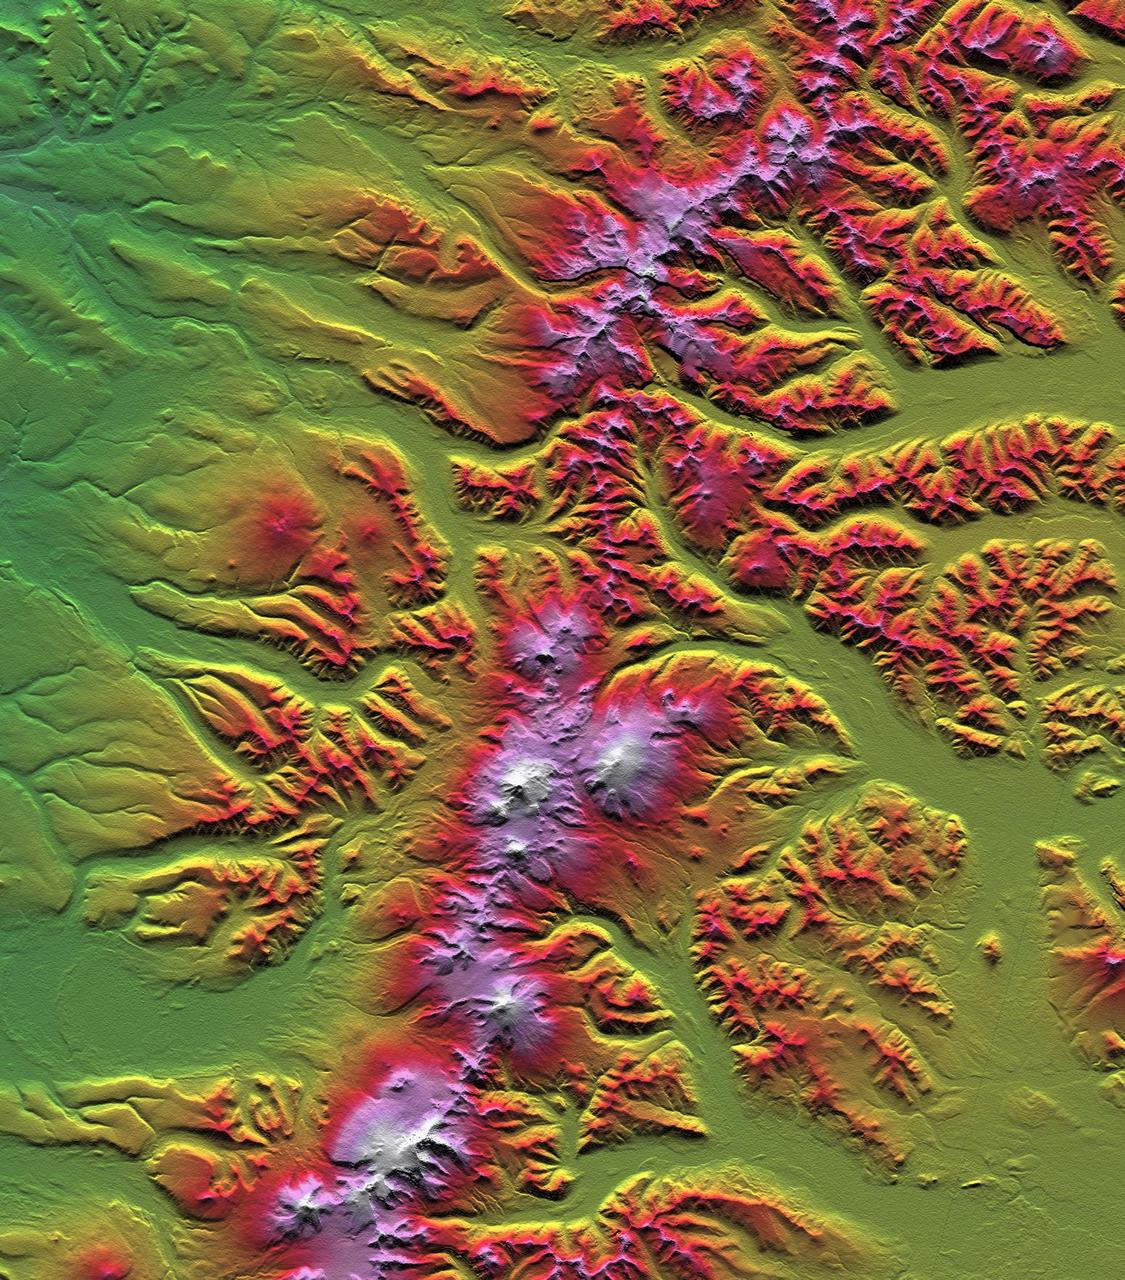
This image is of Mt. Pinos and San Joaquin Valley, California. NASA Shuttle Radar Topography Mission SRTM acquired this data on February 16, 2000.
This partial frame from an animation was generated using radar data collected by the National Science Foundation 1,000-foot 305-meter Arecibo Observatory in Puerto Rico.
Much of Honshu, Japan largest island, is seen in this image generated from NASA Shuttle Radar Topography Mission SRTM data on February 19, 2000.
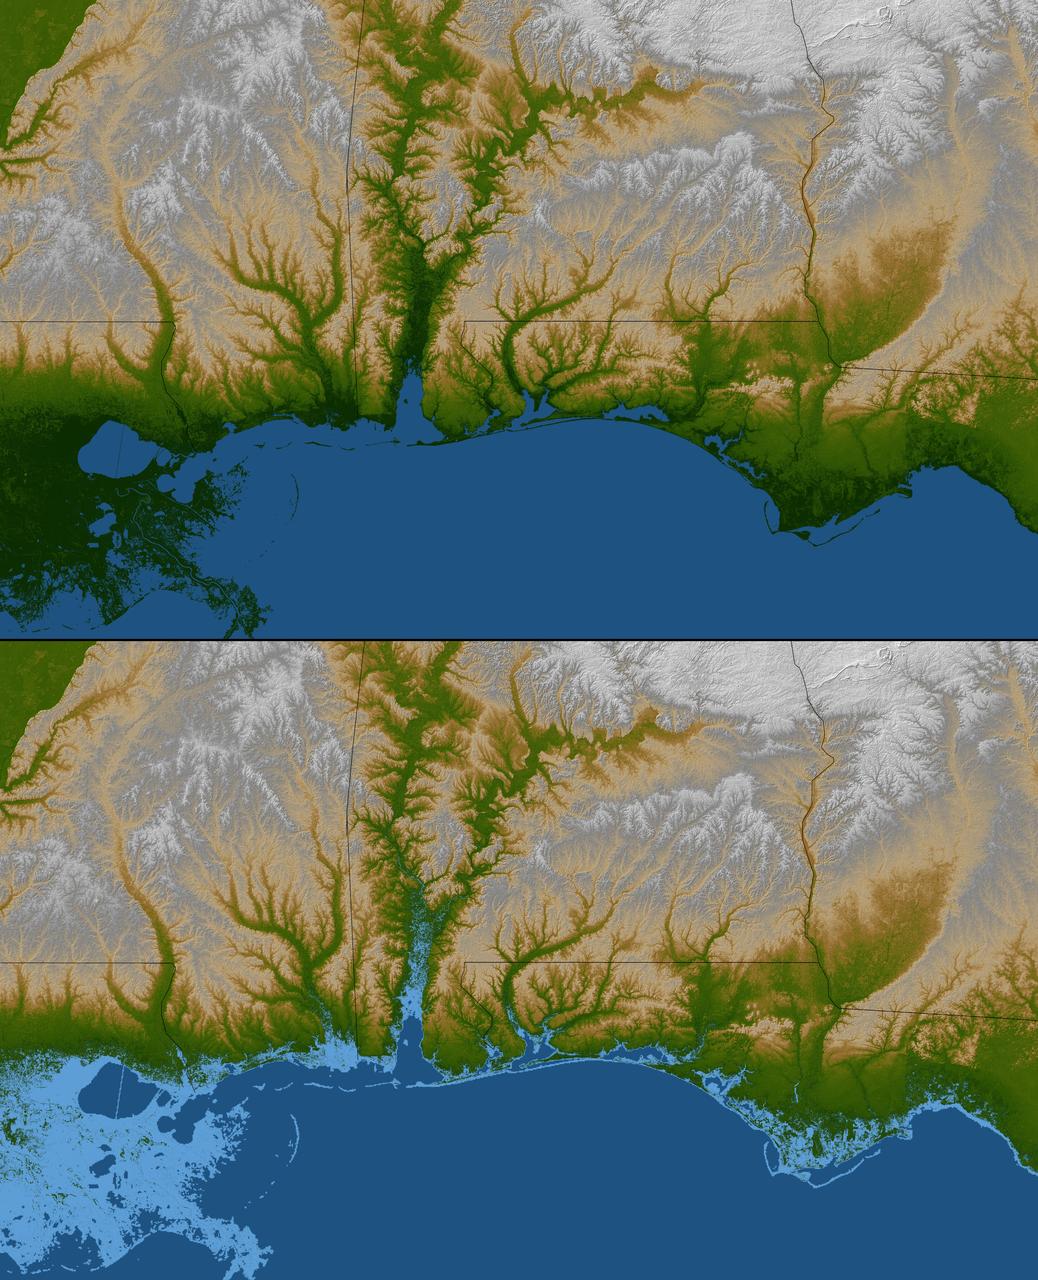
The topography of the Gulf Coast states is well shown in this color-coded shaded relief map generated with data from NASA Shuttle Radar Topography Mission.
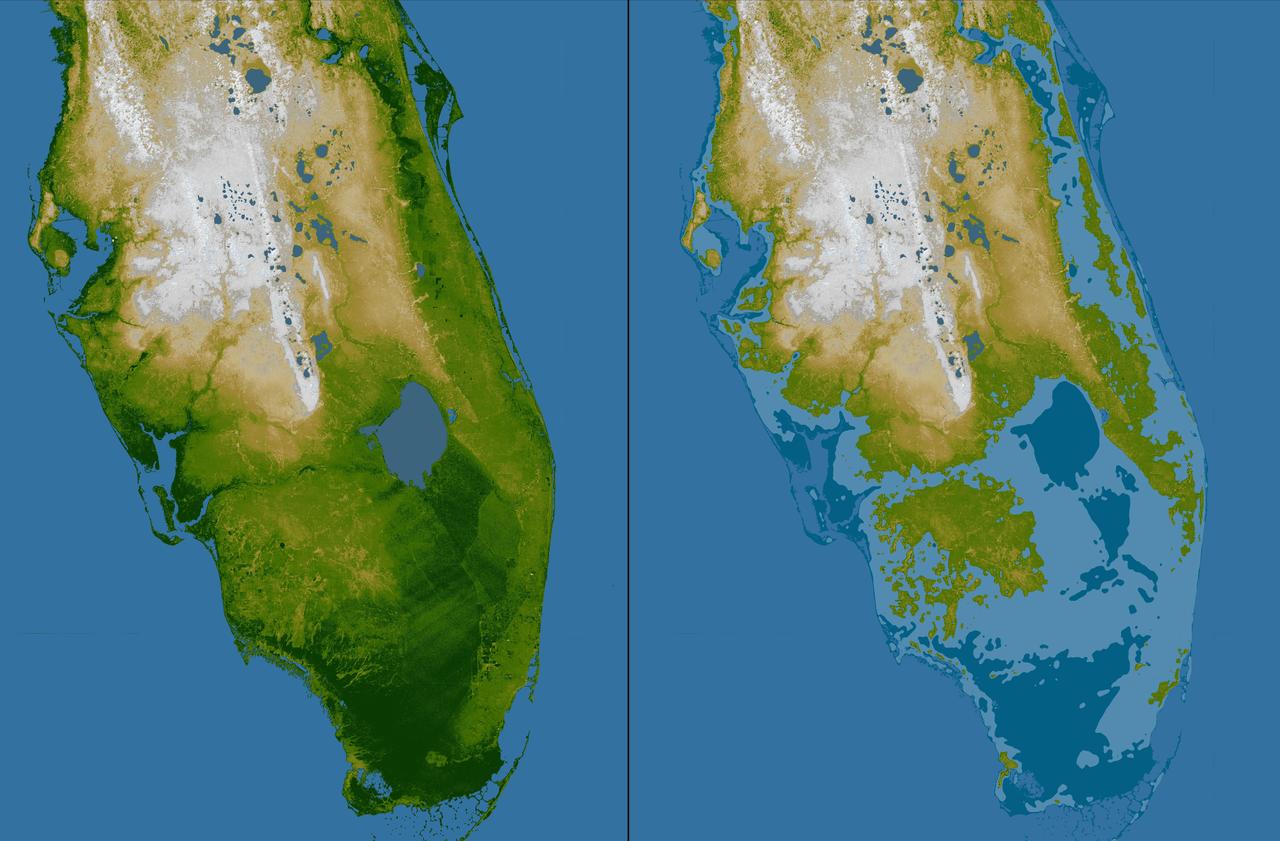
The very low topography of southern Florida is evident in this color-coded shaded relief map generated with data from NASA Shuttle Radar Topography Mission.
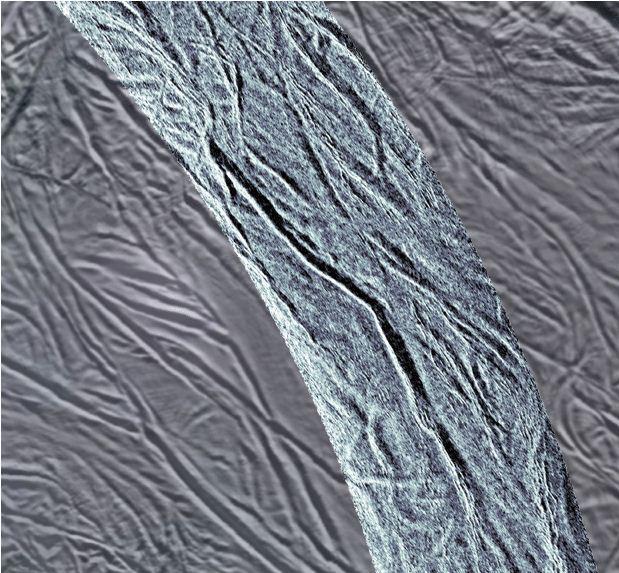
This image using synthetic-aperture radar SAR data acquired by NASA Cassini spacecraft shows grooves in the southern part of Saturn moon Enceladus.
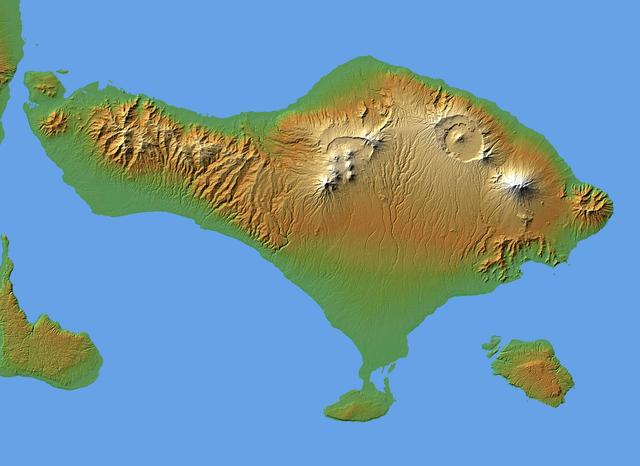
The volcanic nature of the island of Bali is evident in this shaded relief image generated with data from NASA Shuttle Radar Topography Mission SRTM.
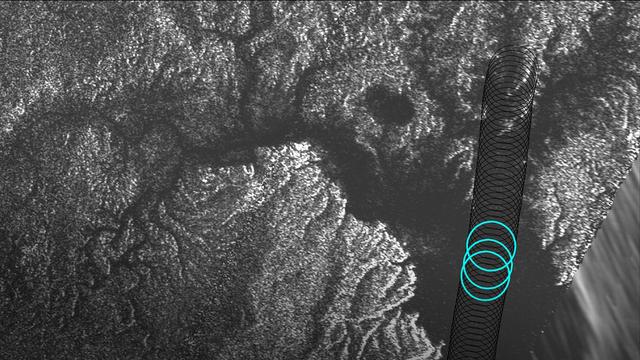
Radar data from NASA's Cassini spacecraft reveal the depth of liquid methane/ethane seas on Saturn's moon Titan. Cassini's Titan flyby on August 21, 2014, included a segment designed to collect altimetry (or height) data, using the spacecraft's radar instrument, along a 120-mile (200-kilometer) shore-to-shore track on Kraken Mare, Titan's largest hydrocarbon sea. For a 25-mile (40-kilometer) stretch of this data, along the sea's eastern shoreline, Cassini's radar beam bounced off the sea bottom and back to the spacecraft, revealing the sea's depth in that area. Observations in this region, near the mouth of a large, flooded river valley, showed depths ranging from 66 to 115 feet (20 to 35 meters). Plots of three radar echoes are shown at left, indicating depths of 89 feet (27 meters), 108 feet (33 meters) and 98 feet (30 meters), respectively. The altimetry echoes show the characteristic double-peaked returns of a bottom-reflection. The tallest peak represents the sea surface; the shorter of the pair represents the sea bottom. The distance between the two peaks is a measure of the liquid's depth. The Synthetic Aperture Radar (SAR) image at right shows successive altimetry observations as black circles. The three blue circles indicate the locations of the three altimetry echoes shown in the plots at left. http://photojournal.jpl.nasa.gov/catalog/PIA19046

This satellite interferometric synthetic aperture radar image using COSMO-SkyMed radar data, depicts the relative deformation of Earth surface at Kilauea between Feb. 11, 2011 and March 7, 2011 two days following the start of the current eruption.
The topography surrounding the Laguna Salada Fault in the Mexican state of Baja, California, is shown in this combined radar image and topographic view with data from NASA Shuttle Radar Topography Mission where a 7.2 earthquake struck on April 4, 2010.
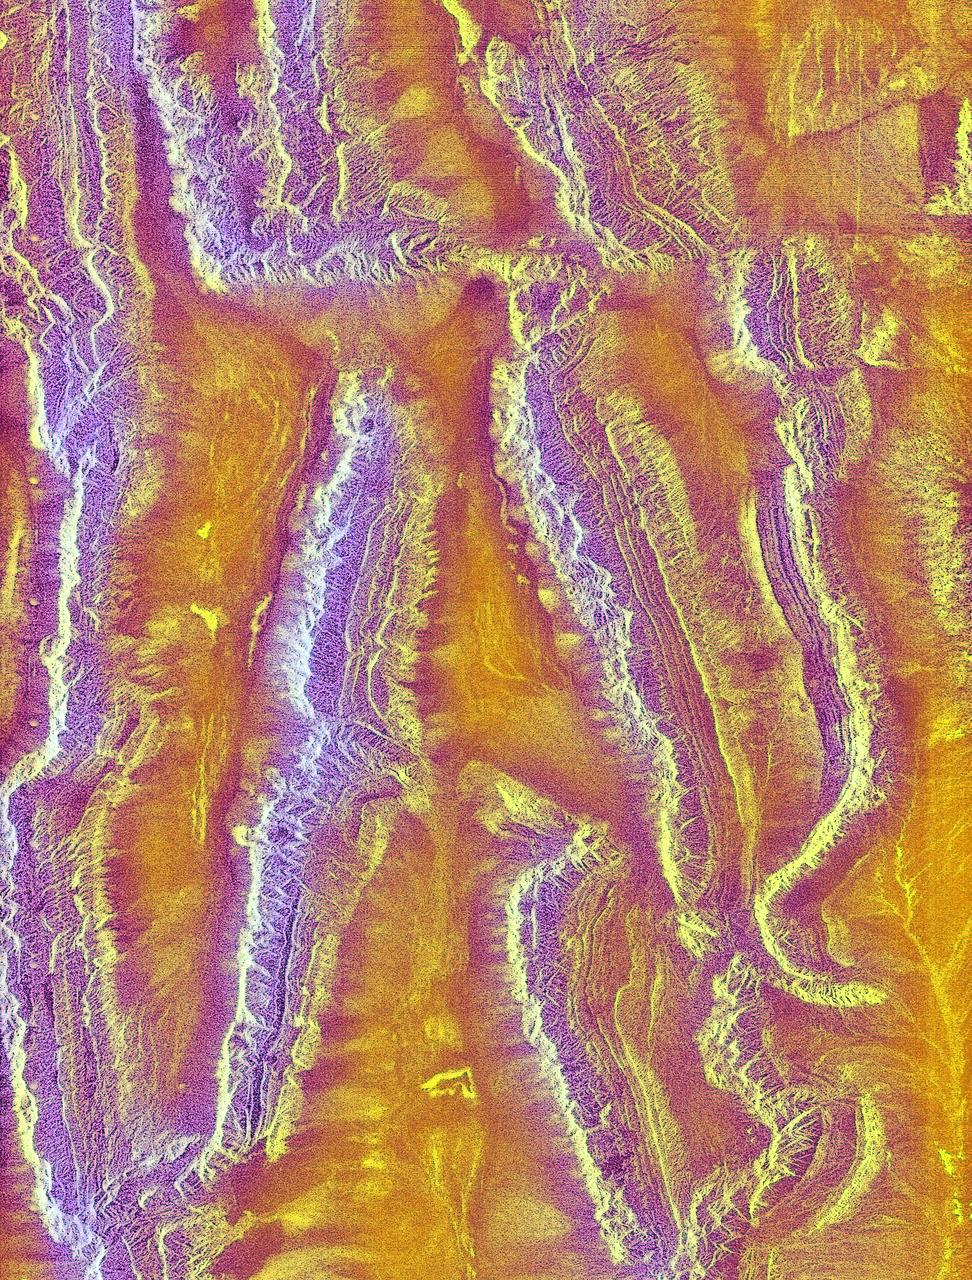
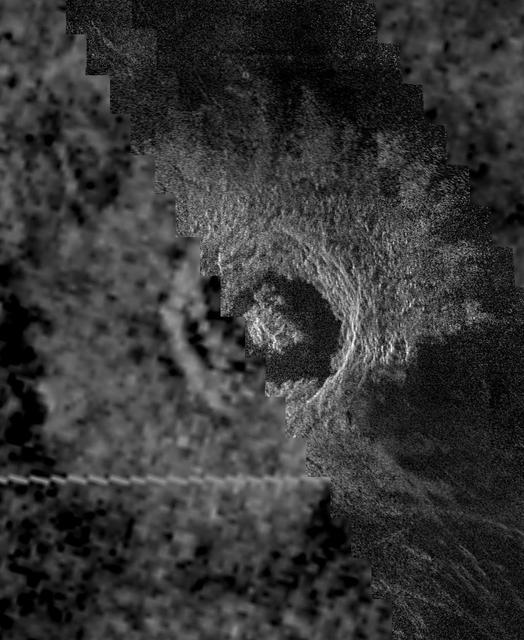
This radar image from NASA Magellan spacecraft shows a region located in a vast plain to the south of Aphrodite Terra. The data for this image was obtained in January 1991. http://photojournal.jpl.nasa.gov/catalog/PIA00202
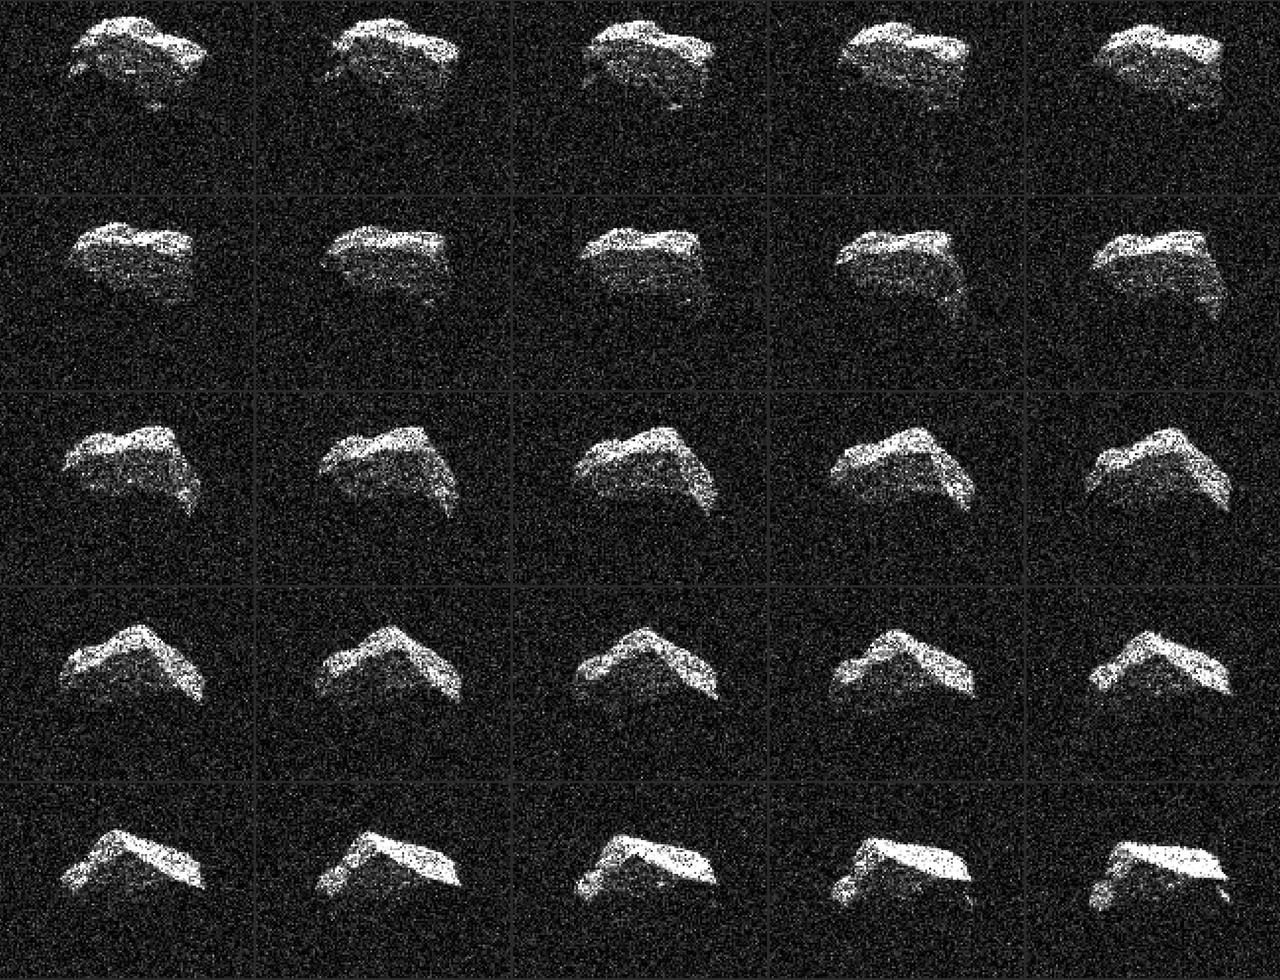
This composite of 25 images of asteroid 2017 BQ6 was generated with radar data collected using NASA's Goldstone Solar System Radar in California's Mojave Desert. The images were gathered on Feb. 7, 2017, between 8:39 and 9:50 p.m. PST (11:39 p.m. EST and 12:50 a.m., Feb. 7), revealing an irregular, angular-appearing asteroid about 660 feet (200 meters) in size that rotates about once every three hours. The images have resolutions as fine as 12 feet (3.75 meters) per pixel. http://photojournal.jpl.nasa.gov/catalog/PIA21452
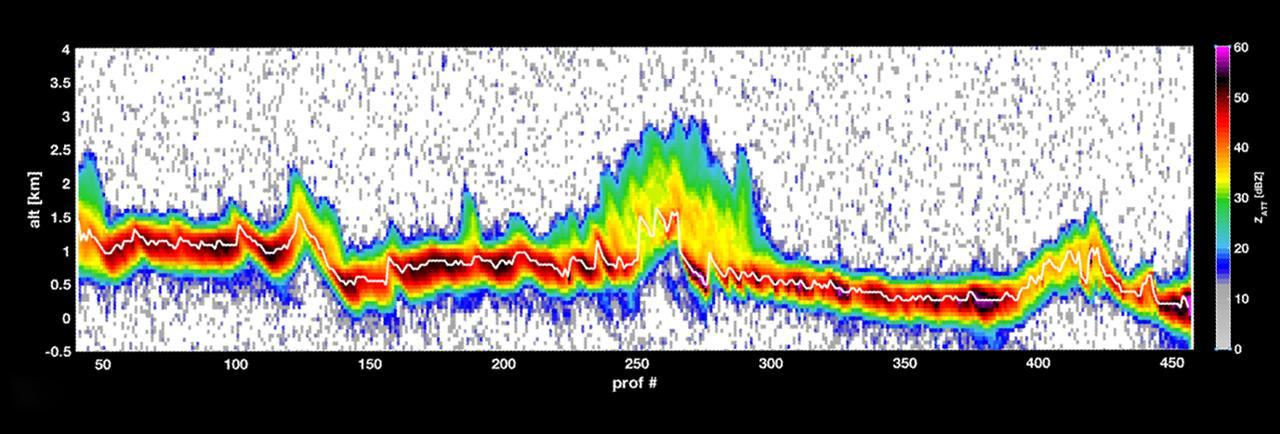
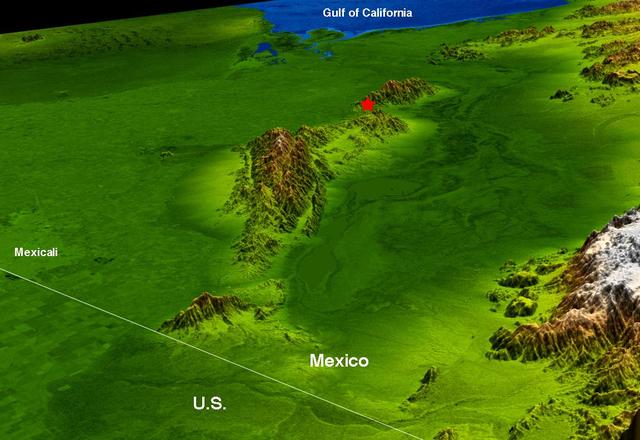
The first data from RainCube, a tiny weather satellite. RainCube is a prototype for a possible fleet of future small satellite missions that can track precipitation from space. RainCube "sees" objects by using radar, much as a bat uses sonar. The satellite's umbrella -- like antenna sends out chirps, or specialized radar signals, that bounce off raindrops, bringing back a picture of what the inside of the storm looks like. This graph shows a storm over the mountains in Mexico in late August 2018, as measured by RainCube's radar. The data shows a vertical snapshot of the storm -- the bright white line shows the ground, while the bright colors around it show the intensity of the rainfall, as well as the more reflective areas of the terrain. Brighter colors, like yellow or red, show areas of higher reflectivity, e.g. heavier rain. https://photojournal.jpl.nasa.gov/catalog/PIA22654
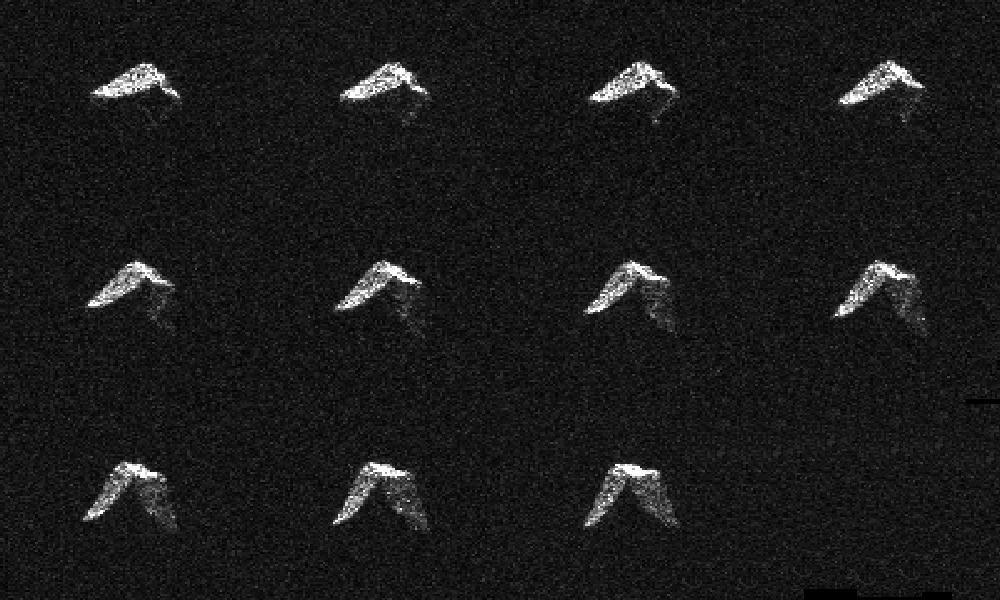
This composite of 11 images of asteroid 2017 BQ6 was generated with radar data collected using NASA's Goldstone Solar System Radar in California's Mojave Desert on Feb. 5, 2017, between 5:24 and 5:52 p.m. PST (8:24 to 8:52 p.m. EST / 1:24 to 1:52 UTC). The images have resolutions as fine as 12 feet (3.75 meters) per pixel. http://photojournal.jpl.nasa.gov/catalog/PIA21453
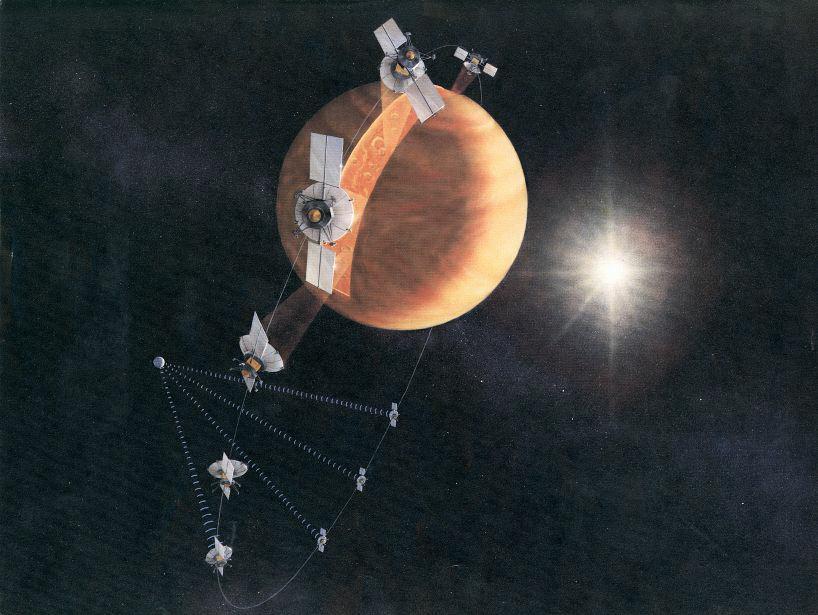
An artist's concept of the Magellan spacecraft making a radar map of Venus. Magellan mapped 98 percent of Venus' surface at a resolution of 100 to 150 meters (about the length of a football or soccer field), using synthetic aperture radar, a technique that simulates the use of a much larger radar antenna. It found that 85 percent of the surface is covered with volcanic flows and showed evidence of tectonic movement, turbulent surface winds, lava channels and pancake-shaped domes. Magellan also produced high-resolution gravity data for 95 percent of the planet and tested a new maneuvering technique called aerobraking, using atmospheric drag to adjust its orbit. The spacecraft was commanded to plunge into Venus' atmosphere in 1994 as part of a final experiment to gather atmospheric data. http://photojournal.jpl.nasa.gov/catalog/PIA18175
This first glimpse of seasonal change shows the southern polar area of Saturn moon Titan, using data from the Synthetic Aperture Radar instrument aboard NASA Cassini spacecraft.
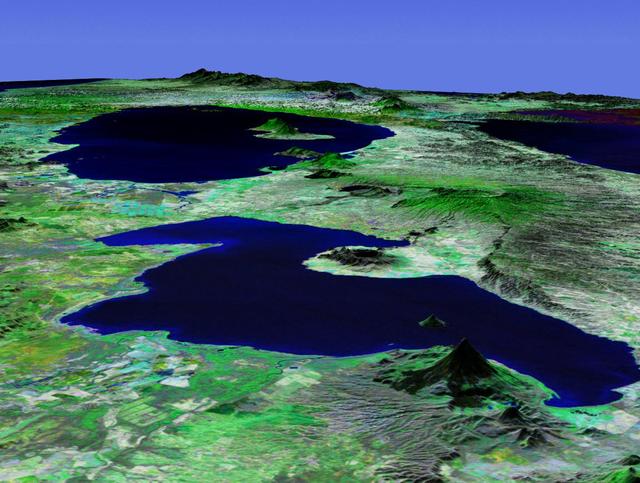
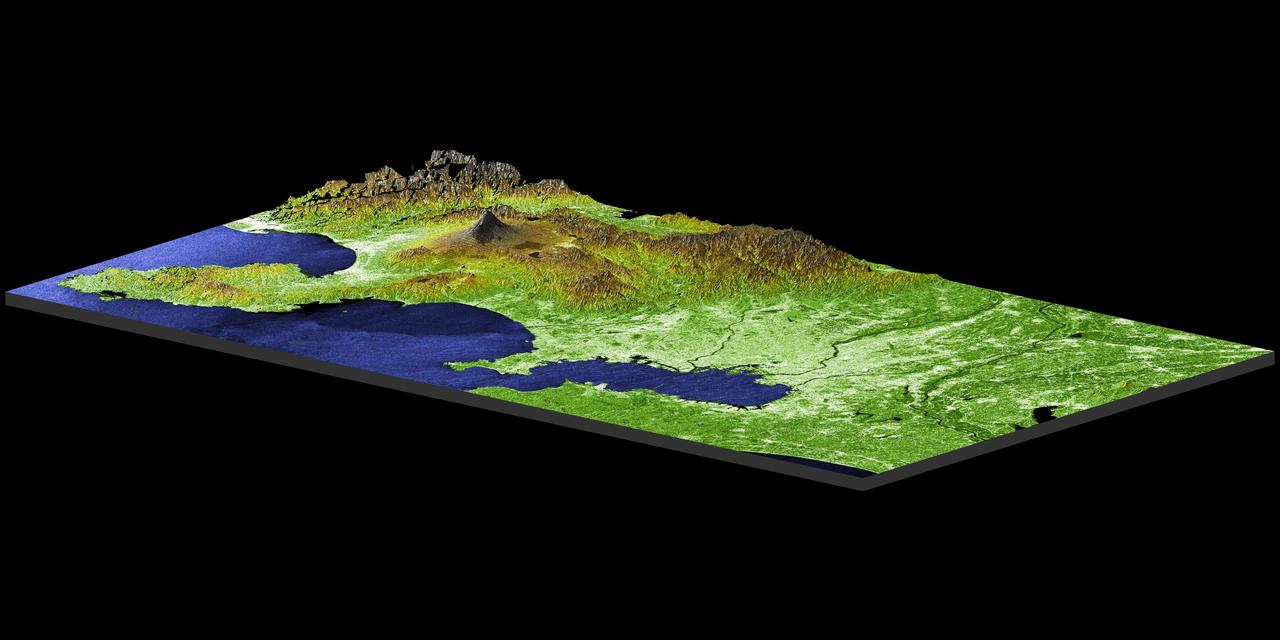
This perspective view acquired by NASA Shuttle Radar Topography Mission SRTM from data collected in the year 2000 shows Lakes Managua and Nicaragua near the Pacific coast of Nicaragua.
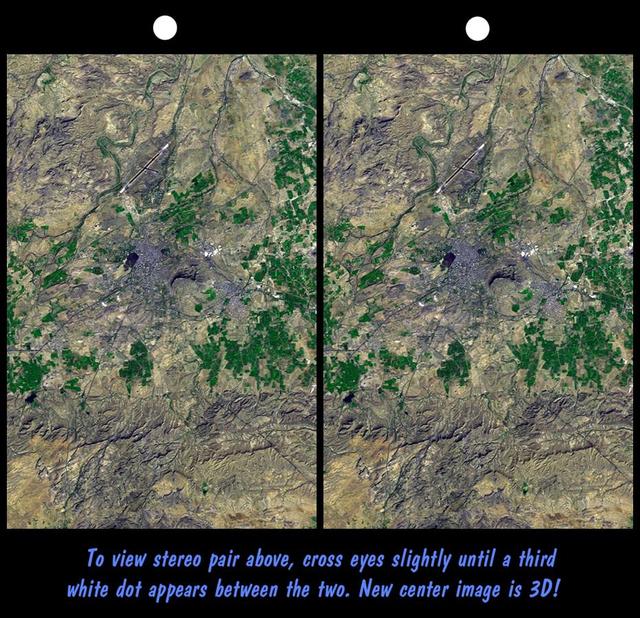
On January 26, 2001, the city of Bhuj suffered the most deadly earthquake in India history. This stereoscopic image was generated from NASA Landsat satellite and data from Shuttle Radar Topography Mission SRTM.
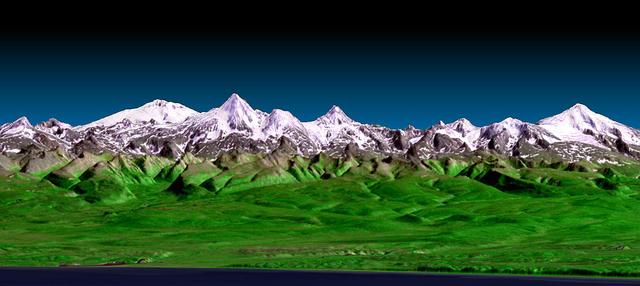
This perspective view shows the western side of the volcanically active Kamchatka Peninsula in eastern Russia. The image was generated using the first data collected during NASA Shuttle Radar Topography Mission SRTM.
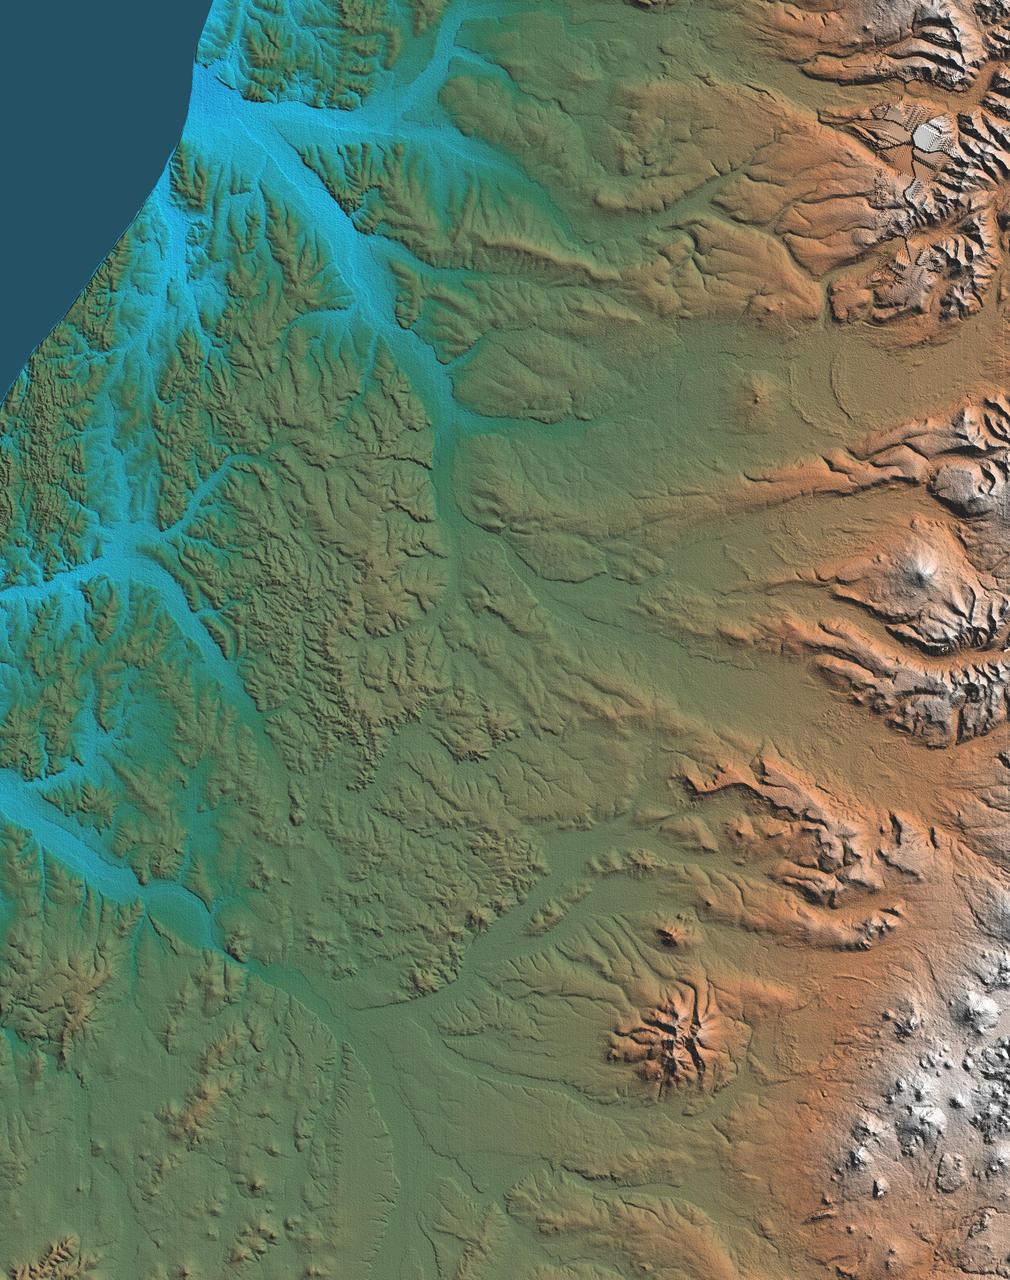
This topographic map acquired by NASA Shuttle Radar Topography Mission SRTM from data collected on February 12, 2000 shows the western side of the volcanically active Kamchatka Peninsula, Russia.
This topographic map acquired by NASA Shuttle Radar Topography Mission SRTM from data collected on February 16, 2000 vividly displays California famous San Andreas Fault along the southwestern edge of the Mojave Desert, Calif.
Rectangular fields of the agriculturally rich Santa Clara River Valley are visible in this perspective view generated by using data from the Shuttle Radar Topography Mission and an enhanced Landsat image.
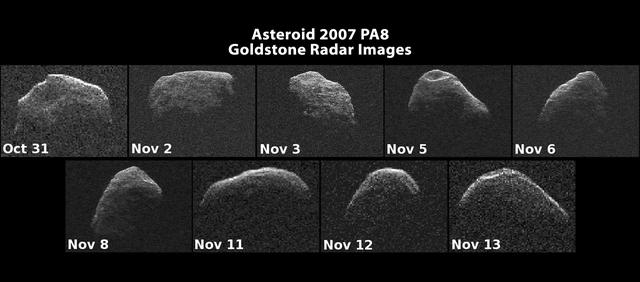
Images of asteroid 2007 PA8 have been generated with data collected by NASA Goldstone Solar System Radar. The images of 2007 PA8 reveal possible craters, boulders, an irregular, asymmetric shape, and very slow rotation.
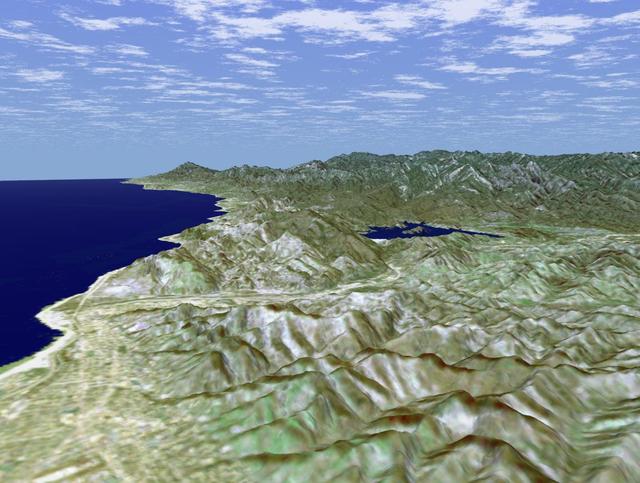
This image is of Ventura, California, one of this state oldest cities, and Lake Casitas, California. NASA Shuttle Radar Topography Mission SRTM acquired this data on February 16, 2000.
The Kamchatka Peninsula in eastern Russia is shown in this scene created from a preliminary elevation model derived from the first data collected during NASA Shuttle Radar Topography Mission SRTM on February 12, 2000.
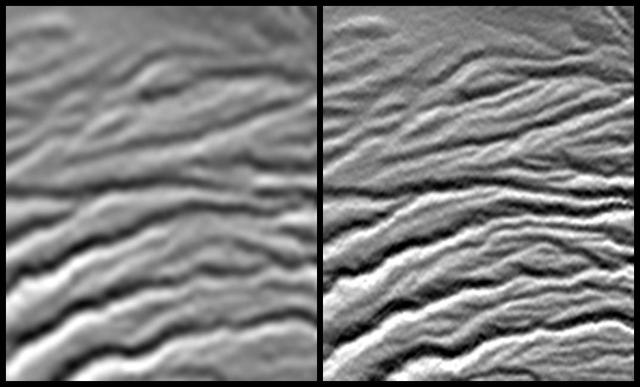
A site in the Crater Highlands of Tanzania reveals the difference between NASA Shuttle Radar Topography Mission SRTM digital elevation model data as originally released in 2004 left and as now released at full resolution in 2014 right.
This perspective view acquired by NASA Shuttle Radar Topography Mission SRTM from data collected in the year 2000 shows Patagonia, Argentina, a spectacular landscape formed by volcanoes, rivers, and wind.
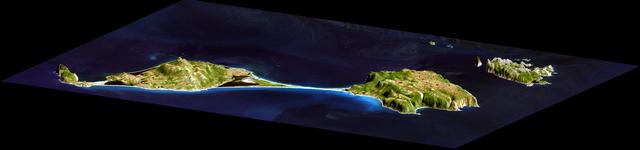
This image acquired by NASA Shuttle Radar Topography Mission SRTM from data collected on February 12, 2000 shows two islands, Miquelon and Saint Pierre, located south of Newfoundland, Canada.
This topographic acquired by NASA Shuttle Radar Topography Mission SRTM from data collected on February 16, 2000 shows the relationship of the urban area of Pasadena, California to the natural contours of the land.
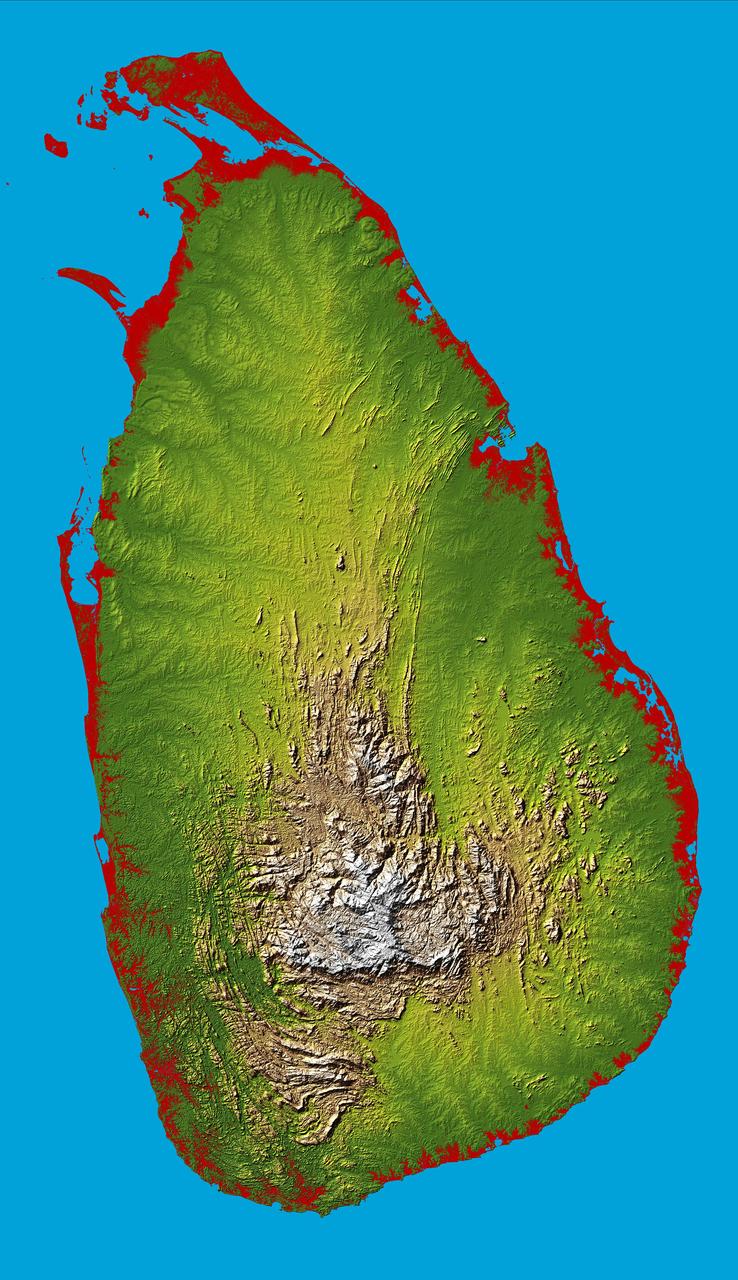
The topography of the island nation of Sri Lanka is well shown in this color-coded shaded relief map generated with digital elevation data from NASA Shuttle Radar Topography Mission SRTM.
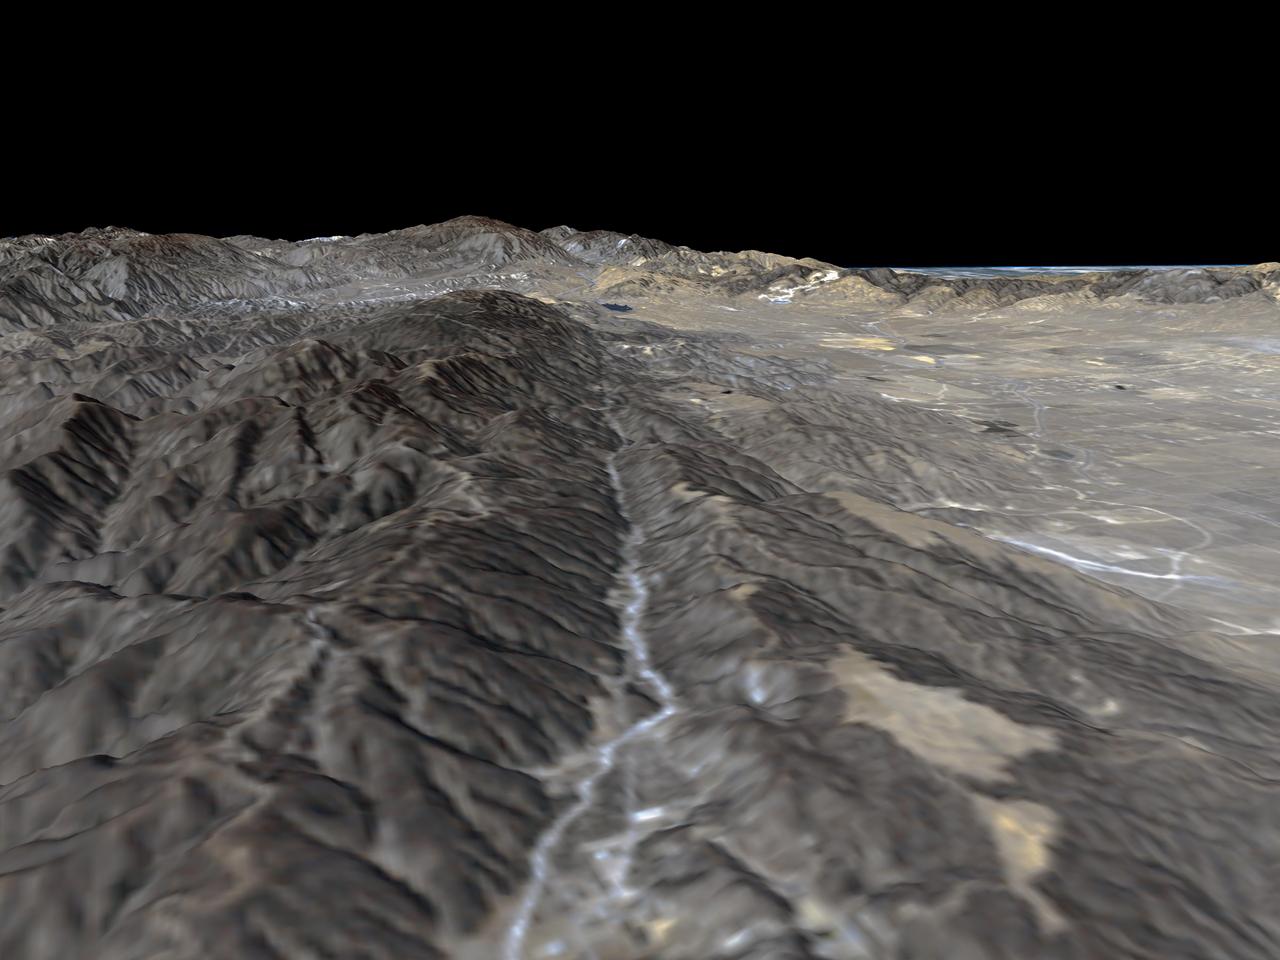
The prominent linear feature straight down the center of this perspective view is California famous San Andreas Fault. The image was created with data from NASA Shuttle Radar Topography Mission SRTM.
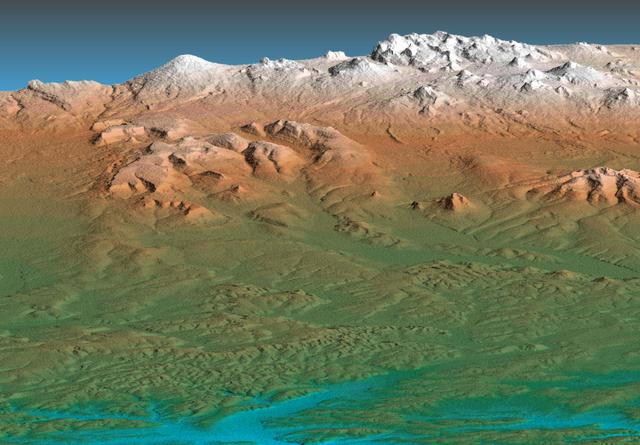
This perspective view acquired by NASA Shuttle Radar Topography Mission SRTM from data collected on February 12, 2000 shows the western side of the volcanically active Kamchatka Peninsula, Russia.

This radar image, called a coseismic interferogram, using satellite data from the European Space Agency Envisat depicts ground displacements resulting from the March 11, 2011, magnitude 9.0 Tohoku earthquake in Japan.
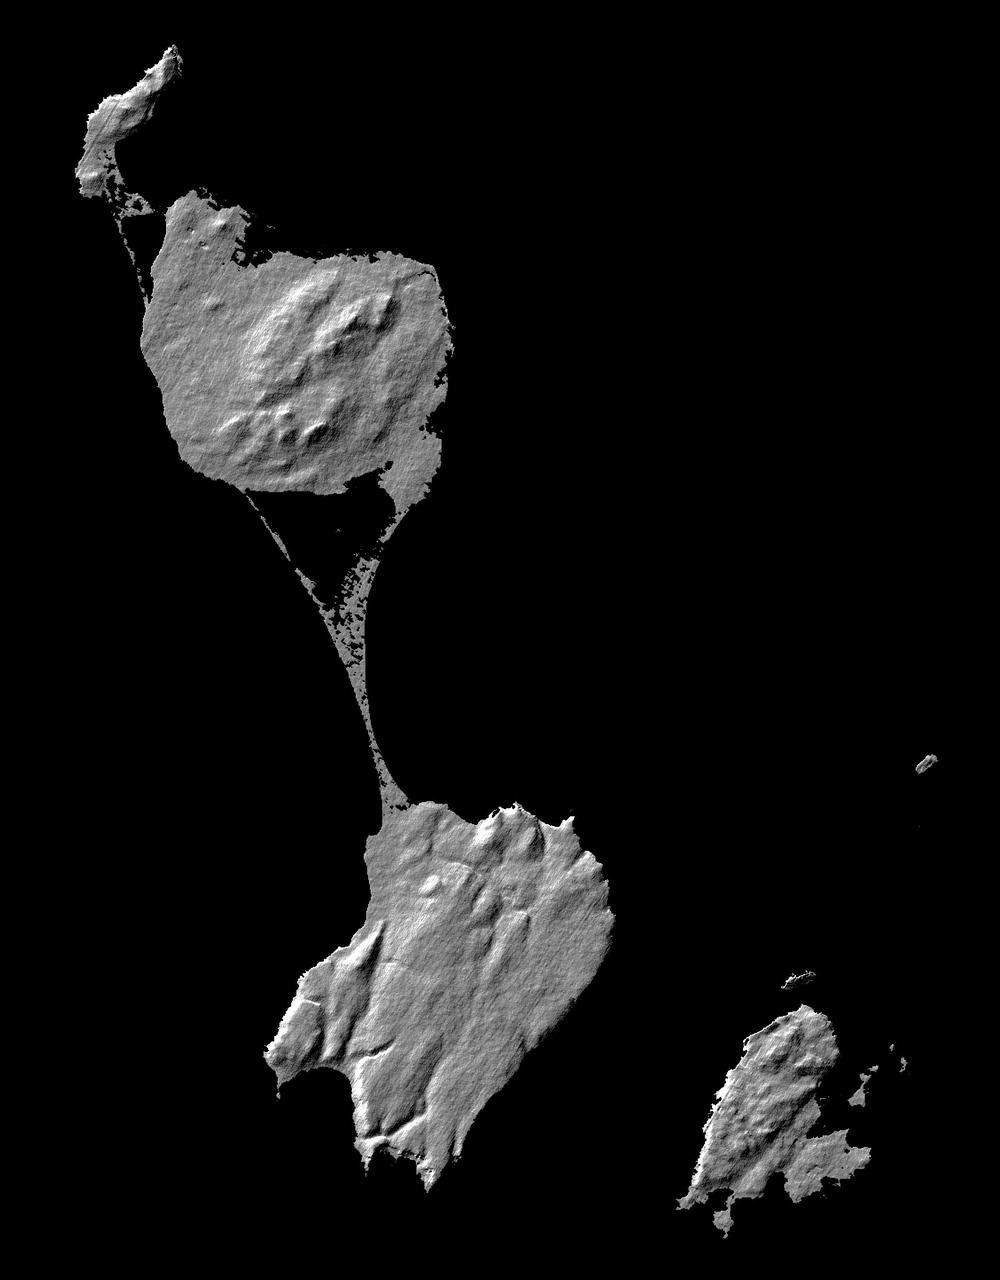
This image acquired by NASA Shuttle Radar Topography Mission SRTM from data collected on February 12, 2000 shows two islands, Miquelon and Saint Pierre, located south of Newfoundland, Canada.
The prominent linear feature straight down the center of this perspective view is the San Andreas Fault in an image created with data from NASA shuttle Radar Topography Mission SRTM.
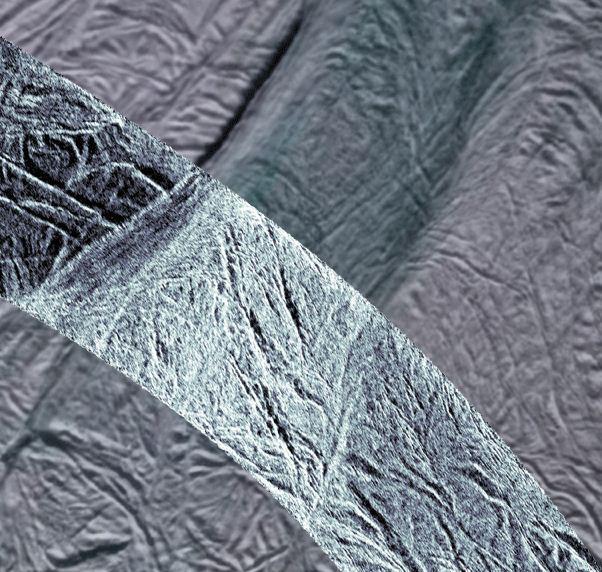
This image shows rough ice in the southern part of Saturn moon Enceladus. It was created using synthetic-aperture radar SAR data acquired by NASA Cassini spacecraft on Nov. 6, 2011.
This perspective view acquired by NASA Shuttle Radar Topography Mission SRTM from data collected on February 16, 2000 shows an area of Ventura County, California, including Simi Valley in the center of the image.
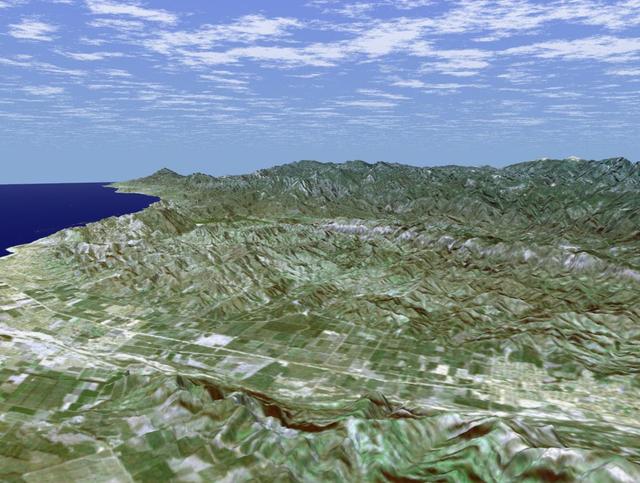
Santa Barbara, California, is often called America Riviera as seen in this image generated from NASA Shuttle Radar Topography Mission SRTM data on February 16, 2000.
Japan Mt. Fuji presents a beautiful backdrop for the city of Tokyo as seen in this image generated from NASA Shuttle Radar Topography Mission SRTM data on February 21, 2000.
California Garlock Fault, marking the northwestern boundary of the Mojave Desert, lies at the foot of the mountains, running from the lower right to the top center of this image, which was created with data from NASA shuttle Radar Topography Mission.
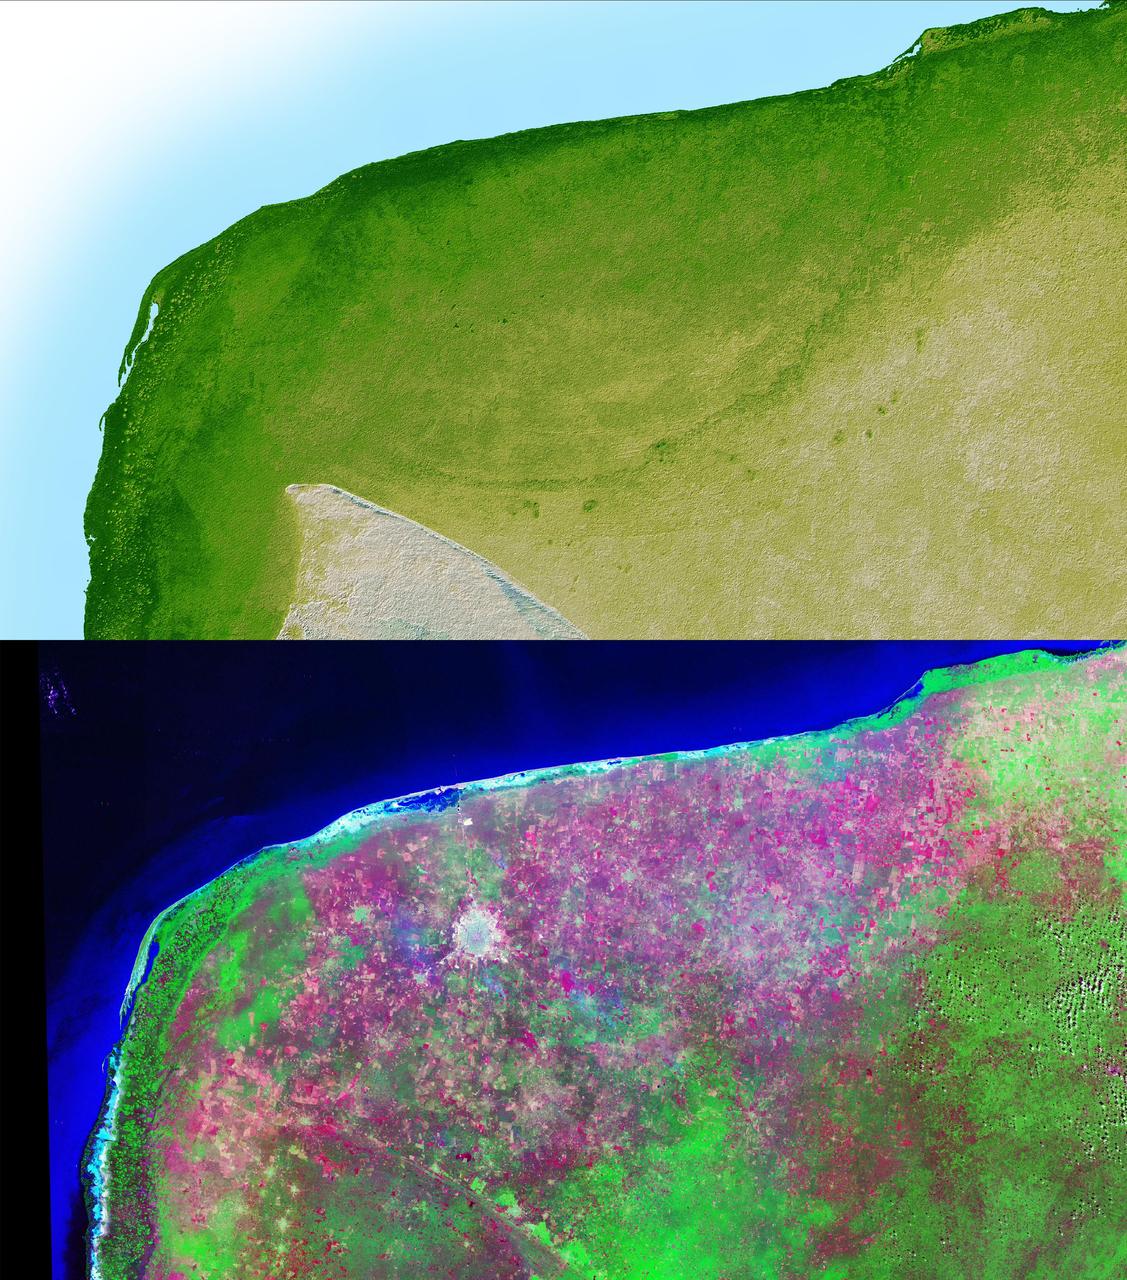
The top picture is a shaded relief image of the northwest corner of Mexico Yucatan Peninsula generated from NASA Shuttle Radar Topography Mission SRTM data, and shows a subtle, but unmistakable, indication of the Chicxulub impact crater.
This topographic image acquired by NASA Shuttle Radar Topography Mission SRTM from data collected on February 15, 2000, of Patagonia, Argentina shows a spectacular landscape formed by volcanoes, rivers, and wind.

The topography surrounding the Laguna Salada Fault in the Mexican state of Baja, California, is shown in this perspective view with data from NASA Shuttle Radar Topography Mission where a 7.2 earthquake struck on April 4, 2010.
This shaded relief topographic acquired by NASA Shuttle Radar Topography Mission SRTM image from data collected on February 12, 2000 shows the western side of the volcanically active Kamchatka Peninsula, Russia.
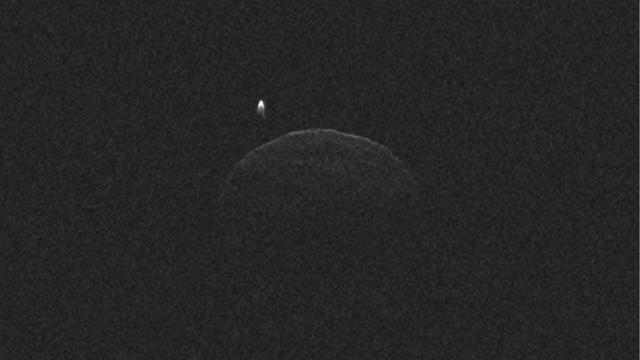
This radar imagery of asteroid 1998 QE2 and its moon was generated from data collected by NASA 230-foot-wide 70-meter Deep Space Network antenna at Goldstone, Calif., on June 1, 2013.
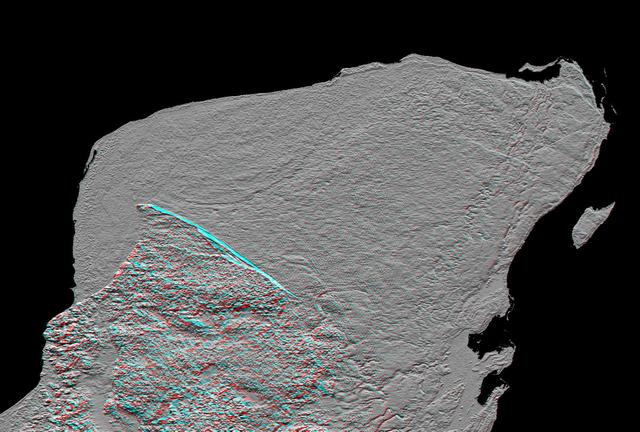
This anaglyph of Mexico Yucatan Peninsula was generated from NASA Shuttle Radar Topography Mission data, and shows a subtle but distinctive indication of the Chicxulub impact crater. 3D glasses are necessary to view this image.
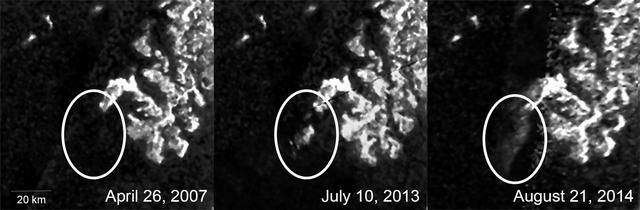
These three images, created from NASA Cassini Synthetic Aperture Radar SAR data, show the appearance and evolution of a mysterious feature in Ligeia Mare, one of the largest hydrocarbon seas on Saturn moon Titan.
This topographic map acquired by NASA Shuttle Radar Topography Mission SRTM from data collected on February 16, 2000 vividly displays California famous San Andreas Fault along the southwestern edge of the Mojave Desert, Calif.
Tokyo, located on the island of Honshu, with Mt. Fuji in the background as seen in this image generated from NASA Shuttle Radar Topography Mission SRTM data on February 21, 2000.
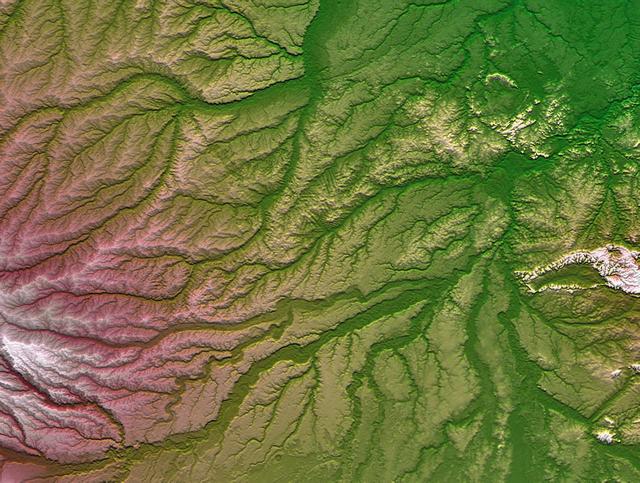
Pando Province, Bolivia, and adjacent parts of Brazil and Peru are seen in this visualization of NASA Shuttle Radar Topography Mission SRTM elevation data covering part of the Amazon Basin.
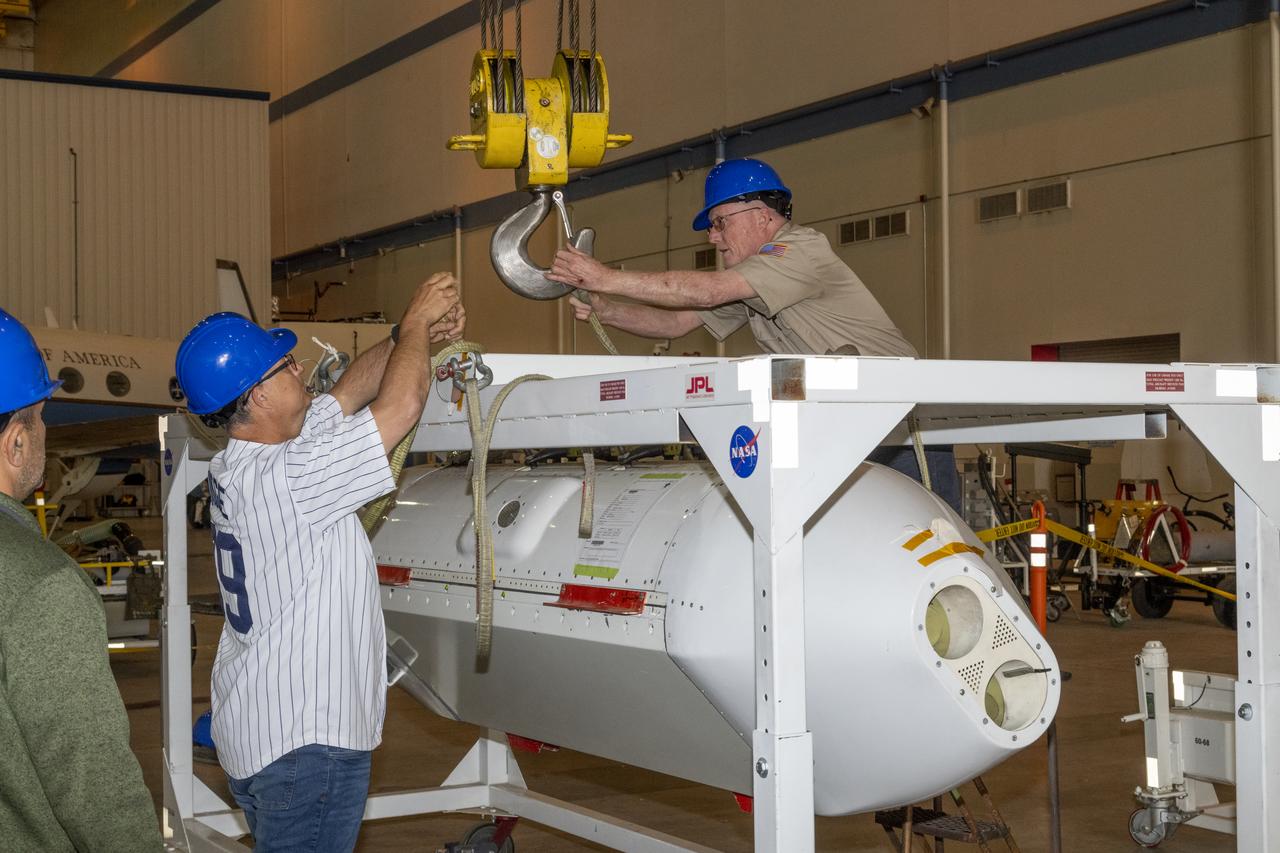
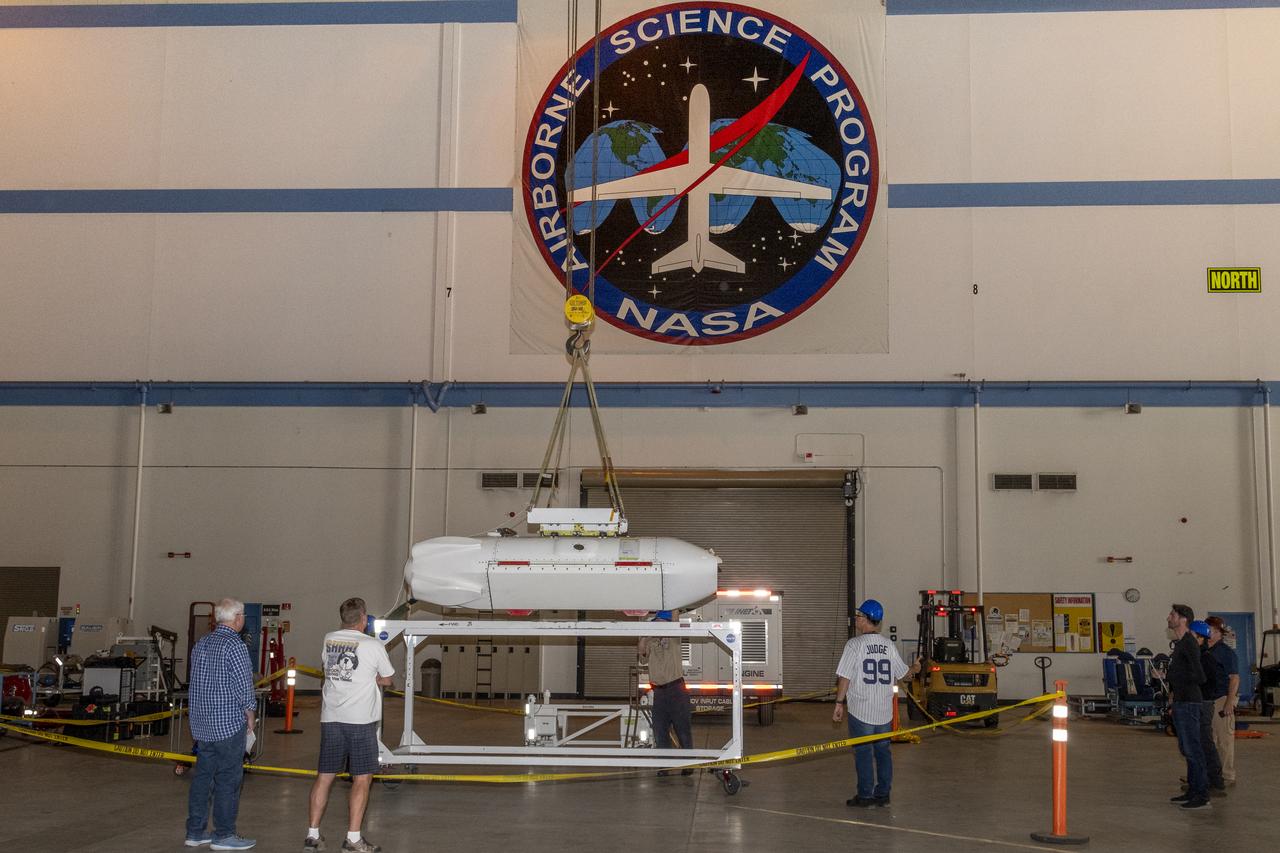
The Uninhabited Aerial Vehicle Synthetic Aperture Radar, UAVSAR, is prepared for installation onto NASA’s C-20A aircraft. THE UAVSAR uses a technique called interferometry to detect and measure very subtle deformations in the Earth’s surface, and the pod is specially designed to be interoperable with unmanned aircraft in the future. It will gather data from Gabon, Africa in September of 2023.

The Uninhabited Aerial Vehicle Synthetic Aperture Radar, UAVSAR, is prepared for installation onto NASA’s C-20A aircraft. THE UAVSAR uses a technique called interferometry to detect and measure very subtle deformations in the Earth’s surface, and the pod is specially designed to be interoperable with unmanned aircraft in the future. It will gather data from Gabon, Africa in September of 2023.
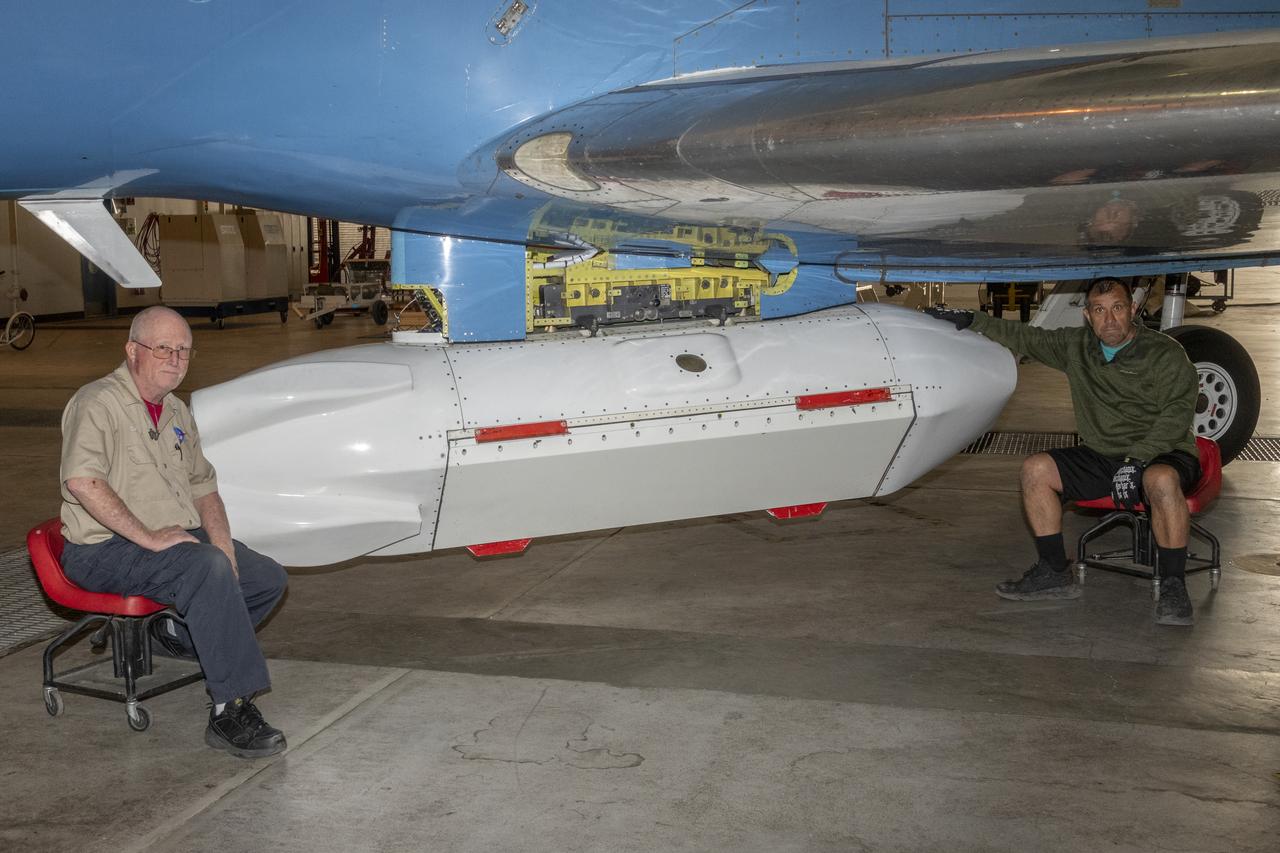
The Uninhabited Aerial Vehicle Synthetic Aperture Radar, UAVSAR, is prepared for installation onto NASA’s C-20A aircraft. THE UAVSAR uses a technique called interferometry to detect and measure very subtle deformations in the Earth’s surface, and the pod is specially designed to be interoperable with unmanned aircraft in the future. It will gather data from Gabon, Africa in September of 2023.

The Uninhabited Aerial Vehicle Synthetic Aperture Radar, UAVSAR, is prepared for installation onto NASA’s C-20A aircraft. THE UAVSAR uses a technique called interferometry to detect and measure very subtle deformations in the Earth’s surface, and the pod is specially designed to be interoperable with unmanned aircraft in the future. It will gather data from Gabon, Africa in September of 2023.
The Uninhabited Aerial Vehicle Synthetic Aperture Radar, UAVSAR, is prepared for installation onto NASA’s C-20A aircraft. THE UAVSAR uses a technique called interferometry to detect and measure very subtle deformations in the Earth’s surface, and the pod is specially designed to be interoperable with unmanned aircraft in the future. It will gather data from Gabon, Africa in September of 2023.
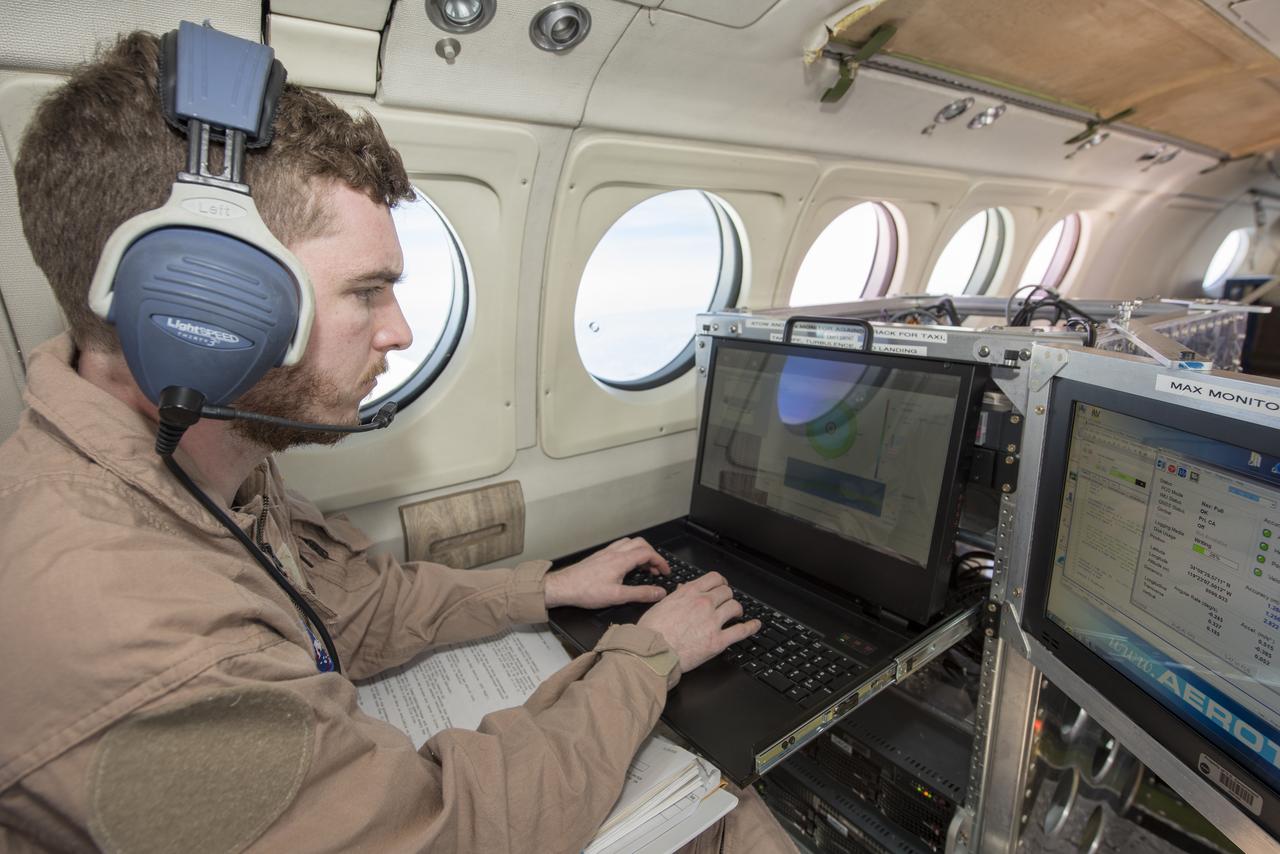
Radar operator Alexander Winteer monitors incoming wind data from the DopplerScatt radar instrument during a science flight off the California Coast on March 5, 2018.
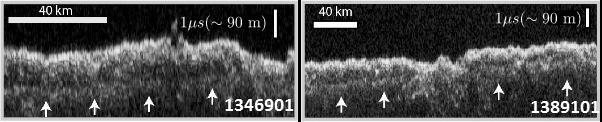
These two images show data acquired by the Shallow Radar (SHARAD) instrument while passing over two ground tracks in a part of Mars' Utopia Planitia region where the orbiting, ground-penetrating radar detected subsurface deposits rich in water ice. The instrument on NASA's Mars Reconnaissance Orbiter emits radio waves and times their echo off of radio-reflective surfaces and interfaces on Mars. The white arrows indicate a subsurface reflector interpreted as the bottom of the ice-rich deposit. The deposit is about as large in area as the state of New Mexico and contains about as much water as Lake Superior. The horizontal scale bar indicates 40 kilometers (25 miles) along the ground track of the radar, as flown by the orbiter overhead. The vertical scale bar indicates a return time of one microsecond for the reflected radio signal, equivalent to a distance of about 90 meters (295 feet). http://photojournal.jpl.nasa.gov/catalog/PIA21137
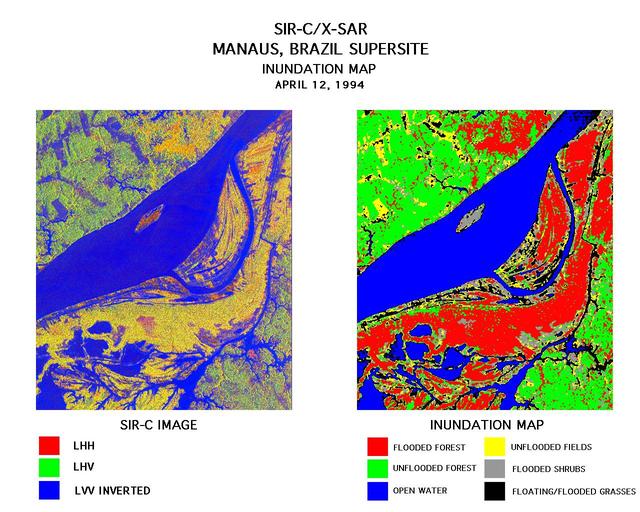
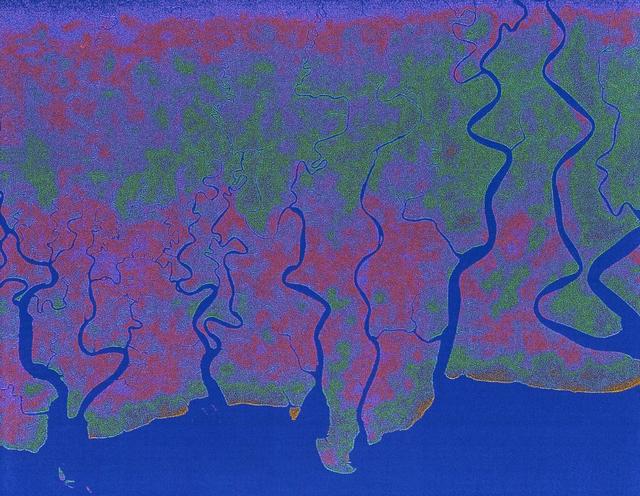
These two images were created using data from the Spaceborne Imaging Radar-C/X-Band Synthetic Aperture Radar (SIR-C/X-SAR). On the left is a false-color image of Manaus, Brazil acquired April 12, 1994, onboard space shuttle Endeavour. In the center of this image is the Solimoes River just west of Manaus before it combines with the Rio Negro to form the Amazon River. The scene is around 8 by 8 kilometers (5 by 5 miles) with north toward the top. The radar image was produced in L-band where red areas correspond to high backscatter at HH polarization, while green areas exhibit high backscatter at HV polarization. Blue areas show low backscatter at VV polarization. The image on the right is a classification map showing the extent of flooding beneath the forest canopy. The classification map was developed by SIR-C/X-SAR science team members at the University of California,Santa Barbara. The map uses the L-HH, L-HV, and L-VV images to classify the radar image into six categories: Red flooded forest Green unflooded tropical rain forest Blue open water, Amazon river Yellow unflooded fields, some floating grasses Gray flooded shrubs Black floating and flooded grasses Data like these help scientists evaluate flood damage on a global scale. Floods are highly episodic and much of the area inundated is often tree-covered. http://photojournal.jpl.nasa.gov/catalog/PIA01712
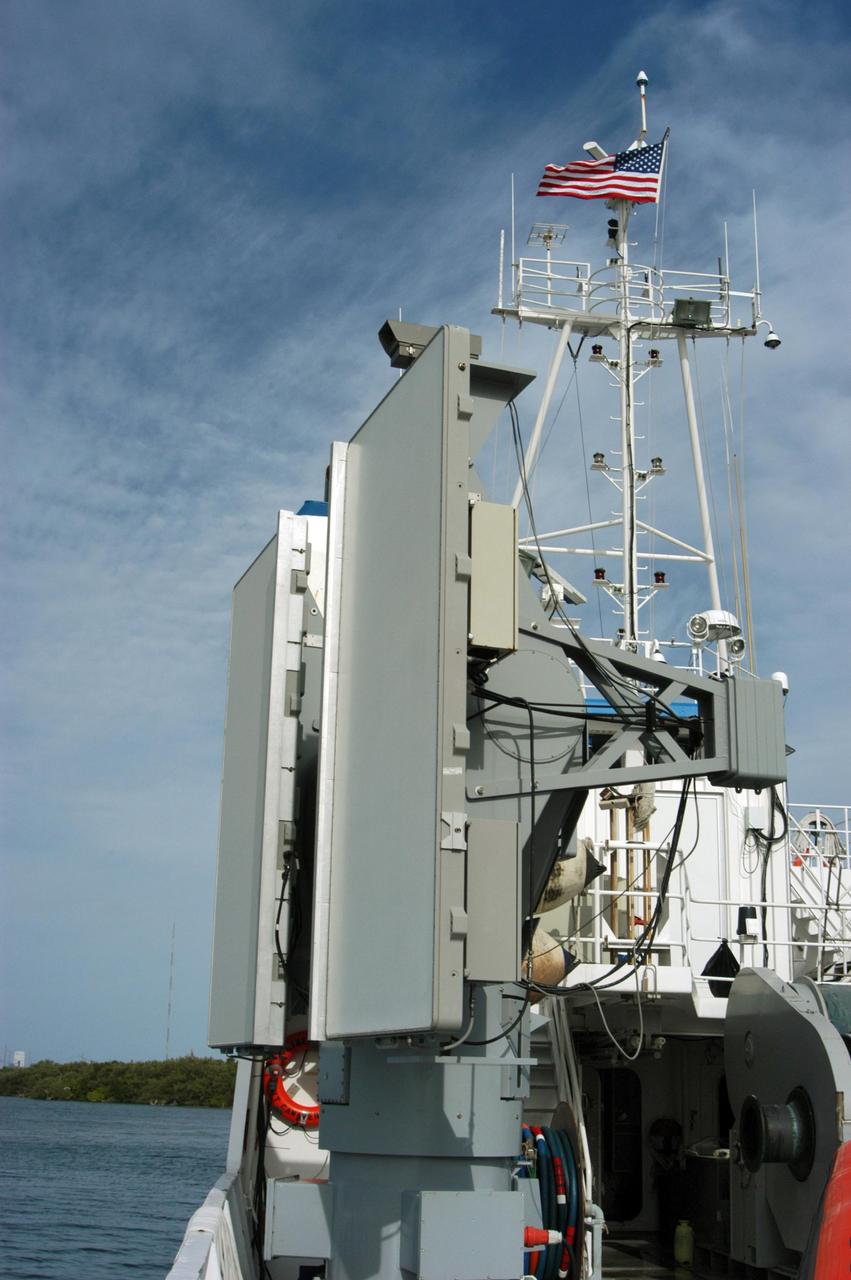
KENNEDY SPACE CENTER, FLA. -- The X-band radar array is installed on the solid rocket booster retrieval ship Liberty before launch of Space Shuttle Discovery. It is one of two Weibel Continuous Pulse Doppler X-band radars located on each of the two SRB retrieval ships. This one will be located downrange of the launch site. Working with the land-based C-band radar, the X-band radars provide velocity and differential shuttle/debris motion information during launch. The radar data will be sent from the ships via satellite link and analyzed at the C-band radar site located on north Kennedy Space Center. Photo credit: NASA/George Shelton
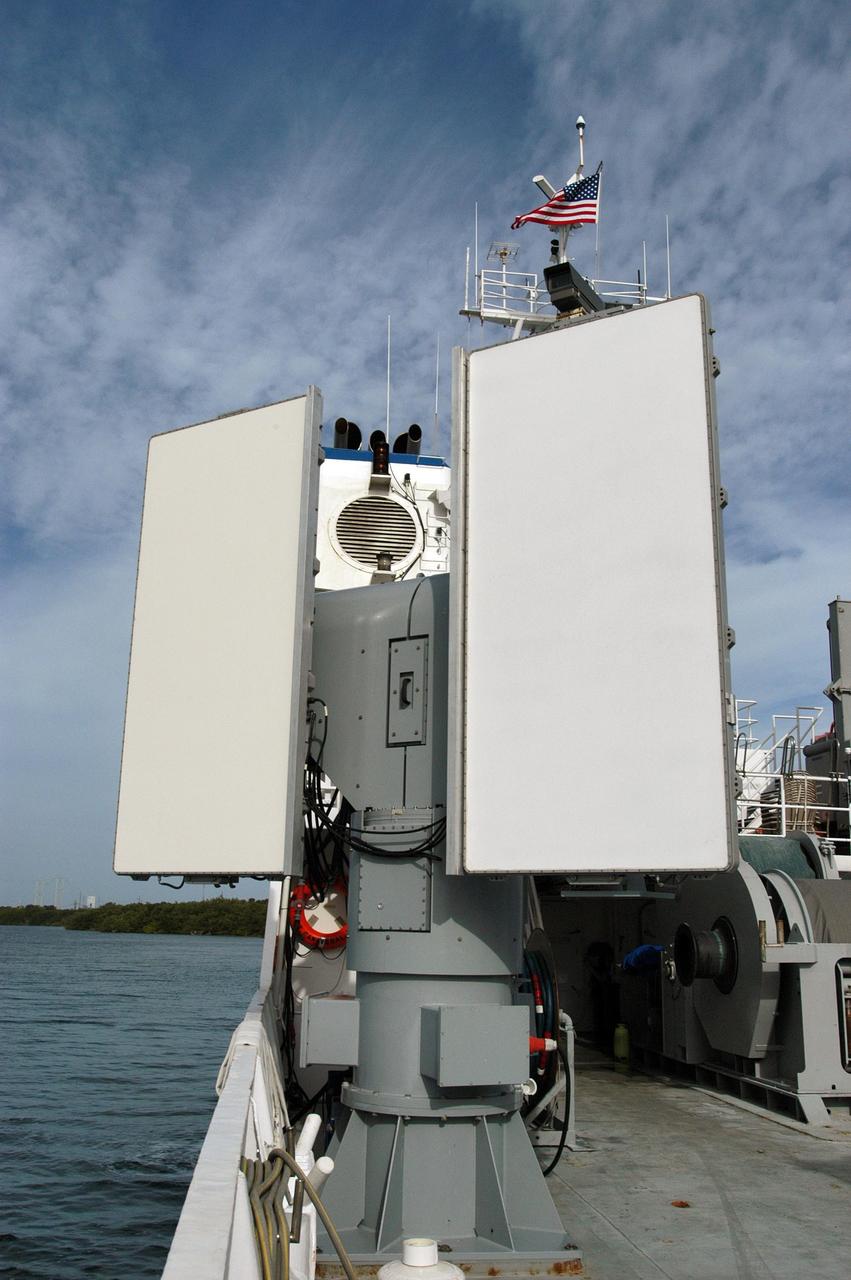
KENNEDY SPACE CENTER, FLA. -- The X-band radar array is installed on the solid rocket booster retrieval ship Liberty before launch of Space Shuttle Discovery. It is one of two Weibel Continuous Pulse Doppler X-band radars located on each of the two SRB retrieval ships. This one will be located downrange of the launch site. Working with the land-based C-band radar, the X-band radars provide velocity and differential shuttle/debris motion information during launch. The radar data will be sent from the ships via satellite link and analyzed at the C-band radar site located on north Kennedy Space Center. Photo credit: NASA/George Shelton
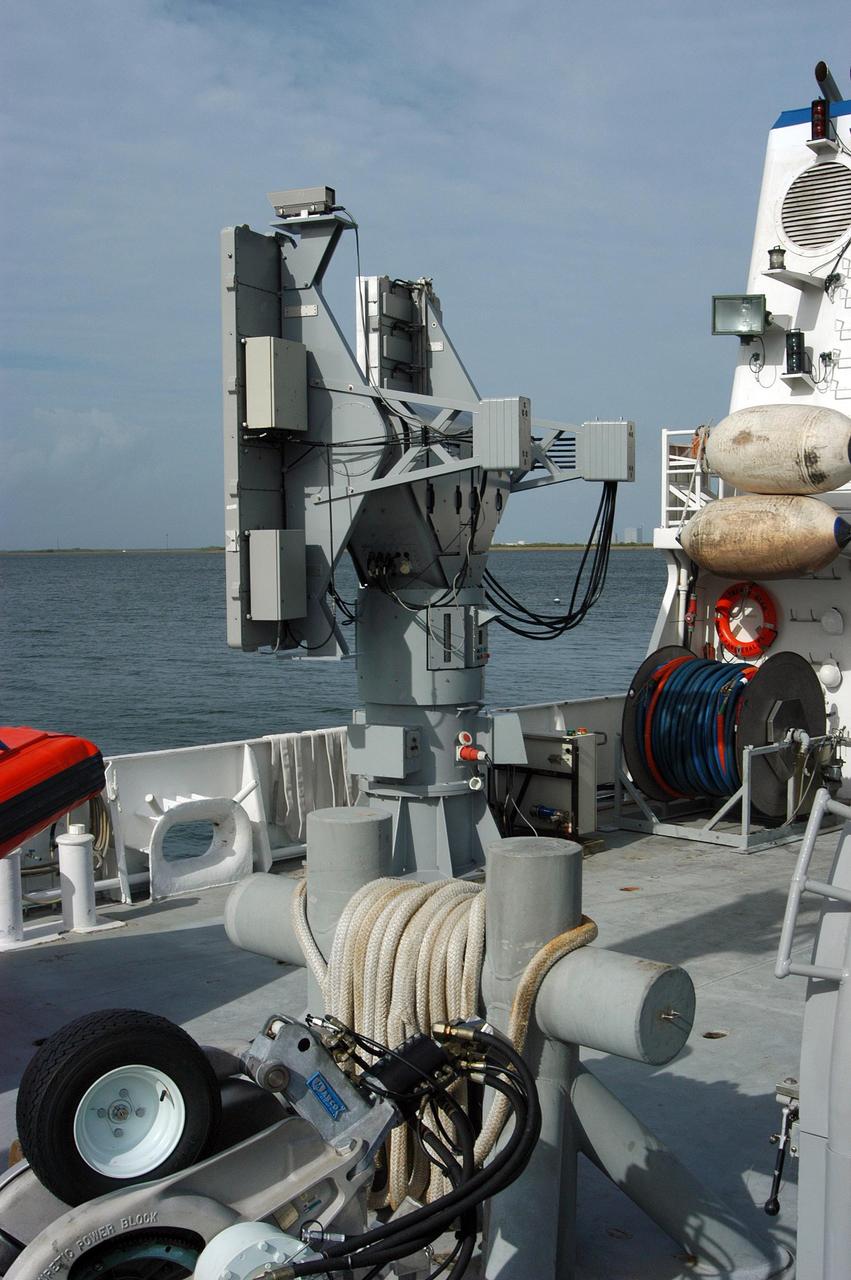
KENNEDY SPACE CENTER, FLA. -- The X-band radar array is installed on the solid rocket booster retrieval ship Liberty before launch of Space Shuttle Discovery. It is one of two Weibel Continuous Pulse Doppler X-band radars located on each of the two SRB retrieval ships. This one will be located downrange of the launch site. Working with the land-based C-band radar, the X-band radars provide velocity and differential shuttle/debris motion information during launch. The radar data will be sent from the ships via satellite link and analyzed at the C-band radar site located on north Kennedy Space Center. Photo credit: NASA/George Shelton
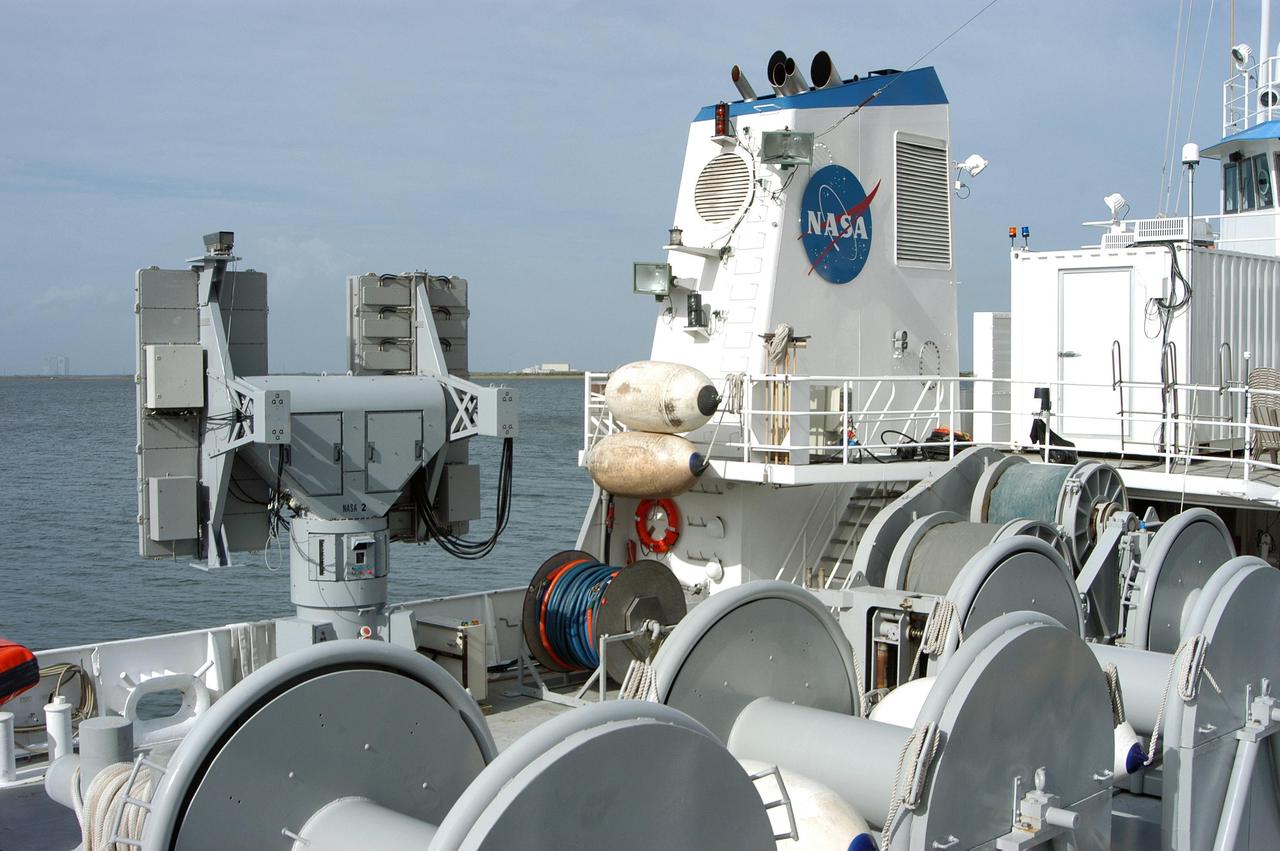
KENNEDY SPACE CENTER, FLA. -- The X-band radar array is being installed on the solid rocket booster retrieval ship Liberty before launch of Space Shuttle Discovery. It is one of two Weibel Continuous Pulse Doppler X-band radars located on each of the two SRB retrieval ships. This one will be located downrange of the launch site. Working with the land-based C-band radar, the X-band radars provide velocity and differential shuttle/debris mo¬tion information during launch. The radar data will be sent from the ships via satellite link and analyzed at the C-band radar site located on north Kennedy Space Center. Photo credit: NASA/George Shelton

KENNEDY SPACE CENTER, FLA. -- The X-band radar array is installed on the solid rocket booster retrieval ship Liberty before launch of Space Shuttle Discovery. It is one of two Weibel Continuous Pulse Doppler X-band radars located on each of the two SRB retrieval ships. This one will be located downrange of the launch site. Working with the land-based C-band radar, the X-band radars provide velocity and differential shuttle/debris motion information during launch. The radar data will be sent from the ships via satellite link and analyzed at the C-band radar site located on north Kennedy Space Center. Photo credit: NASA/George Shelton

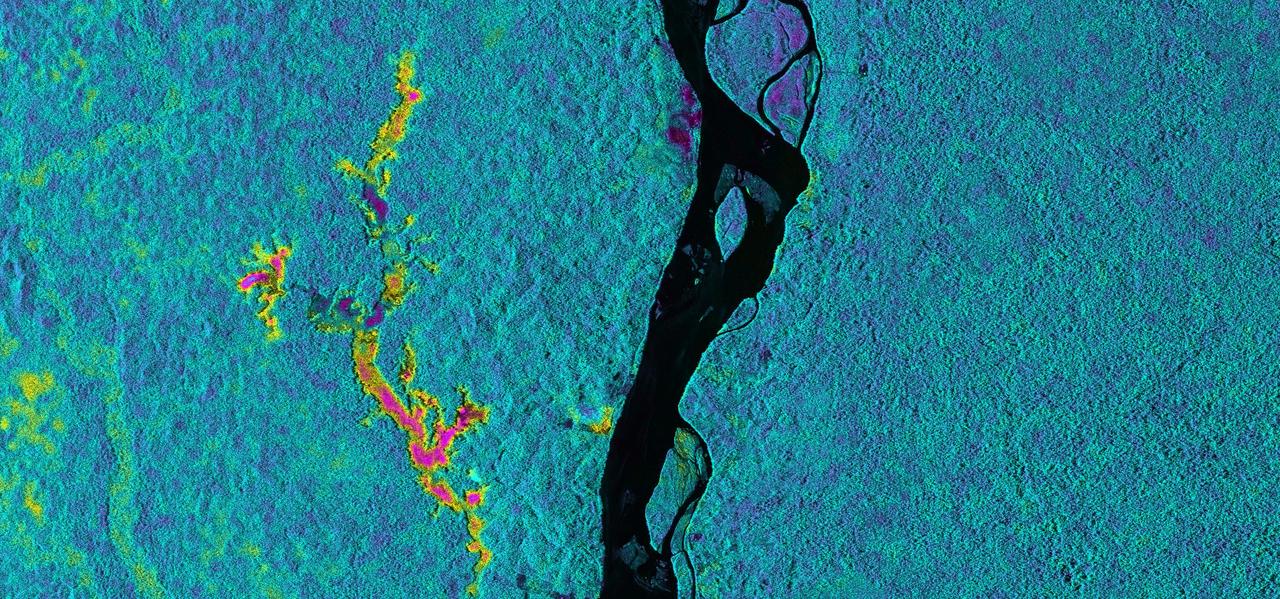
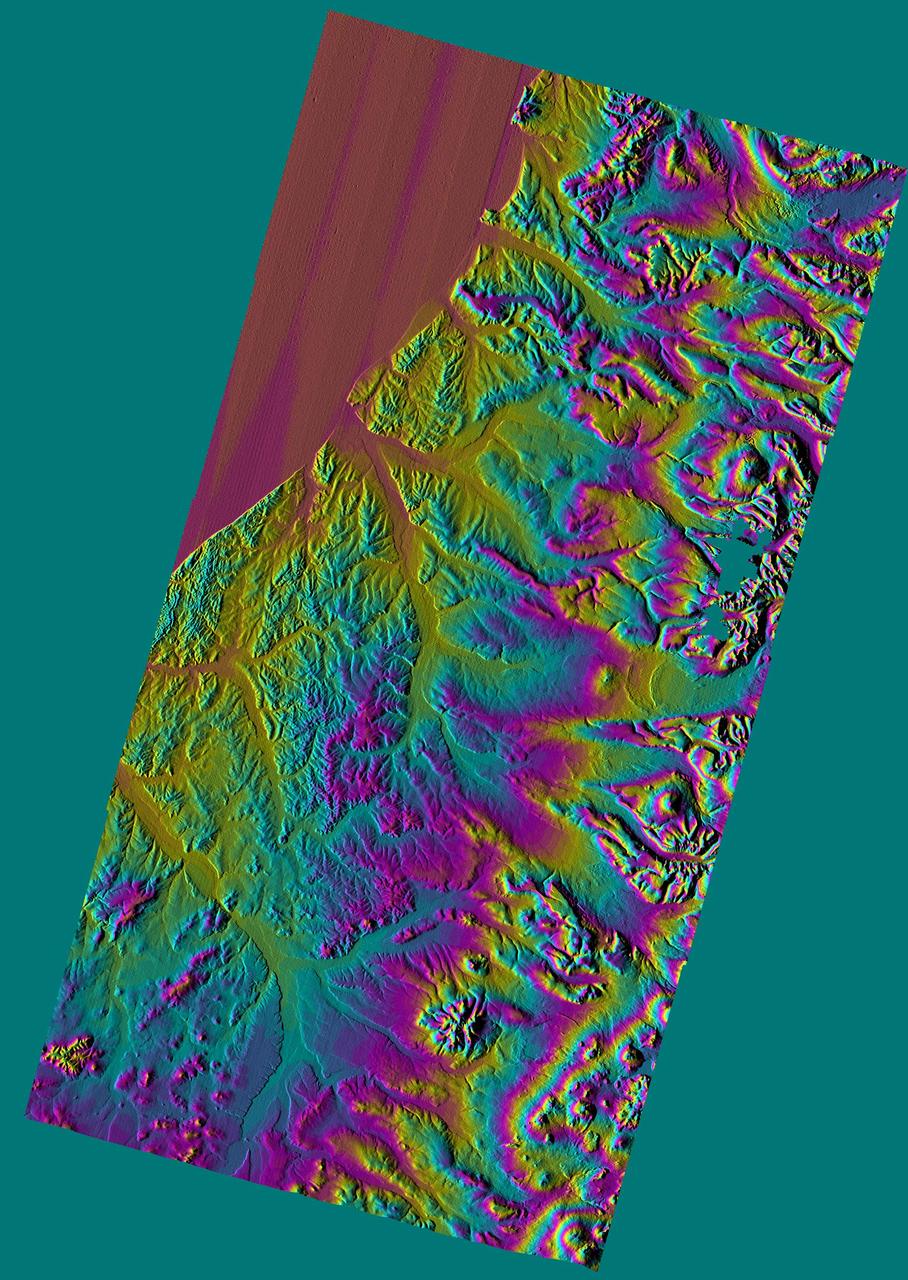
An oil slick in the Gulf of Mexico following Hurricane Ida – a high-end Category 4 when it made landfall near Port Fourchon, Louisiana, on Aug. 29, 2021 – appears as a green trail in the inset false-color graphic provided by NASA's Delta-X project, while the surrounding seawater appears orange. The National Oceanic and Atmospheric Administration (NOAA) regularly monitors U.S. coastal waters for potential spills and noticed slicks that appeared just off the coast after the hurricane. They were able to use this information from Delta-X to corroborate other data they had about oil slicks in the area (satellite image in the second inset picture). The blue-green swath crossing from the Gulf of Mexico over the Louisiana coast denotes the flight path of the Delta-X radar instrument on Sept. 1, just before 11:30 a.m. CDT. Charged with studying the Mississippi River Delta, Delta-X was gearing up to collect data on Louisiana's coastal wetlands when Hurricane Ida barreled ashore in late August. The storm damaged buildings and infrastructure alike, resulting in power outages, flooding, and oil slicks in the Gulf of Mexico. Oil tends to smooth out the bumps on the ocean's surface, which results in a distinct radar signal that the Delta-X mission was able to pick out of their data. Delta-X added flight paths to their planned schedule – with the support of NASA's Applied Science Disaster Program – in order to collect information over the gulf in areas of interest to NOAA. Delta-X is studying two wetlands – the Atchafalaya and Terrebonne Basins – by land, boat, and air to quantify water and sediment flow as well as vegetation growth. While the Atchafalaya Basin has been gaining land through sediment accumulation, Terrebonne Basin, which is right next to the Atchafalaya, has been rapidly losing land. The data collected by the project will be applied to models used to forecast which areas of the delta are likely to gain or lose land under various sea level rise, river flow, and watershed management scenarios. The mission uses several instruments to collect its data. Affixed to the bottom of a Gulfstream-III airplane, one of those instruments, the all-weather Uninhabited Aerial Vehicle Synthetic Aperture Radar (UAVSAR), bounces radar signals off of Earth's surface, forming a kind of image of a particular area. Repeated images of the same regions, captured at different times, enable researchers to detect changes in those areas, such as fluctuating water levels beneath the vegetation as the tides move in and out of these wetlands. In addition to radar measurements, teams from Caltech, Louisiana State University, Florida International University, and other collaborating institutions gather water and vegetation samples – among other data – by boat, other airborne sensors, and from instruments on the ground. Funded by NASA's Earth Venture Suborbital (EVS-3) program, Delta-X is managed by the agency's Jet Propulsion Laboratory. Caltech in Pasadena, California, manages JPL for NASA. Fall 2021 was Delta-X's last scheduled field campaign, although the five-year mission will run through the end of 2023. https://photojournal.jpl.nasa.gov/catalog/PIA24540

These images of the world were generated with data from the Shuttle Radar Topography Mission (SRTM). The SRTM Project has recently released a new global data set called SRTM30, where the original one arcsecond of latitude and longitude resolution (about 30 meters, or 98 feet, at the equator) was reduced to 30 arcseconds (about 928 meters, or 1496 feet.) These images were created from that data set and show the Earth as it would be viewed from a point in space centered over the Americas, Africa and the western Pacific. Two visualization methods were combined to produce the image: shading and color coding of topographic height. The shade image was derived by computing topographic slope in the northwest-southeast direction, so that northwest slopes appear bright and southeast slopes appear dark. Color coding is directly related to topographic height, with green at the lower elevations, rising through yellow and tan, to white at the highest elevations. Elevation data used in this image were acquired by the Shuttle Radar Topography Mission aboard the Space Shuttle Endeavour, launched on Feb. 11, 2000. http://photojournal.jpl.nasa.gov/catalog/PIA03394
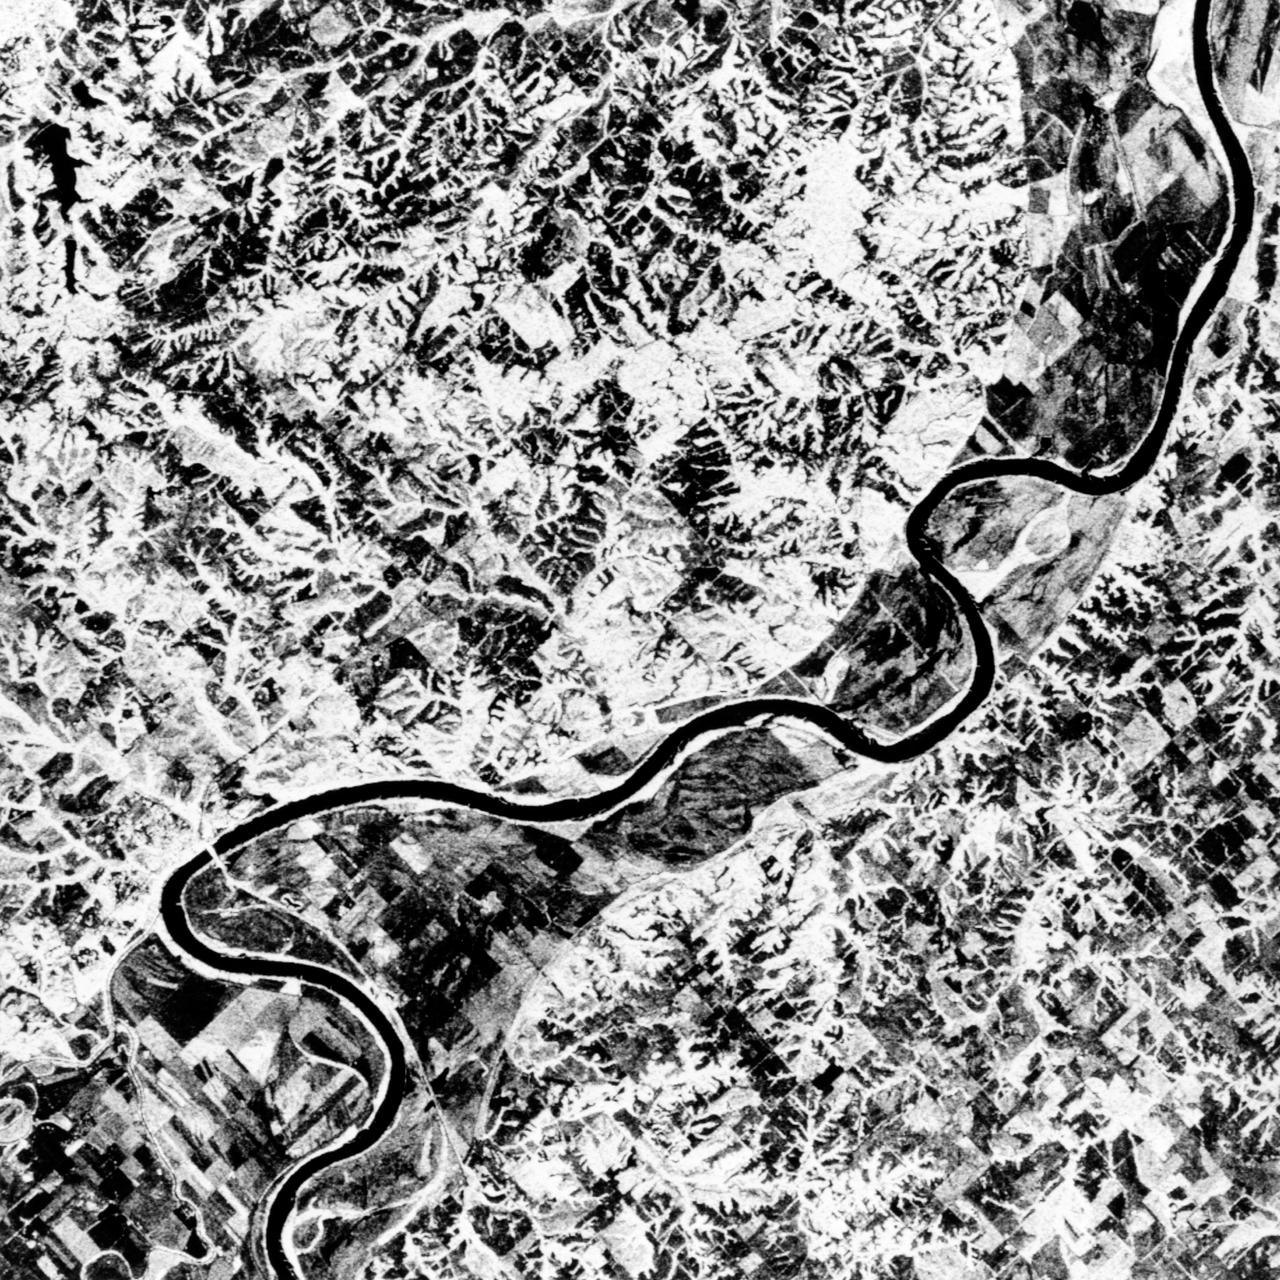
STS068-S-055 (7 October 1994) --- This is a false-color L-Band image of an area near Glasgow, Missouri, centered at about 39.2 degrees north latitude and 92.8 degrees west longitude. The image was acquired using the L-Band radar channel (horizontally transmitted and received and horizontally transmitted and vertically received) polarization's combined. The data were acquired by the Spaceborne Imaging Radar-C/X-Band Synthetic Aperture Radar (SIR-C/X-SAR) aboard the Space Shuttle Endeavour on orbit 50 on October 3, 1994. The area shown is approximately 37 by 25 kilometers (23 by 16 miles). The radar data, coupled with pre-flood aerial photography and satellite data and post-flood topographic and field data, are being used to evaluate changes associated with levee breaks in land forms, where deposits formed during the widespread flooding in 1993 along the Missouri and Mississippi Rivers. The distinct radar scattering properties of farmland, sand fields and scoured areas will be used to inventory flood plains along the Missouri River and determine the processes by which these areas return to preflood conditions. The image shows one such levee break near Glasgow, Missouri. In the upper center of the radar image, below the bend of the river, is a region covered by several meters of sand, shown as dark regions. West (left) of the dark areas, a gap in the levee tree canopy shows the area where the levee failed. Radar data such as these can help scientists more accurately assess the potential for future flooding in this region and how that might impact surrounding communities. Spaceborne Imaging Radar-C/X-Band Synthetic Aperture Radar (SIR-C/X-SAR) is part of NASA's Mission to Planet Earth. The radars illuminate Earth with microwaves, allowing detailed observations at any time, regardless of weather or sunlight conditions. SIR-C/X-SAR uses the three microwave wavelengths: the L-Band (24 centimeters), C-Band (6 centimeters) and X-Band (3 centimeters). The multi-frequency data will be used by the international scientific community to better understand the global environment and how it is changing. The SIR-C/X-SAR data, complemented by aircraft and ground studies, will give scientists clearer insights into those environmental changes which are caused by nature and those changes which are induced by human activity. SIR-C was developed by NASA's Jet Propulsion Laboratory (JPL). X-SAR was developed by the Dornier and Alenia Spazio companies for the German space agency, Deutsche Agentur fuer Raumfahrtangelegenheiten (DARA), and the Italian space agency, Agenzia Spaziale Italiana (ASI), with the Deutsche Forschungsanstalt fuer Luft und Raumfahrt e.v. (DLR), the major partner in science, operations and data processing of X-SAR. (P-44734)
This X-band image of the volcano Kilauea was taken on October 4, 1994, by the Spaceborne Imaging Radar-C/X-band Synthetic Aperture Radar. The area shown is about 9 kilometers by 13 kilometers (5.5 miles by 8 miles) and is centered at about 19.58 degrees north latitude and 155.55 degrees west longitude. This image and a similar image taken during the first flight of the radar instrument on April 13, 1994 were combined to produce the topographic information by means of an interferometric process. This is a process by which radar data acquired on different passes of the space shuttle is overlaid to obtain elevation information. Three additional images are provided showing an overlay of radar data with interferometric fringes; a three-dimensional image based on altitude lines; and, finally, a topographic view of the region. http://photojournal.jpl.nasa.gov/catalog/PIA01763
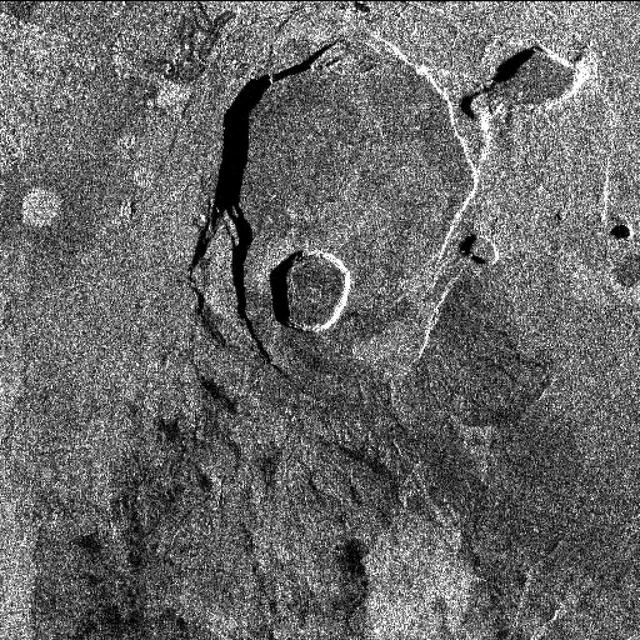
KENNEDY SPACE CENTER, FLA. - This radar image shows the presence of large birds around Launch Pad 39B. The data is being relayed from the avian radars recently set up on the pad. The computer is one of two set up in Firing Room 4 of the Launch Control Center. When birds, especially vultures, are near the shuttle during a launch, impact on a critical area is possible and could cause catastrophic damage to the vehicle. Already proven affective for aviation where threats posed by bird strikes have been a problem, the avian radar, known as Aircraft Birdstrike Avoidance Radar, provides horizontal and vertical scanning and can monitor either launch pad for movement of vultures around them. If data relayed from the avian radar indicates large birds are dangerously close to the vehicle, controllers could hold the countdown. Photo credit: NASA/George Shelton
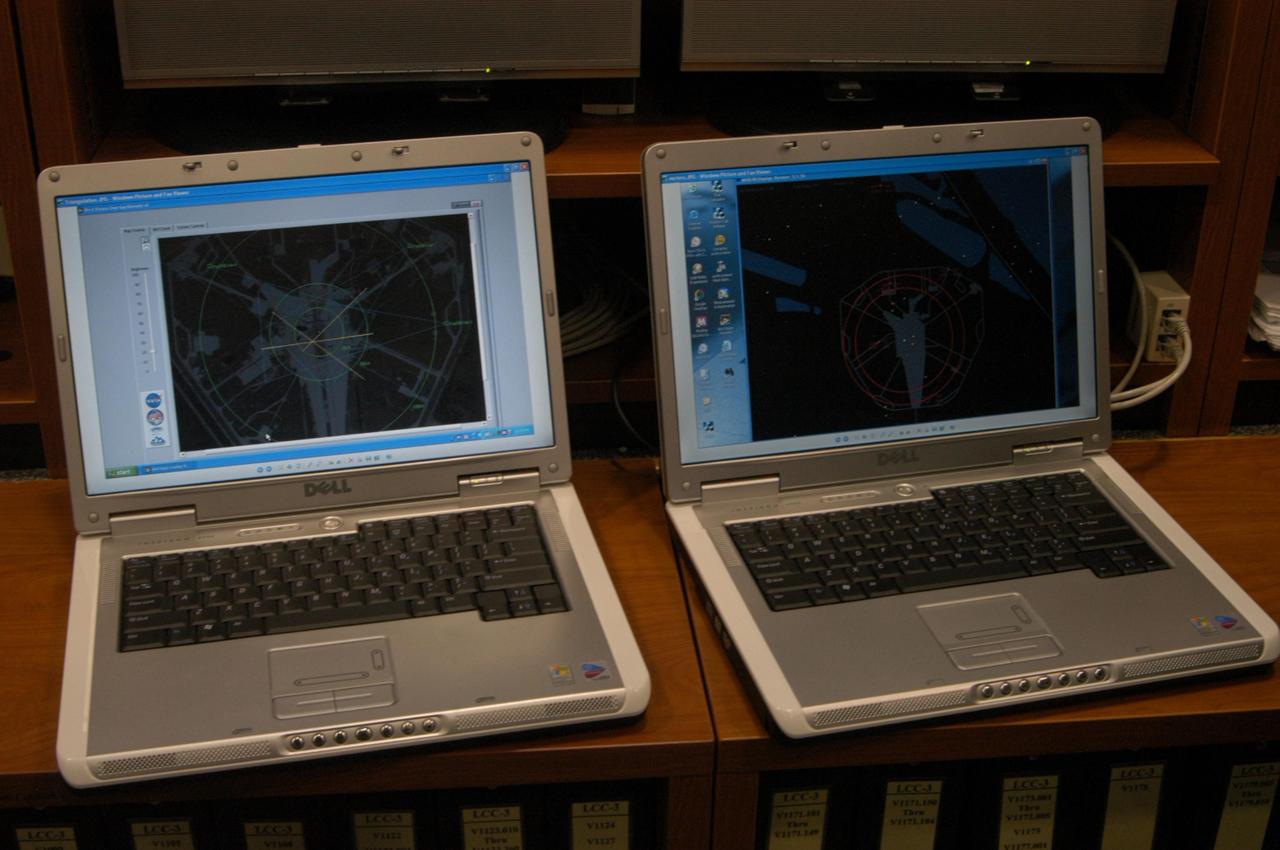
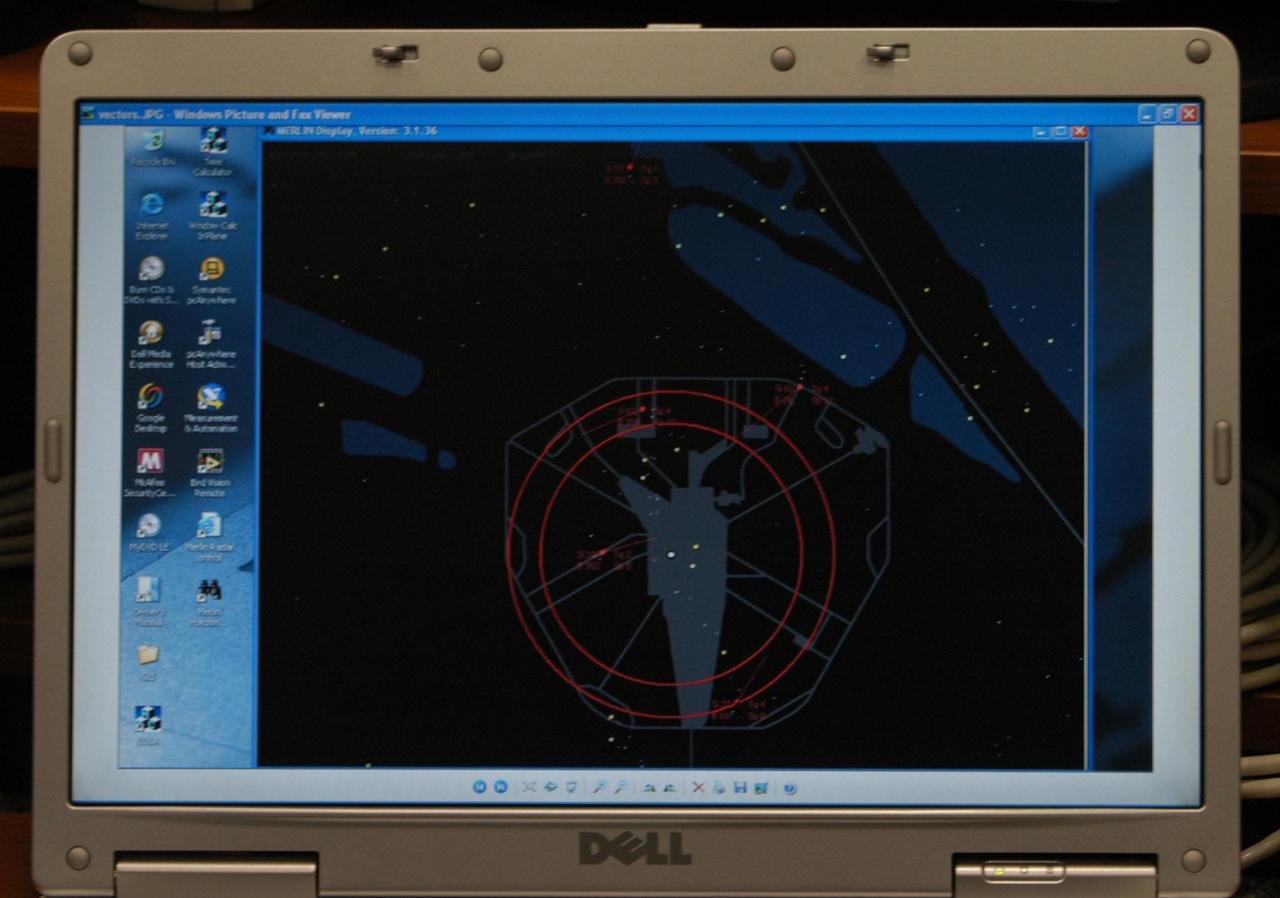
KENNEDY SPACE CENTER, FLA. - These laptop computers in Firing Room 4 of the Launch Control Center reveal data being relayed from the avian radars recently set up on Launch Pad 39B. On the left is an associated camera image. On the right is the radar image. When birds, especially vultures, are near the shuttle during a launch, impact on a critical area is possible and could cause catastrophic damage to the vehicle. Already proven affective for aviation where threats posed by bird strikes have been a problem, the avian radar, known as Aircraft Birdstrike Avoidance Radar, provides horizontal and vertical scanning and can monitor either launch pad for movement of vultures around them. If data relayed from the avian radar indicates large birds are dangerously close to the vehicle, controllers could hold the countdown. Photo credit: NASA/George Shelton
This perspective view acquired by NASA Shuttle Radar Topography Mission SRTM from data collected on February 18, 2000 shows three Hawaiian islands: Molokai lower left, Lanai right, and the northwest tip of Maui upper left.
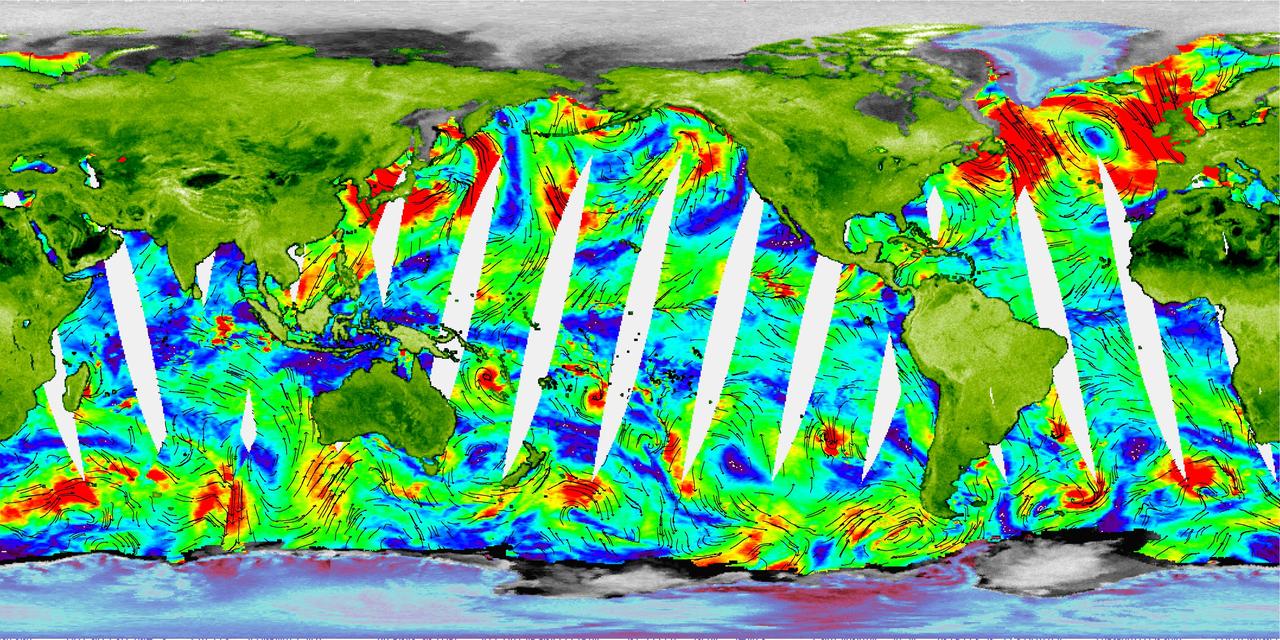
One of NASA newest Earth-observing instruments, the SeaWinds scatterometer aboard Japan Advanced Earth Observing Satellite Adeos 2--now renamed Midori 2--has successfully transmitted its first radar data to our home planet.
This image of the Venusian crater Golubkina, a 340 kilometer 20.4 miles diameter impact crater located at about 60.5 degrees north latitude, 287.2 degrees east longitude, contains NASA Magellan data mosaiced with a Soviet Venera radar image. http://photojournal.jpl.nasa.gov/catalog/PIA00210
This three-dimensional perspective view, looking up the Tigil River, acquired by NASA Shuttle Radar Topography Mission SRTM from data collected on February 16, 2000, shows the western side of the volcanically active Kamchatka Peninsula, Russia.
This perspective view shows the city of Bhuj, India, in the foreground gray area after an earthquake in western India on January 26, 2001. This image was generated from NASA Landsat satellite and data from Shuttle Radar Topography Mission SRTM.