Ancient Rift
The Great Rift
Tethys Great Rift
Rifting at Hiiaka Patera, Io?
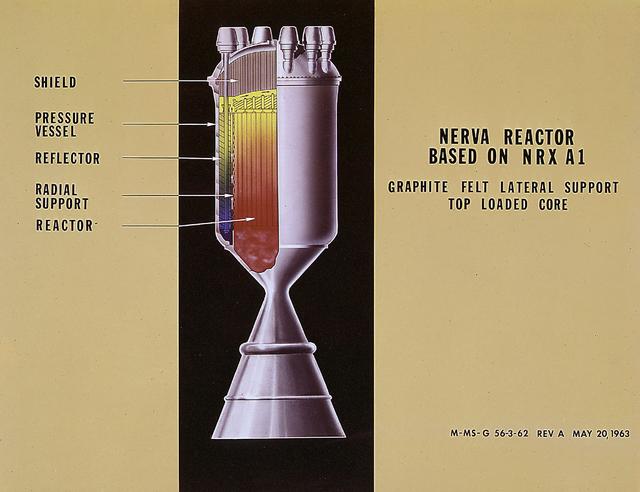
This artist's concept from 1963 shows a proposed NERVA (Nuclear Engine for Rocket Vehicle Application) incorporating the NRX-A1, the first NERVA-type cold flow reactor. The NERVA engine, based on Kiwi nuclear reactor technology, was intended to power a RIFT (Reactor-In-Flight-Test) nuclear stage, for which Marshall Space Flight Center had development responsibility.

This image acquired by NASA Terra satellite on December 18, 2002 shows the East African rift -- places where the earth crust has formed deep fissures and the plates have begun to move apart.
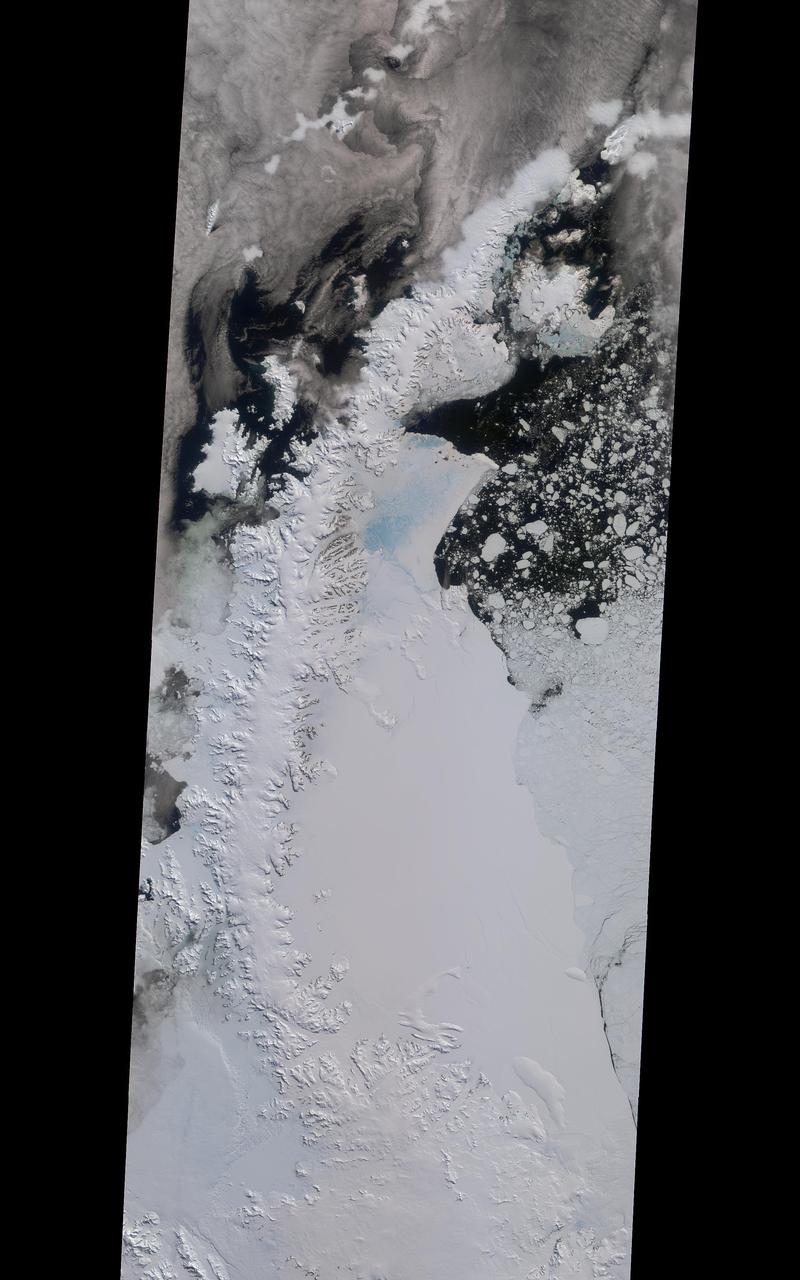
A rift in Antarctica's Larsen C ice shelf has grown to 110 miles (175 km) long, making it inevitable that an iceberg larger than Rhode Island will soon calve from the ice shelf. Larsen C is the fourth largest ice shelf in Antarctica, with an area of almost 20,000 square miles (50,000 square kilometers). The calving event will remove approximately 10 percent of the ice shelf's mass, according to the Project for Impact of Melt on Ice Shelf Dynamics and Stability (MIDAS), a UK-based team studying the ice shelf. Only 12 miles (20 km) of ice now separates the end of the rift from the ocean. The rift has grown at least 30 miles (50 km) in length since August, but appears to be slowing recently as Antarctica returns to polar winter. Project MIDAS reports that the calving event might destabilize the ice shelf, which could result in a collapse similar to what occurred to the Larsen B ice shelf in 2002. The Multi-angle Imaging SpectroRadiometer (MISR) instrument aboard NASA's Terra satellite captured views of Larsen C on August 22, 2016, when the rift was 80 miles (130 km) in length; December 8, 2016, when the rift was approximately 90 miles (145 km) long; and April 6, 2017. The MISR instrument has nine cameras, which view the Earth at different angles. The overview image, from December 8, shows the entire Antarctic Peninsula -- home to Larsen A, B, and C ice shelves -- in natural color (similar to how it would appear to the human eye) from MISR's vertical-viewing camera. Combining information from several MISR cameras pointed at different angles gives information about the texture of the ice. The accompanying GIF depicts the inset area shown on the larger image and displays data from all three dates in false color. These multiangular views -- composited from MISR's 46-degree backward-pointing camera, the nadir (vertical-viewing) camera, and the 46-degree forward-pointing camera -- represent variations in ice texture as changes in color, such that areas of rough ice appear orange and smooth ice appears blue. The Larsen C shelf is on the left in the GIF, bordered by the Weddell Sea on the upper right. The ice within the rift is orange, indicating movement, and the end of the rift can be tracked across the shelf between images. In addition, between December and April, the rift widened, pushing the future iceberg away from the shelf at its southern end. These data were acquired during Terra orbits 88717, 90290 and 92023. https://photojournal.jpl.nasa.gov/catalog/PIA21581
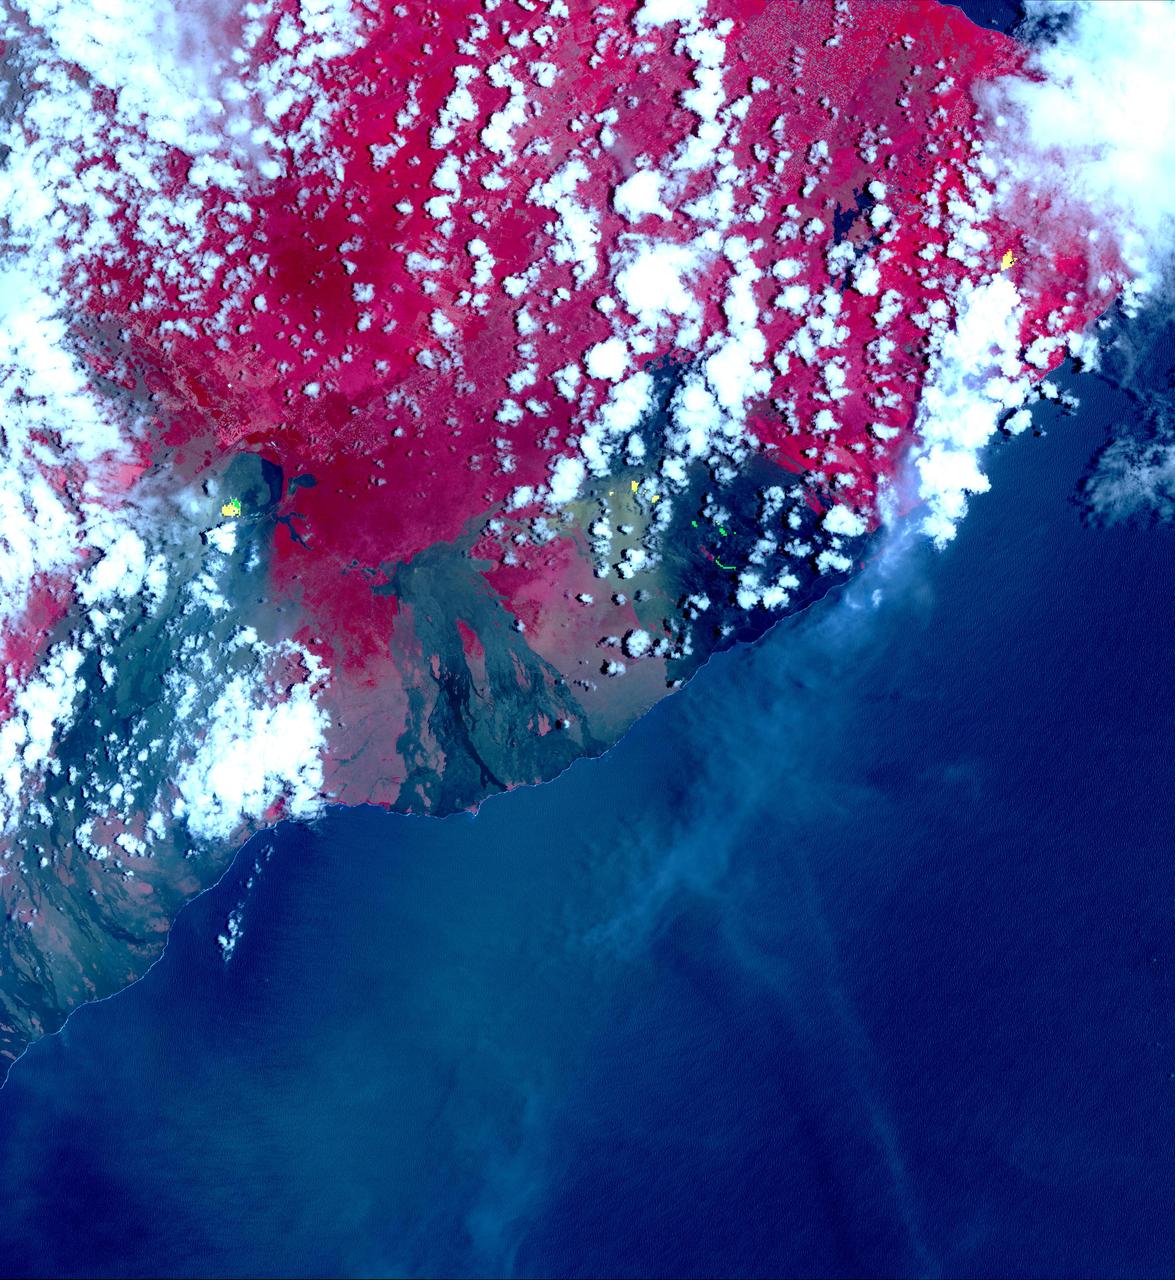
The 2018 Kilauea, Hawaii eruption began in May on Kilauea's East Rift Zone. Lava fountains up to 100 meters high, lava flows, and volcanic gas continued until August. By the time the eruption ended, over 700 houses had been destroyed, and 35 square kilometers of land had been covered by lava flows. About 3.5 square kilometers (875 acres) of new land has been created in the ocean. The before image was acquired by Landsat 8 on September 5, 2013; the ASTER image was acquired November 14, 2018. The images cover an area of 18 by 25.5 kilometers, and are located at 19.5 degrees north, 154.9 degrees west. https://photojournal.jpl.nasa.gov/catalog/PIA22899

CAPE CANAVERAL, Fla. – A visitor to the Robot Rocket Rally tries his hand at virtual reality in a demonstration of the Oculus Rift technology, provided by the Open Source Robotics Foundation. The three-day event at Florida's Kennedy Space Center Visitor Complex is highlighted by exhibits, games and demonstrations of a variety of robots, with exhibitors ranging from school robotics clubs to veteran NASA scientists and engineers. Photo credit: NASA/Kim Shiflett
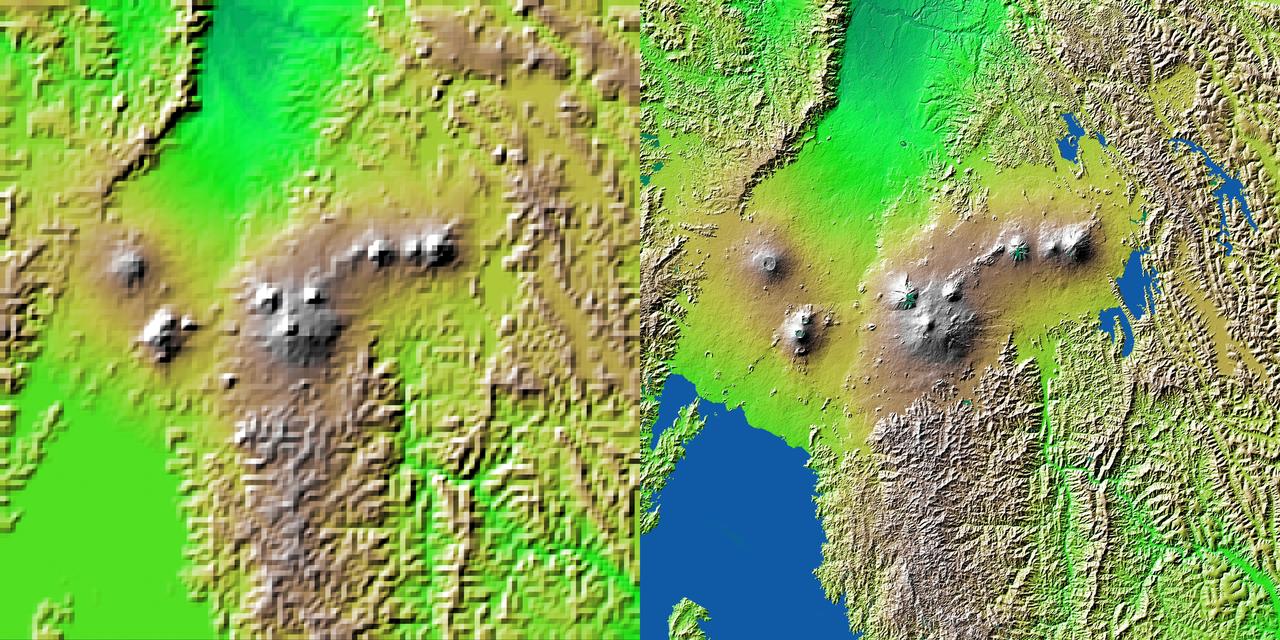
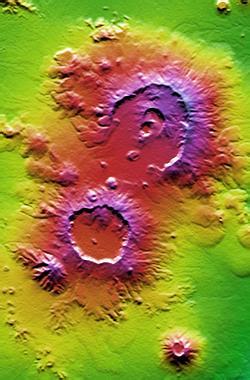
Volcanic, tectonic, erosional and sedimentary landforms are all evident in this comparison of two elevation models of a region along the East African Rift at Lake Kivu. The area shown covers parts of Congo, Rwanda and Uganda.
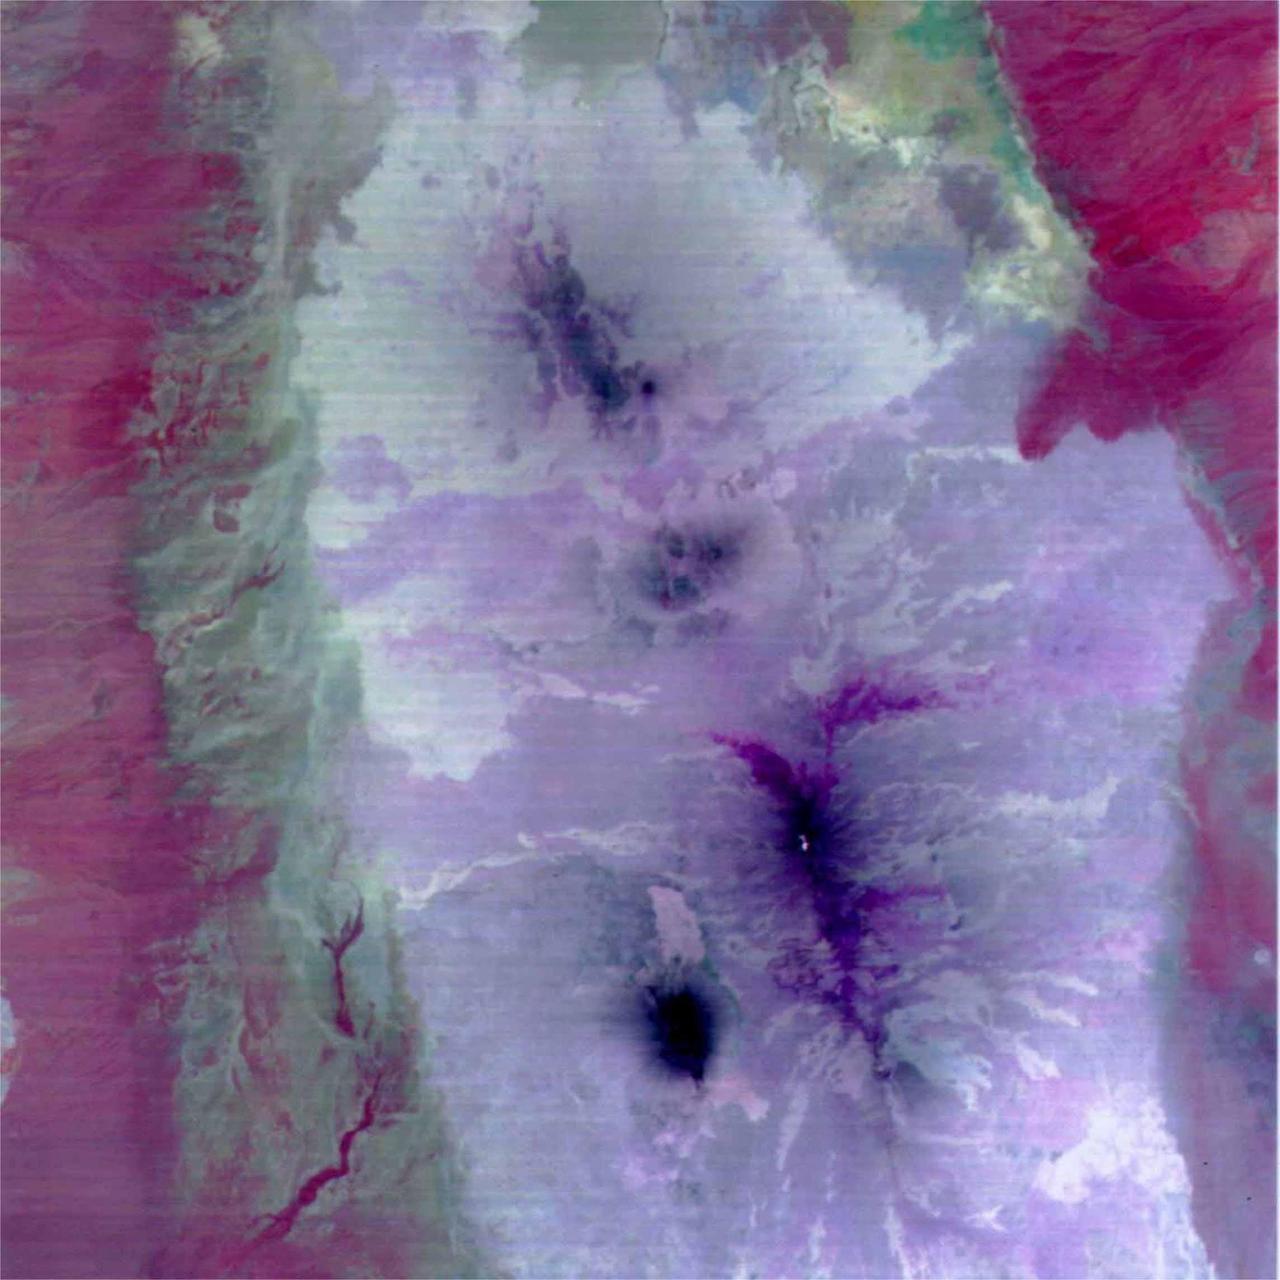
This image is a color composite covering the Rift Valley inland area of Ethiopia (south of the region shown in PIA02452). The color difference of this image reflects the distribution of different rocks with different amounts of silicon dioxide. It is inferred that the area with whitish color is covered with basalt and the pinkish area in the center contain sandesite. This is the first spaceborne, multi-band TIR image in history that enables geologists to distinguish between rocks with similar compositions. The size of image: 60 km x 60 km approx., ground resolution 90 m x 90 m approximately. http://photojournal.jpl.nasa.gov/catalog/PIA02453
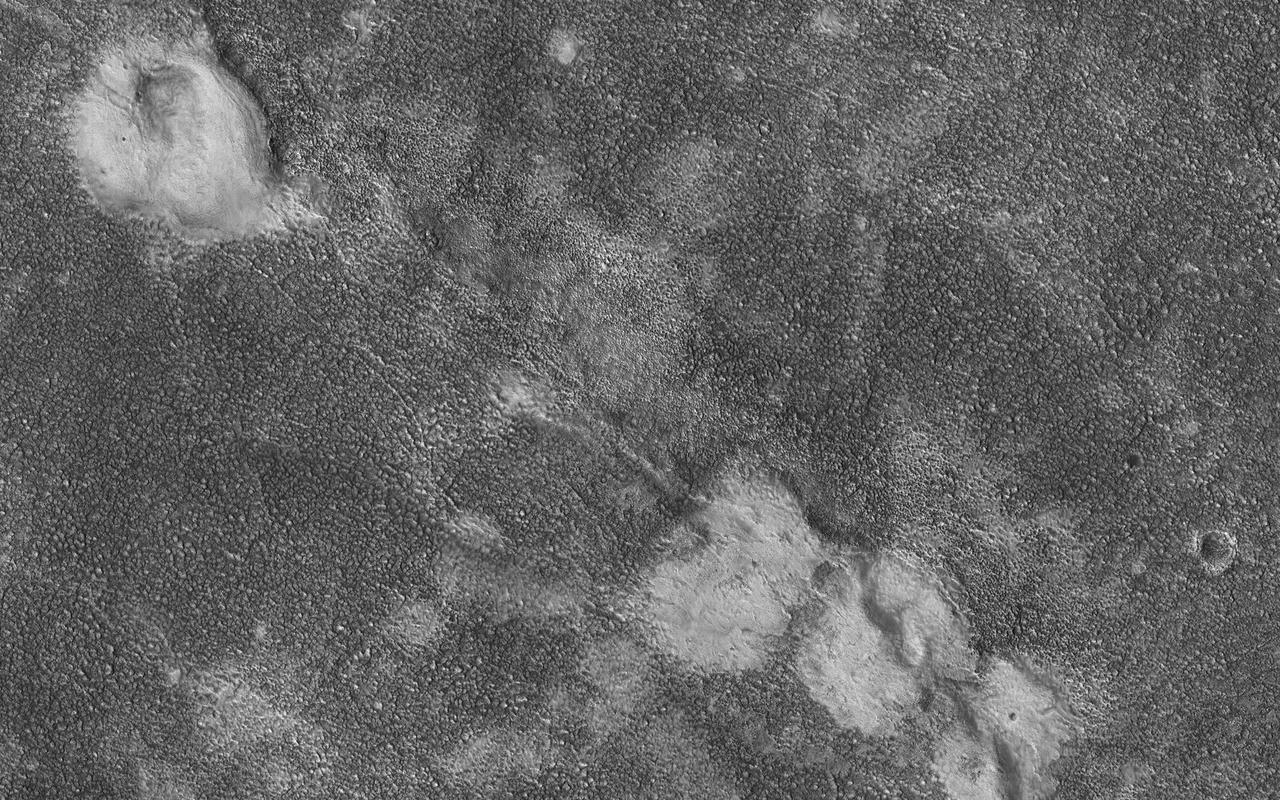
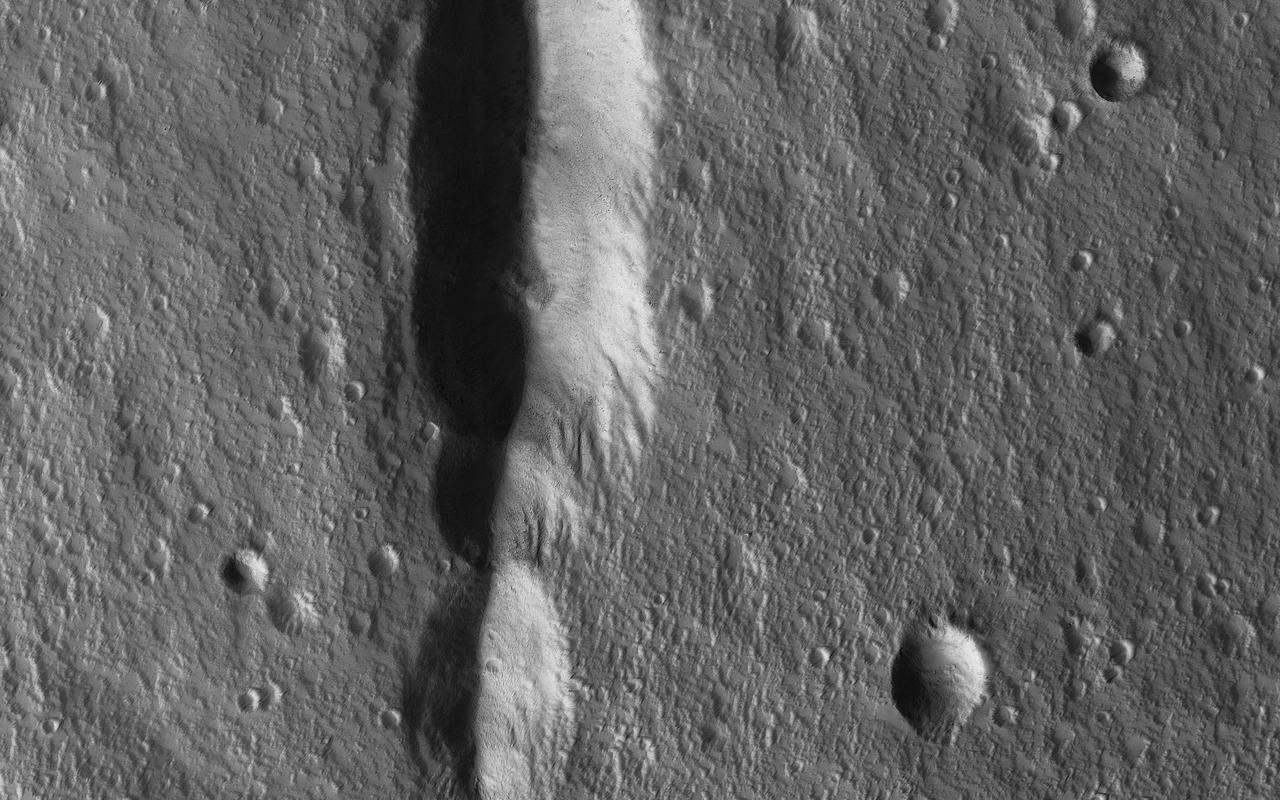
This image shows four relatively bright mounds along a linear, curving feature that appears to be a rift zone, where the shallow surface materials have pulled apart. The mounds also appear to be deformed. A possible geologic interpretation is that as the rift began to open, subsurface material (perhaps mud) erupted to create the mounds, which were then deformed as the rift continued to spread. This region (Chryse Planitia) is a low-elevation basin in which large outflow channels deposited water and sediments billions of years ago. https://photojournal.jpl.nasa.gov/catalog/PIA23672
The area known as the Afar Triangle is located at the northern end of the East Africa Rift, where it approaches the southeastern end of the Red Sea and the southwestern end of the Gulf of Aden.
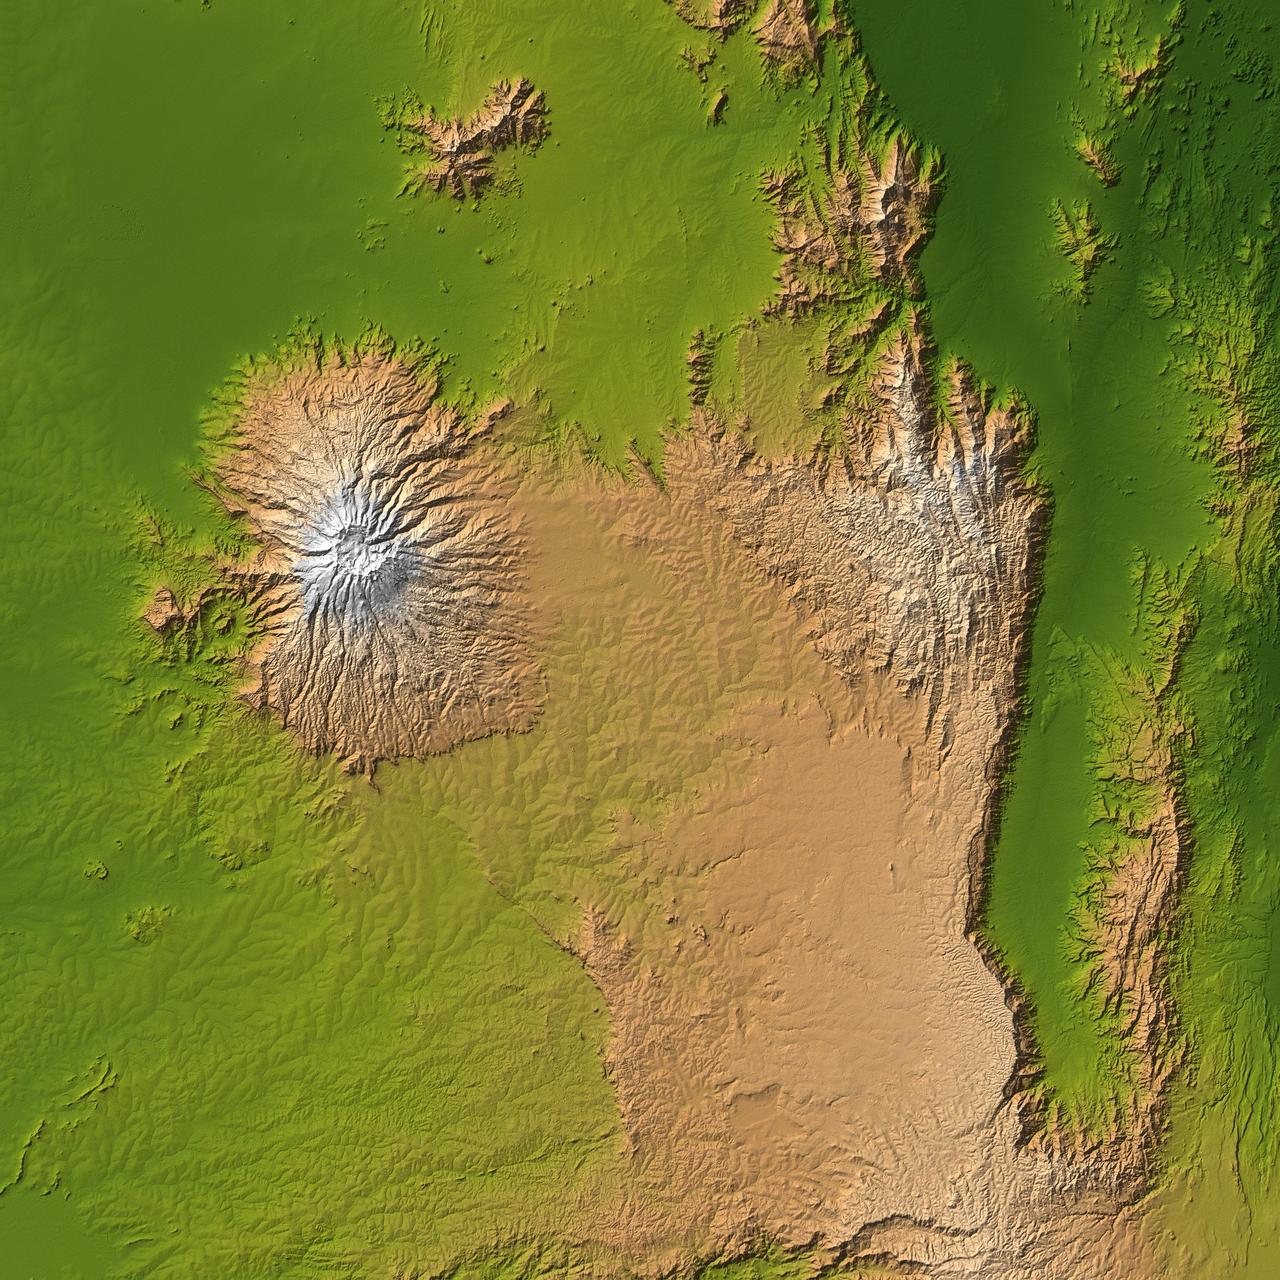
The striking contrast of geologic structures in Africa is shown in this shaded relief image of Mt. Elgon on the left and a section of the Great Rift Valley on the right.

In December, 2011, NASA Terra spacecraft captured this image of a new volcanic island forming in the Red Sea. This region is part of the Red Sea Rift where the African and Arabian tectonic plates are pulling apart.

Visible in this observation from NASA Mars Reconnaissance Orbiter is a section of Cerberus Fossae, which are comprised of a series of rifts present located in Elysium Planitia just north the Martian equator.
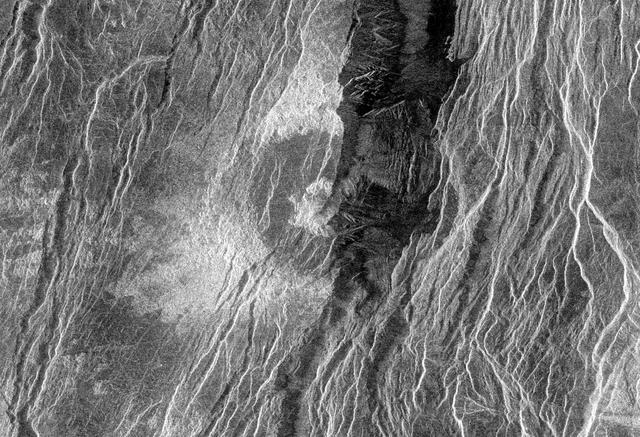
This radar image from NASA's Magellan spacecraft is of a half crater located in the rift between Rhea and Theia Montes in Beta Regio on Venus and has been cut by many fractures or faults since it was formed by the impact of a large asteroid. http://photojournal.jpl.nasa.gov/catalog/PIA00100
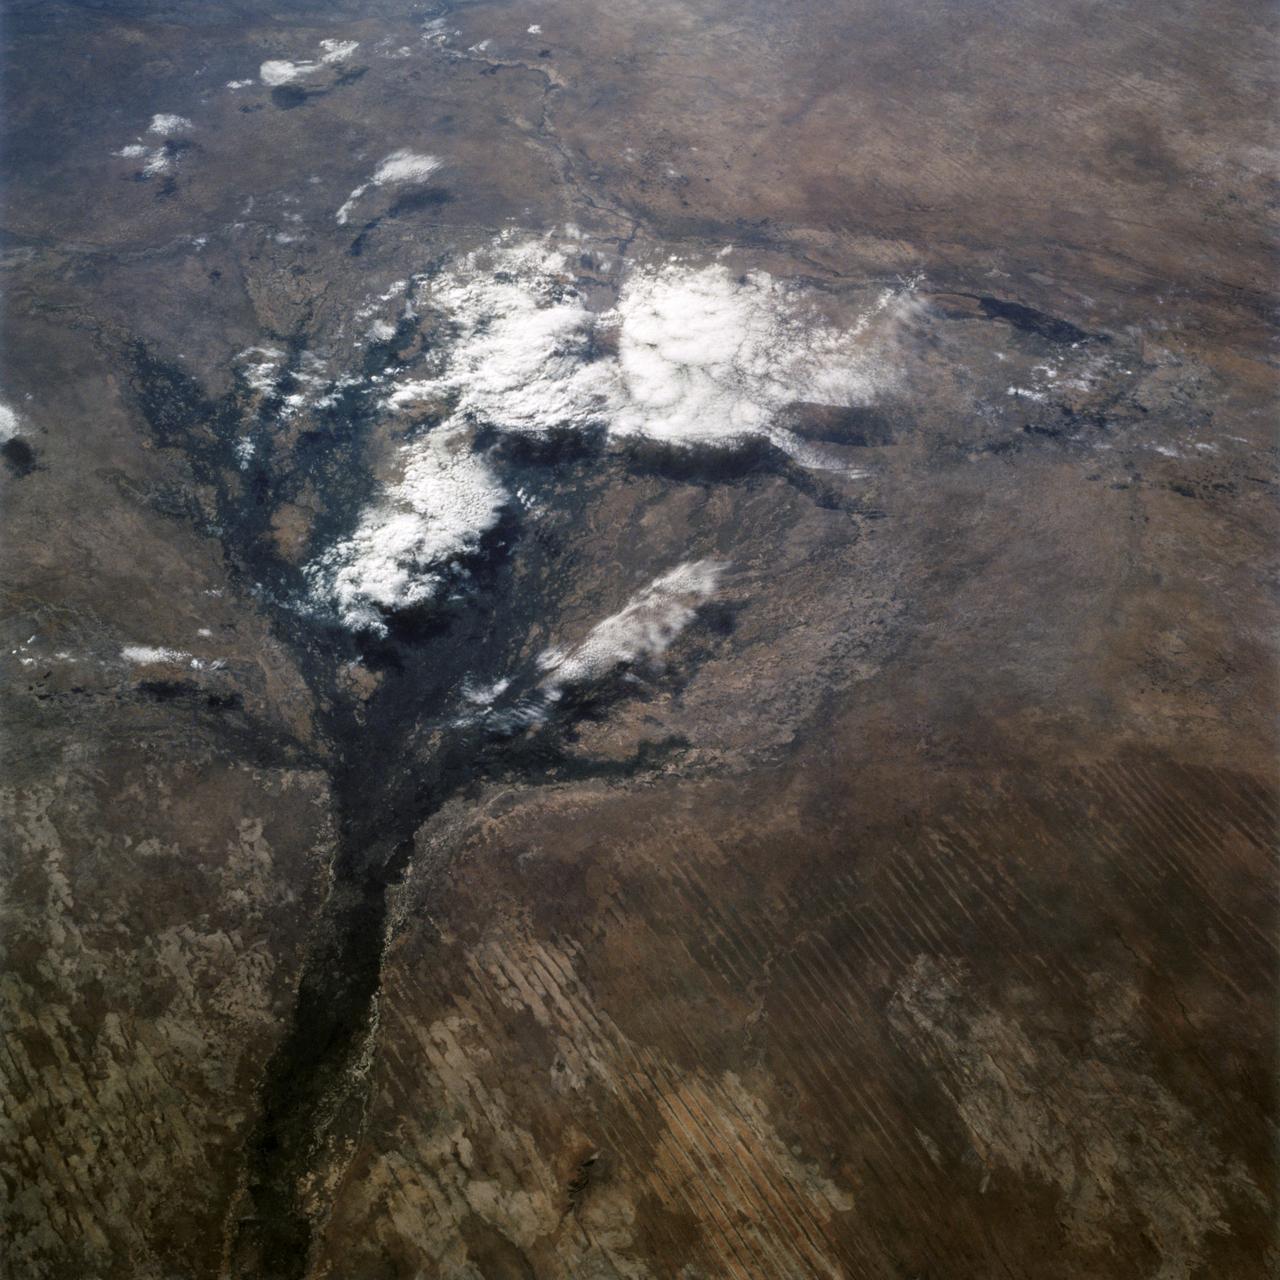
ISS030-E-035487 (14 Jan. 2012) --- The East African Rift Valley in Kenya is featured in this image photographed by an Expedition 30 crew member on the International Space Station. This photograph highlights classical geological structures associated with a tectonic rift valley, in this case the Eastern Branch of the East African Rift near Kenya’s southern border with Tanzania and just south of the Equator. The East African Rift is one of the great tectonic features of Africa, caused by fracturing of Earth’s crust. The Nubian (or African) plate includes the older continental crust of Africa to the west, while the Somalian plate that is moving away includes the Horn of Africa to the northeast; the tectonic boundary stretches from the southern Red Sea to central Mozambique. Landscapes in the rift valley can appear confusing. The most striking features in this view are the numerous, nearly parallel, linear fault lines that occupy the floor of the valley (most of the image). Shadows cast by the late afternoon sun make the fault scarps (steps in the landscape caused by slip motion along individual faults) more prominent. The faults are aligned with the north-south axis of the valley (lower left to top right). A secondary trend of less linear faults cuts the main fault trend at an acute angle, the fault steps throwing large shadows. The Eastern Branch of the East African Rift is arid (compared with the Western Branch which lies on the border of the Congolese rainforest). Evidence of this can be seen in the red, salt-loving algae of the shallow and salty Lake Magadi (center). A neighboring small lake to the north has deeper water and appears dark in the image. The white salt deposits of the dry part of the Lake Magadi floor (center) host a few small commercial salt pans. The lakes appear to be located where the main and secondary fault trends intersect. The East African rift system is marked by substantial volcanic activity, including lavas erupted from fissures along the rift in the region. Much of the faulting observed in this image cuts through such lavas. Elsewhere along the rift system individual volcanoes form. Some of those volcanoes are very large, including Mt. Kilimanjaro and Mt. Kenya. In this image, rising 400 meters above the valley floor, a volcano appears to be superimposed on the faults—indicating that the volcano is younger than the faults it covers. Deeply eroded slopes also suggest that the volcano has not been active for a long time. The largest vegetated area (lower left)—in an desert zone with no vegetation visible to the naked eye from space—is the green floor of a valley which drains an area large enough for water to exist near the surface so that plants can thrive. For a sense of scale, the vegetated valley floor is 17 kilometers long (10.5 miles).
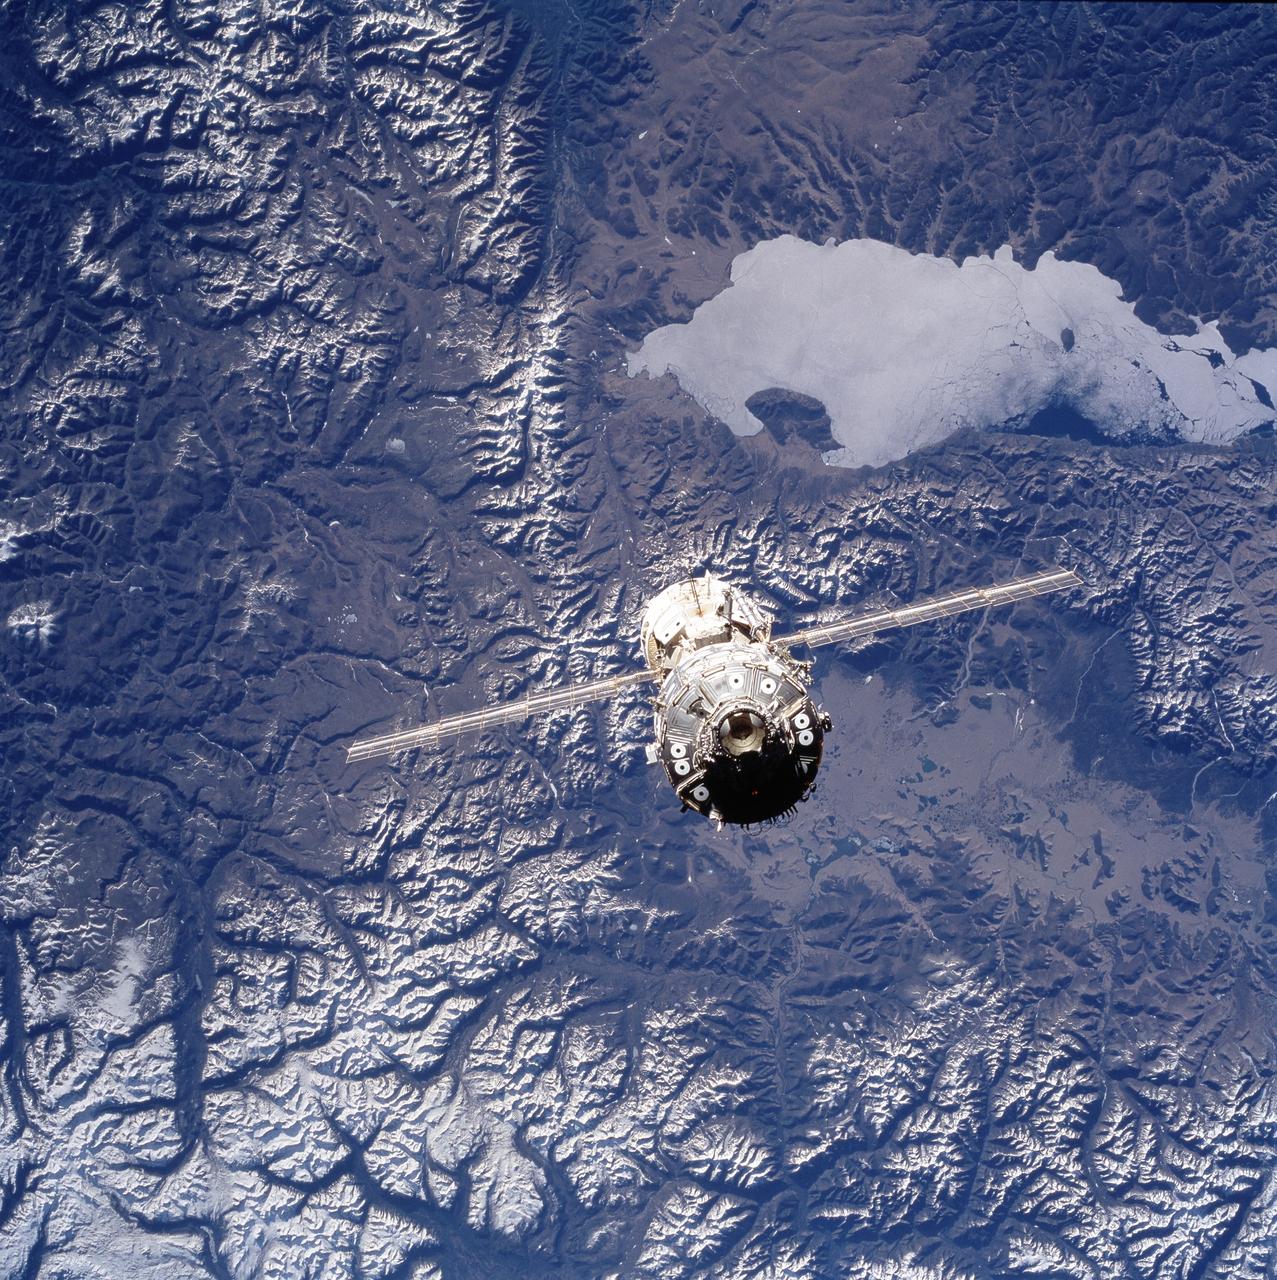
STS101-720-58 (26 May 2000) --- The International Space Station is photographed just after separation from the Space Shuttle Atlantis over Mongolia. Featured in the 70mm frame is the Lake Hovsgol rift valley. A long, straight transform fault zone connects the Hovsgol and Baykal rift valleys. Lake Baykal is 200 kilmeters east of Lake Volsgol.
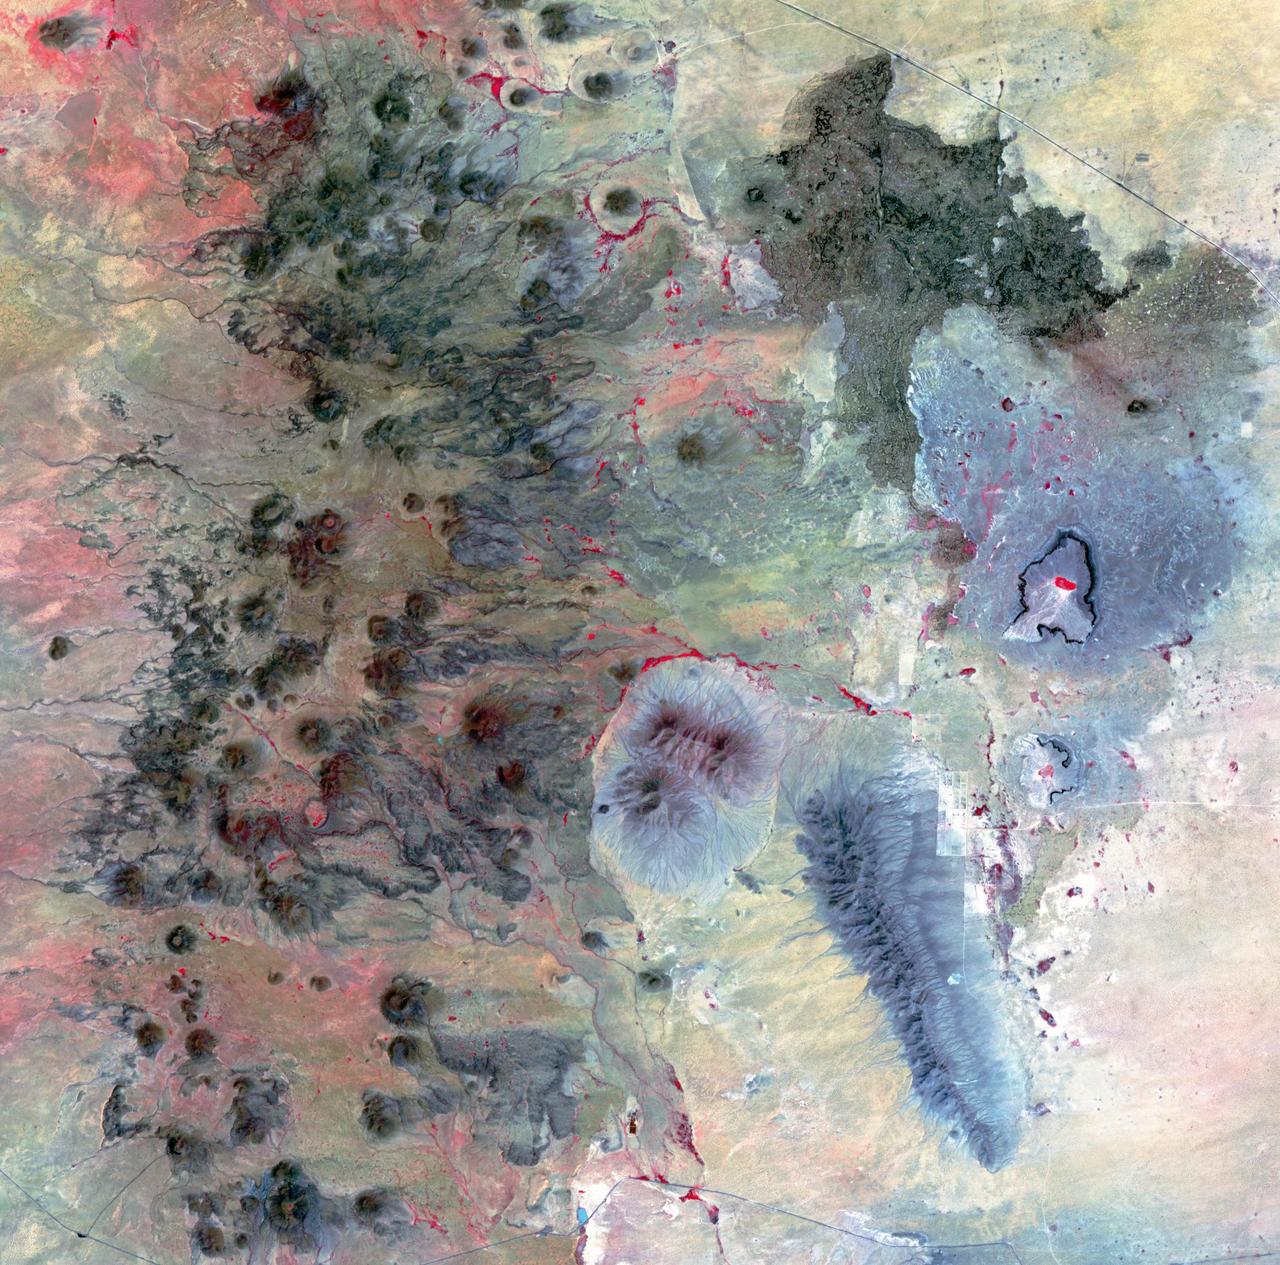
The Potrillo volcanic field is located on the Rio Grande Rift in southern New Mexico. Different kinds of volcanism form distinct landforms. The western part is composed of hundreds of cinder cones and flows. The eastern side has a small shield volcano with many tube-fed lava flows and two large maar craters, formed by the explosive interaction of magma with ground water. The age of the field is between 1 million to 20,000 years old. The image was acquired August 26, 2002, covers an area of 36 by 36.4 kilometers, and is located at 32 degrees north, 107.1 degrees west. https://photojournal.jpl.nasa.gov/catalog/PIA23065
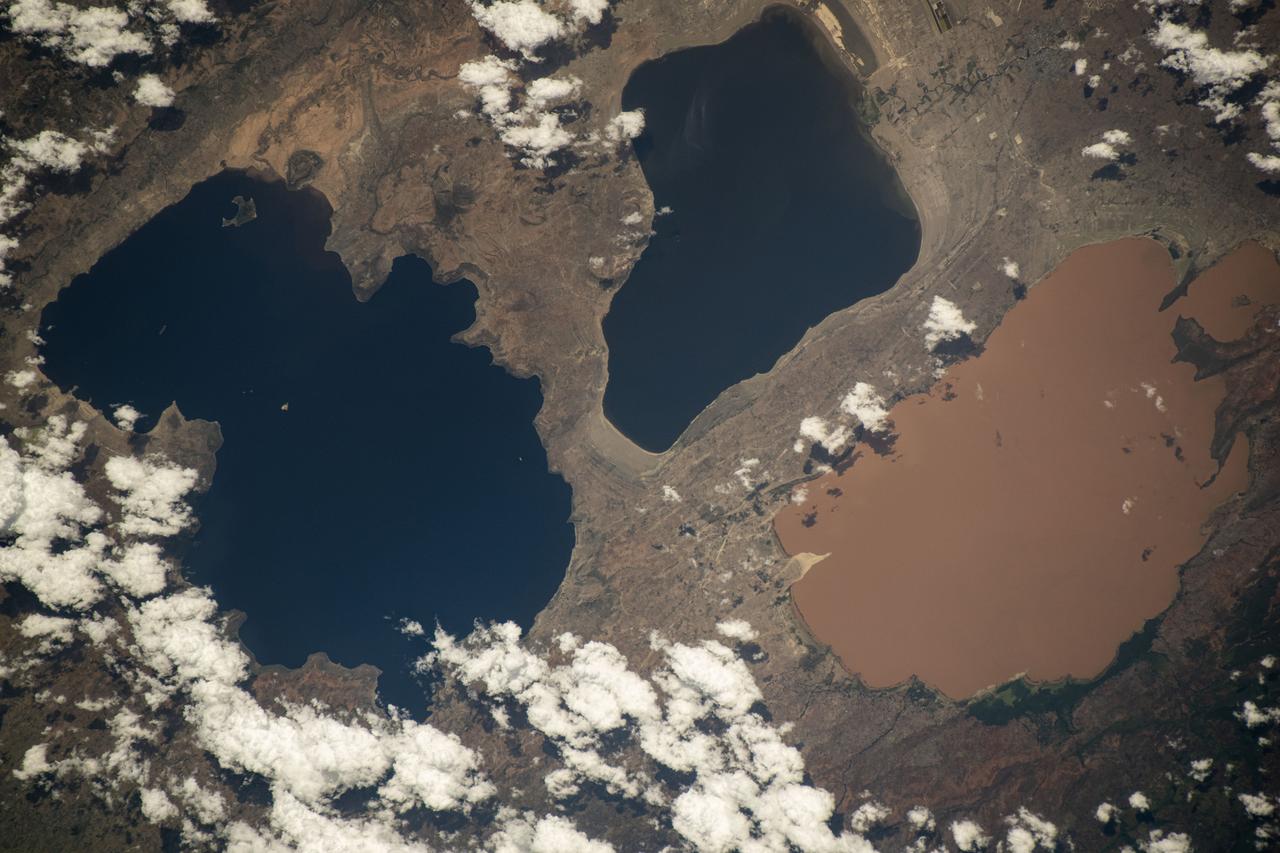
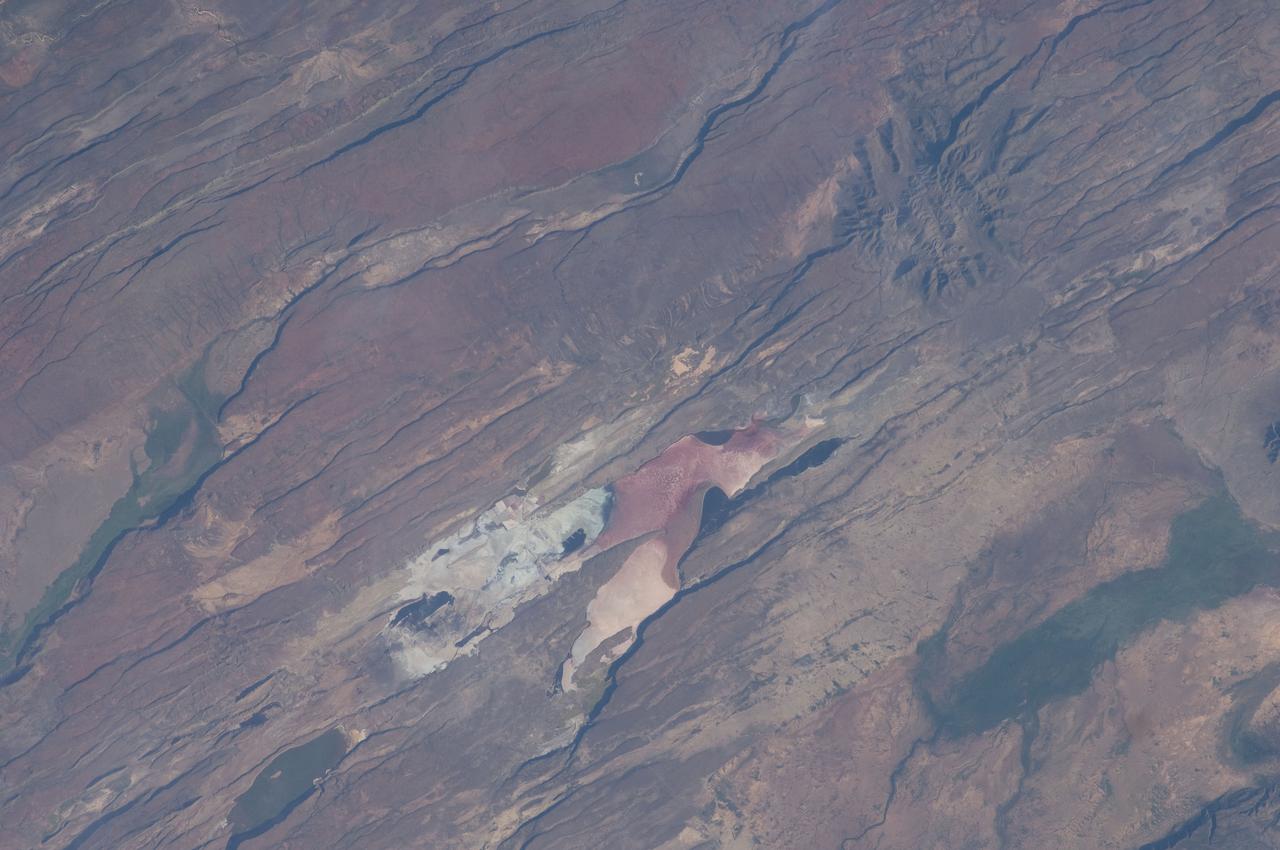
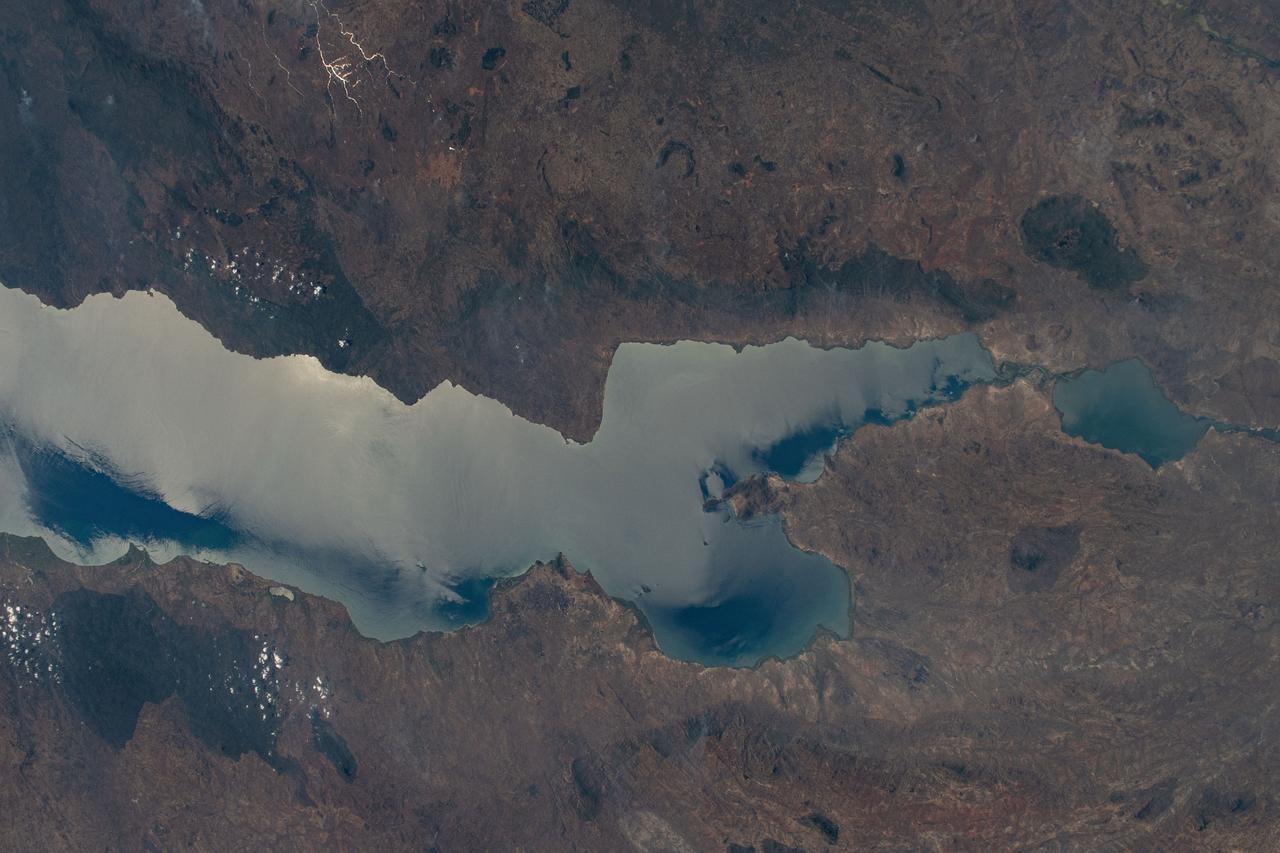
iss071e132461 (May 27, 2024) -- A trio of lakes in the Ethiopian Rift Valley were pictured from the International Space Station as it orbited 259 miles above. From left are Lakes Shala, Abijatta (both alkaline bodies of water), and Langano, which gets its brown color from high sulfur levels and other minerals.
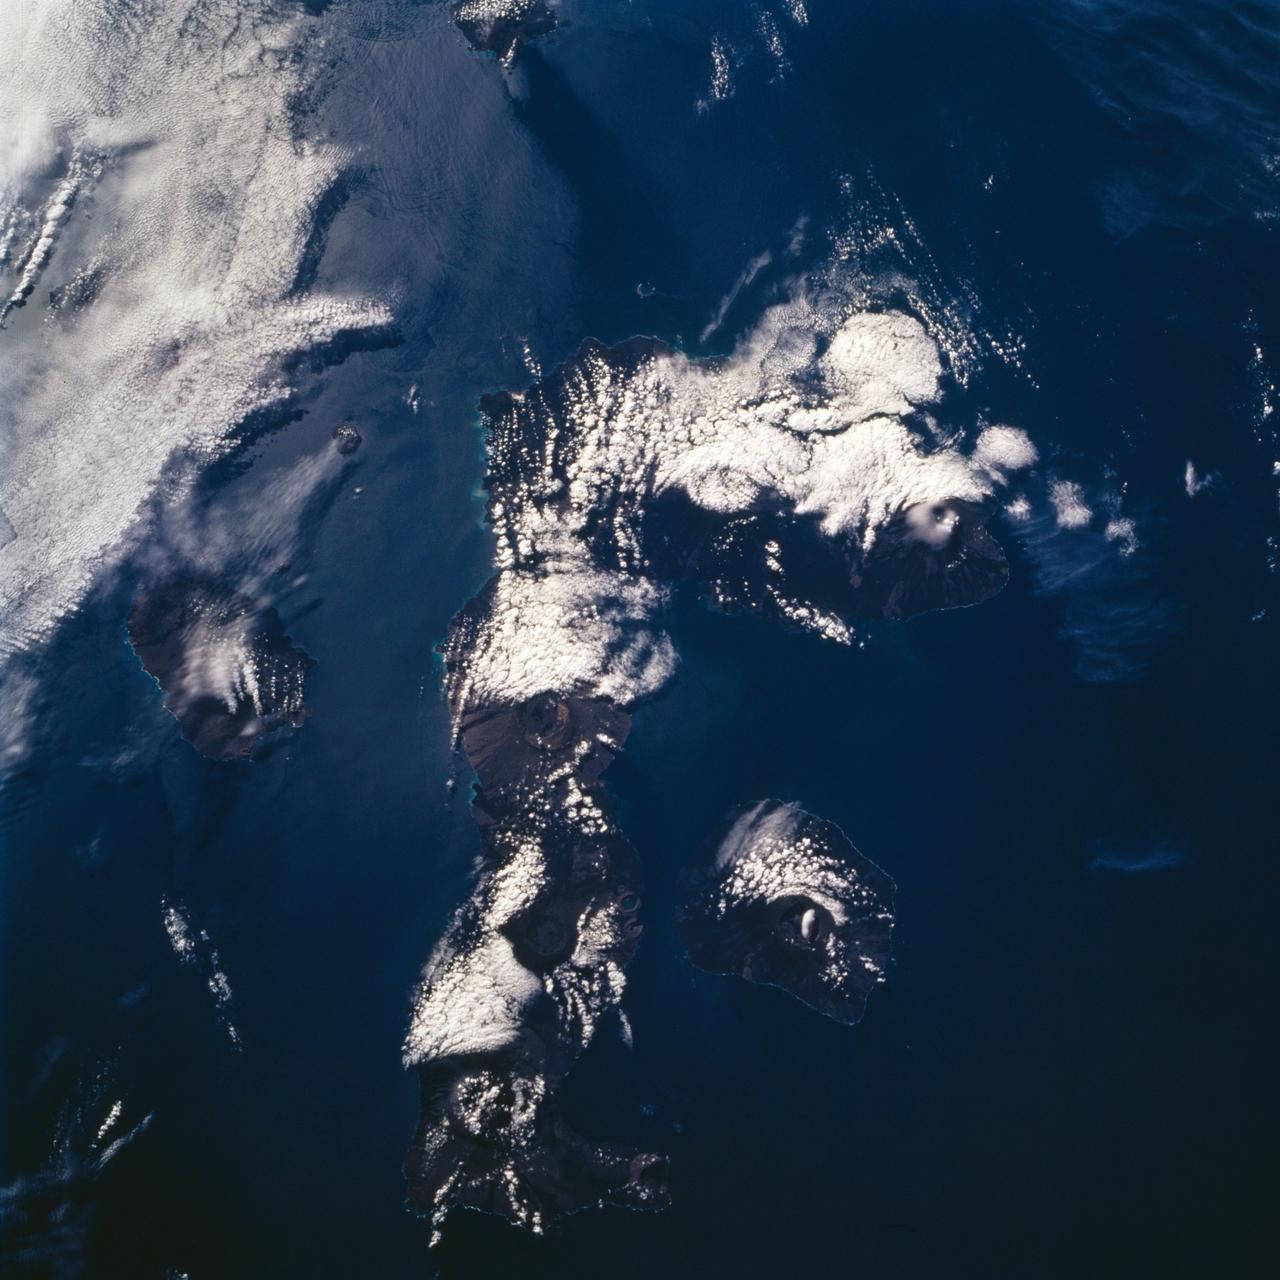
STS072-732-072 (11-20 Jan. 1996) --- Three of the nineteen Galapagos Islands are visible in this image, photographed from the Earth-orbiting Space Shuttle Endeavour. The Galapagos Islands are located 600 miles (1,000 kilometers) to the west of Ecuador. The largest of the islands, Isabela, is at center (north is toward the upper right corner). The numerous circular features on the island, highlighted by clouds, are volcanoes. The Galapagos Islands owe their existence to a hot spot, or persistent heat source in the mantle, which also is located over a rift, or place where plates are separating and new crust is being created. The rift is located between the Cocos and Nazca Plates. The dark linear features on the islands are lava flows from past eruptions. The island to the left of Isabela is Fernandina, while the island to the right is San Salvador. The Galapagos Islands were visited by the English naturalist Charles Darwin in 1835.

This image covers part of the 150 kilometer (90 mile) wide, 1 to 1.5 kilometer (0.6 to 0.9 mile) deep valley, Devana Chasma. The image is a composite of the first two orbits recorded by NASA's Magellan spacecraft in August 1990 superimposed on Pioneer Venus topography. This image is located at the intersection of Devana Chasma and the Phoebe Regio upland. It covers a region approximately 525 by 525 kilometers (315 by 315 miles), centered 288 degrees east longitude on the equator. Devana Chasma consists of radar bright lineaments, interpreted to be fault scarps, oriented in a north-northeast direction. This part of the planet is thought to be an area where the crust is being stretched and pulled apart producing a rift valley, similar to the East African rift. http://photojournal.jpl.nasa.gov/catalog/PIA00464
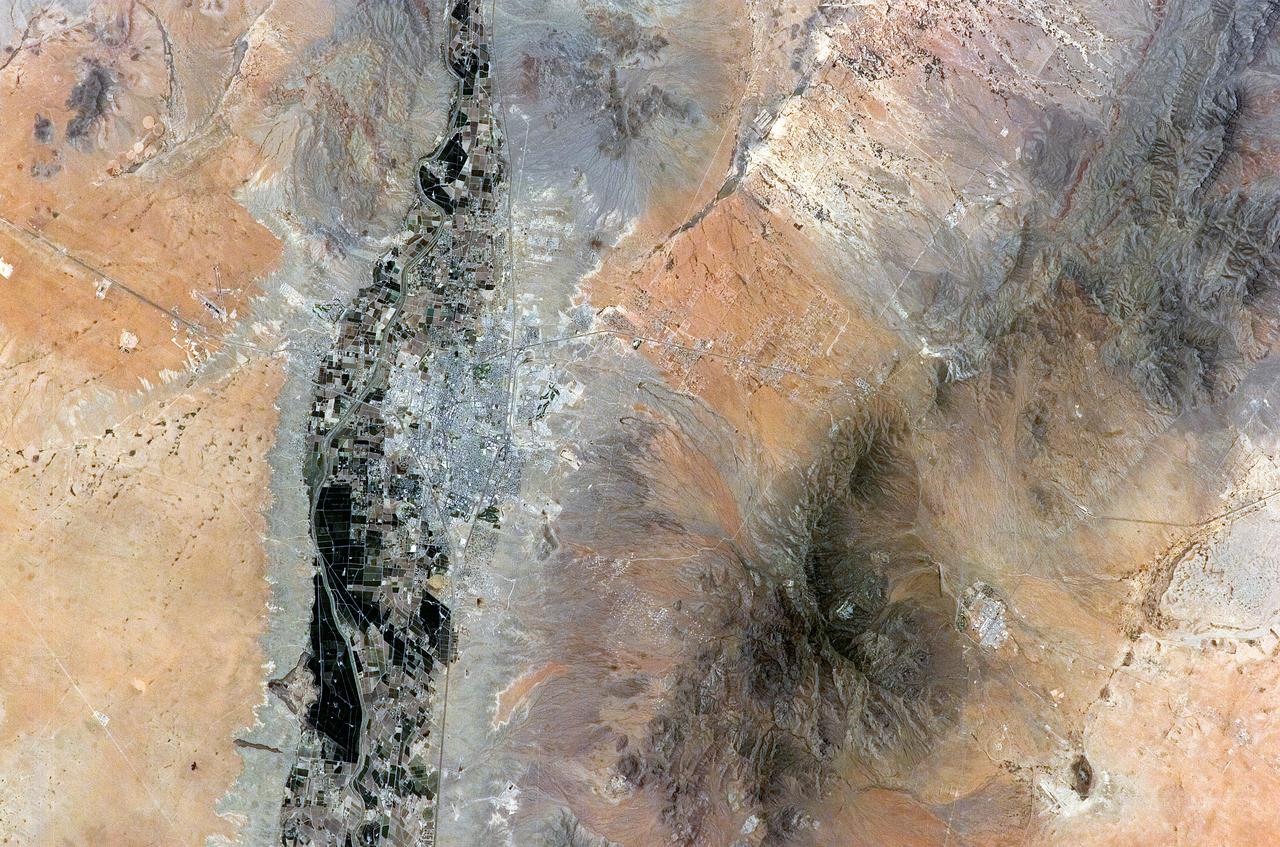
ISS011-E-08410 (9 June 2005) --- Las Cruces, New Mexico is featured in this image photographed by an Expedition 11 crewmember on the International Space Station. The city of Las Cruces is located within the Rio Grande Rift, a large geological feature that extends from Colorado southward into Mexico. According to NASA geologists, rifting usually heralds the breakup of continental landmasses, such as the separation of South America and Africa to form the southern Atlantic Ocean during the Mesozoic Era. The Rift is marked by a series of depressions (known as graben) caused by the subsidence of crustal blocks between parallel faults as the continental crust is pulled apart by tectonic forces. These graben are frequently marked by uplifted rocks along bounding faults — the striking Organ Mountains to the east of Las Cruces are one such uplifted fault block. While separation of the continental crust is no longer occurring, the Rio Grande Rift is still considered active as evidenced by frequent low-intensity earthquakes and hot springs to the north of Las Cruces. The modern city of Las Cruces — the seat of Doña Ana County and home to New Mexico State University — is undergoing rapid urban expansion due to influx of new residents attracted to the climate and landscape. The current urban area (gray to white region at image center) contrasts sharply with agricultural lands (dark green and grey brown) located along the Rio Grande River and the surrounding desert valley floor to the northeast and southwest (brown, blue gray and tan areas).
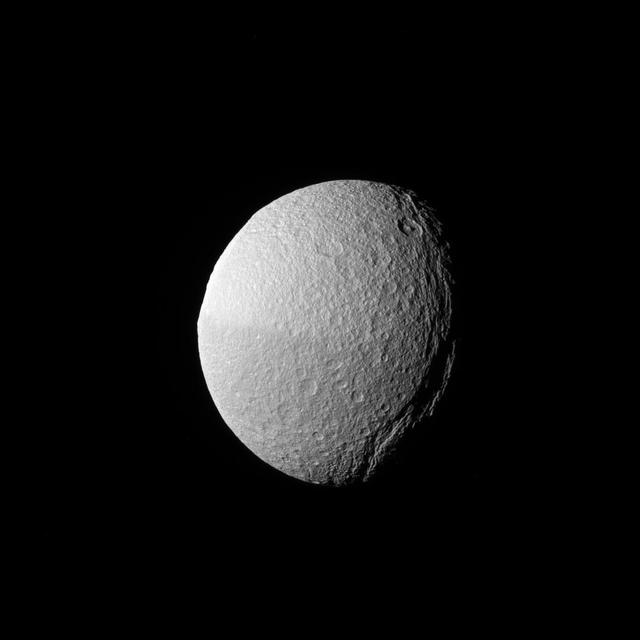
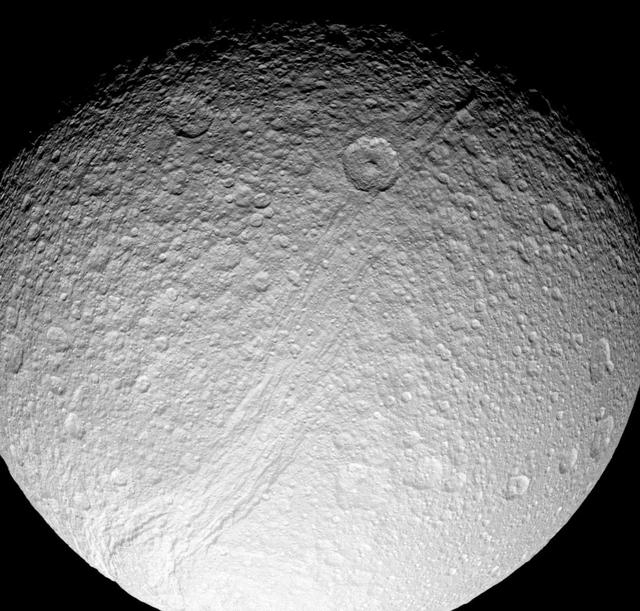
The low angle of the sun over Tethys' massive canyon, Ithaca Chasma (near the terminator, at right), highlights the contours of this enormous rift. Ithaca Chasma is up to 60 miles (100 kilometers) wide, and runs nearly three-fourths of the way around icy Tethys (660 miles or 1,062 kilometers across). The canyon has a maximum depth of nearly 2.4 miles (4 kilometers) deep. The giant crater Odysseus -- usually one of Tethys' most recognizable features-- is barely seen in profile along the limb, at upper left. This view looks toward the Saturn-facing hemisphere of Tethys. North on Tethys is up and rotated 5 degrees to the left. The image was taken in green light with the Cassini spacecraft narrow-angle camera on Jan. 30, 2017. The view was obtained at a distance of approximately 221,000 miles (356,000 kilometers) from Tethys. Image scale is 1 mile (2 kilometers) per pixel. https://photojournal.jpl.nasa.gov/catalog/PIA20527
iss071e378491 (July 21, 2024) -- Sunlight reflects off the freshwater of Kasankha Bay, located in the southern region of Lake Malawi, creating a near glass-like appearance. One of seven African Great Lakes, Malawi ranks as one of the deepest lakes in the world. As the International Space Station soared 262 miles above the Great Rift Valley, NASA astronaut Matthew Dominick captured this photo.
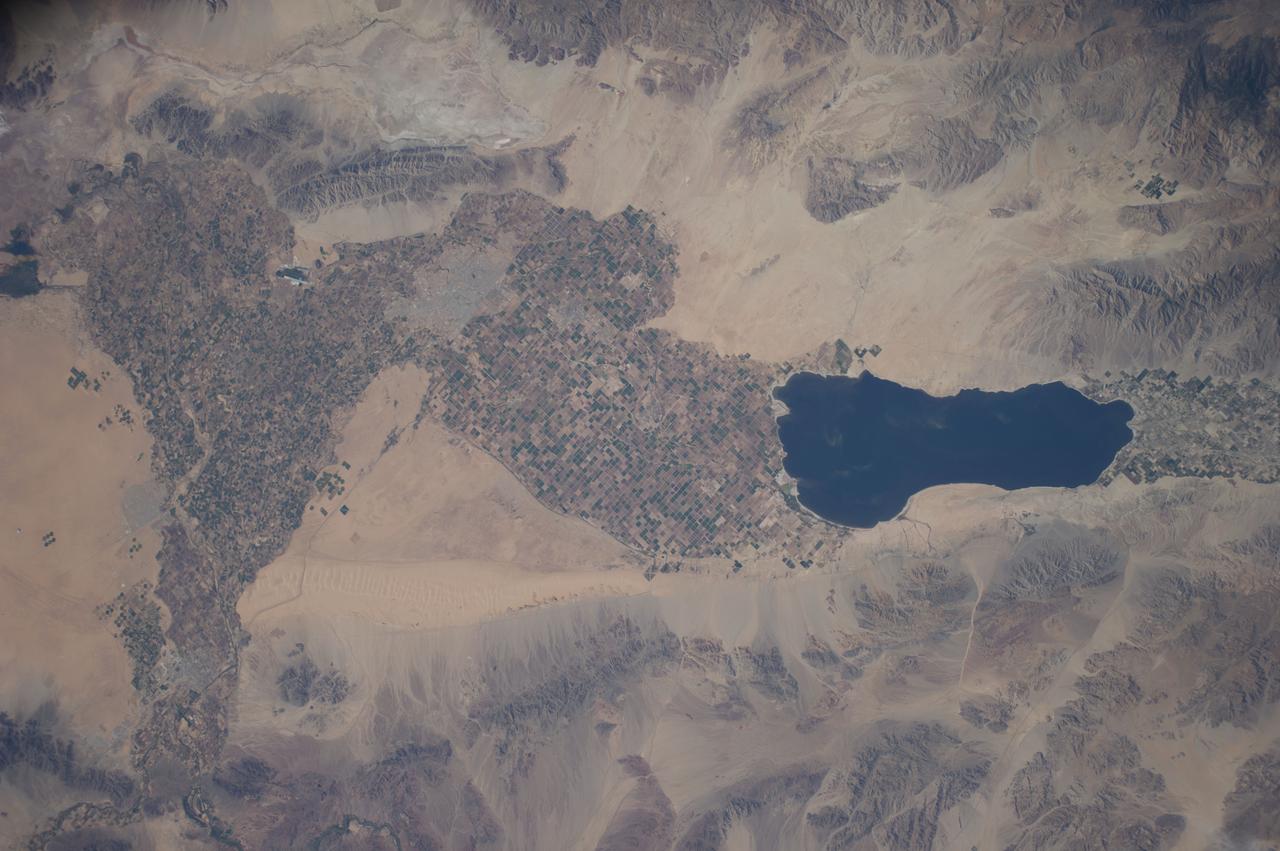
ISS040-E-114379 (31 Aug. 2014) --- One of the Expedition 40 crew members aboard the Earth-orbiting International Space Station, flying at an altitude of approximately 225 nautical miles, photographed this image of California's Salton Sea on Aug. 31, 2014. The body of water is actually a shallow, saline, endorheic rift lake located directly on the San Andreas Fault, predominantly in the Imperial and Coachella Valleys.

This artist's concept illustrates the NERVA (Nuclear Engine for Rocket Vehicle Application) engine's hot bleed cycle in which a small amount of hydrogen gas is diverted from the thrust nozzle, thus eliminating the need for a separate system to drive the turbine. The NERVA engine, based on KIWI nuclear reactor technology, would power a RIFT (Reactor-In-Flight-Test) nuclear stage, for which the Marshall Space Flight Center had development responsibility.
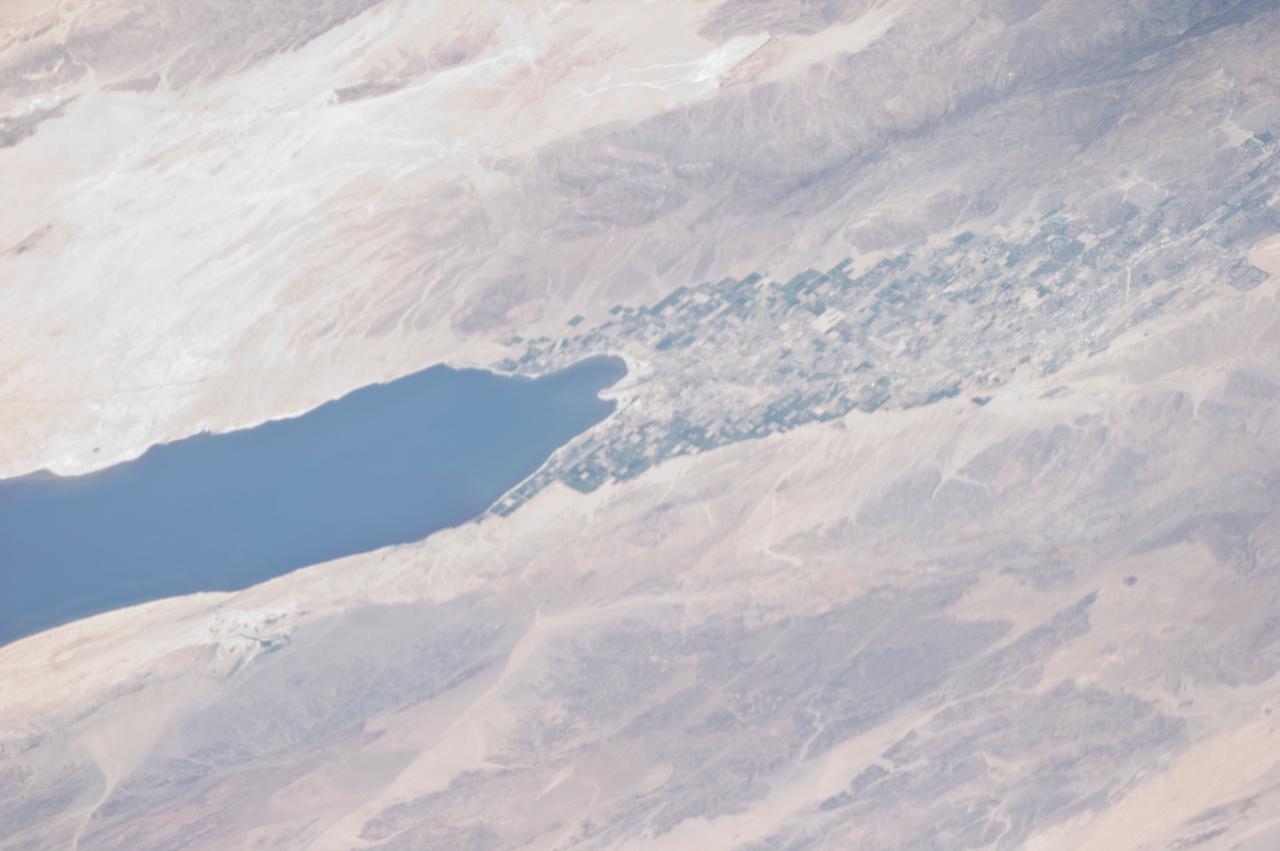
ISS028-E-006059 (28 May 2011) --- One of the Expedition 28 crew members, photographing Earth images onboard the International Space Station while docked with the space shuttle Endeavour and flying at an altitude of just under 220 miles, captured this frame of the Salton Sea. The body of water, easily identifiable from low orbit spacecraft, is a saline, endorheic rift lake located directly on the San Andreas Fault. The agricultural area is within the Coachella Valley.
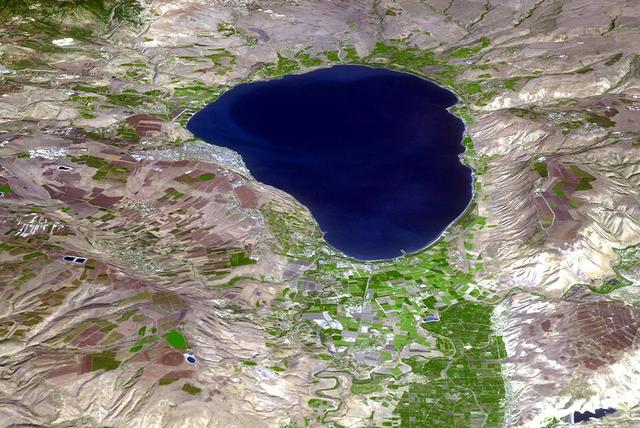
The Sea of Galilee (or Sea of Kinneret) in northern Israel is the lowest freshwater lake on Earth. The lake's main source is the Jordan River, in the Jordan Rift Valley. In antiquity, the Greeks, Hasmoneans, and Romans founded towns on the lake. In the New Testament, much of the ministry of Jesus occured on the shores of the Sea. (Information from Wikipedia.) The image was acquired October 14, 2018, and is located at 32.8 degrees north, 35.6 degrees east. https://photojournal.jpl.nasa.gov/catalog/PIA24130
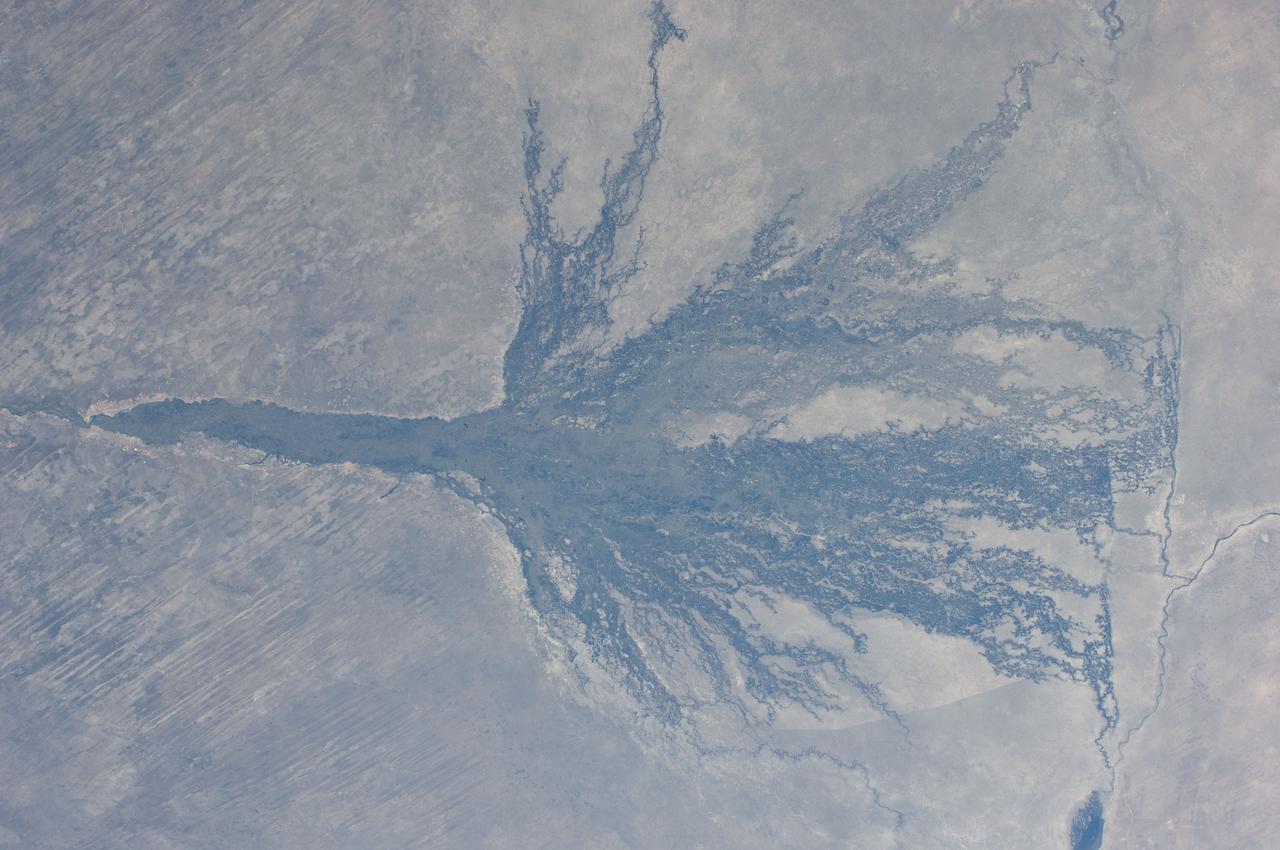
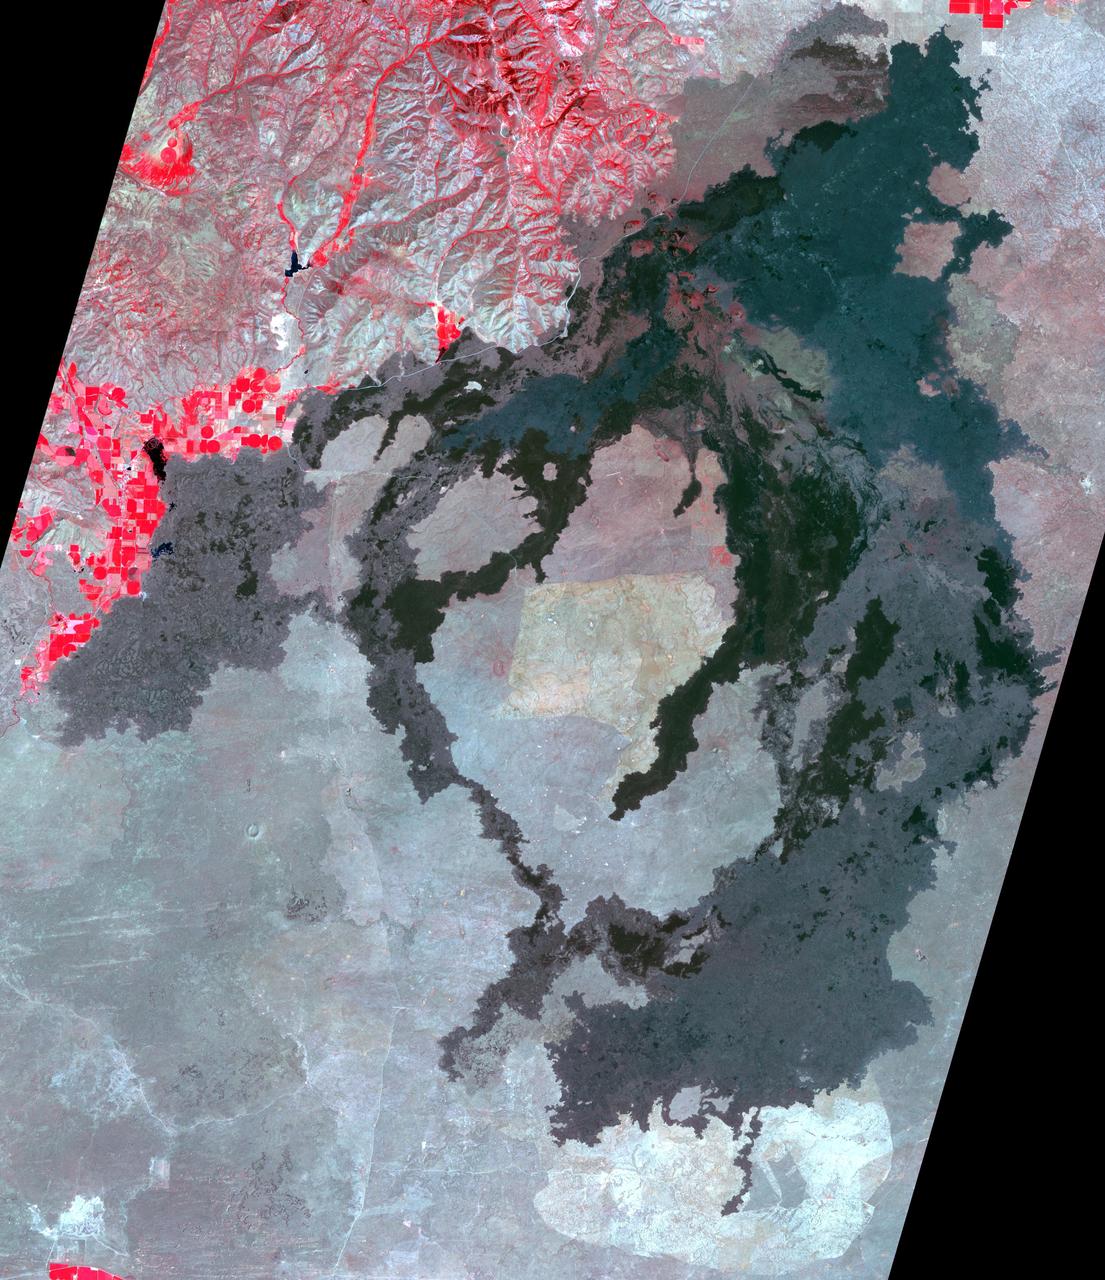
ISS028-E-006830 (2 June 2011) --- Okavango Swamp in Botswana is featured in this image photographed by an Expedition 28 crew member on the International Space Station. This short focal-length photograph shows the entire Okavango ?delta,? a swampland known in Southern Africa as the ?Jewel of the Kalahari Desert?. This enormous pristine wetland of forest, wildlife, and freshwater almost miraculously appears in a desert where surface water is typically non-existent. The water comes from the Okavango River which rises in the high-rainfall zone of southern Angola, hundreds of kilometers to the northwest. The dark green forested floodplain is approximately 10 kilometers wide where it enters the view (left). The Okavango then enters a rift basin which allows the river to spread out, forming the wetland. The width of the rift determines the dimensions of the delta?150 kilometers from apex to the linear downstream margin (right). The apex fault is more difficult to discern, but two fault lines actually define the downstream margin; the fault traces are indicated by linear stream channels and vegetation patterns oriented at nearly right angles to the southeast-trending distributary channels at center. The distributary channels carry sediment from the Okavango River that is deposited within the rift basin. Over time, a fan-shaped morphology of the deposits has developed, leading to characterization of the wetland as the Okavango ?delta?. The drying trend from higher rainfall in the north (left) to less rainfall in central Botswana (right) is shown by the change from the greens of denser savanna vegetation to browns of an open ?thornscrub? savanna. More subtle distinctions appear: the distributary arms of the delta include tall, permanent riverine and seasonal forest (dark green), with grasses and other savanna vegetation (light green) on floodplains?which appear well watered in this image. Linear dunes, emplaced by constant winds from the east during drier climates, appear as straight lines at left. The dunes are 10 meters high and their sands hold enough moisture for some trees to grow on them. Counter-intuitively, the low ?streets? between the dunes are treeless because they are dominated by dense dry white soils known as calcretes.
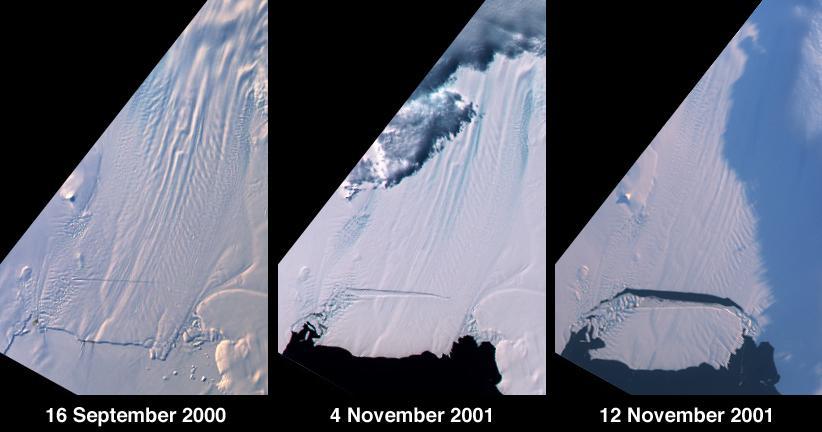
A large tabular iceberg (42 kilometers x 17 kilometers) broke off Pine Island Glacier, West Antarctica (75ºS latitude, 102ºW longitude) sometime between November 4 and 12, 2001. Images of the glacier were acquired by the Multi-angle Imaging SpectroRadiometer (MISR) instrument aboard NASA's Terra spacecraft. This event was preceded by the formation of a large crack across the glacier in mid 2000. Data gathered by other imaging instruments revealed the crack to be propagating through the shelf ice at a rate averaging 15 meters per day, accompanied by a slight rotation of about one percent per year at the seaward margin of the rift. The image set shows three views of Pine Island Glacier acquired by MISR's vertical-viewing (nadir) camera. The first was captured in late 2000, early in the development of the crack. The second and third views were acquired in November 2001, just before and just after the new iceberg broke off. The existence of the crack took the glaciological community by surprise, and the rapid rate at which the crack propagated was also not anticipated. Glaciologists predicted that the rift would reach the other side of the glacier sometime in 2002. However, the iceberg detached much sooner than anticipated, and the last 10-kilometer segment that was still attached to the ice shelf snapped off in a matter of days. http://photojournal.jpl.nasa.gov/catalog/PIA03431
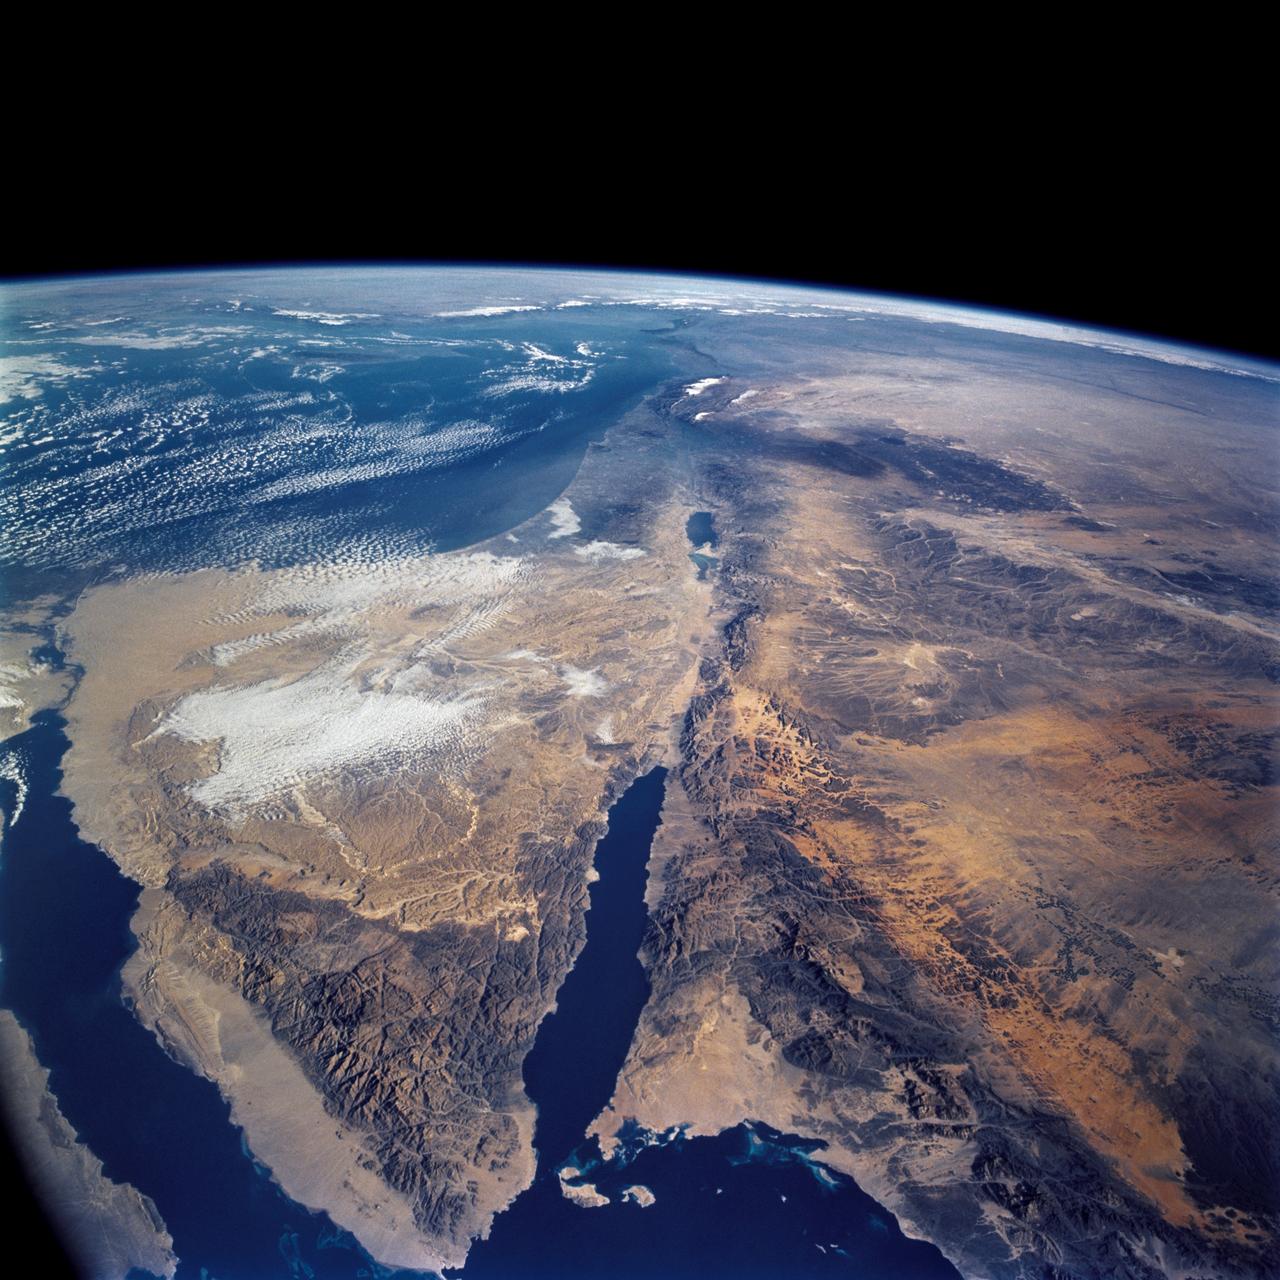
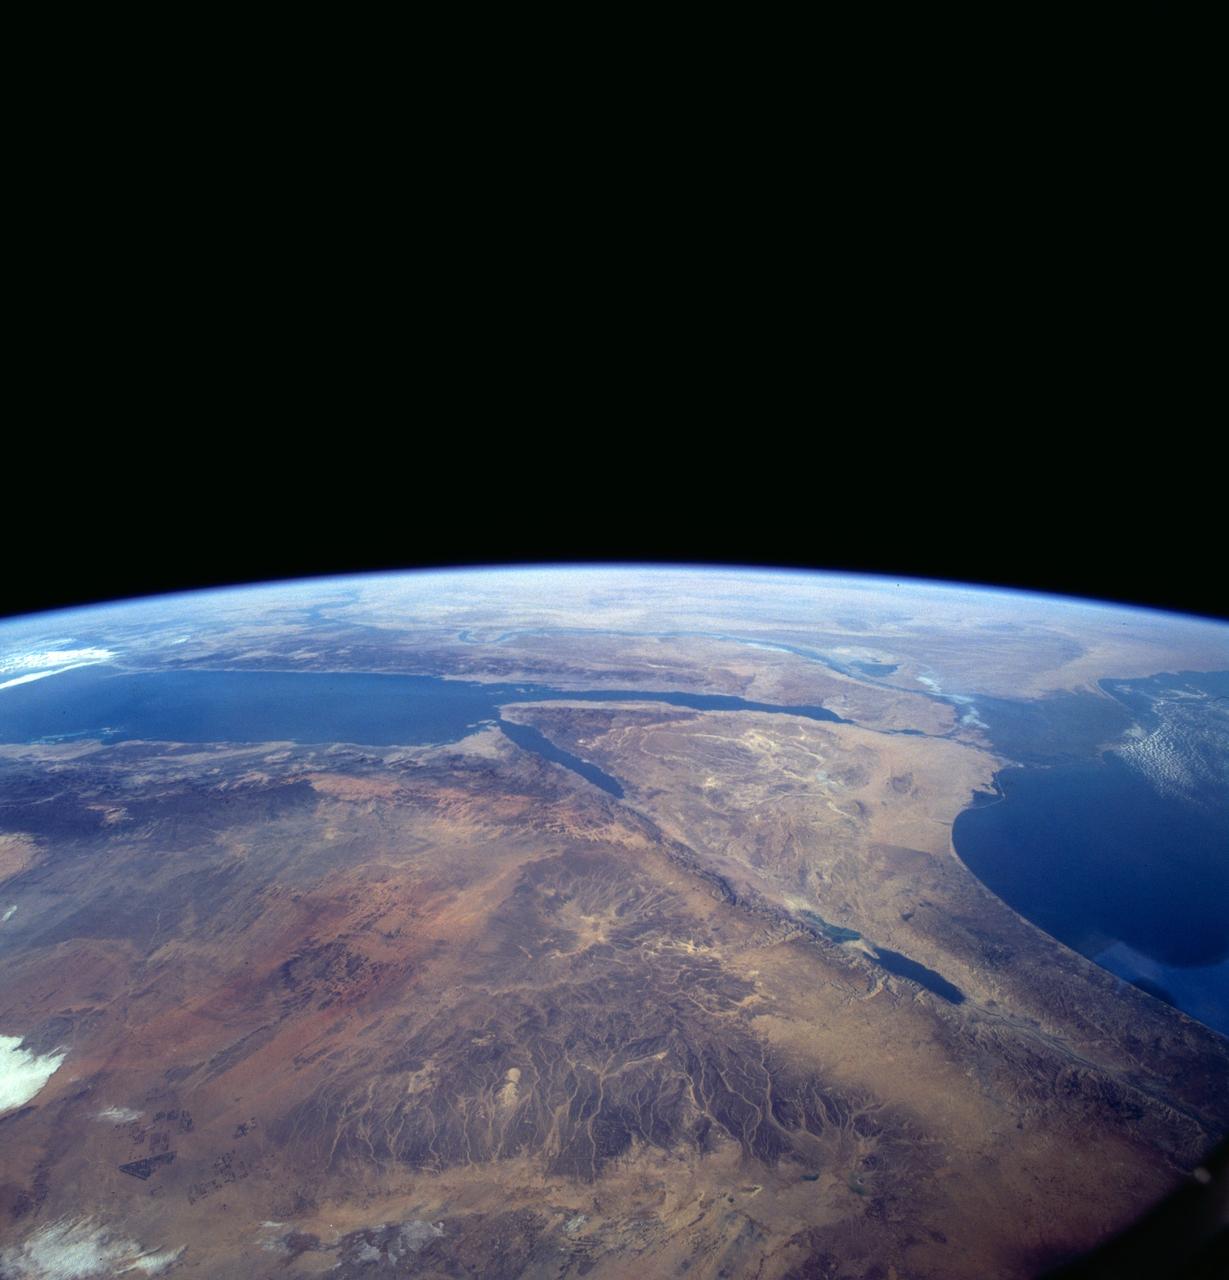
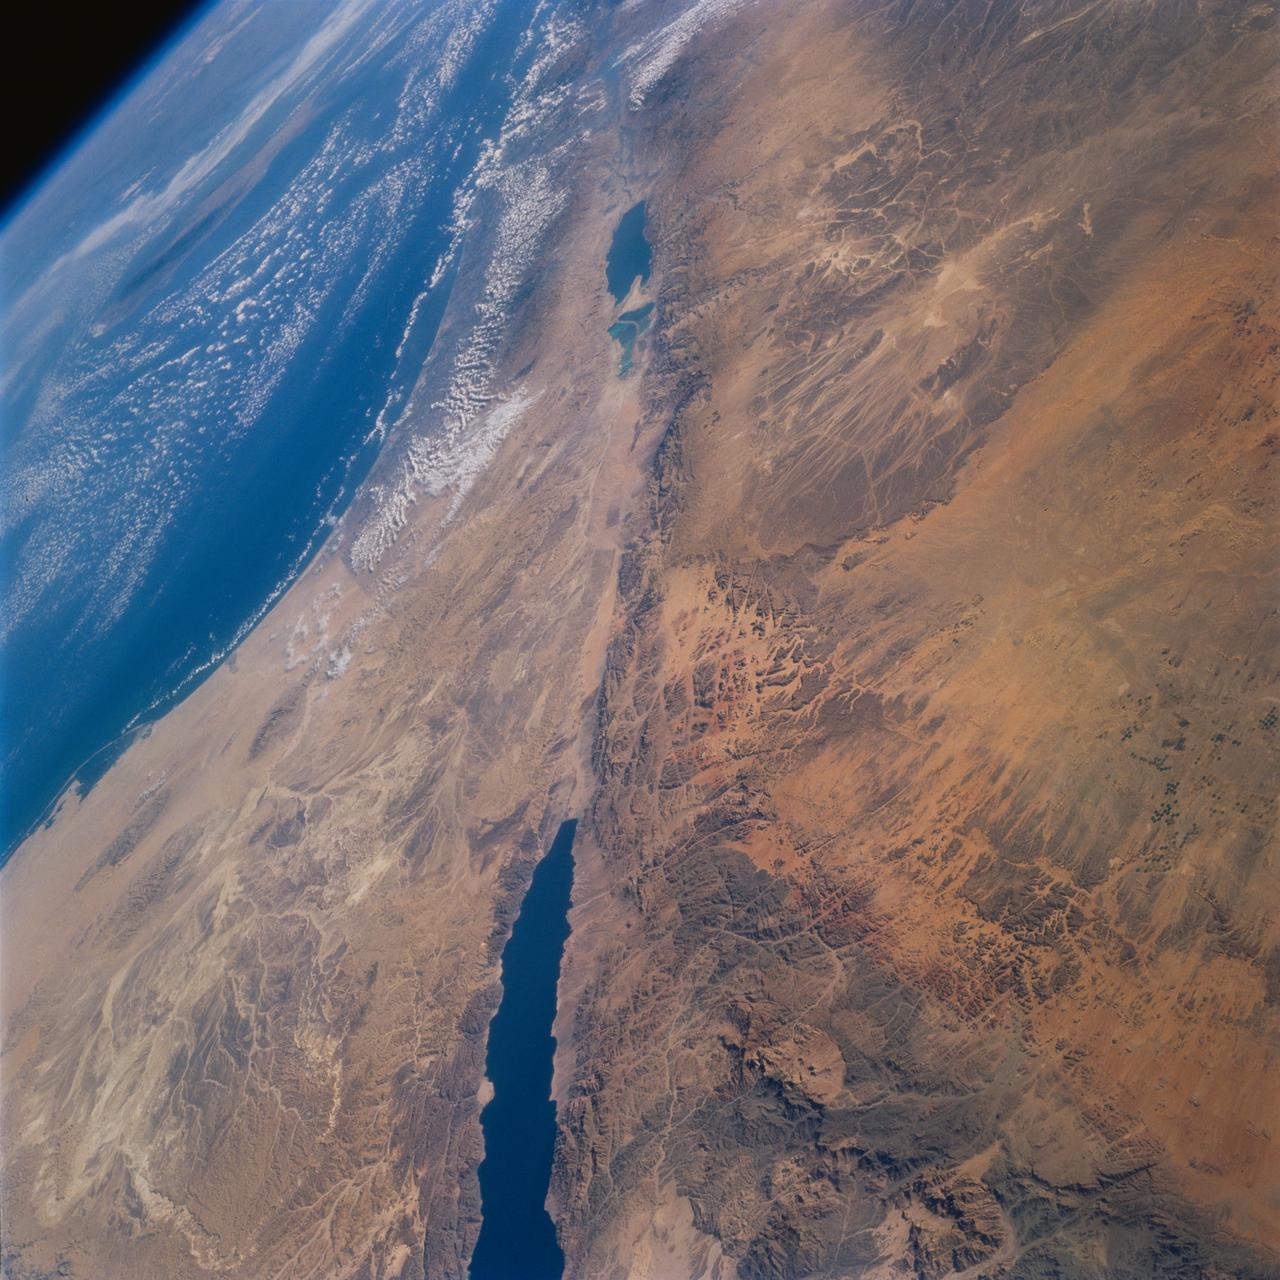
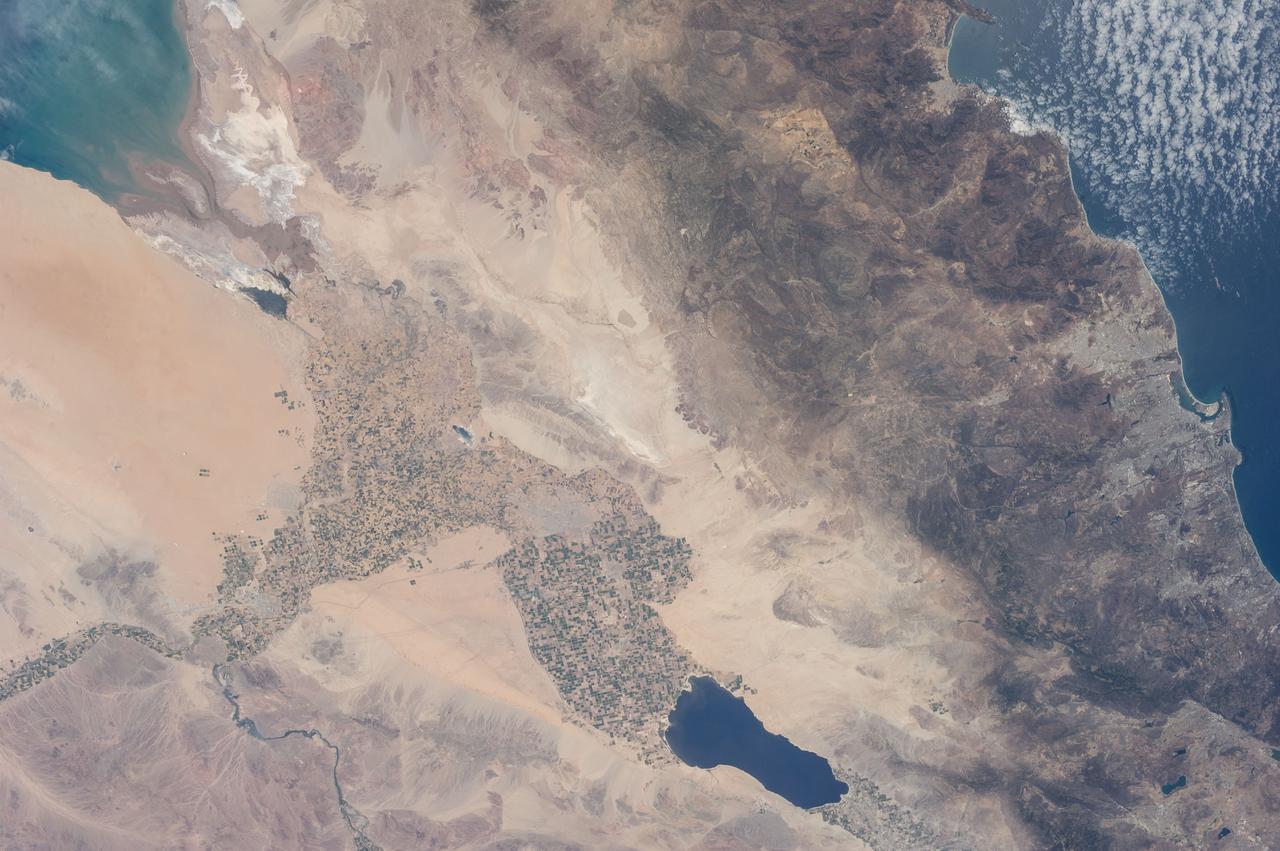
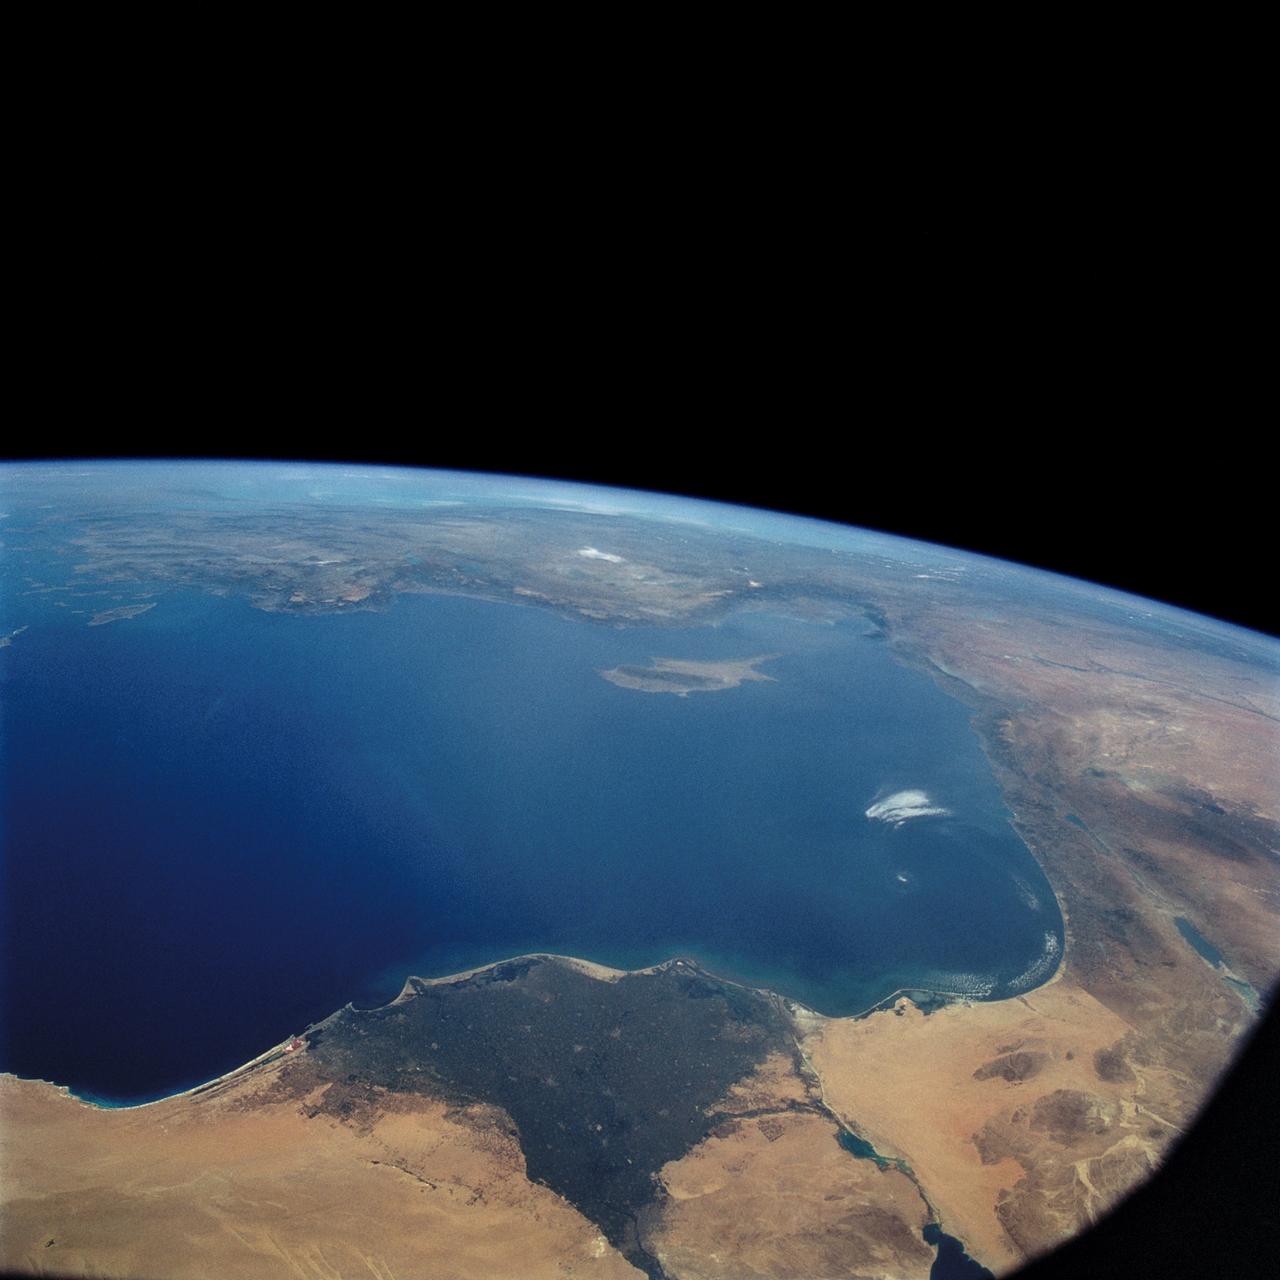
STS109-708-024 (1-12 March 2002) --- The astronauts on board the Space Shuttle Columbia took this 70mm picture featuring the Sinai Peninsula and the Dead Sea Rift. The left side of the view is dominated by the great triangle of the Sinai peninsula, which is partly obscured by an unusual cloud mass on this day. The famous Monastery of St. Catherine lies in the very remote, rugged mountains in the southern third of the peninsula (foreground). The Gulf of Aqaba is a finger of the Red Sea bottom center, pointing north to the Dead Sea, the small body of water near the center of the view. According to NASA scientists studying the STS-109 photo collection, the gulf and the Dead Sea are northerly extensions of the same geological rift that resulted in the opening of the Red Sea . The Gulf of Suez appears in the lower left corner. Northwest Saudi Arabia occupies the lower right side of the view, Jordan and Syria the right and top right, and the Eastern Mediterranean Sea the top left. Thin white lines of cloud have formed along the coastal mountains of southern Turkey and stretch across the top of the view near the Earth's limb.
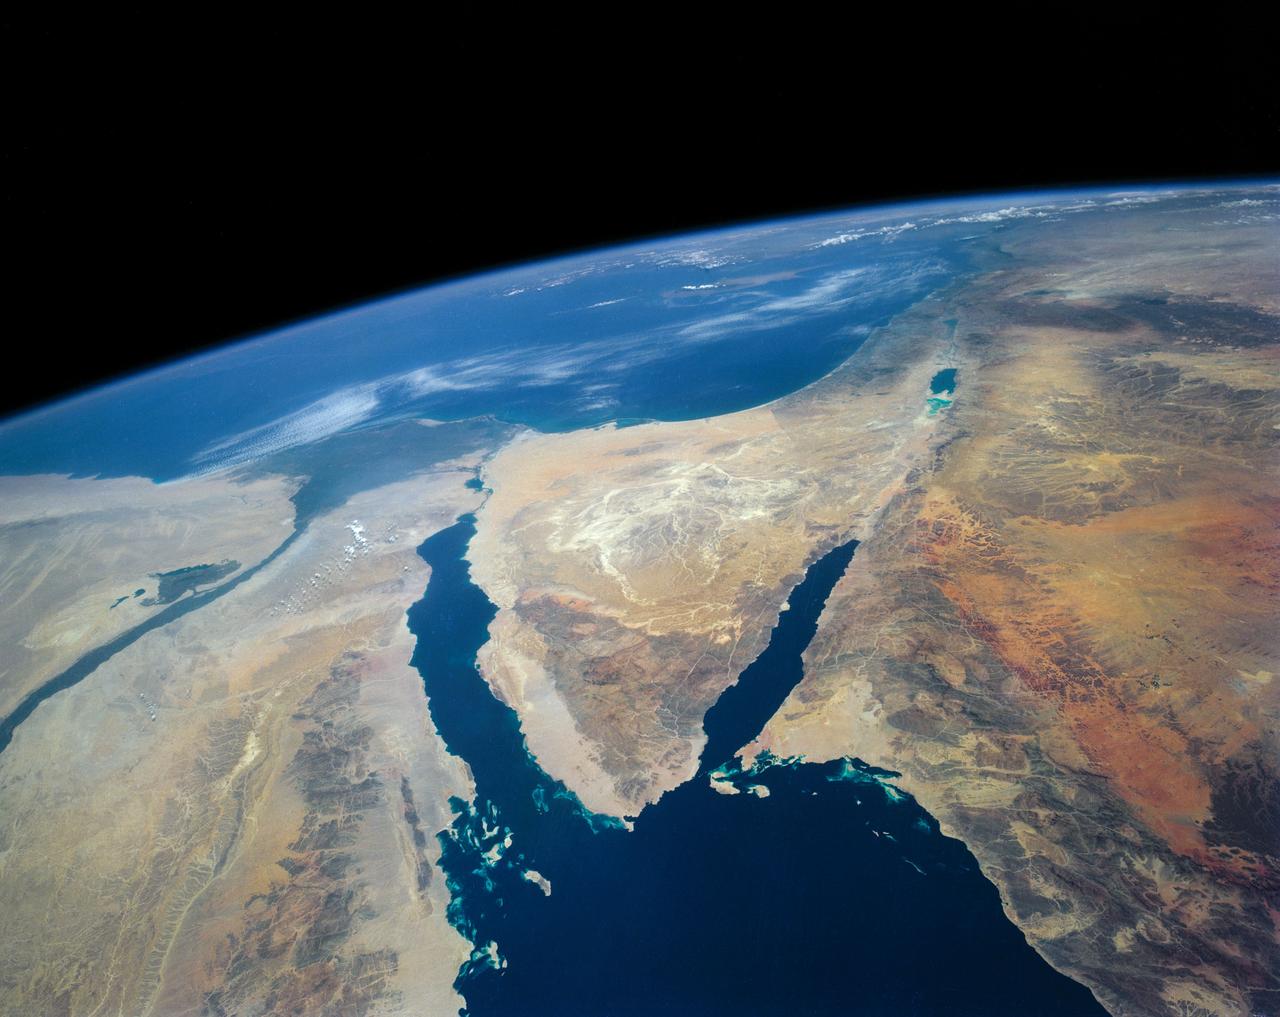
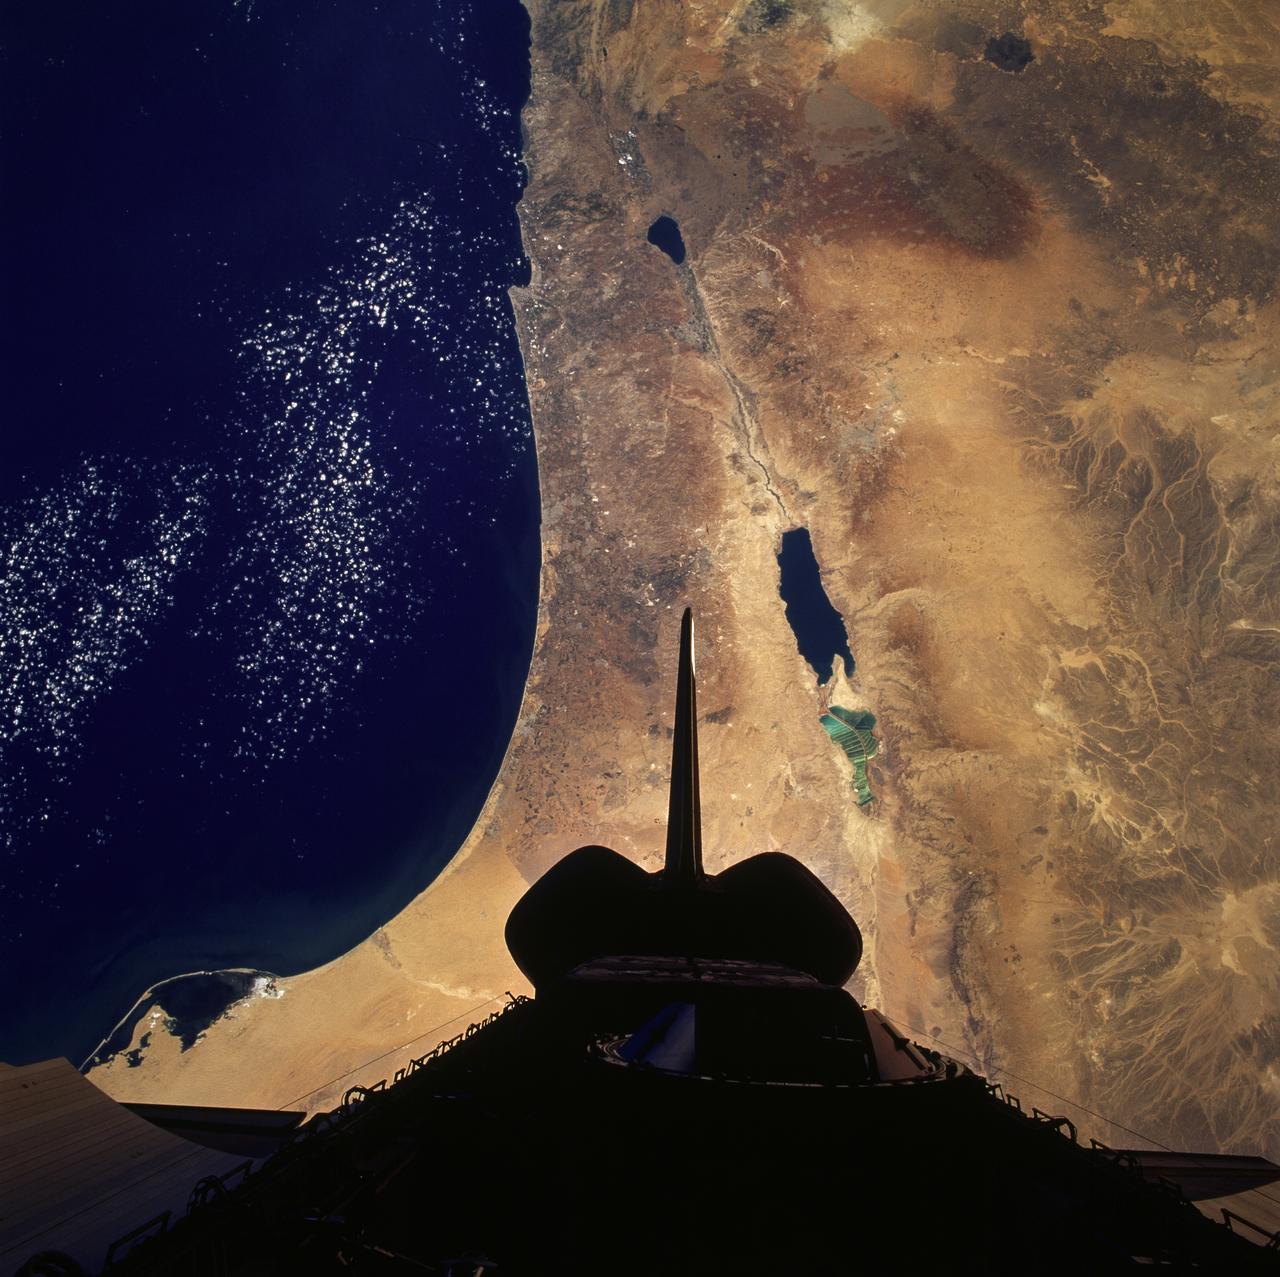
STS040-152-180 (5-24 June 1991) --- The Sinai Peninsula dominates this north-looking, oblique view. According to NASA photo experts studying the STS 40 imagery, the Red Sea in the foreground is clear of river sediment because of the prevailing dry climate of the Middle East. The great rift of the Gulf of Aqaba extends northward to Turkey (top right) through the Dead Sea. The international boundary between Israel and Egypt, reflecting different rural landscapes, stands out clearly. The Nile River runs through the frame. NASA photo experts believe the haze over the Mediterranean to be wind-borne dust. The photo was taken with an Aero-Linhof large format camera.
AST-16-1268 (20 July 1975) --- A near vertical view of a portion of the Mediterranean coast of Turkey and Syria, as photographed from the Apollo spacecraft in Earth orbit during the joint U.S-USSR Apollo-Soyuz Test Project mission. This view covers the Levant Coast north of Beirut, showing the cities of Aleppo, Hamah, Homs and Latakia. The Levantine rift bends to the northeast. This picture was taken with a 70mm Hasselblad camera using high-definition aerial Ektachrome SO-242 type film. The altitude of the spacecraft was 225 kilometers (140 statute miles) when this photograph was taken.
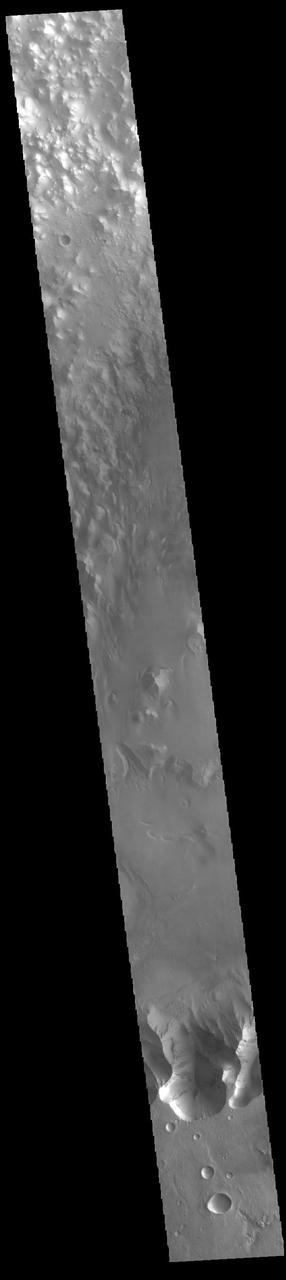
On the north side of Mars' great equatorial rift Valles Marineris lies a large depression called Juventae Chasma. The chasma stretches for 180 kilometers (110 miles) east-west and 250 km (155 miles) north-south. Most of its floor lies 5km (3 miles) or more below the surrounding surface of Lunae Planum. The large outflow channel Maja Valles originates at the northern end of Juventae Chasma. Sand dunes cover a large portion of the floor of Juventae Chasma, visible in the central part of this VIS image. Orbit Number: 85954 Latitude: -3.98251 Longitude: 298.967 Instrument: VIS Captured: 2021-04-30 18:13 https://photojournal.jpl.nasa.gov/catalog/PIA24889
Craters of the Moon National Monument is located in southern Idaho in the Snake River Plain. The Snake River Plain was formed by a series of giant eruptions which started 16 million years ago. The COM flows were erupted between 15,000 and 2,100 years ago. The hotspot that created the eruptions is now under Yellowstone. The COM has some of the best examples of open rift cracks in the world. There are excellent examples of almost every variety of basaltic, as well as tree molds, lava tubes, and many other volcanic features. The image was acquired July 14, 2006, covers an area of 65.2 by 75.4 km, and is located at 43.5 degrees north, 113.5 degrees west. https://photojournal.jpl.nasa.gov/catalog/PIA26501
A high oblique view of the Middle East centered at approximately 28.0 degrees north and 34.0 degrees east. Portions of the countries of Egypt, Israel, Jordan and Saudi Arabia are visible. The Dead Sea Rift Valley continuing into the Gulf of Aqaba marks the boundary between Israel and Jordan. The vegetation change in the Sinai Peninsula is the border between the Gaza Strip and Egypt. In Egypt, the Suez Canal connects the Gulf of Suez with the Mediterranean Sea and forms the western boundary of the Sinai Peninsula. The green ribbon of the Nile River is in marked contrast to this arid region. Even the Jordan River does not support large scale agriculture.
STS077-732-093 (19-29 May 1996) --- This high oblique perspective from the Space Shuttle Endeavour shows the Dead Sea Rift Valley and the surrounding deserts. North is to the right side of the frame. The vegetation line on the coast between Egypt and Israel is clearly visible. Crete is visible in the Mediterranean Sea. The Dead Sea was formed approximately 3 million years ago. A passage opened up to the sea and the water poured in. It is about 1,300 feet below sea level. It is fed by the Jordan River and numerous mineral springs from the surrounding hills. It is estimated to contain 43 million metric tons of salt. The salinity is 32 percent.
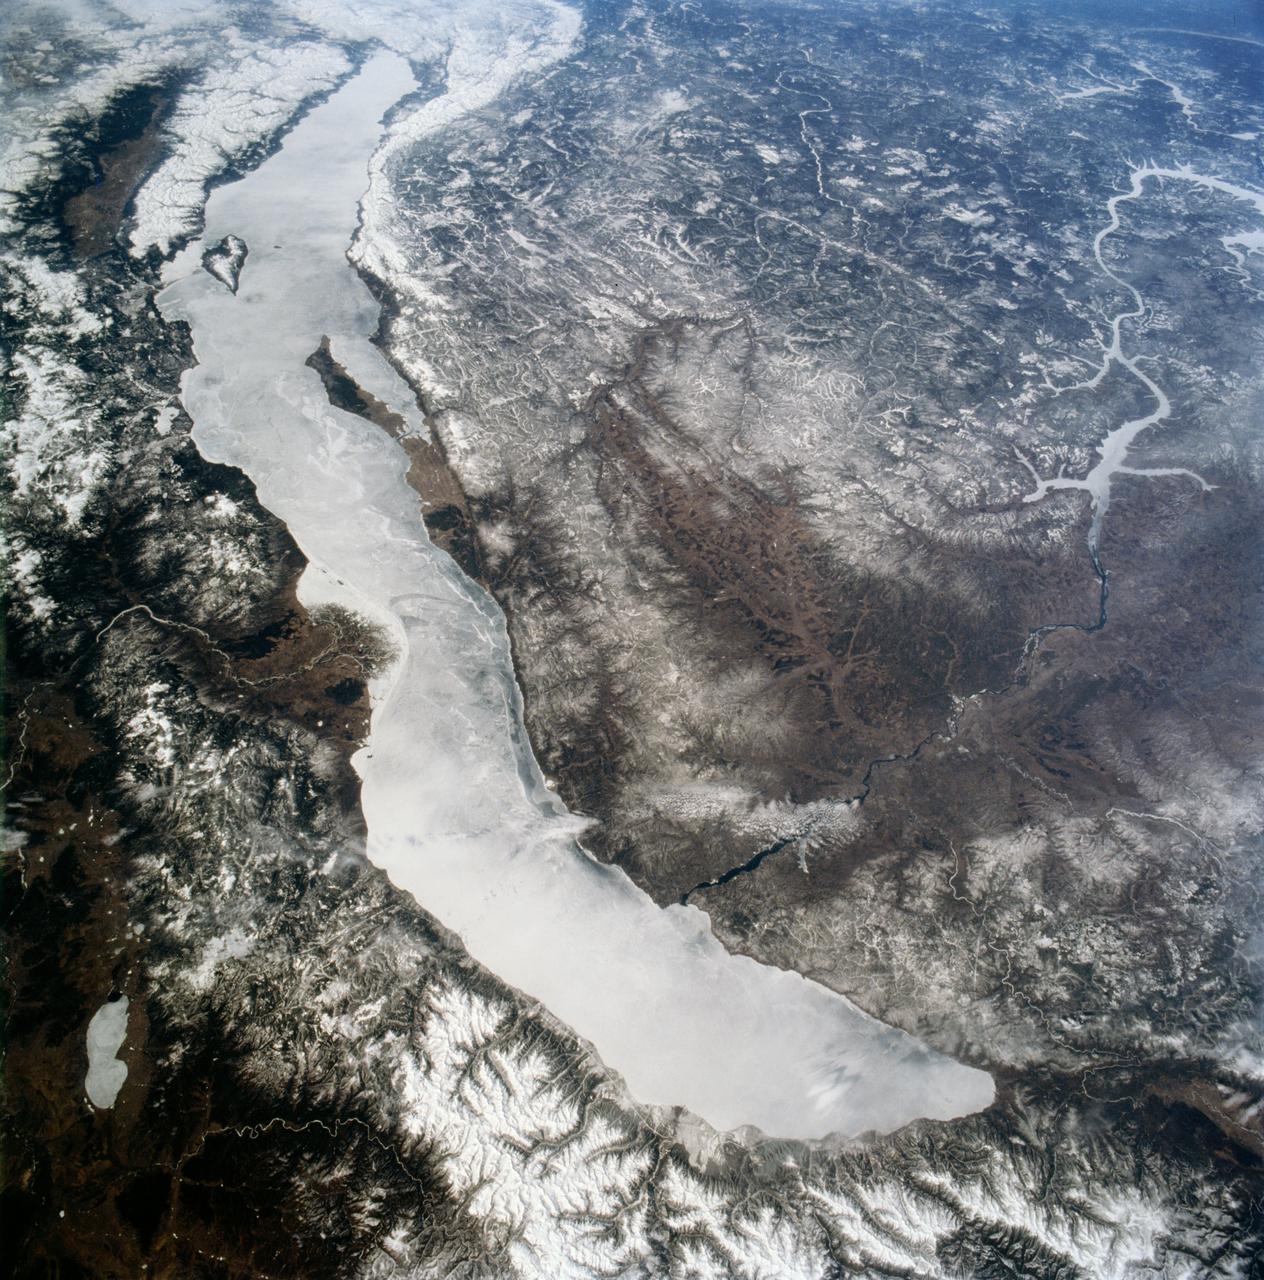
STS059-90-098 (9-20 April 1994) --- Ice-covered Lake Baikal, in Siberia, is about 400 miles long within a major rift valley. The water surface is 455 meters above sea level, but the bottom is 1,295 meters below sea level; the lake represents the largest body of fresh water in the world, except for the Antarctic and Greenland ice sheets. A tributary, the Senusi River, has built a delta on the east side. The Angara River exits the lake to the northwest; the city of Irkutsk is under the small, rippled cloud bank that crosses the river. Hasselblad camera.
STS079-824-081 (16-26 Sept. 1996) --- In this 70mm frame from the space shuttle Atlantis, the Jordan River Valley can be traced as it separates Lebanon, Palestine and Israel on the west, from Syria and Jordan on the east. The river flows along the Dead Sea rift; the east side of the fault zone (Syria, Jordan, Saudi Arabia) has moved north about 100 kilometers relative to the west side (Lebanon, Israel, Egypt) during the past 24 million years. The Dead Sea and Sea of Galilee are in depressions formed where faults of the zone diverge or step over. The Dead Sea once covered the area of salt evaporation pans (the bright blue water). The lagoon, barrier islands and evaporite deposits (bright white) along the Mediterranean coast of the Sinai Peninsula (lower left of frame) are just east of Port Said.
During the 2018 Mars dust storm, we obtained a clear view of the summit of the giant volcano Elysium Mons. We see the western rim and floor of the caldera, and a chain of pits (called a "catena") extending from the caldera towards the north. The chain of pits likely formed by volcanic processes, such as the collapse of a lava tube after it drained. Or by a tectonic process, such as a rift in the rocks below that drained loose material from the surface. An unexpected feature of this catena is the presence of avalanches in two of the pits (marked A and B in the cutout, with the uphill direction towards the top of the image.) The flows in both pits could be ancient, produced during the formation of the catena, but they are not found in the other pits in the chain. They might have formed more recently by the collapse of steep dust deposits like those in a degraded crater to the left of the catena. https://photojournal.jpl.nasa.gov/catalog/PIA22728
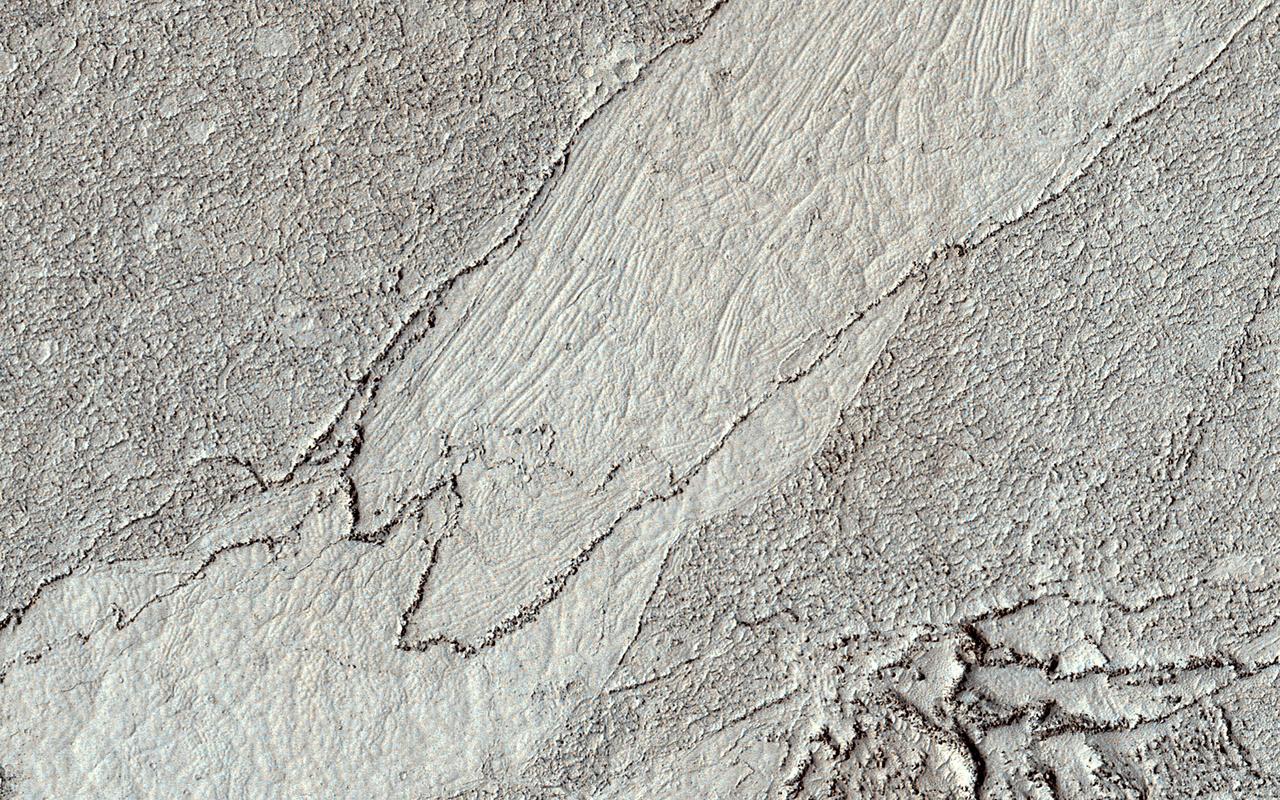
This HiRISE image shows a classic example of platy-ridged lava. Scientists think that this is the same as a lava type called "rubbly pahoehoe" on Earth. In this lava, a crust of rubble forms as the lava partially cools but then tears up its own cover. Eventually, the rubble can form plates that can be rafted apart as the lava cools further, producing textures like those visible on terrestrial lava lakes that have cooled. We see here a complex history of these processes. There are two different shapes of the rubble (at right, and top left/bottom center) indicating two stages of formation. The smooth area at center also is divided into two domains with different polygon styles, indicating that the rift opened, partially cooled, and then opened further. https://photojournal.jpl.nasa.gov/catalog/PIA25948
ISS036-E-011034 (21 June 2013) --- The Salton Trough is featured in this image photographed by an Expedition 36 crew member on the International Space Station. The Imperial and Coachella Valleys of southern California – and the corresponding Mexicali Valley and Colorado River Delta in Mexico – are part of the Salton Trough, a large geologic structure known to geologists as a graben or rift valley that extends into the Gulf of California. The trough is a geologically complex zone formed by interaction of the San Andreas transform fault system that is, broadly speaking, moving southern California towards Alaska; and the northward motion of the Gulf of California segment of the East Pacific Rise that continues to widen the Gulf of California by sea-floor spreading. According to scientists, sediments deposited by the Colorado River have been filling the northern rift valley (the Salton Trough) for the past several million years, excluding the waters of the Gulf of California and providing a fertile environment – together with irrigation—for the development of extensive agriculture in the region (visible as green and yellow-brown fields at center). The Salton Sea, a favorite landmark of astronauts in low Earth orbit, was formed by an irrigation canal rupture in 1905, and today is sustained by agricultural runoff water. A wide array of varying landforms and land uses in the Salton Trough are visible from space. In addition to the agricultural fields and Salton Sea, easily visible metropolitan areas include Yuma, AZ (lower left); Mexicali, Baja California, Mexico (center); and the San Diego-Tijuana conurbation on the Pacific Coast (right). The approximately 72-kilometer-long Algodones Dunefield is visible at lower left.
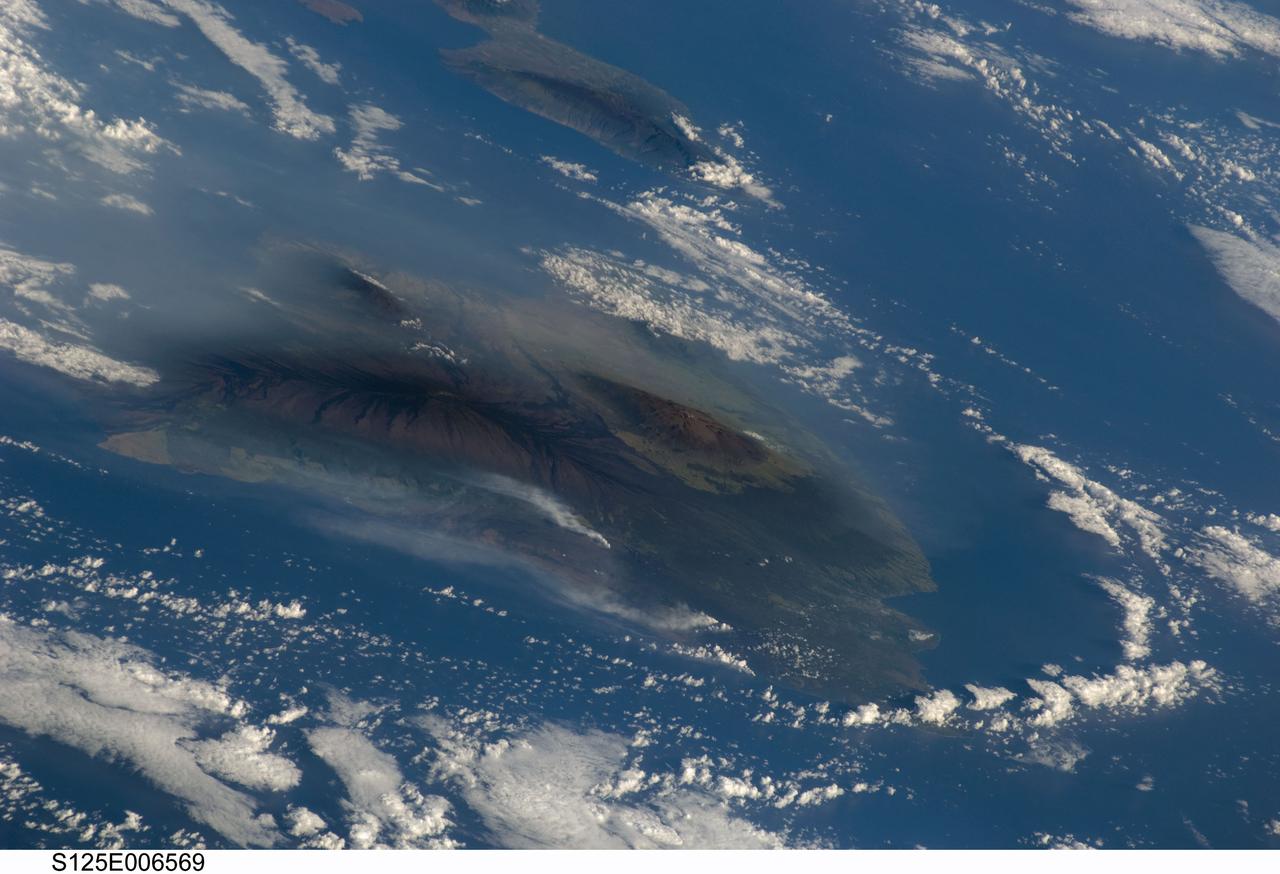
S125-E-006569 (13 May 2009) --- Hawaiian vog from Kilauea volcano, on the island of Hawaii, has been erupting continuously since 1983. This image, taken by the crew of Space Shuttle Atlantis (after completing the capture of the Hubble Space Telescope), shows the volcanic plumes from Kilauea rising up from Halema`uma`u Crater and along the coastline from lava flows entering the ocean from the East rift zone. The volcanic activity has created a blanket of volcanic fog, called vog that envelops the island. The Hawaii Volcano Observatory (HVO) maintains a website (including webcams) that continuously monitors and updates reports on the volcanic activity. Recent maps indicate expanded lava coverage along the coastal plain. In addition, Hawaii?s Department of Health maintains daily vog alerts, and publishes advisories for vog conditions around the ?big island? of Hawaii and the state. When this image was acquired, the region west of Hawaii Volcanoes National Park (downwind from the coastal plumes) had a vog advisory for people with respiratory sensitivities. The Volcano Observatory also reported that ?Lava from east rift zone vents continues to flow through tubes to the coast and is entering the ocean at two locations west of Kalapana. Sulfur dioxide emission rates from the Halema`uma`u and Pu`u `O`o vents remain elevated. Sulfur dioxide emission rates remain elevated and variable; the most recent rate measurement was 1,200 tonnes/day on May 12, compared to the 2003-2007 average rate of 140 tonnes/day. Small amounts of mostly ash-sized tephra continue to be produced consisting mostly of Pele's hair -- irregular pieces of vesicular glass -- and a few hollow spherules.?
Between July 10 and 12, 2017, the Larsen C Ice Shelf in West Antarctica calved one of the largest icebergs in history (named "A-68"), weighing approximately one trillion tons. The rift in the ice shelf that spawned the iceberg has been present on the shelf since at least the beginning of the Landsat era (approximately the 1970s), but remained relatively dormant until around 2012, when it was observed actively moving through a suture zone in the ice shelf (Jansen et al., 2015). Suture zones are wide bands of ice that extend from glacier grounding lines (the boundary between a floating ice shelf and ice resting on bedrock) to the sea comprised of a frozen mixture of glacial ice and sea water, traditionally considered to be stabilizing features in ice shelves. When the Antarctic entered its annual dark period in late April, scientists knew the rift only had a few more miles to go before it completely calved the large iceberg. However, due to the lack of sunlight during the Antarctic winter, visible imagery is generally not available each year between May and August. This frame is from an animation that shows the ice shelf as imaged by the NASA/NOAA satellite Suomi NPP, which features the VIIRS (Visible Infrared Imaging Radiometer Suite) instrument. VIIRS has a day/night panchromatic band capable of collecting nighttime imagery of Earth with a spatial resolution of 2,460 feet (750 meters). An image from the Moderate Resolution Imaging Spectroradiometer (MODIS) instrument on NASA's Terra satellite shows the last cloud-free, daytime image of the ice shelf on April 6; the MODIS thermal imagery band is shown on April 29. The images from May 9 to July 14 show available cloud-free imagery from Suomi NPP. Luckily, despite several cloudy days leading up to the break, the weather mostly cleared on July 11, allowing scientists to see the newly formed iceberg on July 12. The animation is available at https://photojournal.jpl.nasa.gov/catalog/PIA21785
STS066-122-091 (3-14 Nov. 1994) --- This November 1994 view looking south-southeast shows clouds over the Okavango Delta area of northern Botswana. The Okavango is one of the wilder, less spoiled regions of Africa. The area still supports great herds of wild animals such as elephant, zebra and the cape buffalo. Despite conservation efforts from the stable government of Botswana, delta habitats are pressured. The Okavango River (lower left of view) brings water from the high, wet plateaus of Angola into the Kalahari Desert, and enormous inland basin. As a result of a series of small faults (upper center of the view) related to the African Rift System, the river is dammed up in the form of swampy inland delta. Here, water is consumed by evaporation, infiltration, and the swamp forests. Late summer floods take six months to slowly penetrate the 160 kilometer (95 miles) to the other end of the Delta. The visual patterns of the area are strongly linear: straight sand dunes occur in many places and can be seen across the bottom portion of the photograph. Numerous brush-fire scars produce a complex, straight-edged pattern over much of the lower portion of this view. Lake Ngami (upper right of view) was once permanently full as late as the middle 1800's. Changes in the climate of the area over the last 100 years has changed the size and shape of the inland delta.
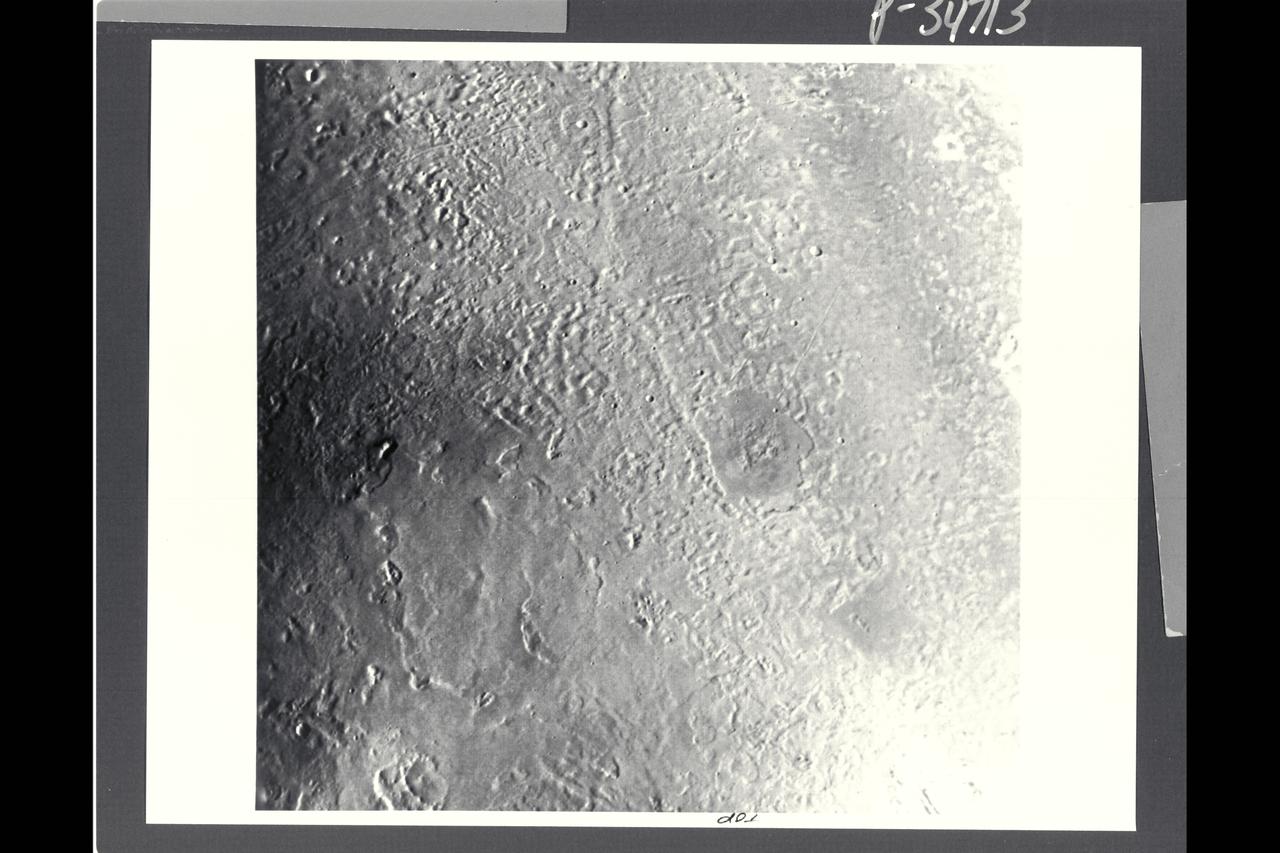
P-34713 This Voyager image of Triton reveals two kinds of mid-latitude terrain. Near the center and the lower half of the frame is a gently rolling terrain pock-marked with a modest number of impact craters. The density of impact craters is somewhat similiar to that found on the mare surface of Earth's moon. Crossing this rolling surface are narrow rifts, one of which grades into a chain of craters that probably are of collapse origin. In the upper right part of the frame is a smooth terrain with very sparse impact craters. This terrain evidently has been formed by flooding of the surface by low-viscosity fluids rather late in geologic time. One of the vents from which these fluids erupted probably is represented by a deep, elongate crater near the middle of the right side of the image. Two slightly dark regions underlain by late eruptive material also occur in the left half of the image. Apparent vents for these eruptions are marked by shallow depressiions, which may have been formed by drain back of material at the end of the eruptive episode.
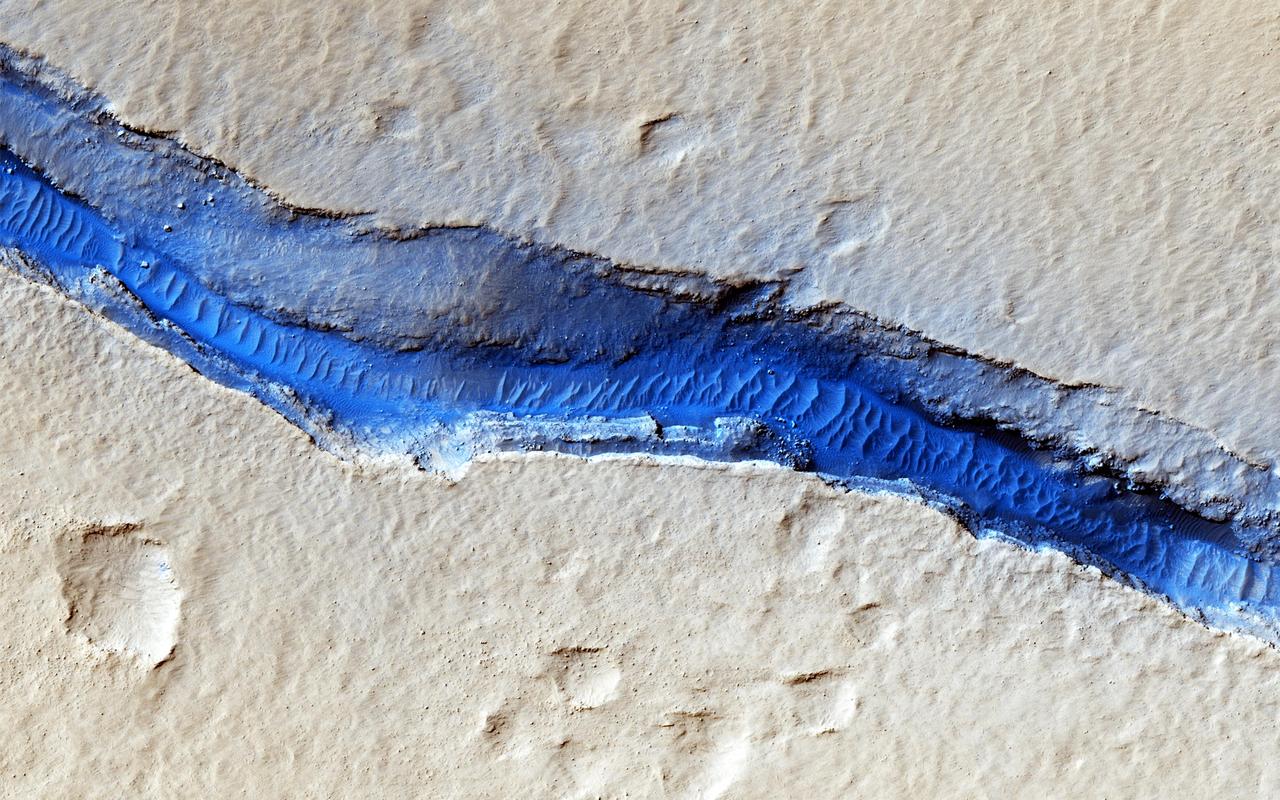
A dominant driver of surface processes on Mars today is aeolian (wind) activity. In many cases, sediment from this activity is trapped in low-lying areas, such as craters. Aeolian features in the form of dunes and ripples can occur in many places on Mars depending upon regional wind regimes. The Cerberus Fossae are a series of discontinuous fissures along dusty plains in the southeastern region of Elysium Planitia. This rift zone is thought to be the result of combined volcano-tectonic processes. Dark sediment has accumulated in areas along the floor of these fissures as well as inactive ripple-like aeolian bedforms known as "transverse aeolian ridges" (TAR). Viewed through HiRISE infrared color, the basaltic sand lining the fissures' floor stands out as deep blue against the light-toned dust covering the region. This, along with the linearity of the fissures and the wave-like appearance of the TAR, give the viewer an impression of a river cutting through the Martian plains. However, this river of sand does not appear to be flowing. Analyses of annual monitoring images of this region have not detected aeolian activity in the form of ripple migration thus far. http://photojournal.jpl.nasa.gov/catalog/PIA21063
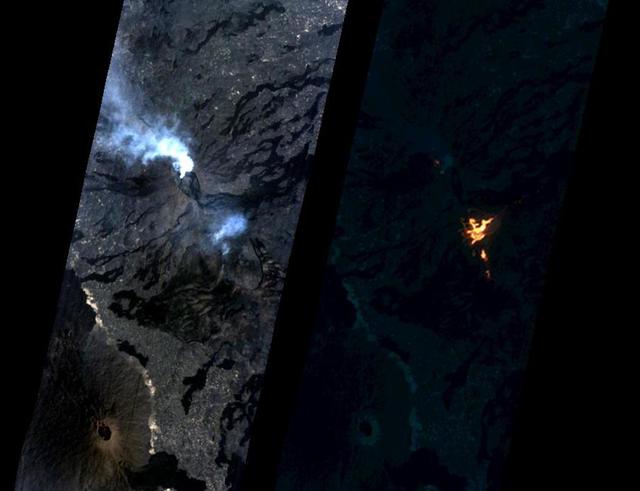
On Jan. 24, 2017, the Hyperion Imager on NASA's Earth Observing 1 (EO-1) spacecraft observed a new eruption at Erta'Ale volcano, Ethiopia, from an altitude of 438 miles (705 kilometers). Data were collected at a resolution of 98 feet (30 meters) per pixel at different visible and infrared wavelengths and were combined to create these images. A visible-wavelength image is on the left. An infrared image is shown on the right. The infrared image emphasizes the hottest areas and reveals a spectacular rift eruption, where a crack opens and lava gushes forth, fountaining into the air. The lava flows spread away from the crack. Erta'Ale is the location of a long-lived lava lake, and it remains to be seen if this survives this new eruption. The observation was scheduled via the Volcano Sensor Web, a network of sensors linked by artificial intelligence software to create an autonomous global monitoring program of satellite observations of volcanoes. The Volcano Sensor Web was alerted to this new activity by data from another spacecraft. http://photojournal.jpl.nasa.gov/catalog/PIA11239
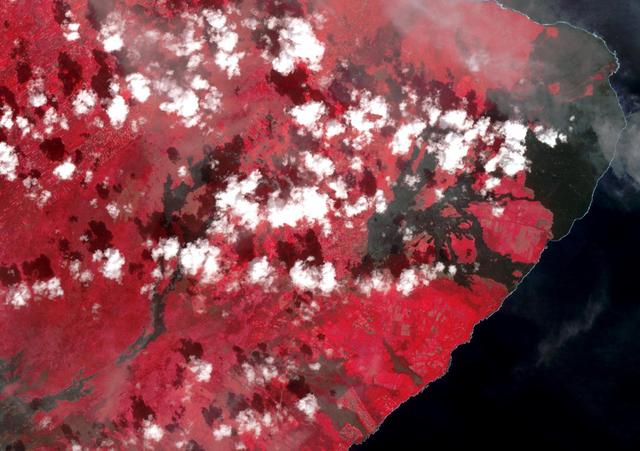
This image from NASA's Advanced Spaceborne Thermal Emission and Reflection Radiometer (ASTER) instrument on NASA's Terra spacecraft show recent eruptions of Kilauea volcano on the island of Hawaii (the Big Island). Following days of increased seismic activity, Kilauea erupted May 3, 2018, and triggered a number of additional fissure eruptions along the East Rift Zone. The eruptions and high level of sulfur dioxide gas (SO2) prompted evacuations in the area, including the Leilani Estates subdivision near the town of Pahoa. The ASTER images, acquired on May 6, 2018, show different aspects of the eruption. A color composite depicts vegetation in red, and old lava flows in black and gray. Superimposed on the image in yellow are hotspots detected on the thermal infrared bands. The easternmost hot spots show the newly formed fissures and the lava flow spilling to the northwest. The middle spots are Pu'u O'o crater, and lava flows descending the slopes to the southeast. The westernmost area is the crater and lava lake on Kilauea's summit. The greenish area southwest of Pu'u O'o is ash deposits from its short eruption on Friday. The inset shows the massive sulfur dioxide plume is shown in yellow and yellow-green, extracted from ASTER's multiple thermal bands. A smaller, but thicker, sulfur dioxide gas plume can be seen coming from Kilauea. The prevailing trade winds blow the plumes to the southwest, out over the ocean. The images cover an area of 57.8 by 63 kilometers, and are located at 19.3 degrees North, 155.1 degrees West. https://photojournal.jpl.nasa.gov/catalog/PIA22450
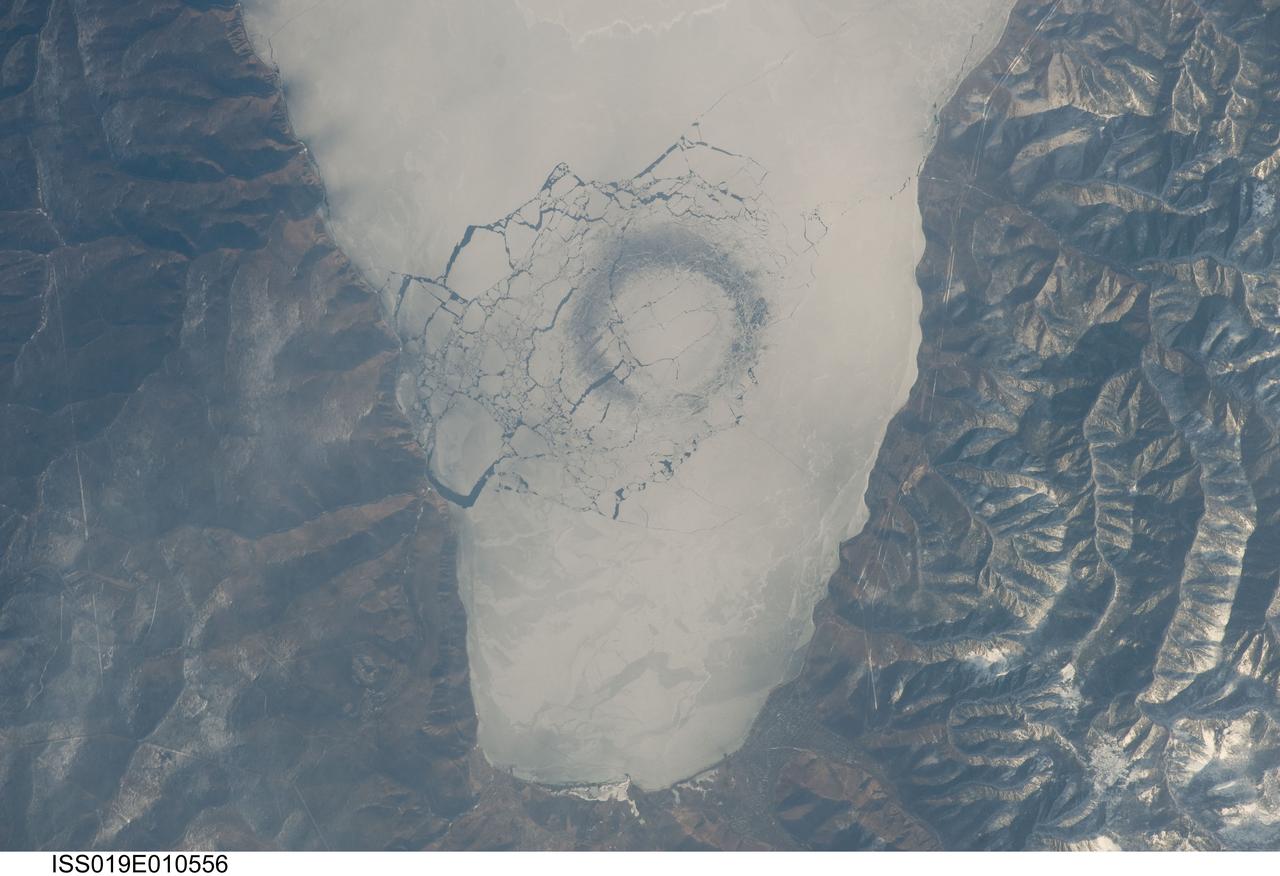
ISS019-E-010556 (23 April 2009) --- A circle in thin ice in Lake Baikal, Russia is featured in this image photographed by an Expedition 19 crewmember on the International Space Station. Late in April 2009, astronauts aboard the station observed a strange circular area of thinned ice (dark in color, with a diameter of about 4.4 kilometers) in the southern end of Lake Baikal in southern Siberia. Lake Baikal is unique in many regards. It is the largest (by volume) and deepest (1,637 meters at the deepest point) fresh water lake on Earth and, as a World Heritage Site, is considered one of Russia?s environmental jewels. The lake?s long, thin and deep profile results from its location in the Baikal Rift valley in Siberia. According to scientists, it is also one of the world?s oldest lakes (25-30 million years old); it contains up to 7 kilometers of sediment deposited on the bottom, and is home to an amazing array of plants and animals, many being found only in Lake Baikal. The lake?s biodiversity includes fresh water seals and several species of fish that are not found elsewhere on Earth. Siberia is remote and cold; ice cover can persist into June. This detailed image shows a circle of thin ice, which is the focal point for ice break up in the very southern end of the lake. While the origin of the circles is unknown, the peculiar pattern suggests convection in the lake?s water column. Ice cover changes rapidly at this time of year. Within a day, the ice can melt almost completely, and then freeze again overnight. Throughout April, the circles are persistent ? they appear when ice cover forms, and then disappear as ice melts. The pattern and appearance suggests that the ice is quite thin.
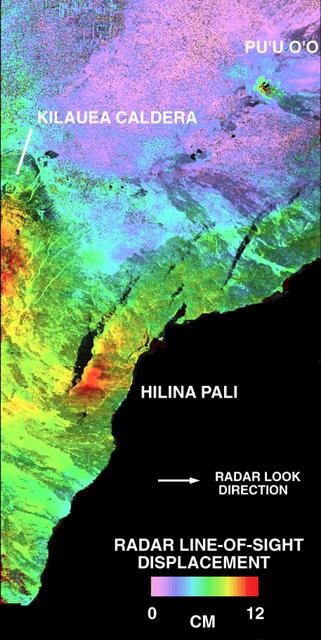
This is a deformation map of the south flank of Kilauea volcano on the big island of Hawaii, centered at 19.5 degrees north latitude and 155.25 degrees west longitude. The map was created by combining interferometric radar data -- that is data acquired on different passes of the space shuttle which are then overlayed to obtain elevation information -- acquired by the Spaceborne Imaging Radar-C/X-band Synthetic Aperture Radar during its first flight in April 1994 and its second flight in October 1994. The area shown is approximately 40 kilometers by 80 kilometers (25 miles by 50 miles). North is toward the upper left of the image. The colors indicate the displacement of the surface in the direction that the radar instrument was pointed (toward the right of the image) in the six months between images. The analysis of ground movement is preliminary, but appears consistent with the motions detected by the Global Positioning System ground receivers that have been used over the past five years. The south flank of the Kilauea volcano is among the most rapidly deforming terrains on Earth. Several regions show motions over the six-month time period. Most obvious is at the base of Hilina Pali, where 10 centimeters (4 inches) or more of crustal deformation can be seen in a concentrated area near the coastline. On a more localized scale, the currently active Pu'u O'o summit also shows about 10 centimeters (4 inches) of change near the vent area. Finally, there are indications of additional movement along the upper southwest rift zone, just below the Kilauea caldera in the image. Deformation of the south flank is believed to be the result of movements along faults deep beneath the surface of the volcano, as well as injections of magma, or molten rock, into the volcano's "plumbing" system. Detection of ground motions from space has proven to be a unique capability of imaging radar technology. Scientists hope to use deformation data acquired by SIR-C/X-SAR and future imaging radar missions to help in better understanding the processes responsible for volcanic eruptions and earthquakes. http://photojournal.jpl.nasa.gov/catalog/PIA01758
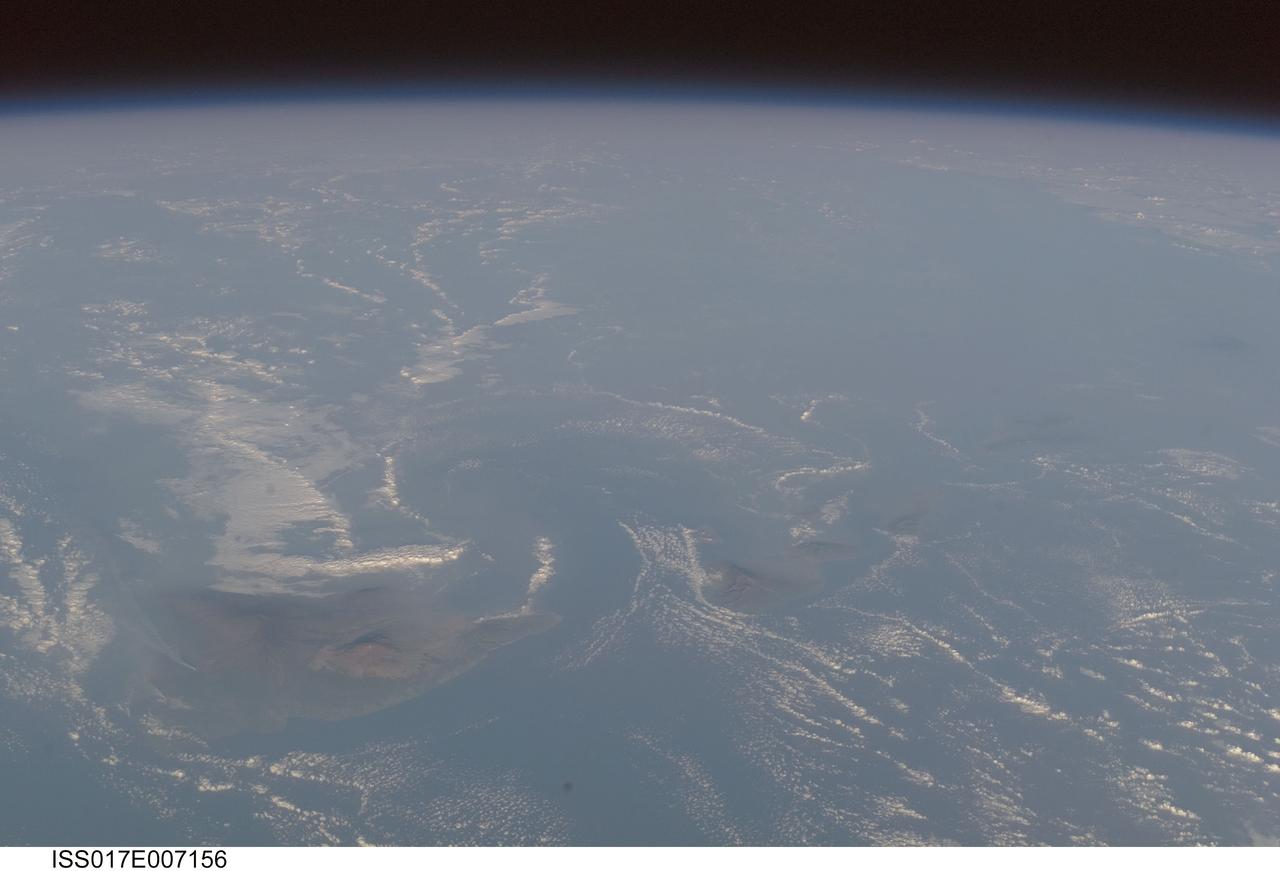
ISS017-E-007156 (17 May 2008) --- Volcanic plumes and volcanic fog in Hawaii are featured in this image photographed by an Expedition 17 crewmember on the International Space Station. For 25 years, Kilauea volcano on Hawaii's Big Island has been erupting continuously. Recent explosive activity that started in March 2008 is producing increased emissions of sulfur dioxide (SO2). These emissions result in a widespread caustic volcanic fog -- known as vog -- that, depending on local winds, drifts as much as 200 miles up the volcanic chain, burning throats and eyes, and inducing asthma attacks as far away as Honolulu, on the island of Oahu. An oblique view of the Hawaiian islands taken from the International Space Station -- viewed looking towards the southwest, rather than "straight down" relative to the station -- on a hazy spring day includes a regional view of three volcanic plumes from Kilauea that contribute to the vog: the plume from Halema'uma'u crater near the summit, a plume from Pu'u O'o vent along the east rift, and a plume from where lava enters the ocean on the coast outside of the park boundaries. At the time this image was taken, doctors throughout the state of Hawaii were reporting an increased caseload of people with respiratory problems. Aside from the vog, this view captures cloud formations indicative of both the large-scale air flow and the local wind patterns around the islands. The parallel lines of clouds aligned roughly northeast to southwest reveal the direction of the region's prevailing trade winds; that flow is disrupted around the islands (between Hawaii and Maui, at right), and further influenced by the local land/sea breeze which at that time had driven the cloud formations offshore and circling the islands. In addition to the Kilauea plumes, the volcanoes of Mauna Loa and Mauna Kea are also visible on the island of Hawaii (center). The uninhabited island of Kaho'olawe is just visible to the southwest of Maui.
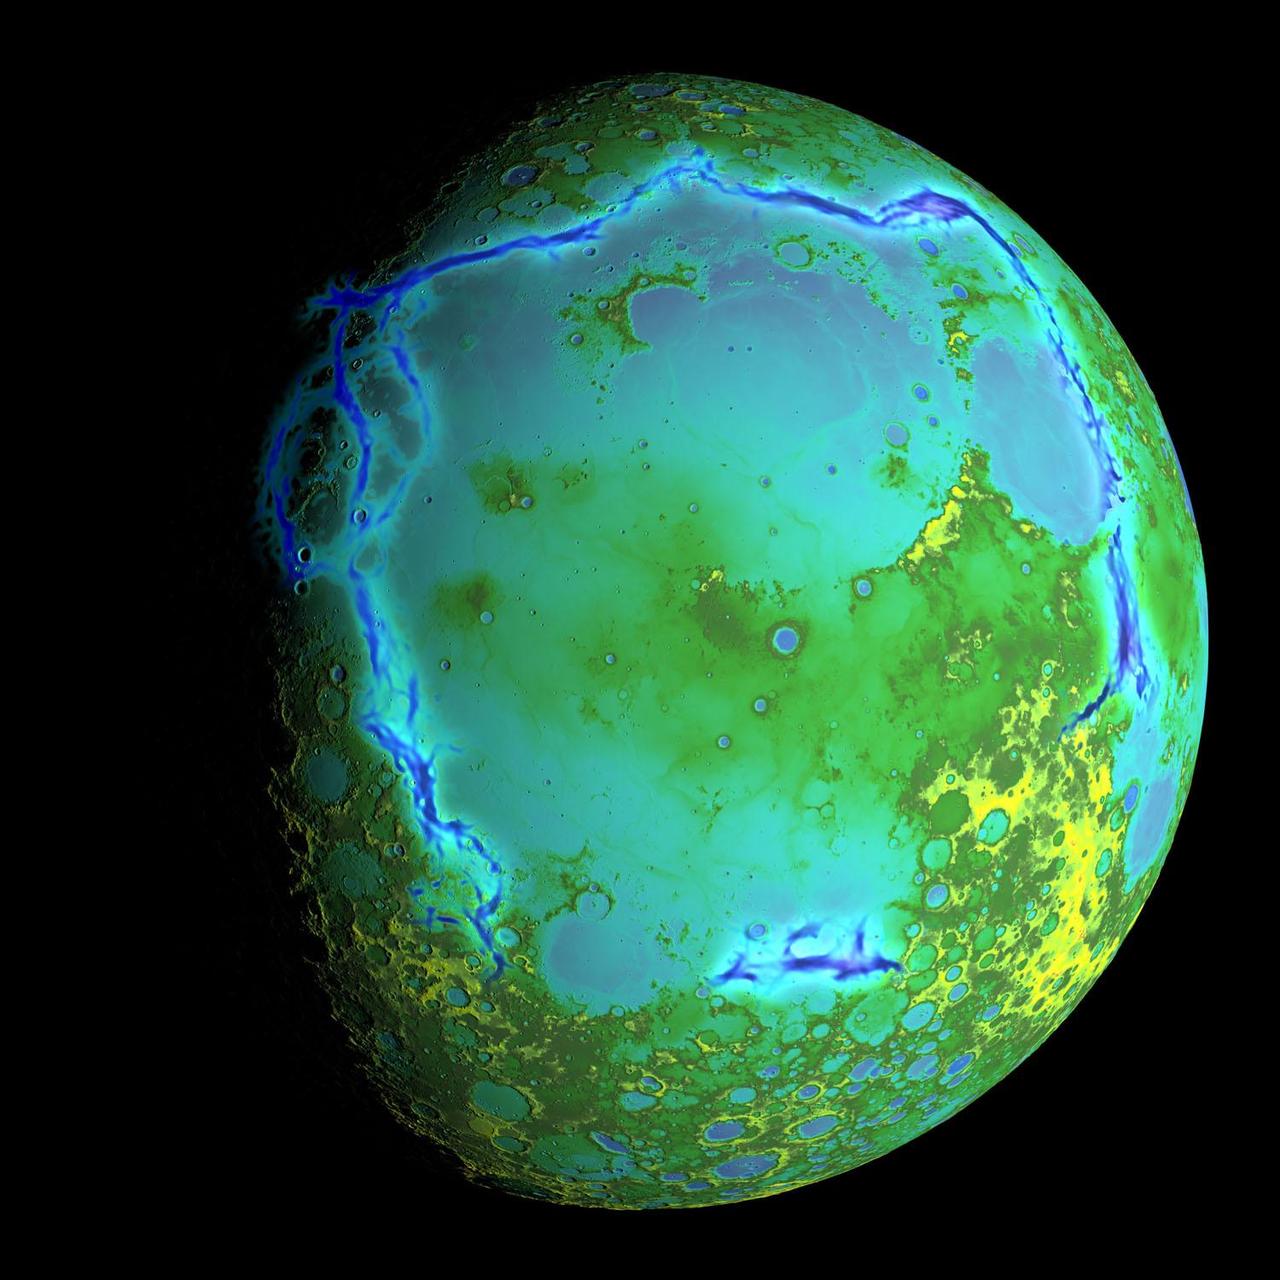
Topography of Earth's moon generated from data collected by the Lunar Orbiter Laser Altimeter, aboard NASA's Lunar Reconnaissance Orbiter, with the gravity anomalies bordering the Procellarum region superimposed in blue. The border structures are shown using gravity gradients calculated with data from NASA's Gravity Recovery and Interior Laboratory (GRAIL) mission. These gravity anomalies are interpreted as ancient lava-flooded rift zones buried beneath the volcanic plains (or maria) on the nearside of the Moon. Launched as GRAIL A and GRAIL B in September 2011, the probes, renamed Ebb and Flow, operated in a nearly circular orbit near the poles of the moon at an altitude of about 34 miles (55 kilometers) until their mission ended in December 2012. The distance between the twin probes changed slightly as they flew over areas of greater and lesser gravity caused by visible features, such as mountains and craters, and by masses hidden beneath the lunar surface. The twin spacecraft flew in a nearly circular orbit until the end of the mission on Dec. 17, 2012, when the probes intentionally were sent into the moon's surface. NASA later named the impact site in honor of late astronaut Sally K. Ride, who was America's first woman in space and a member of the GRAIL mission team. GRAIL's prime and extended science missions generated the highest-resolution gravity field map of any celestial body. The map will provide a better understanding of how Earth and other rocky planets in the solar system formed and evolved. The GRAIL mission was managed by NASA's Jet Propulsion Laboratory (JPL) in Pasadena, California, for NASA's Science Mission Directorate in Washington. The mission was part of the Discovery Program managed at NASA's Marshall Space Flight Center in Huntsville, Alabama. GRAIL was built by Lockheed Martin Space Systems in Denver. For more information about GRAIL, please visit <a href="http://grail.nasa.gov" rel="nofollow">grail.nasa.gov</a>. Credit: NASA/Colorado School of Mines/MIT/GSFC/Scientific Visualization Studio
STS057-73-075 (21 June-1 July 1993) --- Eastern Mediterranean from an unusually high vantage point over the Nile River, this north-looking view shows not only the eastern Mediterranean but also the entire landmass of Asia Minor, with the Black Sea dimly visible at the horizon. Many of the Greek islands can be seen in the Aegean Sea (top left), off the coast of Asia Minor. Cyprus is visible under atmospheric dust in the northeast corner of the Mediterranean. The dust cloud covers the east end of the Mediterranean, its western edge demarcated by a line that cuts the center of the Nile Delta. This dust cloud originated far to the west, in Algeria, and moved northeast over Sicily, southern Italy, and Greece. Part of the cloud then moved on over the Black Sea, but another part swerved southward back towards Egypt. A gyre of clouds in the southeast corner of the Mediterranean indicates a complementary counterclockwise (cyclonic) circulation of air. The Euphrates River appears as a thin green line (upper right) in the yellow Syrian Desert just south of the blue-green mountains of Turkey. The Dead Sea (lower right) lies in a rift valley which extends north into Turkey and south thousands of miles down the Gulf of Aqaba, the Red Sea, and on through East Africa. The straight international boundary between Israel and Egypt (where the coastline angles) is particularly clear in this view, marked by the thicker vegetation on the Israeli side of the border. The green delta of the Nile River appears in the foreground, with the great conurbation of Cairo seen as a gray area at the apex of the triangle. Most of Egypt's 52 million inhabitants live in the delta. On the east side of the delta, the Suez Canal is visible. On the western corner of the delta lies the ancient city of Alexandria, beside the orange and white salt pans. The World War II battlesite El Alamein lies on the coast.
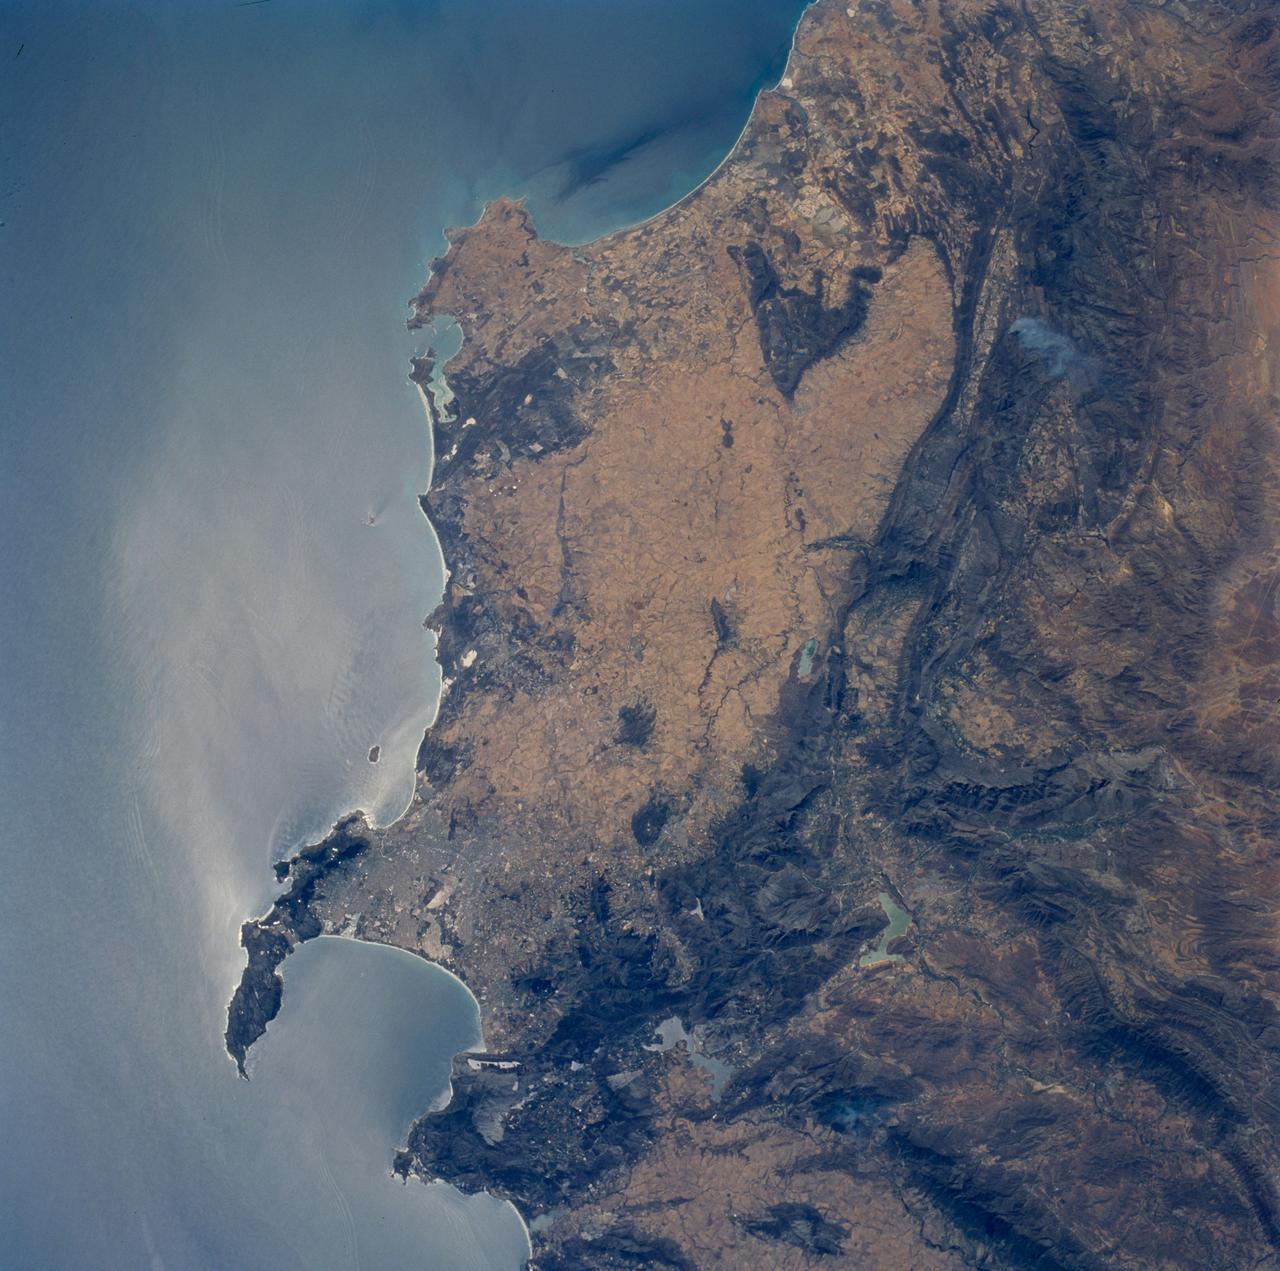
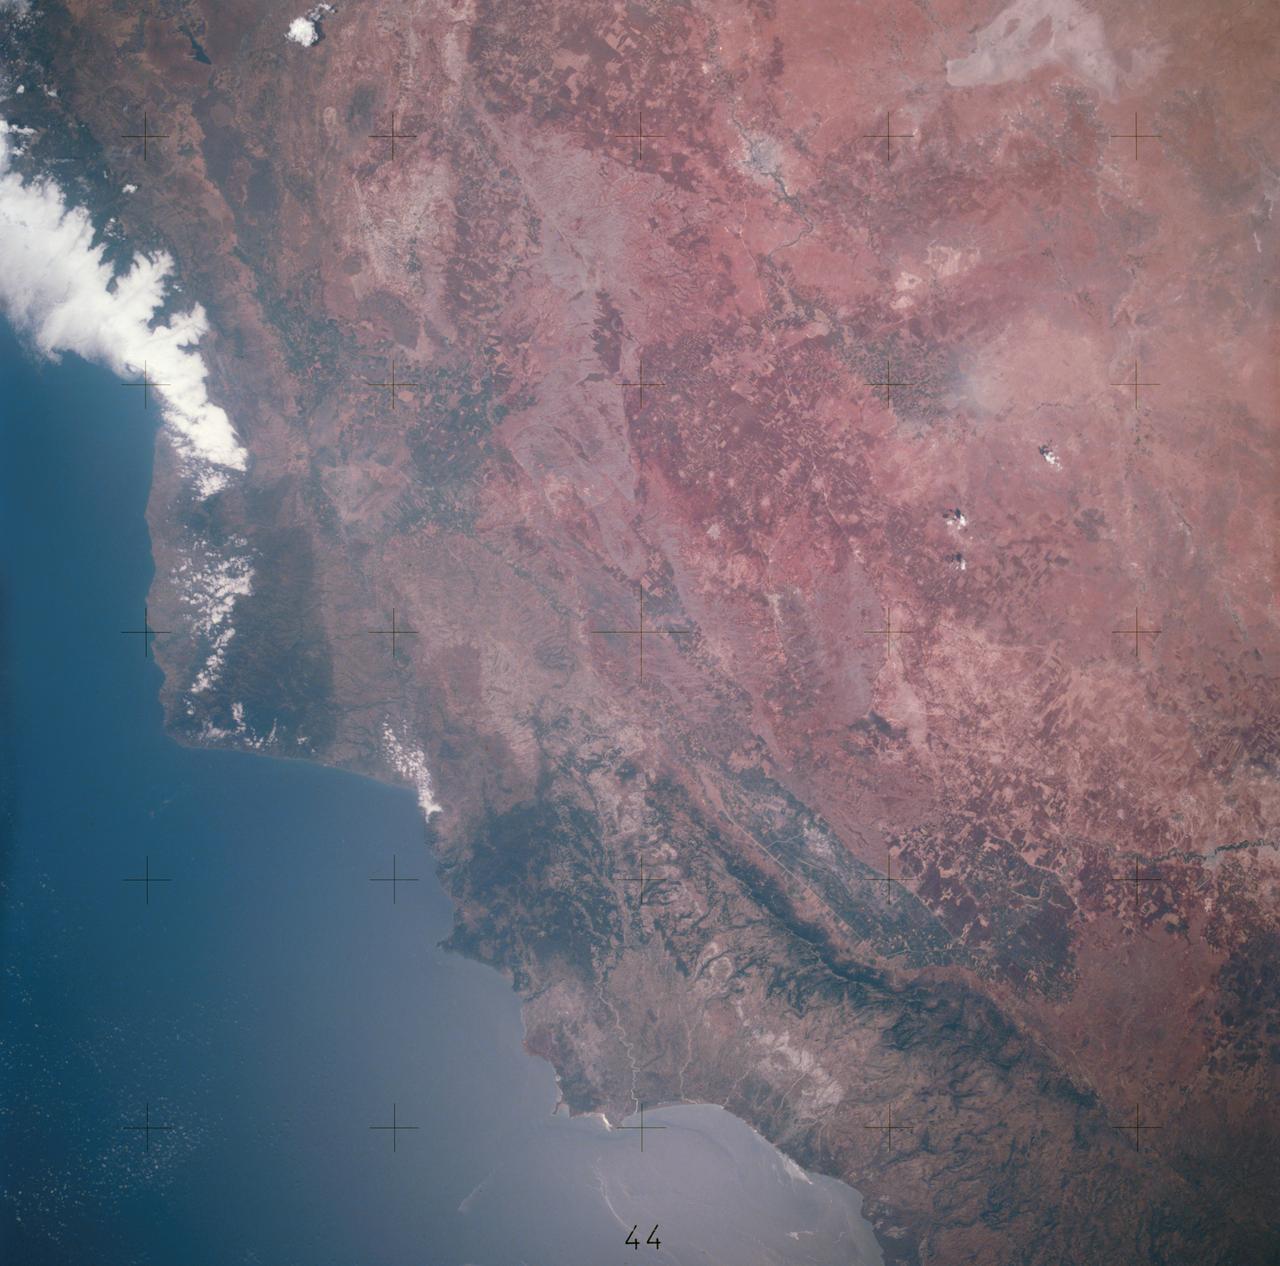
STS089-706-068 (22-31 Jan. 1998) --- This nadir view of the southern Cape District of South Africa was photographed with a 70mm handheld camera from the Earth-orbiting space shuttle Endeavour. Prominent landmarks are the Cape of Good Hope, False Bay and Cape Town. Cape Town is the gray area at the base of the peninsula that forms the Cape of Good Hope. East and north of Cape Town the dark mountain ranges are the Cape Fold Belt. Northerly structures of the region formed approximately 580 million years ago when east Antarctica, Africa and parts of South America combined. According to NASA scientists those continents separated and then recombined about 230 million years ago; in the later event, the northerly structures were again active and the west-trending folds of the Great and Little Karroo ranges formed. The westerly structures of the Karroo formed somewhat later; the northerly structures were re-folded at that time. The great continental mass, Gondwana, remained together until around 175 million years ago, when it rifted apart leaving the coastline essentially as it is seen today. Photos such as this are useful to geologists working in these areas as they provide, quite literally, the big picture in complex regions. Other items of interest are the internal waves noted offshore, several trains can be seen east, north and south of Cape Town. In the mountains to the north (upper left corner) a large brush fire is seen from the smoke plume. The giant gold and diamond mines are located northeast and east of this photo. The gold province is primarily located around Johannesburg (450 miles northeast) and the diamond mines are approximately 300 miles northeast around Kimberley. Photo credit: NASA

ISS036-E-011050 (22 June 2013) --- An Egyptian dust plume and the Red Sea are featured in this image photographed by an Expedition 36 crew member on the International Space Station. This photograph provides a panoramic view of most of the length of the Red Sea, with the northernmost end, the Gulf of Suez, just visible at top center—fully 1,900 kilometers (ground distance) from the space station. The River Nile snakes its way northward through the Sahara Desert at top left. Much closer to the camera—but still more than 550 kilometers distant from the ground point above which the space station is orbiting—is a prominent dust plume surging out over the clear water of the Red Sea (foreground), reaching most of the way to Saudi Arabia. The “point source” of this plume is the delta of the southern Egyptian river Khor Baraka. Images from the spacecraft have shown that this delta is a common source for dust plumes, mainly because it is a relatively large area of exposed, loose sand and clay, easily lofted into the air. But the river also cuts through a high range of hills in a narrow valley that channels the wind, making it blow faster. This dramatic view of the Red Sea shows the generally parallel margins of the opposing coastlines. According to scientists, the rift or depression which now holds the Red Sea has been opening slowly for about 30 million years, and is nearly 300 kilometers wide in the region of the dust plume. Scientists believe the depression only recently filled with seawater within the last approximately five million years.
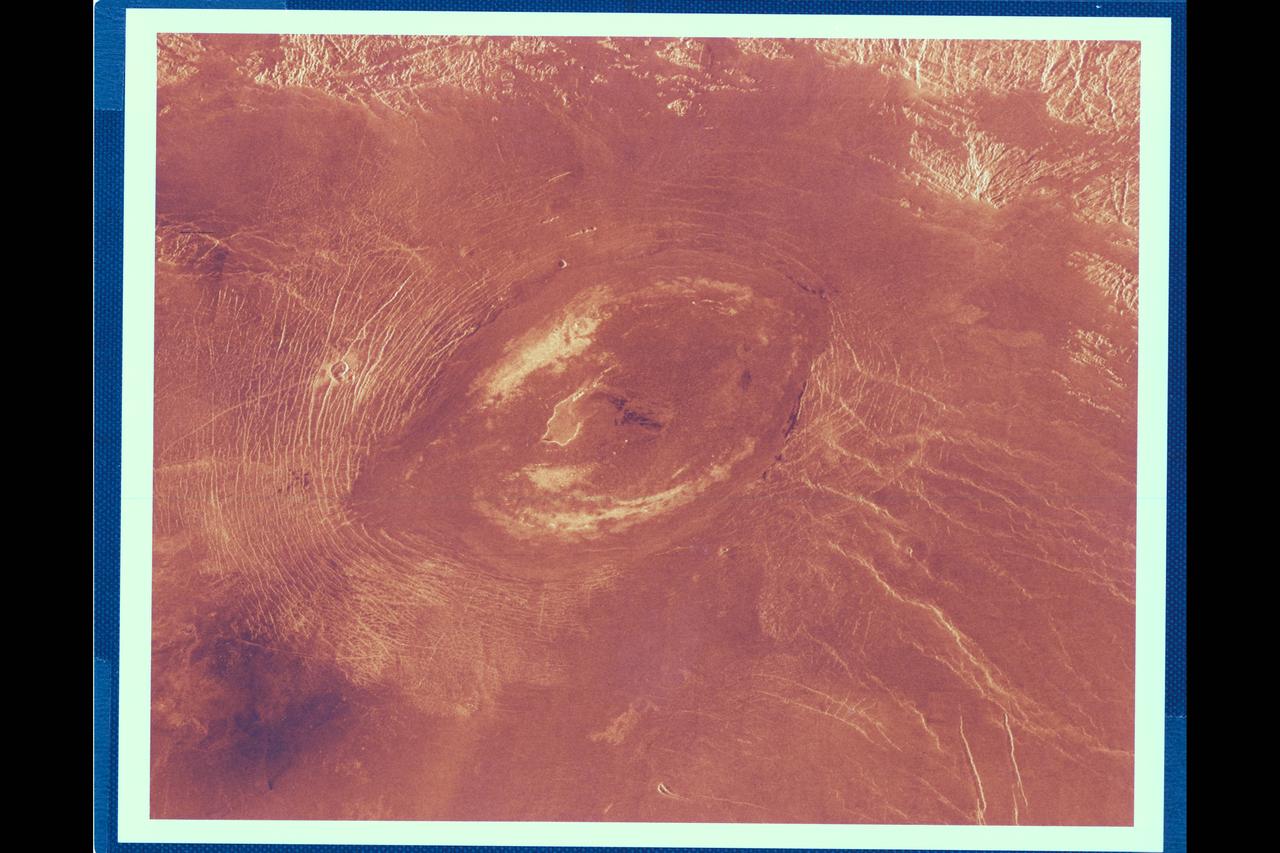
This Magellan image reveals Sacajawea Patera, a large, elongate caldera located in wester Ishtar Terra on the smooth plateau of Lakshmi Planum. The image is centered at 64.5 degrees north latitude adn 337 degrees east longitude. It is approx. 420 km (252 mi.) wide at the base Sacajawea is a depression approx. 1-2 km (0.6-1.2 mi.) deep and 120 by 215 km (74 by 133 mi.) in diameter; it is elongate in a sousthwest-northeast direction. The depression is interpreted to be graben adn fault scarps. These structures are space 0.5 to 4 km (0.3 to 2.5 mi.) apart, are 0.6 to 4 km (0.4 to 2.5 mi.) in width and up to 100 km (62 mi.) in length. Extending up to 140 km (87 mi.) in length from the southeast of the patera is a system of linear structures thought to represent a flanking rift zone along which the lateral injection and eruption of magma may have occurred. A shield edifice 12 km (7 mi.) in diameter with a prominent central pit lies along the trend of one of these features. The impact crater zlata, approx. 6 km (4 mi.) in diameter is located within the zone of graben to the northwest of the patera. Few flow features are observed in association with sacajawea, possibly due to age and state of degradation of the flows. Mottled bright deposits 4 to 20 km (2.5 to 12 mi.) in width are located near the periphery and in the center of the patera floor within local topographic lows. Diffuse patches of dark material approx. 40 km (25 mi.) in width are observed southwest of the patera, superimposed on portions of the surrounding graben. The formation of sacajawea is thought to be related to the drainage and collapse of a large magma chamber. Gravitational relaxation may have caused the resultant caldera to sag, producing the numerous complex, highly deformed tessera-like terrain are located north and east of the patera and are seen in the upper portion of the image. Color has been added to this image to simulate the appearance of the Venus surface.
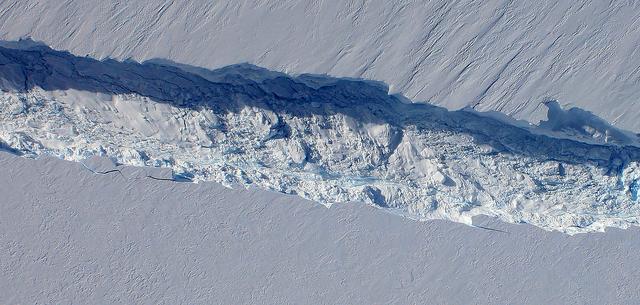
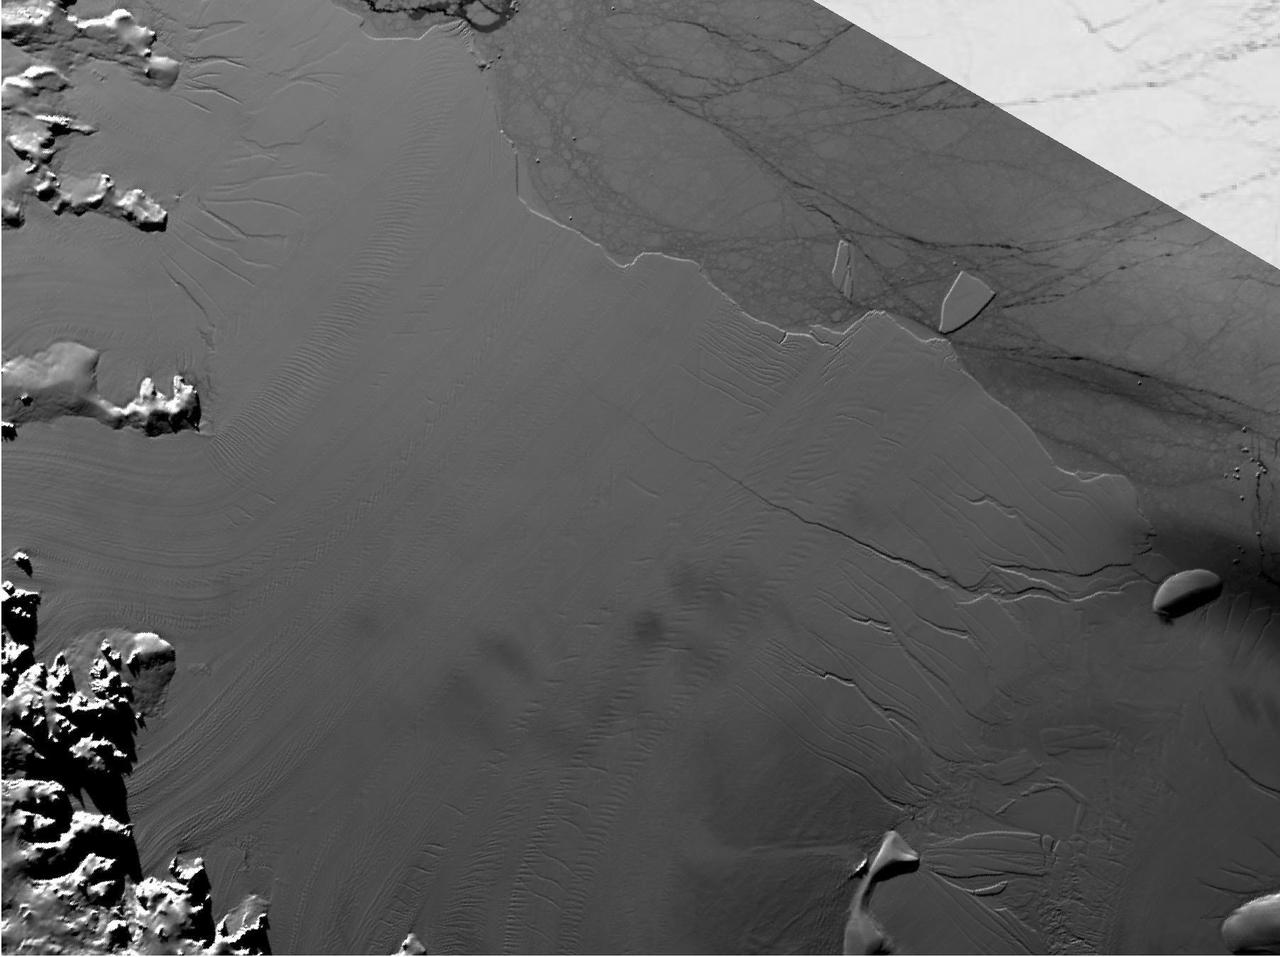
A close-up image of the crack spreading across the ice shelf of Pine Island Glacier shows the details of the boulder-like blocks of ice that fell into the rift when it split. For most of the 18-mile stretch of the crack that NASA’s DC-8 flew over on Oct. 26, 2011, it stretched about 240 feet wide, as roughly seen here. The deepest points ranged from about 165 to 190 feet, roughly equal to the top of the ice shelf down to sea level. Scientists expect the crack to propagate and the ice shelf to calve an iceberg of more than 300 square miles in the coming months. This image was captured by the Digital Mapping System (DMS) aboard the DC-8. Credit: NASA/DMS NASA's Operation IceBridge returns to a base camp of Punta Arenas, Chile for the third year of flights over Antarctica's changing sea ice, glaciers and ice sheets. NASA's DC-8, outfitted with seven remote-sensing instruments, and a Gulfstream 5 operated by the National Science Foundation and National Center for Atmospheric Research and outfitted with a high-altitude laser-ranging mapper, will fly from Chile over Antarctica in October and November. The mission is designed to record changes to Antarctica's ice sheets and give scientists insight into what is driving those changes. Follow the progress of the mission: Campaign News site: <a href="http://www.nasa.gov/mission_pages/icebridge/index.html" rel="nofollow">www.nasa.gov/mission_pages/icebridge/index.html</a> IceBridge blog: <a href="http://blogs.nasa.gov/cm/newui/blog/viewpostlist.jsp?blogname=icebridge" rel="nofollow">blogs.nasa.gov/cm/newui/blog/viewpostlist.jsp?blogname=ic...</a> Twitter: @nasa_ice <b><a href="http://www.nasa.gov/audience/formedia/features/MP_Photo_Guidelines.html" rel="nofollow">NASA image use policy.</a></b> <b><a href="http://www.nasa.gov/centers/goddard/home/index.html" rel="nofollow">NASA Goddard Space Flight Center</a></b> enables NASA’s mission through four scientific endeavors: Earth Science, Heliophysics, Solar System Exploration, and Astrophysics. Goddard plays a leading role in NASA’s accomplishments by contributing compelling scientific knowledge to advance the Agency’s mission. <b>Follow us on <a href="http://twitter.com/NASA_GoddardPix" rel="nofollow">Twitter</a></b> <b>Like us on <a href="http://www.facebook.com/pages/Greenbelt-MD/NASA-Goddard/395013845897?ref=tsd" rel="nofollow">Facebook</a></b> <b>Find us on <a href="http://instagrid.me/nasagoddard/?vm=grid" rel="nofollow">Instagram</a></b>
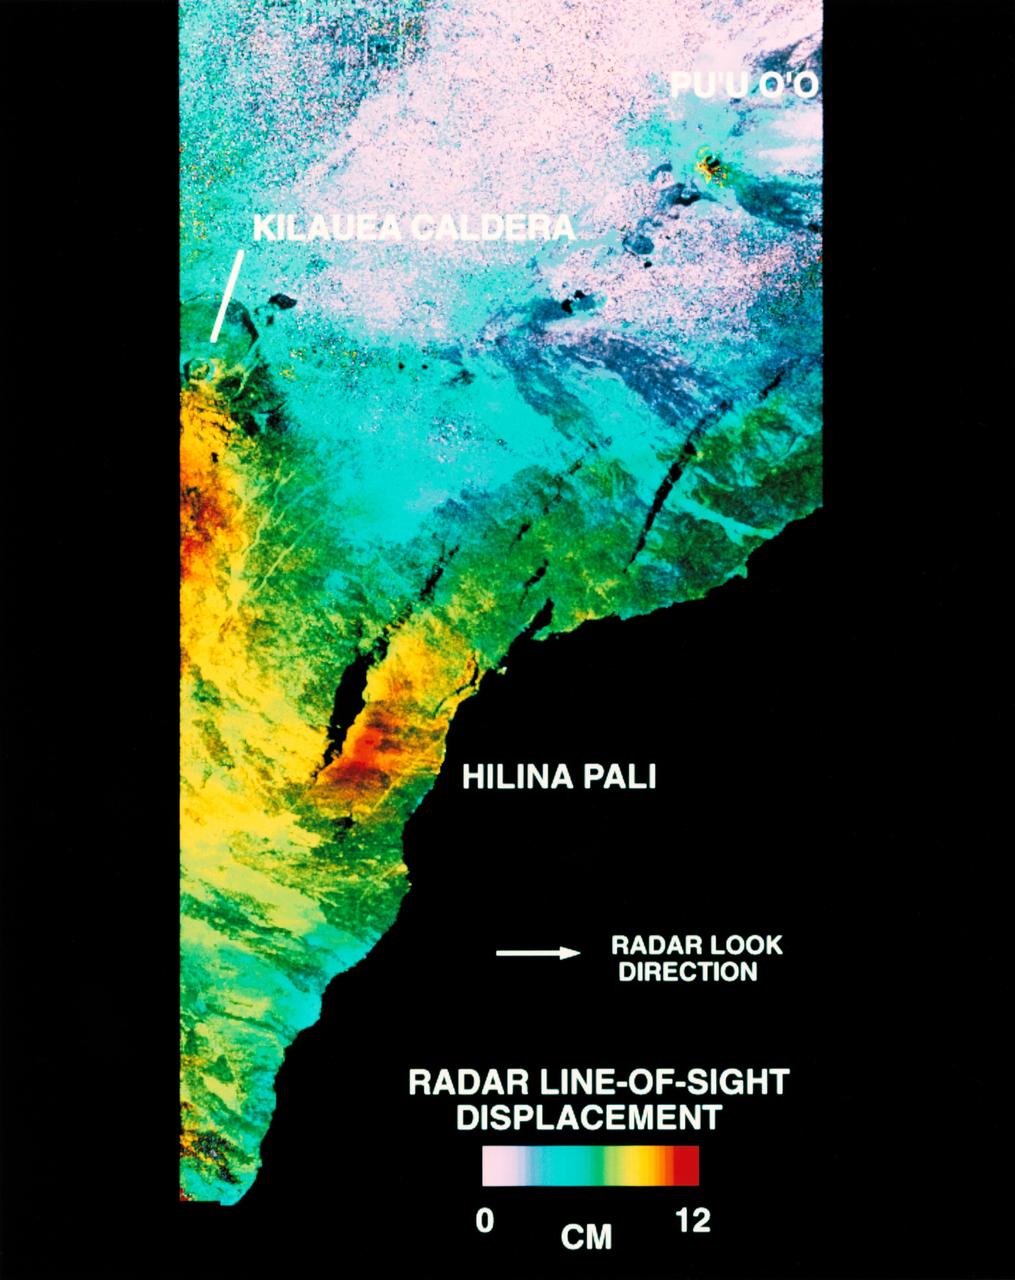
STS068-S-054 (10 October 1994) --- This is a deformation map of the south flank of Kilauea volcano on the big island of Hawaii, centered at 19.5 degrees north latitude and 155.25 degrees west longitude. The map was created by combining interferometric radar data - that is data acquired on different passes of the Space Shuttle Endeavour which are then overlaid to obtain elevation information - acquired by the Spaceborne Imaging Radar-C/X-Band Synthetic Aperture Radar (SIR-C/X-SAR) during its first flight in April 1994 and its second flight in October 1994. The area shown is approximately 40 by 80 kilometers (25 by 50 miles). North is toward the upper left of the image. The colors indicate the displacement of the surface in that direction that the radar instrument was pointed (toward the right of the image) in the six months between images. The analysis of ground movement is preliminary, but appears consistent with the motions detected by the Global Positioning System ground receivers that have been used over the past five years. The south flank of the Kilauea volcano is among the most rapidly deforming terrain's on Earth. Several regions show motion over the six-month time period. Most obvious is at the base of Hilina Pali, where 10 centimeters (4 inches) or more of crustal deformation can be seen in a concentrated area near the coastline. On a more localized scale, the currently active Pu'u O'o summit also shows about 10 centimeters (4 inches) of change near the vent area. Finally, there are indications of additional movement along the upper southwest rift zone, just below the Kilauea caldera in the image. Deformation of the south flank is believed to be the result of movements along faults deep beneath the surface of the volcano, as well as injections of magma, or molten rock, into the volcano's "plumbing" system. Detection of ground motions from space has proven to be a unique capability of imaging radar technology. Scientists hope to use deformation data acquired by SIR-C/X-SAR and future imaging radar missions to help in better understanding the processes responsible for volcanic eruptions and earthquakes. Spaceborne Imaging Radar-C/X-Band Synthetic Aperture Radar (SIR-C/X-SAR) is part of NASA's Mission to Planet Earth. (P-44753)
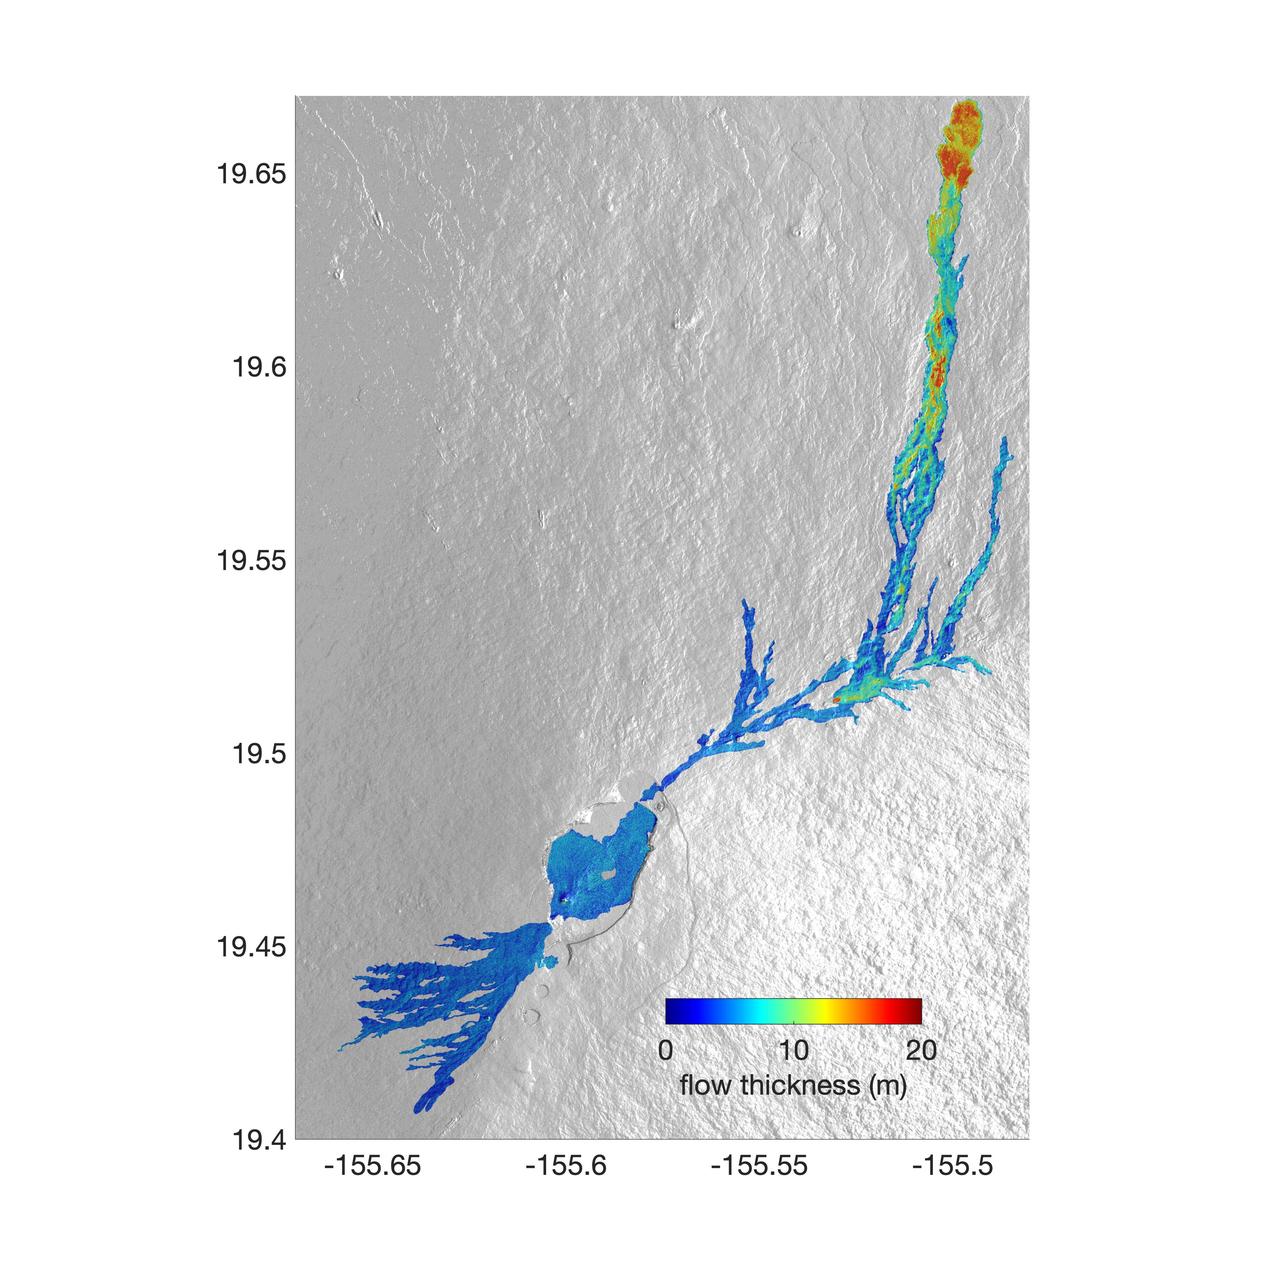
The world's largest active volcano – Hawaii's Mauna Loa – had been quiet for 38 years. But in 2022, the volcano began to stir, showing increased numbers of small earthquakes and subtle swelling of certain land surfaces in September. On November 27, fountains of lava began spurting from the mountain's Northeast Rift Zone and streams of molten rock flowed to the north. Ten days into the eruption, a NASA aircraft conducted its first flight over the erupting volcano. It carried NASA's Uninhabited Aerial Vehicle Synthetic Aperture Radar (UAVSAR) system, which was used to map the volcano's topography in fine detail with a Ka-band instrument called GLISTIN-A. Teams from NASA's Jet Propulsion Laboratory and the United States Geological Survey (USGS) used data from that sensor to map the thickness of those flows during a series of flights on December 7, 8, and 10. The map above shows the thickness of the lava flows during the flight on December 7, the day before USGS scientists noticed a significant decline in the pace of the eruption. A few days later, they declared the eruption had stopped. The map shows the thickness of the lava flows in the summit caldera, where the eruption began, and of lava flows on Mauna Loa's northeastern flank. The color variation from blue to orange indicates increasing lava flow thickness. A maximum thickness of roughly 25 meters (82 feet) is shown, though values exceeding 40 meters (131 feet) were observed in some areas. The thickening at the northern end of the flow is due to lava accumulating away from the vent, along with a flattening of the terrain at the saddle between the Mauna Loa and Mauna Kea volcanoes. By comparing to pre-eruption maps of this area's topography, including GLISTIN-A data collected in 2017, the USGS researchers were able to calculate the size and volume of the lava flow. Over the roughly 14-day eruption, Mauna Loa erupted more than 8.8 billion cubic feet (230 million cubic meters) along a lava flow that extended up to 16.5 miles (19.5 kilometers) from the vent, according to the USGS. The UAVSAR operates from a pod mounted beneath a crewed Gulfstream III jet from NASA's Armstrong Flight Research Center in California. Repeated topographic maps generated with each flight reveal the progression and thickening of lava with time – important information for scientific understanding of volcano processes and for emergency response. For the Mauna Loa science flights, the instrument suite featured an additional state-of-the-art imaging tool: the synthetic aperture radar-fusion optical short-wave infrared (SAR-Fusion Optical/SWIR) camera system. SAR-Fusion collects data over the same ground swath as GLISTIN-A to map land surface changes using optical/SWIR photogrammetry methods. GLISTIN-A was designed to provide all-weather, high-resolution surface topography not available through existing lidar or radar sensors. GLISTIN-A was originally demonstrated as a new radar technique for mapping ice surfaces. Science demonstration flights began in 2013 over alpine glaciers and sea ice in Alaska, and a floodplain in California. Its applications have since expanded to other areas, such as snow accumulation and volcano dynamics. The first time the instrument was deployed for volcano response was in 2018 during the three-month eruption of Kilauea. The success of that operation paved the way for deployment to Mauna Loa. https://photojournal.jpl.nasa.gov/catalog/PIA25526