![NASA researchers have new [sic] insights into the mysteries of Arctic sea ice, thanks to the unique abilities of Canada Radarsat satellite.](https://images-assets.nasa.gov/image/PIA02971/PIA02971~thumb.jpg)
NASA researchers have new [sic] insights into the mysteries of Arctic sea ice, thanks to the unique abilities of Canada Radarsat satellite.
![NASA researchers have new [sic] insights into the mysteries of Arctic sea ice, thanks to the unique abilities of Canada's Radarsat satellite. The Arctic is the smallest of the world's four oceans, but it may play a large role in helping scientists monitor Earth's climate shifts. Using Radarsat's special sensors to take images at night and to peer through clouds, NASA researchers can now see the complete ice cover of the Arctic. This allows tracking of any shifts and changes, in unprecedented detail, over the course of an entire winter. The radar-generated, high-resolution images are up to 100 times better than those taken by previous satellites. http://photojournal.jpl.nasa.gov/catalog/PIA02970](https://images-assets.nasa.gov/image/PIA02970/PIA02970~thumb.jpg)
NASA researchers have new [sic] insights into the mysteries of Arctic sea ice, thanks to the unique abilities of Canada's Radarsat satellite. The Arctic is the smallest of the world's four oceans, but it may play a large role in helping scientists monitor Earth's climate shifts. Using Radarsat's special sensors to take images at night and to peer through clouds, NASA researchers can now see the complete ice cover of the Arctic. This allows tracking of any shifts and changes, in unprecedented detail, over the course of an entire winter. The radar-generated, high-resolution images are up to 100 times better than those taken by previous satellites. http://photojournal.jpl.nasa.gov/catalog/PIA02970
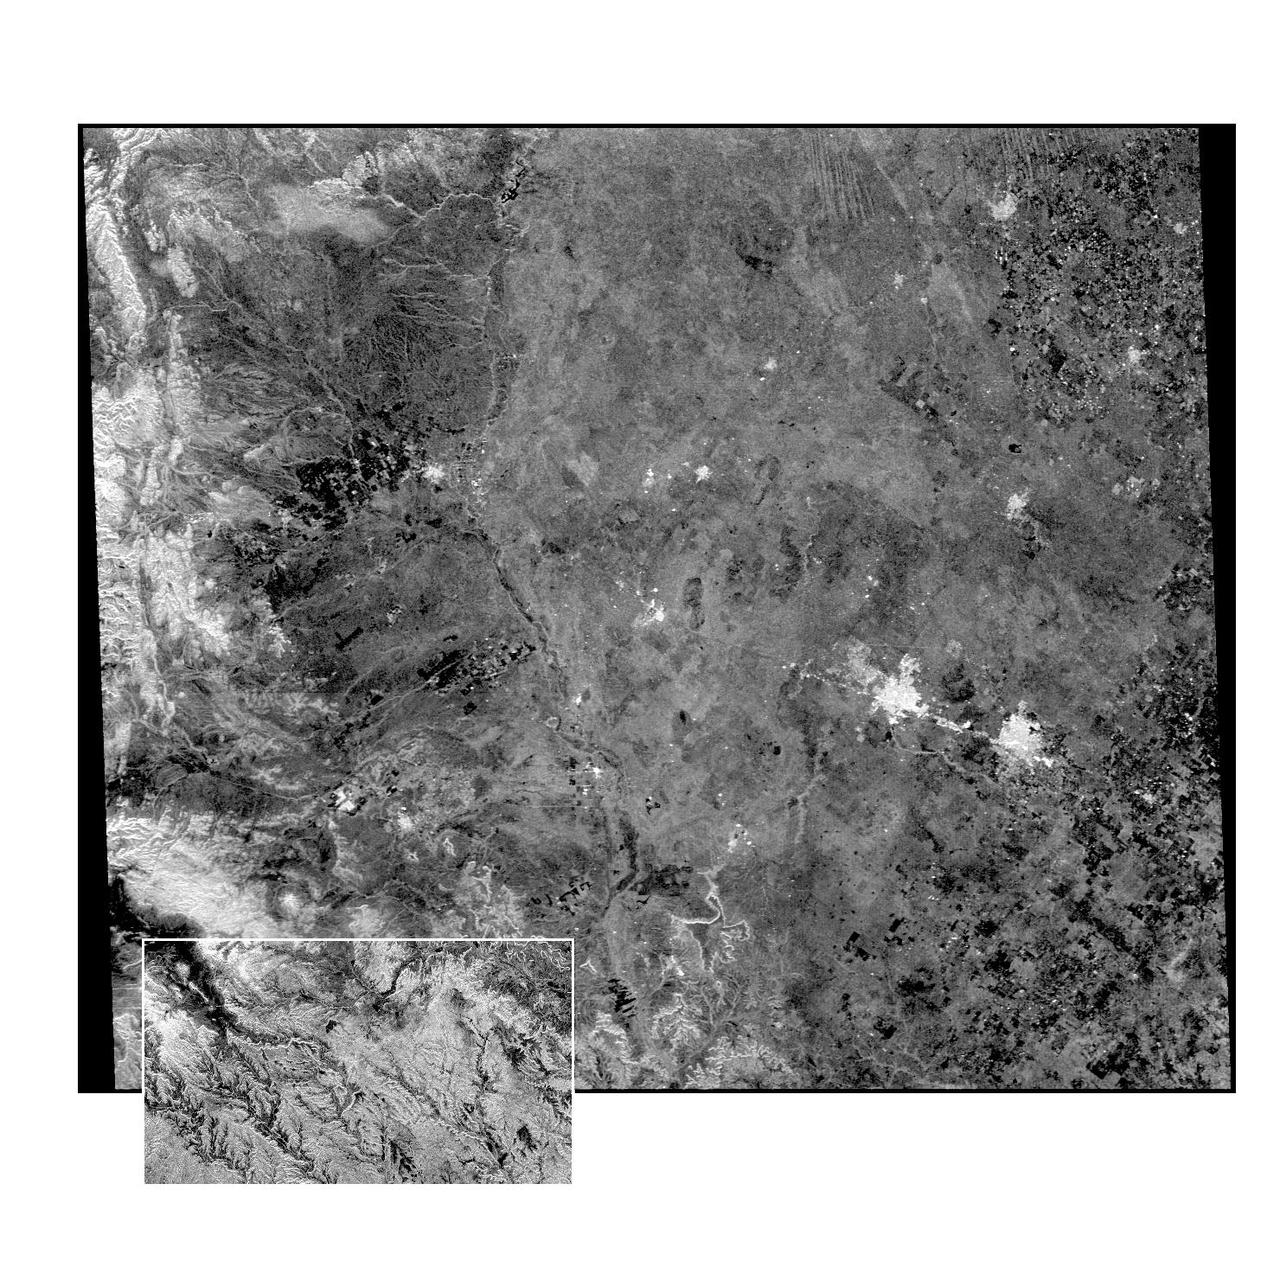
This radar image of the Midland/Odessa region of West Texas, demonstrates an experimental technique, called ScanSAR, that allows scientists to rapidly image large areas of the Earth's surface. The large image covers an area 245 kilometers by 225 kilometers (152 miles by 139 miles). It was obtained by the Spaceborne Imaging Radar-C/X-Band Synthetic Aperture Radar (SIR-C/X-SAR) flying aboard the space shuttle Endeavour on October 5, 1994. The smaller inset image is a standard SIR-C image showing a portion of the same area, 100 kilometers by 57 kilometers (62 miles by 35 miles) and was taken during the first flight of SIR-C on April 14, 1994. The bright spots on the right side of the image are the cities of Odessa (left) and Midland (right), Texas. The Pecos River runs from the top center to the bottom center of the image. Along the left side of the image are, from top to bottom, parts of the Guadalupe, Davis and Santiago Mountains. North is toward the upper right. Unlike conventional radar imaging, in which a radar continuously illuminates a single ground swath as the space shuttle passes over the terrain, a Scansar radar illuminates several adjacent ground swaths almost simultaneously, by "scanning" the radar beam across a large area in a rapid sequence. The adjacent swaths, typically about 50 km (31 miles) wide, are then merged during ground processing to produce a single large scene. Illumination for this L-band scene is from the top of the image. The beams were scanned from the top of the scene to the bottom, as the shuttle flew from left to right. This scene was acquired in about 30 seconds. A normal SIR-C image is acquired in about 13 seconds. The ScanSAR mode will likely be used on future radar sensors to construct regional and possibly global radar images and topographic maps. The ScanSAR processor is being designed for 1996 implementation at NASA's Alaska SAR Facility, located at the University of Alaska Fairbanks, and will produce digital images from the forthcoming Canadian RADARSAT satellite. http://photojournal.jpl.nasa.gov/catalog/PIA01787
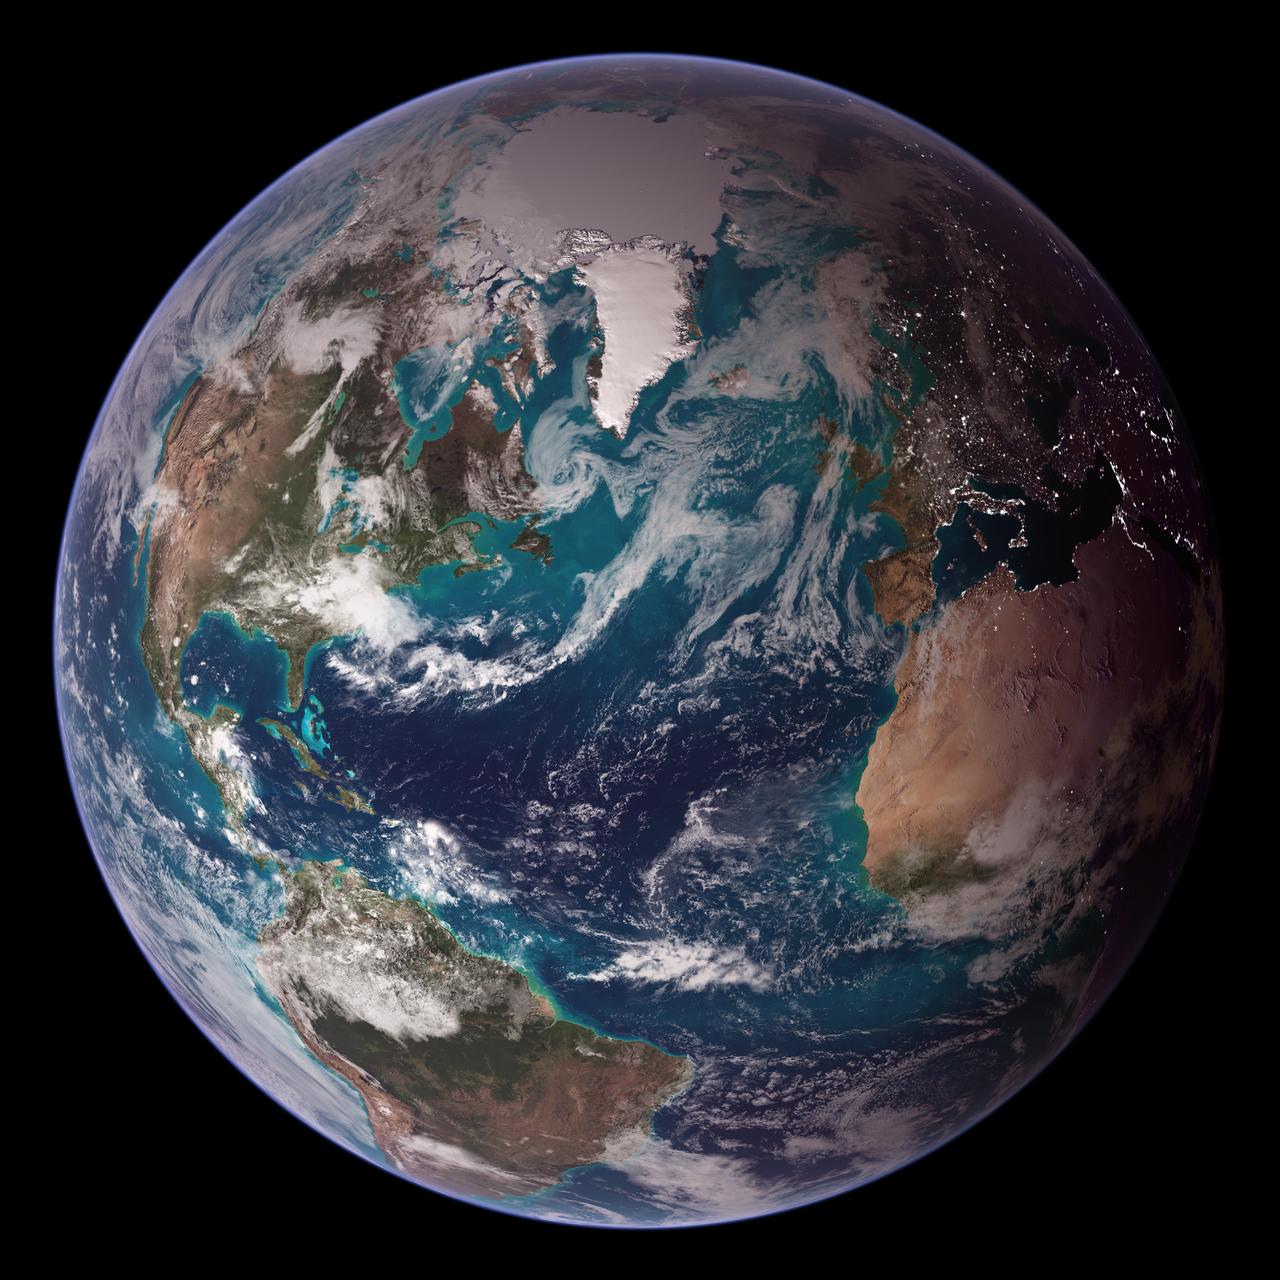
<b>RELEASE DATE: OCTOBER 9, 2007</b> <b>Credit: NASA/Goddard Space Flight Center/Reto Stöckli</b> A day’s clouds. The shape and texture of the land. The living ocean. City lights as a beacon of human presence across the globe. This amazingly beautiful view of Earth from space is a fusion of science and art, a showcase for the remote-sensing technology that makes such views possible, and a testament to the passion and creativity of the scientists who devote their careers to understanding how land, ocean, and atmosphere—even life itself—interact to generate Earth’s unique (as far as we know!) life-sustaining environment. Drawing on data from multiple satellite missions (not all collected at the same time), a team of NASA scientists and graphic artists created layers of global data for everything from the land surface, to polar sea ice, to the light reflected by the chlorophyll in the billions of microscopic plants that grow in the ocean. They wrapped these layers around a globe, set it against a black background, and simulated the hazy edge of the Earth’s atmosphere (the limb) that appears in astronaut photography of the Earth. The land surface layer is based on photo-like surface reflectance observations (reflected sunlight) measured by the Moderate Resolution Imaging Spectroradiometer (MODIS) on NASA’s Terra satellite in July 2004. The sea ice layer near the poles comes from Terra MODIS observations of daytime sea ice observed between August 28 and September 6, 2001. The ocean layer is a composite. In shallow water areas, the layer shows surface reflectances observed by Terra MODIS in July 2004. In the open ocean, the photo-like layer is overlaid with observations of the average ocean chlorophyll content for 2004. NASA’s Aqua MODIS collected the chlorophyll data. The cloud layer shows a single-day snapshot of clouds observed by Terra MODIS across the planet on July 29, 2001. City lights on Earth’s night side are visualized from data collected by the Defense Meteorological Satellite Program mission between 1994–1995. The topography layer is based on radar data collected by the Space Shuttle Endeavour during an 11-day mission in February of 2000. Topography over Antarctica comes from the Radarsat Antarctic Mapping Project, version 2. Most of the data layers in this visualization are available as monthly composites as part of NASA’s Blue Marble Next Generation image collection. The images in the collection appear in cylindrical projection (rectangular maps), and they are available at 500-meter resolution. The large images provided above are the full-size versions of these globes. In their hope that these images will inspire people to appreciate the beauty of our home planet and to learn about the Earth system, the developers of these images encourage readers to re-use and re-publish the images freely. NASA images by Reto Stöckli, based on data from NASA and NOAA. To learn the history of the Blue Marble go here: <a href="http://earthobservatory.nasa.gov/Features/BlueMarble/BlueMarble_history.php" rel="nofollow">earthobservatory.nasa.gov/Features/BlueMarble/BlueMarble_...</a> To learn more about the Blue Marble go here: <a href="http://earthobservatory.nasa.gov/IOTD/view.php?id=8108" rel="nofollow">earthobservatory.nasa.gov/IOTD/view.php?id=8108</a> <b><a href="http://www.nasa.gov/centers/goddard/home/index.html" rel="nofollow">NASA Goddard Space Flight Center</a></b> is home to the nation's largest organization of combined scientists, engineers and technologists that build spacecraft, instruments and new technology to study the Earth, the sun, our solar system, and the universe. <b>Follow us on <a href="http://twitter.com/NASA_GoddardPix" rel="nofollow">Twitter</a></b> <b>Join us on <a href="http://www.facebook.com/pages/Greenbelt-MD/NASA-Goddard/395013845897?ref=tsd" rel="nofollow">Facebook</a><b> </b></b>
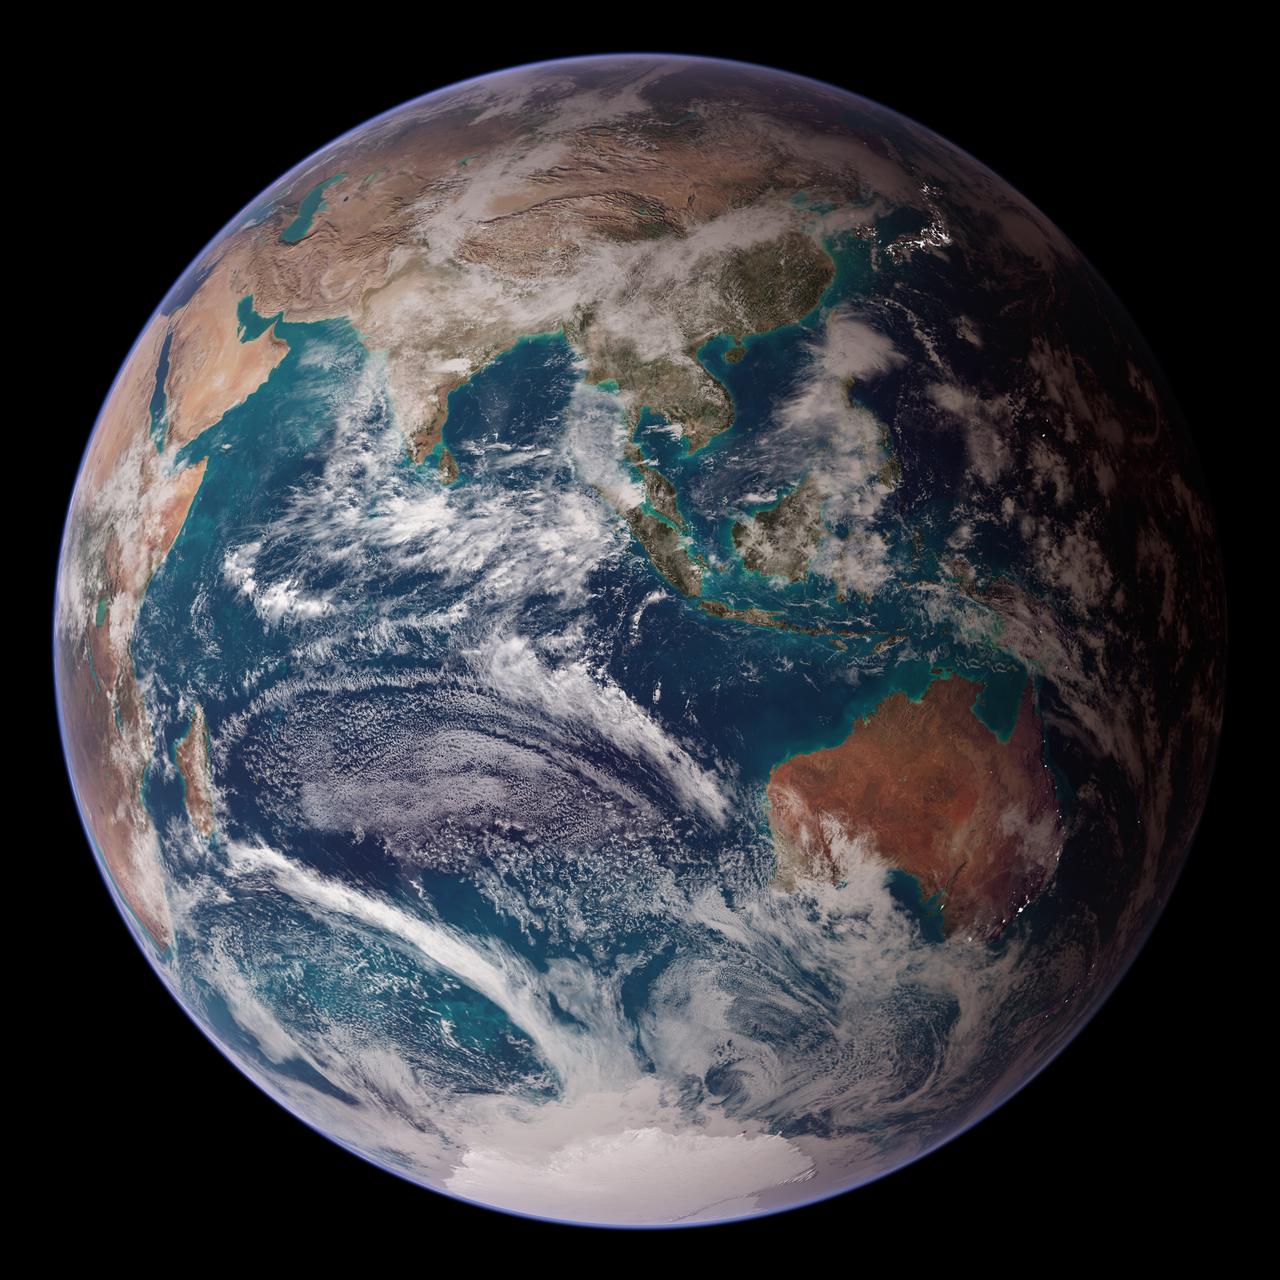
<b>RELEASE DATE: OCTOBER 9, 2007</b> <b>Credit: NASA/Goddard Space Flight Center/Reto Stöckli</b> A day’s clouds. The shape and texture of the land. The living ocean. City lights as a beacon of human presence across the globe. This amazingly beautiful view of Earth from space is a fusion of science and art, a showcase for the remote-sensing technology that makes such views possible, and a testament to the passion and creativity of the scientists who devote their careers to understanding how land, ocean, and atmosphere—even life itself—interact to generate Earth’s unique (as far as we know!) life-sustaining environment. Drawing on data from multiple satellite missions (not all collected at the same time), a team of NASA scientists and graphic artists created layers of global data for everything from the land surface, to polar sea ice, to the light reflected by the chlorophyll in the billions of microscopic plants that grow in the ocean. They wrapped these layers around a globe, set it against a black background, and simulated the hazy edge of the Earth’s atmosphere (the limb) that appears in astronaut photography of the Earth. The land surface layer is based on photo-like surface reflectance observations (reflected sunlight) measured by the Moderate Resolution Imaging Spectroradiometer (MODIS) on NASA’s Terra satellite in July 2004. The sea ice layer near the poles comes from Terra MODIS observations of daytime sea ice observed between August 28 and September 6, 2001. The ocean layer is a composite. In shallow water areas, the layer shows surface reflectances observed by Terra MODIS in July 2004. In the open ocean, the photo-like layer is overlaid with observations of the average ocean chlorophyll content for 2004. NASA’s Aqua MODIS collected the chlorophyll data. The cloud layer shows a single-day snapshot of clouds observed by Terra MODIS across the planet on July 29, 2001. City lights on Earth’s night side are visualized from data collected by the Defense Meteorological Satellite Program mission between 1994–1995. The topography layer is based on radar data collected by the Space Shuttle Endeavour during an 11-day mission in February of 2000. Topography over Antarctica comes from the Radarsat Antarctic Mapping Project, version 2. Most of the data layers in this visualization are available as monthly composites as part of NASA’s Blue Marble Next Generation image collection. The images in the collection appear in cylindrical projection (rectangular maps), and they are available at 500-meter resolution. The large images provided above are the full-size versions of these globes. In their hope that these images will inspire people to appreciate the beauty of our home planet and to learn about the Earth system, the developers of these images encourage readers to re-use and re-publish the images freely. NASA images by Reto Stöckli, based on data from NASA and NOAA. To learn the history of the Blue Marble go here: <a href="http://earthobservatory.nasa.gov/Features/BlueMarble/BlueMarble_history.php" rel="nofollow">earthobservatory.nasa.gov/Features/BlueMarble/BlueMarble_...</a> To learn more about the Blue Marble go here: <a href="http://earthobservatory.nasa.gov/IOTD/view.php?id=8108" rel="nofollow">earthobservatory.nasa.gov/IOTD/view.php?id=8108</a> To learn more about NASA's Goddard Space Flight Center go here: <a href="http://www.nasa.gov/centers/goddard/home/index.html" rel="nofollow">www.nasa.gov/centers/goddard/home/index.html</a> <b><a href="http://www.nasa.gov/centers/goddard/home/index.html" rel="nofollow">NASA Goddard Space Flight Center</a></b> is home to the nation's largest organization of combined scientists, engineers and technologists that build spacecraft, instruments and new technology to study the Earth, the sun, our solar system, and the universe. <b><a href="http://www.nasa.gov/centers/goddard/home/index.html" rel="nofollow">NASA Goddard Space Flight Center</a></b> is home to the nation's largest organization of combined scientists, engineers and technologists that build spacecraft, instruments and new technology to study the Earth, the sun, our solar system, and the universe. <b>Follow us on <a href="http://twitter.com/NASA_GoddardPix" rel="nofollow">Twitter</a></b> <b>Join us on <a href="http://www.facebook.com/pages/Greenbelt-MD/NASA-Goddard/395013845897?ref=tsd" rel="nofollow">Facebook</a><b> </b></b>
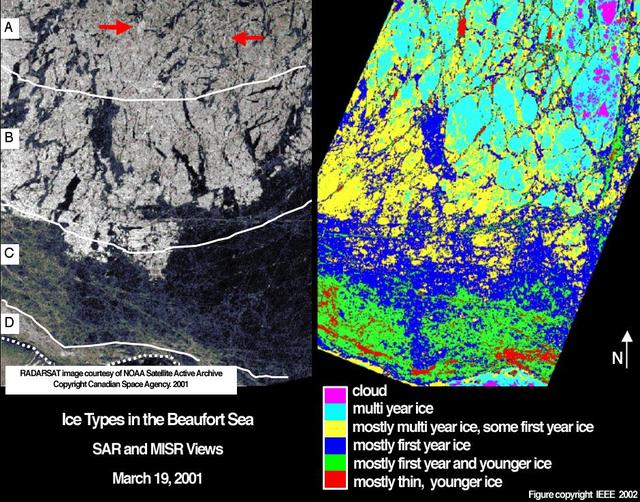
Sea ice in the Beaufort Sea off the north coast of Alaska was classified and mapped in these concurrent images acquired March 19, 2001 by NASA Terra spacecraft.