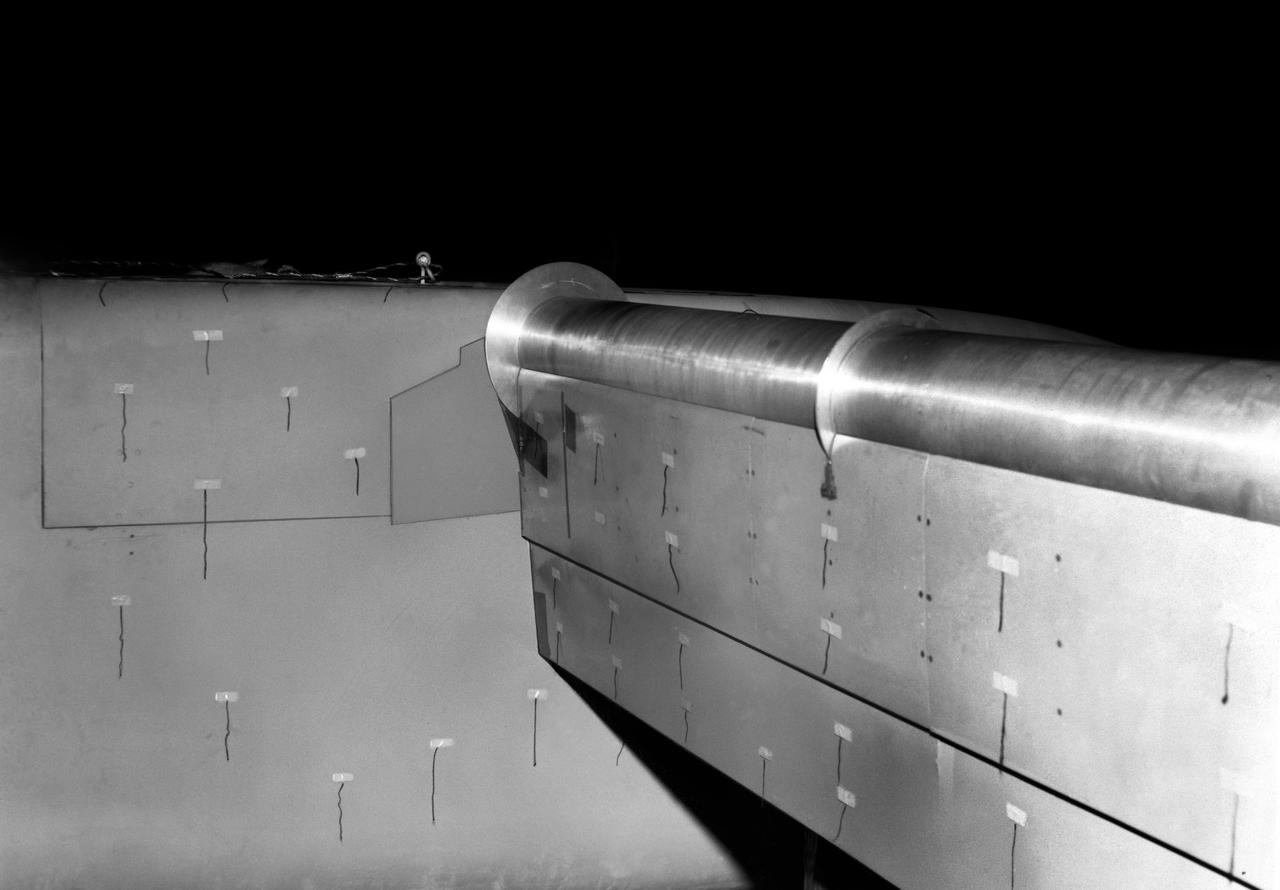
Detail view of 4 propeller model rotating cylinder flap at 90 degrees with yarn tufts attached.
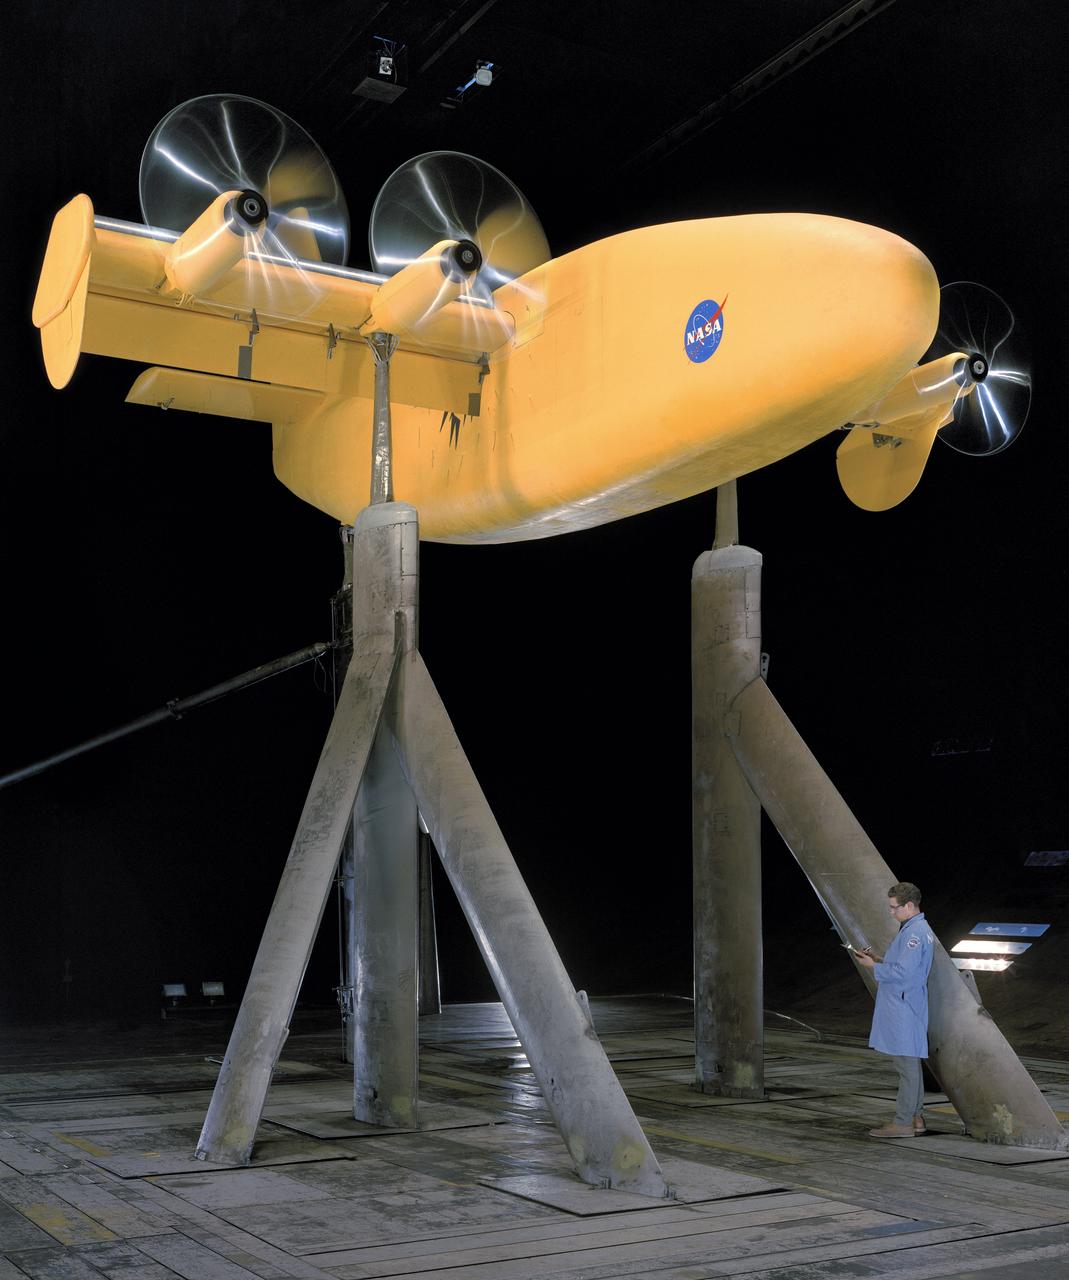
4 propeller model with rotating cylinder flap. Propellers running. 3/4 front view. DAVE JONES (PROPS TURNING)
2-Prop. R.C.F. (Rotating Cylinder Flap) in 40 x 80ft. wind tunnel. - rear view with Chuck Greco.
3/4 front view with wing tilted and flaps 0 degrees. Coin Airplane: Rotating cylinder flap applied.

2-Prop. R.C.F. (Rotating Cylinder Flap) in 40 x 80ft. wind tunnel. front view detail of flap
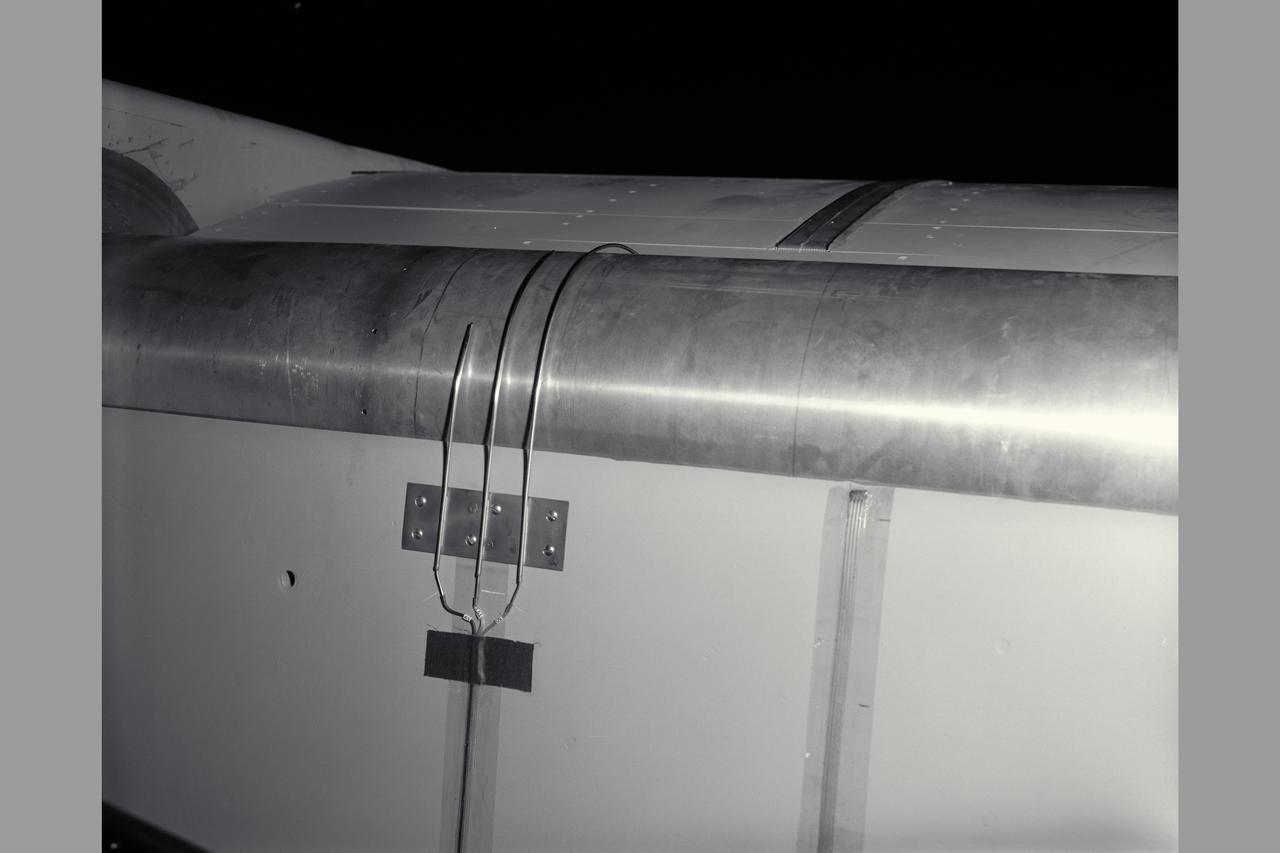
2-Prop. R.C.F. (Rotating Cylinder Flap) in 40 x 80ft. wind tunnel. rear view detail of flap
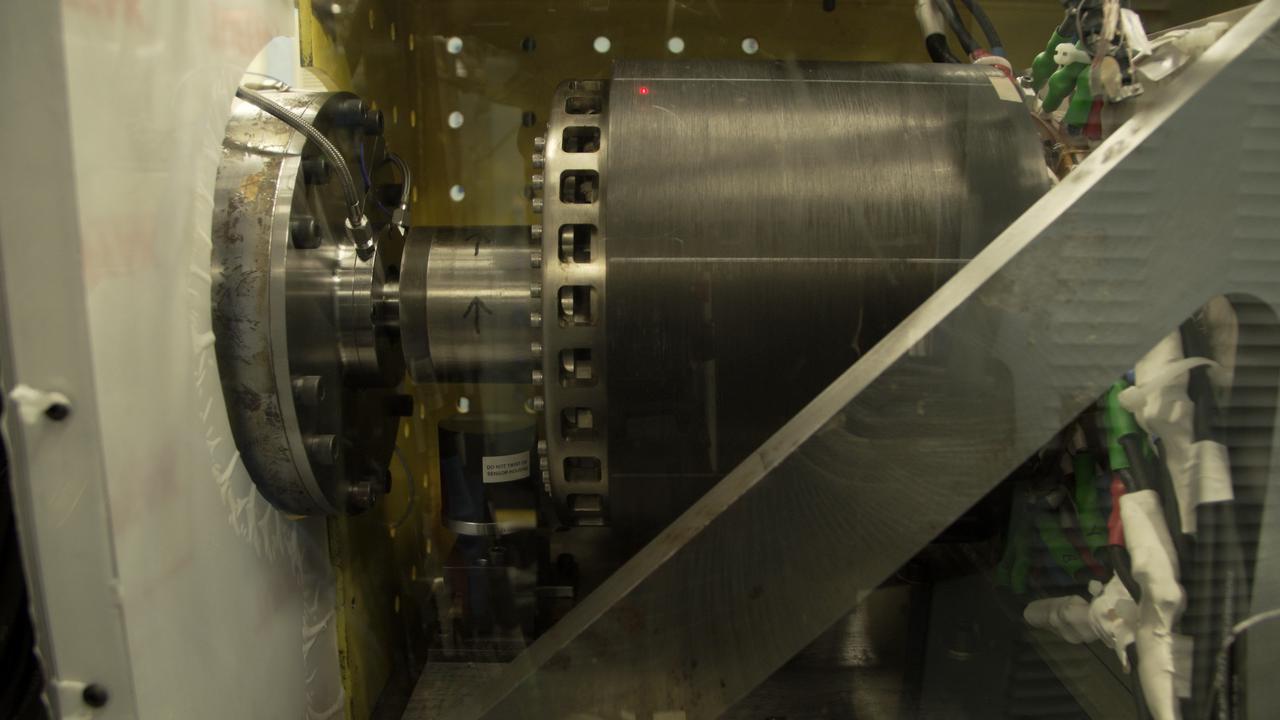
UIUC’s megawatt machine (right) was connected to a dynamometer (left) to test its effectiveness as an electric generator in a safety enclosure at a Collins Aerospace test facility in Rockford, Illinois. This unusual design has its rotating parts on the outside, so that both the cylinder on the right and the cylinder with arrows spin during operation.

2-Prop. R.C.F. (Rotating Cylinder Flap) in 40 x 80ft. wind tunnel. 3/4 front view with Jim Weiberg Chuck Greco.
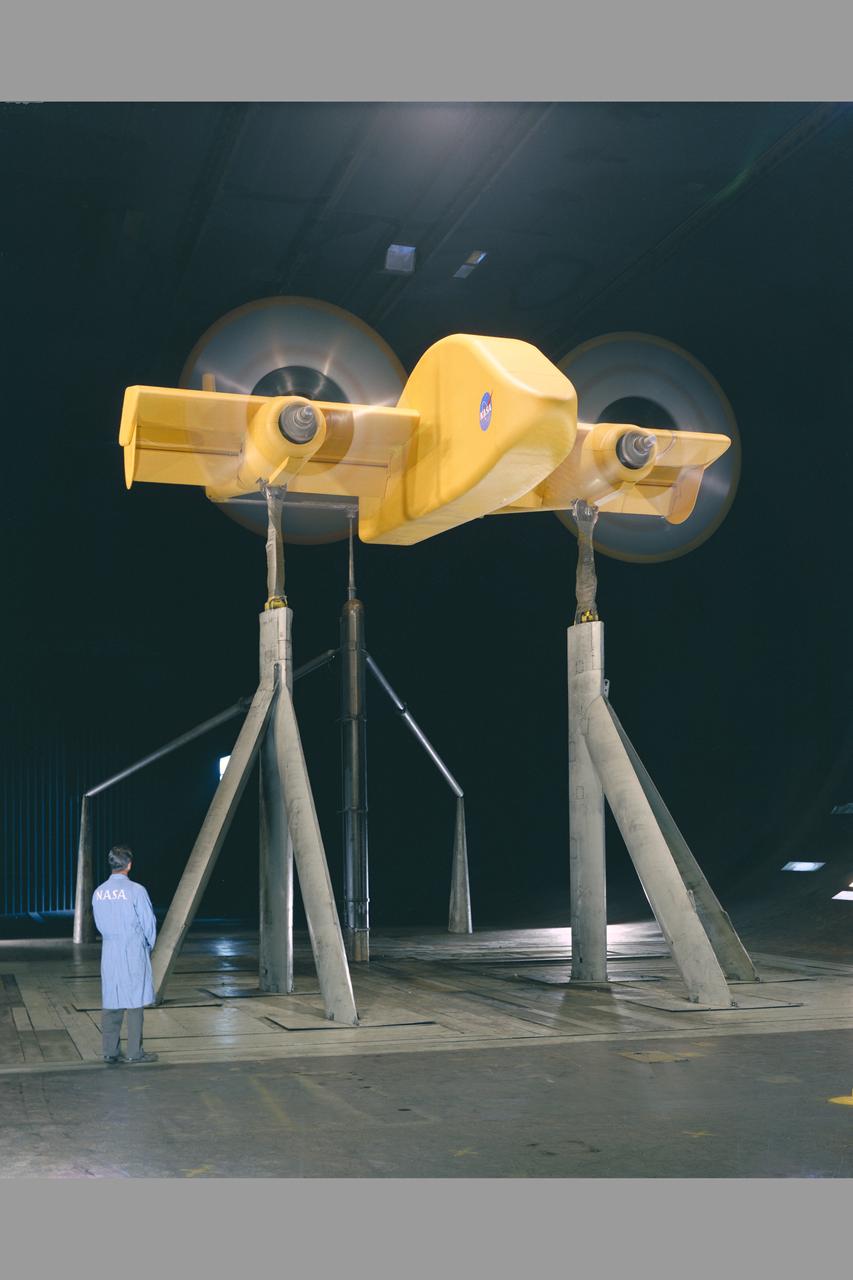
2-Prop. R.C.F. (Rotating Cylinder Flap) in 40 x 80ft. wind tunnel. 3/4 front view propeller spinning with Chuck Greco.
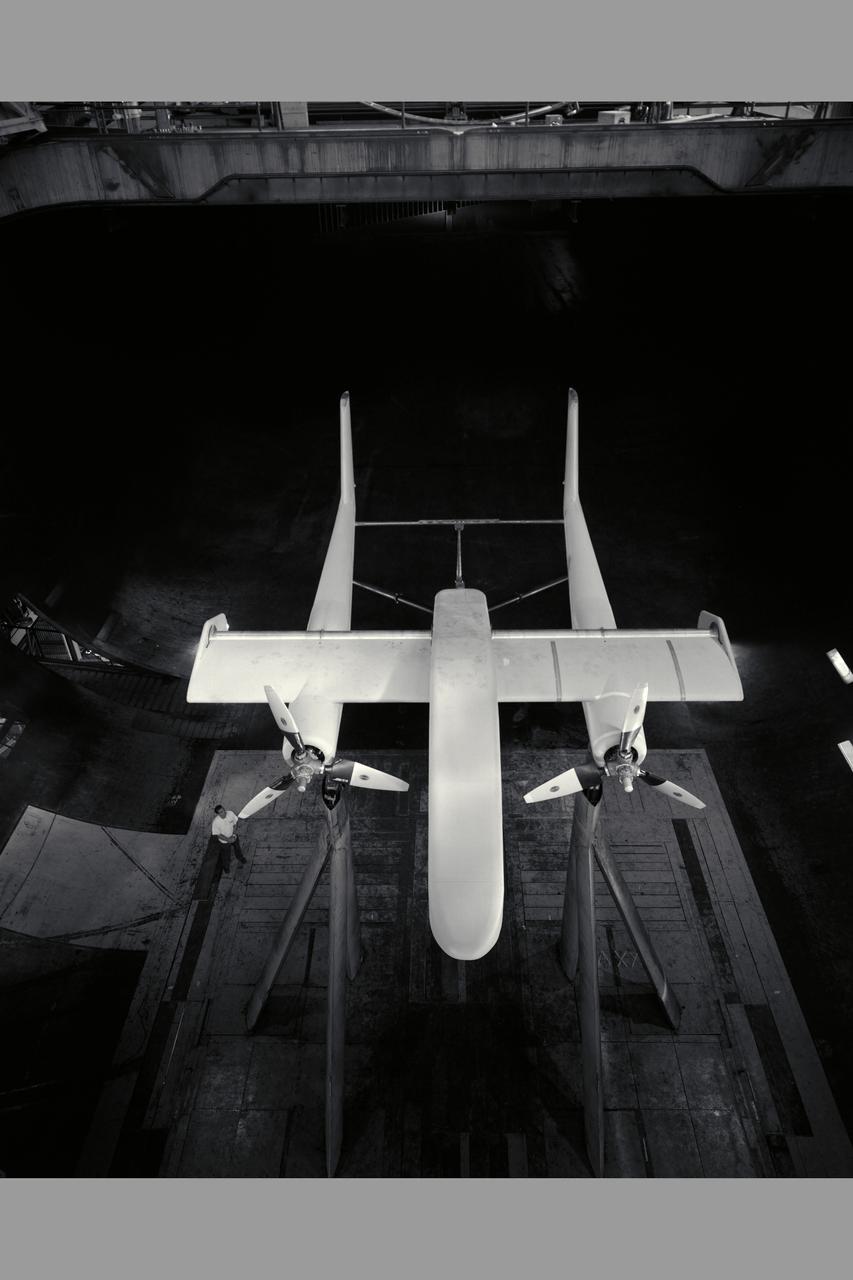
2-Prop. R.C.F. (Rotating Cylinder Flap) in 40 x 80ft. wind tunnel - overhead view propeller spinning with Chuck Greco.
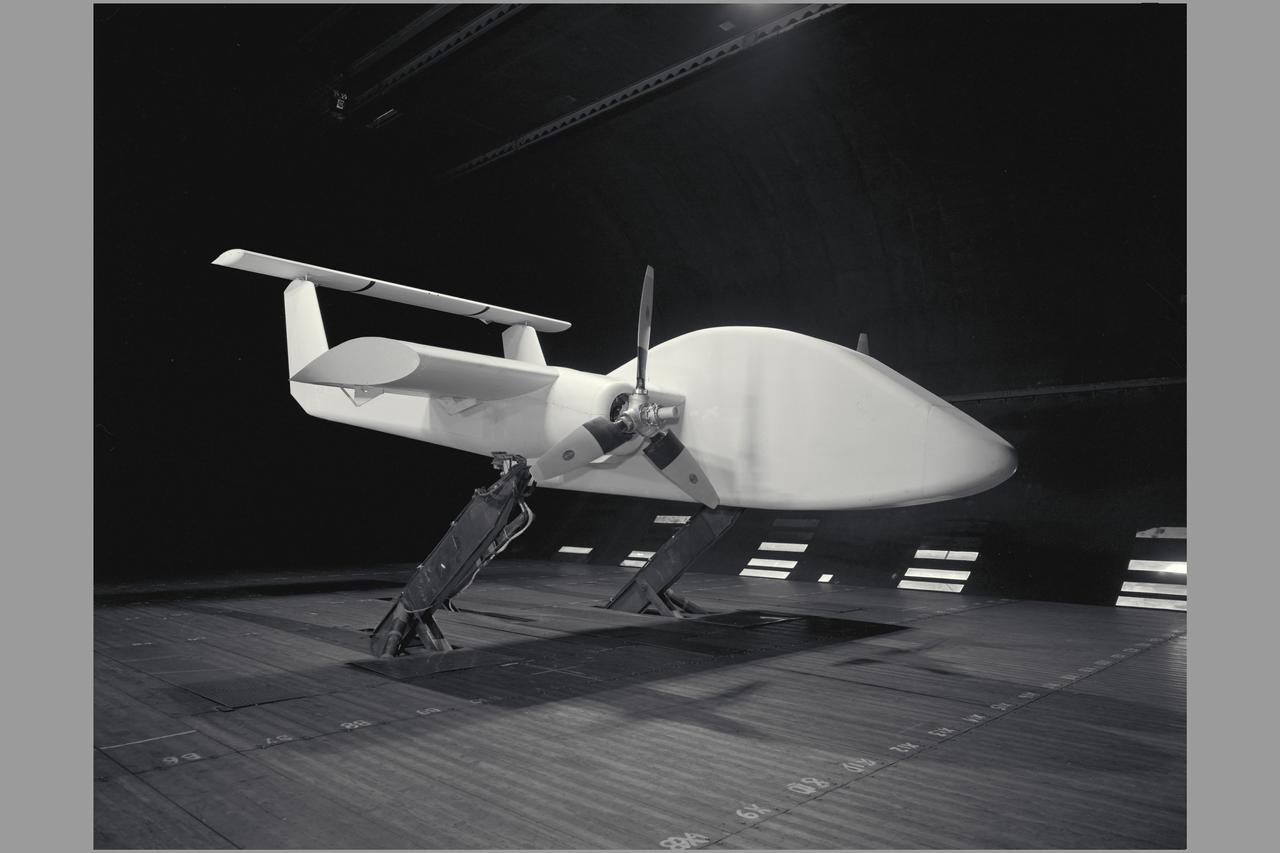
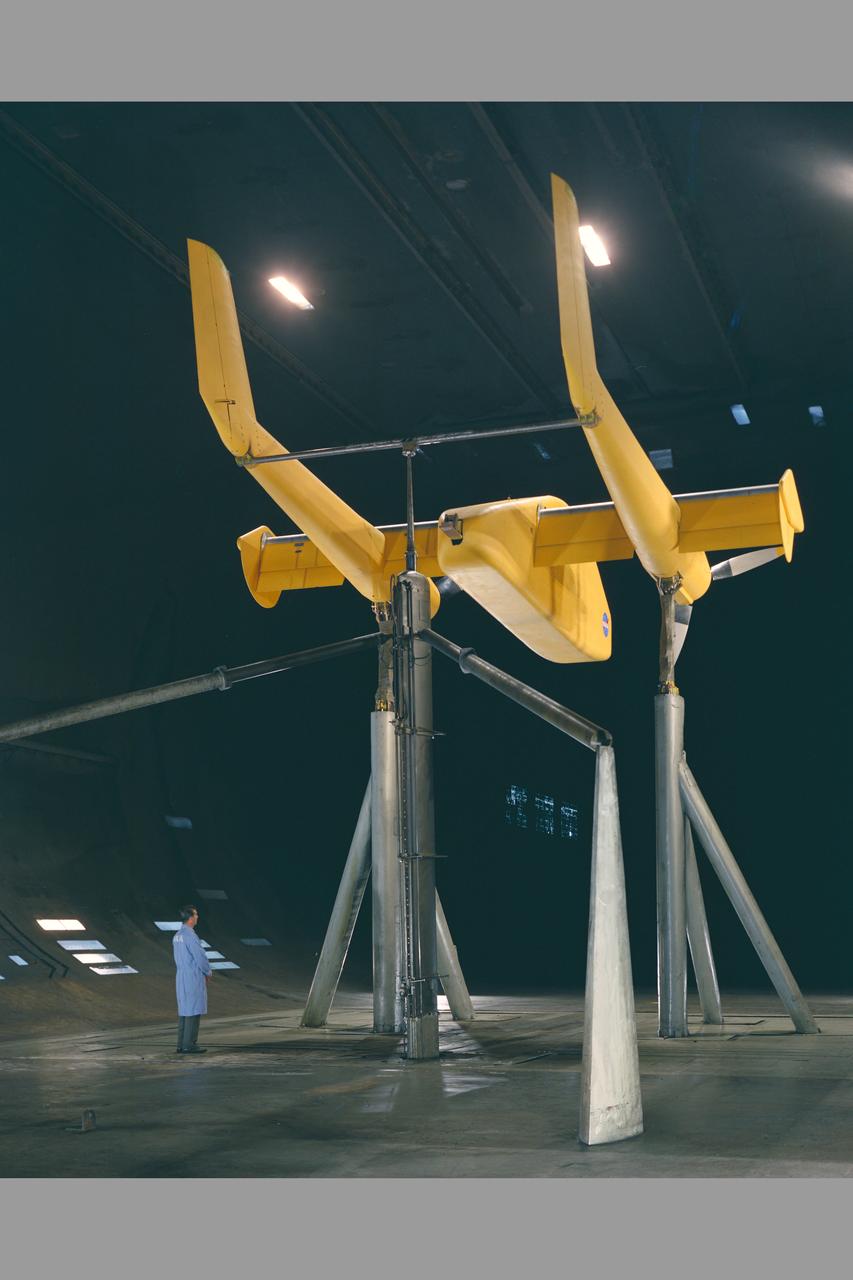
3/4 front view of model with flaps up. V/STOL Aircraft: Wind tunnel investigation of rotating cylinder applied to training edge flaps for high lift & low-speed control.

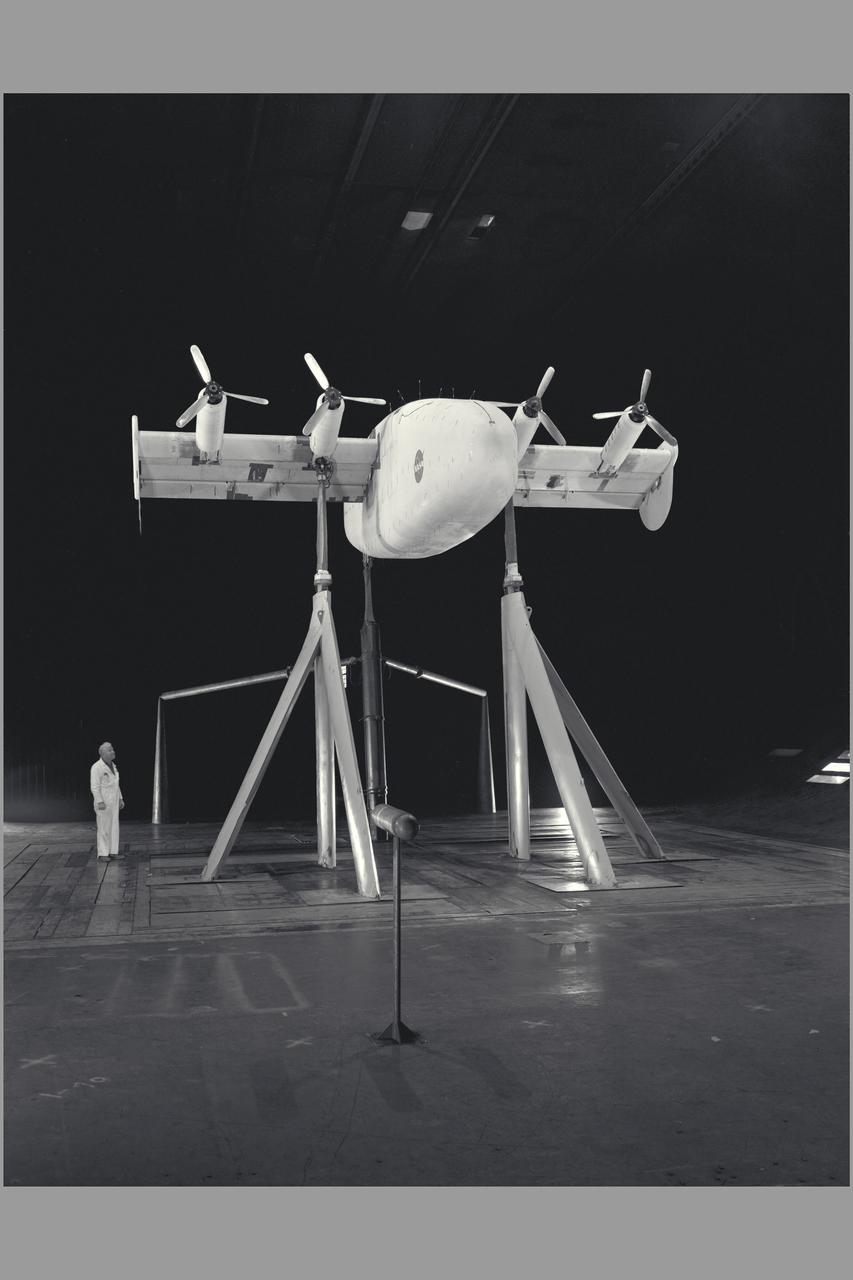
3/4 rear view of model with flaps down with Cecil E. MacDonald. V/STOL Aircraft: Wind tunnel investigation of rotating cylinder applied to training edge flaps for high lift & low-speed control.
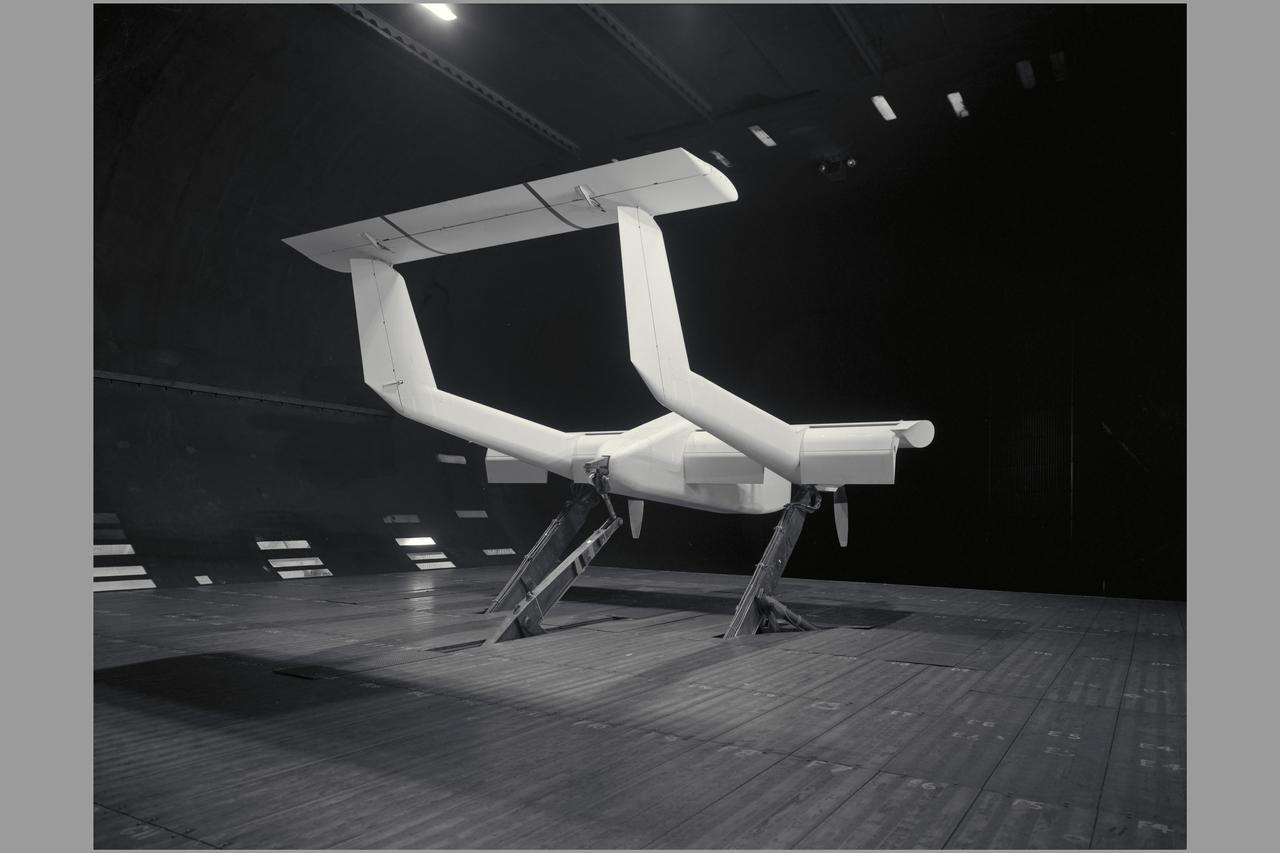
3/4 rear view of model with flaps down. V/STOL Aircraft: Wind tunnel investigation of rotating cylinder applied to training edge flaps for high lift & low-speed control.
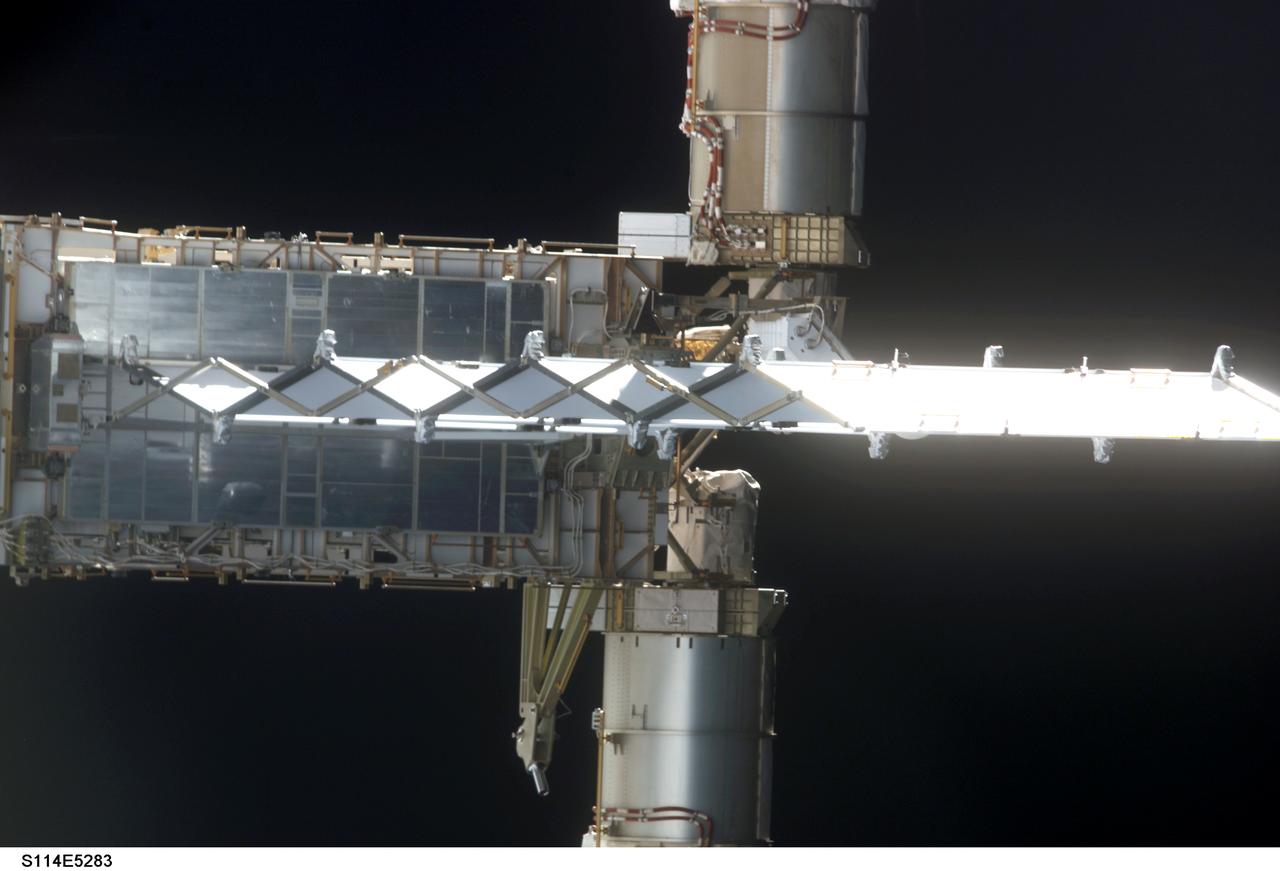
STS114-E-5283 (28 July 2005) --- This frame and STS114-E-5282 actually can be conjoined and rotated 90 degrees to make a single frame, providing an "astronaut's eye view" from Discovery's aft cabin looking toward the recently docked International Space Station. This frame shows the end of the P6 truss and a radiator panel. The two cropped cylinder-shaped objects are actually the base for the large solar array panels (out of frame).
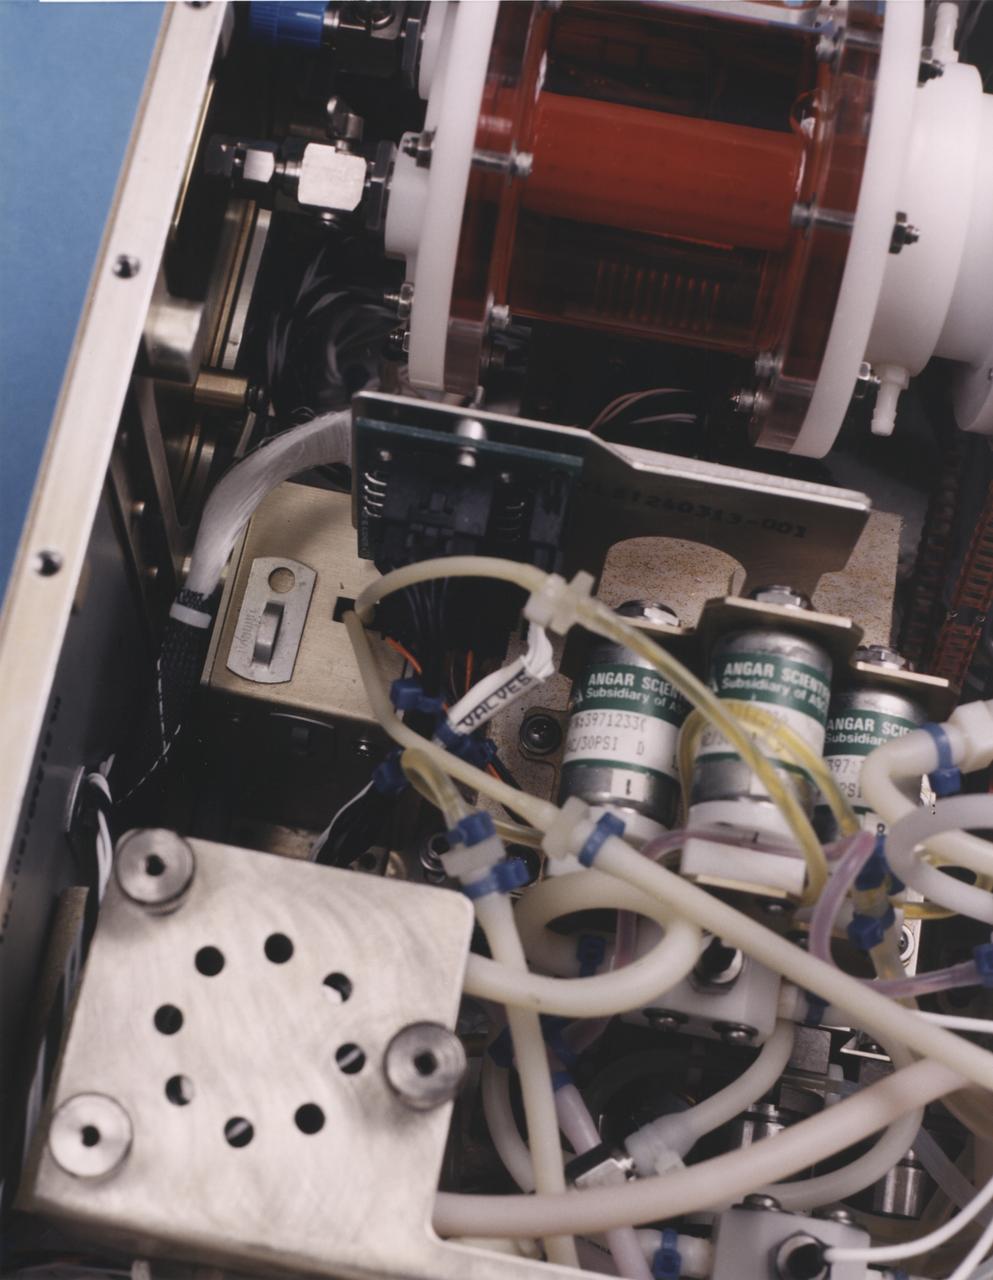
Close-up view of the interior of a NASA Bioreactor shows the plastic plumbing and valves (cylinders at right center) to control fluid flow. The rotating wall vessel is at top center. The NASA Bioreactor provides a low turbulence culture environment which promotes the formation of large, three-dimensional cell clusters. The Bioreactor is rotated to provide gentle mixing of fresh and spent nutrient without inducing shear forces that would damage the cells. Due to their high level of cellular organization and specialization, samples constructed in the bioreactor more closely resemble the original tumor or tissue found in the body. The work is sponsored by NASA's Office of Biological and Physical Research. The bioreactor is managed by the Biotechnology Cell Science Program at NASA's Johnson Space Center (JSC). NASA-sponsored bioreactor research has been instrumental in helping scientists to better understand normal and cancerous tissue development. In cooperation with the medical community, the bioreactor design is being used to prepare better models of human colon, prostate, breast and ovarian tumors. Cartilage, bone marrow, heart muscle, skeletal muscle, pancreatic islet cells, liver and kidney are just a few of the normal tissues being cultured in rotating bioreactors by investigators.
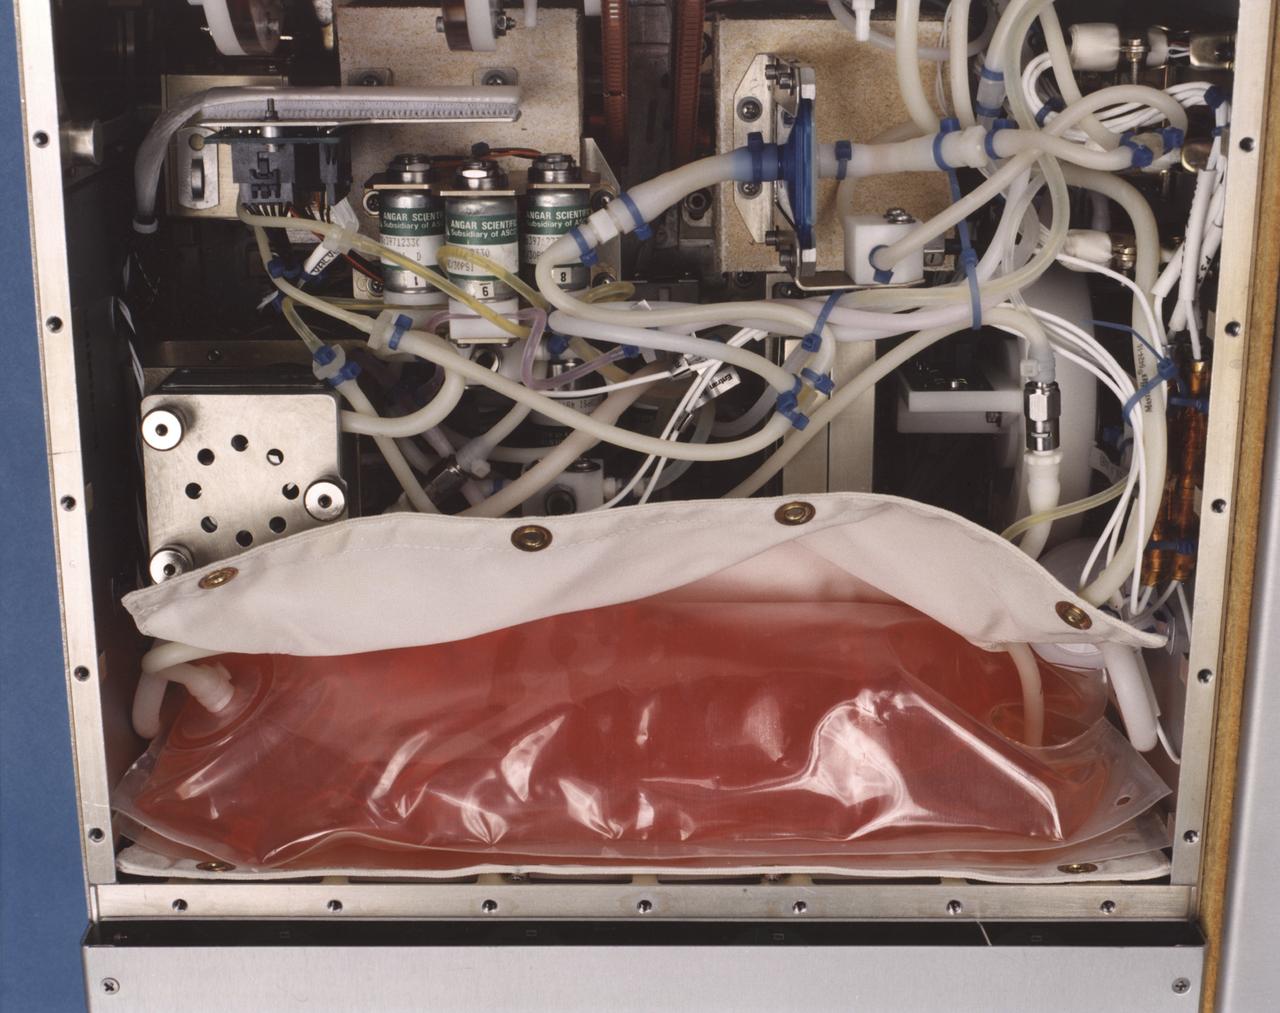
Close-up view of the interior of a NASA Bioreactor shows the plastic plumbing and valves (cylinders at center) to control fluid flow. A fresh nutrient bag is installed at top; a flattened waste bag behind it will fill as the nutrients are consumed during the course of operation. The drive chain and gears for the rotating wall vessel are visible at bottom center center. The NASA Bioreactor provides a low turbulence culture environment which promotes the formation of large, three-dimensional cell clusters. The Bioreactor is rotated to provide gentle mixing of fresh and spent nutrient without inducing shear forces that would damage the cells. Due to their high level of cellular organization and specialization, samples constructed in the bioreactor more closely resemble the original tumor or tissue found in the body. The work is sponsored by NASA's Office of Biological and Physical Research. The bioreactor is managed by the Biotechnology Cell Science Program at NASA's Johnson Space Center (JSC). NASA-sponsored bioreactor research has been instrumental in helping scientists to better understand normal and cancerous tissue development. In cooperation with the medical community, the bioreactor design is being used to prepare better models of human colon, prostate, breast and ovarian tumors. Cartilage, bone marrow, heart muscle, skeletal muscle, pancreatic islet cells, liver and kidney are just a few of the normal tissues being cultured in rotating bioreactors by investigators.
The large-scale structure of clouds in and around Hurricane Irma is seen in this animation and still image created with data from the Atmospheric Infrared Sounder (AIRS) instrument on NASA's Aqua satellite. The clouds are typical of tropical areas both nearby and away from tropical cyclones. Observations were taken at 1 p.m. EDT (5 p.m. UTC) on Tuesday, Sept. 5, 2017, as Irma approached the Caribbean islands and was just becoming a powerful Category 5 storm. Each cylinder represents a volume of cloud detected by AIRS. The oval cylinder ends represent a region viewed by AIRS, with the oval sizes adjusted to reflect the proportion of clouds filling the area viewed. The largest ovals are about 30 miles (45 kilometers) across. The height of the cylinders indicates the cloud thickness, with thickest clouds reaching down to the surface. The vertical scale is exaggerated 15 times. Colors represent temperatures at the tops of the clouds. The perspective views the storm diagonally from above with an initial view toward the north-northwest, with the perspective rotating clockwise for a full circle. The area depicted is about 1,000 miles by 800 miles across (1,600 by 1,300 kilometers). At the start of the loop, North America is seen at the top of the image, and coastal Venezuela at the lower right. In the initial perspective, cirrus clouds (thin and blue), associated with flow outward from the top of the hurricane, overlie warmer (pink and red) shallow clouds. About five seconds into the loop, the deep clouds in the middle of Irma are easily seen. The most dangerous parts of Irma are within the region of high and cold (blue), thick clouds surrounding the central eye. The clouds are cold because they are carried to high, cold altitudes by vigorous thunderstorms within the hurricane. The eye itself is nearly cloud free, but the few clouds within it are low and warm. As the perspective shift toward the south-southeast around seven seconds into the loop, another storm system well north of Irma can be seen. It contains high, thick clouds, with more cirrus carried outward over shallow clouds. At about nine seconds, more outflow from Irma is seen, with high, thin clouds over shallow clouds once again apparent. Shortly afterward when the view is toward the southwest, yet more deep clouds and their outflowing cirrus clouds are apparent. This image depicts many of the clouds typical of the tropics even when cyclones are not present: high, cold thunderstorms pushing cirrus clouds over nearby regions containing many warm, shallow clouds. The animation also shows the structure typical of tropical cyclones around the world: very strong thunderstorms lifting clouds into cold parts of the atmosphere, with strong outflow at upper levels carrying cirrus clouds away from the storm center, and the storm organized symmetrically around a central eye. https://photojournal.jpl.nasa.gov/catalog/PIA21950
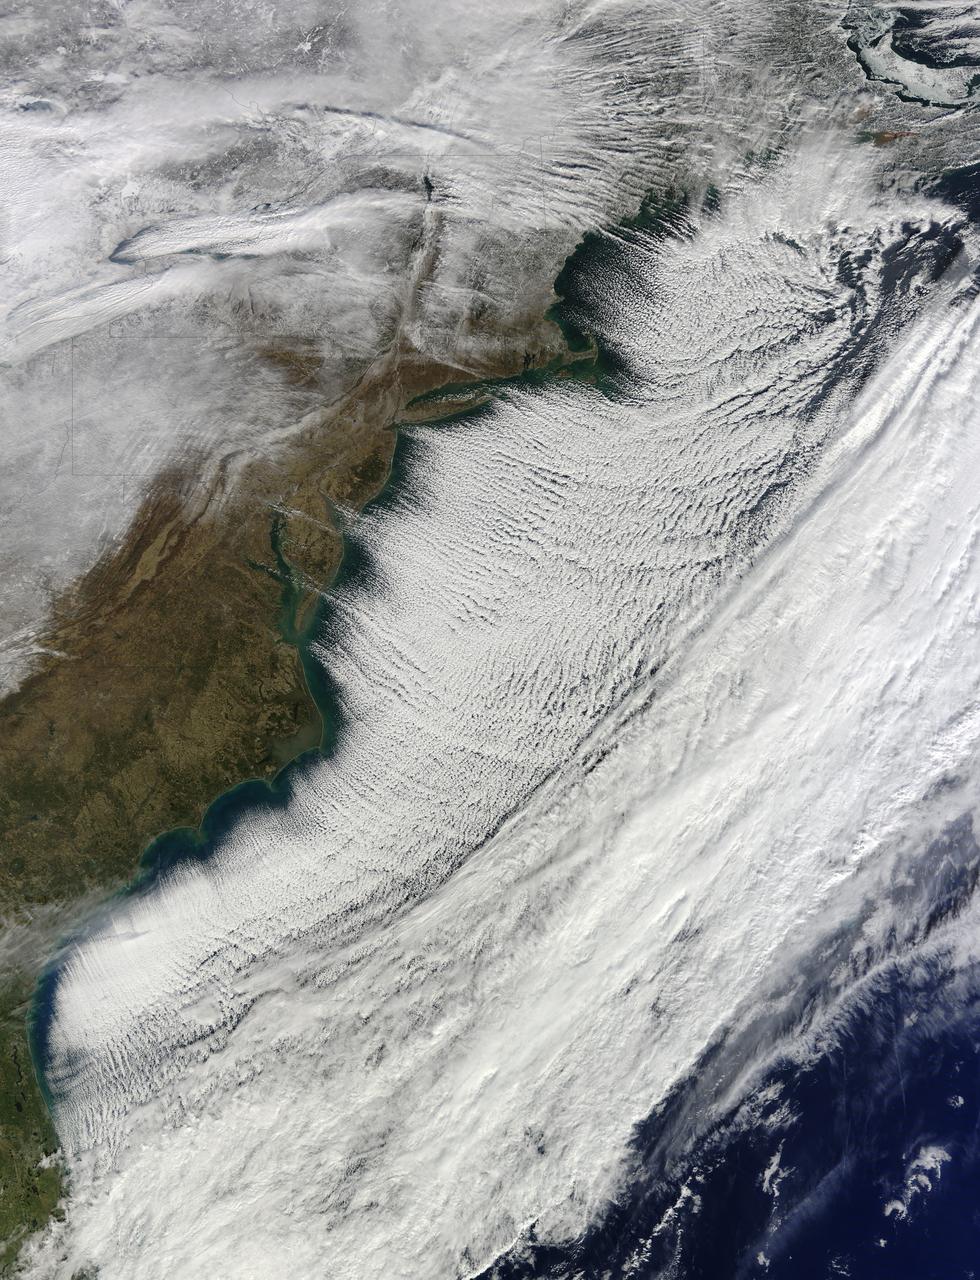
In the midst of a cold snap that sent temperatures 20–40°F (11–22°C) below normal across much of the United States, the Moderate Resolution Imaging Spectroradiometer (MODIS) on the Terra satellite captured this image of cloud streets over the Atlantic Ocean on January 7, 2014. Cloud streets—long parallel bands of cumulus clouds—form when cold air blows over warmer waters and a warmer air layer (or temperature inversion) rests over the top of both. The comparatively warm water gives up heat and moisture to the cold air above, and columns of heated air called thermals naturally rise through the atmosphere. The temperature inversion acts like a lid, so when the rising thermals hit it, they roll over and loop back on themselves, creating parallel cylinders of rotating air. As this happens, the moisture cools and condenses into flat-bottomed, fluffy-topped cumulus clouds that line up parallel to the direction of the prevailing wind. On January 7, the winds were predominantly out of the northwest. Cloud streets can stretch for hundreds of kilometers if the land or water surface underneath is uniform. Sea surface temperature need to be at least 40°F (22°C) warmer than the air for cloud streets to form. More info: <a href="http://earthobservatory.nasa.gov/NaturalHazards/view.php?id=82800" rel="nofollow">earthobservatory.nasa.gov/NaturalHazards/view.php?id=82800</a> NASA Earth Observatory image courtesy Jeff Schmaltz LANCE/EOSDIS MODIS Rapid Response Team, GSFC. Caption by Adam Voiland. Instrument: Terra - MODIS Credit: <b><a href="http://www.earthobservatory.nasa.gov/" rel="nofollow"> NASA Earth Observatory</a></b> <b><a href="http://www.nasa.gov/audience/formedia/features/MP_Photo_Guidelines.html" rel="nofollow">NASA image use policy.</a></b> <b><a href="http://www.nasa.gov/centers/goddard/home/index.html" rel="nofollow">NASA Goddard Space Flight Center</a></b> enables NASA’s mission through four scientific endeavors: Earth Science, Heliophysics, Solar System Exploration, and Astrophysics. Goddard plays a leading role in NASA’s accomplishments by contributing compelling scientific knowledge to advance the Agency’s mission. <b>Follow us on <a href="http://twitter.com/NASA_GoddardPix" rel="nofollow">Twitter</a></b> <b>Like us on <a href="http://www.facebook.com/pages/Greenbelt-MD/NASA-Goddard/395013845897?ref=tsd" rel="nofollow">Facebook</a></b> <b>Find us on <a href="http://instagram.com/nasagoddard?vm=grid" rel="nofollow">Instagram</a></b>
The Soil Moisture Active Passive (SMAP) mission, scheduled for launch on Jan. 29, will measure the moisture in Earth's soil with greater accuracy and higher resolution than any preceding mission, producing a global map of soil moisture every three days. Here are five quick facts about the spacecraft and what it studies. 1. Soil moisture is a tiny fraction of water with a big punch. Only 0.001 percent of Earth's total water is lodged in the top few feet of soil. That tiny percentage, however, affects all living things on land and plays an important role in moving water, carbon and heat between land and atmosphere. 2. Soil moisture can compound water risks. A flood follows a heavy rainfall -- but only if the ground cannot soak up the rain. Waterlogged soil makes a region more flood-prone. Going to the opposite extreme, a drought can parch soil to such an extent that plants are unable to grow even after a few rains have fallen. Knowing soil moisture allows hydrologists to make better decisions related to the risk of flooding and drought, such as how much water to retain in reservoirs. 3. Soil moisture controls the on-off switch for carbon dioxide cleanup. The world's vast northern forests remove carbon dioxide from the air as they grow, helping to clean up our emissions from burning fossil fuels. But when the ground freezes, that process switches off. Carbon dioxide builds up in the atmosphere until the ground thaws in the spring and plants begin growing again. Knowing where and for how long the ground is frozen or thawed is an important part of understanding the role of the northern forests in reducing greenhouse warming. SMAP will map frozen and thawed soils north of 45 degrees north latitude (about the latitude of Minneapolis), around the globe. 4. SMAP is a twofer. The spacecraft's radiometer produces an accurate reading of how much moisture is in the top two inches (five centimeters) of soil, but it has low spatial resolution, that is, one measurement covers a large area. A radar instrument produces an image with higher spatial resolution, but it can't measure soil moisture as accurately as a radiometer. Through sophisticated data processing, SMAP combines observations from the two instruments into a very accurate measurement with high spatial resolution. 5. SMAP has a huge, folding, spinning antenna. At 19 feet 8 inches (6 meters) in diameter, SMAP's rotating mesh antenna dwarfs the size of the instruments and spacecraft and is the largest rotating antenna of its kind that NASA has yet deployed. But the entire dish furls into a cylinder one foot (diameter) by four feet (30 by 120 centimeters) to fit inside the rocket’s fairing for launch, and it weighs only 128 pounds (about 58 kilograms). For more information about SMAP, see: <a href="http://smap.jpl.nasa.gov/" rel="nofollow">smap.jpl.nasa.gov/</a> <a href="http://www.nasa.gov/smap/" rel="nofollow">www.nasa.gov/smap/</a> <b><a href="http://www.nasa.gov/audience/formedia/features/MP_Photo_Guidelines.html" rel="nofollow">NASA image use policy.</a></b> <b><a href="http://www.nasa.gov/centers/goddard/home/index.html" rel="nofollow">NASA Goddard Space Flight Center</a></b> enables NASA’s mission through four scientific endeavors: Earth Science, Heliophysics, Solar System Exploration, and Astrophysics. Goddard plays a leading role in NASA’s accomplishments by contributing compelling scientific knowledge to advance the Agency’s mission. <b>Follow us on <a href="http://twitter.com/NASAGoddardPix" rel="nofollow">Twitter</a></b> <b>Like us on <a href="http://www.facebook.com/pages/Greenbelt-MD/NASA-Goddard/395013845897?ref=tsd" rel="nofollow">Facebook</a></b> <b>Find us on <a href="http://instagram.com/nasagoddard?vm=grid" rel="nofollow">Instagram</a></b>