
Goddard Spring Run was held on May 2, 2108 near Child Development Center

Goddard Spring Run was held on May 2, 2018 near Child Development Center First, Second and Third Place winners

Goddard’s 85th Intracenter Run was held on May 2, 2018 near Child Development Center 1/2/3 place in Children’s race
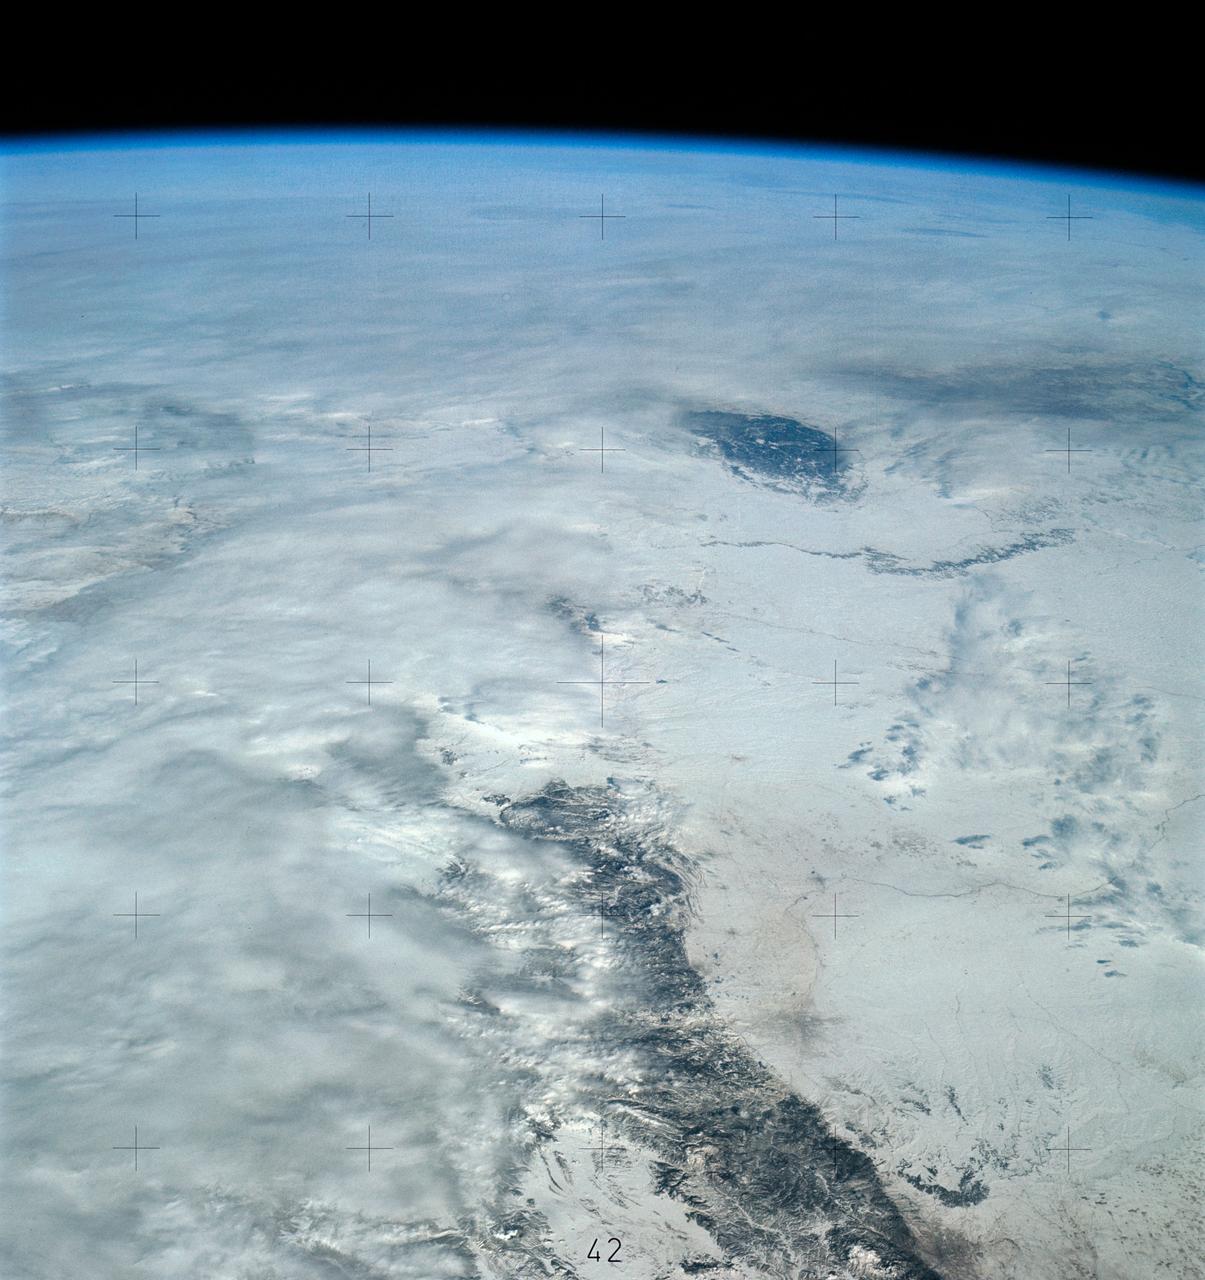
SL4-139-4040 (10 Jan. 1974) --- An oblique view of a portion of the Western United States, as photographed from the Skylab space station in Earth orbit by one of the Skylab 4 crewmen. The camera used was a hand-held 70mm Hasselblad, with SO-368 medium-speed Ektachrome film. This photograph is one of a stereo pair (the other being 4039) taken to support the hydrological studies of the changing snow patterns in several watersheds. Stereo analysis will enable snow to be distinguished from clouds quantitatively. In a qualitative sense, the clouds are the fuzzy white, whereas the snow is distinct white. The area covered is from the Colorado Springs, Colorado area at the south to (and beyond) the Black Hills, South Dakota area. The Black Forest between Colorado Springs and Denver is evident as are the mountains west of these cities. South Park, west of Colorado Springs, and the South Platte River running north and east from Denver are two other conspicuous features. Photo credit: NASA

NASA's Marshall Space Flight Center showcased it's various projects for the public in Huntsville, Alabama's Big Spring Park. Exhibits were displayed by all of the various directorates of the Center with employee volunteers explaining all aspects of their projects. Adding to the festivities was the attendance of retired NASA astronaut Robert "Hoot" Gibson. A view of the canal running through the park showing a small portion of the crowd attending NASA Day in the Park.
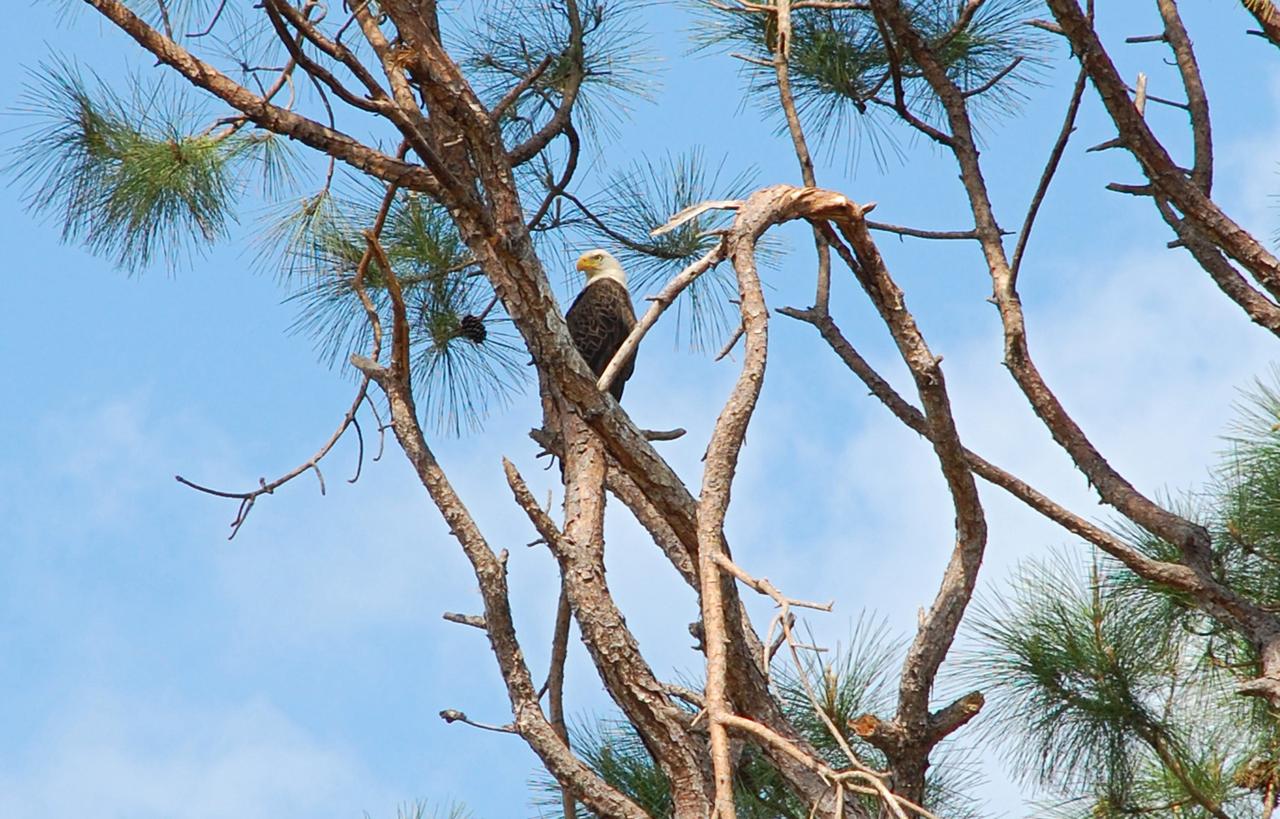
CAPE CANAVERAL, Fla. – A mature eagle stands watch near its nest, out of sight, which holds a young eagle. The nest is in a pine tree on S.R. 3 that runs through NASA's Kennedy Space Center in Florida. There are a dozen eagle nests within Kennedy and in the surrounding Merritt Island National Wildlife Refuge. Bald eagles use a specific territory for nesting (they mate for life), winter feeding or a year-round residence. Its natural domain is from Alaska to Baja, California, and from Maine to Florida. The Merritt Island refuge also includes several wading bird rookeries, many osprey nests, up to 400 manatees during the spring, and approximately 2,500 Florida scrub jays. It also is a major wintering area for migratory birds. More than 500 species of wildlife inhabit the refuge, with 15 considered federally threatened or endangered. Photo credit: NASA/Ben Smegelsky

Data from NASA's ECOSTRESS (Ecosystem Spaceborne Thermal Radiometer Experiment on Space Station) instrument aboard the International Space Station shows three wildfires burning in the mountains east and southeast of the Los Angeles area on Sept. 10, 2024. The Bridge Fire started Sept. 8 in the Angeles National Forest during an intense heat wave that blanketed the area for about a week. As of Sept. 13, the fire was only 3% contained. The Line Fire started Sept. 5 in Highland, within San Bernardino County, and spread toward the mountain communities of Running Springs and Big Bear. After more than a week of battling the blaze, firefighters had the conflagration 21% contained. The Airport Fire ignited Sept. 9 in the foothills of the Santa Ana Mountains east of the Orange County city of Irvine and spread into Riverside County. As of Sept. 13, it was 8% contained. The ECOSTRESS instrument measures the temperature of the land rather than air temperatures that most people are familiar with in weather forecasts. Bright white spots in the active fire areas in the visual above indicate a land surface temperature of over 300 degrees Fahrenheit (149 degrees Celsius). Dark red represents areas closer to 100 F (38 C). https://photojournal.jpl.nasa.gov/catalog/PIA26187
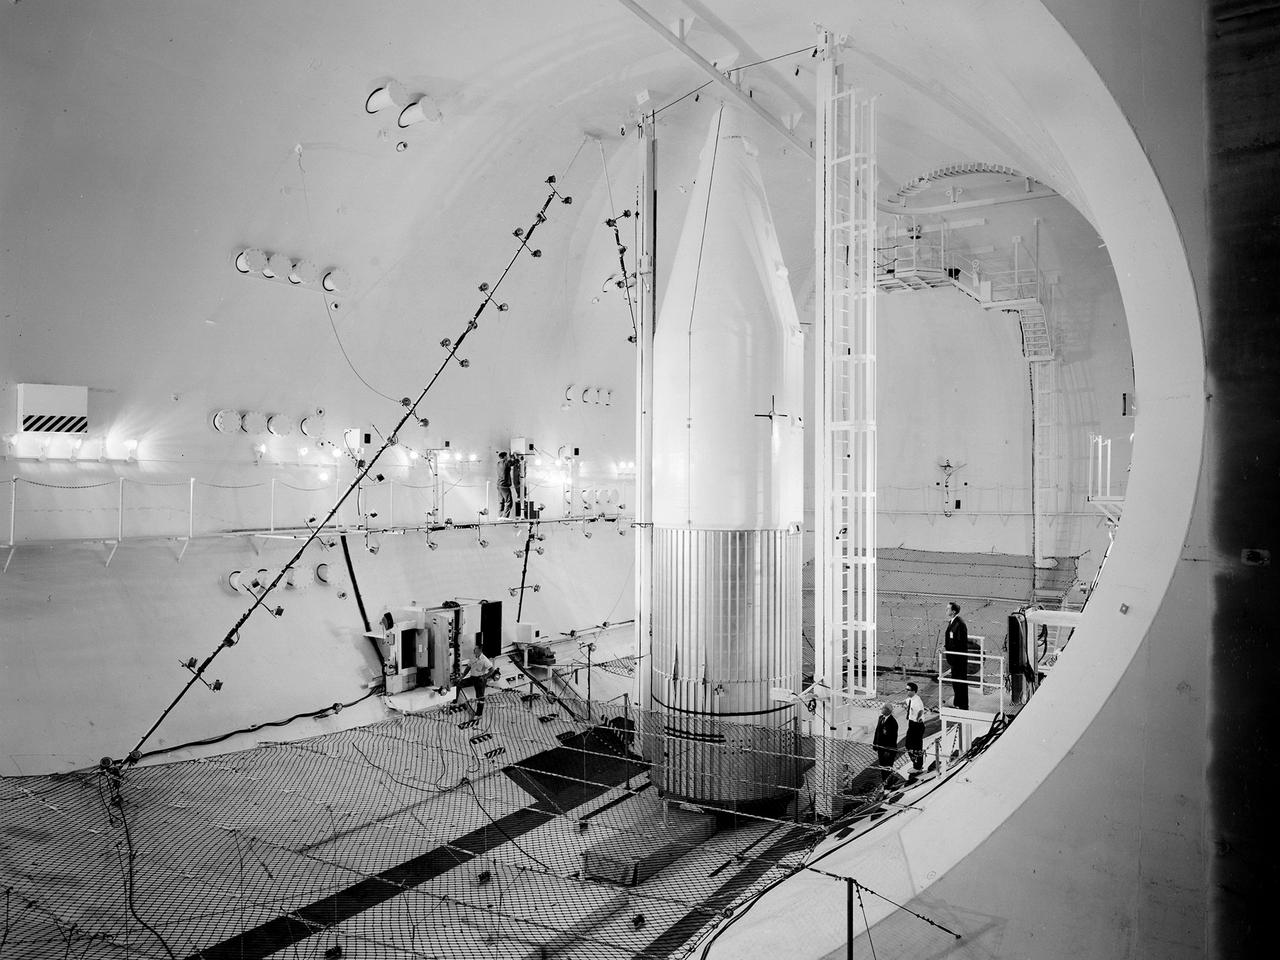
Preparations for a shroud jettison test for the Orbiting Astronomical Observatory-1 (OAO-1) satellite in the Space Power Chambers facility at the National Aeronautics and Space Administration (NASA) Lewis Research Center. The satellite was to be launched on an Atlas-Agena rocket in the spring of 1966. The 3900-pound payload was the heaviest ever attempted by Agena. The satellite was the first of three equipped with powerful telescopes to study ultraviolet data from specific stars and galaxies. In-depth observations were not possible from Earth-bound telescopes because of the filtering and distortion of the atmosphere. The OAO-1 satellite was wider in diameter than the Agena stage, so a new clamshell shroud was created to enclose both the satellite and the Agena. The clamshell shroud consisted of three sections that enclosed both the Agena and OAO-1: a fiberglass nose fairing and aluminum mid and aft fairings. The upper two fairings separated when the Atlas engines stopped, and the aft fairing fell away with the Atlas upon separation from the upper stages The large altitude tank in the Space Power Chambers could simulate altitudes up to 100,000 feet. Three shroud jettison tests were run in July 1965 and the first week of August at a simulated altitude of 20 miles. The April 8, 1966 launch from Cape Canaveral went smoothly, but the OAO-1 satellite failed after only 90 minutes due to a battery failure.
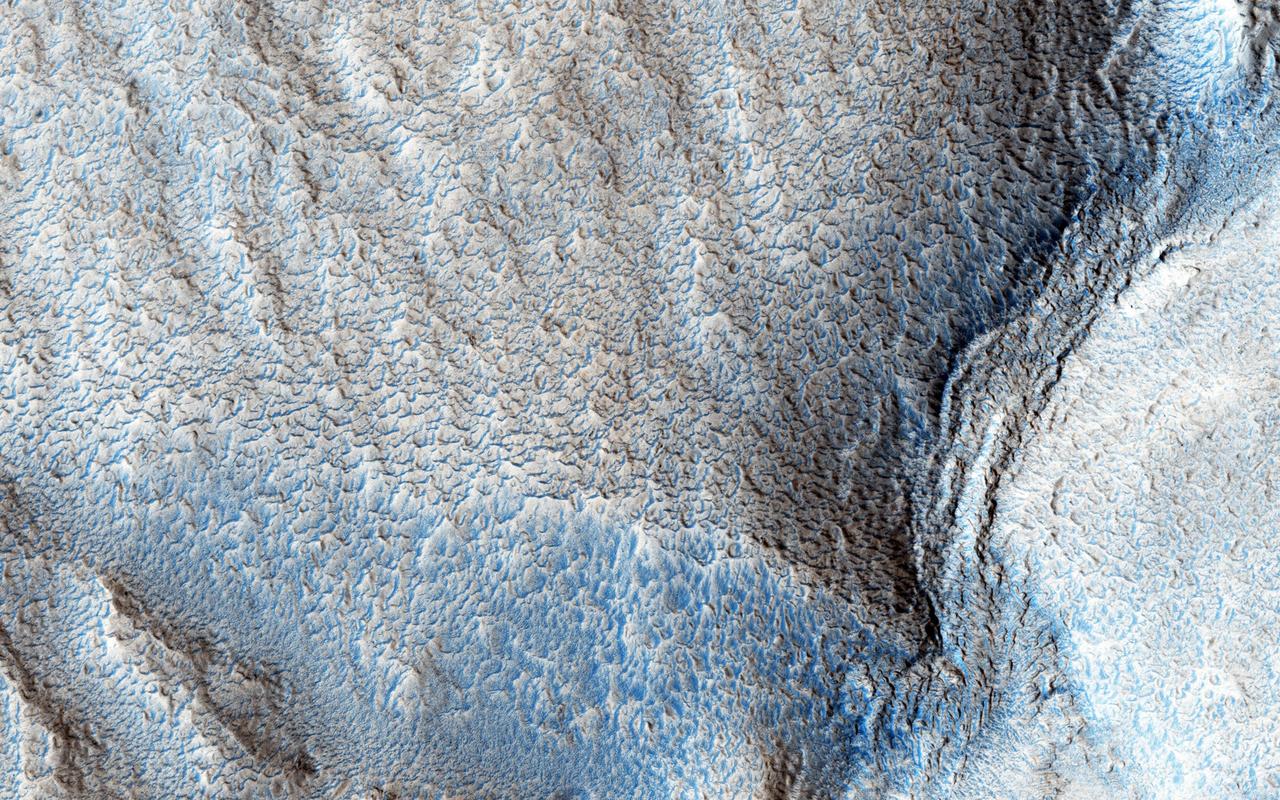
Early in Martian history, liquid water energetically carved the surface, forming channel systems that look remarkably similar to river valleys and drainage networks on Earth. Exactly how these channels formed -- by rainfall, snowmelt, or seepage from underground springs -- is often debated. The answer has important ramifications about the early Martian climate. Clues about the source of the water may indicate the shape, layout, and scale of the various tributaries in a channel system. Our image shows an example of just such a water-carved channel. The channel pattern, called "dendritic" because of its tree-like branching, begins at the top of the image and runs down over the rim of an ancient impact basin across the basin floor. The soil surface overlying these channels, and indeed the entire landscape, has been changed and reworked over the intervening millions of years, by the combined actions of wind and ice. Over time, the original channels become muted or even erased. Nevertheless, some characteristics of the smallest tributary channels are still visible at scales seen by HiRISE. http://photojournal.jpl.nasa.gov/catalog/PIA20337
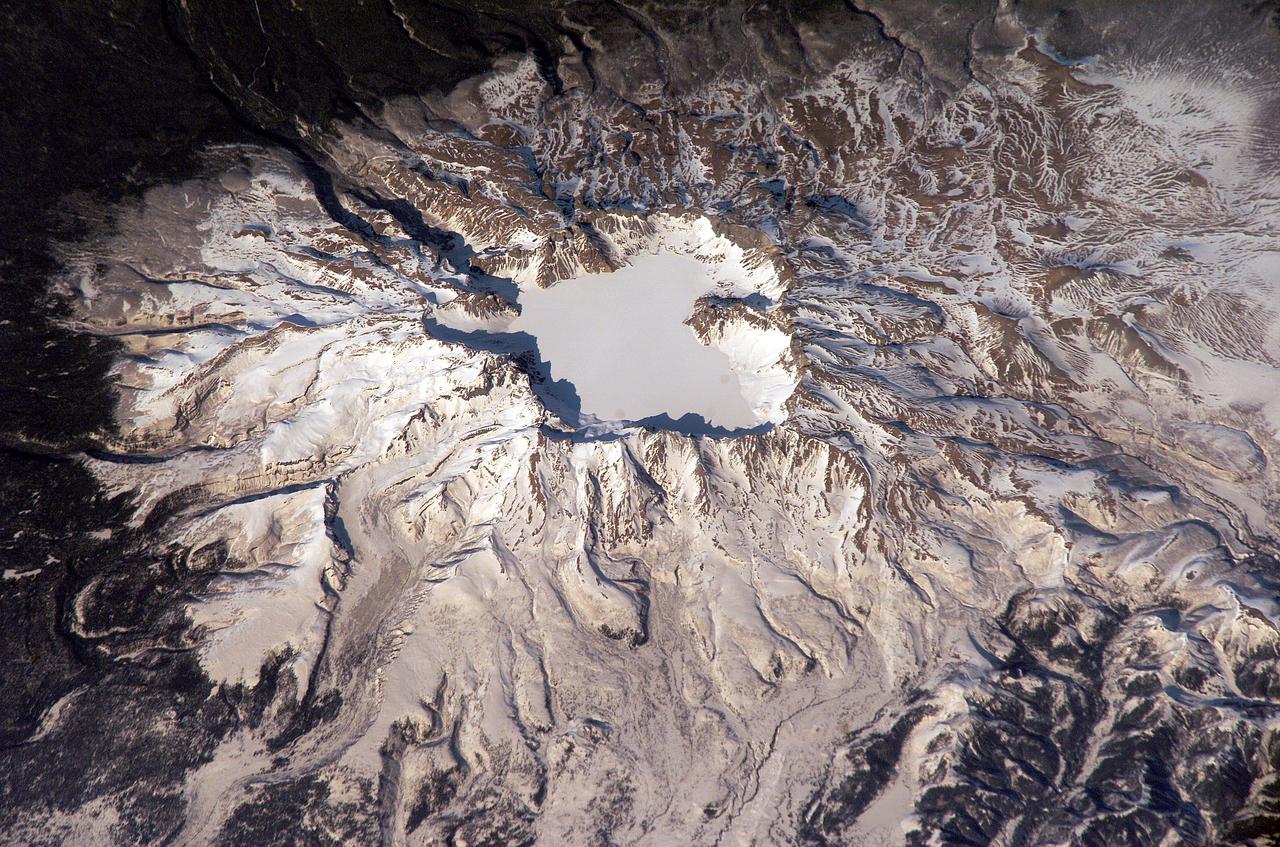
ISS006-E-43366 (4 April 2003) --- This view featuring Baitoushan Volcano, China and North Korea, was photographed by an Expedition 6 crewmember on the International Space Station (ISS). One of the largest known Holocene eruptions occurred at Baitoushan Volcano (also known as Changbaishan in China and P’aektu-san in Korea) about 1000 A.D., with erupted material deposited as far away as northern Japan – a distance of approximately 1200 kilometers. The eruption also created the 4.5 kilometer diameter, 850 meters deep summit caldera of the volcano that is now filled with the waters of Lake Tianchi (or Sky Lake). This oblique photograph was taken during the winter season, and snow highlights frozen Lake Tianchi along with lava flow lobes along the southern face of the volcano. Baitoushan last erupted in 1702 and is considered a dormant volcano. Gas emissions were reported from the summit and nearby hot springs in 1994, but no evidence of renewed activity of the volcano was observed. The Chinese-Korean border runs directly through the center of the summit caldera, and the mountain is considered sacred by the dominantly Korean population living near the volcano. Lake Tianchi is a popular resort destination, both for its natural beauty and alleged sightings of unidentified creatures living in its depths (similar to legendary Loch Ness Monster in Scotland).
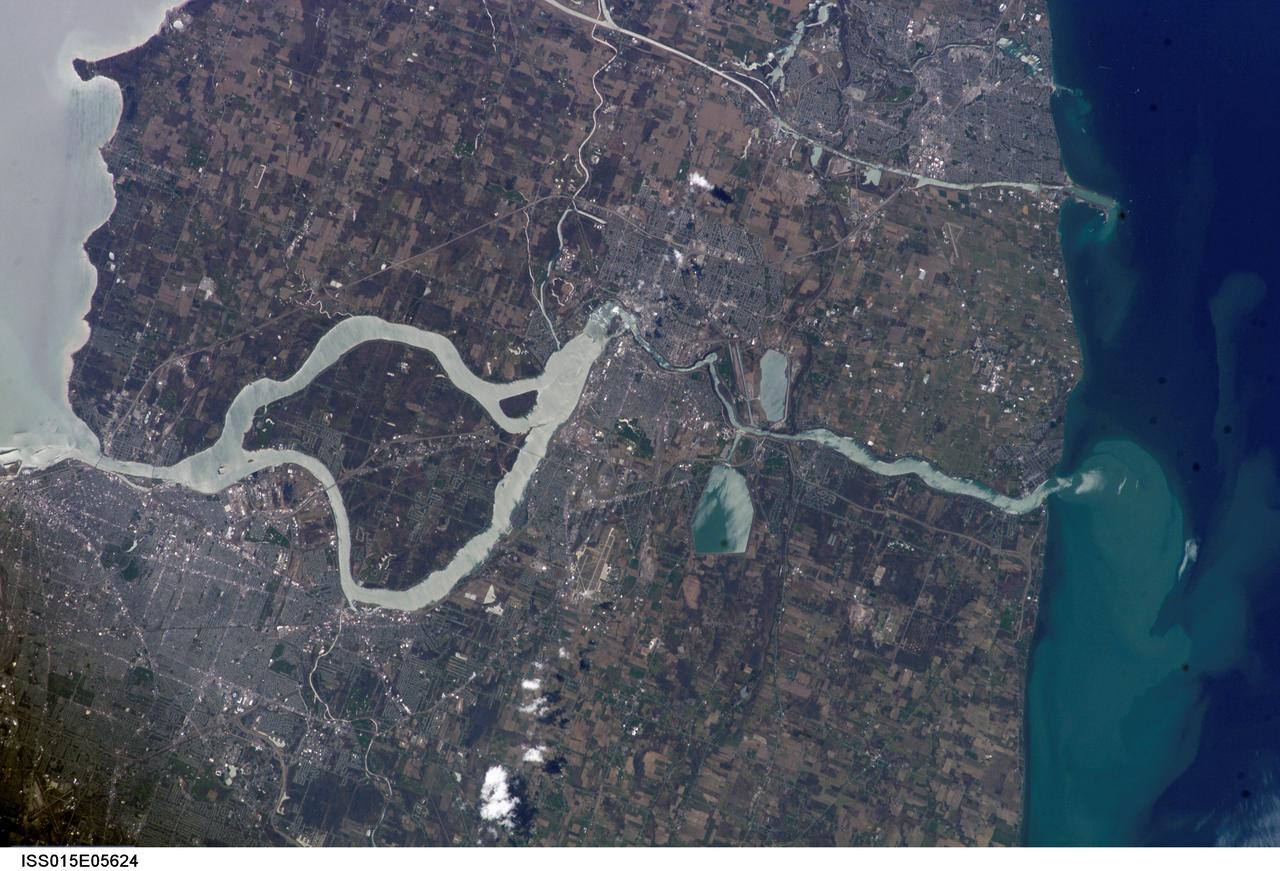
ISS015-E-05624 (29 April 2007) --- The Niagara River, eastern end of Lake Erie and western end of Lake Ontario are featured in this image photographed by an Expedition 15 crewmember on the International Space Station. In contrast, an image photographed by an Expedition 14 crewmember just a month earlier on March 21, 2007 (ISS014-E-17999) shows Lake Erie clogged with ice that is pushed against the shore line by the prevailing weather systems from the west. These two images document the breakup of the Lake Erie ice pack, the unofficial signature of spring for residents of Buffalo and Niagara Falls. During the winter months, the ice collects in Lake Erie and is prevented from flowing down the Niagara River (the international boundary between Ontario, Canada and New York State) by the Lake Erie-Niagara River Ice Boom. The 2,680-meter (8,800-foot) boom, administered by the 1909 Boundary Water Treaty's International Niagara Board of Control, is deployed each December. Operational since 1964, the boom serves several functions: it protects the water intakes for the Niagara River power plants, and minimizes ice runs and ice blockages that can create damage and flooding along the river. At the height of winter, the thickness of the ice at the Buffalo harbor can reach 3.5 meters (12 feet). The removal of the ice boom, usually in early April, is now marked by local celebrations. This year the boom was removed in mid-April, a bit later than usual.
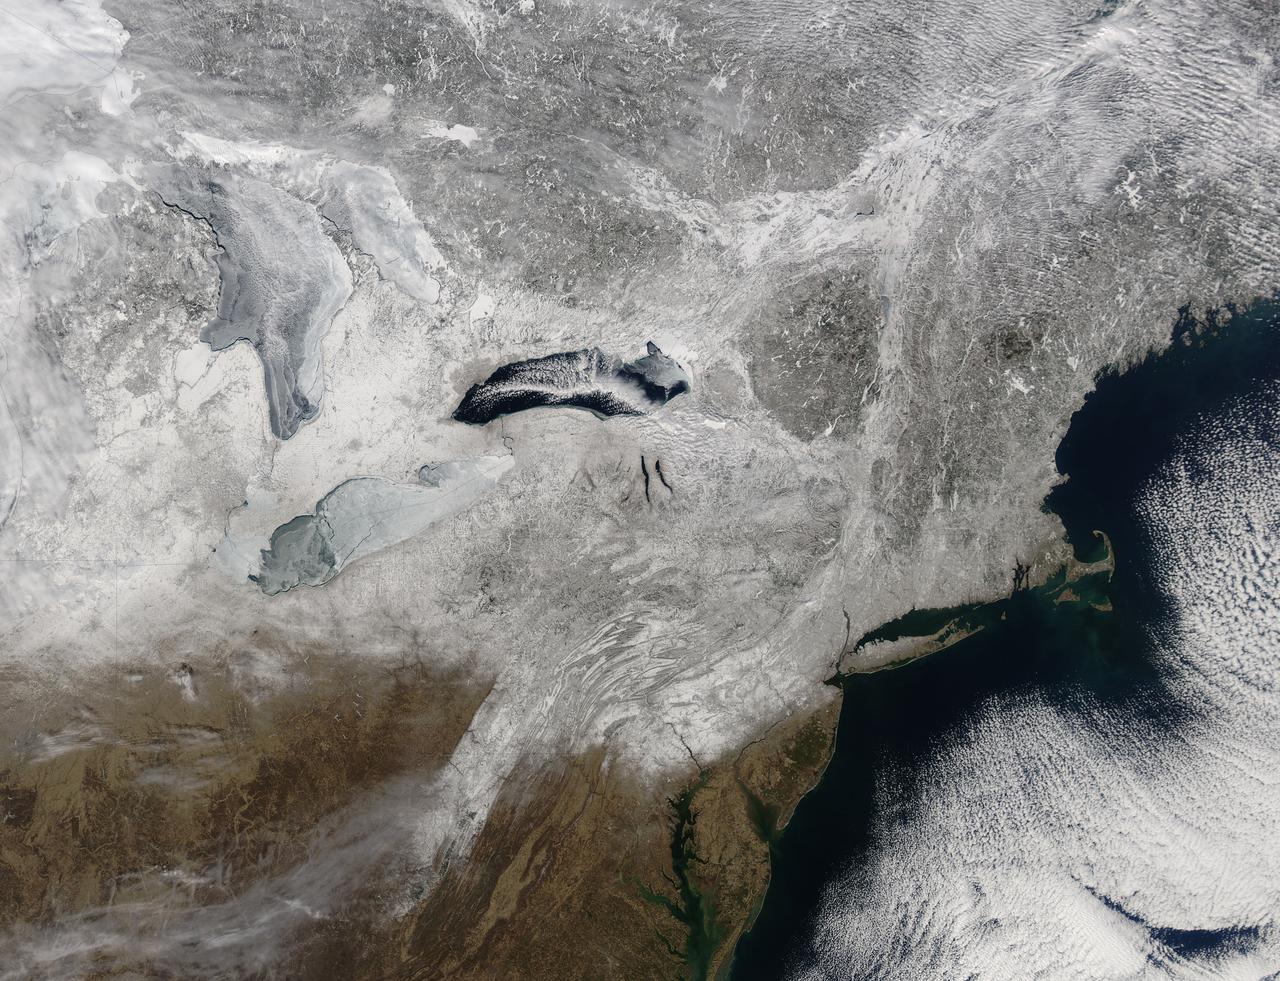
Snow covered the northeastern United States on last day of meteorological winter, 2014. Climatologists and meteorologists break seasons down into three-month groups, based on annual temperature and our calendar. This method is helpful for weather observing and forecasting, and for planning consistent agricultural dates, such as expected first frosts or best planting date. Meteorological winter – the season where temperatures are, on average, coldest and when snow is most likely to fall – runs from December 1 to February 28 in the United States and Canada. Winter can also be defined by the astronomical calendar, which is based on the rotation of the Earth around the sun. In this method, the seasons are defined by two solstices (times when the sun’s path is furthest from the Earth’s equator) and two equinoxes (the times when the sun passes directly above the equator). In the Northern Hemisphere, winter begins on the winter solstice, which falls on or around December 22 and ends on or around March 21, at the vernal (spring) equinox. On February 28, 2014, the Moderate Resolution Imaging Spectroradiometer aboard NASA’s Aqua satellite captured this true-color image of a sunny winter day in the northeastern United States. Snow stretches from Maine west to Indiana and south along the ridges of the Appalachian Mountains well into West Virginia. In Canada, the landscape appears greener, primarily because snow lies on conifers (evergreen) trees in the boreal forest regions. The Great Lakes, with the exception of Lake Ontario, are almost completely covered with ice. Credit: NASA/GSFC/Jeff Schmaltz/MODIS Land Rapid Response Team <b><a href="http://www.nasa.gov/audience/formedia/features/MP_Photo_Guidelines.html" rel="nofollow">NASA image use policy.</a></b> <b><a href="http://www.nasa.gov/centers/goddard/home/index.html" rel="nofollow">NASA Goddard Space Flight Center</a></b> enables NASA’s mission through four scientific endeavors: Earth Science, Heliophysics, Solar System Exploration, and Astrophysics. Goddard plays a leading role in NASA’s accomplishments by contributing compelling scientific knowledge to advance the Agency’s mission. <b>Follow us on <a href="http://twitter.com/NASAGoddardPix" rel="nofollow">Twitter</a></b> <b>Like us on <a href="http://www.facebook.com/pages/Greenbelt-MD/NASA-Goddard/395013845897?ref=tsd" rel="nofollow">Facebook</a></b> <b>Find us on <a href="http://instagram.com/nasagoddard?vm=grid" rel="nofollow">Instagram</a></b>
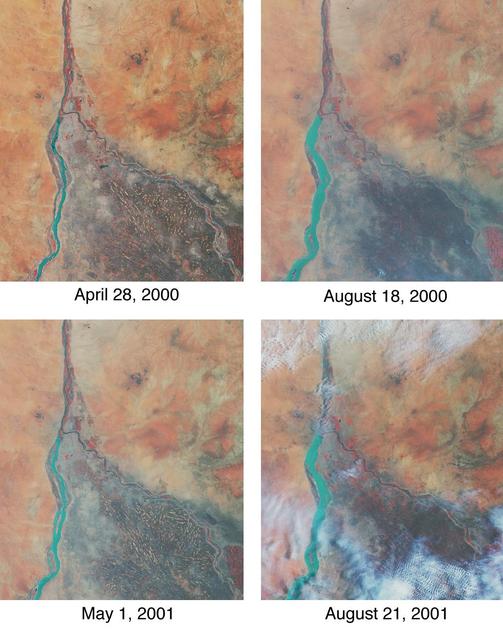
Throughout history, the rising and falling waters of the mighty Nile River have directly impacted the lives of the people who live along its banks. These images of the area around Sudan's capital city of Khartoum capture the river's dynamic nature. Acquired by the Multi-angle Imaging SpectroRadiometer's nadir (vertical-viewing) camera, they display the extent of the Nile waters before and after the onset of the rainy seasons of 2000 (top pair) and 2001 (bottom pair). The images are displayed in "false color," using the camera's near-infrared, green, and blue bands. With this particular spectral combination, water appears in shades of blue and turquoise, and highly vegetated areas show up as bright red. Originating in Uganda and Ethiopia, respectively, the waters of the White Nile (western branch) and Blue Nile (eastern branch) converge at Khartoum (about half-way between image center and the left-hand side), and continue to flow northward as the Great Nile. Although the most obvious feature in these images is the increased width of the White Nile between spring and summer, careful inspection shows that the Great Nile is at its widest in August 2001 (note in particular the area between the clouds near the top of this panel). Heavy rains in the Blue Nile catchment area of the Ethiopian highlands led to a rapid overflow of the river's floodwaters into the main stream of the Great Nile, leading to extensive flooding, the worst effects of which occurred north of Khartoum. According to the Food and Agriculture Organization of the United Nations, tens of thousands of people have fled their homes, and the number of people in need of urgent food assistance in Sudan, estimated at three million earlier in the year, was likely to increase with the onset of these floods. South of the confluence of the White Nile and the Blue Nile, the area of a cross-hatched appearance is the irrigated plain of El Gezira. The Gezira irrigation scheme uses water from the Makwar Dam (now called the Sennar Dam), located across the Blue Nile south of Khartoum. Among the main agricultural products of this region are cotton, millet, peanuts and fodder crops. Overall prospects for Sudan's 2001 grain crop were already poor prior to the flooding due to a late start of the rainy season in parts of the country. Following two consecutive years of serious drought, precipitation arrived too late to save the grain harvest that normally begins in late August. Lower harvests for the past two years coupled with depletion of stocks have led to a rise in cereal prices, reducing access to food for the Sudan's poorer citizens, already suffering from the effects of Africa's longest running civil war. Each of these images represents an area of about 130 kilometers x 150 kilometers. The data were obtained during Terra orbits 1922, 3553, 7281, and 8912. http://photojournal.jpl.nasa.gov/catalog/PIA03420
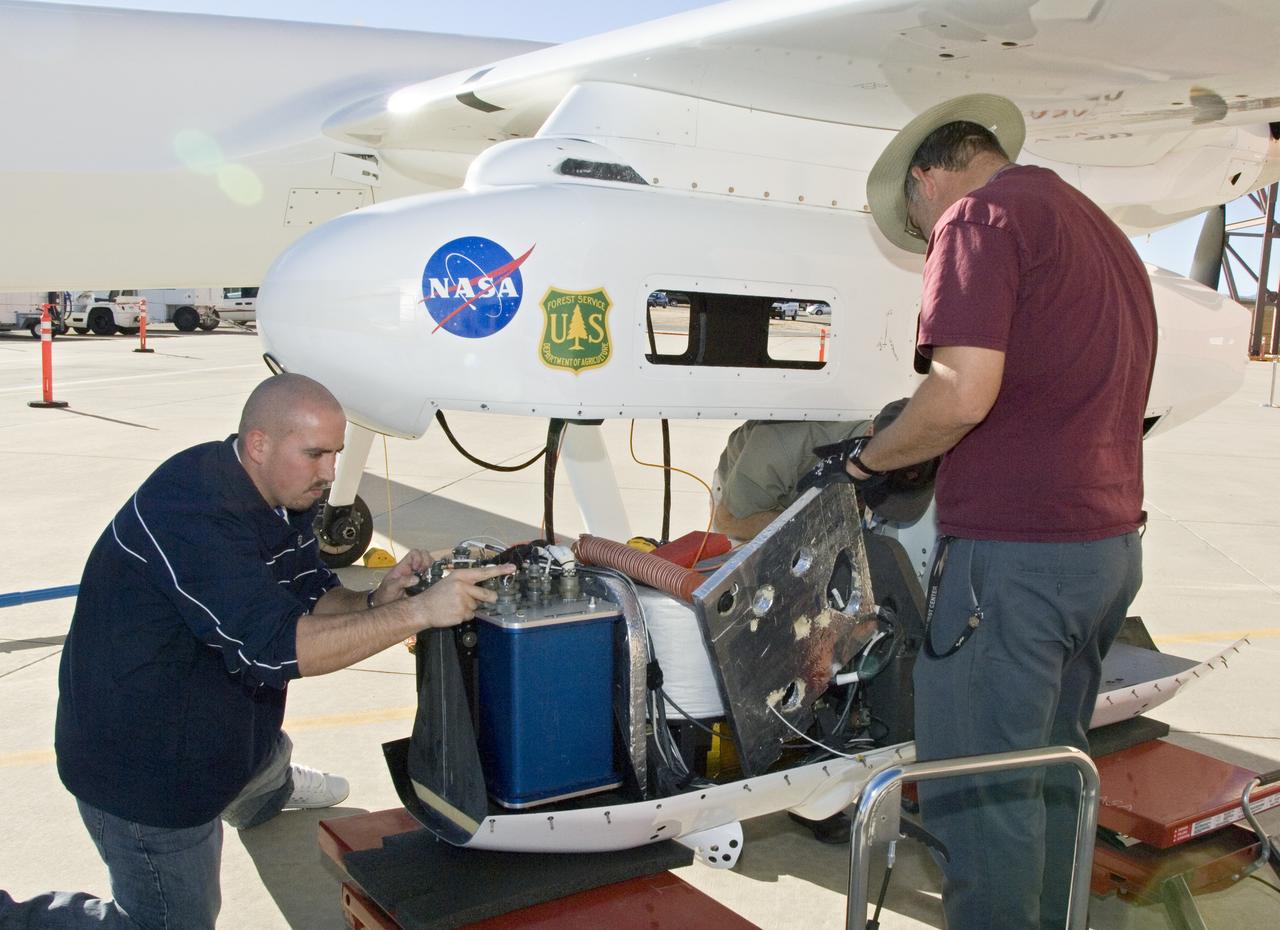
NASA Dryden's Ikhana ground crewmen Gus Carreno and James Smith load the thermal-infrared imaging scanner pallet into the Ikhana's underwing payload pod.
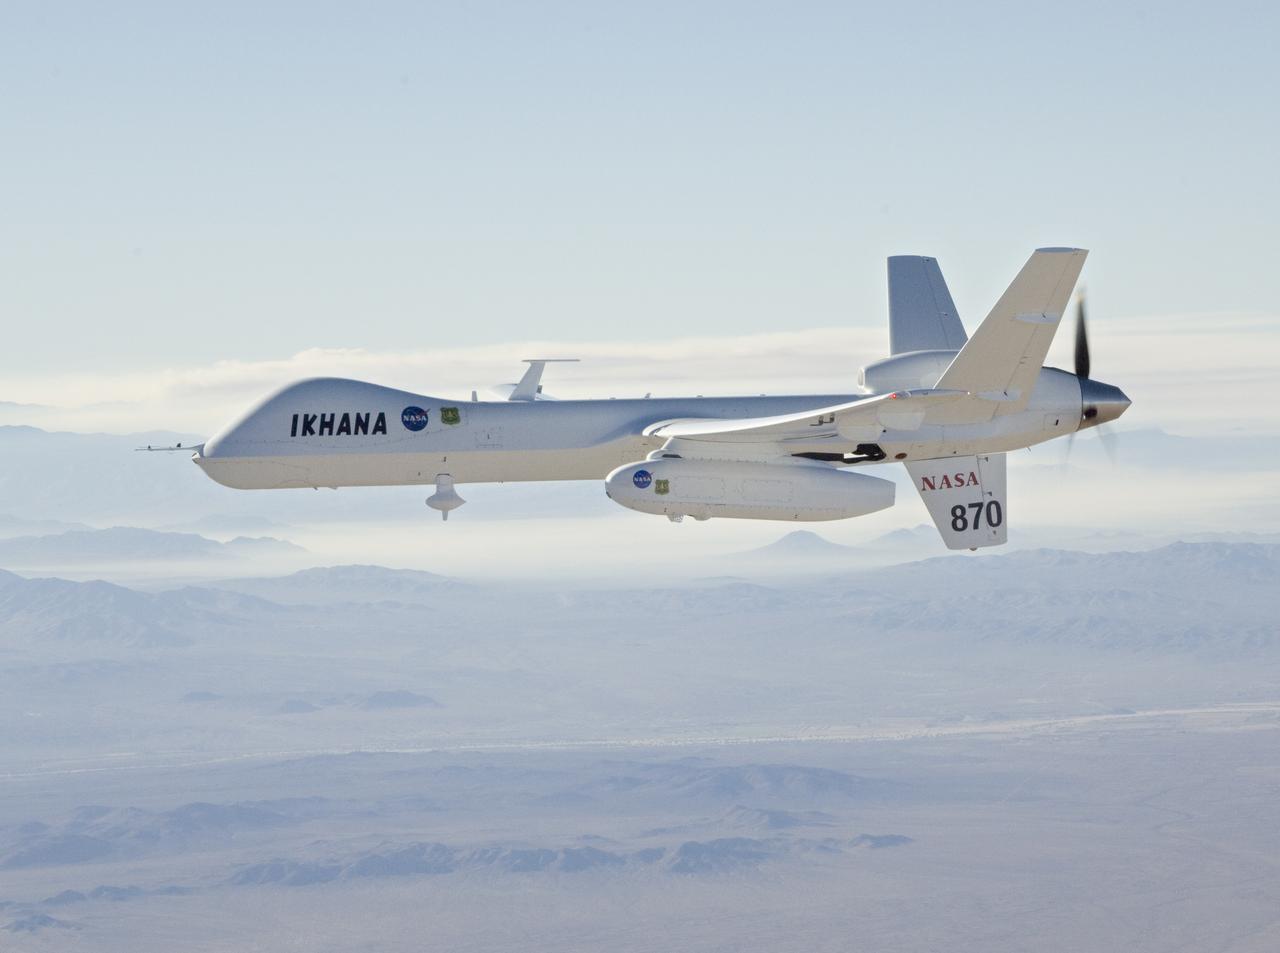
With smoke from the Lake Arrowhead area fires streaming in the background, NASA's Ikhana unmanned aircraft heads out on a Southern California wildfires imaging mission.

With smoke from the Lake Arrowhead area fires streaming in the background, NASA's Ikhana unmanned aircraft heads out on a Southern California wildfires imaging mission.
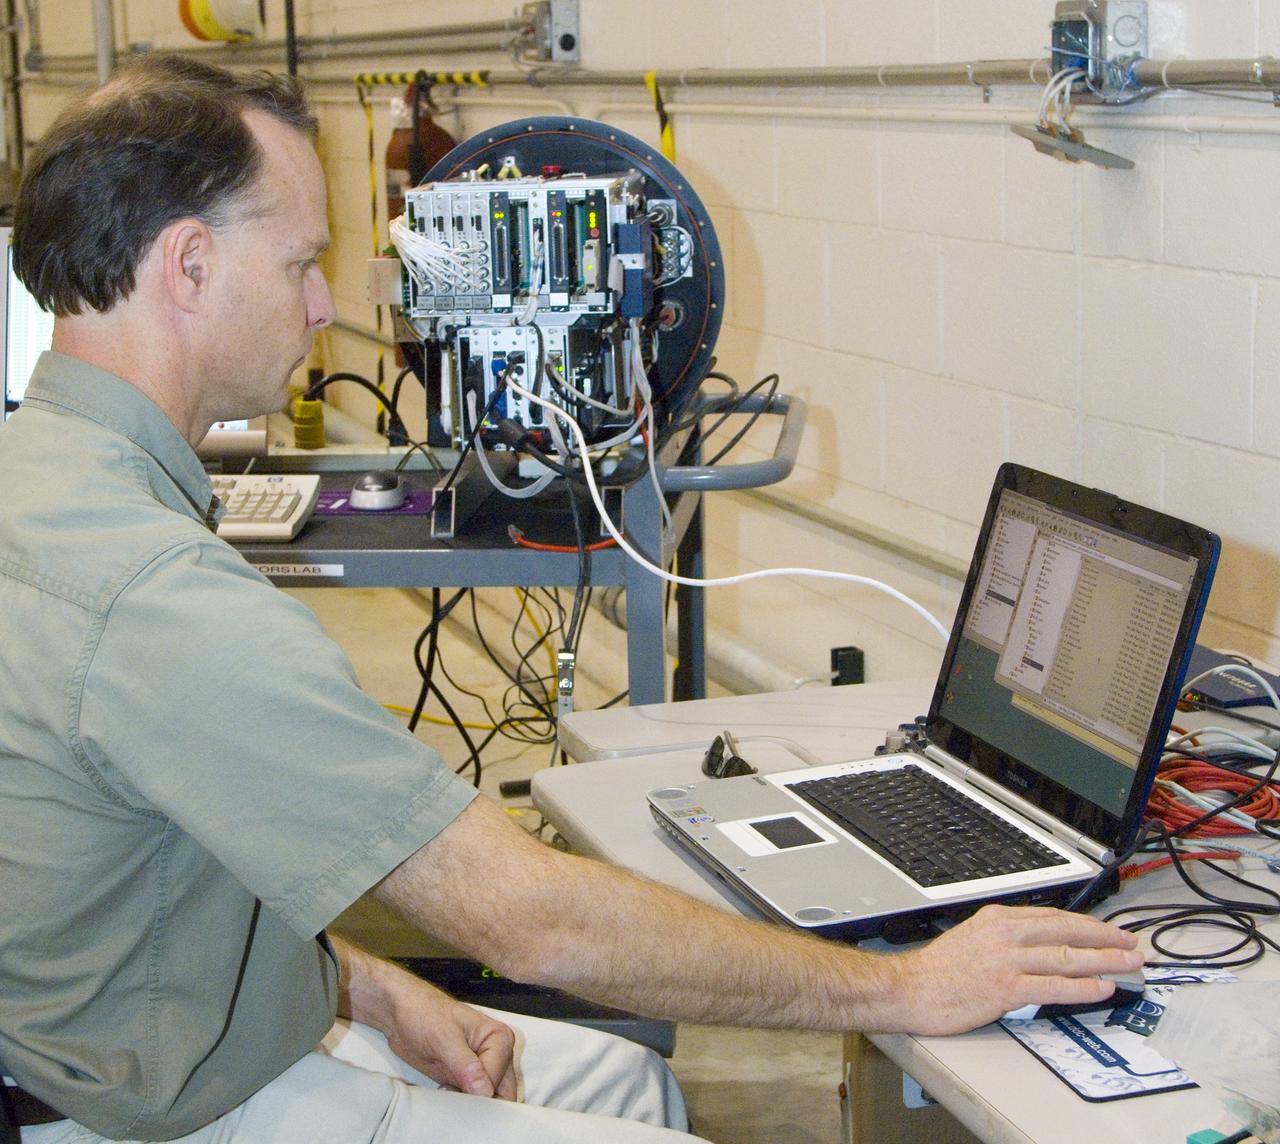
NASA Ames engineer Ted Hildum checks out the thermal-infrared scanner computer before it is loaded on NASA's Ikhana unmanned aircraft.
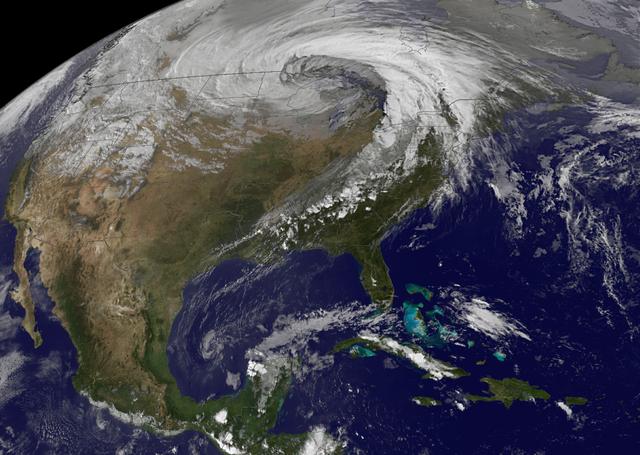
NASA image acquired October 26, 2010 The storm that swept across the center of the United States on October 26 and October 27, 2010, was memorable to those who experienced it because of its strong winds, rain, hail, and widespread tornadoes. Meteorologists get excited about the storm because it set a record for the lowest pressure (not associated with a hurricane) measured over land in the continental United States. At 5:13 p.m. CDT, the weather station in Bigfork, Minnesota recorded 955.2 millibars (28.21 inches of pressure). Pressure is one indicator of a storm’s strength, and this measurement corresponds to the pressure seen in a Category 3 hurricane. This image, taken by the GOES satellite on October 26, shows the storm system circling around the area of extreme low pressure. Such extratropical cyclones form over the United States in the spring and fall, when the temperature difference from north to south is large. Warm, high-pressure air rushes toward the cooler, low-pressure air in the north. Because the Earth is rotating, the air moving in ends up circling the area of low pressure, creating the cyclone shown in the image. The intensity of the storm is determined by the pressure difference between the center and the outer edges. Extreme low pressure in the center of the storm, therefore, is an indicator that the storm was very intense. The animation shows the storm developing starting late on October 25 and running through October 27. The cyclone formed very quickly on October 26, taking a distinctive comma shape as the day went on. The storm developed so quickly, in fact, that it is classified as a bomb, an extremely fast developing storm (dropping at least one millibar of pressure per hour for 24 hours), more common over water than land. The storm was also huge. Though the area of low pressure is centered over the Upper Midwest, the storm reached from the Gulf of Mexico into Canada, and from the Rocky Mountains to the Atlantic Ocean. Extratropical cyclones bring an array of unsettled weather, including strong wind, rain, hail, and tornadoes, and this cyclone brought all of that. On October 26–27, winds gusted up to 78 miles per hour in Michigan, with high winds throughout the Midwest. The National Weather Service reported 61 tornadoes over the two days. Heavy snow also fell in the north. NASA Earth Observatory imagery created by Jesse Allen, using imagery provided courtesy of the NASA GOES Project Science Office. Caption by Holli RIebeek. Instrument: GOES Credit: <b><a href="http://www.earthobservatory.nasa.gov/" rel="nofollow"> NASA Earth Observatory</a></b> <b><a href="http://www.nasa.gov/centers/goddard/home/index.html" rel="nofollow">NASA Goddard Space Flight Center</a></b> enables NASA’s mission through four scientific endeavors: Earth Science, Heliophysics, Solar System Exploration, and Astrophysics. Goddard plays a leading role in NASA’s accomplishments by contributing compelling scientific knowledge to advance the Agency’s mission. <b>Follow us on <a href="http://twitter.com/NASA_GoddardPix" rel="nofollow">Twitter</a></b> <b>Join us on <a href="http://www.facebook.com/pages/Greenbelt-MD/NASA-Goddard/395013845897?ref=tsd" rel="nofollow">Facebook</a></b>