The Seasons
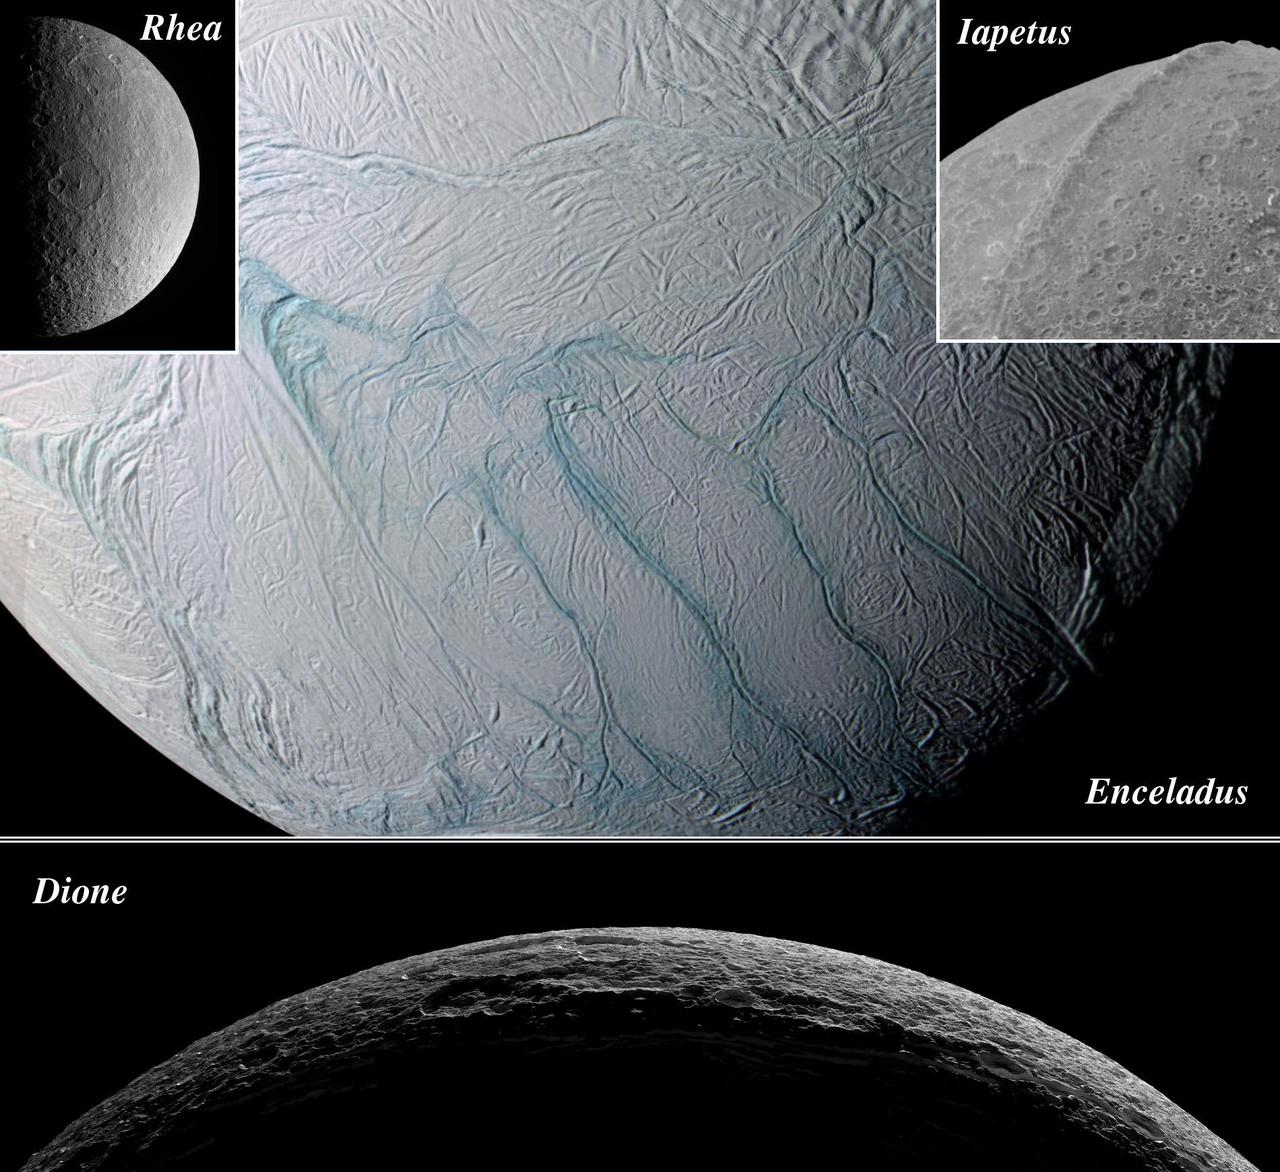
Season of Moons

Seasonal Differences
Change of Season
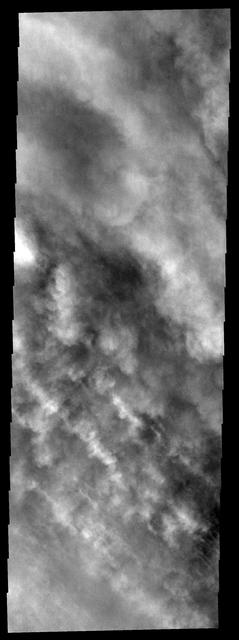
Storm Season

Seasonal Frost Changes on Mars

Polygons in Seasonal Frost
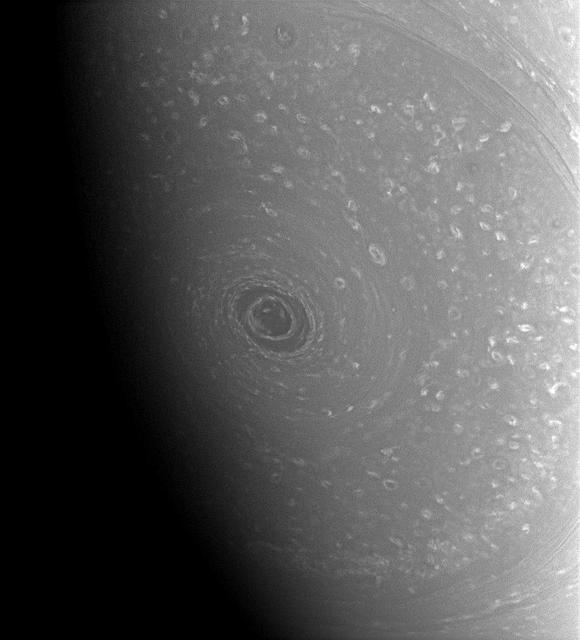
Tis the Season for Spokes
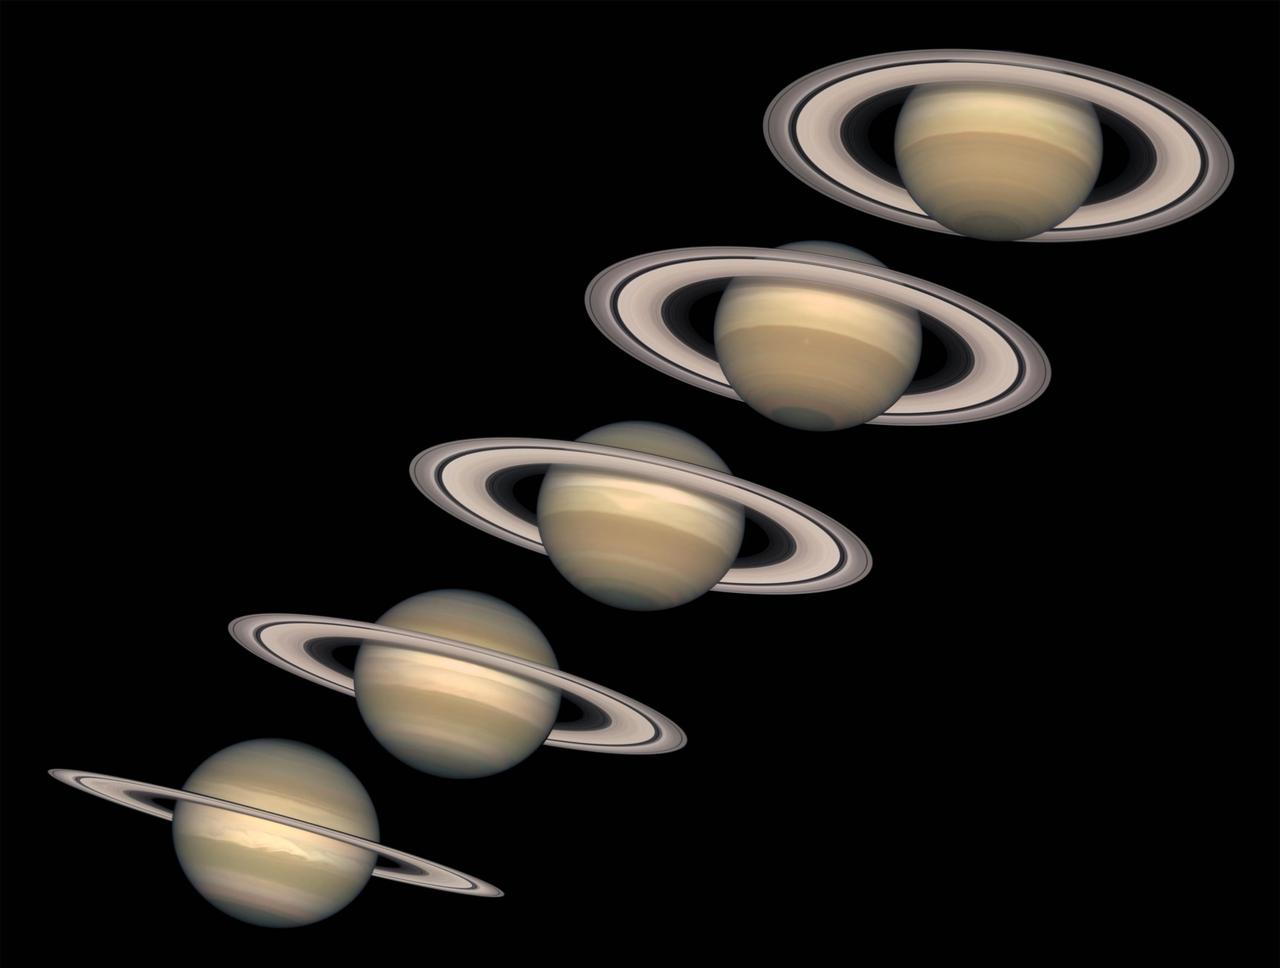
A Change of Seasons on Saturn
Seasonal Frost in Terra Sirenum
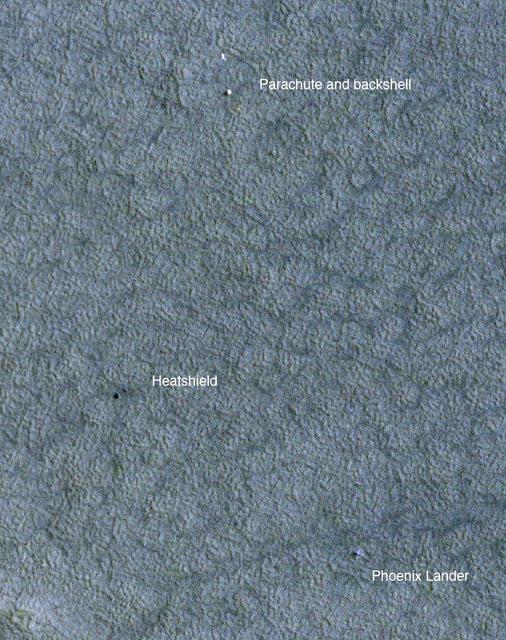
A Change of Seasons at Phoenix Site

SEASONAL VIEWS, FALL, (NOVEMBER 13, 2019), OF MSFC BUILDING 4200
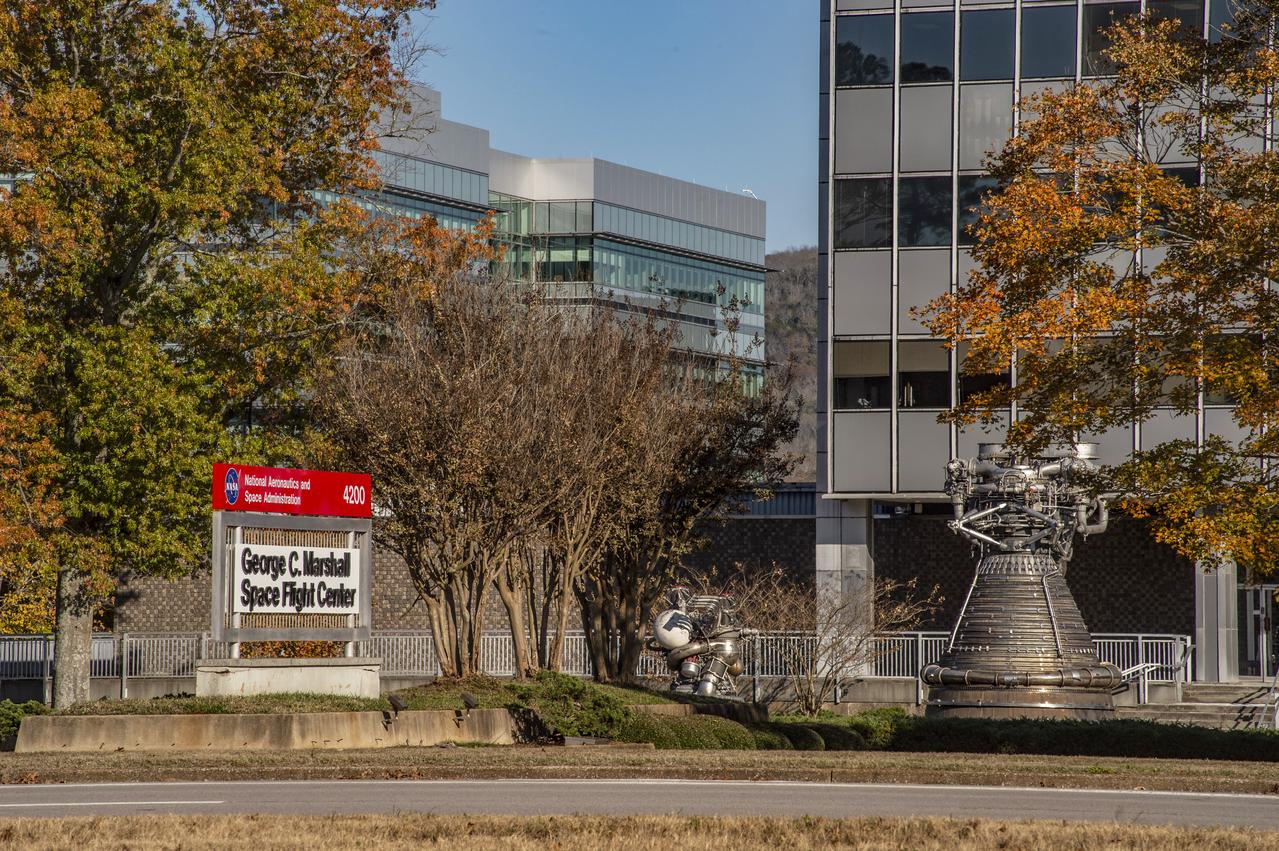
SEASONAL VIEWS, FALL, (NOVEMBER 13, 2019), OF MSFC BUILDING 4200
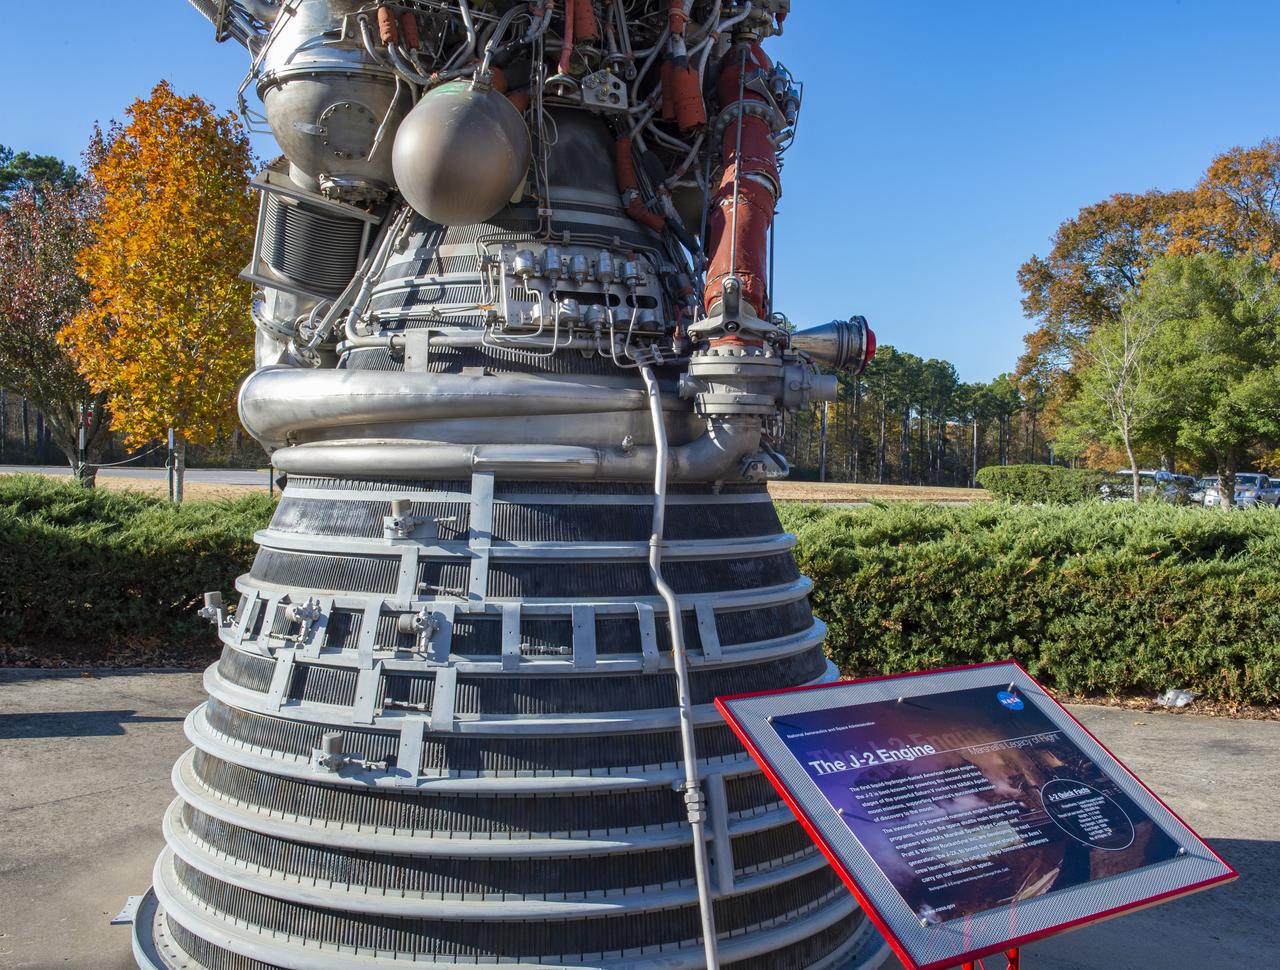
SEASONAL VIEWS, FALL, (NOVEMBER 13, 2019), OF MSFC BUILDING 4200
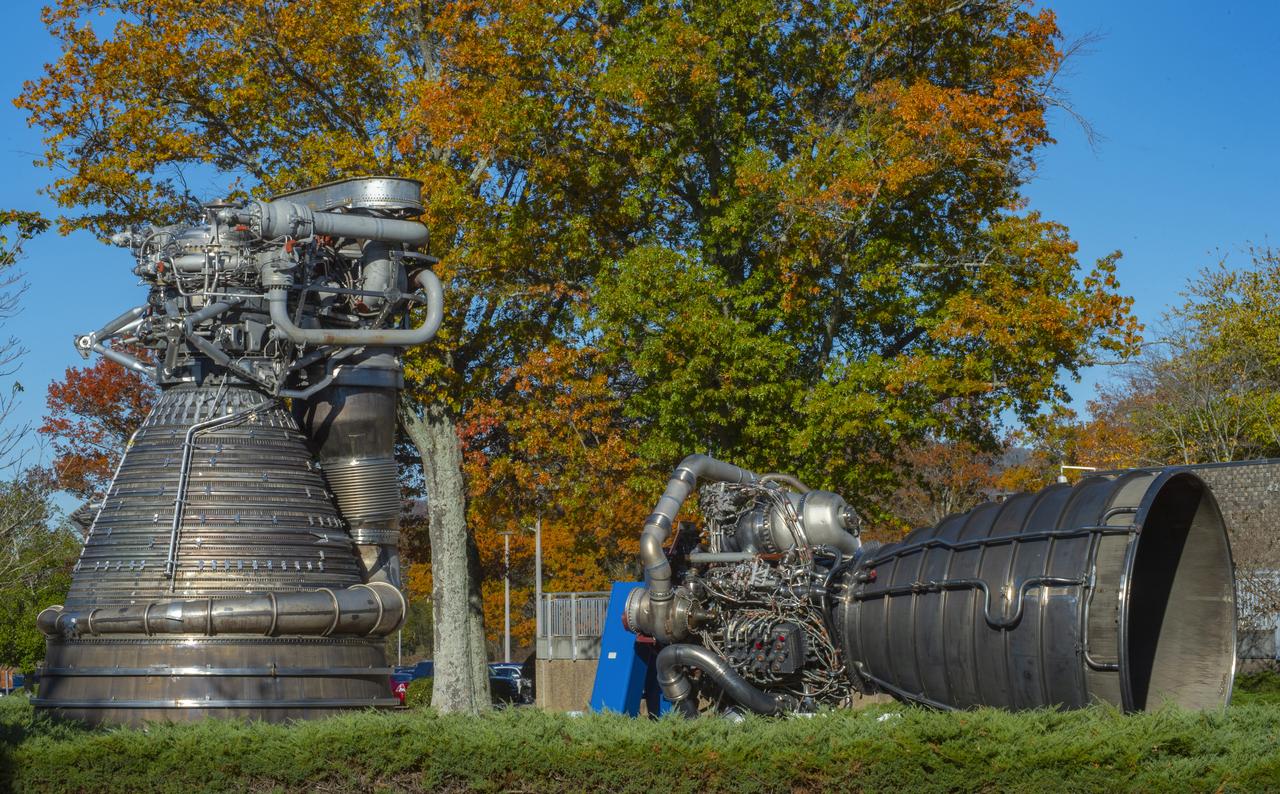
SEASONAL VIEWS, FALL, (NOVEMBER 13, 2019), OF MSFC BUILDING 4200

SEASONAL VIEWS, FALL, (NOVEMBER 13, 2019), OF MSFC BUILDING 4200

SEASONAL VIEWS, FALL, (NOVEMBER 13, 2019), OF MSFC BUILDING 4200
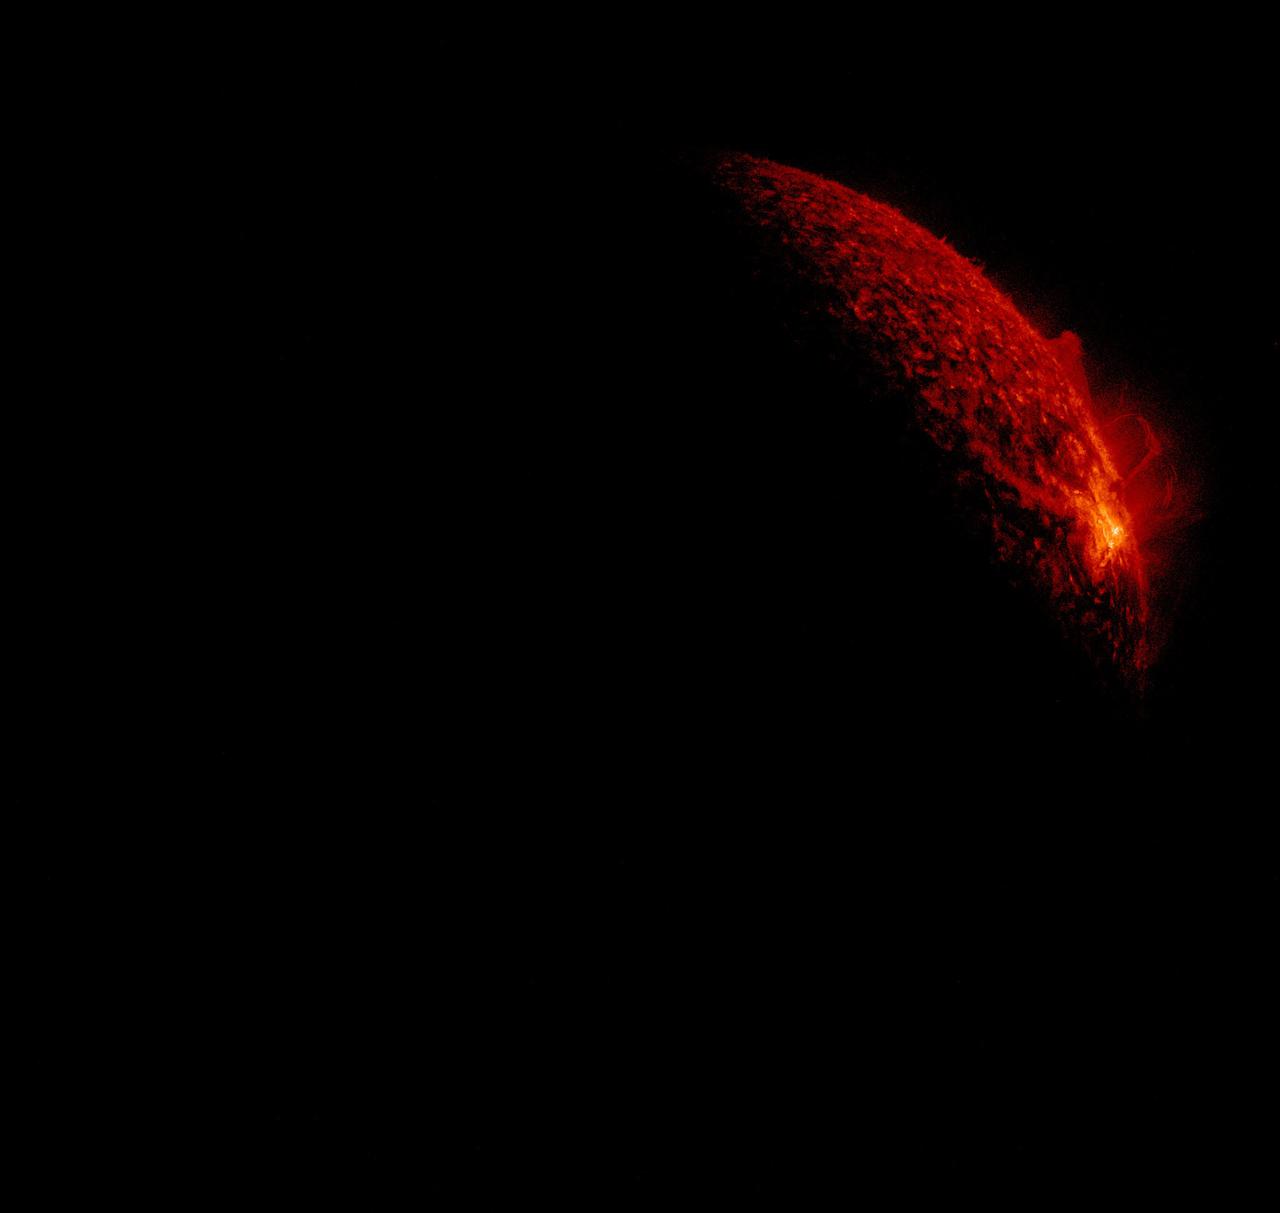
The Fall 2011 eclipse season started on September 11, 2011. Here is an AIA 304 image from 0658 UT. SDO has eclipse seasons twice a year near each equinox. For three weeks near midnight Las Cruces time (about 0700 UT) our orbit has the Earth pass between SDO and the Sun. These eclipses can last up to 72 minutes in the middle of an eclipse season. The current eclipse season started on September 11 and lasts until October 4. To read more about SDO go to: <a href="http://sdo.gsfc.nasa.gov/" rel="nofollow">sdo.gsfc.nasa.gov/</a> Credit: NASA/GSFC/SDO <b><a href="http://www.nasa.gov/centers/goddard/home/index.html" rel="nofollow">NASA Goddard Space Flight Center</a></b> enables NASA’s mission through four scientific endeavors: Earth Science, Heliophysics, Solar System Exploration, and Astrophysics. Goddard plays a leading role in NASA’s accomplishments by contributing compelling scientific knowledge to advance the Agency’s mission. <b>Follow us on <a href="http://twitter.com/NASA_GoddardPix" rel="nofollow">Twitter</a></b> <b>Like us on <a href="http://www.facebook.com/pages/Greenbelt-MD/NASA-Goddard/395013845897?ref=tsd" rel="nofollow">Facebook</a></b> <b>Find us on <a href="http://instagrid.me/nasagoddard/?vm=grid" rel="nofollow">Instagram</a></b>
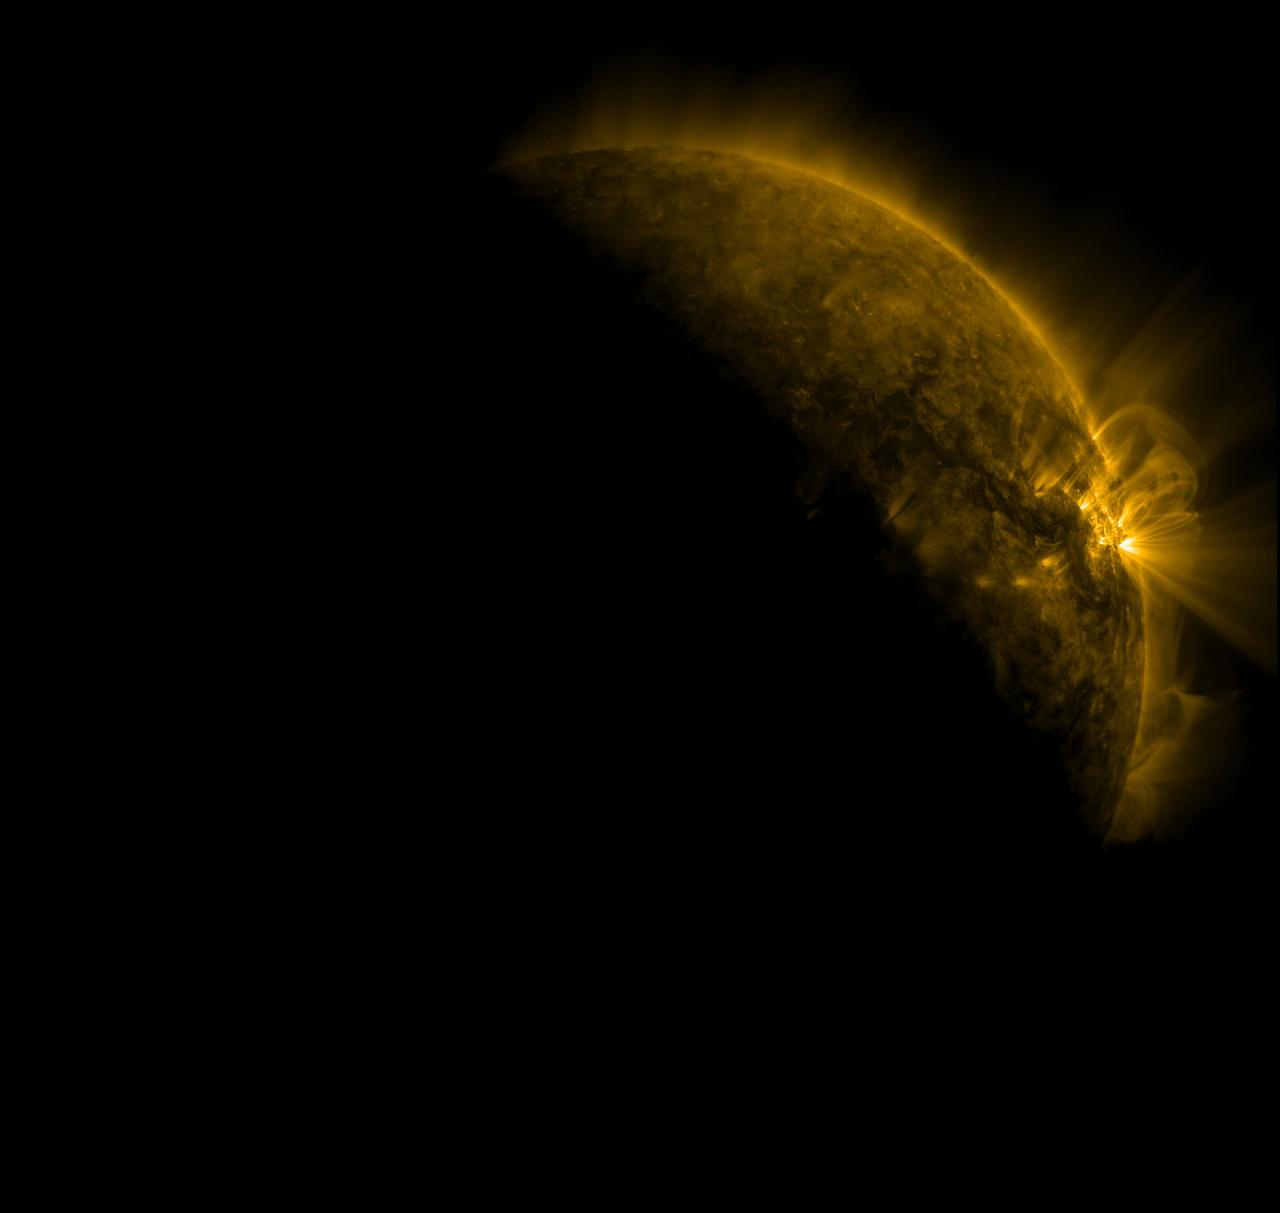
The Fall 2011 eclipse season started on September 11. Here is an AIA 171 image from 0657 UT with the first eclipse! SDO has eclipse seasons twice a year near each equinox. For three weeks near midnight Las Cruces time (about 0700 UT) our orbit has the Earth pass between SDO and the Sun. These eclipses can last up to 72 minutes in the middle of an eclipse season. The current eclipse season started on September 11 and lasts until October 4. To read more about SDO go to: <a href="http://sdo.gsfc.nasa.gov/" rel="nofollow">sdo.gsfc.nasa.gov/</a> Credit: NASA/GSFC/SDO <b><a href="http://www.nasa.gov/centers/goddard/home/index.html" rel="nofollow">NASA Goddard Space Flight Center</a></b> enables NASA’s mission through four scientific endeavors: Earth Science, Heliophysics, Solar System Exploration, and Astrophysics. Goddard plays a leading role in NASA’s accomplishments by contributing compelling scientific knowledge to advance the Agency’s mission. <b>Follow us on <a href="http://twitter.com/NASA_GoddardPix" rel="nofollow">Twitter</a></b> <b>Like us on <a href="http://www.facebook.com/pages/Greenbelt-MD/NASA-Goddard/395013845897?ref=tsd" rel="nofollow">Facebook</a></b> <b>Find us on <a href="http://instagrid.me/nasagoddard/?vm=grid" rel="nofollow">Instagram</a></b>
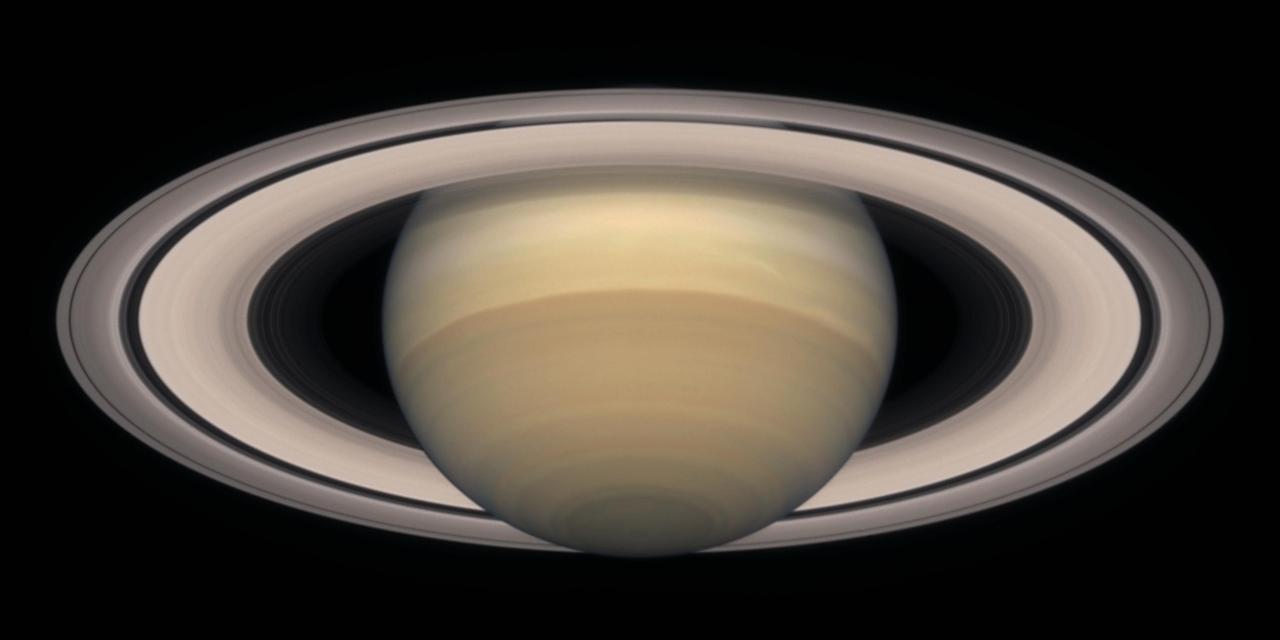
A Change of Seasons on Saturn - October, 2000
Polygonal Ground with Seasonally Dark Edges
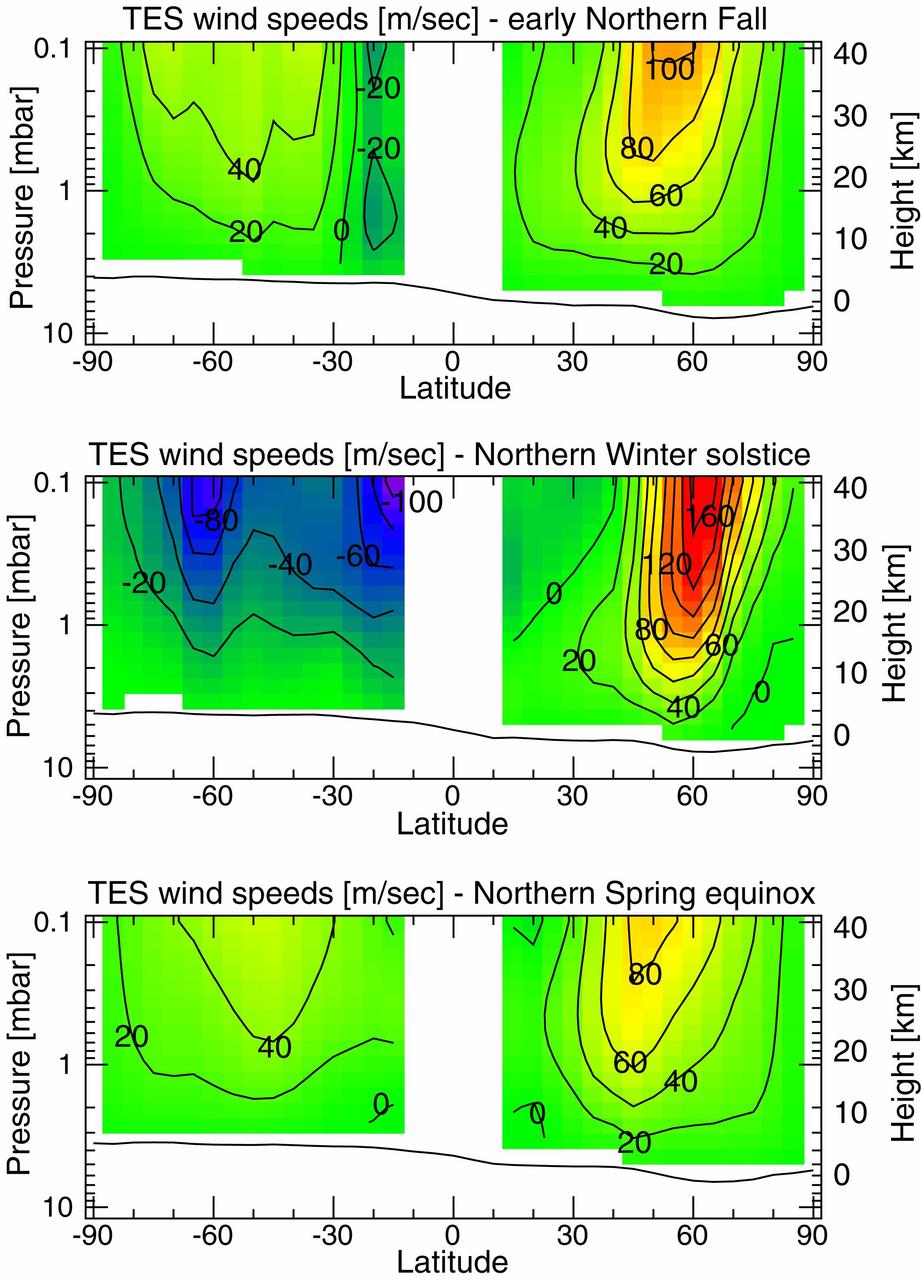
Measurements of the Martian Winds for Three Seasons
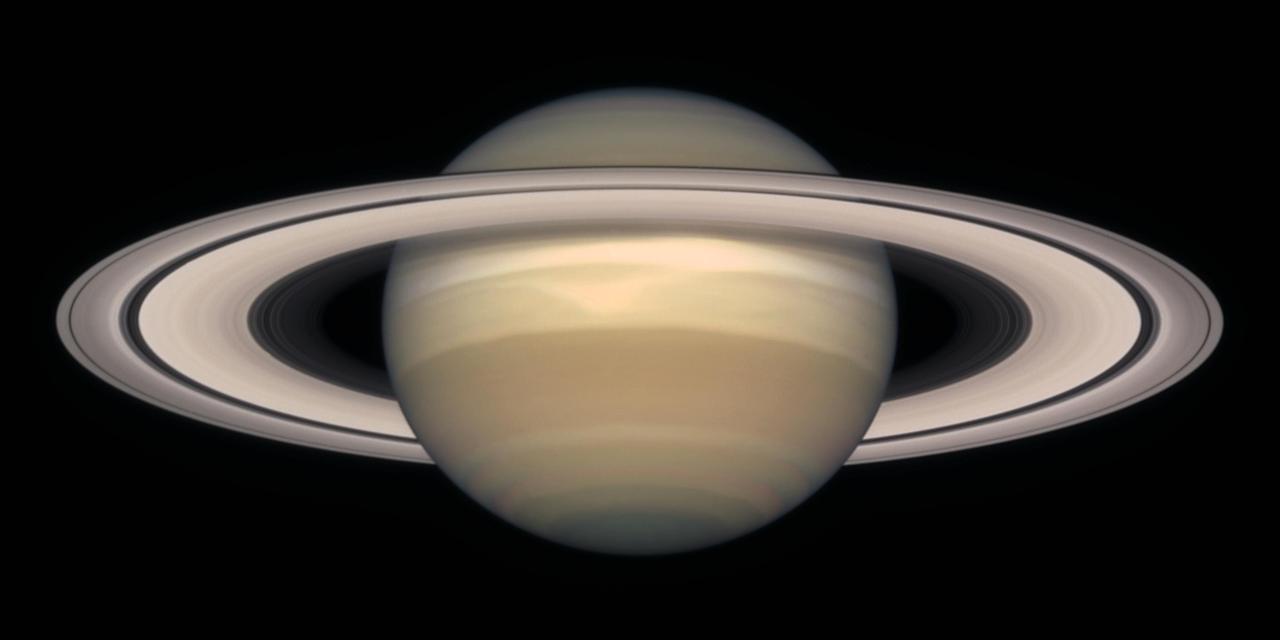
A Change of Seasons on Saturn - October, 1998
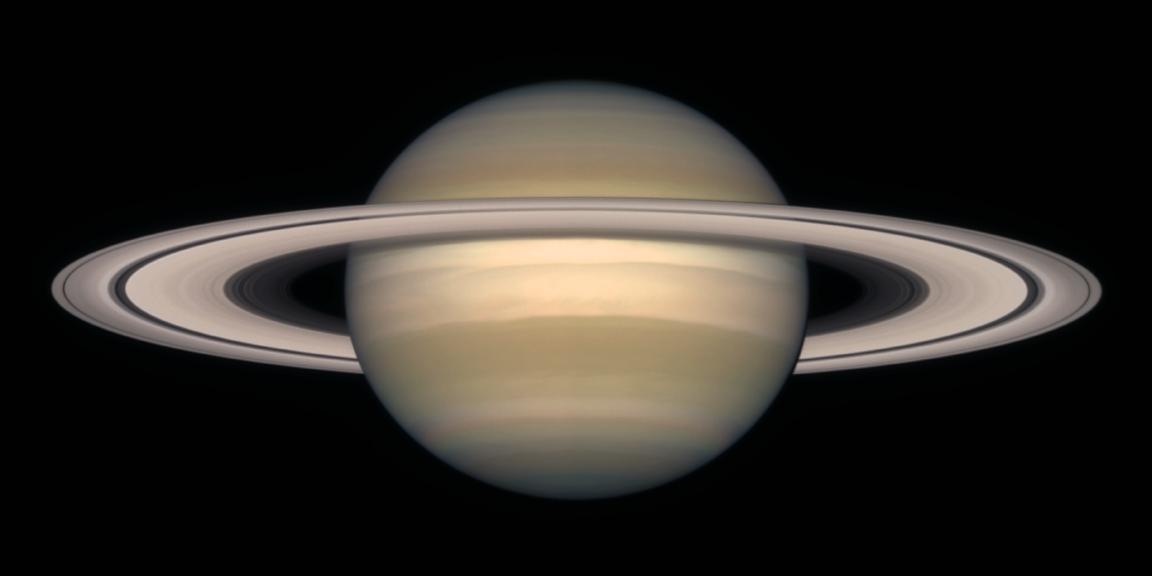
A Change of Seasons on Saturn - October, 1997
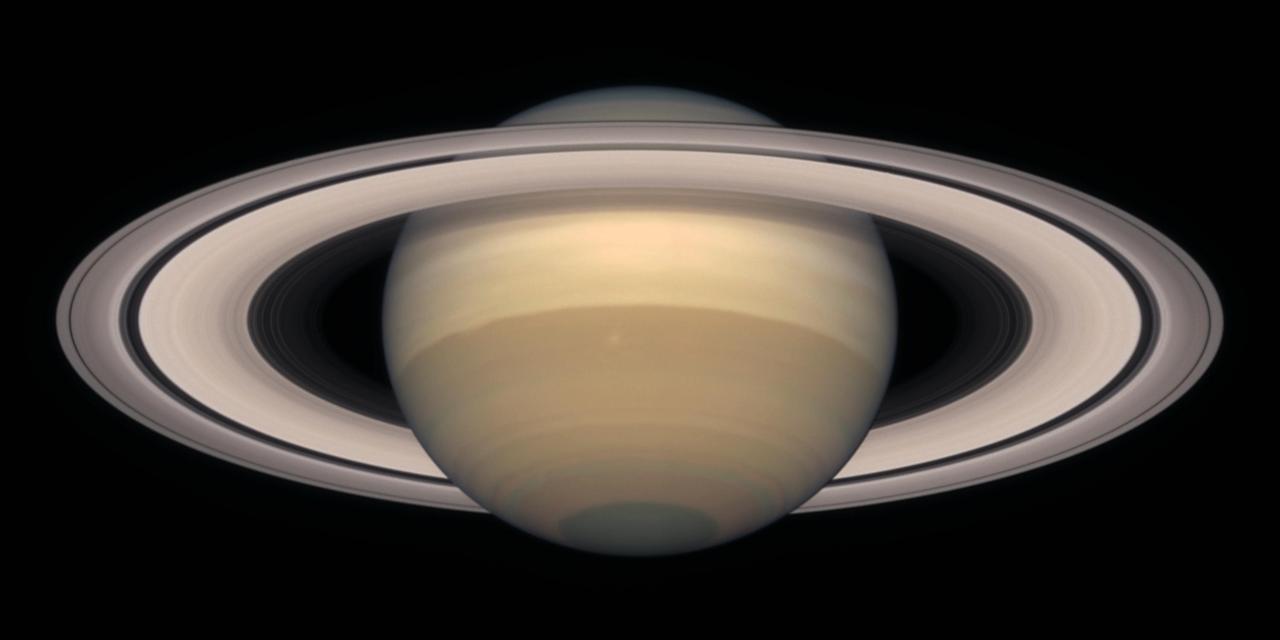
A Change of Seasons on Saturn - October, 1999
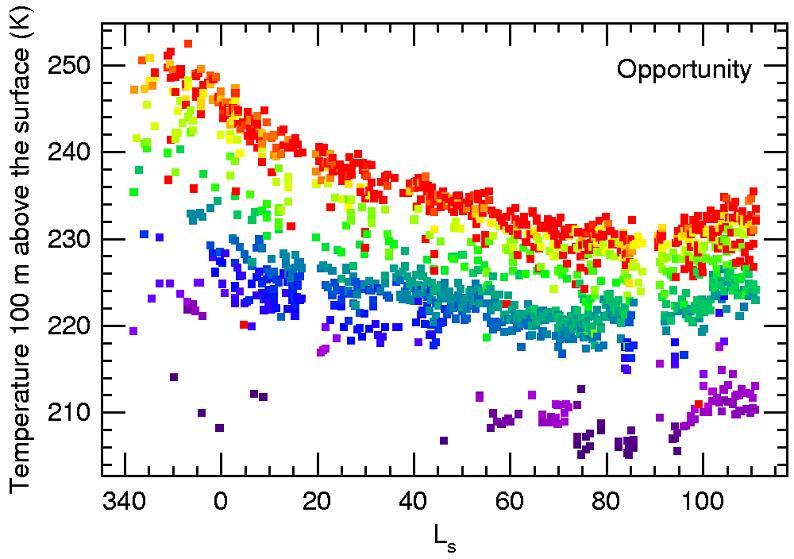
Seasonal Air Temperatures Above Opportunity
Seasons Conceal South Pole Storm
Color Reveals Translucent Seasonal Ice
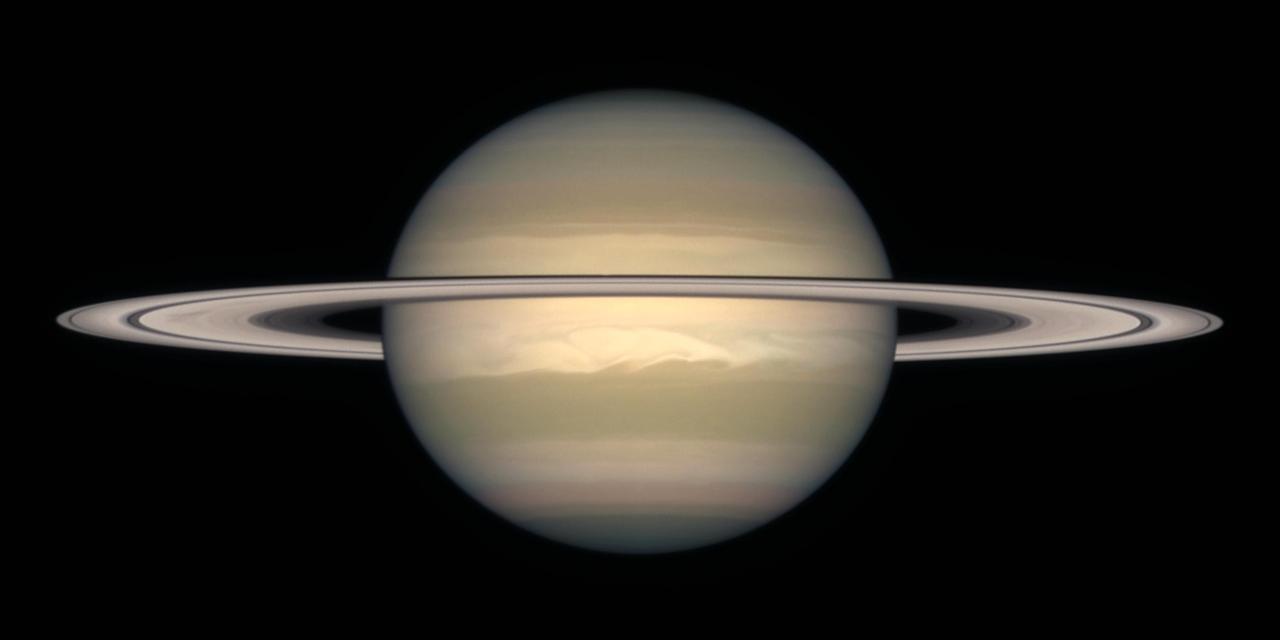
A Change of Seasons on Saturn - October, 1996
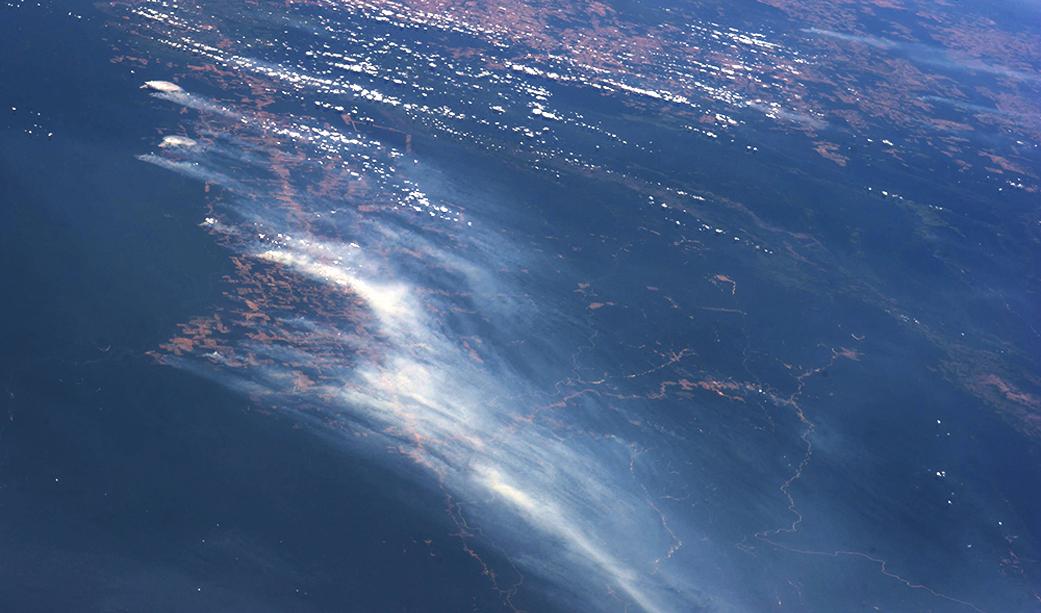
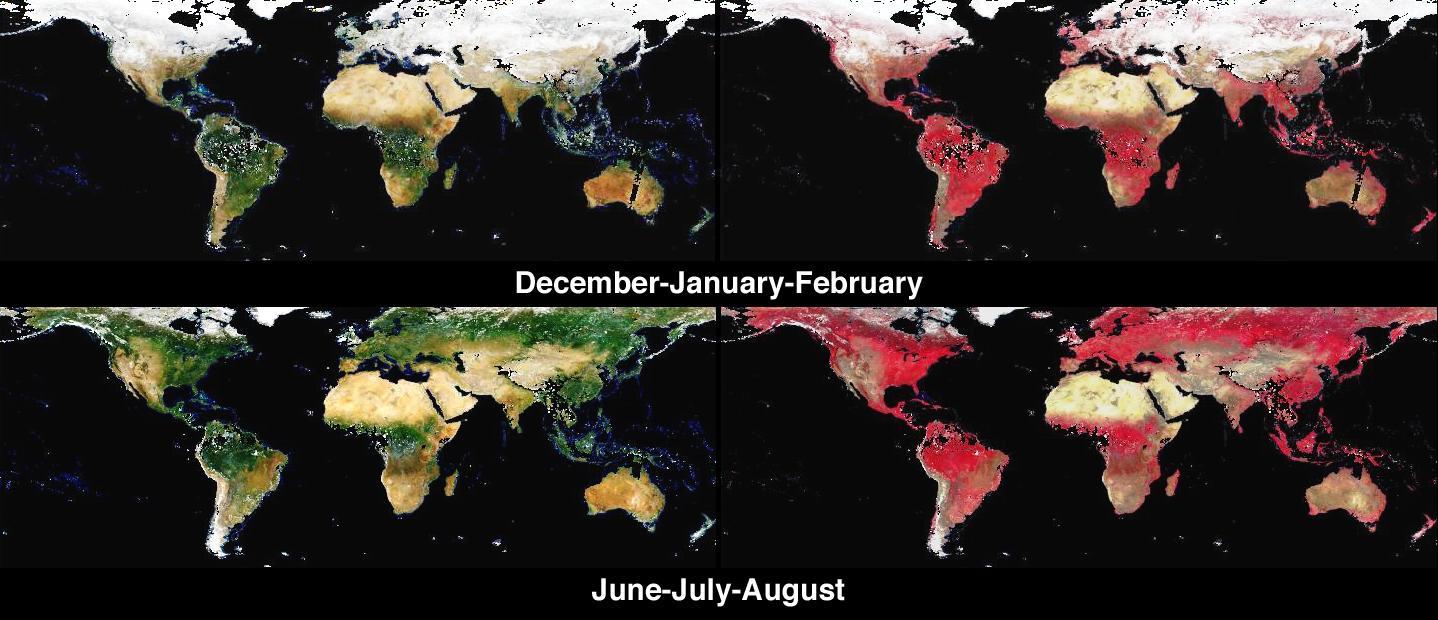
El Niño conditions in 2015 and early 2016 altered rainfall patterns around the world. In the Amazon, El Niño reduced rainfall during the wet season, leaving the region drier at the start of the 2016 dry season than any year since 2002, according to NASA satellite data. Wildfire risk for the dry season months of July to October this year now exceeds fire risk in 2005 and 2010, drought years when wildfires burned large areas of Amazon rainforest, said Doug Morton, an Earth scientist at NASA’s Goddard Space Flight Center who helped create the fire forecast. "Severe drought conditions at the start of the dry season set the stage for extreme fire risk in 2016 across the southern Amazon," Morton said. The Amazon fire forecast uses the relationship between climate and active fire detections from NASA satellites to predict fire season severity during the region’s dry season. Developed in 2011 by scientists at University of California, Irvine and NASA’s Goddard Space Flight Center, the forecast model is focused particularly on the link between sea surface temperatures and fire activity. Warmer sea surface temperatures in the tropical Pacific (El Niño) and Atlantic oceans shift rainfall away from the Amazon region, increasing the risk of fires during dry season months. Read more: <a href="http://go.nasa.gov/2937ADt" rel="nofollow">go.nasa.gov/2937ADt</a> <b><a href="http://www.nasa.gov/audience/formedia/features/MP_Photo_Guidelines.html" rel="nofollow">NASA image use policy.</a></b> <b><a href="http://www.nasa.gov/centers/goddard/home/index.html" rel="nofollow">NASA Goddard Space Flight Center</a></b> enables NASA’s mission through four scientific endeavors: Earth Science, Heliophysics, Solar System Exploration, and Astrophysics. Goddard plays a leading role in NASA’s accomplishments by contributing compelling scientific knowledge to advance the Agency’s mission. <b>Follow us on <a href="http://twitter.com/NASAGoddardPix" rel="nofollow">Twitter</a></b> <b>Like us on <a href="http://www.facebook.com/pages/Greenbelt-MD/NASA-Goddard/395013845897?ref=tsd" rel="nofollow">Facebook</a></b> <b>Find us on <a href="http://instagrid.me/nasagoddard/?vm=grid" rel="nofollow">Instagram</a></b>
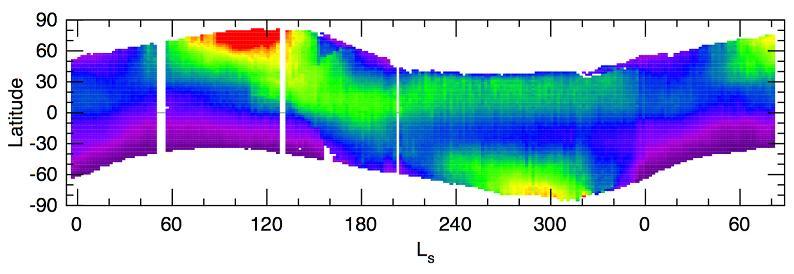
Seasonal Trend in Water Vapor Seen from Orbit
Dust Fans on the Seasonal Carbon Dioxide Polar Cap
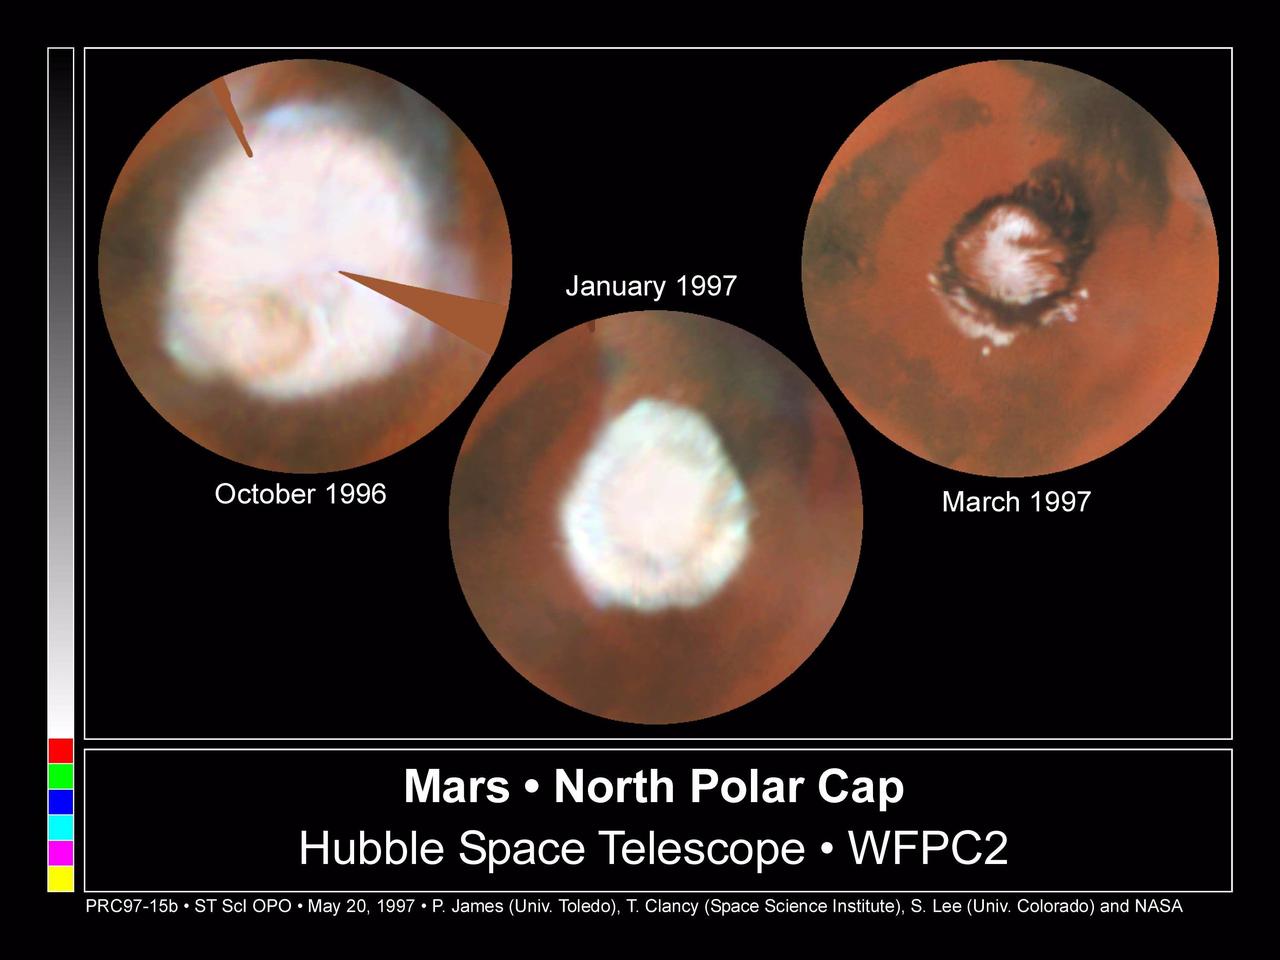
Seasonal Changes in Mars North Polar Ice Cap
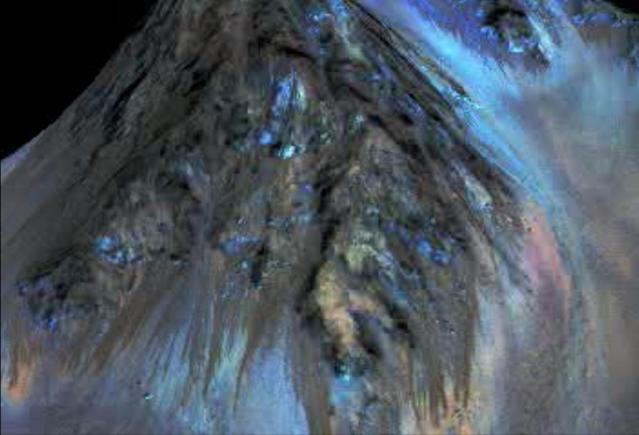
Dark, seasonal flows emanate from bedrock exposures at Palikir Crater on Mars in this image from the HiRISE camera on NASA Mars Reconnaissance Orbiter. These dark, warm-season flows are called recurring slope lineae or RSL.

NASA Administrator Bill Nelson gives remarks during an event celebrating UAE-US collaboration in space, Friday, March 8, 2024, at the Four Seasons Hotel in Washington. Photo Credit: (NASA/Bill Ingalls)

NASA Administrator Bill Nelson gives remarks during an event celebrating UAE-US collaboration in space, Friday, March 8, 2024, at the Four Seasons Hotel in Washington. Photo Credit: (NASA/Bill Ingalls)

NASA Administrator Bill Nelson gives remarks during an event celebrating UAE-US collaboration in space, Friday, March 8, 2024, at the Four Seasons Hotel in Washington. Photo Credit: (NASA/Bill Ingalls)

NASA Associate Administrator Jim Free, gives remarks during an event celebrating UAE-US collaboration in space, Friday, March 8, 2024, at the Four Seasons Hotel in Washington. Photo Credit: (NASA/Bill Ingalls)

NASA Associate Administrator Jim Free, center, gives remarks during an event celebrating UAE-US collaboration in space, Friday, March 8, 2024, at the Four Seasons Hotel in Washington. Photo Credit: (NASA/Bill Ingalls)
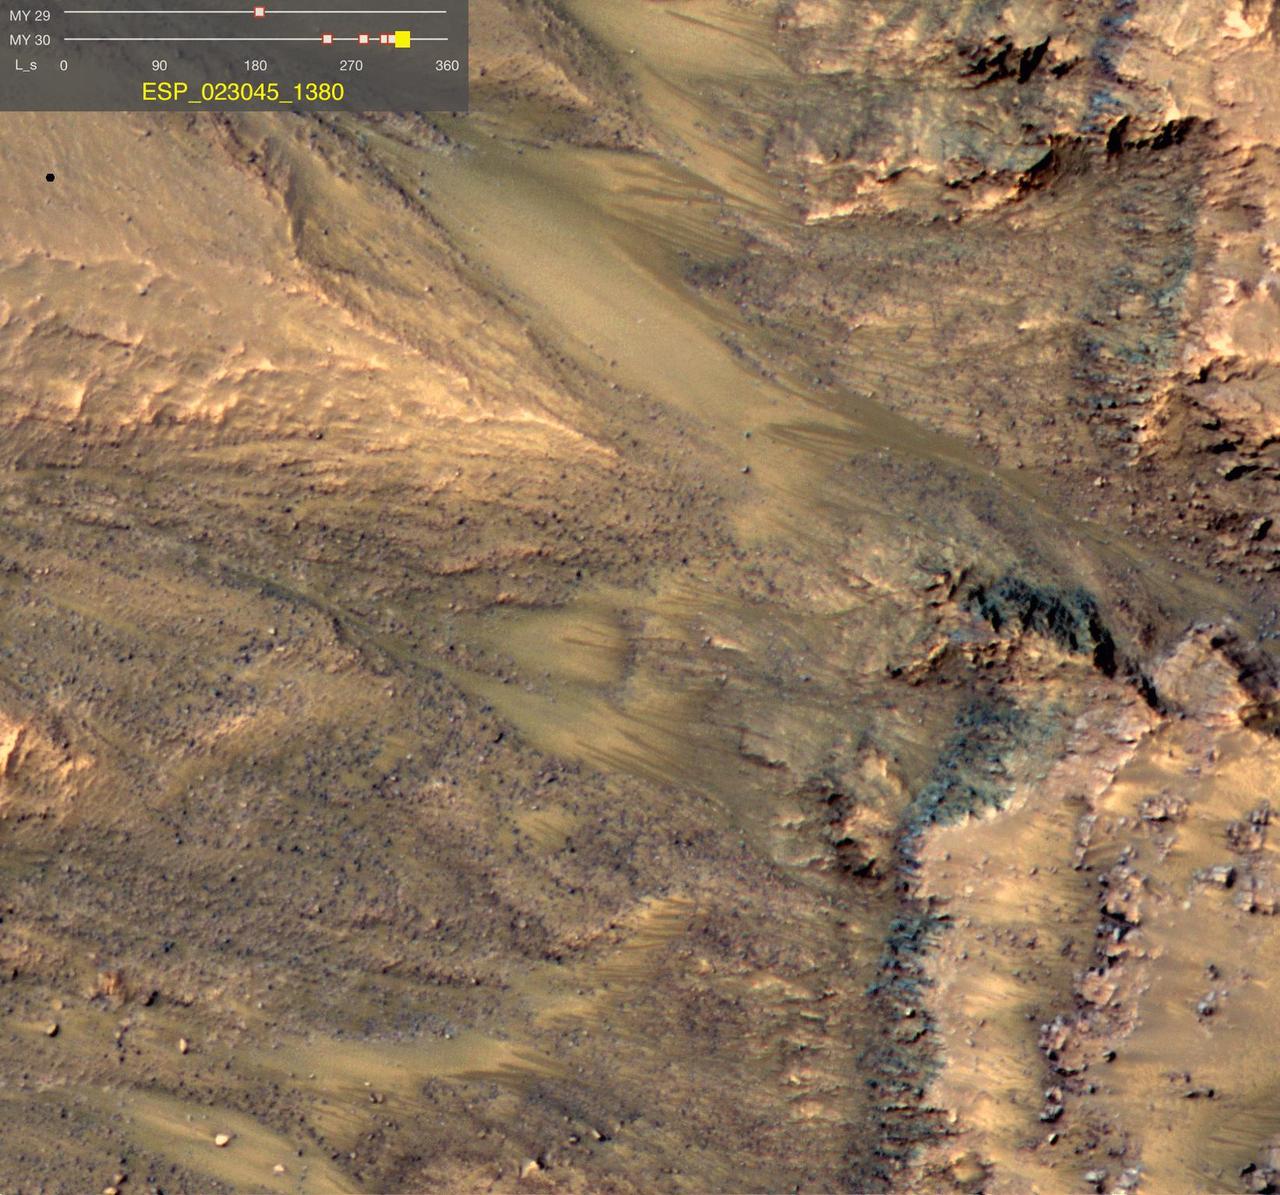
This image shows warm-season flows on a north-facing slope in middle southern latitudes of Mars. It was taken by the HiRISE camera onboard NASA Mars Reconnaissance Orbiter on June 24, 2011. The season was summer in Mars southern hemisphere.

National Space Council Executive Secretary Chirag Parikh, gives remarks during an event celebrating UAE-US collaboration in space, Friday, March 8, 2024, at the Four Seasons Hotel in Washington. Photo Credit: (NASA/Bill Ingalls)

UAE astronaut and Minister of Youth, H.E. Dr. Sultan Al Neyadi, gives remarks during an event celebrating UAE-US collaboration in space, Friday, March 8, 2024, at the Four Seasons Hotel in Washington. Photo Credit: (NASA/Bill Ingalls)

National Space Council Executive Secretary Chirag Parikh, gives remarks during an event celebrating UAE-US collaboration in space, Friday, March 8, 2024, at the Four Seasons Hotel in Washington. Photo Credit: (NASA/Bill Ingalls)

UAE Assistant Minister of Foreign Affairs and International Cooperation for Advanced Science and Technology, Omran Sharaf, gives remarks during an event celebrating UAE-US collaboration in space, Friday, March 8, 2024, at the Four Seasons Hotel in Washington. Photo Credit: (NASA/Bill Ingalls)

NASA associate administrator for International and Interagency Relations Karen Feldstein, gives remarks during an event celebrating UAE-US collaboration in space, Friday, March 8, 2024, at the Four Seasons Hotel in Washington. Photo Credit: (NASA/Bill Ingalls)

Director General of the UAE Space Agency Salem Al Qubaisi, gives remarks during an event celebrating UAE-US collaboration in space, Friday, March 8, 2024, at the Four Seasons Hotel in Washington. Photo Credit: (NASA/Bill Ingalls)

UAE Ambassador to the US and Minister of State, His Excellency Yousef Al Otaib, gives remarks during an event celebrating UAE-US collaboration in space, Friday, March 8, 2024, at the Four Seasons Hotel in Washington. Photo Credit: (NASA/Bill Ingalls)

National Space Council Executive Secretary Chirag Parikh, gives remarks during an event celebrating UAE-US collaboration in space, Friday, March 8, 2024, at the Four Seasons Hotel in Washington. Photo Credit: (NASA/Bill Ingalls)

Director of Space Missions Department, UAESA, Mohsen Al Awadhi, gives remarks during an event celebrating UAE-US collaboration in space, Friday, March 8, 2024, at the Four Seasons Hotel in Washington. Photo Credit: (NASA/Bill Ingalls)

NASA Cassini spacecraft records Titan seasonal hemispheric dichotomy, with the moon northern half appearing slightly lighter than the southern half in this image.
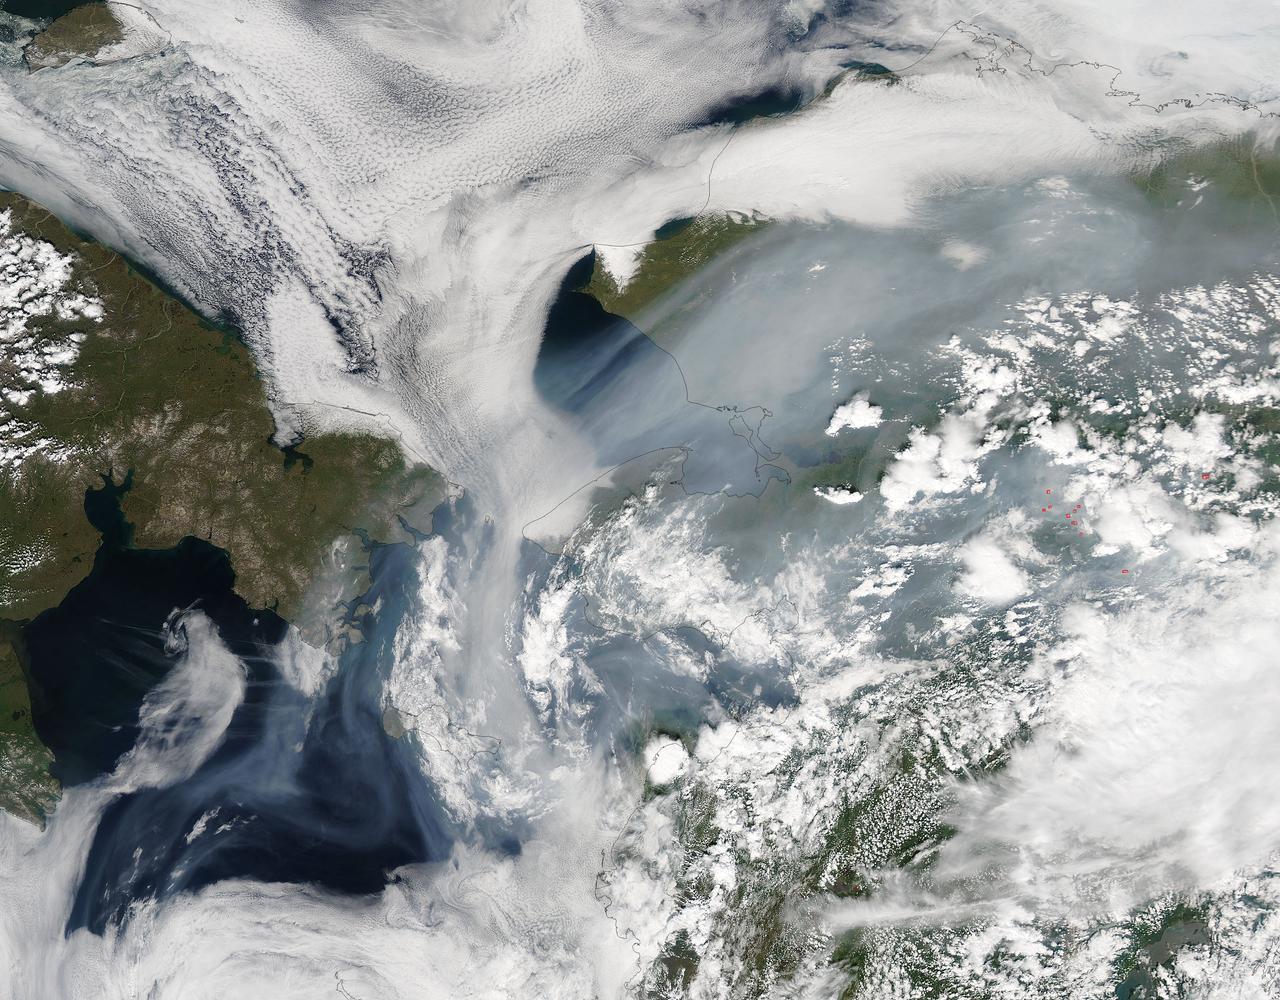
Fires have raged throughout Alaska in 2015. The Moderate Resolution Imaging Spectroradiometer (MODIS) on NASA’s Aqua satellite acquired this image on July 14, 2015. Actively burning areas, detected by the thermal bands on MODIS, are outlined in red. According to the most recent update (July 16, 2015) from the Alaska Interagency Coordination Center, about 304 fires were actively burning when MODIS imaged the area. To date, fires have charred a total of 4,854,924 acres in Alaska. The worst fire season in Alaska's history was in 2004. At this point in time, 2015 is a month ahead of the totals in 2004 putting it on track surpass the fire totals in 2004. The amount of acreage burned in Alaska during June 2015 shattered the previous acreage record set in June 2004 by more than 700,000 acres delivering a sobering piece of news for Alaskan residents. Credit: NASA/GSFC/Jeff Schmaltz/MODIS Land Rapid Response Team <b><a href="http://www.nasa.gov/audience/formedia/features/MP_Photo_Guidelines.html" rel="nofollow">NASA image use policy.</a></b> <b><a href="http://www.nasa.gov/centers/goddard/home/index.html" rel="nofollow">NASA Goddard Space Flight Center</a></b> enables NASA’s mission through four scientific endeavors: Earth Science, Heliophysics, Solar System Exploration, and Astrophysics. Goddard plays a leading role in NASA’s accomplishments by contributing compelling scientific knowledge to advance the Agency’s mission. <b>Follow us on <a href="http://twitter.com/NASAGoddardPix" rel="nofollow">Twitter</a></b> <b>Like us on <a href="http://www.facebook.com/pages/Greenbelt-MD/NASA-Goddard/395013845897?ref=tsd" rel="nofollow">Facebook</a></b> <b>Find us on <a href="http://instagrid.me/nasagoddard/?vm=grid" rel="nofollow">Instagram</a></b>
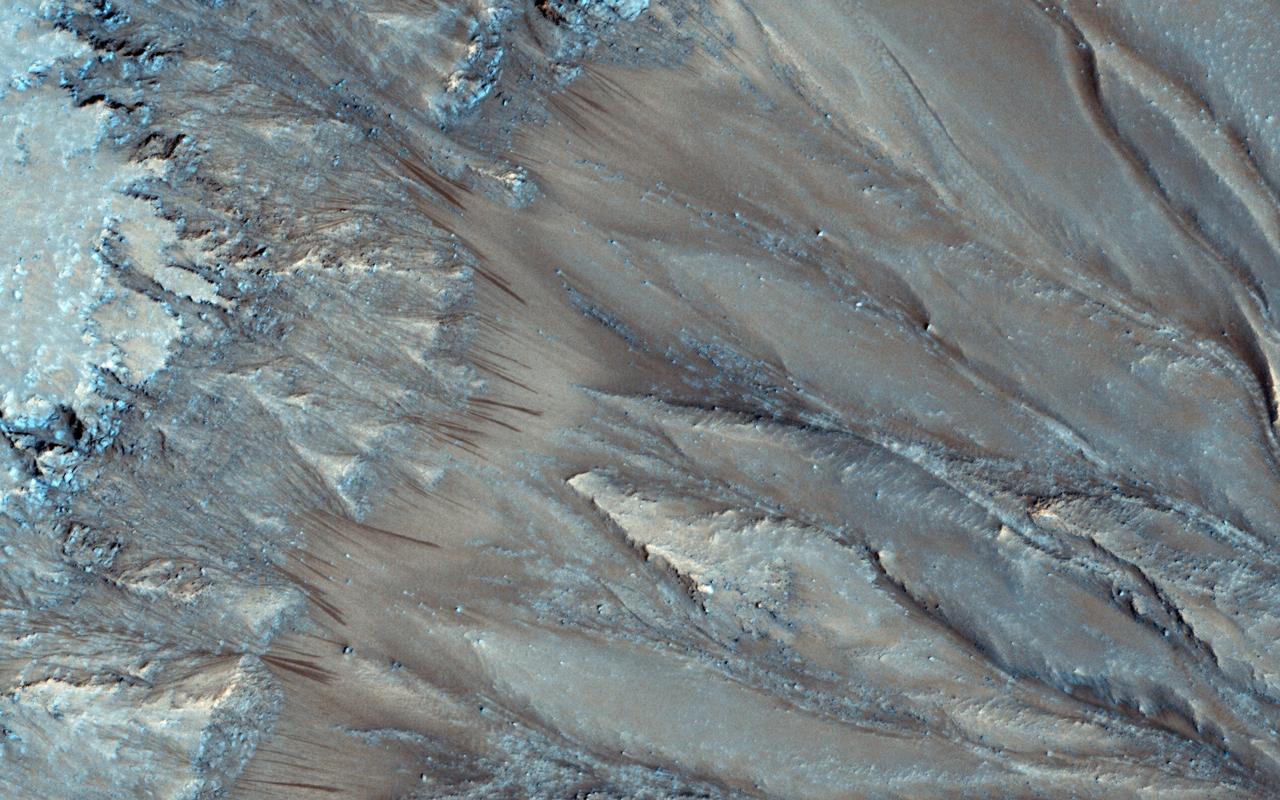
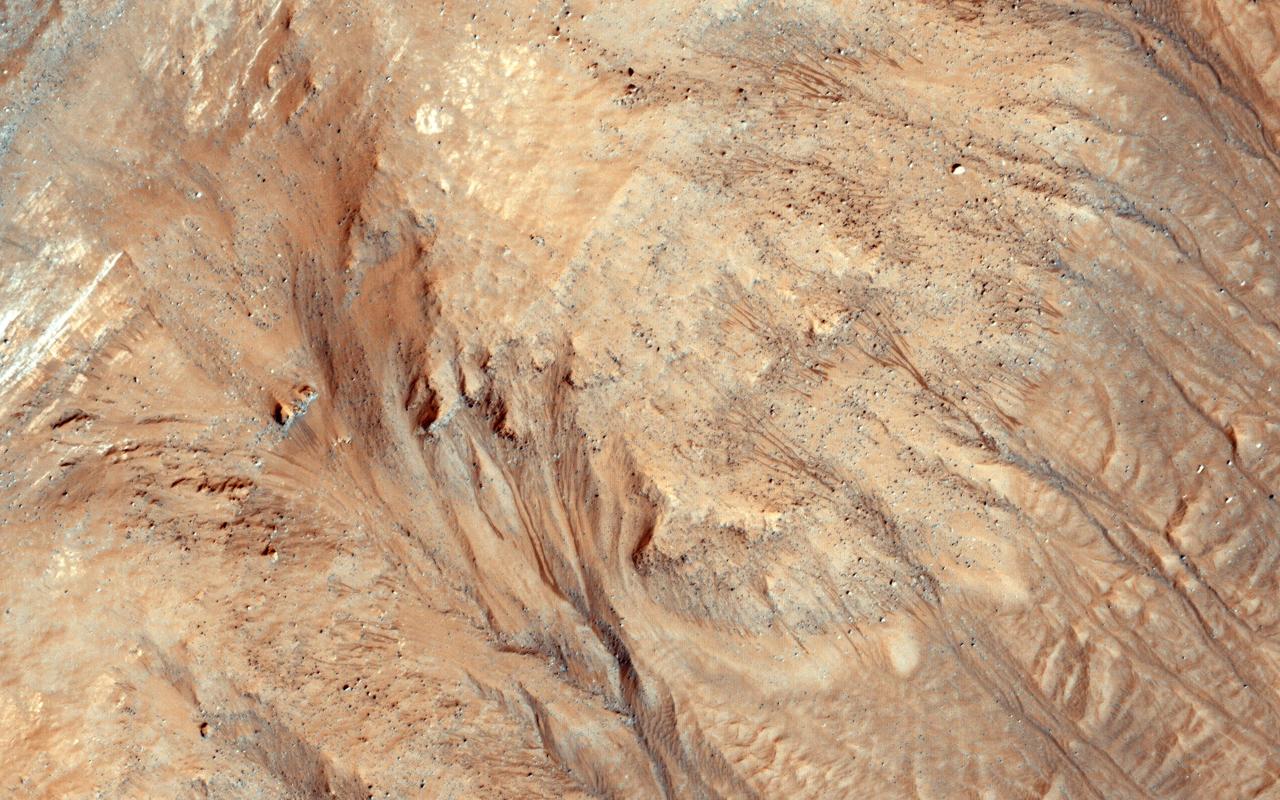
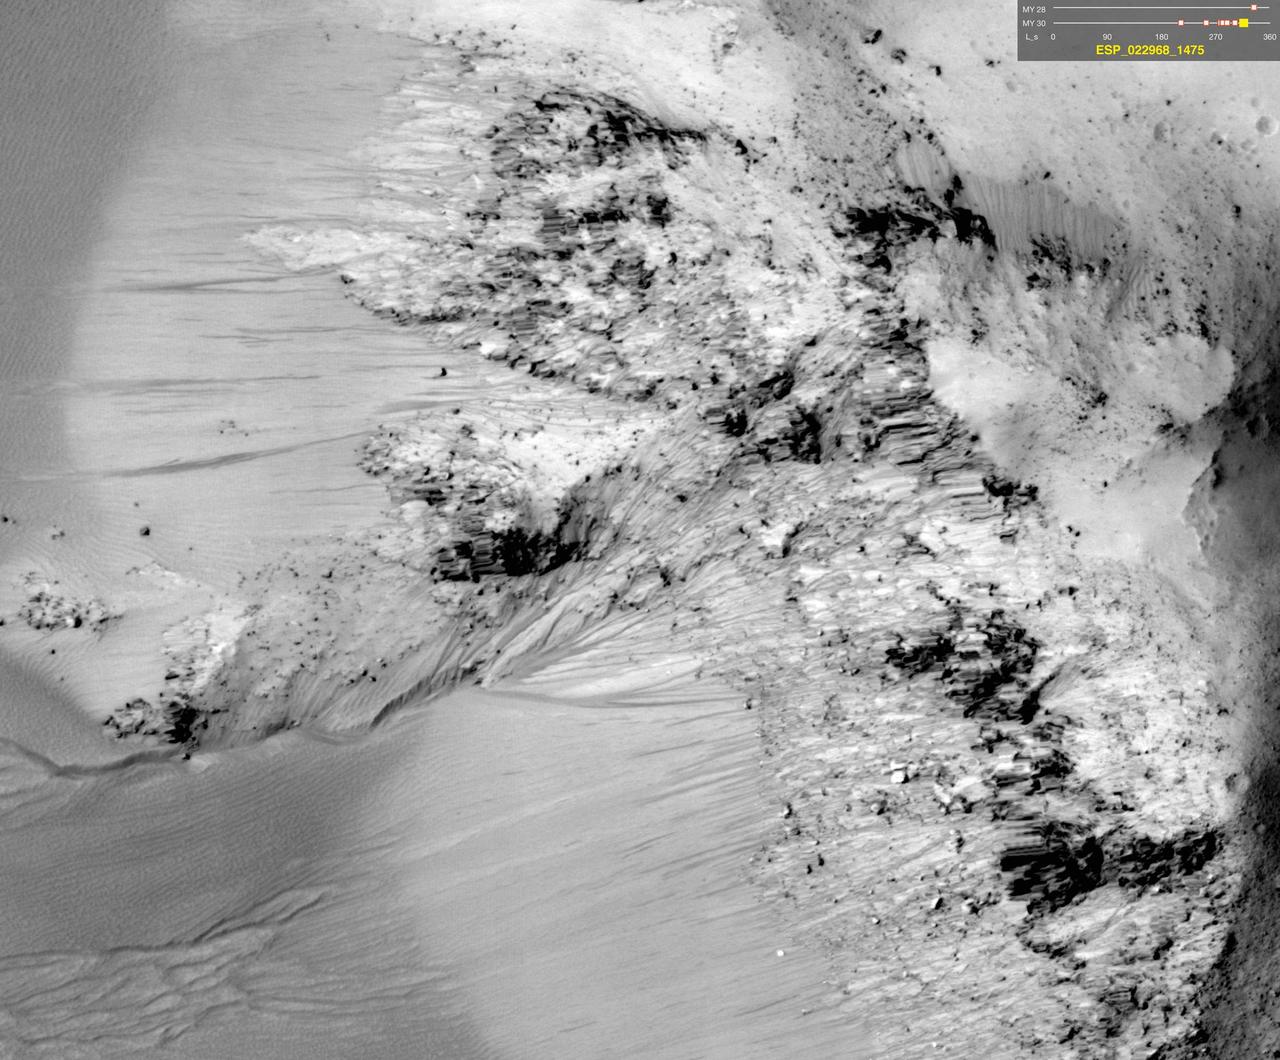
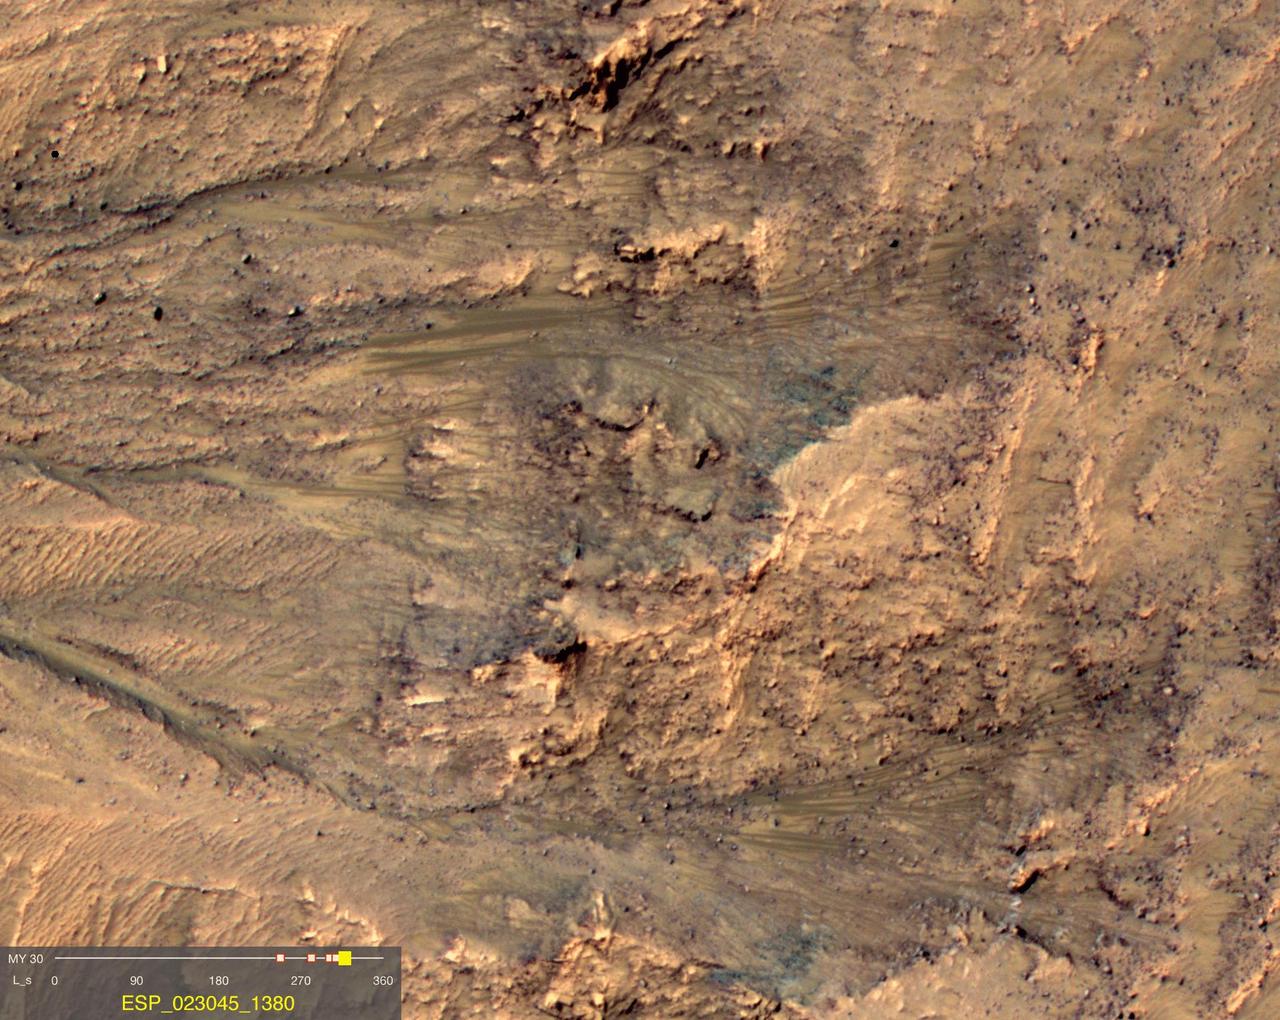
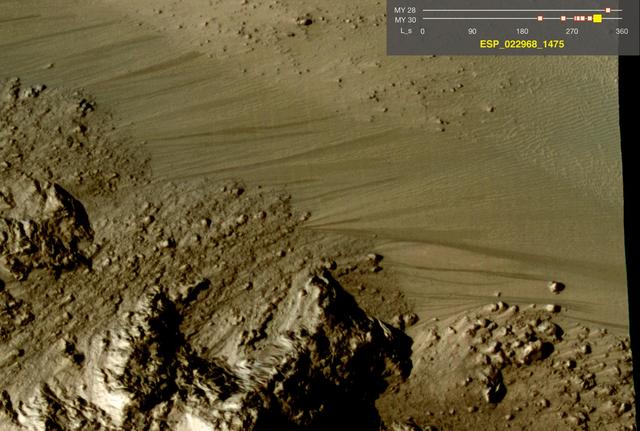
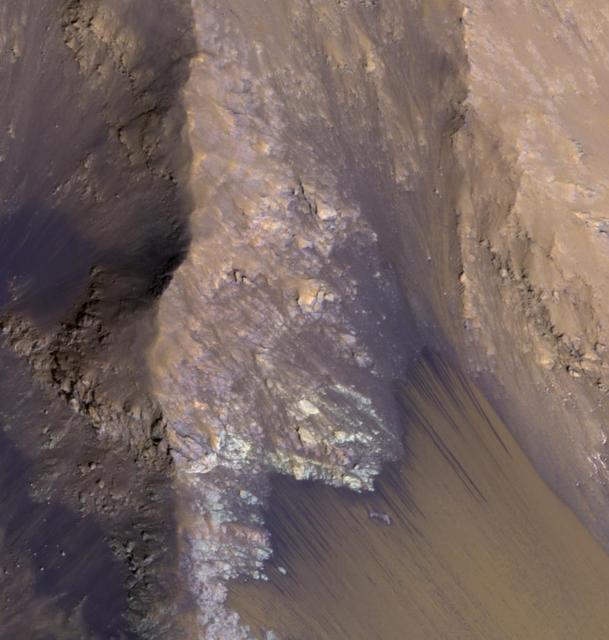
Recurring slope lineae (RSL) are seasonal flows on warm slopes, and are especially common in central and eastern Valles Marineris, as seen in this observation by NASA's Mars Reconnaissance Orbiter (MRO). This image covers a large area full of interesting features. Here, the RSL are active on east-facing slopes, extending from bouldery terrain and terminating on fans. Perhaps the fans themselves built up over time from the seasonal flows. Part of the fans with abundant RSL are dark, while the downhill portion of the fans are bright. The role of water in RSL activity is a matter of active debate. https://photojournal.jpl.nasa.gov/catalog/PIA21608

UAE Ambassador to the US and Minister of State His Excellency Yousef Al Otaib, left, and NASA Administrator Bill Nelson, talk during an event celebrating UAE-US collaboration in space, Friday, March 8, 2024, at the Four Seasons Hotel in Washington. Photo Credit: (NASA/Bill Ingalls)

UAE Ambassador to the US and Minister of State, His Excellency Yousef Al Otaib and others listen as NASA Administrator Bill Nelson gives remarks during an event celebrating UAE-US collaboration in space, Friday, March 8, 2024, at the Four Seasons Hotel in Washington. Photo Credit: (NASA/Bill Ingalls)
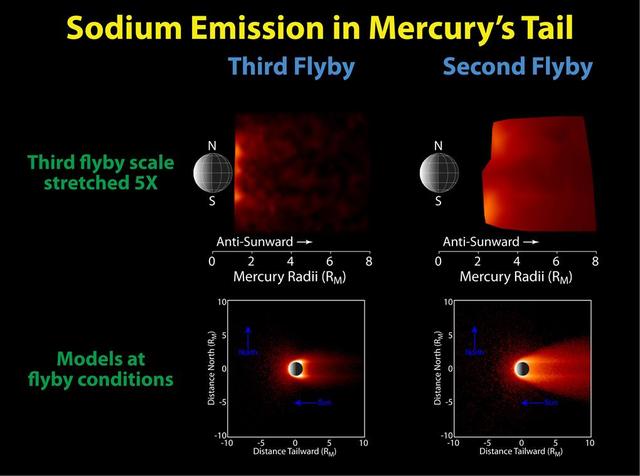
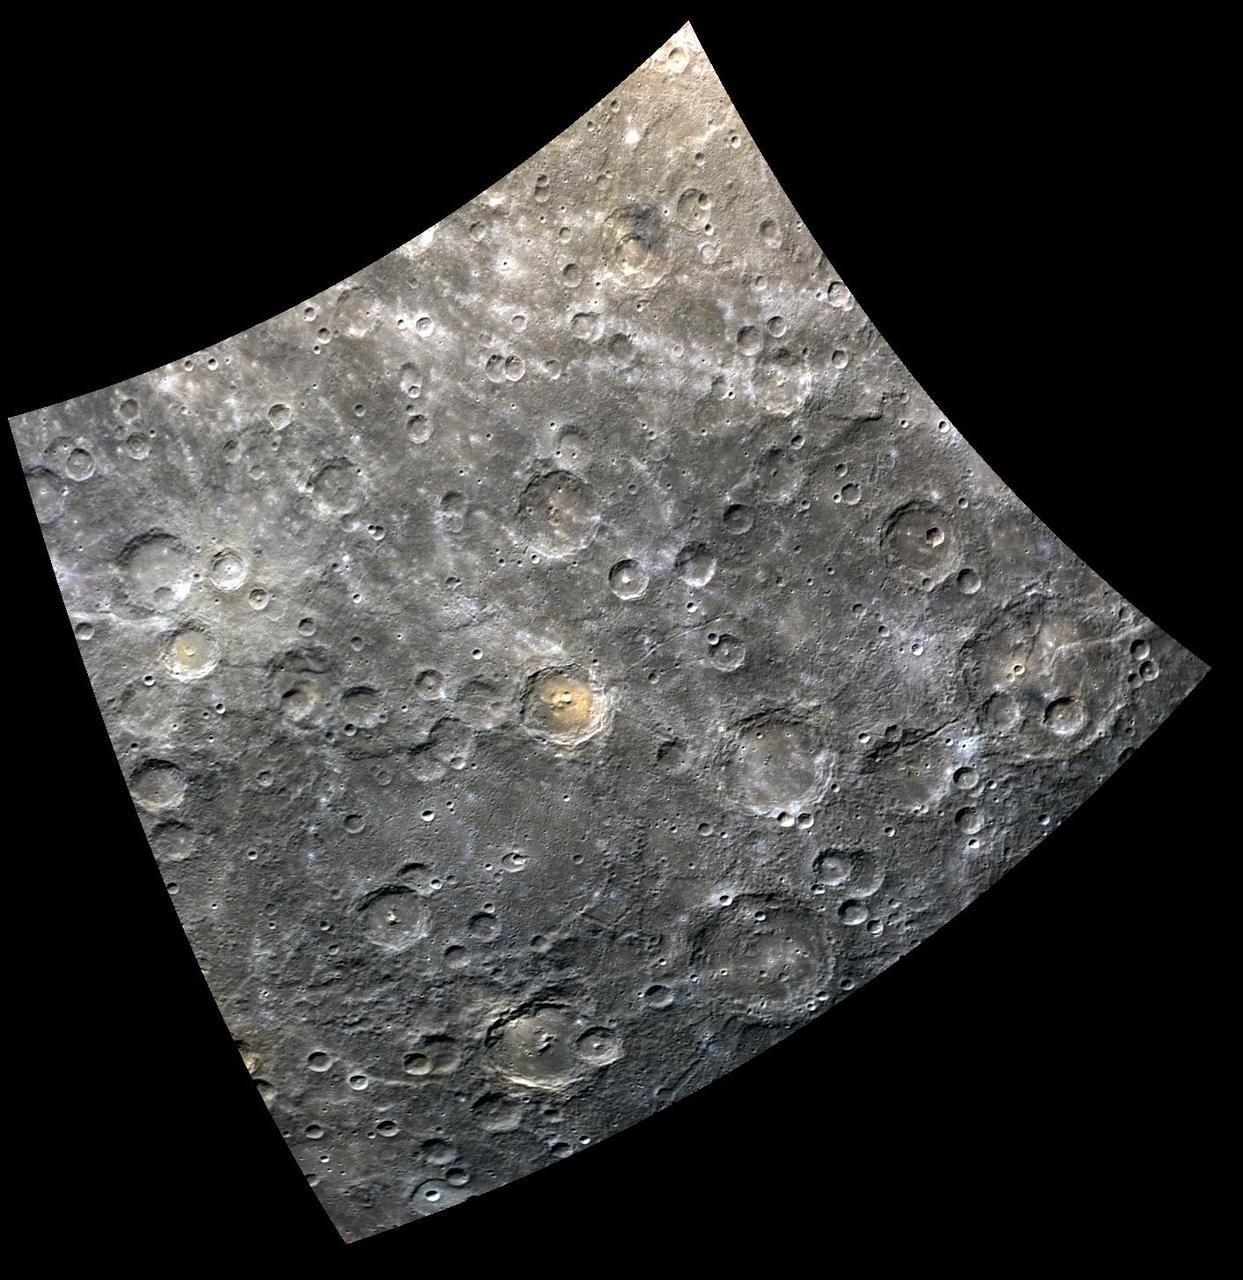
Modeling the Seasons of Mercury Tail

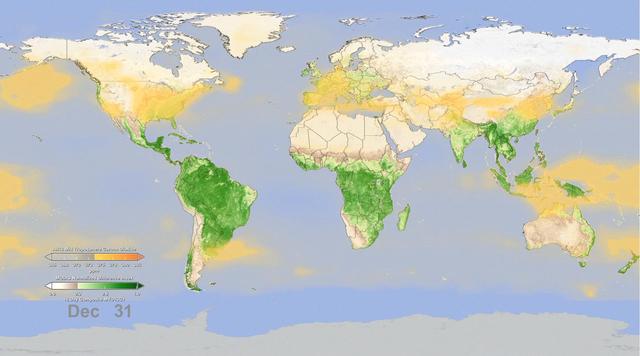
Seasonal changes in Earth surface albedo over a 5-year period are seen in these image summary maps from NASA Terra spacecraft.
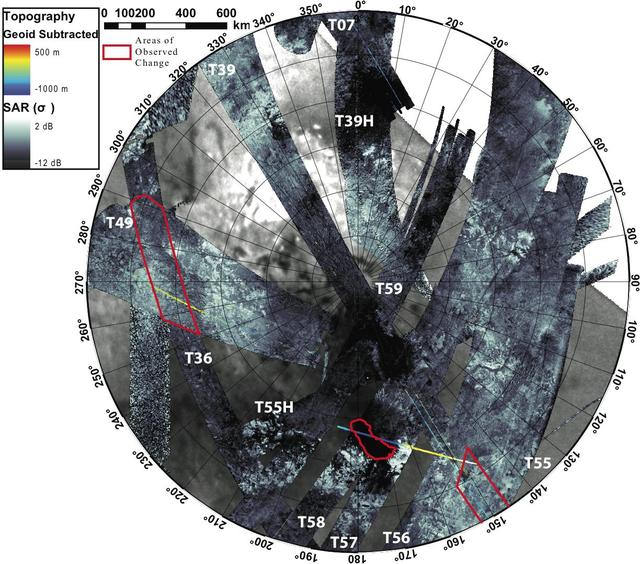
This first glimpse of seasonal change shows the southern polar area of Saturn moon Titan, using data from the Synthetic Aperture Radar instrument aboard NASA Cassini spacecraft.
Seasonal flows on warm Martian slopes may be caused by the flow of salty water on Mars, active today when the surface is warm above the freezing point of the solution. This observation is from NASA Mars Reconnaissance Orbiter.

UAE astronaut and Minister of Youth, H.E. Dr. Sultan Al Neyadi, left, Director General, Mohammed bin Rashid Space Centre Salem AlMarri, and NASA Associate Administrator Jim Free, right, are seen during an event celebrating UAE-US collaboration in space, Friday, March 8, 2024, at the Four Seasons Hotel in Washington. Photo Credit: (NASA/Bill Ingalls)

UAE Ambassador to the US and Minister of State, His Excellency Yousef Al Otaib and others listen as UAE astronaut and Minister of Youth, H.E. Dr. Sultan Al Neyadi, gives remarks during an event celebrating UAE-US collaboration in space, Friday, March 8, 2024, at the Four Seasons Hotel in Washington. Photo Credit: (NASA/Bill Ingalls)

Polar bears already face shorter ice seasons - limiting prime hunting and breeding opportunities. Nineteen separate polar bear subpopulations live throughout the Arctic, spending their winters and springs roaming on sea ice and hunting. The bears have evolved mainly to eat seals, which provide necessary fats and nutrients in the harsh Arctic environment. Polar bears can't outswim their prey, so instead they perch on the ice as a platform and ambush seals at breathing holes or break through the ice to access their dens. The total number of ice-covered days declined at the rate of seven to 19 days per decade between 1979 and 2014. The decline was even greater in the Barents Sea and the Arctic basin. Sea ice concentration during the summer months — an important measure because summertime is when some subpopulations are forced to fast on land — also declined in all regions, by 1 percent to 9 percent per decade. Read more: <a href="http://go.nasa.gov/2cIZSSc" rel="nofollow">go.nasa.gov/2cIZSSc</a> Photo credit: Mario Hoppmann
Seasonal flows called recurring slope lineae RSL grow down warm slopes in the summer, fade when they become inactive, then re-form the following year when the slopes warm up again from the Sun. This observation is from NASA Mars Reconnaissance Orbiter
In this frame from an animation, NASA instruments show the seasonal cycle of vegetation and the concentration of carbon dioxide in the atmosphere.

Senior Director of the Space Engineering Department, MBRSC, Amer Al Sayegh, left, UAE Assistant Minister of Foreign Affairs and International Cooperation for Advanced Science and Technology, Omran Sharaf, NASA Associate Administrator Jim Free, and Director of Space Missions Department, UAESA, Mohsen Al Awadhi, right, participate in a panel discussion during an event celebrating UAE-US collaboration in space, Friday, March 8, 2024, at the Four Seasons Hotel in Washington. Photo Credit: (NASA/Bill Ingalls)

NASA Administrator Bill Nelson, left, Speaks with UAE astronaut Hazza Al Mansouri, and UAE astronaut and Minister of Youth, H.E. Dr. Sultan Al Neyad, right, during an event celebrating UAE-US collaboration in space, Friday, March 8, 2024, at the Four Seasons Hotel in Washington. Photo Credit: (NASA/Bill Ingalls)
These images from NASA Terra spacecraft provide global, seasonal summaries of a quantity called the Directional Hemispherical Reflectance DHR, also sometimes referred to as the black-sky albedo.
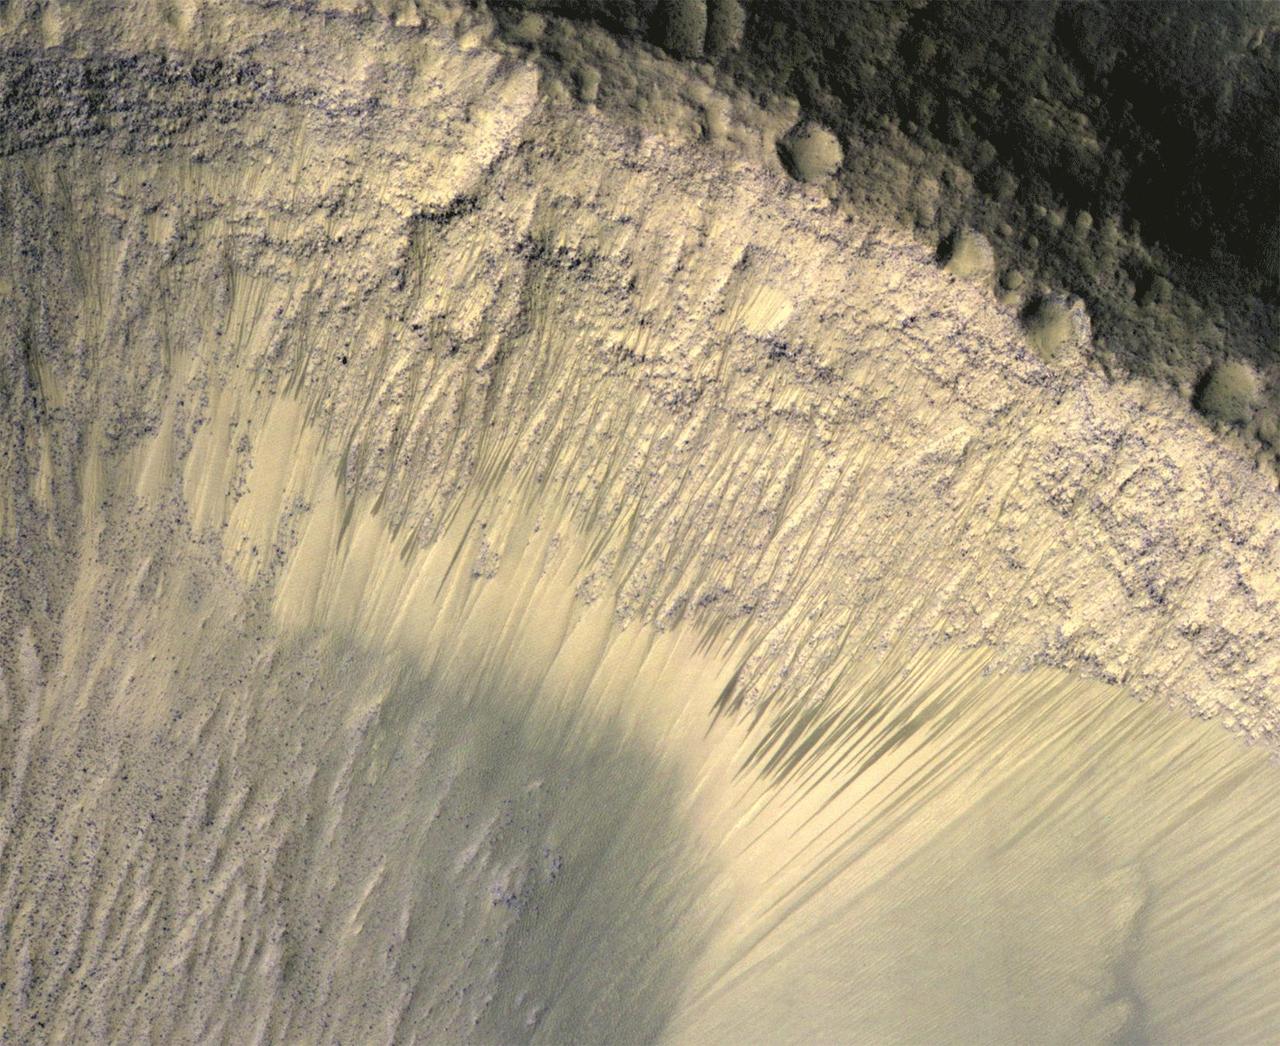
These images from NASA Mars Reconnaissance Orbiter show how the appearance of dark markings on Martian slope changes with the seasons. The marks, called recurrent slope linea extend down slopes during warmer months.
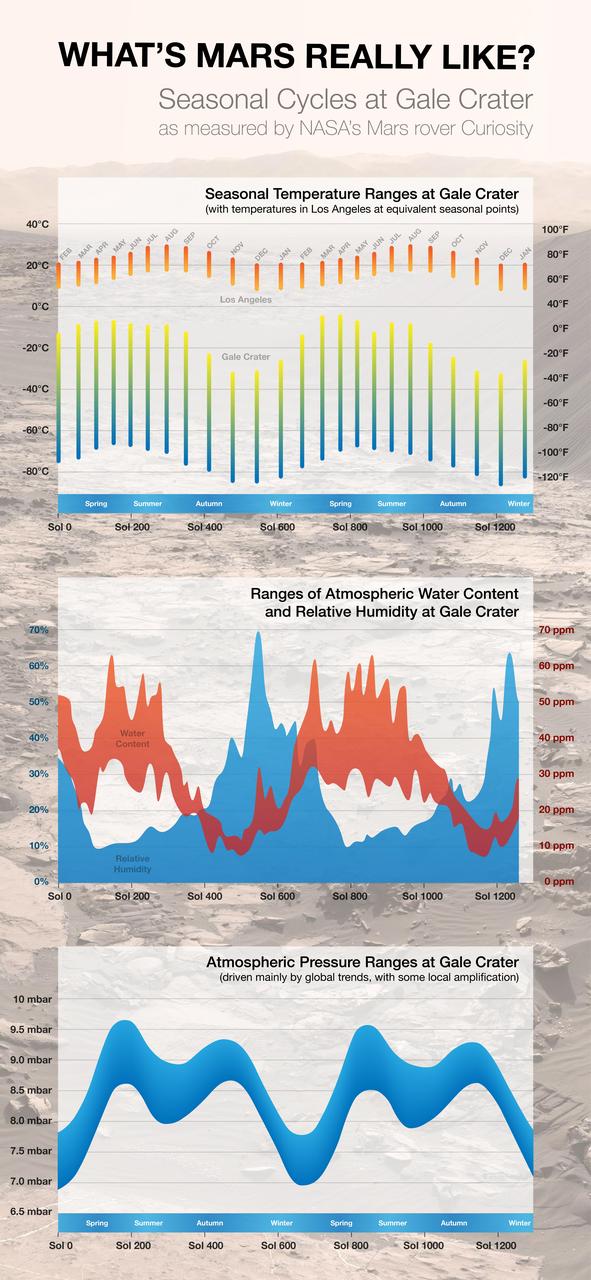
By monitoring weather throughout two Martian years since landing in Gale Crater in 2012, NASA Curiosity Mars rover has documented seasonal patterns such as shown in these graphs of temperature, water-vapor content and air pressure.
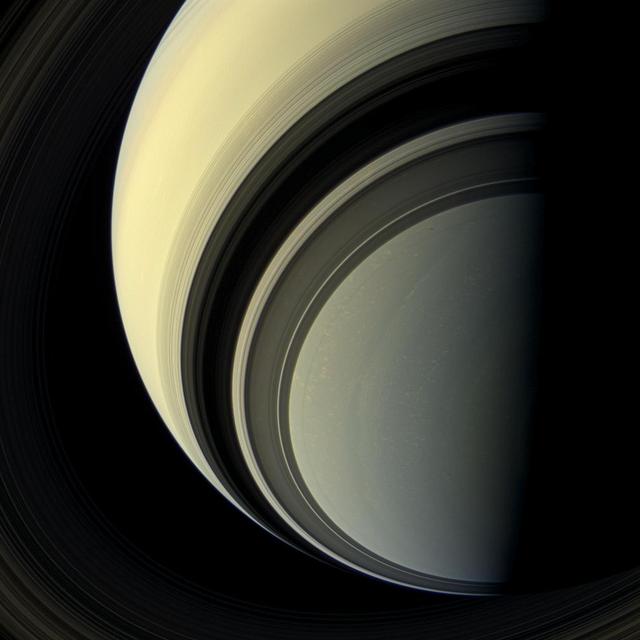
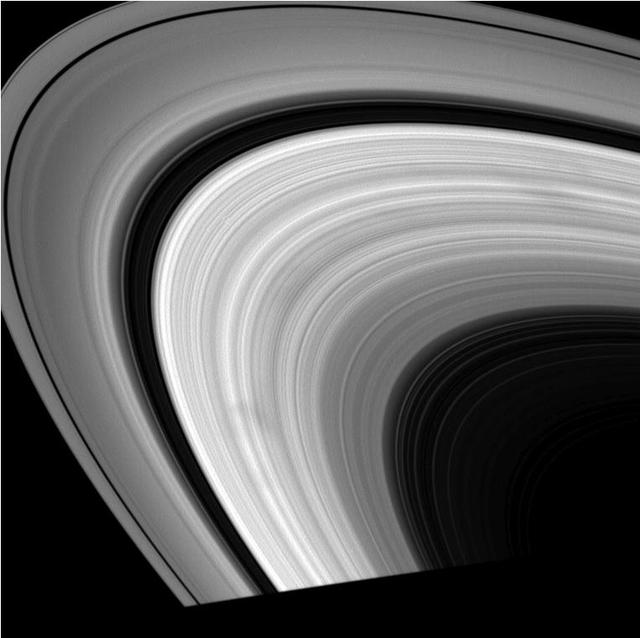
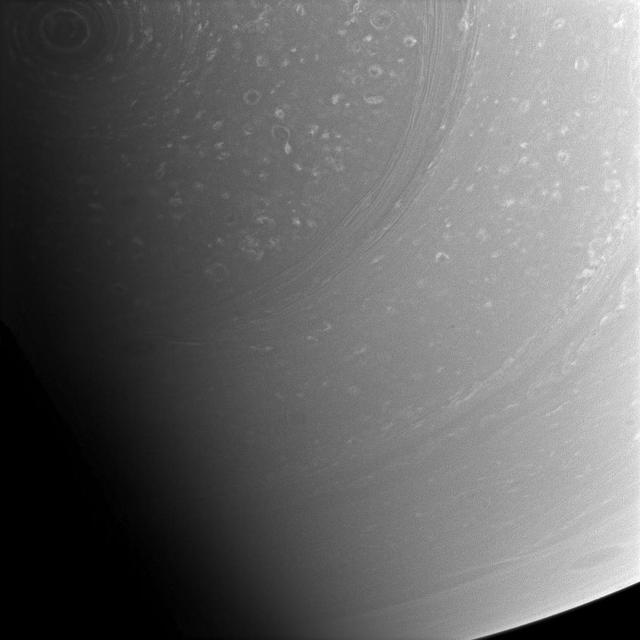
Winter is approaching in the southern hemisphere of Saturn and with this cold season has come the familiar blue hue that was present in the northern winter hemisphere at the start of NASA's Cassini mission. The changing blue hue that we have learned marks winter at Saturn is likely due to reduction of ultraviolet sunlight and the haze it produces, making the atmosphere clearer and increasing the opportunity for Rayleigh scattering (scattering by molecules and smaller particles) and methane absorption: both processes make the atmosphere blue. The small black dot seen to the right and up from image center, within the ring shadows of the A and F rings, is the shadow of the moon, Prometheus. For an image showing winter in the northern hemisphere see PIA08166. This view looks toward the unilluminated side of the rings from about 44 degrees below the ring plane. Images taken using red, green and blue spectral filters were combined to create this natural color view. The images were taken with the Cassini spacecraft wide-angle camera on July 29, 2013. This view was acquired at a distance of approximately 1.003 million miles (1.615 million kilometers) from Saturn. Image scale is 58 miles (93 kilometers) per pixel. http://photojournal.jpl.nasa.gov/catalog/PIA17176

NASA associate administrator for International and Interagency Relations Karen Feldstein, moderates a panel discussion with, Senior Director of the Space Engineering Department, MBRSC, Amer Al Sayegh, left, UAE Assistant Minister of Foreign Affairs and International Cooperation for Advanced Science and Technology, Omran Sharaf, NASA Associate Administrator Jim Free, and Director of Space Missions Department, UAESA, Mohsen Al Awadhi, right, during an event celebrating UAE-US collaboration in space, Friday, March 8, 2024, at the Four Seasons Hotel in Washington. Photo Credit: (NASA/Bill Ingalls)
Ravines or very large gullies are actively forming on Mars during the coldest times of year, when carbon dioxide frost aids mass wasting as seen by NASA Mars Reconnaissance Orbiter. However, some of these ravines also show activity in the warmest time of year, in the form of recurring slope lineae (RSL); dark, narrow flows in some alcoves that flow part way down the channels. Few topographic changes have been seen in association with RSL, and they appear to be seeps of water that seasonally extend down slopes, then fade when inactive, and recur each warm season. Could the RSL activity carve the ravines? In some places the RSL extend to the ends of the fans and appear to match in scale, and perhaps gradually form the ravines. In other places, such as this image, the ravines are much larger than the RSL, so presently-observed RSL flow did not produce the larger landforms, but maybe the flow was greater in the past or maybe the RSL just follow the topography created by other processes. The largest ravines are on pole-facing slopes in the middle latitudes, where RSL have never been seen to form, unless the ravine creates a small equator-facing slope. http://photojournal.jpl.nasa.gov/catalog/PIA19458
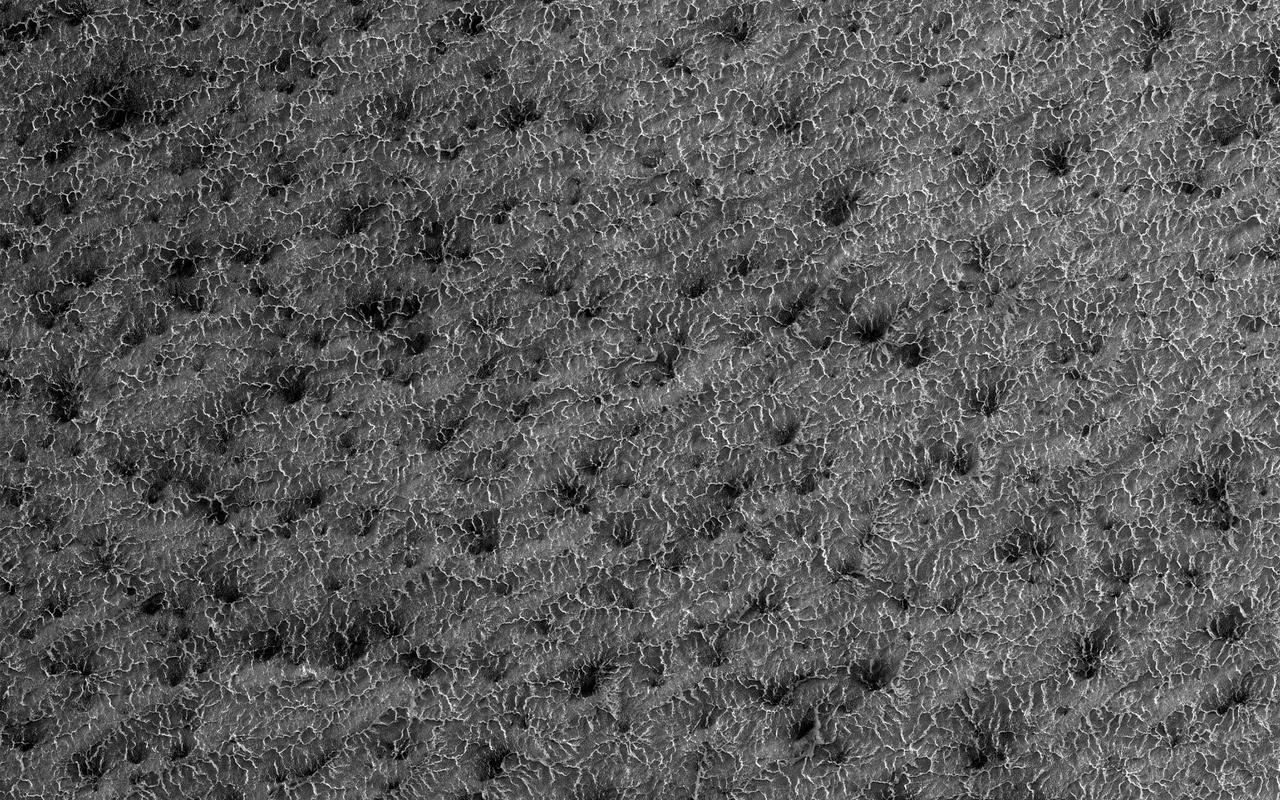
![Recurring Slope Lineae (called "RSL") are seasonally-repeating dark flows that are active at the warmest times of the year. Some of these grow from the top of the steep slope downwards as expected for liquid or granular flows. Others show different darkening patterns, which suggests different processes. Although HiRISE has acquired many images to monitor RSL sites, it still is not certain how these features form. The map is projected here at a scale of 25 centimeters (9.8 inches) per pixel. [The original image scale is 25.8 centimeters (10.2 inches) per pixel (with 2 x 2 binning); objects on the order of 51.7 centimeters (20.4 inches) across are resolved.] North is up. http://photojournal.jpl.nasa.gov/catalog/PIA21558](https://images-assets.nasa.gov/image/PIA21558/PIA21558~medium.jpg)
Recurring Slope Lineae (called "RSL") are seasonally-repeating dark flows that are active at the warmest times of the year. Some of these grow from the top of the steep slope downwards as expected for liquid or granular flows. Others show different darkening patterns, which suggests different processes. Although HiRISE has acquired many images to monitor RSL sites, it still is not certain how these features form. The map is projected here at a scale of 25 centimeters (9.8 inches) per pixel. [The original image scale is 25.8 centimeters (10.2 inches) per pixel (with 2 x 2 binning); objects on the order of 51.7 centimeters (20.4 inches) across are resolved.] North is up. http://photojournal.jpl.nasa.gov/catalog/PIA21558
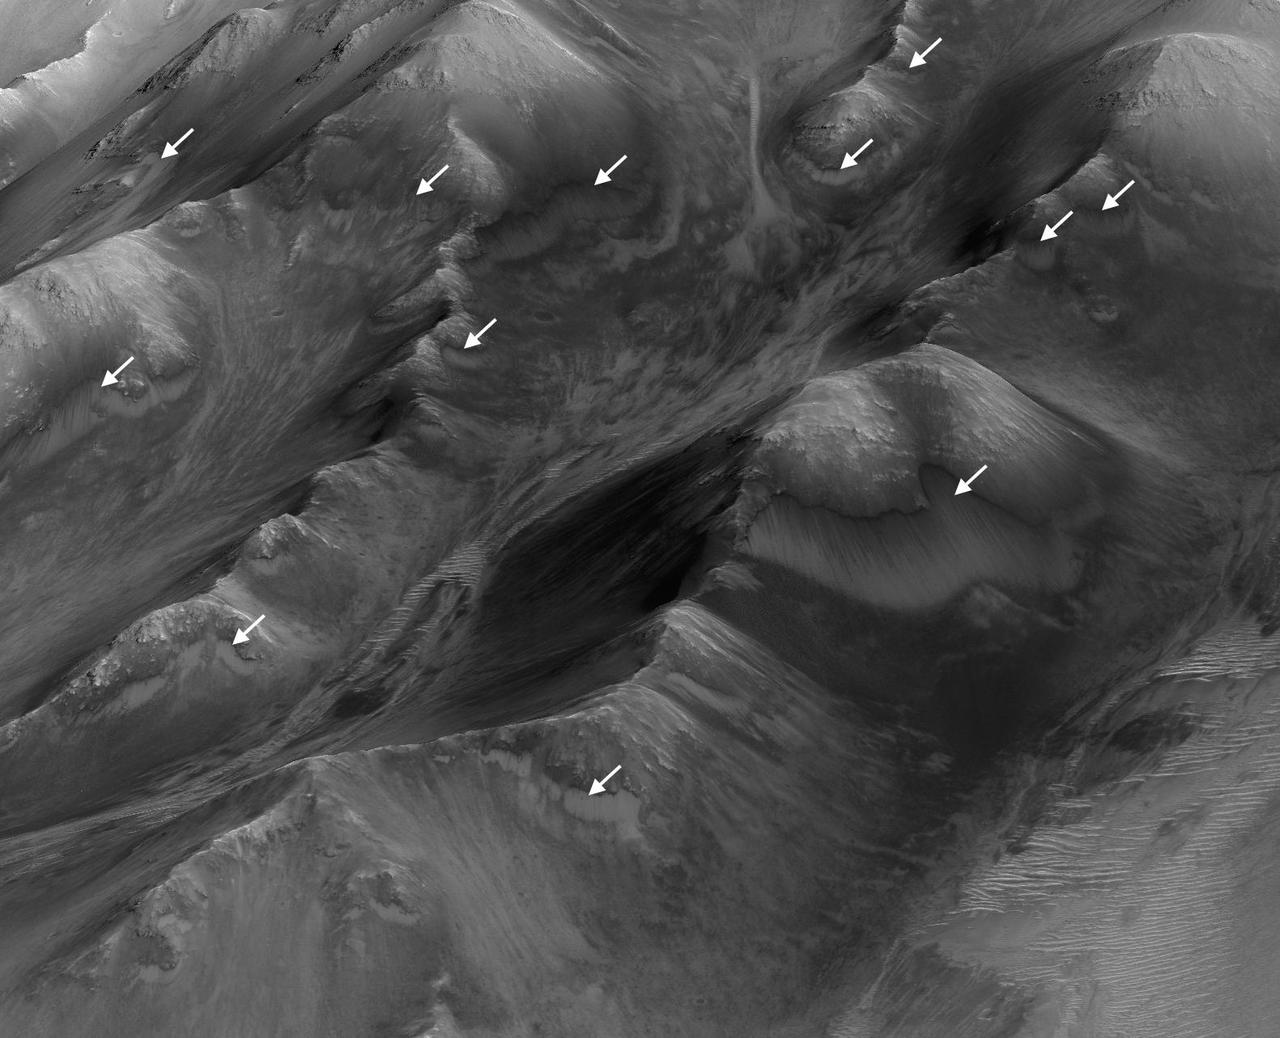
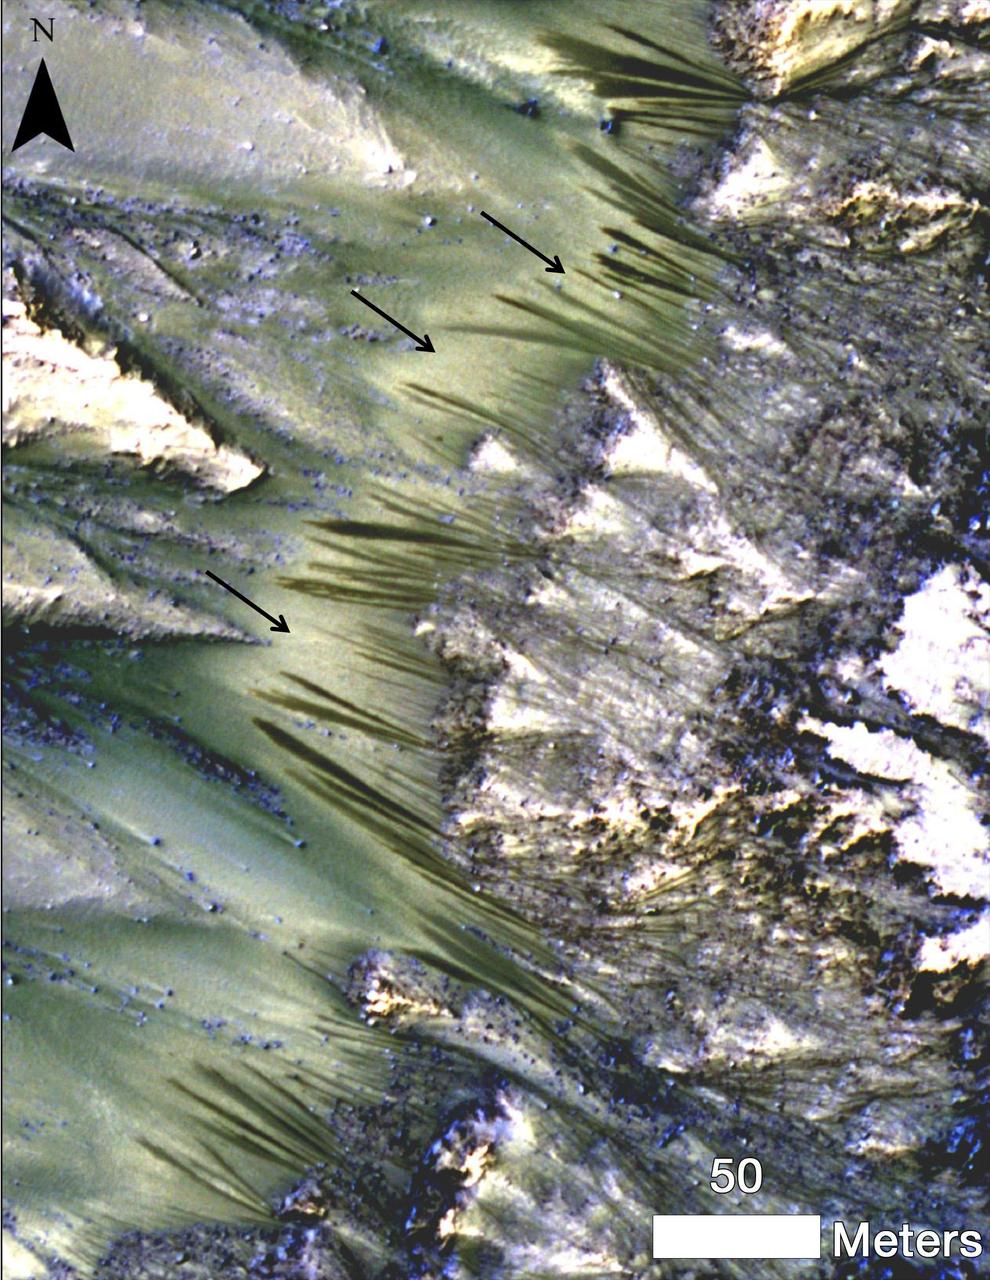
The white arrows indicate locations in this scene where numerous seasonal dark streaks have been identified in the Coprates Montes area of Mars' Valles Marineris by repeated observations from orbit. The streaks, called recurring slope lineae or RSL, extend downslope during a warm season, fade in the colder part of the year, and repeat the process the next Martian year. They are regarded as the strongest evidence for the possibility of liquid water on the surface of modern Mars. This oblique perspective for this view uses a three-dimensional terrain model derived from a stereo pair of observations by the High Resolution Imaging Science Experiment (HiRISE) camera on NASA's Mars Reconnaissance Orbiter. The scene covers an area approximately 1.6 miles (2.5 kilometers) wide. http://photojournal.jpl.nasa.gov/catalog/PIA20757
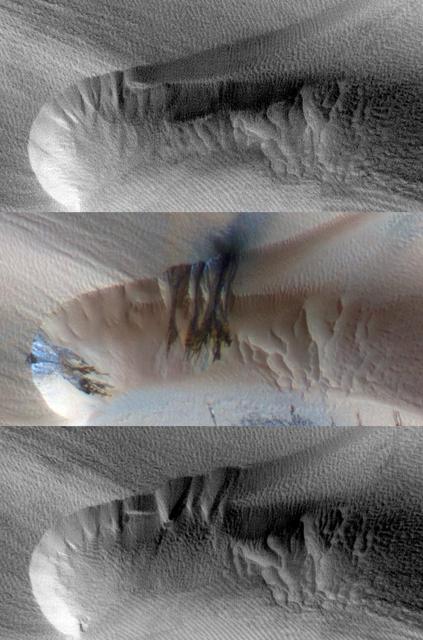
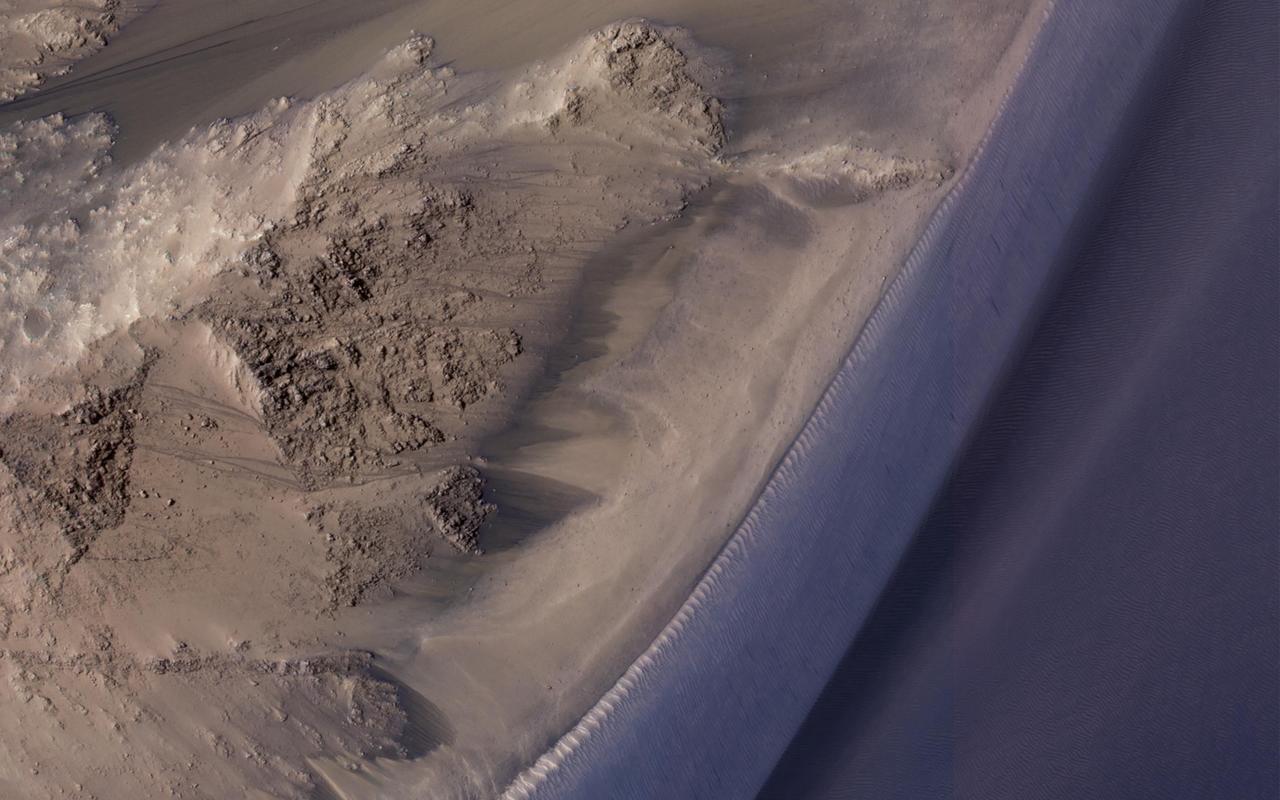
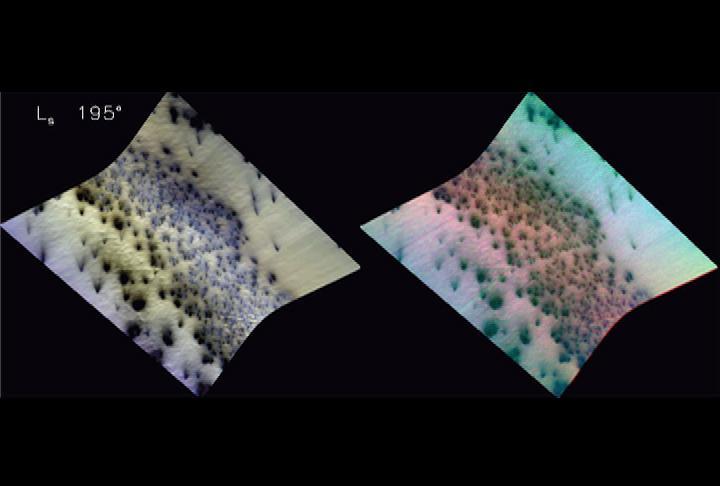
Three images of the same location, taken by NASA Mars Reconnaissance Orbiter at different times on Mars, show seasonal activity causing sand avalanches and ripple changes on a Martian dune. Time sequence of the images progresses from top to bottom.
This image comes from observations of Newton crater by the HiRISE camera onboard NASA Mars Reconnaissance Orbiter; warm-season features might be evidence of salty liquid water active on Mars today.
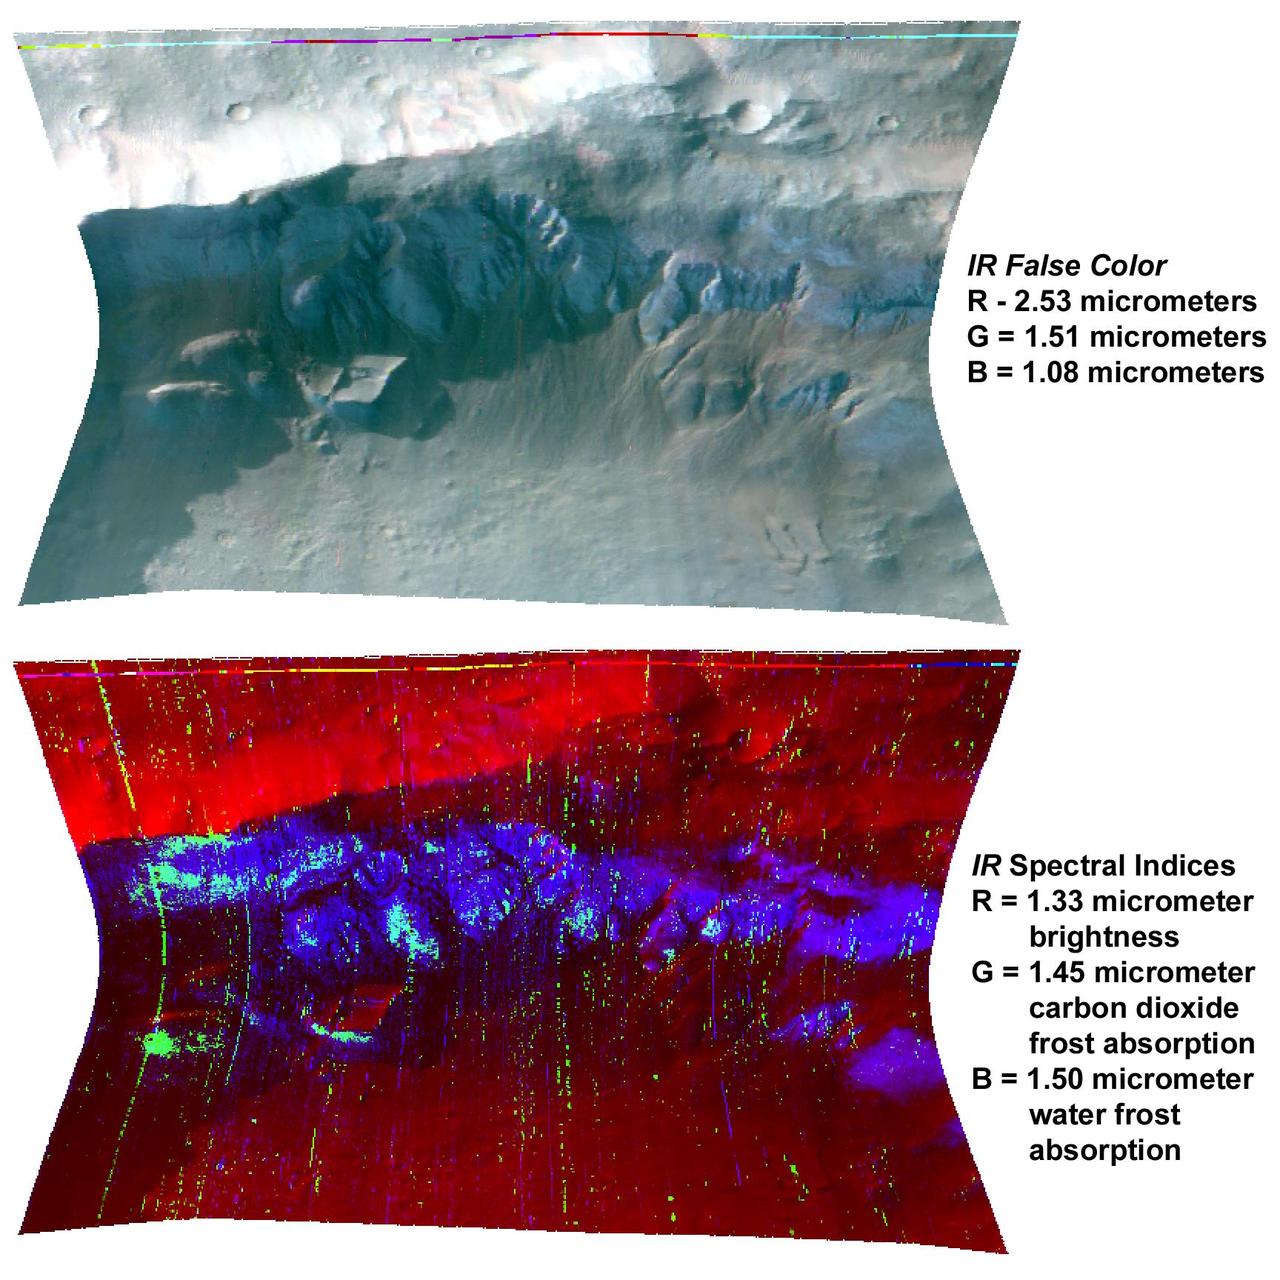
NASA CRISM onboard the Mars Reconnaissance Orbiter shows Mars seasonal caps consist of frozen carbon dioxide mixed with smaller amounts of water ice frost and dust.
This image comes from observations of Horowitz crater by the HiRISE camera onboard NASA Mars Reconnaissance Orbiter. The features that extend down the slope during warm seasons are called recurring slope lineae.
This image comes from observations of Newton crater by the HiRISE camera onboard NASA Mars Reconnaissance Orbiter. The features that extend down the slope during warm seasons are called recurring slope lineae.
This image comes from observations of Horowitz crater by the HiRISE camera onboard NASA Mars Reconnaissance Orbiter. The features that extend down the slope during warm seasons are called recurring slope lineae.
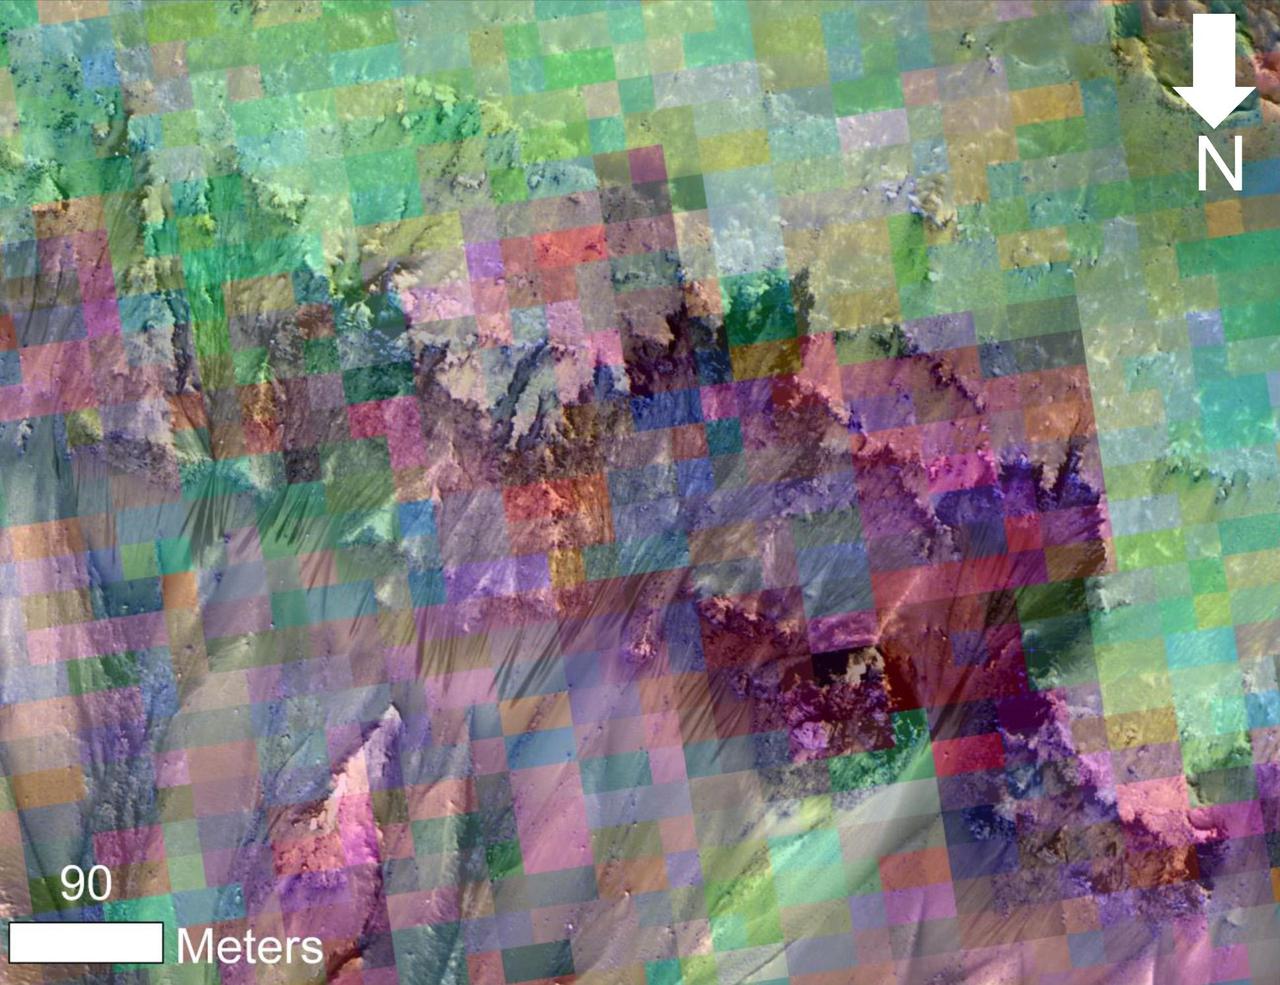
This image from NASA Mar Reconnaissance Orbiter combines a photograph of seasonal dark flows on a Martian slope at Palikir Crater with a grid of colors based on data collected by a mineral-mapping spectrometer observing the same area.

The SDO spacecraft is in another eclipse season as of Feb. 6, 2019. This begins a several week period when the Earth briefly blocks SDO's view of the Sun each day. In fact, because SDO orbits above the Mountain Time zone, the Earth passes between SDO and the Sun at about 7:20 UT (12:20 am MT) each orbit. Eclipses are due to SDO's circular geosynchronous orbit some 22,000 miles above Earth. At the speed we are showing the frames, the eclipse is only a flicker. The still image shows that the edge of Earth, here about halfway across the Sun, looks quite rough due to the absorption of the 304 Å EUV light by our atmosphere. Movies available at https://photojournal.jpl.nasa.gov/catalog/PIA21213
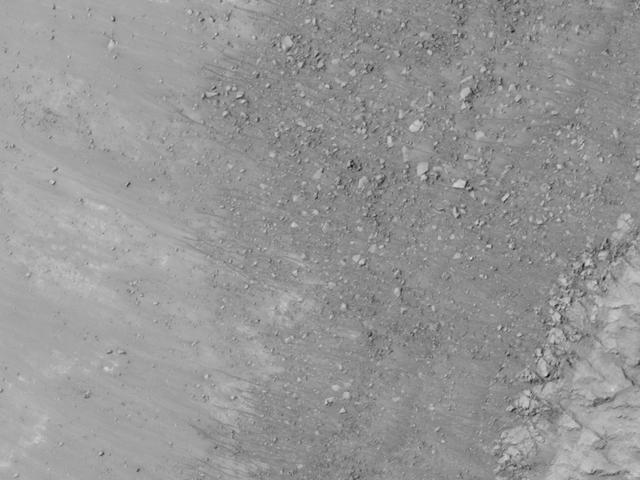
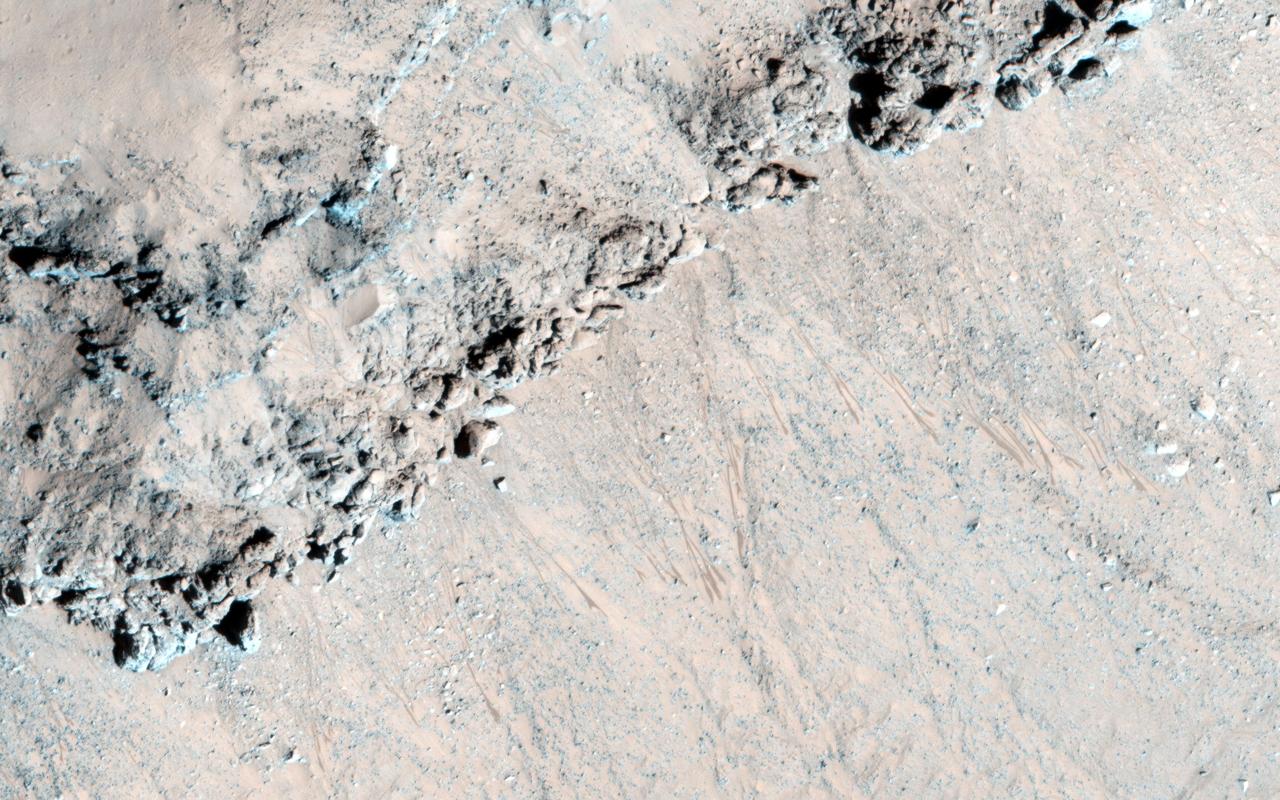
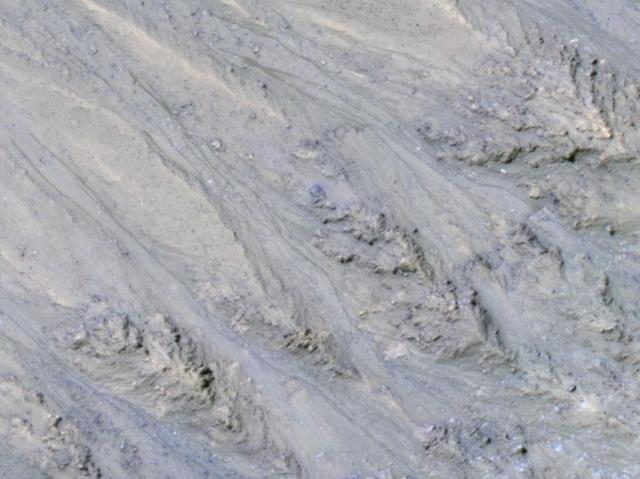
Among the many discoveries by NASA's Mars Reconnaissance Orbiter since the mission was launched on Aug. 12, 2005, are seasonal flows on some steep slopes. These flows have a set of characteristics consistent with shallow seeps of salty water. This July 21, 2015, image from the orbiter's High Resolution Imaging Science Experiment (HiRISE) camera shows examples of these flows on a slope within Coprates Chasma, which is part of the grandest canyon system on Mars, Valles Marineris. The image covers an area of ground one-third of a mile (536 meters) wide. These flows are called recurring slope lineae because they fade and disappear during cold seasons and reappear in warm seasons, repeating this pattern every Martian year. The flows seen in this image are on a north-facing slope, so they are active in northern-hemisphere spring. The flows emanate from the relatively bright bedrock and flow onto sandy fans, where they are remarkably straight, following linear channels. Valles Marineris contains more of these flows than everywhere else on Mars combined. At any season, some are active, though on different slope aspects at different seasons. Future human explorers (and settlers?) will need water to drink, grow food, produce oxygen to breath, and make rocket fuel. Bringing all of that water from Earth would be extremely expensive, so using water on Mars is essential. Although there is plenty of water ice at high latitudes, surviving the cold winters would be difficult. An equatorial source of water would be preferable, so Valles Marineris may be the best destination. However, the chemistry of this water must be understood before betting any lives on it. http://photojournal.jpl.nasa.gov/catalog/PIA19805
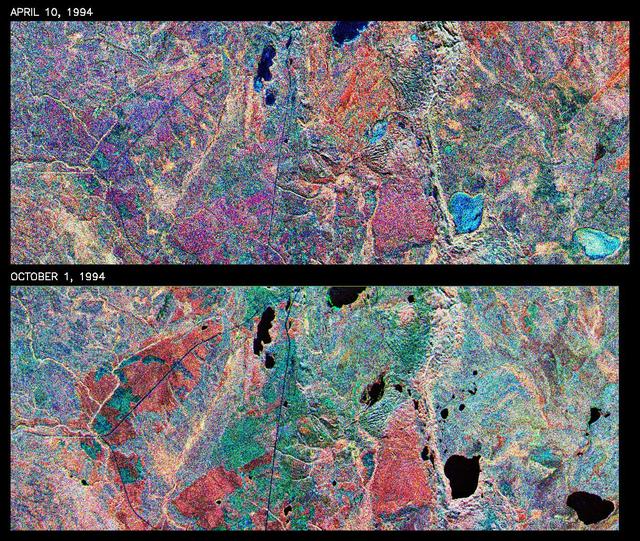
This is an X-band image showing seasonal changes at the hydrological test site of Bebedouro in Brazil. The image is centered at 9 degrees south latitude and 40.2 degrees west longitude. This image was acquired by the Spaceborne Imaging Radar-C and X-band Synthetic Aperture Radar (SIR-C/X-SAR) aboard the space shuttle Endeavour on April 10, 1994, during the first flight of the radar system, and on October 1, 1994, during the second mission. The swath width is approximately 16.5 kilometers (10.5 miles) wide. The image channels have the following color assignments: red represents data acquired on April 10; green represents data acquired on October 1; blue corresponds to the ratio of the two data sets. Agriculture plays an important economic and social role in Brazil. One of the major problems related to Brazilian agriculture is estimating the size of planting areas and their productivity. Due to cloud cover and the rainy season, which occurs from November through April, optical and infrared Earth observations are seldom used to survey the region. An additional goal of monitoring this region is to watch the floodplains of rivers like Rio Sao Francisco in order to determine suitable locations for additional agricultural fields. This area belongs to the semi-arid northeastern region of Brazil, where estimates have suggested that about 10 times more land could be used for agriculture, including some locations which could be used for irrigation projects. Monitoring of soil moisture during the important summer crop season is of high priority for the future development and productivity of this region. In April the area was covered with vegetation because of the moisture of the soil and only small differences could be seen in X-band data. In October the run-off channels of this hilly region stand out quite clearly because the greenish areas indicated much less soil moisture and water content in plants. http://photojournal.jpl.nasa.gov/catalog/PIA01733

UAE Assistant Minister of Foreign Affairs and International Cooperation for Advanced Science and Technology, Omran Sharaf, left, NASA associate administrator Jim Free, National Space Council Executive Secretary Chirag Parikh, NASA associate administrator for International and Interagency Relations Karen Feldstein, Director General, UAE Space Agency Salem Al Qubaisi, UAE Ambassador to the US and Minister of State His Excellency Yousef Al Otaib, UAE astronaut and Minister of Youth, H.E. Dr. Sultan Al Neyadi, NASA Administrator Bill Nelson, Director General, Mohammed bin Rashid Space Centre Salem AlMarri, and UAE astronaut Hazza Al Mansouri, right, pose for a group photograph during an event celebrating UAE-US collaboration in space, Friday, March 8, 2024, at the Four Seasons Hotel in Washington. Photo Credit: (NASA/Bill Ingalls)
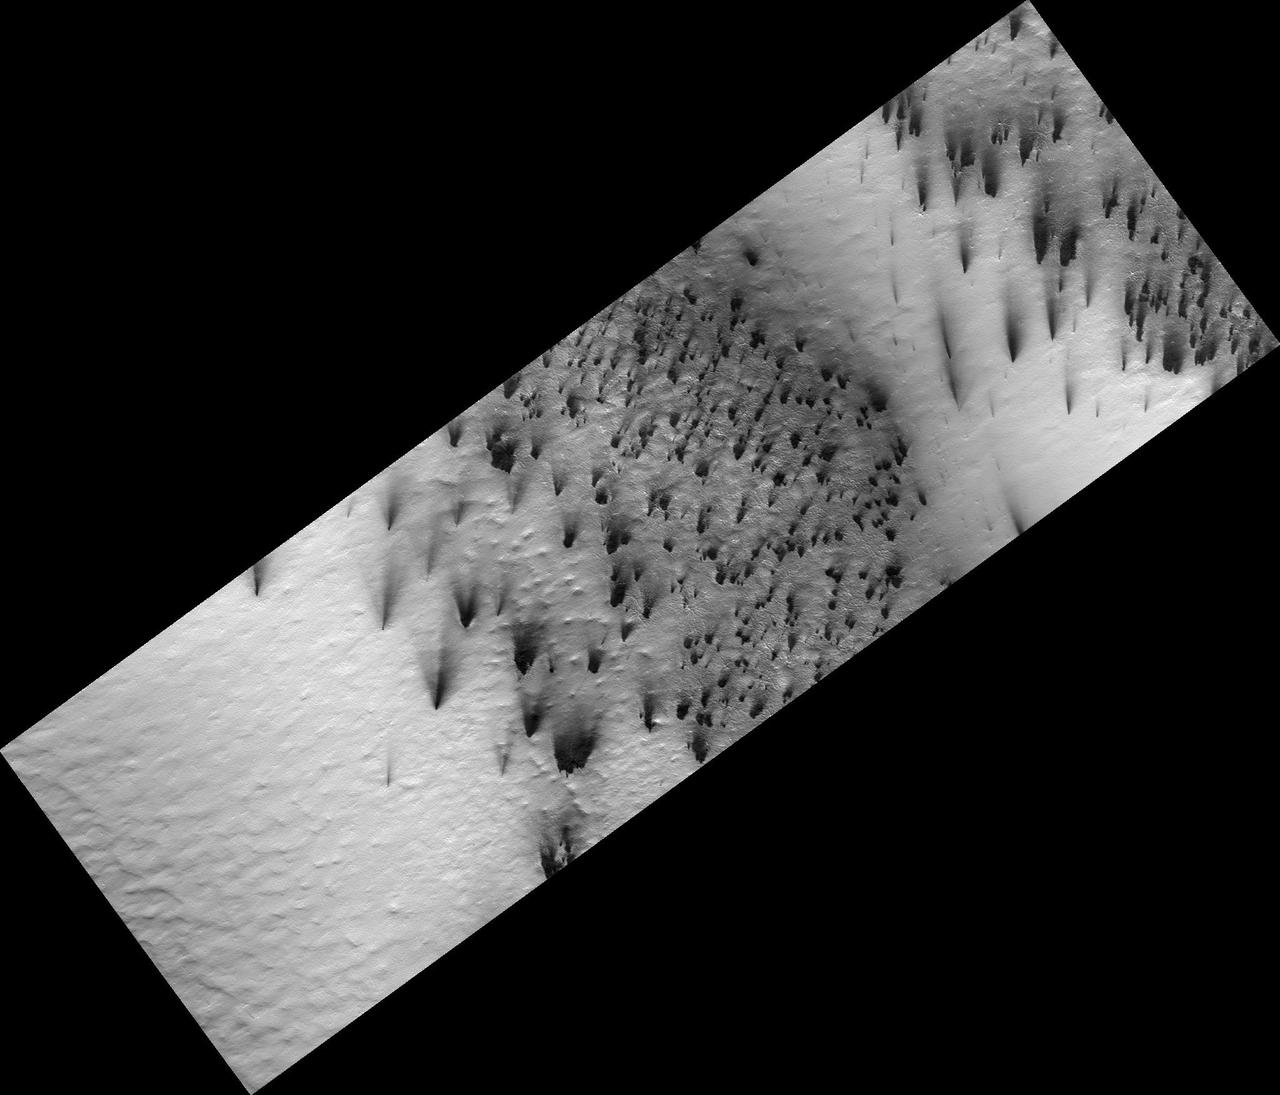
Springtime in the South Polar region of Mars is a season of exciting activity. The thick coating of carbon dioxide ice that accumulated over the winter begins to sublimate (turn to vapor) as the sun rises higher in the sky and warms the ice. Sunlight penetrates through the transparent ice, and is absorbed at the base of the ice layer. The gas that forms as a result of the warming escapes through weaknesses in the ice and erupts in the form of magnificent geysers of gas and dust. This image captures some of this activity in a region near 85 degrees south latitude that is being monitored by HiRISE. What makes this image interesting is the changing directions of the fans left behind by the geysers, indicating that the winds blew from different directions at the time that the geysers erupted. Winds from the southwest produced the dark fans at both ends of the image, whereas northwesterly winds dominated dust deposition in between. Local topography probably played a role in altering the wind direction; this shaded relief image shows that this image traverses a trough in the South Polar layered deposits, which may have funneled winds down slope along the length of the trough. https://photojournal.jpl.nasa.gov/catalog/PIA22881
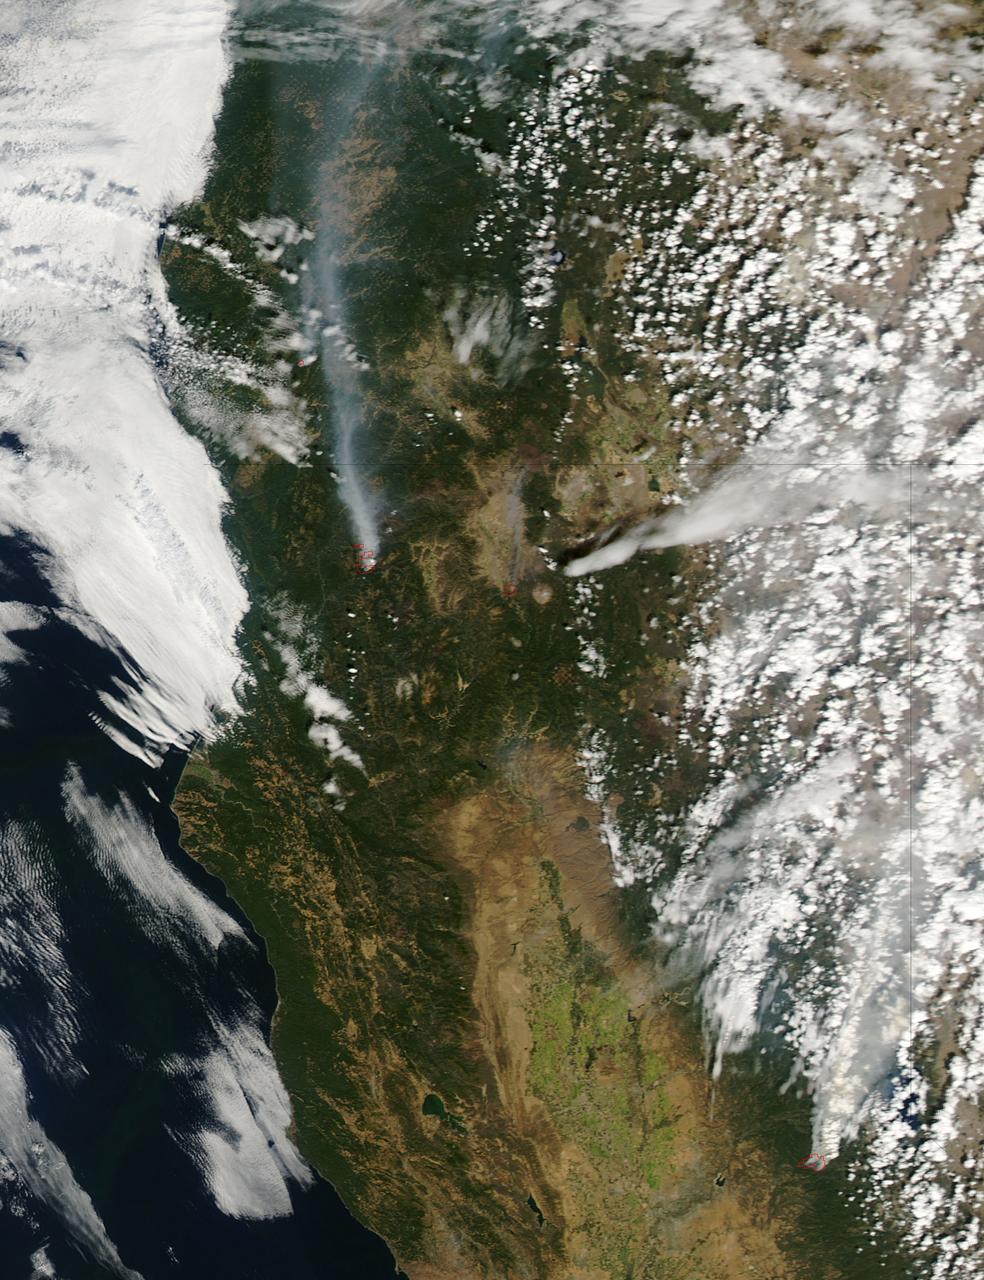
The fire season in California has been anything but cooperative this year. Hot conditions combined with a state-wide drought and dry lightning makes for unpleasant conditions and leads to an abundance of forest fires. On August 12, lightning struck and started the fire that grew into the Happy Camp Complex. Currently over 113,000 acres have been affected and the fire is only 55% contained as of today. Strong winds tested fire lines yesterday (8/15), and are expected to do so again today. Despite the high winds, existing fire lines held with no spotting or expansion outside current containment lines. The south end of the fire continued backing slowly toward Elk Creek in the Marble Mountain Wilderness. The Man Fire joined with the Happy Camp Complex yesterday and will be managed by California Interagency Incident Management Team 4 as of 6:00am on Wednesday, September 17, 2014. Nearby the Happy Camp Complex, near Mt. Shasta and the town of Weed, another fire erupted that fire officials said quickly damaged or destroyed 100 structures Monday (8/15). Hundreds of firefighters were trying to contain that fire. A California Fire spokesman said more than 300 acres were scorched and more than 100 structures damaged or destroyed in just a few hours. The blaze, dubbed the Boles Fire, also led to the closure of Interstate 5 and U.S. 97. Weed is in Siskiyou County, about 50 miles south of the California-Oregon border. With strong winds, the fire was able to rage into the community before firefighters could get equipment to the blaze. About 1,500 to 2,000 residents were being evacuated to the Siskiyou County fairgrounds. An evacuation center was set up at the county fairgrounds in Yreka. NASA's Aqua satellite collected this natural-color image with the Moderate Resolution Imaging Spectroradiometer, MODIS, instrument on September 15, 2014. Actively burning areas, detected by MODIS’s thermal bands, are outlined in red. NASA image courtesy Jeff Schmaltz LANCE/EOSDIS MODIS Rapid Response Team, GSFC. Caption by Lynn Jenner with information from Inciweb and California Department of Forestry and Fire Protection. <b><a href="http://www.nasa.gov/audience/formedia/features/MP_Photo_Guidelines.html" rel="nofollow">NASA image use policy.</a></b> <b><a href="http://www.nasa.gov/centers/goddard/home/index.html" rel="nofollow">NASA Goddard Space Flight Center</a></b> enables NASA’s mission through four scientific endeavors: Earth Science, Heliophysics, Solar System Exploration, and Astrophysics. Goddard plays a leading role in NASA’s accomplishments by contributing compelling scientific knowledge to advance the Agency’s mission. <b>Follow us on <a href="http://twitter.com/NASAGoddardPix" rel="nofollow">Twitter</a></b> <b>Like us on <a href="http://www.facebook.com/pages/Greenbelt-MD/NASA-Goddard/395013845897?ref=tsd" rel="nofollow">Facebook</a></b> <b>Find us on <a href="http://instagram.com/nasagoddard?vm=grid" rel="nofollow">Instagram</a></b>
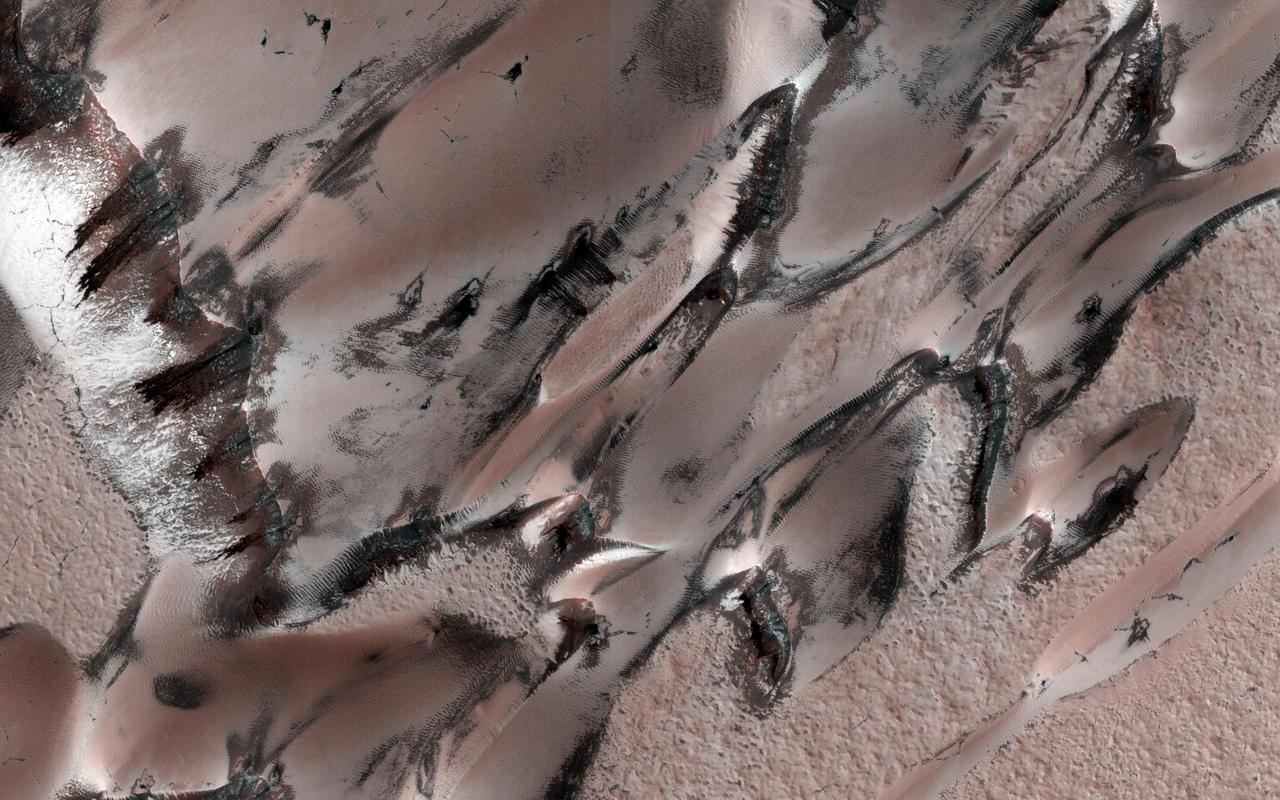
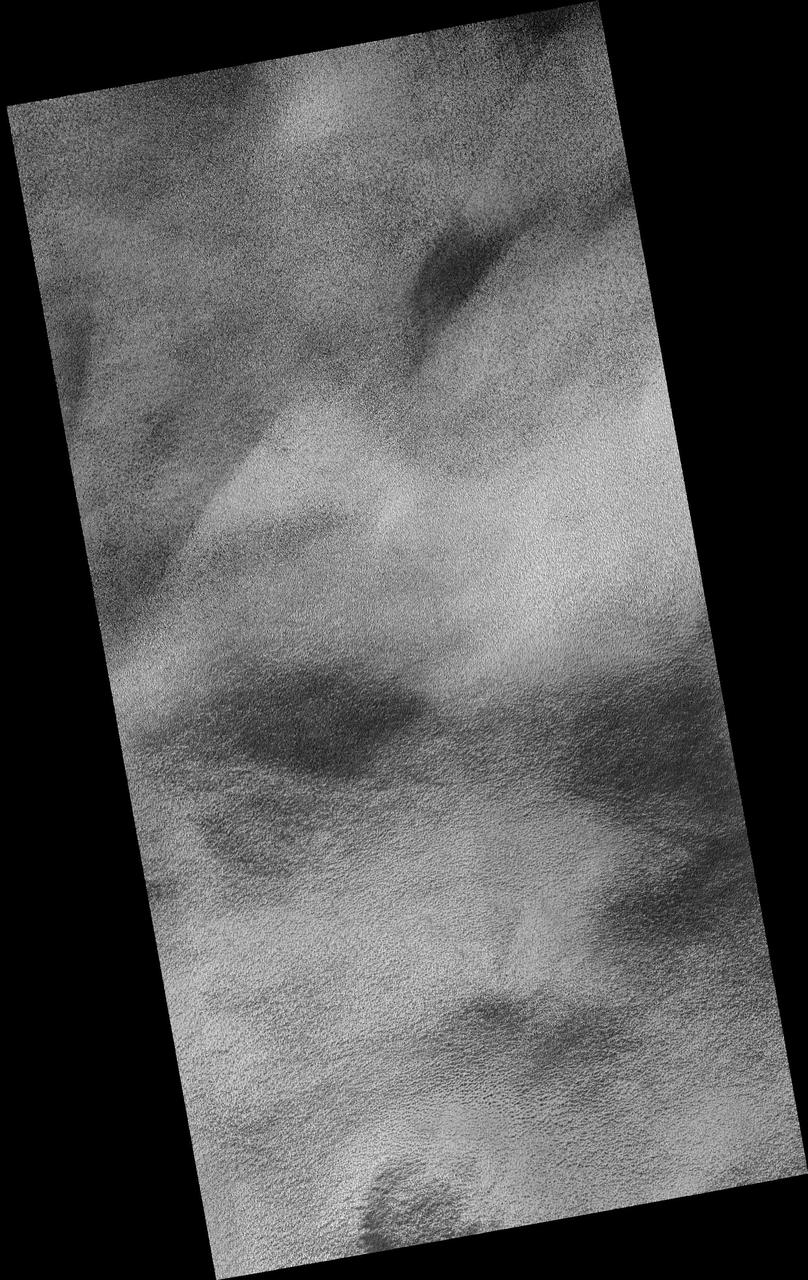
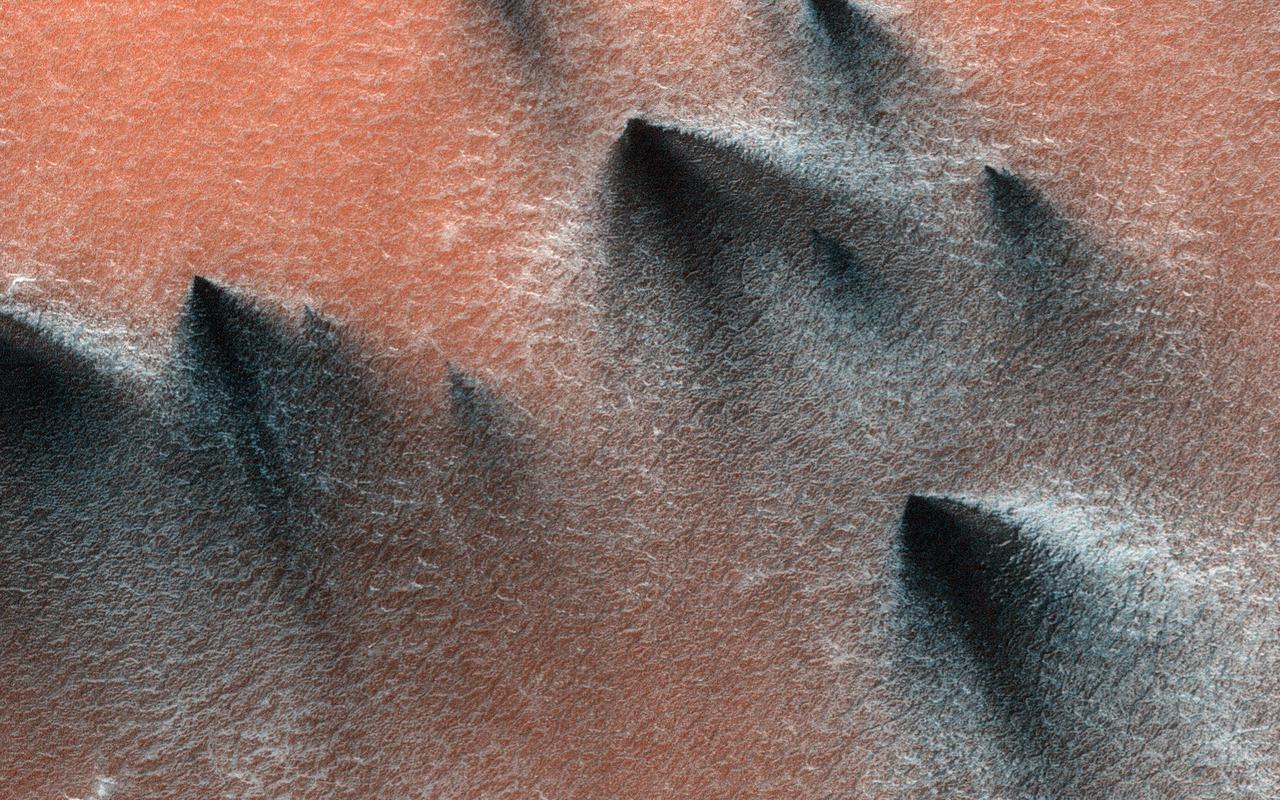
This image covers a unique polar dune field during northern spring, revealing some interesting patterns. The main "megadune" formation comprises giant crescent-shaped dunes called "barchans," which have been migrating (from upper-right to lower-left) over the past several centuries or more. Light-toned seasonal carbon dioxide frost and ice that accumulated over the winter still covers the majority of the surface, and is now starting to defrost and sublimate in complex patterns. (This depends on the slope aspect and incoming solar illumination). As frost is removed, the darker "coal-black" nature of the dune sand is revealed. For example, compare with this image taken in summer, when frost is gone and the dunes are migrating. The striped patterns of the carbon dioxide frost and linear nature of the dune field give it a sea serpent-like appearance. https://photojournal.jpl.nasa.gov/catalog/PIA24699

iss072e280674 (Nov. 24, 2024) --- NASA astronaut and Expedition 72 Commander Suni Williams poses for a fun holiday season portrait while speaking on a ham radio inside the International Space Station's Columbus laboratory module.
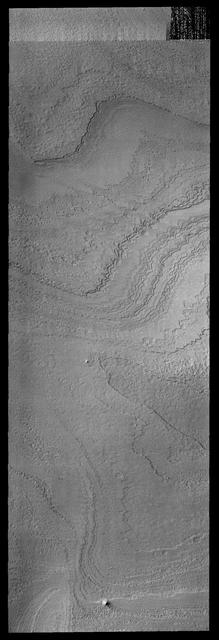
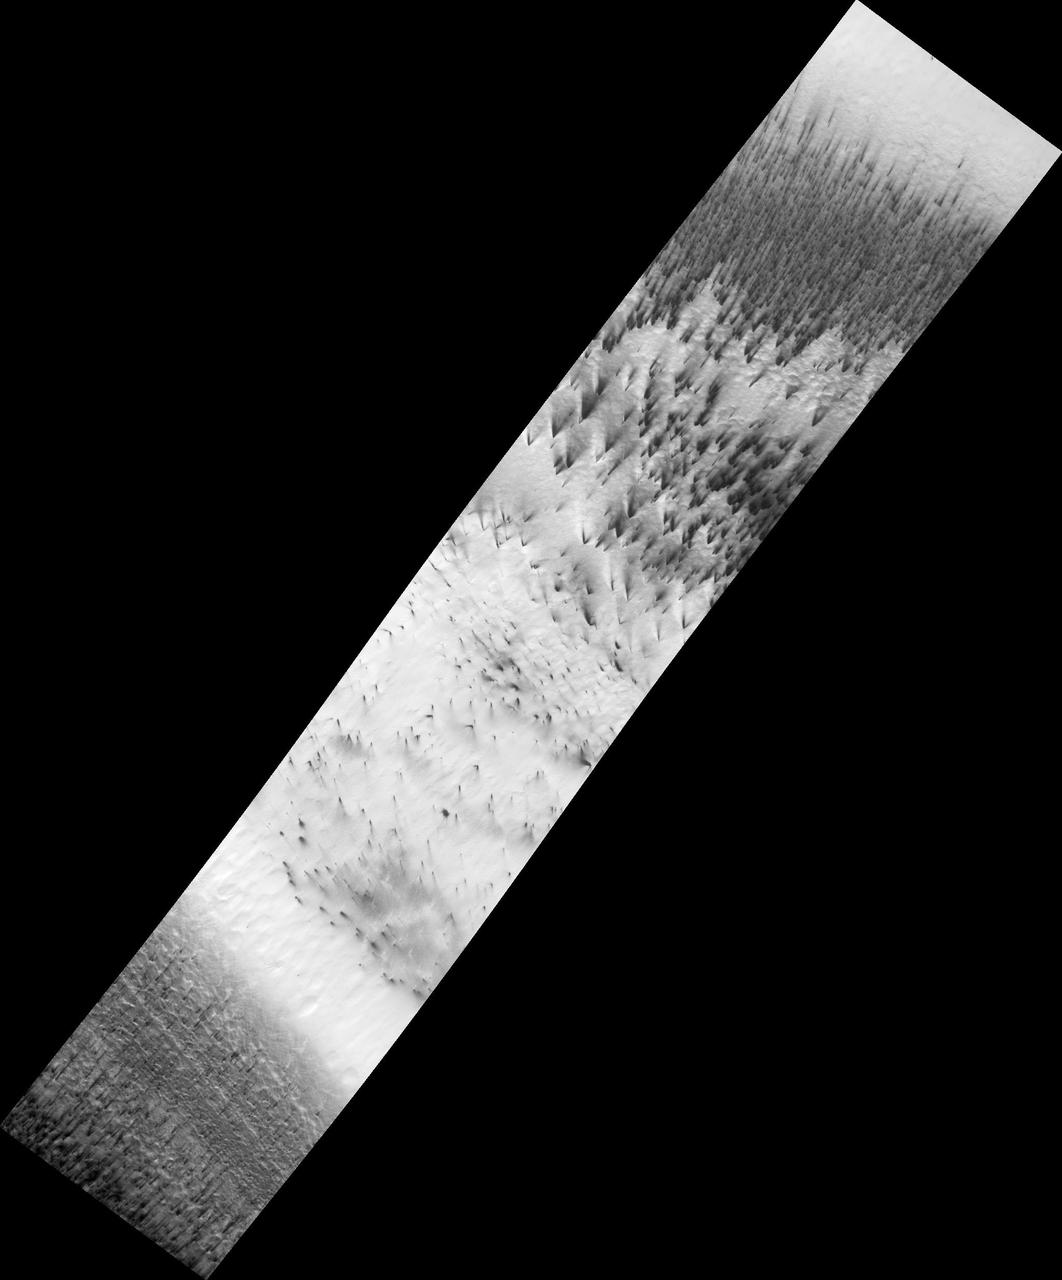
Late in the summer season, the numerous polar layers are free of frost and easily visible
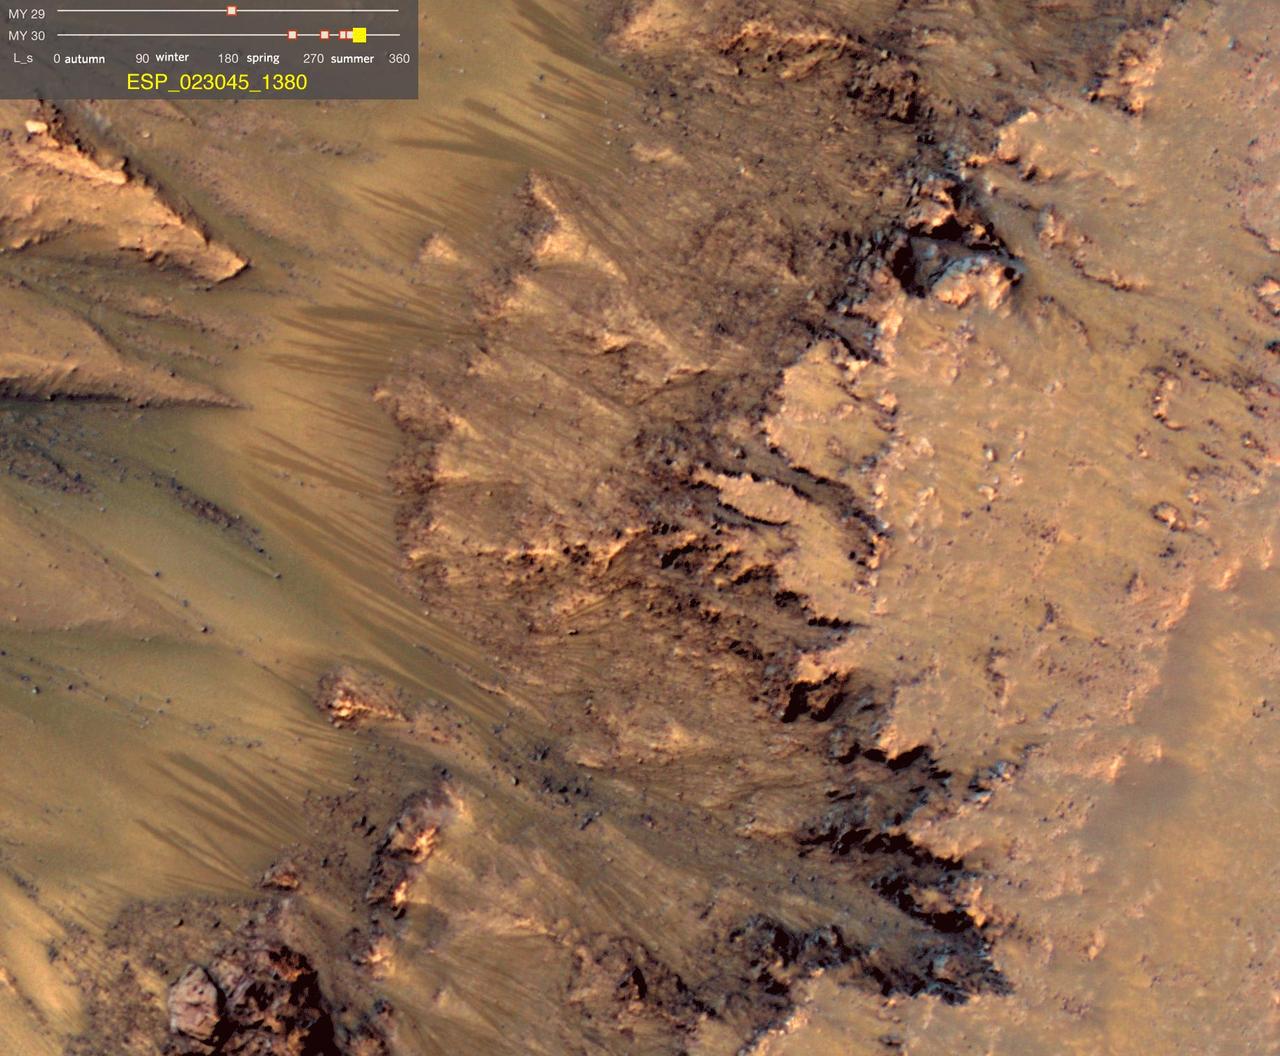
This image comes from observations of Newton crater by the HiRISE camera onboard NASA Mars Reconnaissance Orbiter where features appear and incrementally grow during warm seasons and fade in cold seasons.
This inner slope of a crater on southern Mars has several of the seasonal dark streaks called "recurrent slope lineae," or RSL, that a November 2017 report interprets as granular flows, rather than darkening due to flowing water. This 2011 view near the top of the southern rim of Tivat Crater comes from the High Resolution Imaging Science Experiment (HiRISE) camera on NASA's Mars Reconnaissance Orbiter. North is toward the top and the slope descends toward the northwest. The view spans an area about 1,000 feet (300 meters) wide. Figure 1 includes a scale bar of 50 meters (164 feet). HiRISE began viewing Mars in 2006. Multiple observations of some sites resulted in discovery of RSL in 2011 and has confirmed many thousands of them at more than 50 sites, from equatorial to mid-latitude north and south. These narrow, dark features appear in warm seasons, gradually extend downslope, fade away in winter and reappear the next year. On Earth, only seeping water is known to have these behaviors. Hydrated salts have been identified at RSL sites and RSL have previously been considered possible evidence of liquid water seeping down the slopes and darkening the ground. The Nov. 20, 2017, report in Nature Geosciences uses analysis of the steepness of slopes where RSL appear, including these RSL at Tivat Crater. The RSL all end, downhill, at approximately the same slope, which is similar to the angle of repose for sand. That is, the flows do not extend to slopes shallower than where dry grains of sand or dust could slip downhill, as on the face of a dune. Seeping water should readily extend to shallower slopes. This image is an excerpt from HiRISE observation ESP_023184_1335, taken on July 8, 2011, during Martian mid-afternoon at this site, at latitude 45.9 degrees south and longitude 9.5 degrees east. Tivat Crater is about 2.2 miles (3.6 kilometers) in diameter, and was named in 2011 for a town in Montenegro. https://photojournal.jpl.nasa.gov/catalog/PIA22070
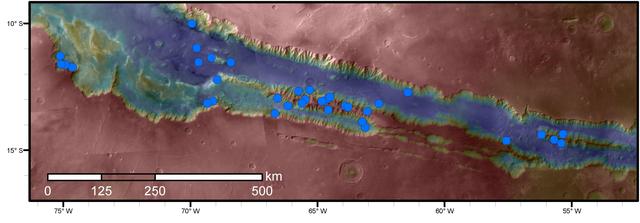
Blue dots on this map indicate sites of recurring slope lineae (RSL) in part of the Valles Marineris canyon network on Mars. RSL are seasonal dark streaks regarded as the strongest evidence for the possibility of liquid water on the surface of modern Mars. The area mapped here has the highest density of known RSL on the Red Planet. The RSL were identified by repeated observations of the sites using the High Resolution Imaging Science Experiment (HiRISE) camera on NASA's Mars Reconnaissance Orbiter. Map colors represent elevation, where red is high and blue is low. Valles Marineris is the largest canyon system in the solar system. The region shown here includes Melas Chasma and Coprates Chasma, in the central and eastern portions of Valles Marineris. The mapped area extends about 1,500 miles (2,400 kilometers) east to west and about 280 miles (450 kilometers) north to south, at latitudes from 9 to 17 degrees south of Mars' equator. The base map uses data from the Mars Orbiter Camera and Mars Orbiter Laser Altimeter of NASA's Mars Global Surveyor mission. RSL extend downslope during a warm season, fade in the colder part of the year, and repeat the process in a subsequent Martian year. A study of 41 RSL sites in this canyon area, published July 7, 2016, provides support for the notion that significant amounts of near-surface water can be found on modern Mars, though the work also indicates that puzzles remain unsolved in understanding how these seasonal features form. Each site includes anywhere from a few to more than 1,000 individual "lineae." http://photojournal.jpl.nasa.gov/catalog/PIA20756
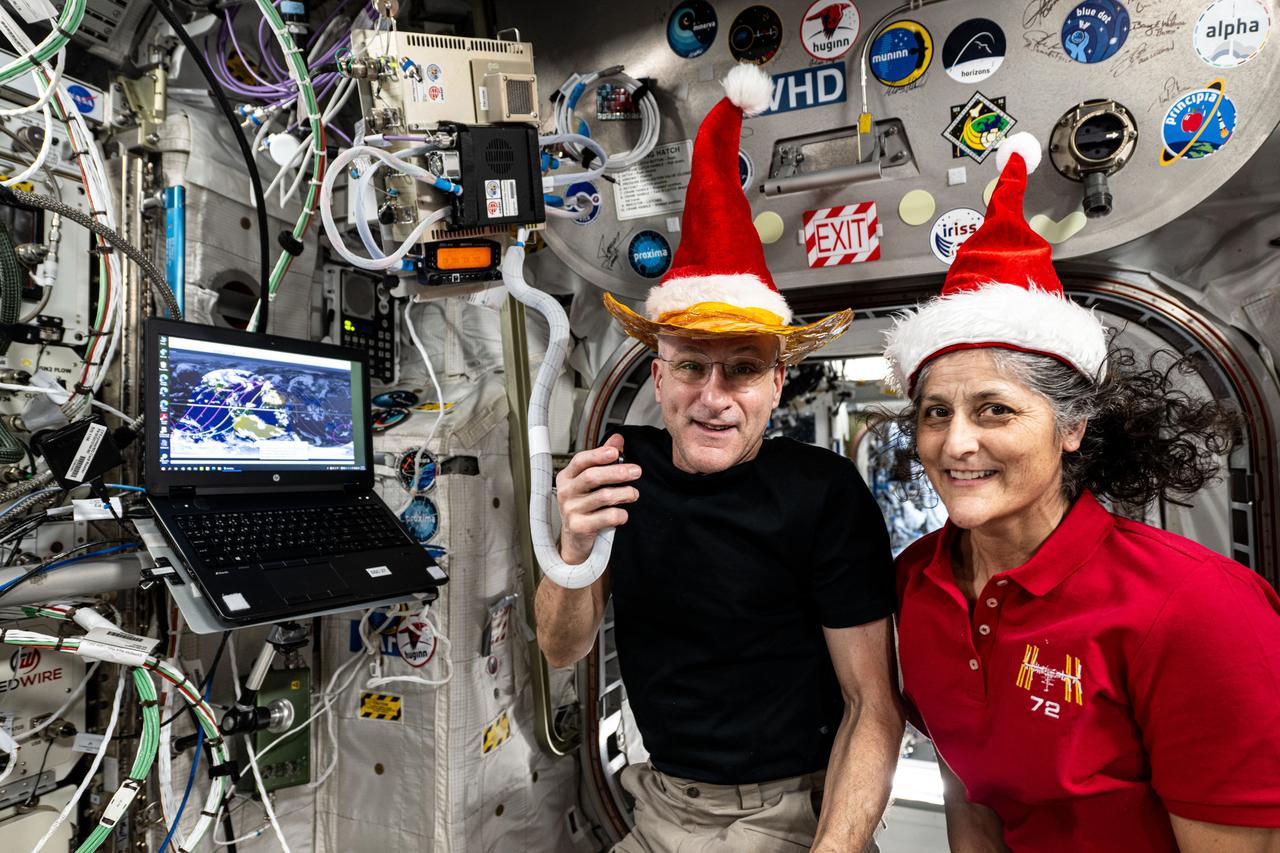
iss072e280684 (Nov. 24, 2024) --- NASA astronauts Don Pettit and Suni Williams, Expedition 72 flight engineer and commander respectively, pose for a fun holiday season portrait while speaking on a ham radio inside the International Space Station's Columbus laboratory module.
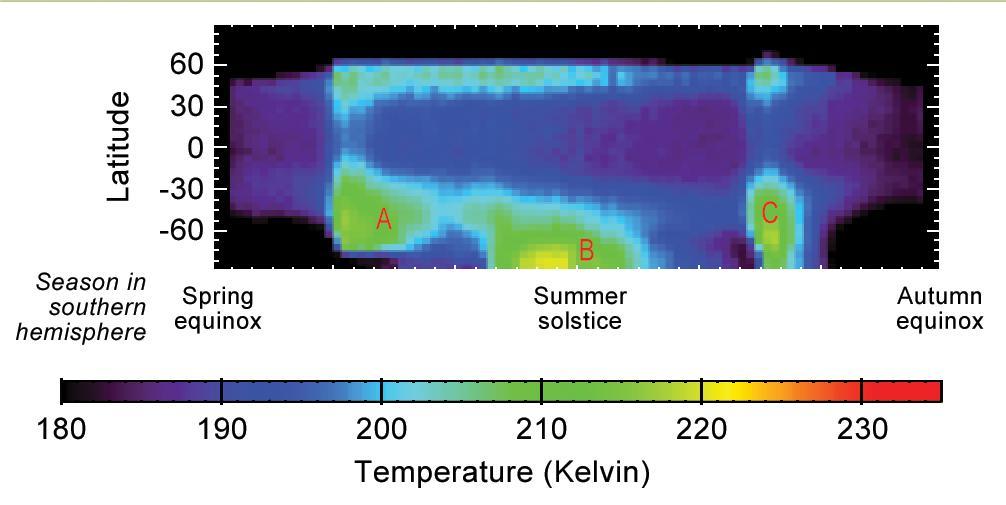
This graphic shows Martian atmospheric temperature data related to seasonal patterns in occurrence of large regional dust storms. The data shown here were collected by the Mars Climate Sounder instrument on NASA's Mars Reconnaissance Orbiter over the course of one-half of a Martian year, during 2012 and 2013. The color coding indicates daytime temperatures of a layer of the atmosphere centered about 16 miles (25 kilometers) above ground level, corresponding to the color-key bar at the bottom of the graphic. Three regional dust storms indicated by increased temperatures are labeled A, B and C. A similar sequence of three large regional dust storms has been seen in atmosphere-temperature data from five other Martian years. The vertical axis is latitude on Mars, from the north pole at the top to south pole at the bottom. Each graphed data point is an average for all Martian longitudes around the planet. The horizontal axis is the time of year, spanning from the beginning of Mars' southern-hemisphere spring (on the left) to the end of southern-hemisphere summer. This is the half of the year when large Martian dust storms are most active. http://photojournal.jpl.nasa.gov/catalog/PIA20746
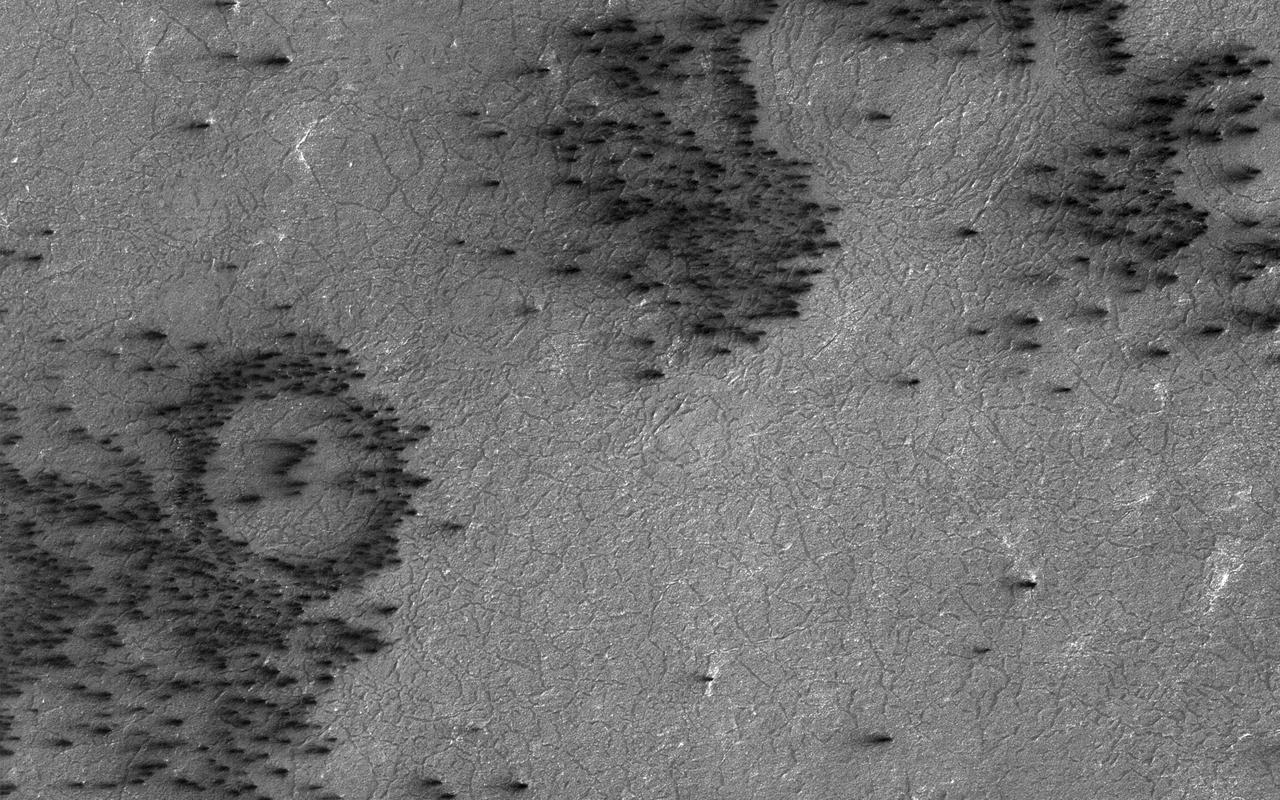
Gas under pressure will choose an easy escape route. In this image, the terrain is covered with a seasonal layer of dry ice. The weak spots, for gas sublimating from the bottom of the seasonal ice layer to escape, appear to be around craters, where the surface was broken and pulverized by an impact. Fans of surface material deposited on top of the seasonal ice layer show where the escape vents are. http://photojournal.jpl.nasa.gov/catalog/PIA21271
Southern spring on Mars brings sublimation of the seasonal dry ice polar cap. Gas trapped under the seasonal ice sheet carves channels on its way to escaping to the atmosphere. At this site, the channels are wider than we see elsewhere on Mars, perhaps meaning that the spider-like (or more scientifically, "araneiform") terrain here is older, or that the surface is more easily eroded. Seasonal fans of eroded surface material, pointed in two different directions, are deposited on the remaining ice. http://photojournal.jpl.nasa.gov/catalog/PIA13151
This frame from an animation simulates a fly-around look at one of the places on Mars where dark streaks advance down slopes during warm seasons, possibly involving liquid water. The streaks are roughly the length of a football field. The imaging and topographical information used in this false-color animation come from the High Resolution Imaging Science Experiment (HiRISE) camera on NASA's Mars Reconnaissance Orbiter. These dark features on the slopes are called "recurring slope lineae" or RSL. Planetary scientists using observations with the Compact Reconnaissance Imaging Spectrometer on the same orbiter detected hydrated salts on these slopes at Hale Crater, corroborating the hypothesis that the streaks are formed by briny liquid water. The image was produced by first creating a 3-D computer model (a digital terrain map) of the area based on stereo information from two HiRISE observations, and then draping a false-color image over the land-shape model. The vertical dimension is exaggerated by a factor of 1.5 compared to horizontal dimensions. http://photojournal.jpl.nasa.gov/catalog/PIA19919
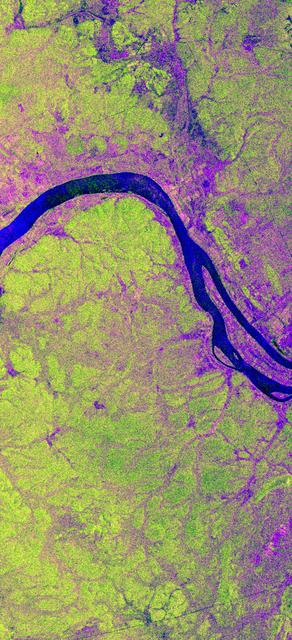
This is a comparison of images over Prince Albert, produced by NASA Spaceborne Imaging Radar-C and X-band Synthetic Aperture Radar aboard the space shuttle Endeavour on its 20th orbit on April 10, 1994. The area is centered at 53.91 degrees north latitude and 104.69 degrees west longitude and is located 40 kilometers (25 miles) north and 30 kilometers (18.5 miles) east of the town of Prince Albert in the Saskatchewan province of Canada. The image covers the area east of Candle Lake, between the gravel highway of 120 and west of highway 106. The area imaged is near the southern limit of the boreal forest. The boreal forest of North America is a continuous vegetation belt at high latitudes stretching across the continent from the Atlantic shoreline of central Labrador and then westward across Canada to the interior mountains and central coastal plains of Alaska. The forest is also part of a larger northern hemisphere circumpolar boreal forest belt. Coniferous trees dominate the entire forest but deciduous trees are also present. During the month of April, the forest experiences seasonal changes from a frozen condition to a thawed condition. The trees are completely frozen over the winter season and the forest floor is covered by snow. As the average temperature rises in the spring, the trees are thawed and the snow melts. This transition has an impact on the rate of moisture evaporation and release of carbon dioxide into the atmosphere. In late September and early October, the boreal forest experiences a relatively different seasonal change. At this time, the leaves on deciduous trees start changing color and dropping off. The soil and trees are quite often moist due to frequent rainfall and cloud cover. The evaporation of moisture and carbon dioxide into the atmosphere also diminishes at this time. SIR-C/X-SAR is sensitive to the moisture of soil and vegetation and can sense this freeze-thaw cycle and the summer-fall seasonal transition over forested areas in particular. Optical sensors, by contrast, are blind to these regions, which are perpetually obscured by thick cloud cover. These changes were detected by comparing the April and October color composite images of L-band data in red, C-band data in green and X-band (vertically received and transmitted) in blue. The changes in intensity of each color over lakes, various forest stands and clear cuts in the two images is striking. Lakes such as Lake Heiberg, Crabtree Lake and Williams Lake, in the right middle part of the image, are frozen in April (appearing in bright blue) and melted (appearing in black) in October. The higher intensity of blue over lakes in April is due to low penetration of the X-band (vertically received and transmitted) and the radar's high sensitivity to surface features. Forest stands also exhibit major changes between the two images. The red areas in the October image are old jack pine canopies that cause higher return at L-band because of their moist condition in late summer compared to their partially frozen condition in April (in purple). Similarly, in the areas near the middle of the image, where black spruce and mixed aspen and jack pine trees dominate, the contrast between blue in October and red and green in April is an indication that the top of the canopy (needles and branches) were frozen in April and moist in October. The changes due to deforestation by logging companies or natural fires can also be detected by comparing the images. For example, the small blue area near the intersection of Harding Road and Highway 120 is the result of logging which occurred after the April data was acquired. The surface area of clear cut is approximately 4 hectares, which is calculated from the high-resolution capability of the radar images and verified by scientists participating in field work during the mission. http://photojournal.jpl.nasa.gov/catalog/PIA01732

iss074e0002629 (Dec. 21, 2025) --- Four Expedition 74 astronauts pose for a festive portrait celebrating the holiday season aboard the International Space Station. Clockwise from bottom left are, station Commander Mike Fincke of NASA and Flight Engineers Zena Cardman of NASA, Kimiya Yui of JAXA (Japan Aerospace Exploration Agency), and Chris Williams of NASA.
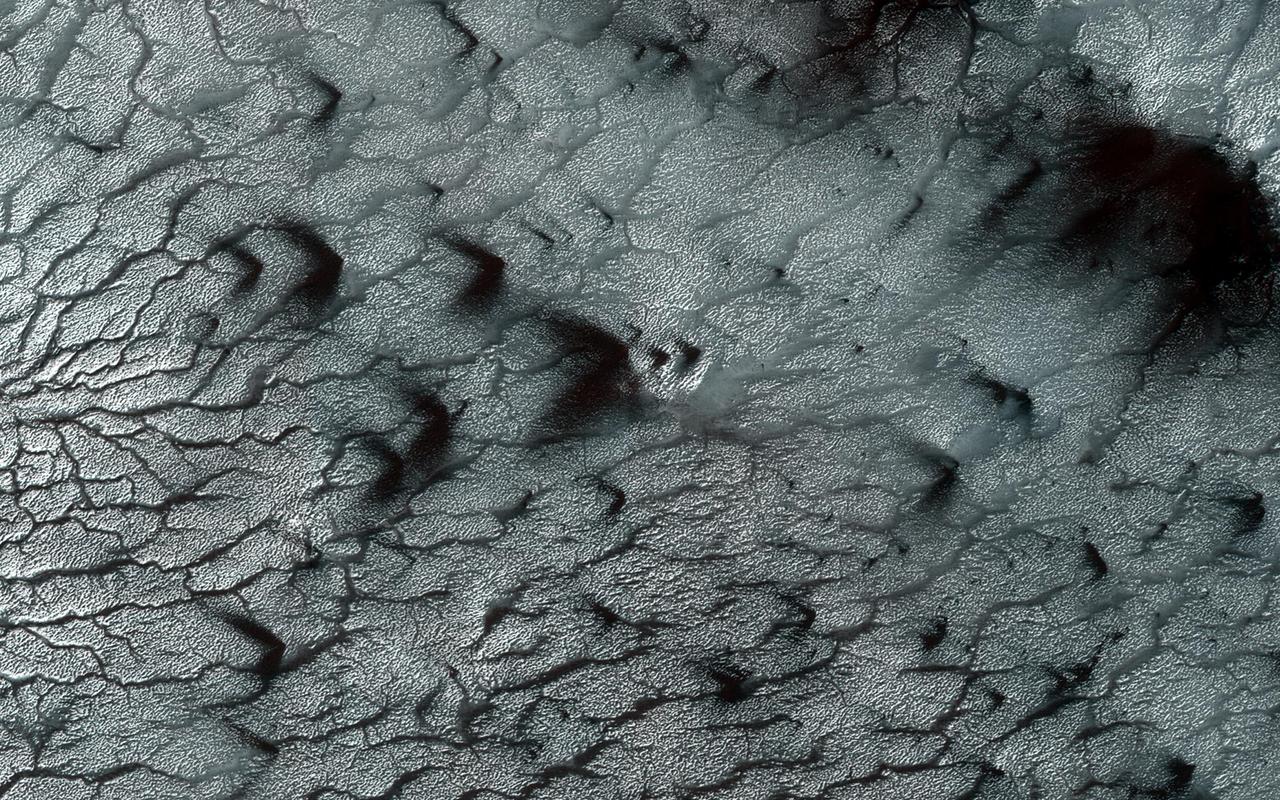
Some seasonal ice on Mars is transparent so that the sunlight penetrates to the bottom of the ice. Heat from this sunlight can turn the ice directly into a gas in a process called sublimation and this gas can scour channels in the loose dirt under the ice. Channels formed by sublimation of a layer of seasonal dry ice are so dense in this area that they look like lace. Gas flow erodes channels as it escapes to the surface of the overlying seasonal ice layer seeking the path of least resistance. http://photojournal.jpl.nasa.gov/catalog/PIA14451