This is a three dimensional perspective view of false-color image of the eastern part of the Big Island of Hawaii. It was produced using all three radar frequencies C-Band and L-Band. This view was constructed by overlaying a SIR-C radar image on a U.S. Geological Survey digital elevation map. The image was acquired on April 12, 1994 during the 52nd orbit of the Shuttle Endeavour by the Spaceborne Imaging Radar-C and X-Band Synthetic Aperture Radar (SIR-C/X-SAR). The area shown is approximately 34 by 57 kilomters with the top of the image pointing toward north-west. The image is centered at about 155.25 degrees west longitude and 19.5 degrees north latitude. Visible in the center of the image in blue are the summit crater (Kilauea Caidera) which contains the smaller Halemaumau Crater, and the line of collapsed craters below them that form the Chain of Craters Road. The rain forest appears bright in the image while green areas correspond to lower vegetation. The lava flows have different colors depending on their types and are easily recognizable due to their shapes. The flows at the top of the image originated from the Muana Loa volcano. The Jet Propulsion Laboratory alternative photo number is P-43932.
STS059-S-085 (18 April 1994) --- This is a three-dimensional perspective view of part of Isla Isabela in the western Galapagos Islands. It was taken by the L-Band radar in HH polarization from the Spaceborne Imaging Radar-C and X-Band Synthetic Aperture Radar (SIR-C/X-SAR) on the 40th orbit of the Space Shuttle Endeavour. This view was constructed by overlaying a SIR-C radar image on a U.S. Geological Survey digital elevation map. The image is centered at about .5 degrees south latitude and 91 degrees west longitude, and covers an area of 75 by 60 kilometers. The radar incidence angle at the center of the image is about 20 degrees. The western Galapagos Islands, which lie about 1200 kilometers west of Ecuador in the eastern Pacific, have six active volcanoes similar to the volcanoes found in Hawaii. Since the time of Charles Darwin's visit to the area in 1835, there have been over 60 recorded eruptions on these volcanoes. This SIR-C/X-SAR image of Alcedo and Sierra Negra volcanoes shows the rougher lava flows as bright features, while ash deposits and smooth pahoehoe lava flows appear dark. The Galapagos Islands are one of the SIR-C/X-SAR supersites and data of this area will be taken several times during the flight to allow scientists to conduct topographic change studies and to search for different lava flow types, ash deposits and fault lines. SIR-C/X-SAR is part of NASA's Mission to Planet Earth (MTPE). SIR-C/X-SAR radars illuminate Earth with microwaves allowing detailed observations at any time, regardless of weather or sunlight conditions. SIR-C/X-SAR uses three microwave wavelengths: L-Band (24 cm), C-Band (6 cm), and X-Band (3 cm). The multi-frequency data will be used by the international scientific community to better understand the global environment and how it is changing. The SIR-C/X-SAR data, complemented by aircraft and ground studies, will give scientists clearer insights into those environmental changes which are caused by nature and those changes which are induced by human activity. SIR-C was developed by NASA's Jet Propulsion Laboratory (JPL). X-SAR was developed by the Dornire and Alenia Spazio Companies for the German Space Agency, Deutsche Agentur fuer Raumfahrtangelegenheiten (DARA), and the Italian Space Agency, Agenzia Spaziale Italiana (ASI). JPL Photo ID: P-43938
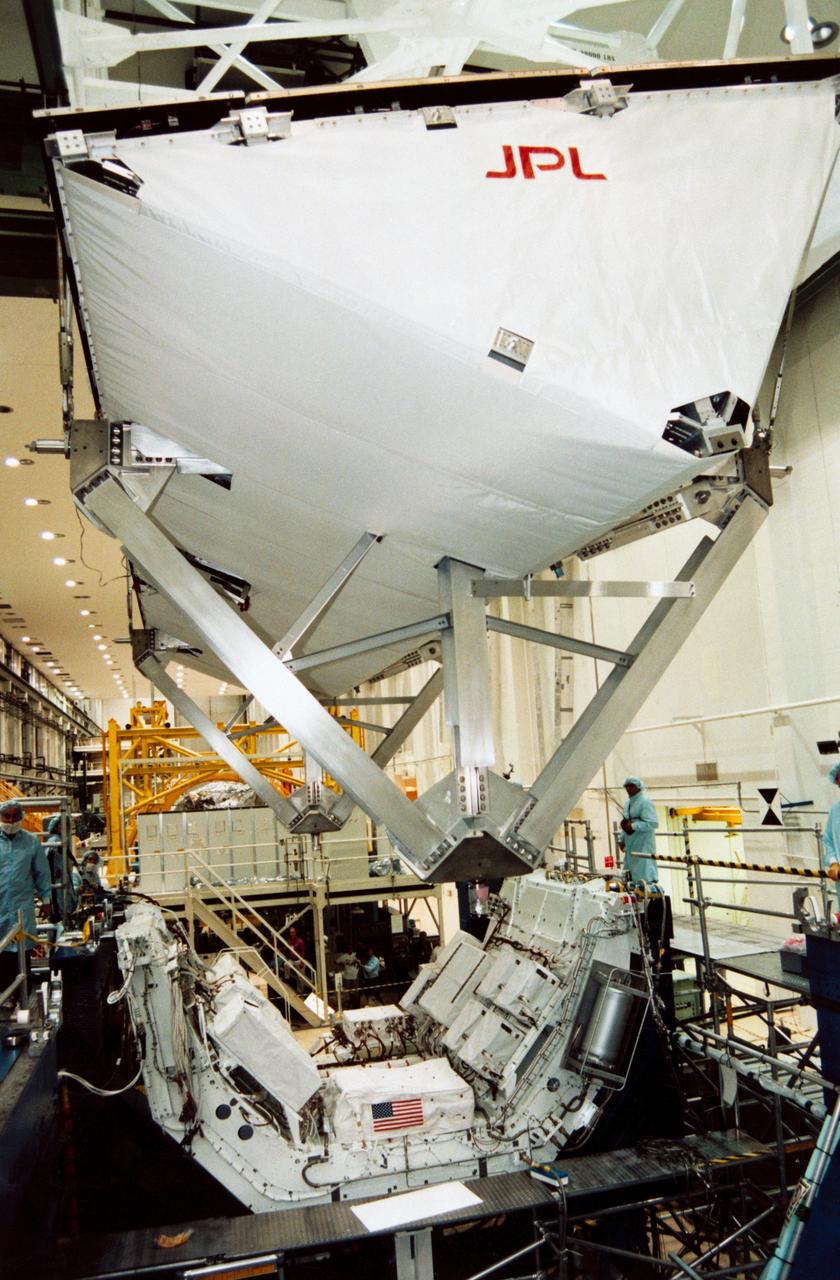
S94-30393 (23 Nov 1993) --- In the south level IV stand of the Operations and Checkout Building low bay, the Space Radar Laboratory -1 (SRL-1) antenna is being placed atop a pallet which holds the antenna electronics. SRL-1 is scheduled to fly on Space Shuttle mission STS-59 next year. It is comprised of two different imaging radars, the Spaceborne Imaging Radar-C (SIR-C) and the X-band Synthetic Aperture Radar (X-SAR). These radars are the most advanced of their kind to fly in space to date, and will allow scientists to make highly detailed studies of the Earth's surface on a global scale. An Interface Verification Test of the antenna and a Mission Sequence Test will be performed on the fully assembled SRL-1 later this month.
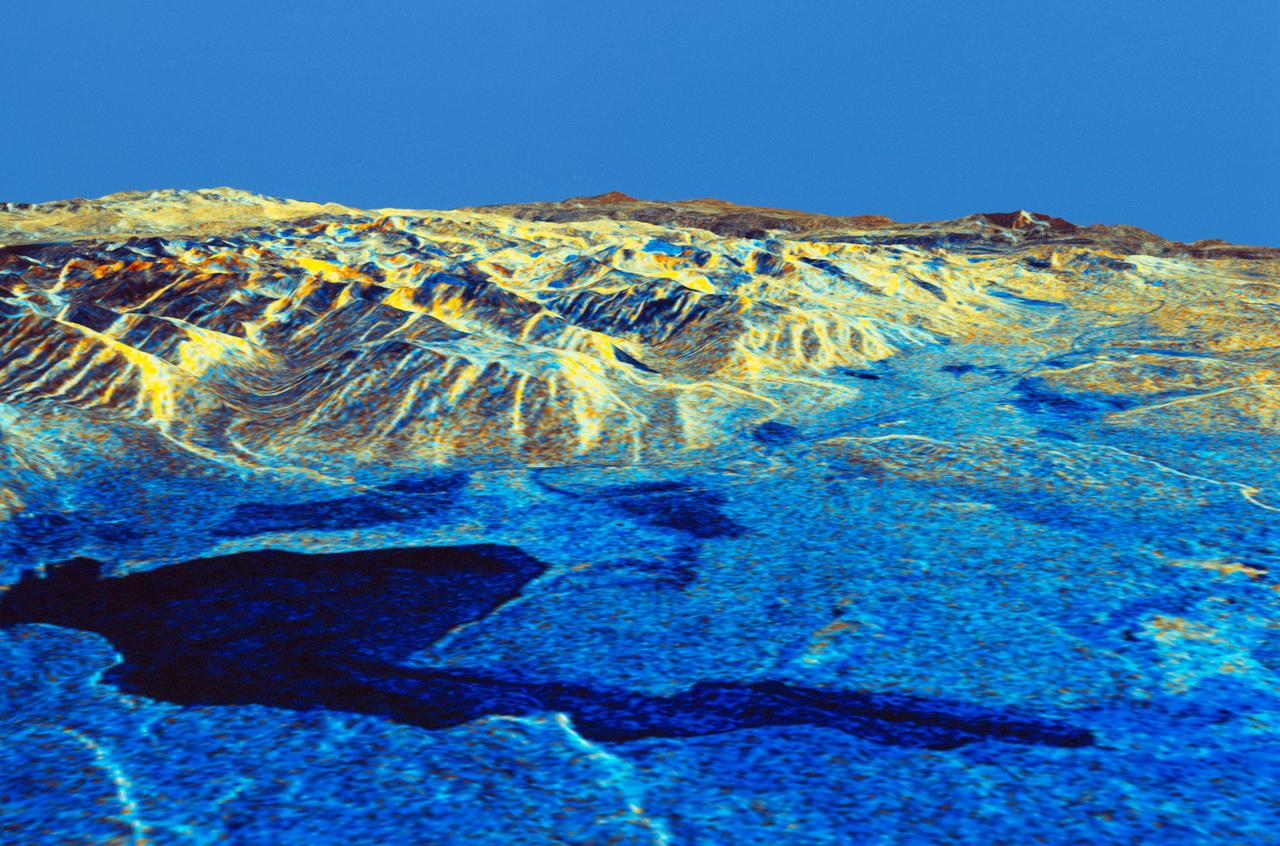
STS059-S-026 (11 April 1994) --- This is an image of Death Valley, California, centered at 36.629 degrees north latitude, 117.069 degrees west longitude. The image shows Furnace Creek alluvial fan and Furnace Creek Ranch at the far right, and the sand dunes near Stove Pipe Wells at the center. The dark fork-shaped feature between Furnace Creek fan and the dunes is a smooth flood-plain which encloses Cottonball Basin. The SIR-C/X-SAR supersite is an area of extensive field investigations and has been visited by both Space Radar Lab astronaut crews. Elevations in the Valley range from 70 meters below sea level, the lowest in the United States, to more than 3300 meters above sea level. Scientists are using SIR-C/X-SAR data from Death Valley to help answer a number of different questions about the Earth's geology. One question concerns how alluvial fans are formed and change through time under the influence of climatic changes and earthquakes. Alluvial fans are gravel deposits that wash down from the mountains over time. They are visible in the image as circular, fan-shaped bright areas extending into the darker valley floor from the mountains. Information about the alluvial fans help scientists study Earth's ancient climate. Scientists know the fans are bulit up through climatic and tectonic processes and they will use the SIR-C/X-SAR data to understand the nature and rates of weathering processes on the fans, soil formation, and the transport of sand and dust by the wind. SIR-C/X-SAR's sensitivity to centimeter-scale (or inch-scale) roughness provides detailed maps of surface texture. Such information can be used to study the occurrence and movement of dust storms and sand dunes. the goal of these studies is to gain a better understanding of the record of past climatic changes and the effects of those changes on a sensitive environment. This may lead to a better ability to predict future response of the land to different potential global cimate-change scenarios. Death Valley is also one of the primary calibration sites for SIR-C/X-SAR. The bright dots near the center of the image are corner reflectors that have been set-up to calibrate the radar as the Shuttle passes overhead. Thirty triangular-shaped reflectors (they look like aluminum pyramids) have been deployed by the calibration team from JPL over a 40 kilometer by 40 kilometer area in and around Death Valley. The calibration team will also deploy transponders (electronic reflectors) and recievers to measure the radar signals from SIR-C/X-SAR on the ground. Spaceborne Imaging Radar-C and X-Synthetic Aperture Radar (SIR-C/X-SAR) is part of NASA's Mission to Planet Earth (MTPE). The radars illuminate Earth with microwaves allowing detailed observations at any time, regardless of weather or sunlight conditions. SIR-C/X-SAR uses three microwave wavelengths: L-Band (24 cm), C-Band (6 cm), and X-Band (3 cm). The multi-frequency data will be used by the international scientific community to better understand the global environment and how it is changing. The SIR-C/X-SAR data, complemented by aircraft and ground studies, will give scientists clearer insights into those environmental changes which are caused by nature and those changes which are induced by human activity. SIR-C was develpoed by NASA's Jet Propulsion Laboratory (JPL). X-SAR was developed by the Dornire and Alenia Spazio Companies for the German Space Agency, Deutsche Agentur fuer Raumfahrtangelegenheiten (DARA), and the Italian Space Agency, Agenzia Spaziale Italiana (ASI). JPL Photo ID: P-43883
STS059-S-074 (15 April 1994) --- This color composite C-Band and L-Band image of the Kilauea volcano on the big island of Hawaii was acquired by the Spaceborne Imaging Radar-C and X-Band Synthetic Aperture Radar (SIR-C/X-SAR) flying on the Space Shuttle Endeavour. The city of Hilo can be seen at the top. The image shows the different types of lava flows around the crater Pu'u O'o. Ash deposits which erupted in 1790 from the summit of Kilauea volcano show up as dark in this image, and fine details associated with lava flows which erupted in 1919 and 1974 can be seen to the south of the summit in an area called the Ka'u Desert. In addition, the other historic lava flows created in 1881 and 1984 from Mauna Loa volcano (out of view to the left of this image) can easily be seen despite the fact that the surrounding area is covered by forest. Such information will be used to map the extent of such flows, which can pose a hazard to the subdivisions of Hilo. Highway 11 is the linear feature running from Hilo to the Kilauea volcano. The Kilauea volcano has been almost continuously active for more than the last 11 years. Field teams that were on the ground specifically to support these radar observations report that there was vigorous surface activity about 400 meters (one-quarter mile) inland from the coast. A moving lava flow about 200 meters (660 feet) in length was observed at the time of the Shuttle over flight, raising the possibility that subsequent images taken during this mission will show changes in the landscape. SIR-C/X-SAR is part of NASA's Mission to Planet Earth (MTPE). SIR-C/X-SAR radars illuminate Earth with microwaves allowing detailed observations at any time, regardless of weather or sunlight conditions. SIR-C/X-SAR uses three microwave wavelengths: L-Band (24 cm), C-Band (6 cm), and X-Band (3 cm). The multi-frequency data will be used by the international scientific community to better understand the global environment and how it is changing. The SIR-C/X-SAR data, complemented by aircraft and ground studies, will give scientists clearer insights into those environmental changes which are caused by nature and those changes which are induced by human activity. SIR-C was developed by NASA's Jet Propulsion Laboratory (JPL). X-SAR was developed by the Dornire and Alenia Spazio Companies for the German Space Agency, Deutsche Agentur fuer Raumfahrtangelegenheiten (DARA), and the Italian Space Agency, Agenzia Spaziale Italiana (ASI). JPL Photo ID: P-43918
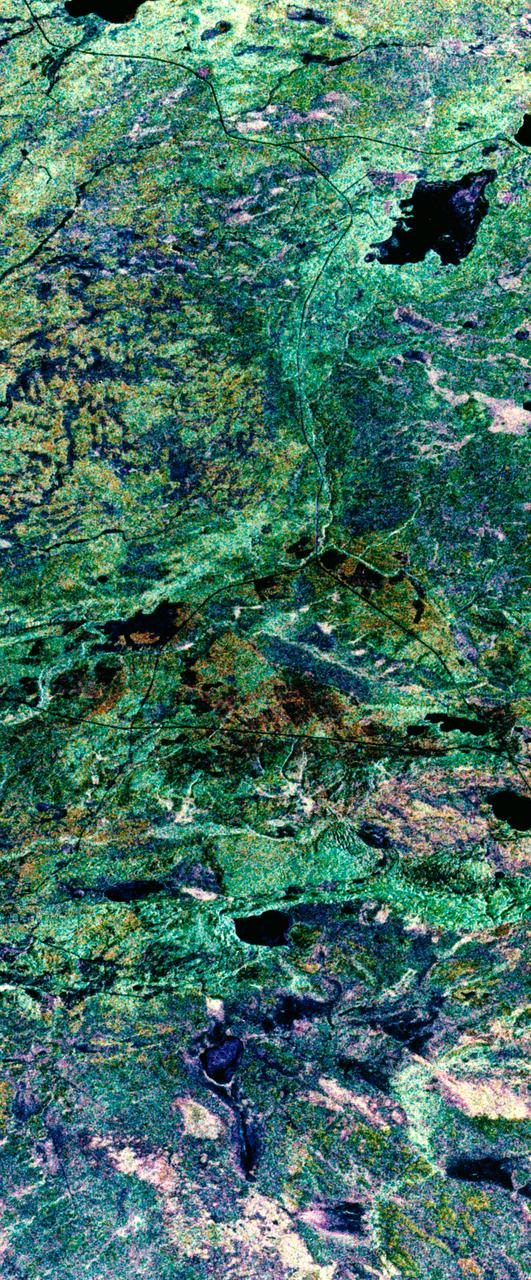
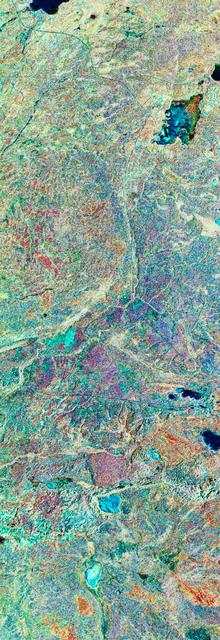
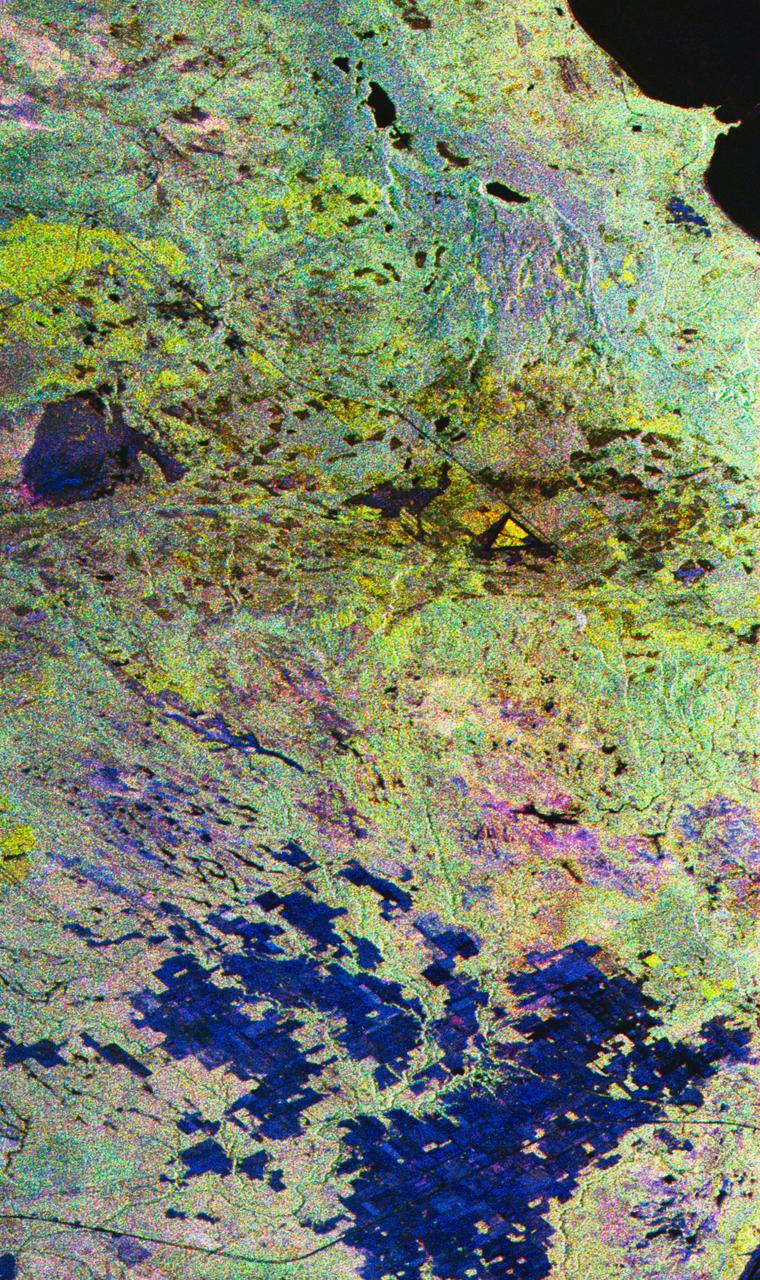
STS059-S-039 (11 April 1994) --- This is a false-color composite of Prince Albert, Canada, centered at 53.91 north latitude and 104.69 west longitude. This image was acquired by the Spaceborne Imaging Radar-C and X-Band Synthetic Aperture Radar (SIR-C/X-SAR) aboard the Space Shuttle Endeavour on its 20th orbit. The area is located 40 kilometers (25 miles) north and 30 kilometers (20 miles) east of the town of Prince Albert in the Saskatchewan province of Canada. The image covers the area east of the Candle Lake, between gravel surface Highways 120 and 106 and west of 106. The area in the middle of the image covers the entire Nipawin (Narrow Hills) provincial park. The look angle of the radar is 30 degrees and the size of the image is approximately 20 kilometers by 50 kilometers (12 by 30 miles). The image was produced by using only the L-Band. The three polarization channels HH, HV and VV are illustrated by red, green and blue respectively. The changes in the intensity of each color are related to various surface conditions such as variations in forest stands, frozen or thawed condition of the surface, disturbances (fire and deforestation), and areas of re-growth. Most of the dark areas in the image are the ice-covered lakes in the region. The dark area on the top right corner of the image is the White Gull Lake north of the intersection of Highway 120 and 913. The right middle part of the image shows Lake Ispuchaw and Lower Fishing Lake. The deforested areas are also shown by dark areas in the image. Since most of the logging practice at the Prince Albert area is around the major highways, the deforested areas can be easily detected as small geometrically shaped dark regions along the roads. At the time of the SIR-C/X-SAR overpass, a major part of the forest is either frozen or undergoing the spring thaw. The L-Band HH shows a high return in the jack pine forest. The reddish areas in the image are old jack pine forest, 12-17 meters (40-55 feet) in height and 60-75 years old. The orange-greenish areas are young jack pine trees, 3-5 meters (10-16 feet) in height and 11-16 years old. The green areas are due to the relative high intensity of the HV channel which is strongly correlated with the amount of biomass. L-Band HV channel shows the biomass variations over the entire region. Most of the green areas, when compared to the forest cover maps are identified as black spruce trees. The dark blue and dark purple colors show recently harvested or re-growth areas respectively. SIR-C/X-SAR is part of NASA's Mission to Planet Earth (MTPE). SIR-C/X-SAR radars illuminate Earth with microwaves allowing detailed observations at any time, regardless of weather or sunlight conditions. SIR-C/X-SAR uses three microwave wavelengths: L-Band (24 cm), C-Band (6 cm), and X-Band (3 cm). The multi-frequency data will be used by the international scientific community to better understand the global environment and how it is changing. The SIR-C/X-SAR data, complemented by aircraft and ground studies, will give scientists clearer insights into those environmental changes which are caused by nature and those changes which are induced by human activity. SIR-C was developed by NASA's Jet Propulsion Laboratory (JPL). X-SAR was developed by the Dornire and Alenia Spazio Companies for the German Space Agency, Deutsche Agentur fuer Raumfahrtangelegenheiten (DARA), and the Italian Space Agency, Agenzia Spaziale Italiana (ASI). JPL Photo ID: P-43886
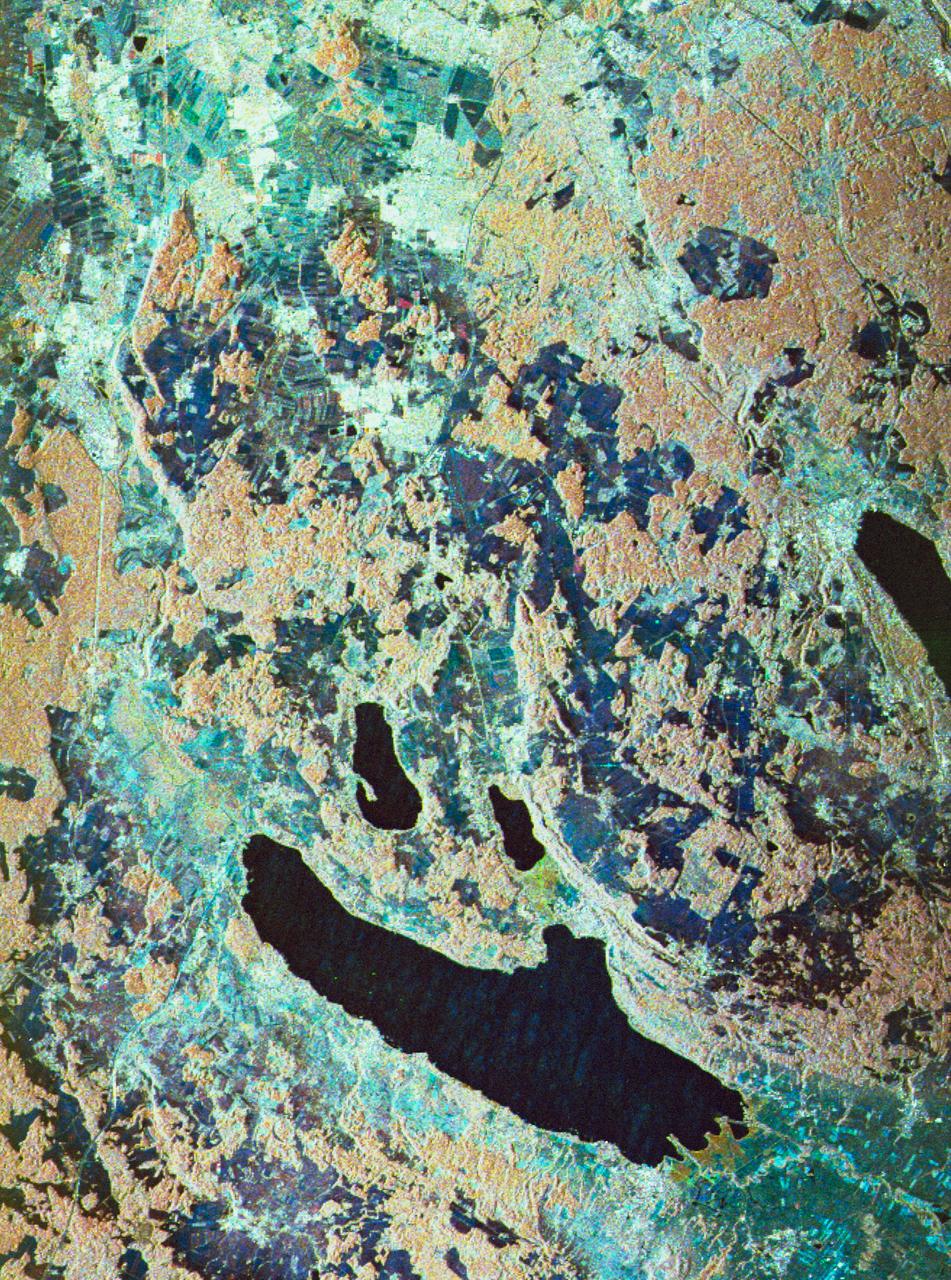
STS059-S-080 (18 April 1994) --- This is a false-color three frequency image of the Oberpfaffenhofen supersite, an area just south-west of Munich in southern Germany. The colors show the different conditions that the three radars (X-Band, C-Band and L-Band) can see on the ground. The image covers a 27 by 36 kilometer area. The center of the site is 48.09 degrees north and 11.29 degrees east. The image was acquired by the Spaceborne Imaging Radar-C and X-Band Synthetic Aperture Radar (SIR-C/X-SAR) onboard the Space Shuttle Endeavour on April 11, 1994. The dark area on the left is Lake Ammersee. The two smaller lakes are the Woerthsee and the Pilsensee. On the bottom is the tip of the Starnbergersee. The city of Munich is located just beyond the right of the image. The Oberpfaffenhofen supersite is the major test site for SIR-C/X-SAR calibration and scientific investigations concerning agriculture, forestry, hydrology and geology. This color composite image is a three frequency overlay. L-Band total power was assigned red, the C-Band total power is shown in green and the X-Band VV polarization appears blue. The colors on the image stress the differences between the L-Band, C-Band, X-Band images. If the three radar antennas were getting an equal response from objects on the ground, this image would appear in black and white. However, in this image, the blue areas corresponds to area for which the X-Band backscatter is relatively higher than the backscatter at L and C-Bands. This behavior is characteristic of grasslands, clear cuts and shorter vegetation. Similarly, the forested areas have a reddish tint (L-Band). The green areas seen near both the Ammersee and the Pilsensee lakes indicate marshy areas. The agricultural fields in the upper right hand corner appear mostly in blue and green (X-Band and C-Band). The white areas are mostly urban areas, while the smooth surfaces of the lakes appear very dark. SIR-C/X-SAR is part of NASA's Mission to Planet Earth (MTPE). SIR-C/X-SAR radars illuminate Earth with microwaves allowing detailed observations at any time, regardless of weather or sunlight conditions. SIR-C/X-SAR uses three microwave wavelengths: L-Band (24 cm), C-Band (6 cm), and X-Band (3 cm). The multi-frequency data will be used by the international scientific community to better understand the global environment and how it is changing. The SIR-C/X-SAR data, complemented by aircraft and ground studies, will give scientists clearer insights into those environmental changes which are caused by nature and those changes which are induced by human activity. SIR-C was developed by NASA's Jet Propulsion Laboratory (JPL). X-SAR was developed by the Dornire and Alenia Spazio Companies for the German Space Agency, Deutsche Agentur fuer Raumfahrtangelegenheiten (DARA), and the Italian Space Agency, Agenzia Spaziale Italiana (ASI). JPL Photo ID: P-43930
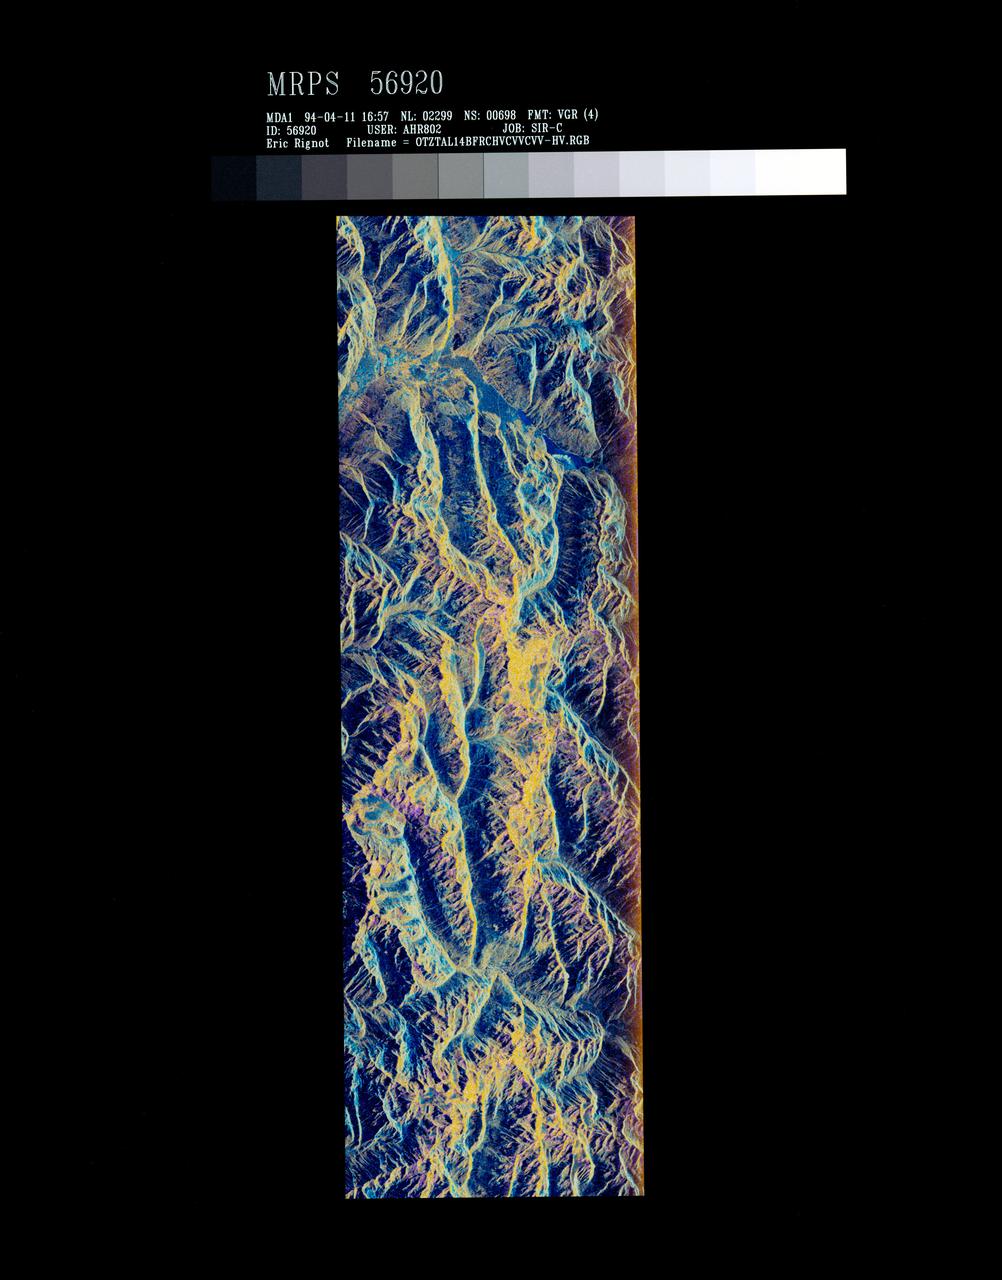
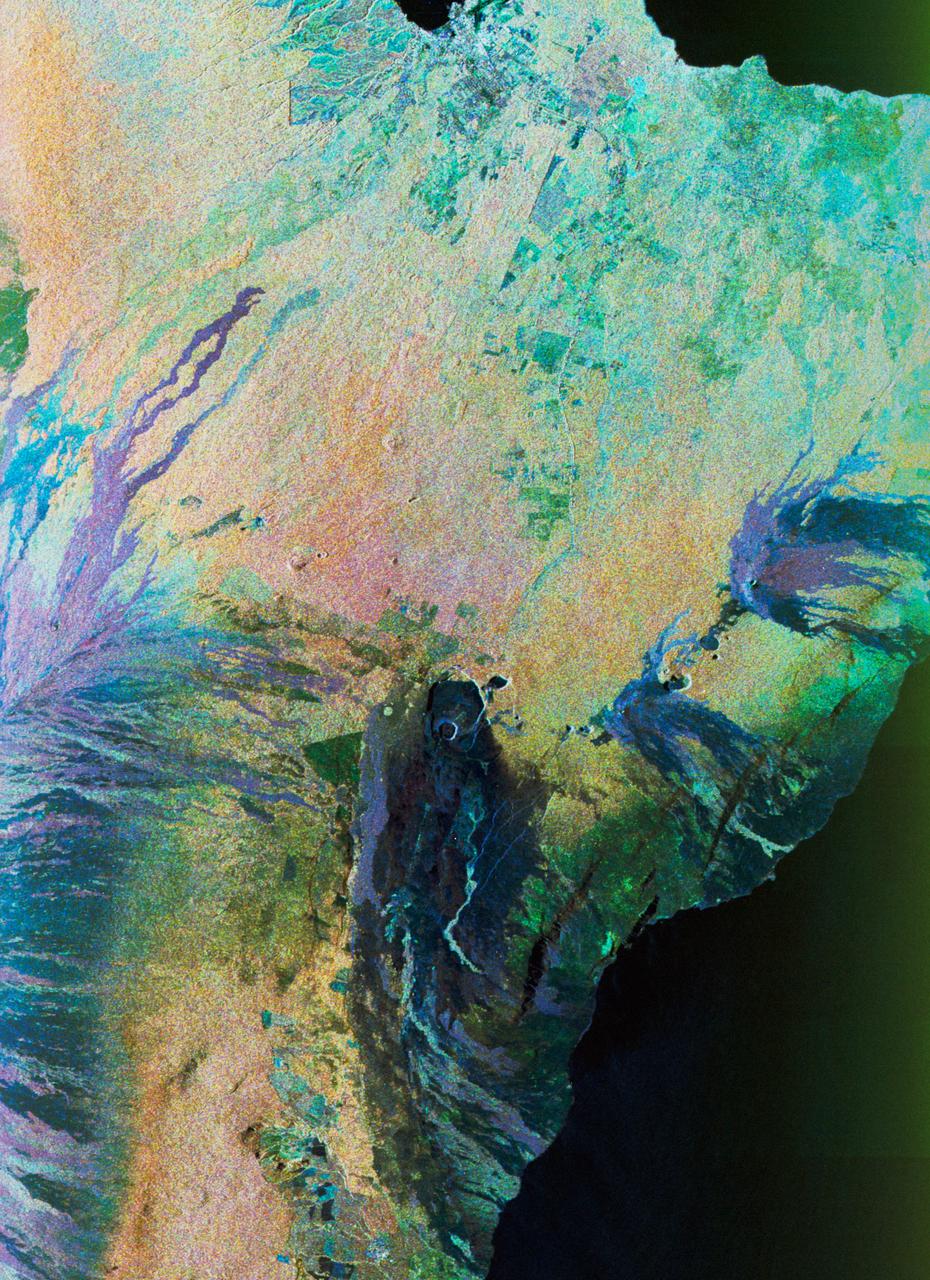
STS059-S-072 (13 April 1994) --- This image is a false-color composite of Oetztal, Austria located in the Central Alps, centered at 46.8 degrees north latitude, and 10.70 degrees east longitude, at the border between Switzerland (top), Italy (left) and Austria (right and bottom). The area shown is 50 kilometers (30 miles) south of Innsbruck, Austria. This image was acquired by the Spaceborne Imaging Radar-C and X-Band Synthetic Aperture Radar (SIR-C/X-SAR) aboard the Space Shuttle Endeavour on its 14th orbit. Oetztal is a SIR-C/X-SAR hydrology supersite. Approximately one quarter of this image is covered by glaciers, the largest of which, Gepatschferner, is visible as a triangular yellow patch in the center of the scene. The summits of the main peaks reach elevations between 3,500 and 3,768 meters (11,500 and 12,362 feet) above sea level. The tongues of the glaciers are descending from elevated plateaus down into narrow valleys which were formed during the last ice age. This color image was produced in C-Band using multi-polarization information (Red=CHV, Green=CVV, Blue=CVV/CHV). The blue areas are lakes (Gepatsch Dam at center right; Lake Muta at top right) and glacier ice. The yellow areas are slopes facing the radar and areas of dry snow. Purple corresponds to slopes facing away from the radar. Yellow in the valley bottom corresponds to tree covered areas. There is 30 to 50 centimeters (12 to 20 inches) of dry, fresh snow on the glaciers, and about 10 centimeters (4 inches) in the valley at the city of Vent, Austria (center). At these data were taken, the weather was cold, with snow and thick fog. The entire area would appear white to an optical sensor because it is all covered under a winter snowpack. Researchers are interested in Oetztal because knowing how glaciers shrink and grow over time is an important indication of climatic change. SIR-C/X-SAR is part of NASA's Mission to Planet Earth (MTPE). SIR-C/X-SAR radars illuminate Earth with microwaves allowing detailed observations at any time, regardless of weather or sunlight conditions. SIR-C/X-SAR uses three microwave wavelengths: L-Band (24 cm), C-Band (6 cm), and X-Band (3 cm). The multi-frequency data will be used by the international scientific community to better understand the global environment and how it is changing. The SIR-C/X-SAR data, complemented by aircraft and ground studies, will give scientists clearer insights into those environmental changes which are caused by nature and those changes which are induced by human activity. SIR-C was developed by NASA's Jet Propulsion Laboratory (JPL). X-SAR was developed by the Dornire and Alenia Spazio Companies for the German Space Agency, Deutsche Agentur fuer Raumfahrtangelegenheiten (DARA), and the Italian Space Agency, Agenzia Spaziale Italiana (ASI). JPL Photo ID: P-43890
STS059-S-079 (18 April 1994) --- This is a false-color, three frequency image of Prince Albert, Canada, centered at 53.91 north latitude and 104.69 west longitude. It was produced using data from the X-Band, C-Band and L-Band radars that comprise the Spaceborne Imaging Radar-C and X-Band Synthetic Aperture Radar (SIR-C/X-SAR). SIR-C/X-SAR acquired this image on the 20th orbit of the Space Shuttle Endeavour. The area is located 40 kilometers north and 30 kilometers east of the town of Prince Albert in the Saskatchewan province of Canada. The image covers the area east of the Candle Lake, between gravel surface Highways 120 and 106 and west of 106. The area in the middle of the image covers the entire Nipawin (Narrow Hills) provincial park. The look angle of the radar is 30 degrees and the size of the image is approximately 20 by 50 kilometers. The red, green, and blue colors represent L-Band total power, C-Band total power, and XVV respectively. The changes in the intensity of each color are related to various surface conditions such as frozen or thawed forest, fire, deforestation and areas of regrowth. Most of the dark blue areas in the image are the ice covered lakes. The dark area on the top right corner of the image is the White Gull Lake north of the intersection of Highway 120 and 913. The right middle part of the image shows Lake Ispuchaw and Lower Fishing Lake. The deforested areas are shown by light blue in the image. Since most of the logging practice at the Prince Albert area is around the major highways, the deforested areas can be easily detected as small geometrically shaped dark regions along the roads. At the time these data were taken, a major part of the forest was either frozen or undergoing the spring thaw. In such conditions, due to low volume of water in the vegetation, a deeper layer of the canopy is imaged by the radar, revealing valuable information about the type of trees, the amount of vegetation biomass and the condition of the surface. As the frequency increases, the penetration depth in the canopy decreases. Over forest canopies, the X-Band radar contains information about the top of the canopy. Whereas, C-Band and L-Band radar returns show contributions from the crown and trunk areas respectively. The bright areas in the image are dense mixed aspen and old jackpine forests where the return from all three bands is high. The reddish area corresponds to more sparse old jack pine (12 to 17 meters in height and 60 to 75 years old) where the L-Band signal penetrates deeper in the canopy and dominates C-Band and X-Band returns. Comparison of the image with the forest cover map of the area indicates that the three band radar can be used to classify various stands. SIR-C/X-SAR is part of NASA's Mission to Planet Earth (MTPE). SIR-C/X-SAR radars illuminate Earth with microwaves allowing detailed observations at any time, regardless of weather or sunlight conditions. SIR-C/X-SAR uses three microwave wavelengths: L-Band (24 cm), C-Band (6 cm), and X-Band (3 cm). The multi-frequency data will be used by the international scientific community to better understand the global environment and how it is changing. The SIR-C/X-SAR data, complemented by aircraft and ground studies, will give scientists clearer insights into those environmental changes which are caused by nature and those changes which are induced by human activity. SIR-C was developed by NASA's Jet Propulsion Laboratory (JPL). X-SAR was developed by the Dornire and Alenia Spazio Companies for the German Space Agency, Deutsche Agentur fuer Raumfahrtangelegenheiten (DARA), and the Italian Space Agency, Agenzia Spaziale Italiana (ASI). JPL Photo ID: P-43929
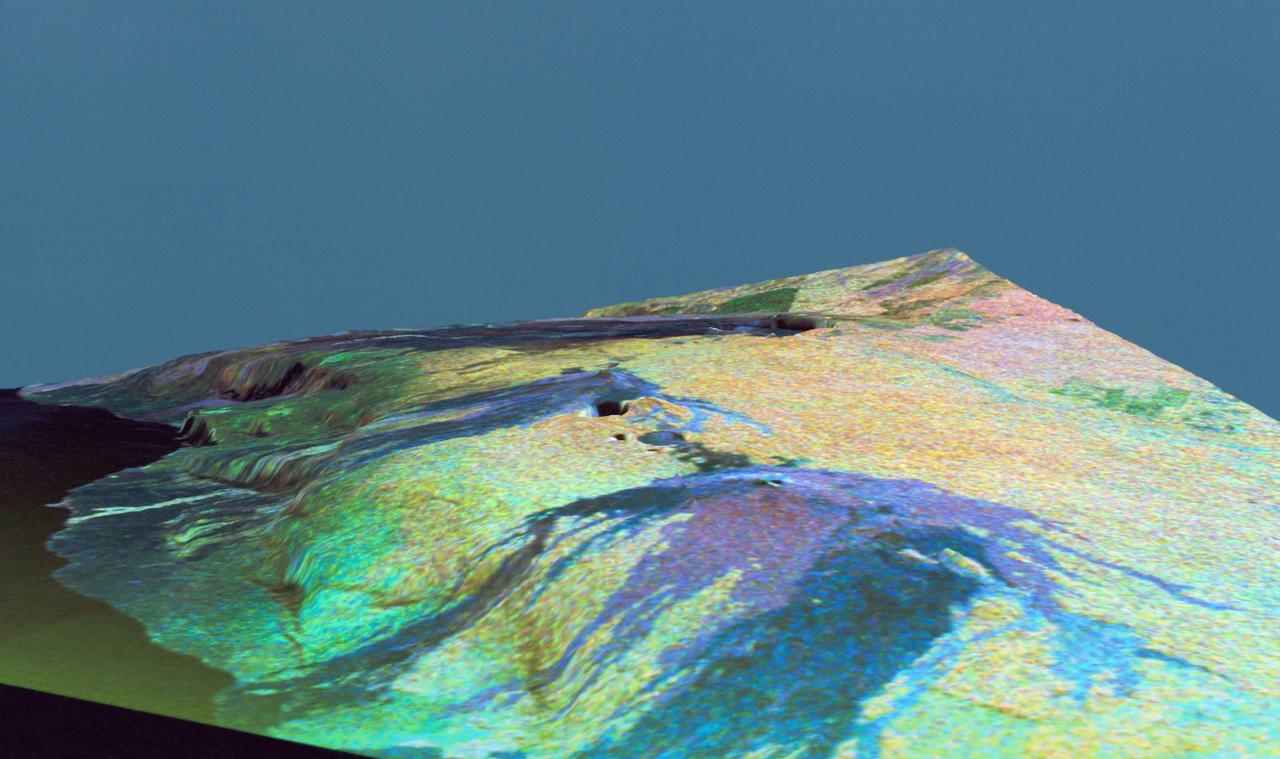
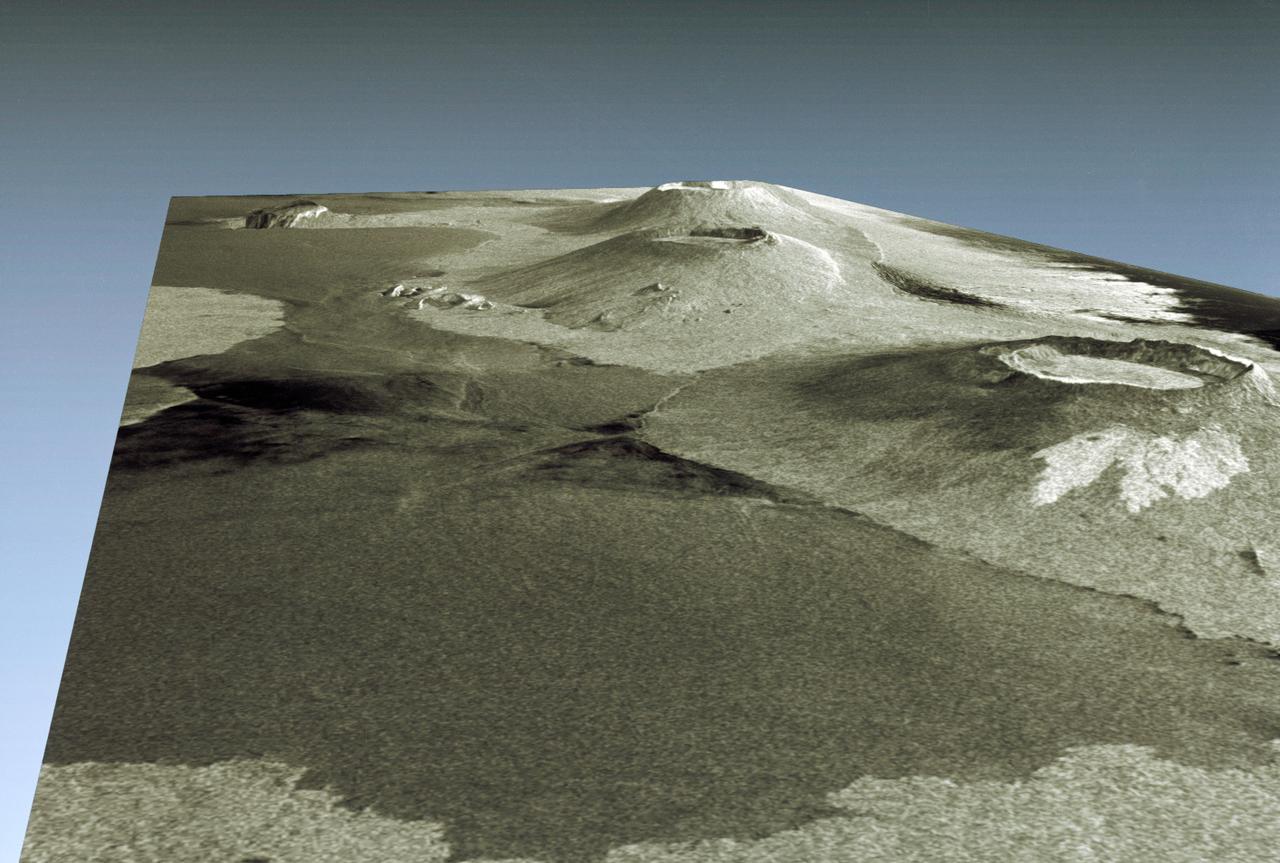
STS059-S-084 (17 April 1994) --- This is a three-dimensional perspective of Mammoth Mountain, California. This view was constructed by overlaying a SIR-C radar image on a U.S. Geological Survey digital elevation map. Vertical exaggeration is 2x. The image is centered at 37.6 degrees north, 119.0 degrees west. It was acquired from the Spaceborne Imaging Radar-C and X-Band Synthetic Aperture Radar (SIR-C/X-SAR) onboard the Space Shuttle Endeavour on its 67th orbit, April 13, 1994. In this color representation, red is C-Band HV-polarization, green is C-Band VV-polarization and blue is the ratio of C-Band VV to C-Band HV. Blue areas are smooth and yellow areas are rock outcrops with varying amounts of snow and vegetation. Crowley Lake is in the foreground and Highway 395 crosses in the middle of the image. Mammoth Mountain is shown in the upper right. SIR-C/X-SAR is part of NASA's Mission to Planet Earth (MTPE). SIR-C/X-SAR radars illuminate Earth with microwaves allowing detailed observations at any time, regardless of weather or sunlight conditions. SIR-C/X-SAR uses three microwave wavelengths: L-Band (24 cm), C-Band (6 cm), and X-Band (3 cm). The multi-frequency data will be used by the international scientific community to better understand the global environment and how it is changing. The SIR-C/X-SAR data, complemented by aircraft and ground studies, will give scientists clearer insights into those environmental changes which are caused by nature and those changes which are induced by human activity. SIR-C was developed by NASA's Jet Propulsion Laboratory (JPL). X-SAR was developed by the Dornire and Alenia Spazio Companies for the German Space Agency, Deutsche Agentur fuer Raumfahrtangelegenheiten (DARA), and the Italian Space Agency, Agenzia Spaziale Italiana (ASI). JPL Photo ID: P-43933
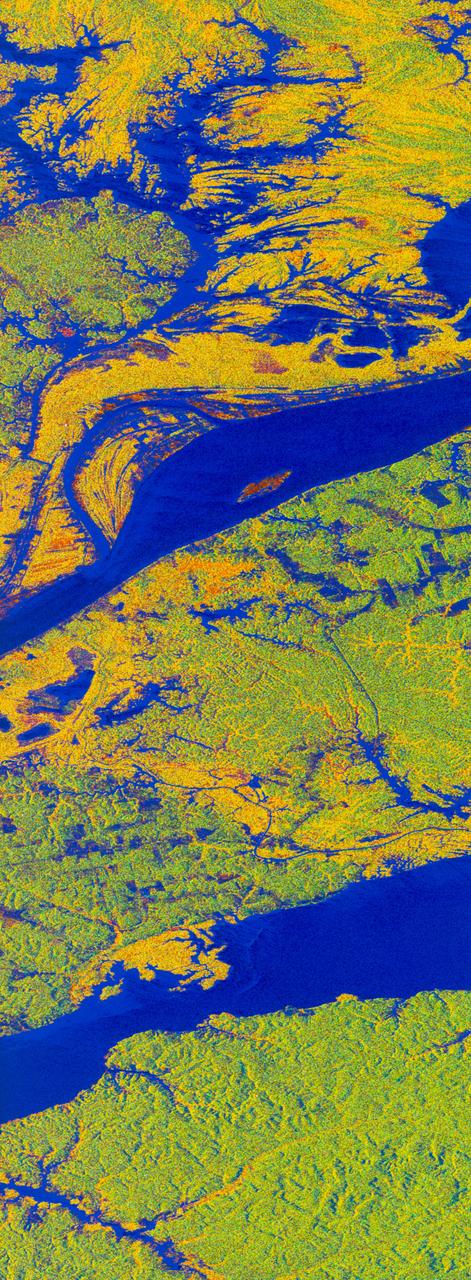
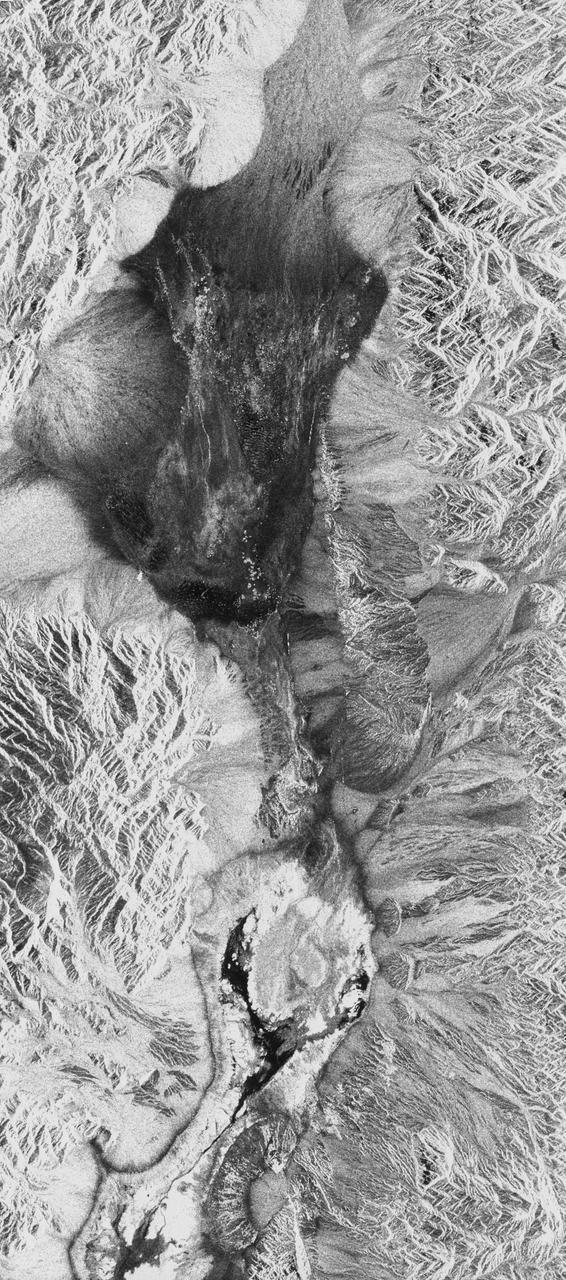
STS059-S-068 (13 April 1994) --- This false-color L-Band image of the Manaus region of Brazil was acquired by the Spaceborne Imaging Radar-C and X-Band Synthetic Aperture Radar (SIR-C/X-SAR) aboard the Space Shuttle Endeavour on orbit 46 of the mission. The area shown is approximately 8 kilometers by 40 kilometers (5 by 25 miles). At the top of the image are the Solimoes and Rio Negro Rivers just before they combine at Manaus to form the Amazon River. The image is centered at about 3 degrees south latitude, and 61 degrees west longitude. The false colors are created by displaying three L-Band polarization channels; red areas correspond to high backscatter at HH polarization, while green areas exhibit high backscatter at HV polarization. Blue areas show low returns at VV polarization; hence the bright blue colors of the smooth river surfaces. Using this color scheme, green areas in the image are heavily forested, while blue areas are either cleared forest or open water. The yellow and red areas are flooded forest. Between Rio Solimoes and Rio Negro a road can be seen running from some cleared areas (visible as blue rectangles north of Rio Solimoes) north towards a tributary of Rio Negro. SIR-C/X-SAR is part of NASA's Mission to Planet Earth (MTPE). SIR-C/X-SAR radars illuminate Earth with microwaves allowing detailed observations at any time, regardless of weather or sunlight conditions. SIR-C/X-SAR uses three microwave wavelengths: L-Band (24 cm), C-Band (6 cm), and X-Band (3 cm). The multi-frequency data will be used by the international scientific community to better understand the global environment and how it is changing. The SIR-C/X-SAR data, complemented by aircraft and ground studies, will give scientists clearer insights into those environmental changes which are caused by nature and those changes which are induced by human activity. SIR-C was developed by NASA's Jet Propulsion Laboratory (JPL). X-SAR was developed by the Dornire and Alenia Spazio Companies for the German Space Agency, Deutsche Agentur fuer Raumfahrtangelegenheiten (DARA), and the Italian Space Agency, Agenzia Spaziale Italiana (ASI). JPL Photo ID: P-43895
STS059-S-027 (10 April 1994) --- This image is a false-color composite of Raco, Michigan, centered at 46.39 degrees north latitude, 84.88 degrees east longitude. This image was acquired by the Spaceborne Imaging Radar-C and X-Band Synthetic Aperture Radar (SIR-C/X-SAR) aboard the Space Shuttle Endeavour on its 6th orbit and during the first full-capacity test of the instrument. This image was produced using both L-Band and C-Band data. The area shown is approximately 20 kilometers by 50 kilometers. Raco is located at the eastern end of Michigan's upper peninsula, west of Sault Ste. Marie and south of Whitefish Bay on Lake Superior. The site is located at the boundary between the boreal forests and the northern temperate forests, a transitional zone that is expected to be ecologically sensitive to anticipated global changes resulting from climatic warming. On any given day, there is a 60 percent chance that this area will be obscured to some extent by cloud cover which makes it difficult to image using optical sensors. In this color representation (Red=LHH, Green=LHV, Blue=CHH), darker areas in the image are smooth surfaces such as frozen lakes and other non-forested areas. The colors are related to the types of trees and the brightness is related to the amount of plant material covering the surface, called forest biomass. Accurate information about land-cover is important to area resource managers and for use in regional- to global-scale scientific models used to understand global change. SIR-C/X-SAR radars illuminate Earth with microwaves allowing detailed observations at any time, regardless of weather or sunlight conditions. SIR-C/X-SAR uses three microwave wavelengths: L-Band (24 cm), C-Band (6 cm), and X-Band (3 cm). The multi-frequency data will be used by the international scientific community to better understand the global environment and how it is changing. The SIR-C/X-SAR data, complemented by aircraft and ground studies, will give scientists clearer insights into those environmental changes which are caused by nature and those changes which are induced by human activity. SIR-C was developed by NASA's Jet Propulsion Laboratory (JPL). X-SAR was developed by the Dornire and Alenia Spazio Companies for the German Space Agency, Deutsche Agentur fuer Raumfahrtangelegenheiten (DARA), and the Italian Space Agency, Agenzia Spaziale Italiana (ASI). JPL Photo ID: P-43882
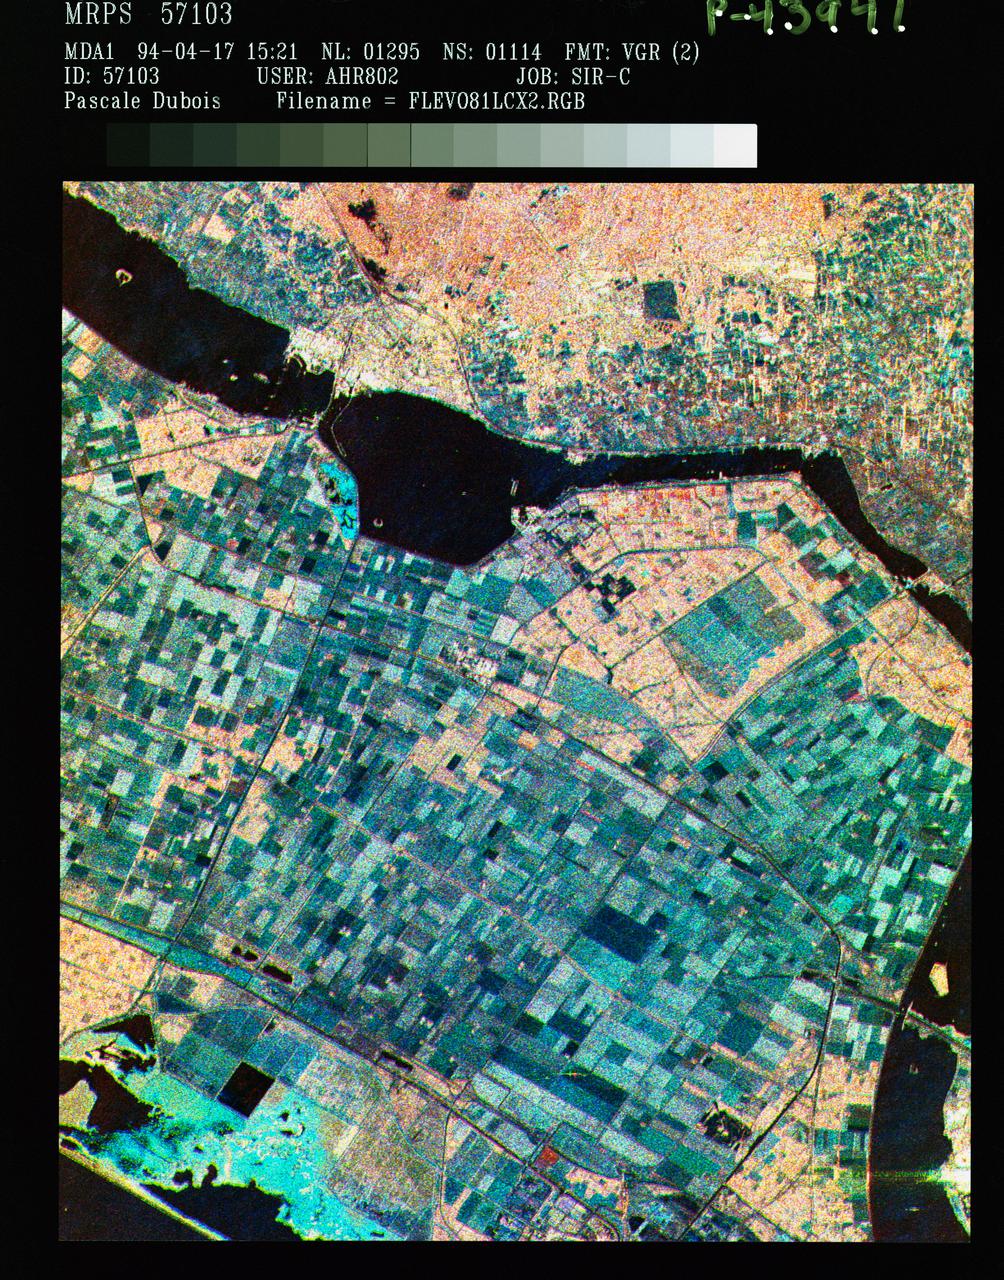
STS059-S-086 (18 April 1994) --- This is a three-frequency false-color image of Flevoland, the Netherlands, centered at 52.4 degrees north latitude, and 5.4 degrees east longitude. This image was acquired by the Spaceborne Imaging Radar-C and X-Band Synthetic Aperture Radar (SIR-C/X-SAR) aboard the Space Shuttle Endeavour on April 14, 1994. It was produced by combining data from the X-Band, C-Band and L-Band radar's. The area shown is approximately 25 by 28 kilometers (15 1/2 by 17 1/2 miles). Flevoland, which fills the lower two-thirds of the image, is a very flat area that is made up of reclaimed land that is used for agriculture and forestry. At the top of the image, across the canal from Flevoland, is an older forest shown in red; the city of Harderwijk is shown in white on the shore of the canal. At this time of the year, the agricultural fields are bare soil, and they show up in this images in blue. The changes in the brightness of the blue areas are equal to the changes in roughness. The dark blue areas are water and the small dots in the canal are boats. This SIR-C/X-SAR supersite is being used for both calibration and agricultural studies. Several soil and crop ground-truth studies will be conducted during the Shuttle flight. In addition, about 10 calibration devices and 10 corner reflectors have been deployed to calibrate and monitor the radar signal. One of these transponders can be seen as a bright star in the lower right quadrant of the image. This false-color image was made using L-Band total power in the red channel, C-Band total power in the green channel, and X-Band VV polarization in the blue channel. SIR-C/X-SAR is part of NASA's Mission to Planet Earth (MTPE). SIR-C/X-SAR radars illuminate Earth with microwaves allowing detailed observations at any time, regardless of weather or sunlight conditions. SIR-C/X-SAR uses three microwave wavelengths: L-Band (24 cm), C-Band (6 cm), and X-Band (3 cm). The multi-frequency data will be used by the international scientific community to better understand the global environment and how it is changing. The SIR-C/X-SAR data, complemented by aircraft and ground studies, will give scientists clearer insights into those environmental changes which are caused by nature and those changes which are induced by human activity. SIR-C was developed by NASA's Jet Propulsion Laboratory (JPL). X-SAR was developed by the Dornire and Alenia Spazio Companies for the German Space Agency, Deutsche Agentur fuer Raumfahrtangelegenheiten (DARA), and the Italian Space Agency, Agenzia Spaziale Italiana (ASI). JPL Photo ID: P-43941
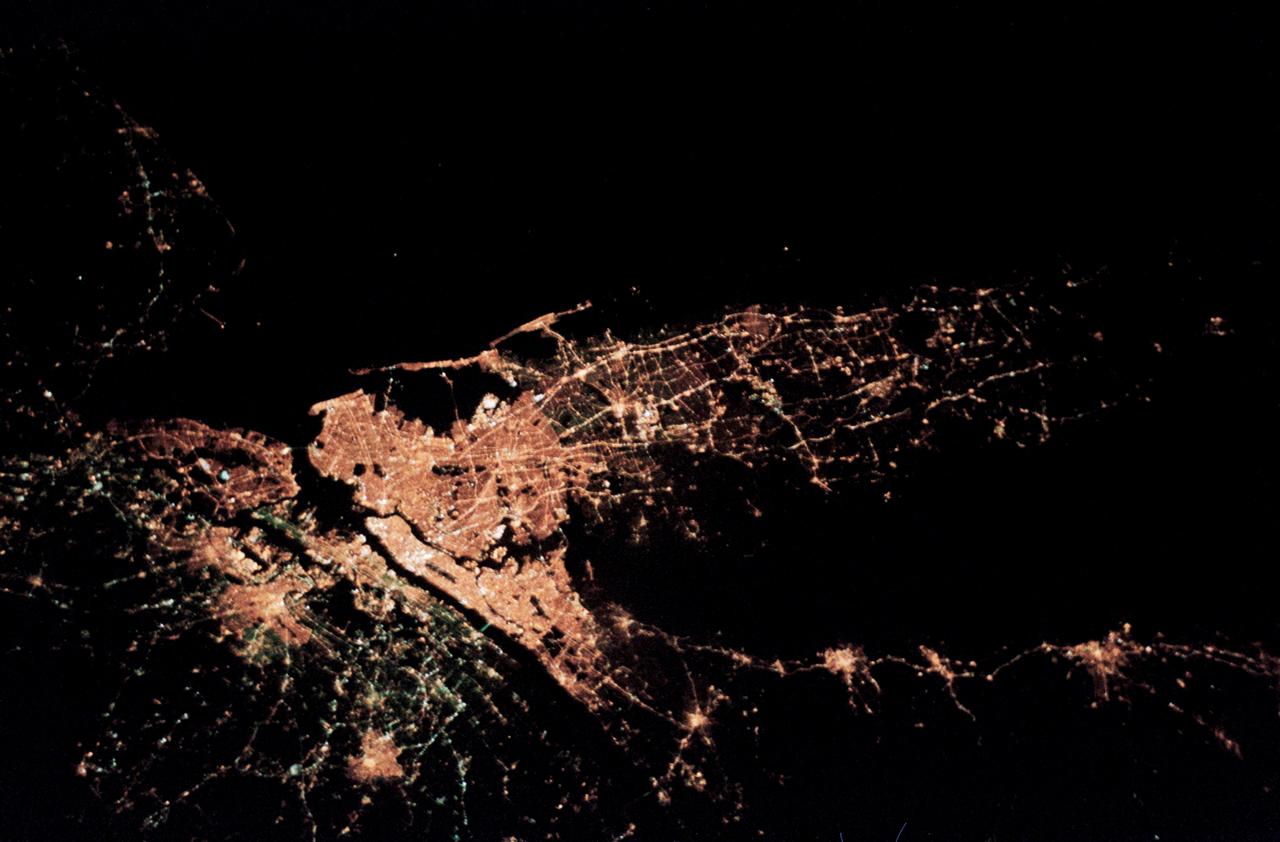
STS059-50-003 (9-20 April 1994) --- This 35mm night image of the New York City metropolitan area was captured by the crew of the STS-59 crew during the Space Radar Laboratory (SRL) mission. Scientists studying film from the Space Shuttle Endeavour feel this is the best nocturnal view of this region from the manned space program.

STS059-09-012 (9-20 April 1994) --- On the Space Shuttle Endeavour's aft flight deck, astronaut Michael R. (Rich) Clifford, mission specialist, inserts a tape in the payload high rate recorder. Three of these state-of-the-art recorders captured four times the amount of data that could be radioed to the ground. The 183 tapes, each containing 40 megabytes of data, will be turned into images over the next year, and analyzed over the next decade. Clifford was joined in space by five other NASA astronauts for a week and a half of support to the Space Radar Laboratory (SRL-1)/STS-59 mission.