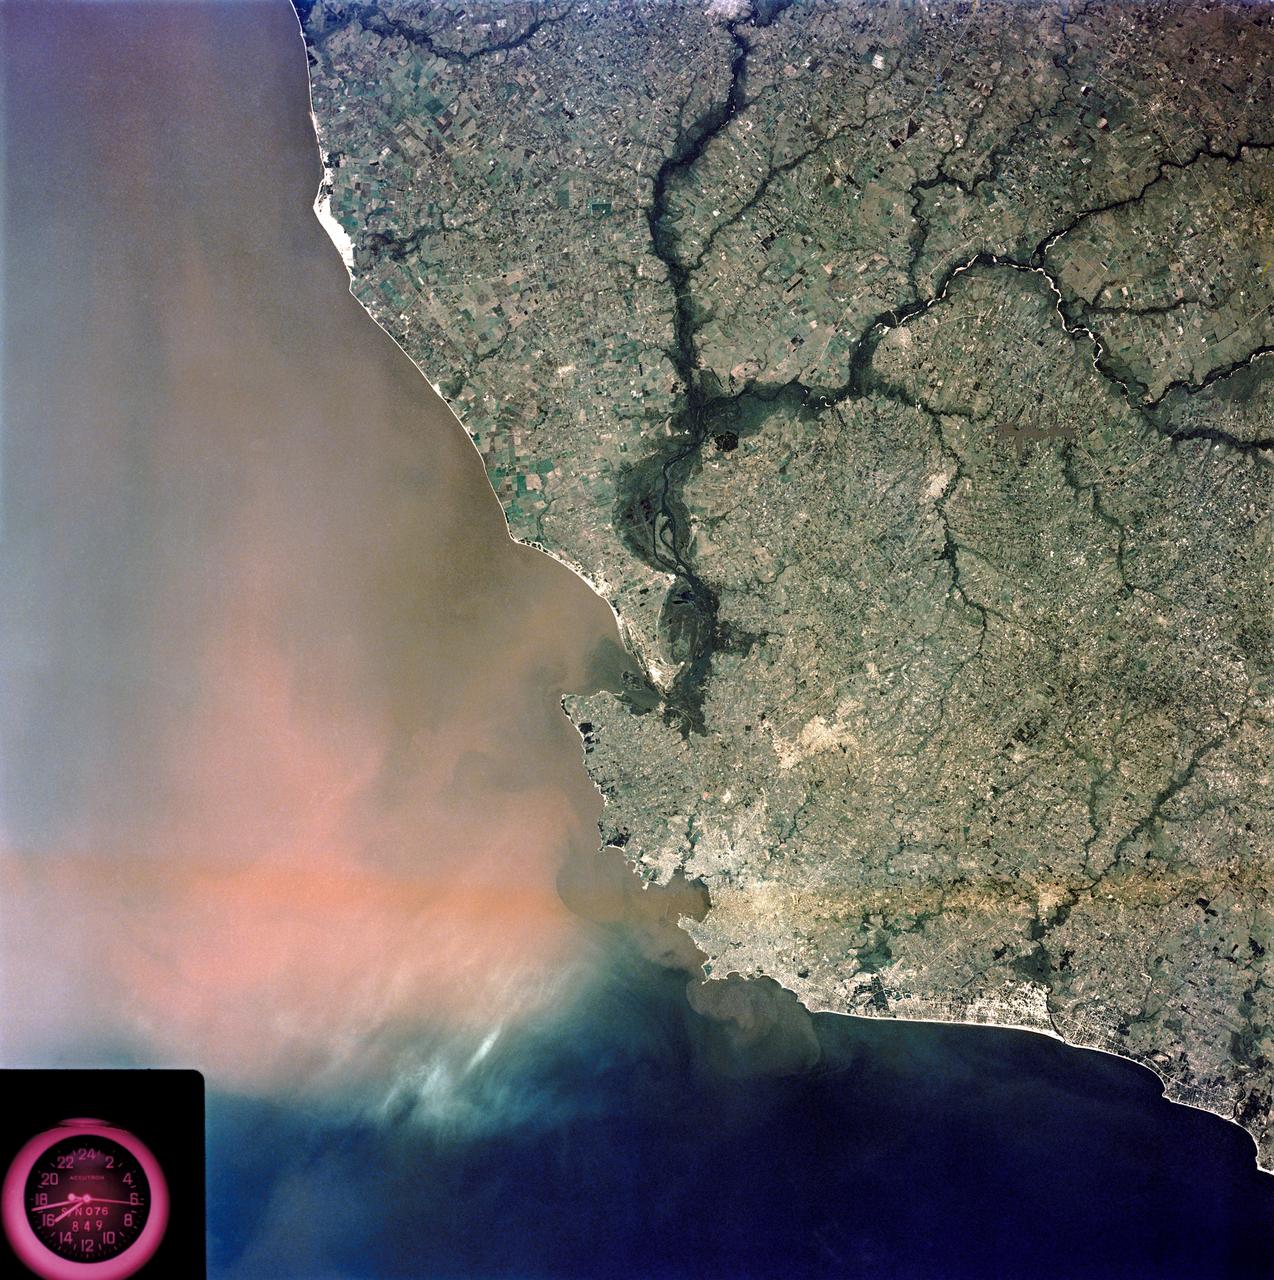
SL3-84-202 (July-September 1973) --- A vertical view of the Montevideo, Uruguay area of South America is seen in this Skylab 3 Earth Resources Experiments Package S190-B (five-inch Earth terrain camera) photograph taken from the Skylab space station in Earth orbit. The large body of water is Rio de la Plata which flows into the South Atlantic Ocean at the bottom of the picture. The red plum in the Rio de la Plata is probably sediment moving seaward. The Santa Lucia River enters the Rio de la Plata west of Montevideo and is the major drainage for the region. Note the small Isla del Tigre at the mouth of the Santa Lucia. The white beach and sand dune areas are plainly visible along the coast. A major airport can be seen immediately east of downtown Montevideo. Major thoroughfares and residential areas, such as the bright one in the suburbs, are clearly visible, also. Farm tracts in green and grey rectangular patterns indicate agricultural regions. Photo credit: NASA
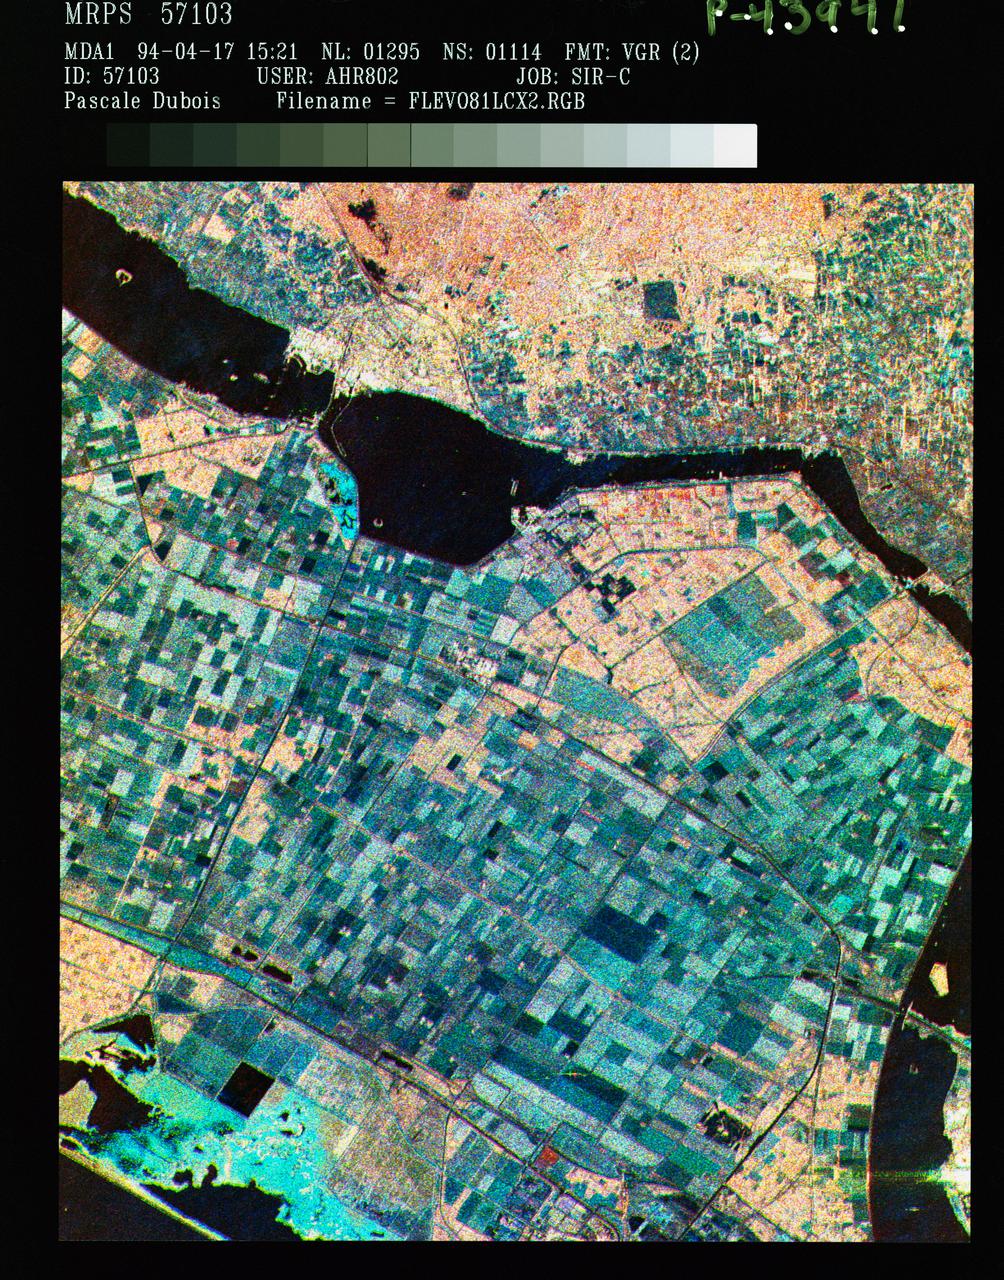
STS059-S-086 (18 April 1994) --- This is a three-frequency false-color image of Flevoland, the Netherlands, centered at 52.4 degrees north latitude, and 5.4 degrees east longitude. This image was acquired by the Spaceborne Imaging Radar-C and X-Band Synthetic Aperture Radar (SIR-C/X-SAR) aboard the Space Shuttle Endeavour on April 14, 1994. It was produced by combining data from the X-Band, C-Band and L-Band radar's. The area shown is approximately 25 by 28 kilometers (15 1/2 by 17 1/2 miles). Flevoland, which fills the lower two-thirds of the image, is a very flat area that is made up of reclaimed land that is used for agriculture and forestry. At the top of the image, across the canal from Flevoland, is an older forest shown in red; the city of Harderwijk is shown in white on the shore of the canal. At this time of the year, the agricultural fields are bare soil, and they show up in this images in blue. The changes in the brightness of the blue areas are equal to the changes in roughness. The dark blue areas are water and the small dots in the canal are boats. This SIR-C/X-SAR supersite is being used for both calibration and agricultural studies. Several soil and crop ground-truth studies will be conducted during the Shuttle flight. In addition, about 10 calibration devices and 10 corner reflectors have been deployed to calibrate and monitor the radar signal. One of these transponders can be seen as a bright star in the lower right quadrant of the image. This false-color image was made using L-Band total power in the red channel, C-Band total power in the green channel, and X-Band VV polarization in the blue channel. SIR-C/X-SAR is part of NASA's Mission to Planet Earth (MTPE). SIR-C/X-SAR radars illuminate Earth with microwaves allowing detailed observations at any time, regardless of weather or sunlight conditions. SIR-C/X-SAR uses three microwave wavelengths: L-Band (24 cm), C-Band (6 cm), and X-Band (3 cm). The multi-frequency data will be used by the international scientific community to better understand the global environment and how it is changing. The SIR-C/X-SAR data, complemented by aircraft and ground studies, will give scientists clearer insights into those environmental changes which are caused by nature and those changes which are induced by human activity. SIR-C was developed by NASA's Jet Propulsion Laboratory (JPL). X-SAR was developed by the Dornire and Alenia Spazio Companies for the German Space Agency, Deutsche Agentur fuer Raumfahrtangelegenheiten (DARA), and the Italian Space Agency, Agenzia Spaziale Italiana (ASI). JPL Photo ID: P-43941
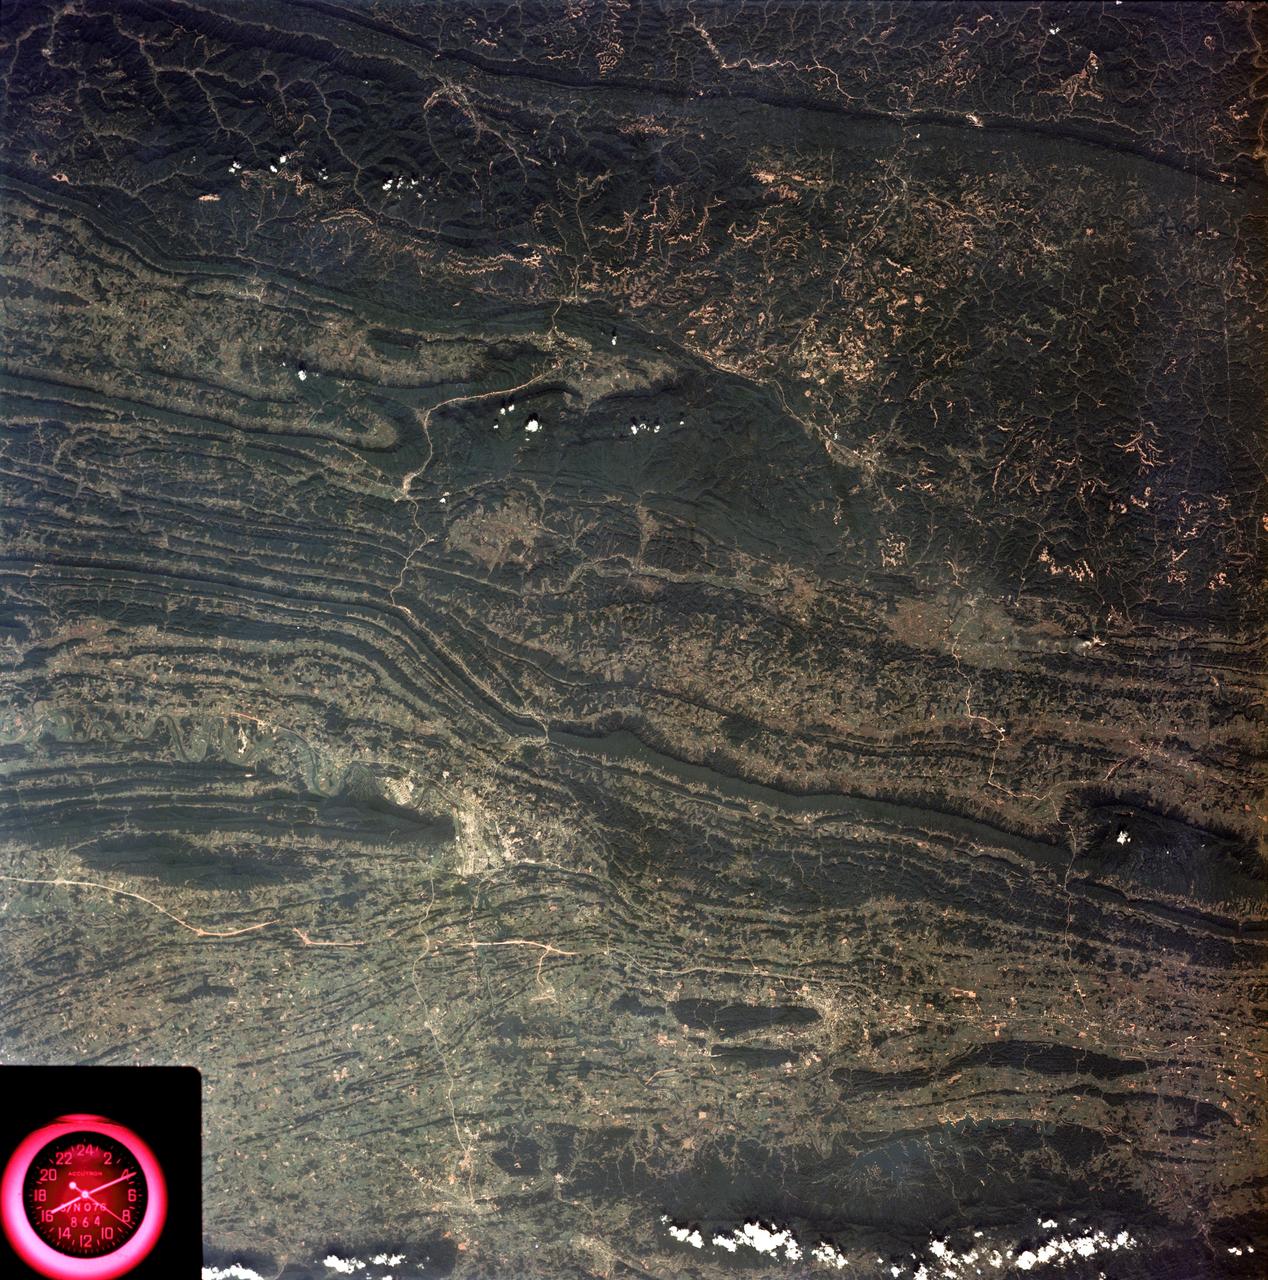
SL3-88-053 (July-September 1973) --- A near vertical view of the Tennessee-Virginia-Kentucky border area is seen in this Skylab 3 Earth Resources Experiments Package S190-B (five-inch Earth terrain camera) photograph taken from the Skylab space station in Earth orbit. The clock is in the most southerly corner of the picture. Interstate 81 under construction extends northeast-southwest across the bottom portion of the photograph. The larger urban area nearest the center of the picture is Kingsport, Tennessee. On the southern side of I-80 and east of Kingsport is the city of Bristol, Tennessee-Virginia. Johnson City, Tennessee is the urban area near the edge of the picture southeast of Kingsport. The Holston River, a tributary of the Tennessee River, meanders through the Kingsport area. The characteristic ridge and valley features in the Cumberland Plateau of Kentucky, Tennessee and Virginia are clearly visible. Forests (dark green) occur on the ridges and clearly outline the folded and faulted rock formations. The valleys (light) were formed in the softer rocks as a result of erosion. Agricultural areas are indicated by the characteristic rectangular patterns. Coal production is an important industry of this area; and it is mined by surface open pit operations. The irregular light areas in the Kentucky-Virginia border area are the strip mines which follow the contour of the land. Reclamation of the strip mine areas is aided through accurate knowledge of the mine and drainage systems. Dr. Ronald Brooks of the Wolf Research and Development Corporation can use this photograph in study of strip mine areas in the east central U.S. Federal agencies participating with NASA on the EREP project are the Departments of Agriculture, Commerce, Interior, the Environmental Protection Agency and the Corps of Engineers. All EREP photography is available to the public through the Department of Interior’s Earth Resources Observations Systems Data Center, Sioux Falls, South Dakota, 57198. Photo credit: NASA
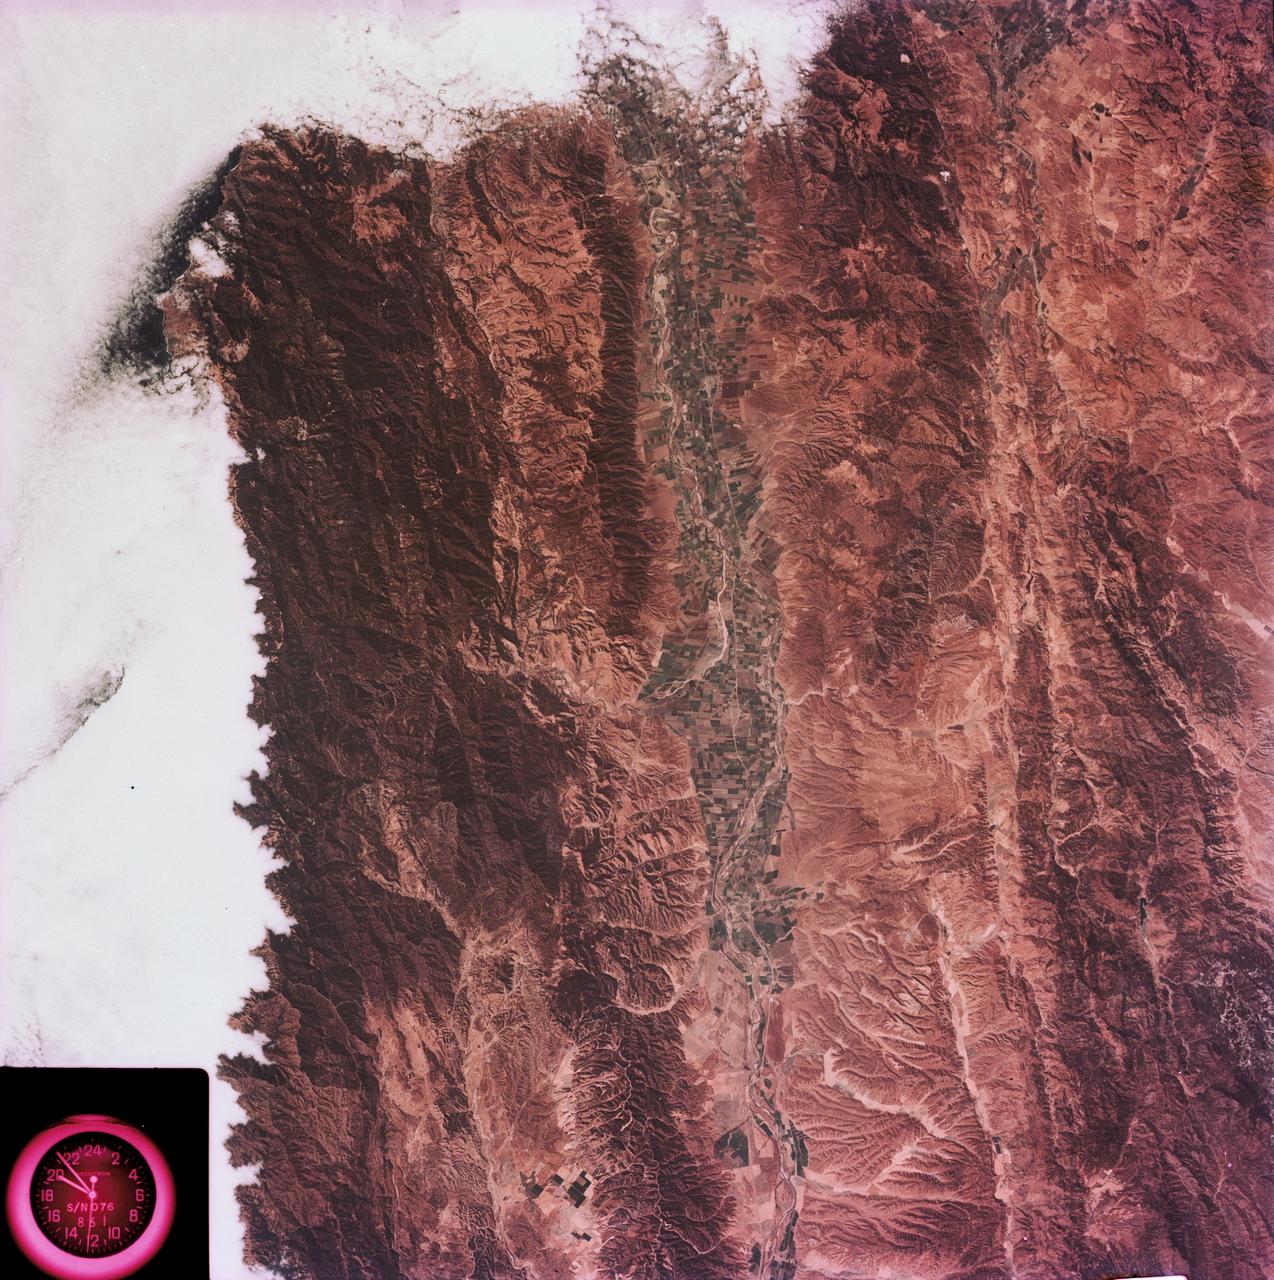
SL3-88-004 (July-September 1973) --- A vertical view of the Salinas River Valley area south of Monterey Bay, California area is seen in this Skylab 3 Earth Resources Experiments Package S190-B (five-inch Earth terrain camera) photograph taken from the Skylab space station in Earth orbit. The valley is an irrigated agricultural area, and is indicated by the dark-green and light-gray rectangular patterns in the centre of the picture. The city of Salinas is barely visible under the cloud cover at the top (north) end of the valley. The dark mass on the left (west) side of the valley is the Santa Lucia mountain range. The Big Sur area is on the left and partly covered by clouds. The Diablo Range forms the dark mass in the lower right (southeast) corner of the photograph. The town of Hollister is the gray area in the dark-green rectangular farm tracts which occupy the floor of the San Benito Valley in the upper right (northeast) corner of the photograph. The Salinas River flows northwestward toward Monterey Bay. The towns of Soledad, Greenfield and King City appear as gray areas along U.S. 101 in the Salinas Valley. The geology of the area is complex, and has been racked by several earthquakes resulting from movement along the San Andreas and subsidiary faults. Here, the surface expression of the San Andreas Fault can be traced from a point just west of Hollister at the contrast of dark brown and tan to a point about one inch left of the lower right (southeast) corner of the picture. Subsidiary faults are indicated by the curving trend of the rocks along the right side. The photograph will provide detailed information on land use patterns (Dr. R. Colwell, University of California, Berkeley) and fault tectonics (Dr. P. Merifield, Earth Science Res., Inc. and Dr. M. Abdel-Gawad, Rockwell International). Federal agencies participating with NASA on the EREP project are the Departments of Agriculture, Commerce, Interior, the Environmental Protection Agency and the Corps of Engineers. All EREP photography is available to the public through the Department of Interior’s Earth Resources Observations Systems Data Center, Sioux Falls, South Dakota, 57198. Photo credit: NASA
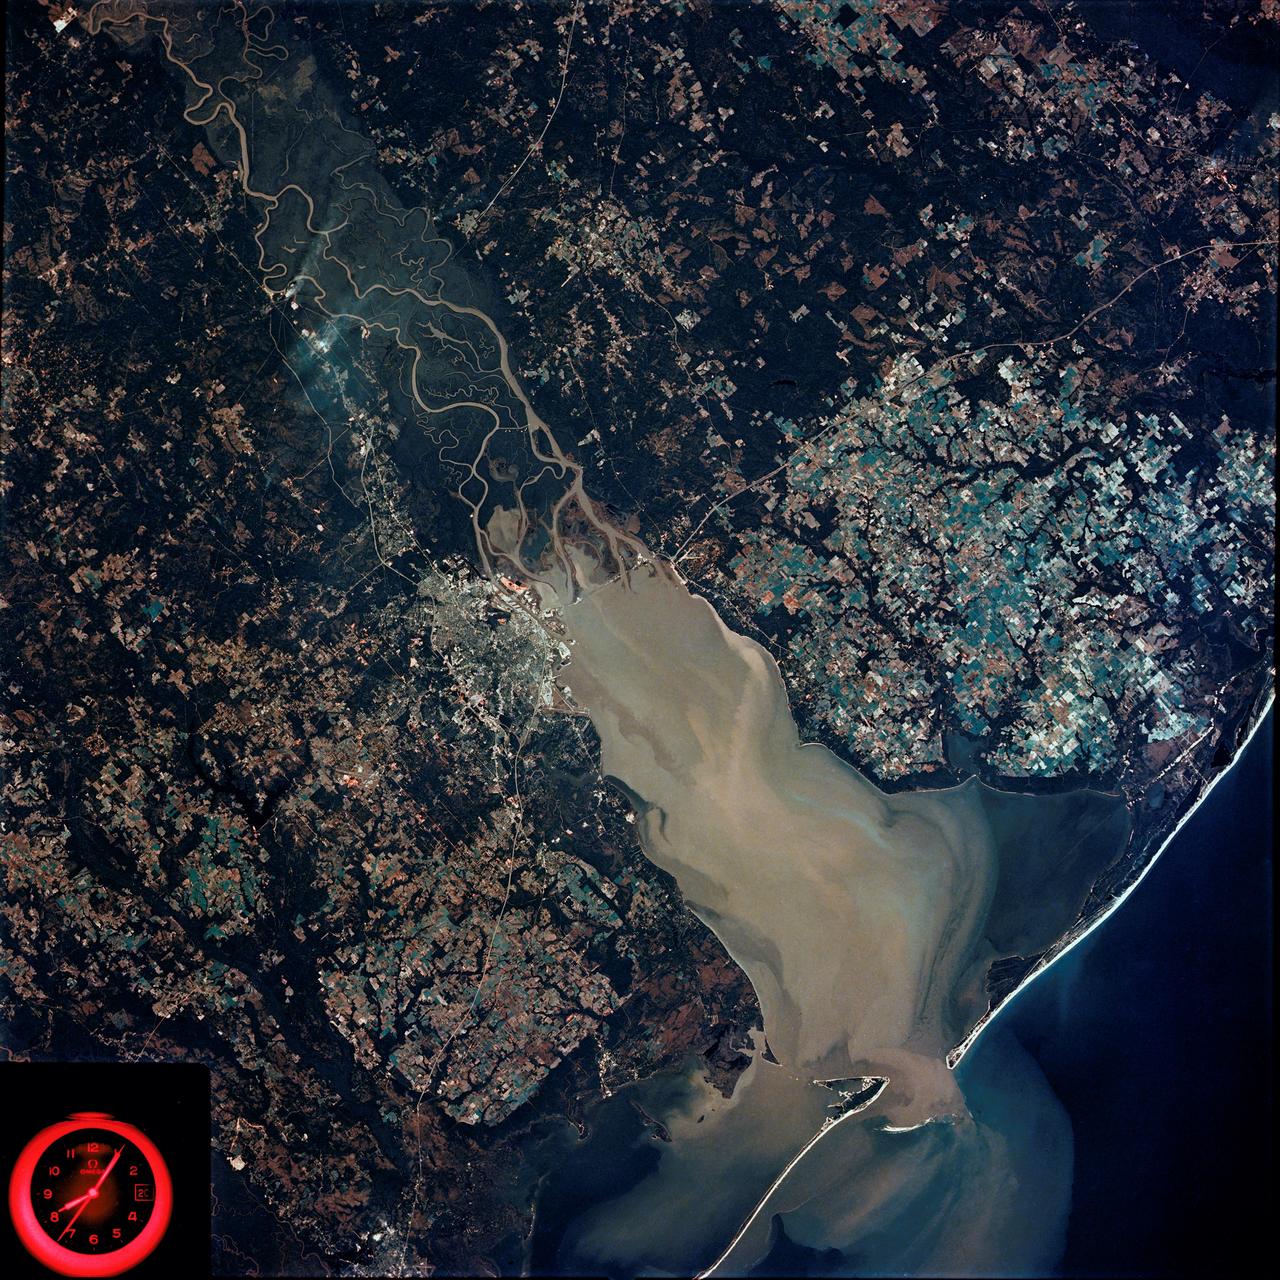
SL4-92-300 (February 1974) --- A near vertical view of the Mobile Bay, Alabama area is seen in this Skylab 4 Earth Resources Experiments Package S190-B (five-inch earth terrain camera) photograph taken from the Skylab space station in Earth orbit. North of Mobile the Tombigbee and Alabama Rivers join to form the Mobile River. Detailed configuration of the individual stream channels and boundaries can be defined as the Mobile River flows into Mobile Bay, and thence into the Gulf of Mexico. The Mobile River Valley with its numerous stream channels is a distinct light shade in contrast to the dark green shade of the adjacent areas. The red coloration of Mobile Bay reflects the sediment load carried into the Bay by the rivers. Variations in red color indicate sediment load and the current paths within Mobile Bay. The waterly movement of the along shore currents at the mouth of Mobile Bay is shown by the contrasting light blue of the sediment-laden current and the blue of the Gulf predominately. Agricultural areas east and west of Mobile Bay are characterized by a rectangular pattern in green to white shades. Color variations may reflect the type and growth cycle of crops. Agricultural areas (light gray-greens) are also clearly visible in other parts of the photograph. Interstate 10 extends from near Pascagoula, Mississippi eastward through Mobile to the outskirts of Pensacola, Florida. Analysis of the EREP photographic data will be undertaken by the U.S. Corps of Engineers to determine bay dynamic processes. Federal agencies participating with NASA on the EREP project are the Departments of Agriculture, Commerce, Interior, the Environmental Protection Agency and the Corps of Engineers. All EREP photography is available to the public through the Department of Interior's Earth Resources Observations Systems Data Center, Sioux Falls, South Dakota. 57198 Photo credit: NASA
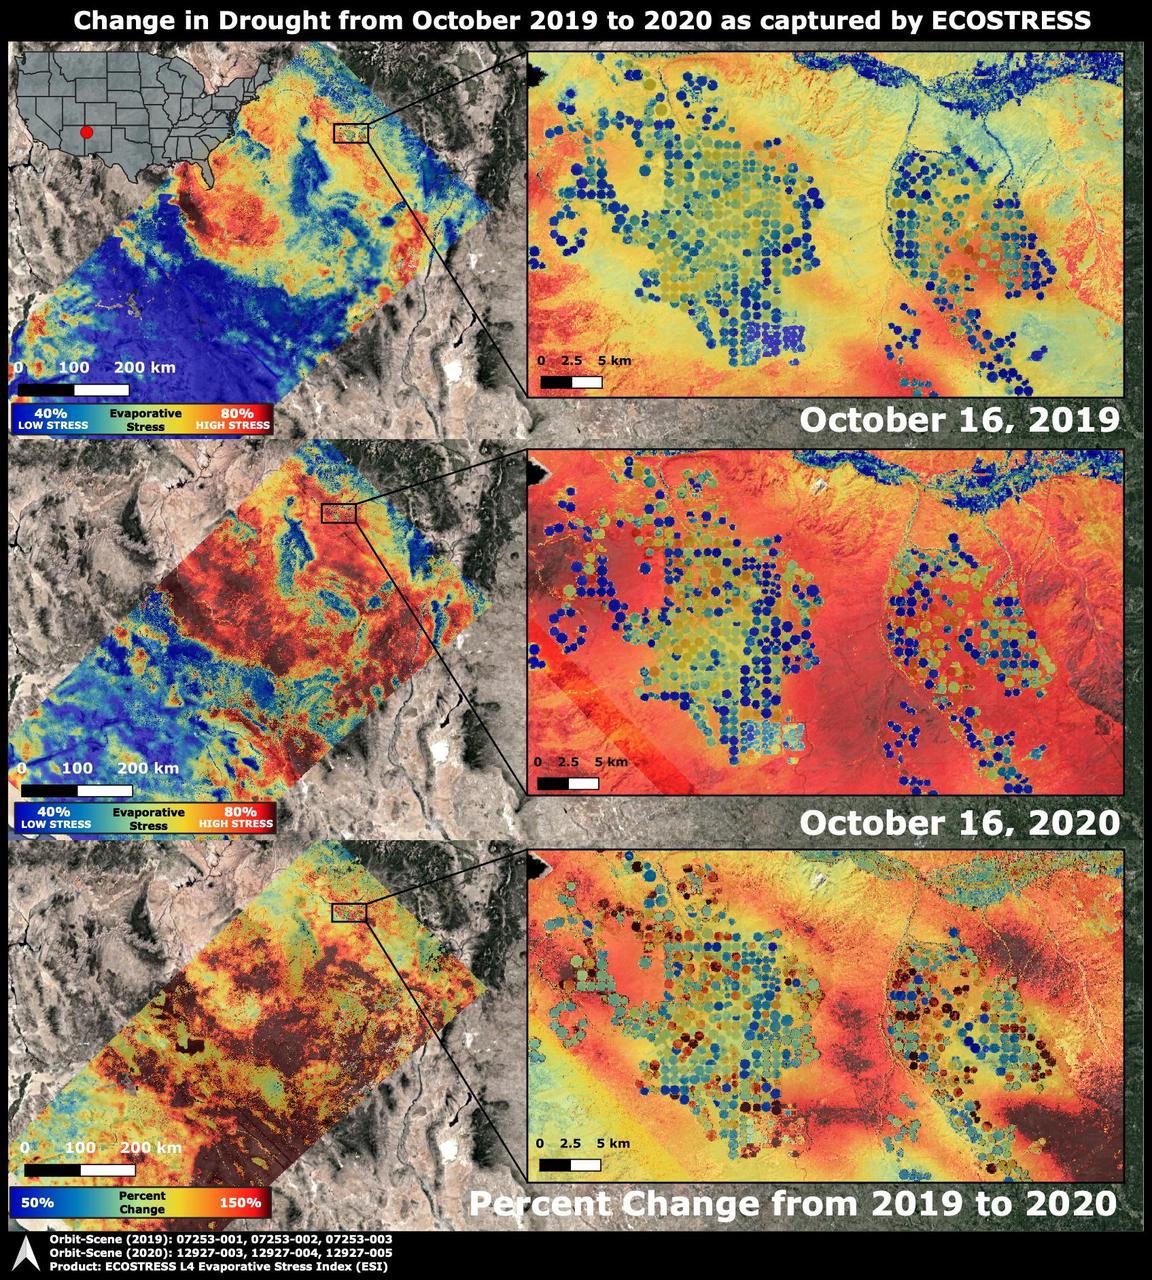
The Western United States has been entrenched in an Extreme and Exceptional drought that has extended from the summer and into the fall of 2020. NASA's ECOsystem Spaceborne Thermal Radiometer Experiment on Space Station (ECOSTRESS) imaged the drought on Oct. 16, 2020, and compared the same area to an image from ECOSTRESS taken a year earlier on Oct. 16, 2019. The bottom image shows the percentage change in plant water stress from 2019 to 2020. The images at left zoom into the Arizona and New Mexico border and Navajo Nation Territory area, featuring the ECOSTRESS Evaporative Stress Index (ESI), which shows plant water stress. The inset images on the right zoom further into the region, showing circular agricultural fields that have been irrigated. Blue colors represent low stress and high water use, whereas red colors represent high stress and low water use. Irrigation is able to alleviate plant water stress in many of the fields while the surrounding landscape suffers from the drought, though numerous agricultural fields are shut down in the drought image. The primary mission of ECOSTRESS, which launched to the International Space Station in June 2018, is to provide insight into plants' health, especially in a drought, by taking their temperature. Plants regulate their temperature by releasing water through tiny pores on their leaves. With sufficient water, they can maintain their temperature. When they lack water, their temperatures rise; ECOSTRESS can measure this change. https://photojournal.jpl.nasa.gov/catalog/PIA24132
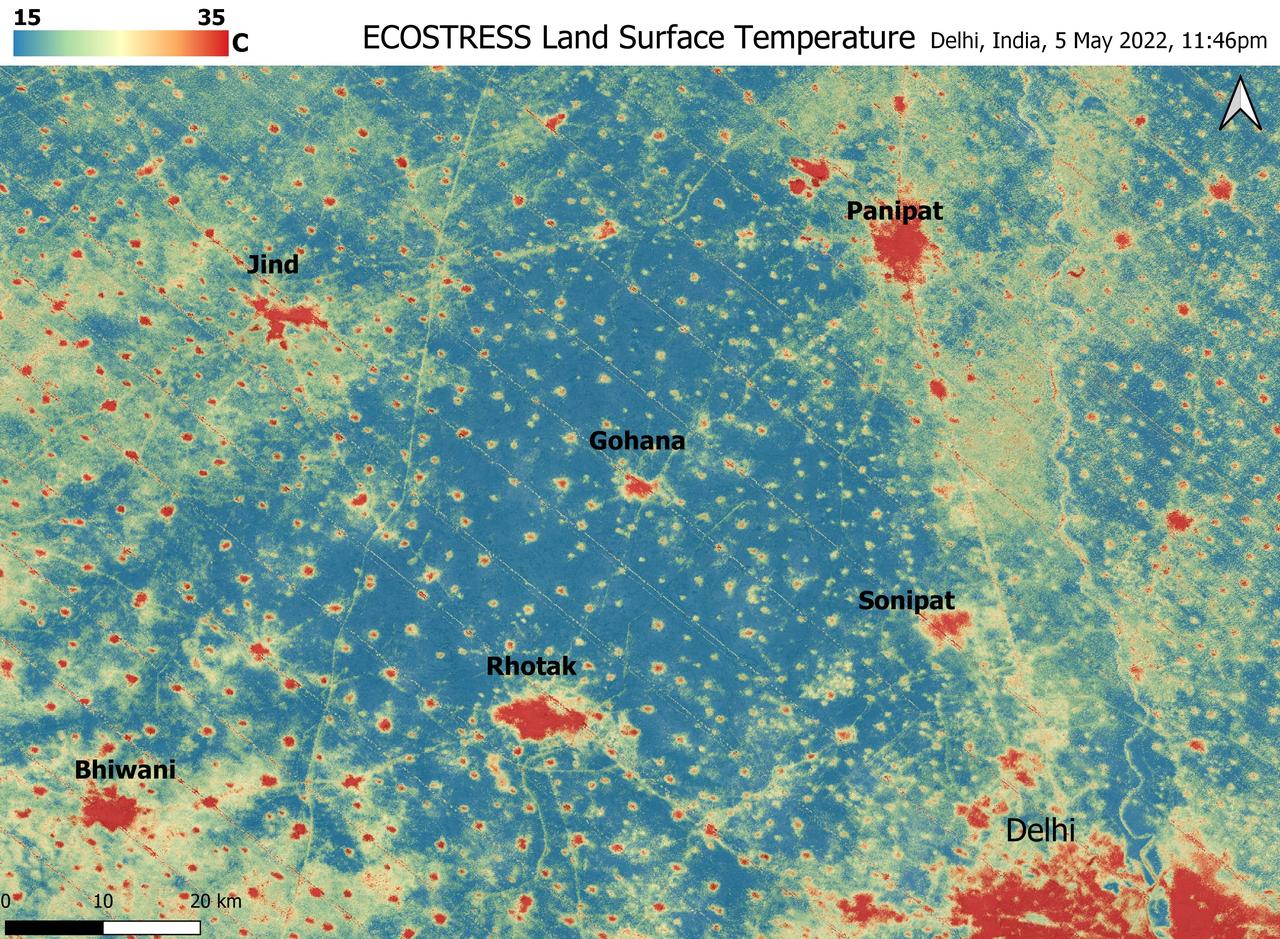
A relentless heat wave has blanketed India and Pakistan since mid-March 2022, causing dozens of deaths, fires, increased air pollution, and reduced crop yields. NASA's Ecosystem Spaceborne Thermal Radiometer Experiment on Space Station instrument (ECOSTRESS) has been measuring these temperatures from space, at the highest spatial resolution of any satellite instrument. This image, taken shortly before local midnight on May 5, shows urban areas and agricultural lands northwest of Delhi that are home to about 28 million people. The image covers about 4,800 square miles (12,350 square kilometers). Cities are usually markedly warmer than the surrounding countryside due to human activities and the materials used in the built environment. The image clearly delineates these urban "heat islands." Nighttime temperatures in Delhi and several smaller villages were above 95 degrees Fahrenheit (35 degrees Celsius), peaking at about 102 degrees F (39 degrees C), while the rural fields nearby had cooled to around 60 degrees F (15 degrees C). This data suggests that city dwellers are experiencing considerably higher temperatures than the average temperatures reported for their regions. ECOSTRESS measures the temperature of the ground itself, which is very similar to air temperature at night (though the ground may be warmer than the air in daylight hours). The instrument launched to the space station in 2018. Its primary mission is to identify plants' thresholds for water use and water stress, giving insight into their ability to adapt to a warming climate. However, ECOSTRESS also records other heat-related phenomena like this heat wave. Its high-resolution images, with a pixel size of about 225 feet (70 meters) by 125 feet (38 meters), are a powerful tool for understanding aspects of the weather event that might be overlooked by traditional observation networks. https://photojournal.jpl.nasa.gov/catalog/PIA24987
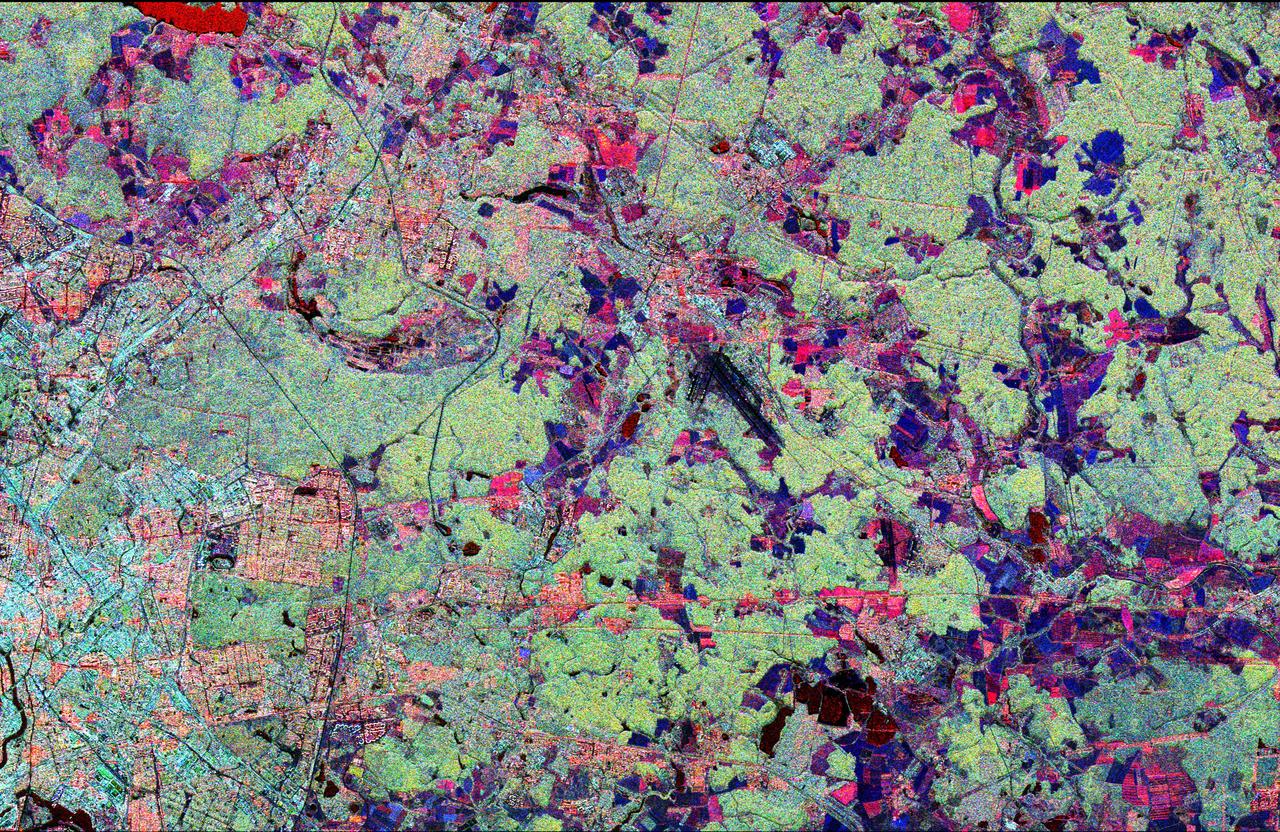
This radar image shows the Star City cosmonaut training center, east of Moscow, Russia. Four American astronauts are training here for future long-duration flights aboard the Russian Mir space station. These joint flights are giving NASA and the Russian Space Agency experience necessary for the construction of the international Alpha space station, beginning in late 1997. This image was acquired by the Spaceborne Imaging Radar-C/X-band Synthetic Aperture Radar (SIR-C/X-SAR), on its 62nd orbit on October 3, 1994. This Star City image is centered at 55.55 degrees north latitude and 38.0 degrees east longitude. The area shown is approximately 32 kilometers by 49 kilometers (20 miles by 30 miles). North is to the top in this image. The radar illumination is from the top of the image. The image was produced using three channels of SIR-C radar data: red indicates L-band (23 cm wavelength, horizontally transmitted and received); green indicates L-band (horizontally transmitted and vertically received); blue indicates C-band (6 cm wavelength, horizontally transmitted and vertically received). In general, dark pink areas are agricultural; pink and light blue areas are urban communities; black areas represent lakes and rivers; dark blue areas are cleared forest; and light green areas are forested. The prominent black runways just right of center are Shchelkovo Airfield, about 4 km long. The textured pale blue-green area east and southeast of Shchelkovo Airfield is forest. Just east of the runways is a thin railroad line running southeast; the Star City compound lies just east of the small bend in the rail line. Star City contains the living quarters and training facilities for Russian cosmonauts and their families. Moscow's inner loop road is visible at the lower left edge of the image. The Kremlin is just off the left edge, on the banks of the meandering Moskva River. The Klyazma River snakes to the southeast from the reservoir in the upper left (shown in bright red), passing just east of Star City and flowing off the lower right edge of the image. The dark blue band of the Vorya River runs north-south in the upper right quadrant, east of Star City. http://photojournal.jpl.nasa.gov/catalog/PIA01775