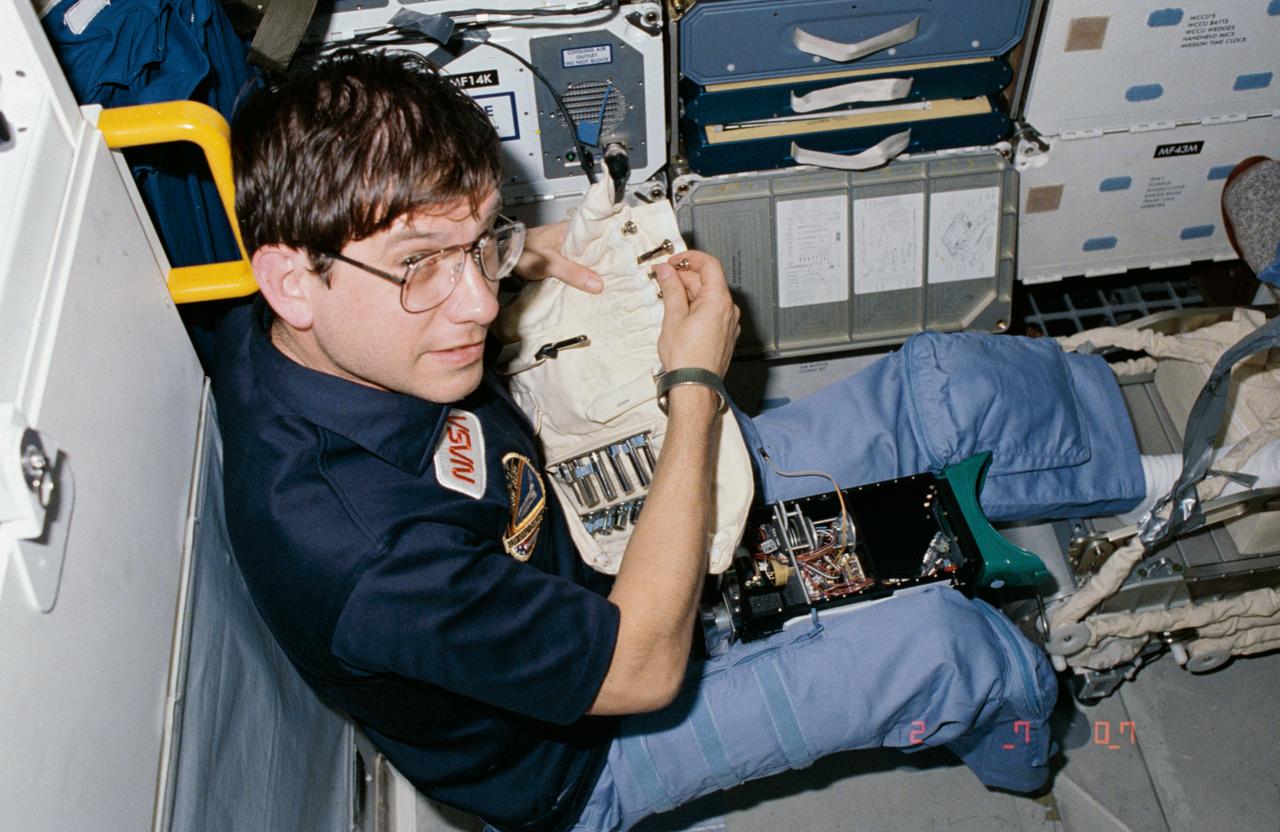
61C-05-035 (12-17 Jan 1986) --- Robert J. Cenker, 61-C payload specialist representing RCA, returns a tiny tool to its stowage position after adjusting the inner workings of a device used in one of a number of detailed supplementary objective (DSO) studies for NASA's Space Biomedical Research Institute. The device is a pair of ocular counter-rolling goggles used by U.S. Rep. Bill Nelson (D., Florida), 61-C's other payload specialist aboard the Columbia for this five-day flight.
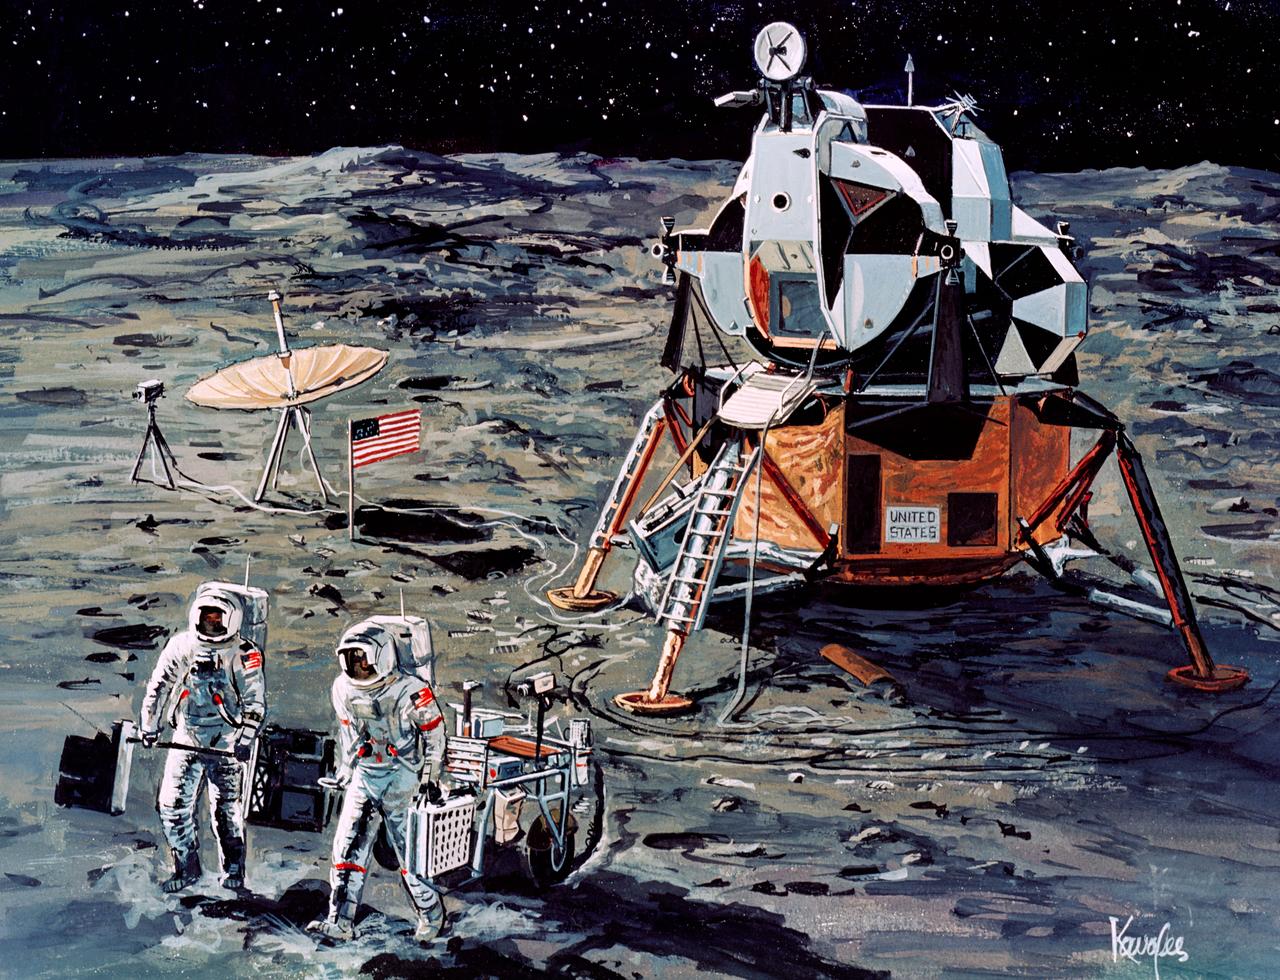
S71-16101 (January 1971) --- A Grumman Aerospace Corporation artist's concept of Apollo 14 crewmen, astronauts Alan B. Shepard Jr., commander, and Edgar D. Mitchell, lunar module pilot, as they set out on their first traverse. Shepard is pulling the Modularized Equipment Transporter (MET) which contains cameras, lunar sample bags, tools and other paraphernalia. Shepard has the Laser Ranging Retro-Reflector (LR-3) in his other hand. Mitchell is carrying the Apollo Lunar Surface Experiments Package (ALSEP) barbell mode.
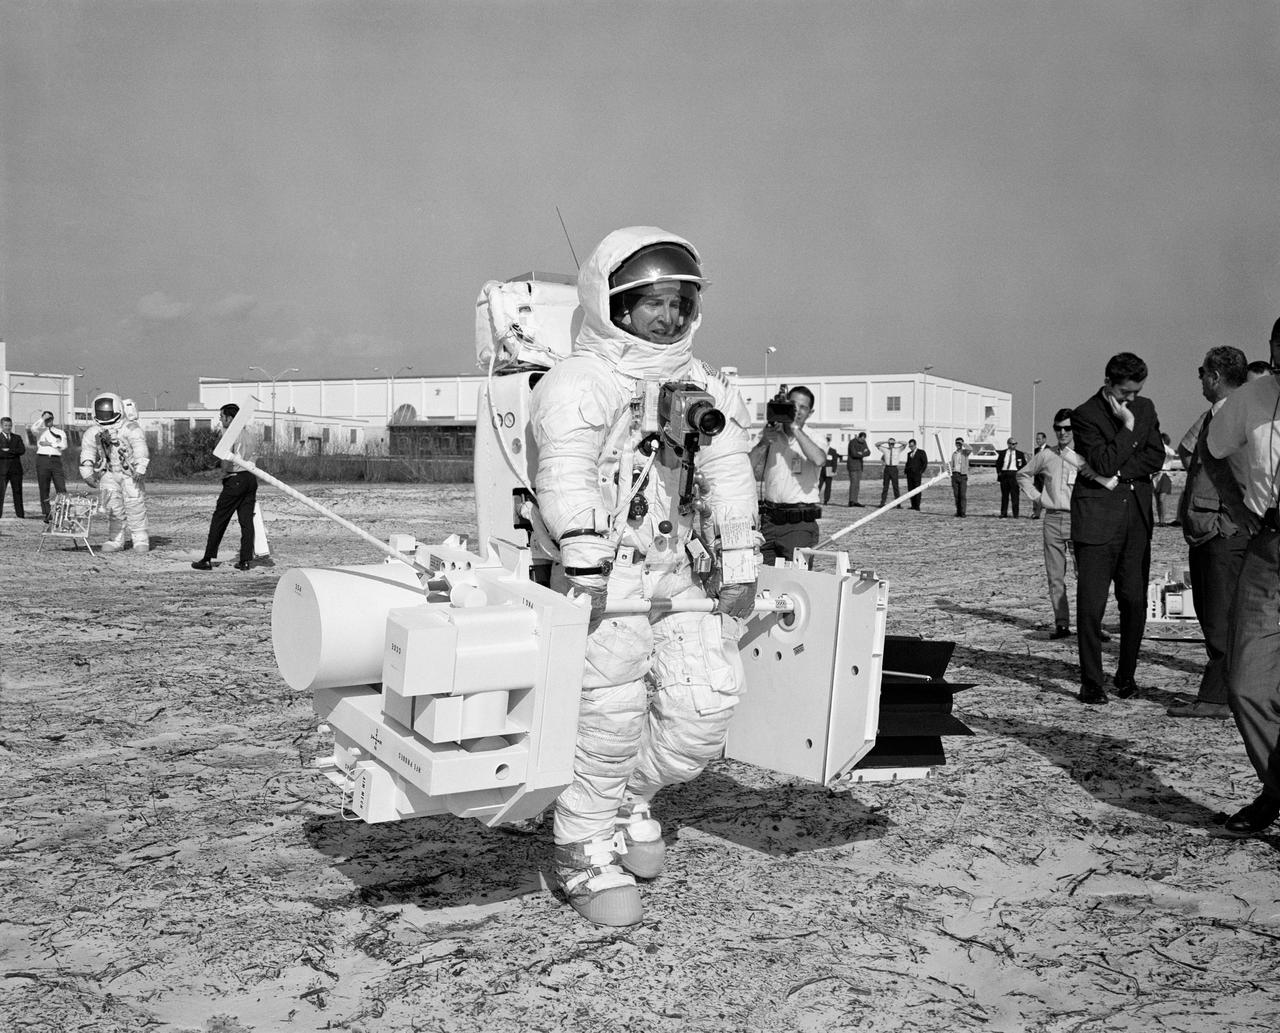
S70-29672 (28 Jan. 1970) --- Astronaut James A. Lovell Jr., commander of the Apollo 13 lunar landing mission, participates in a walk-through of the extravehicular activity timeline at the Kennedy Space Center. Here, Lovell, using mock-ups, traverses with the two subpackages of the Apollo Lunar Surface Experiments Package (ALSEP). Astronaut Fred W. Haise Jr., lunar module pilot, is standing in the left background.
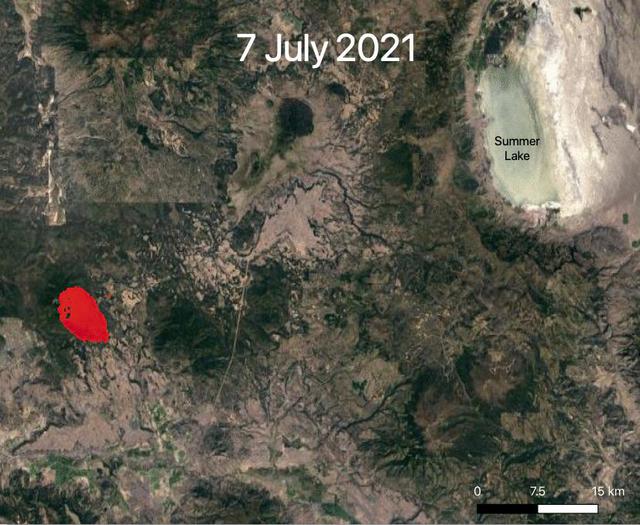
NASA's ECOsystem Spaceborne Thermal Radiometer Experiment on Space Station (ECOSTRESS) is aiding in the fight against fires in the Western U.S. As of July 27, 2021, the Bootleg Fire in southern Oregon had ballooned to more than 410,000 acres, damaging hundreds of buildings and vehicles in its path. ECOSTRESS measures surface temperature from the vantage point of the International Space Station. Researchers of the RADR-Fire team at Pacific Northwest National Laboratory have been experimenting with ECOSTRESS data as part of a new tool now being implemented for first responders like the U.S. Forest Service. In the visualization, ECOSTRESS is tracking the movement of the Bootleg Fire between July 7 and July and identifying its proximity to critical infrastructure — areas in red represent the hottest pixels ECOSTRESS detected. The extreme heat in those areas indicates the fire front, or where resources are most needed. Tasked with detecting plant water use and stress, ECOSTRESS's primary mission is to measure the temperature of plants heating up as they run out of water. But it can also measure and track heat-related phenomena like wildfires, heat waves, and volcanoes. ECOSTRESS observations have a spatial resolution of about 77 by 77 yards (70 by 70 meters), which enables researchers to study surface-temperature conditions down to the size of a football field. Due to the space station's unique orbit, the mission can acquire images of the same regions at different times of the day, as opposed to crossing over each area at the same time of day like satellites in other orbits do. This is advantageous when monitoring plant stress in the same area throughout the day, for example. Movie available at https://photojournal.jpl.nasa.gov/catalog/PIA23695
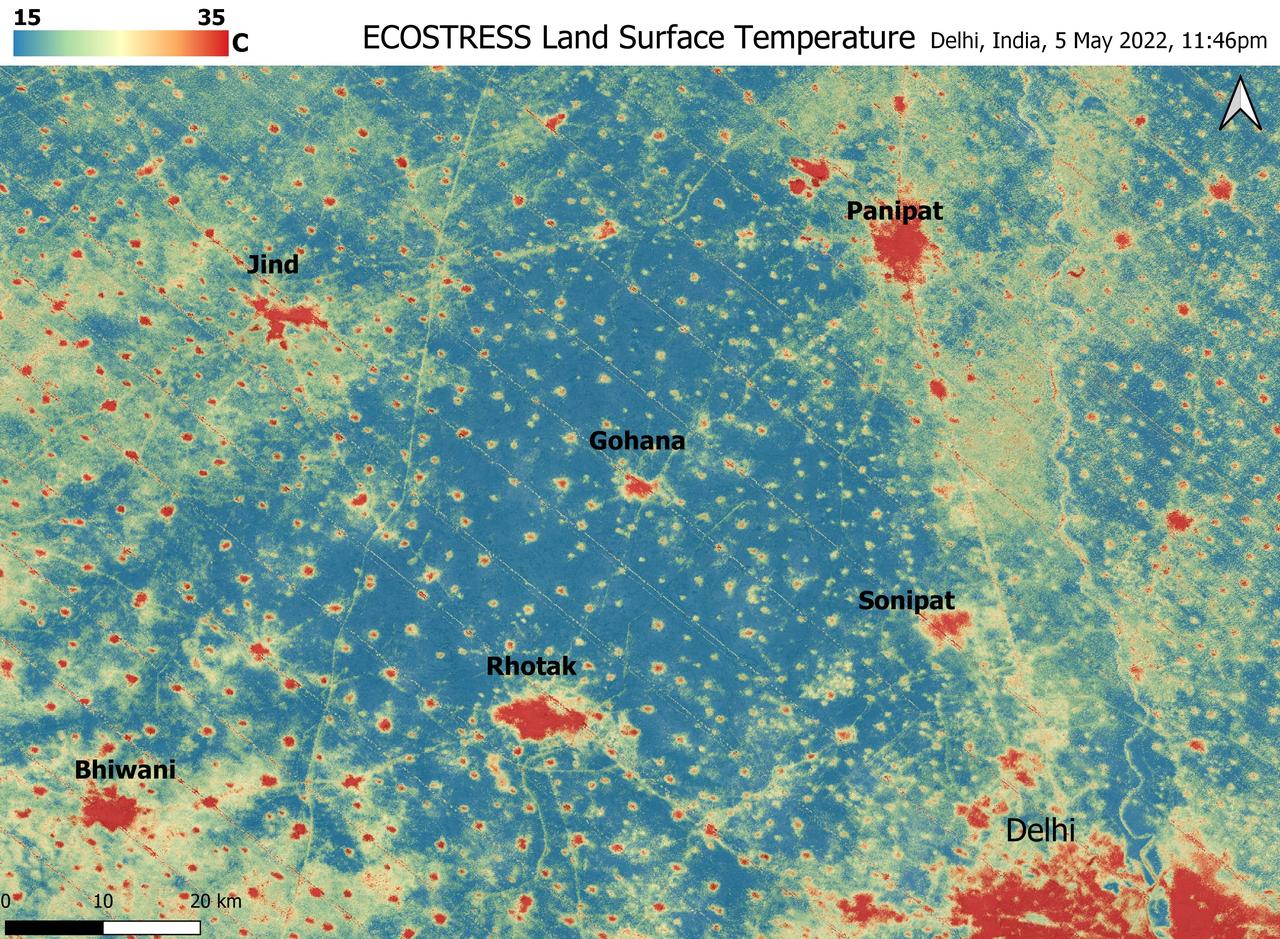
A relentless heat wave has blanketed India and Pakistan since mid-March 2022, causing dozens of deaths, fires, increased air pollution, and reduced crop yields. NASA's Ecosystem Spaceborne Thermal Radiometer Experiment on Space Station instrument (ECOSTRESS) has been measuring these temperatures from space, at the highest spatial resolution of any satellite instrument. This image, taken shortly before local midnight on May 5, shows urban areas and agricultural lands northwest of Delhi that are home to about 28 million people. The image covers about 4,800 square miles (12,350 square kilometers). Cities are usually markedly warmer than the surrounding countryside due to human activities and the materials used in the built environment. The image clearly delineates these urban "heat islands." Nighttime temperatures in Delhi and several smaller villages were above 95 degrees Fahrenheit (35 degrees Celsius), peaking at about 102 degrees F (39 degrees C), while the rural fields nearby had cooled to around 60 degrees F (15 degrees C). This data suggests that city dwellers are experiencing considerably higher temperatures than the average temperatures reported for their regions. ECOSTRESS measures the temperature of the ground itself, which is very similar to air temperature at night (though the ground may be warmer than the air in daylight hours). The instrument launched to the space station in 2018. Its primary mission is to identify plants' thresholds for water use and water stress, giving insight into their ability to adapt to a warming climate. However, ECOSTRESS also records other heat-related phenomena like this heat wave. Its high-resolution images, with a pixel size of about 225 feet (70 meters) by 125 feet (38 meters), are a powerful tool for understanding aspects of the weather event that might be overlooked by traditional observation networks. https://photojournal.jpl.nasa.gov/catalog/PIA24987
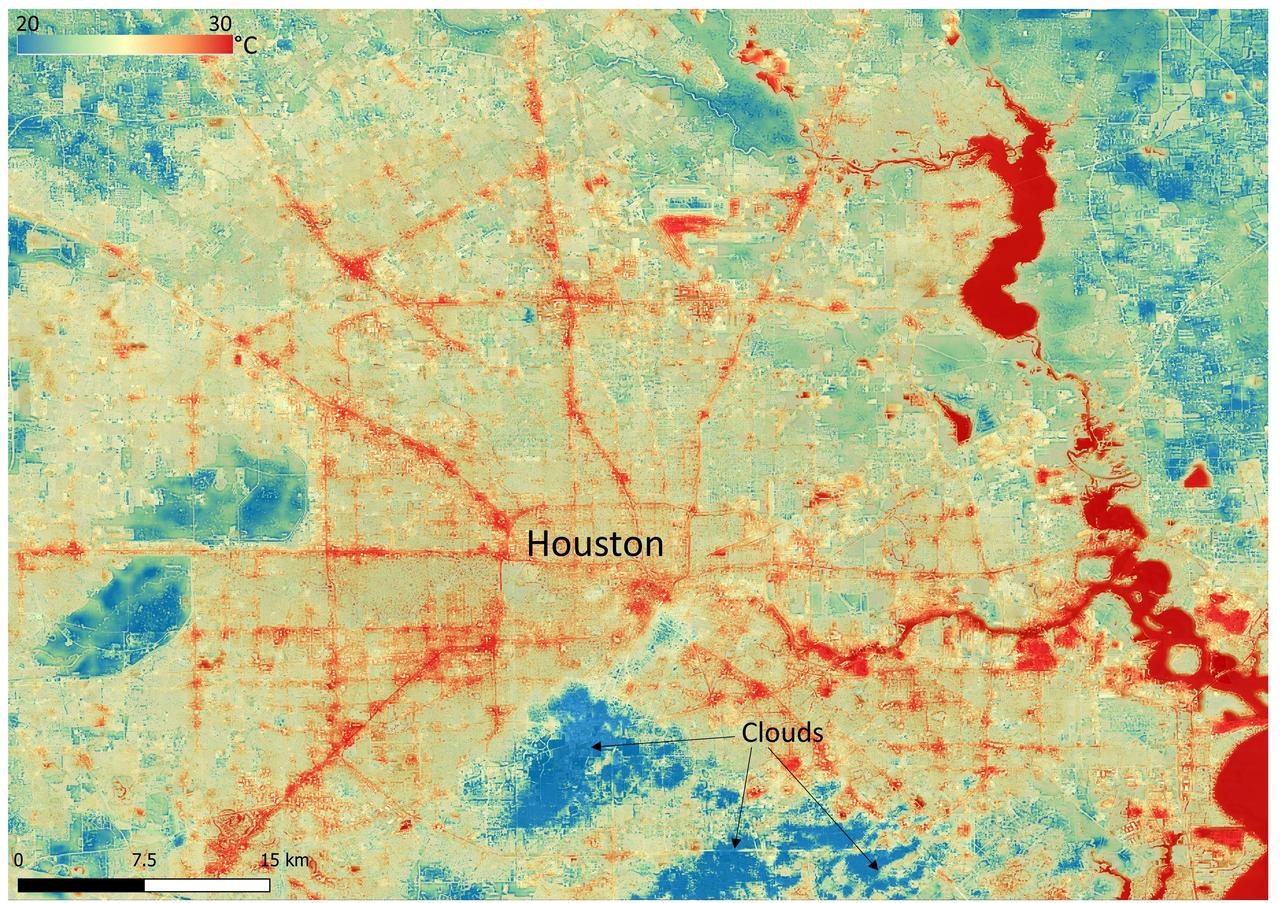
NASA's Ecosystem Spaceborne Thermal Radiometer Experiment on Space Station (ECOSTRESS) instrument recorded this image of ground surface temperatures in Houston and its environs on June 20, 2022, at 6:29 a.m. Central Daylight Time. Even just after sunrise, manmade urban surfaces near the city center and transportation networks – streets, roads, and highways shown in red and orange – were significantly warmer than the outskirts by up to 18 degrees Fahrenheit (10 degrees Celsius). Clouds, which are cool compared with the ground, are shown in blue and labeled in the image. Cities are usually warmer than open land because of human activities and the materials used in building and construction. Streets are often the hottest part of the built environment due to asphalt paving. Dark-colored surfaces absorb more heat from the Sun than lighter-colored ones; asphalt absorbs up to 95% of solar radiation and retains the heat for hours into the nighttime. ECOSTRESS measures the temperature of the ground, which is hotter than the air temperature during the daytime. The instrument launched to the space station in 2018. Its primary mission is to identify plants' thresholds for water use and water stress, giving insight into their ability to adapt to a warming climate. However, ECOSTRESS is also useful for documenting other heat-related phenomena, like patterns of heat absorption and retention. Its high-resolution images, with a pixel size of about 225 feet (70 meters) by 125 feet (38 meters), are a powerful tool for understanding our environment. https://photojournal.jpl.nasa.gov/catalog/PIA25421
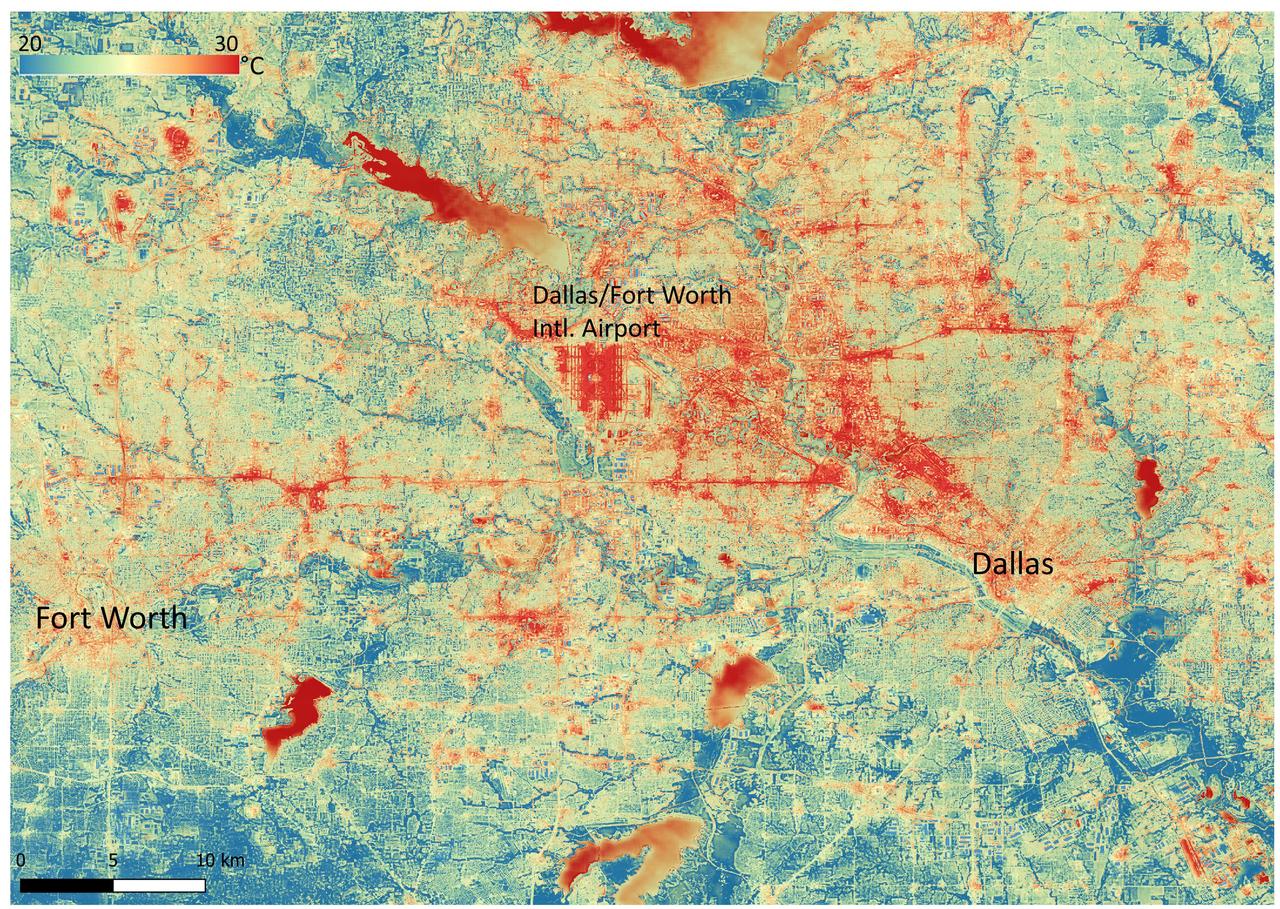
NASA's Ecosystem Spaceborne Thermal Radiometer Experiment on Space Station (ECOSTRESS) instrument recorded this image of ground surface temperatures in Dallas and Fort Worth, Texas, on June 20, 2022, at 7:17 a.m. Central Daylight Time. Even early in the day, manmade urban surfaces near city centers and transportation networks – streets, roads, and highways shown in red and orange – are warmer than the outskirts by up to 18 degrees Fahrenheit (10 degrees Celsius). The paved surfaces at Dallas/Fort Worth International Airport, shown in red near the top-center of the image, had the warmest temperatures, exceeding 86 F (30 C). Natural land surfaces such as vegetation and streams in rural areas, shown in green and blue, are cooler than nearby large bodies of water, shown in red and yellow, that tend to retain more heat overnight due to their higher heat capacity. Cities are usually warmer than open land because of human activities and the materials used in building and construction. Streets are often the hottest part of the built environment due to asphalt paving. Dark-colored surfaces absorb more heat from the Sun than lighter-colored ones; asphalt absorbs up to 95% of solar radiation and retains the heat for hours into the nighttime. ECOSTRESS measures the temperature of the ground, which is hotter than the air temperature during the daytime. The instrument launched to the space station in 2018. Its primary mission is to identify plants' thresholds for water use and water stress, giving insight into their ability to adapt to a warming climate. However, ECOSTRESS is also useful for documenting other heat-related phenomena, like patterns of heat absorption and retention. Its high-resolution images, with a pixel size of about 225 feet (70 meters) by 125 feet (38 meters), are a powerful tool for understanding our environment. https://photojournal.jpl.nasa.gov/catalog/PIA25422
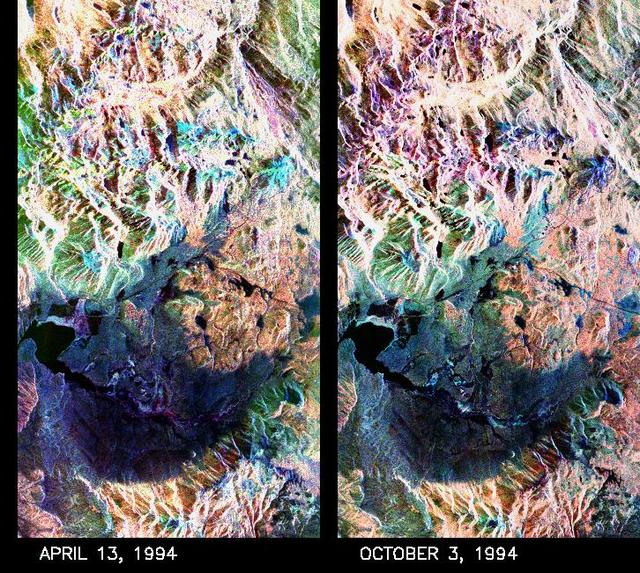
These two false-color composite images of the Mammoth Mountain area in the Sierra Nevada Mountains, Calif., show significant seasonal changes in snow cover. The image at left was acquired by the Spaceborne Imaging Radar-C and X-band Synthetic Aperture Radar aboard the space shuttle Endeavour on its 67th orbit on April 13, 1994. The image is centered at 37.6 degrees north latitude and 119 degrees west longitude. The area is about 36 kilometers by 48 kilometers (22 miles by 29 miles). In this image, red is L-band (horizontally transmitted and vertically received) polarization data; green is C-band (horizontally transmitted and vertically received) polarization data; and blue is C-band (horizontally transmitted and received) polarization data. The image at right was acquired on October 3, 1994, on the space shuttle Endeavour's 67th orbit of the second radar mission. Crowley Lake appears dark at the center left of the image, just above or south of Long Valley. The Mammoth Mountain ski area is visible at the top right of the scene. The red areas correspond to forests, the dark blue areas are bare surfaces and the green areas are short vegetation, mainly brush. The changes in color tone at the higher elevations (e.g. the Mammoth Mountain ski area) from green-blue in April to purple in September reflect changes in snow cover between the two missions. The April mission occurred immediately following a moderate snow storm. During the mission the snow evolved from a dry, fine-grained snowpack with few distinct layers to a wet, coarse-grained pack with multiple ice inclusions. Since that mission, all snow in the area has melted except for small glaciers and permanent snowfields on the Silver Divide and near the headwaters of Rock Creek. On October 3, 1994, only discontinuous patches of snow cover were present at very high elevations following the first snow storm of the season on September 28, 1994. For investigations in hydrology and land-surface climatology, seasonal snow cover and alpine glaciers are critical to the radiation and water balances. SIR-C/X-SAR is a powerful tool because it is sensitive to most snowpack conditions and is less influenced by weather conditions than other remote sensing instruments, such as Landsat. In parallel with the operational SIR-C data processing, an experimental effort is being conducted to test SAR data processing using the Jet Propulsion Laboratory's massively parallel supercomputing facility, centered around the Cray Research T3D. These experiments will assess the abilities of large supercomputers to produce high throughput SAR processing in preparation for upcoming data-intensive SAR missions. The images released here were produced as part of this experimental effort. http://photojournal.jpl.nasa.gov/catalog/PIA01753
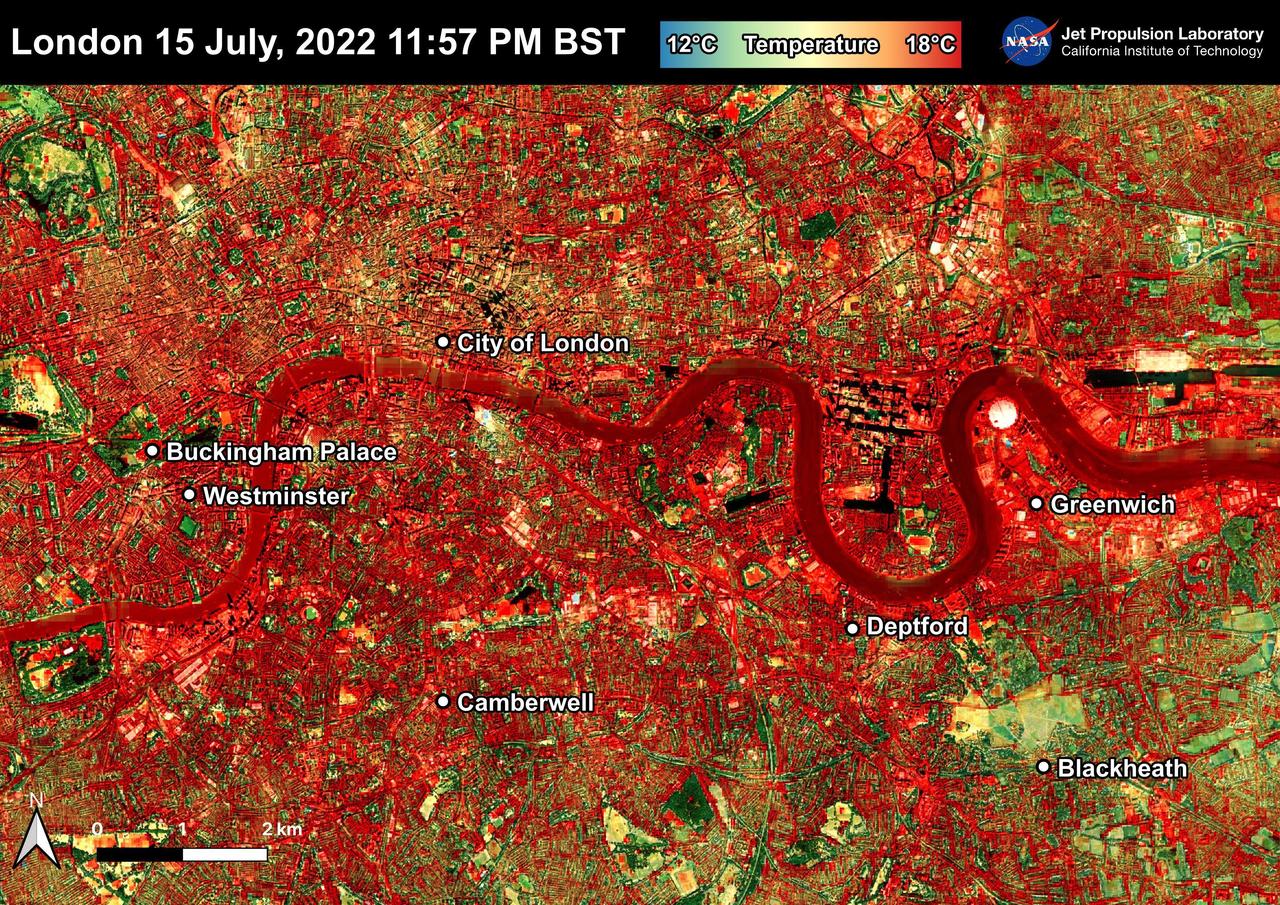
NASA's Ecosystem Spaceborne Thermal Radiometer Experiment on Space Station (ECOSTRESS) instrument recorded this image of ground surface temperatures in London and surrounding areas on July 15, 2022, just before midnight local time. It shows surface temperatures exceeding 68 degrees Fahrenheit (20 degrees Celsius) at 11:57 p.m. British Summer Time. Parts of Europe in mid-July experienced a record-breaking heat wave. The United Kingdom reaching its highest air temperature on record on July 19, 104.5 F (40.3 C) in Coningsby, about 110 miles (177 kilometers) north of London, which itself saw a high of 104.3 F (40.2 C) the same day. That evening, the overnight low was also a record-breaker: 78.4 F (25.8 C) at Kenley Airfield in Greater London. In this image, the red areas indicate hotter temperatures commonly associated with developed areas. These surfaces – roofs, paved streets, and other built structures – remain warm long after the sun sets. Blue and green areas indicate cooler areas commonly associated with parks and other natural land surfaces. Because this image was acquired at night, it shows bodies of water being warmer than the land surface. This is because water tends to change temperature more slowly, so its temperature stays elevated long after land surfaces have cooled down. Cities are usually warmer than open land with natural surfaces because of human activities as well as the materials used in building and construction. Streets are often the hottest part of the built environment due to asphalt paving. Dark-colored surfaces absorb more heat from the Sun than lighter-colored ones; asphalt absorbs up to 95% of solar radiation and retains the heat for hours into nighttime. This image overlays ECOSTRESS surface temperature data on a Google satellite map for context. ECOSTRESS measures the temperature of the ground, which is hotter than the air temperature during the daytime. The instrument launched to the space station in 2018. Its primary mission is to identify plants' thresholds for water use and water stress, giving insight into their ability to adapt to a warming climate. However, ECOSTRESS is also useful for documenting other heat-related phenomena, like patterns of heat absorption and retention. Its high-resolution images, with a pixel size of about 225 feet (70 meters) by 125 feet (38 meters), are a powerful tool for understanding our environment. https://photojournal.jpl.nasa.gov/catalog/PIA25423