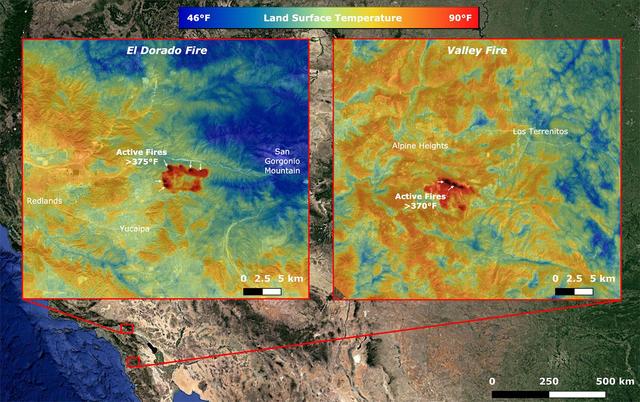
On Sept. 6, NASA's ECOsystem Spaceborne Thermal Radiometer Experiment on Space Station (ECOSTRESS) imaged active fires across California, including the El Dorado fire near Yucaipa and the Valley fire in Japatul Valley in the southern part of the state. As of Sept. 8, there were 25 major wildfires burning in California. Both images, taken at 12:13 a.m. PDT (3:13 a.m. EDT), show multiple concentrated areas of surface temperatures (in red) higher than 375 degrees Fahrenheit (191 degrees Celsius). These high temperature regions were likely where the active fires were occurring. The surrounding areas show abnormally warm middle-of-the-night background surface temperatures (orange) due to the ongoing heat wave. https://photojournal.jpl.nasa.gov/catalog/PIA23788
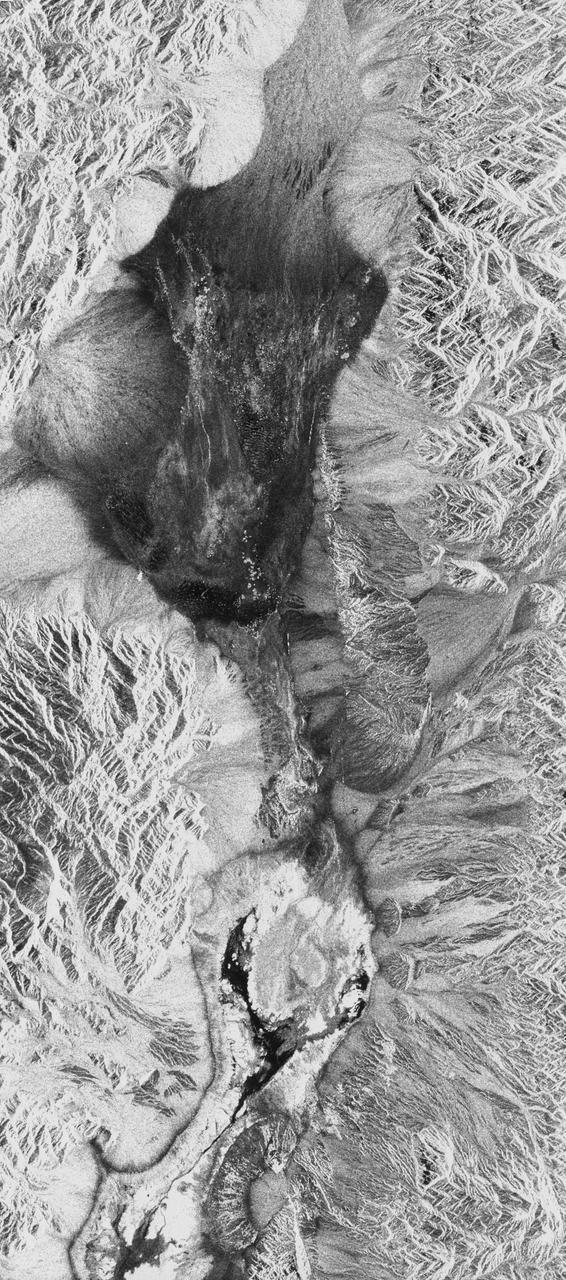
STS059-S-026 (11 April 1994) --- This is an image of Death Valley, California, centered at 36.629 degrees north latitude, 117.069 degrees west longitude. The image shows Furnace Creek alluvial fan and Furnace Creek Ranch at the far right, and the sand dunes near Stove Pipe Wells at the center. The dark fork-shaped feature between Furnace Creek fan and the dunes is a smooth flood-plain which encloses Cottonball Basin. The SIR-C/X-SAR supersite is an area of extensive field investigations and has been visited by both Space Radar Lab astronaut crews. Elevations in the Valley range from 70 meters below sea level, the lowest in the United States, to more than 3300 meters above sea level. Scientists are using SIR-C/X-SAR data from Death Valley to help answer a number of different questions about the Earth's geology. One question concerns how alluvial fans are formed and change through time under the influence of climatic changes and earthquakes. Alluvial fans are gravel deposits that wash down from the mountains over time. They are visible in the image as circular, fan-shaped bright areas extending into the darker valley floor from the mountains. Information about the alluvial fans help scientists study Earth's ancient climate. Scientists know the fans are bulit up through climatic and tectonic processes and they will use the SIR-C/X-SAR data to understand the nature and rates of weathering processes on the fans, soil formation, and the transport of sand and dust by the wind. SIR-C/X-SAR's sensitivity to centimeter-scale (or inch-scale) roughness provides detailed maps of surface texture. Such information can be used to study the occurrence and movement of dust storms and sand dunes. the goal of these studies is to gain a better understanding of the record of past climatic changes and the effects of those changes on a sensitive environment. This may lead to a better ability to predict future response of the land to different potential global cimate-change scenarios. Death Valley is also one of the primary calibration sites for SIR-C/X-SAR. The bright dots near the center of the image are corner reflectors that have been set-up to calibrate the radar as the Shuttle passes overhead. Thirty triangular-shaped reflectors (they look like aluminum pyramids) have been deployed by the calibration team from JPL over a 40 kilometer by 40 kilometer area in and around Death Valley. The calibration team will also deploy transponders (electronic reflectors) and recievers to measure the radar signals from SIR-C/X-SAR on the ground. Spaceborne Imaging Radar-C and X-Synthetic Aperture Radar (SIR-C/X-SAR) is part of NASA's Mission to Planet Earth (MTPE). The radars illuminate Earth with microwaves allowing detailed observations at any time, regardless of weather or sunlight conditions. SIR-C/X-SAR uses three microwave wavelengths: L-Band (24 cm), C-Band (6 cm), and X-Band (3 cm). The multi-frequency data will be used by the international scientific community to better understand the global environment and how it is changing. The SIR-C/X-SAR data, complemented by aircraft and ground studies, will give scientists clearer insights into those environmental changes which are caused by nature and those changes which are induced by human activity. SIR-C was develpoed by NASA's Jet Propulsion Laboratory (JPL). X-SAR was developed by the Dornire and Alenia Spazio Companies for the German Space Agency, Deutsche Agentur fuer Raumfahrtangelegenheiten (DARA), and the Italian Space Agency, Agenzia Spaziale Italiana (ASI). JPL Photo ID: P-43883
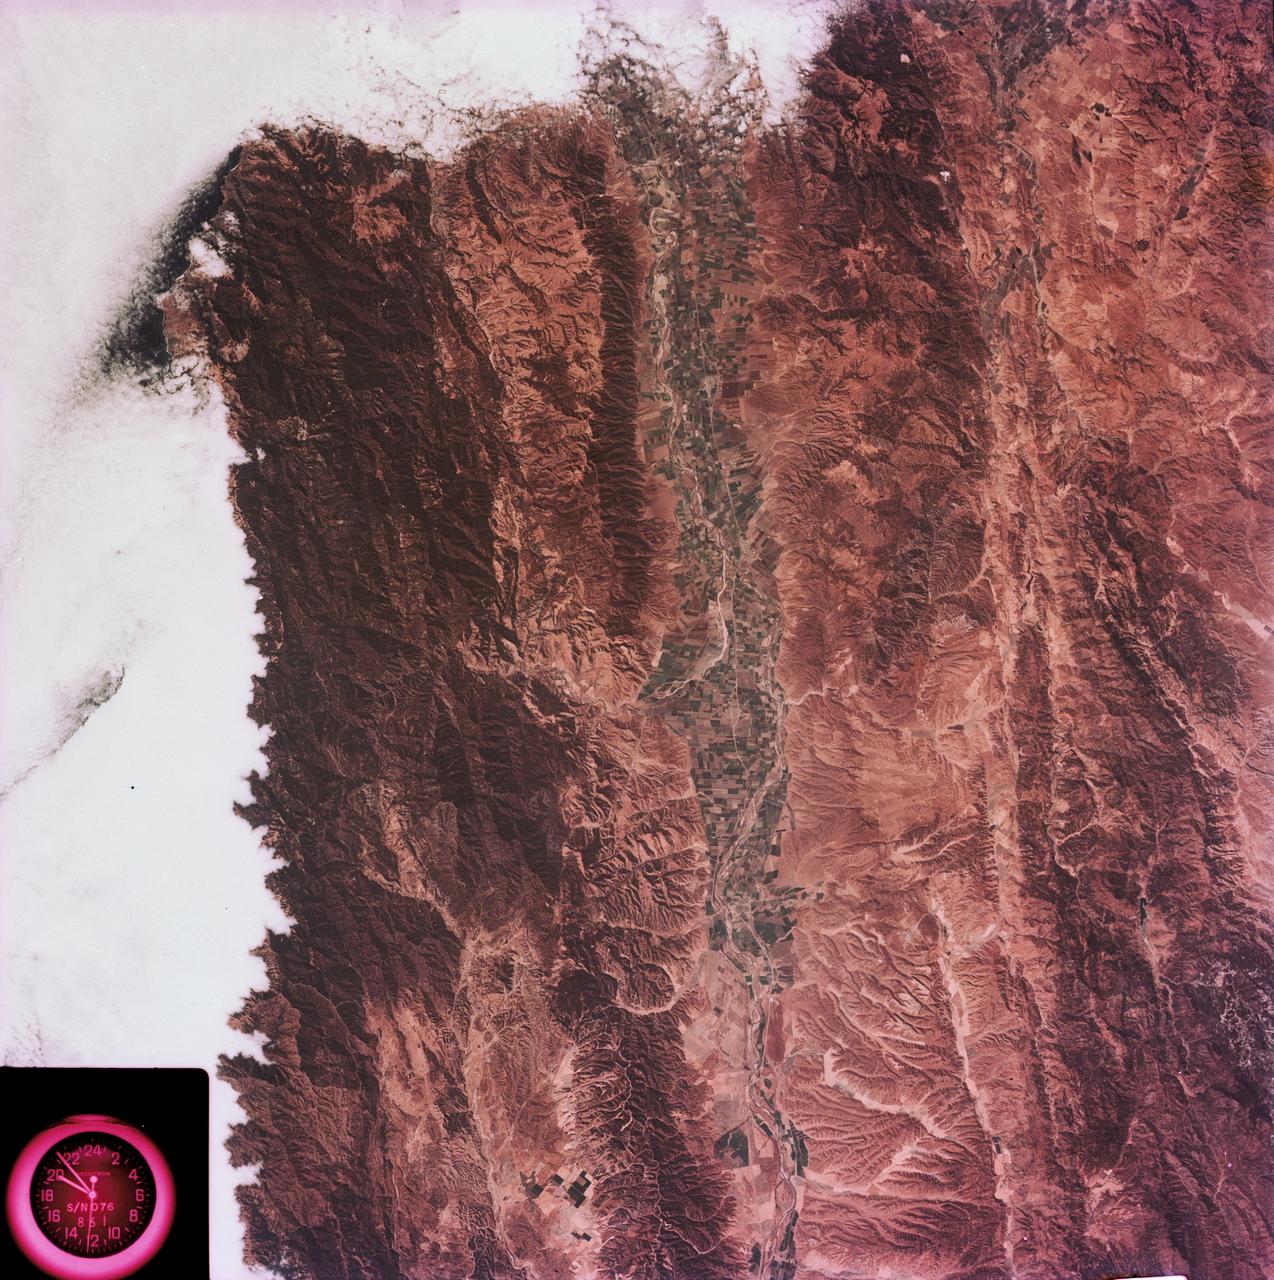
SL3-88-004 (July-September 1973) --- A vertical view of the Salinas River Valley area south of Monterey Bay, California area is seen in this Skylab 3 Earth Resources Experiments Package S190-B (five-inch Earth terrain camera) photograph taken from the Skylab space station in Earth orbit. The valley is an irrigated agricultural area, and is indicated by the dark-green and light-gray rectangular patterns in the centre of the picture. The city of Salinas is barely visible under the cloud cover at the top (north) end of the valley. The dark mass on the left (west) side of the valley is the Santa Lucia mountain range. The Big Sur area is on the left and partly covered by clouds. The Diablo Range forms the dark mass in the lower right (southeast) corner of the photograph. The town of Hollister is the gray area in the dark-green rectangular farm tracts which occupy the floor of the San Benito Valley in the upper right (northeast) corner of the photograph. The Salinas River flows northwestward toward Monterey Bay. The towns of Soledad, Greenfield and King City appear as gray areas along U.S. 101 in the Salinas Valley. The geology of the area is complex, and has been racked by several earthquakes resulting from movement along the San Andreas and subsidiary faults. Here, the surface expression of the San Andreas Fault can be traced from a point just west of Hollister at the contrast of dark brown and tan to a point about one inch left of the lower right (southeast) corner of the picture. Subsidiary faults are indicated by the curving trend of the rocks along the right side. The photograph will provide detailed information on land use patterns (Dr. R. Colwell, University of California, Berkeley) and fault tectonics (Dr. P. Merifield, Earth Science Res., Inc. and Dr. M. Abdel-Gawad, Rockwell International). Federal agencies participating with NASA on the EREP project are the Departments of Agriculture, Commerce, Interior, the Environmental Protection Agency and the Corps of Engineers. All EREP photography is available to the public through the Department of Interior’s Earth Resources Observations Systems Data Center, Sioux Falls, South Dakota, 57198. Photo credit: NASA

SL3-33-156 (July-September 1973) --- A near vertical view of the Florence, Italy area as photographed from Earth orbit by one of the Itek-furnished S190-A Multispectral Photographic Facility Experiment aboard the Skylab space station. The view extends from the Ligurian Sea, an extension of the Mediterranean Sea, across the Apennine Mountains to the Po River Valley. Florence (Firenze) is near the center of the land mass. The mouth of the Arno River is at the center of the coastline. The city of Leghorn (Livorno) is on the coast just south of the Arno River. This picture was taken with type 2443 infrared color film. The S190-A experiment is part of the Skylab Earth Resources Experiments Package. Federal agencies participating with NASA on the EREP project are the Department of Agriculture, Commerce, Interior, the Environmental Protection Agency and the Corps of Engineers. All EREP photography is available to the public through the Department of Interior?s Earth Resources Observations Systems Data Center, Sioux Falls, South Dakota, 57198. Photo credit: NASA
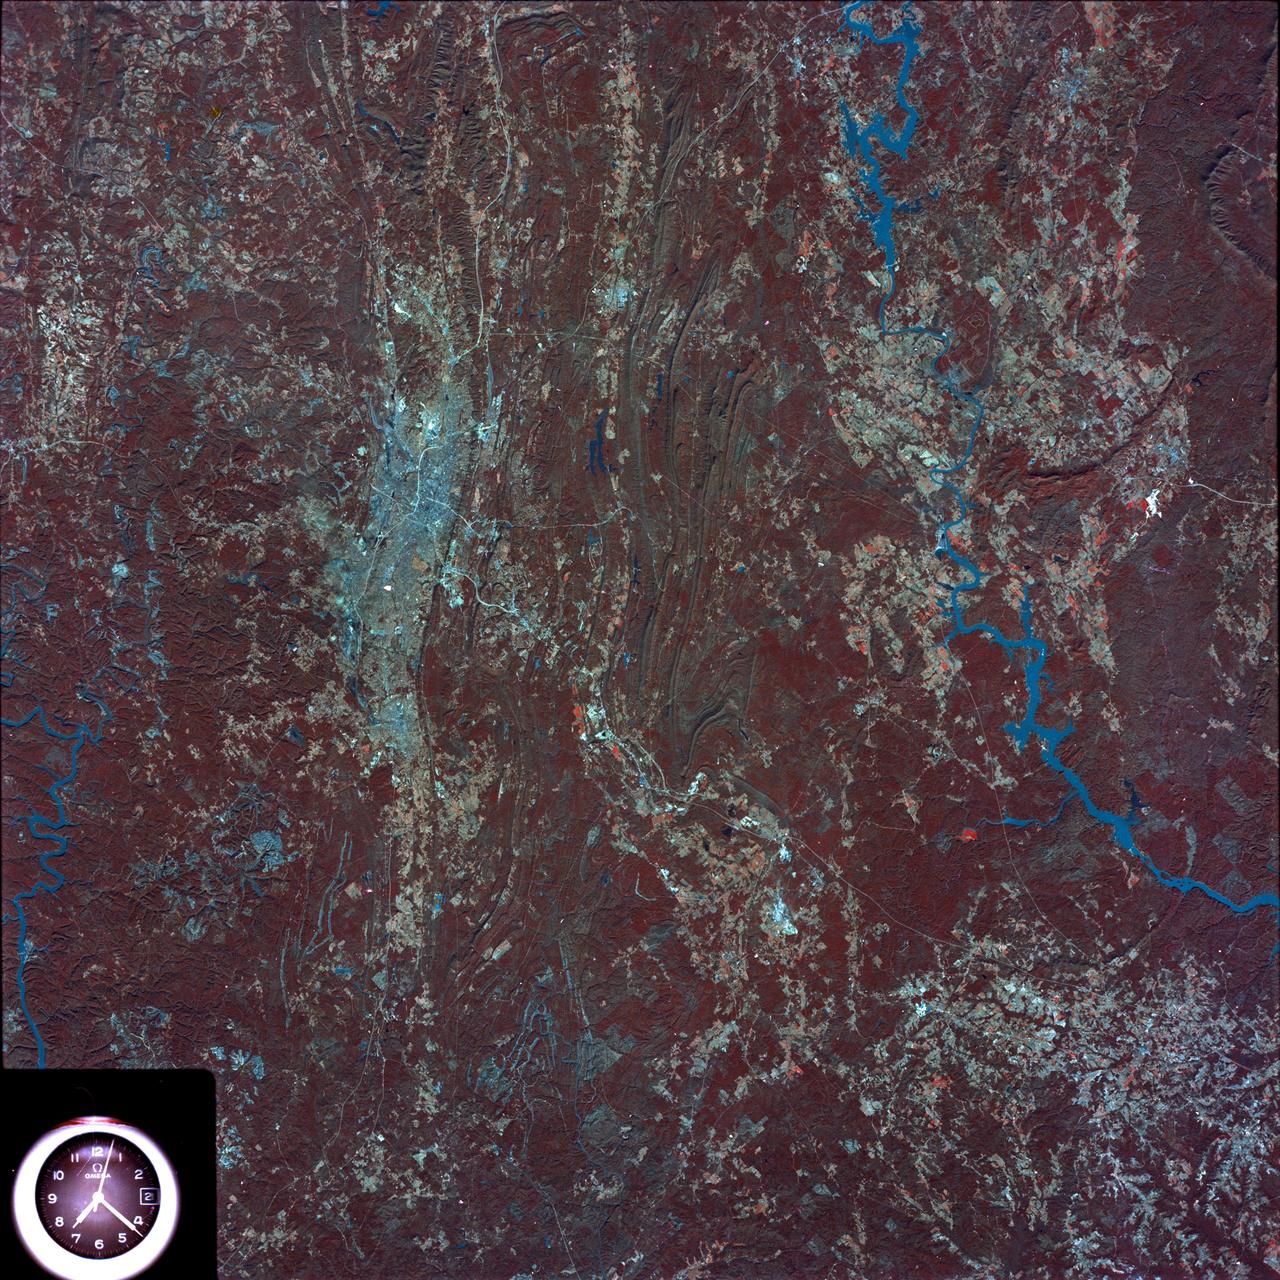
SL4-93-153 (February 1974) --- A vertical view of the Birmingham and central Alabama area is seen in this Skylab 4 Earth Resources Experiments Package S190-B (five-inch earth terrain camera) infrared photographed taken from the Skylab space station in Earth orbit. Illustrated here is the utility of color infrared film in depicting distribution of living vegetation in the 3,600 square mile Birmingham region. The Birmingham industrial complex, with a population of nearly 850,000, is the light gray area nestled in the valley between the northeast-trending ridges that are prominent topographic features in the southern Appalachian Mountains. The narrow ridges and adjacent valleys reflect folded and faulted sedimentary rocks, indicating the complex geological history of the region. Two major rivers and several reservoirs are easily distinguished in this photograph. Bankhand Lake, formed by a dam on the Black Warrior River, appears as bright blue west of Birmingham. Two lakes are formed by dams on the Goosa River east of Birmingham. Federal and state highways appear as thin white lines and are easily identified. Interstate 65 to Montgomery is the prominent white line extending southward from Birmingham. Power line clearings are visible in the center of the picture along the Goosa River, and can be traced northwestward to northern parts of Birmingham. The predominant deep red color of the picture is due to the reflections from living vegetation. In contrast are the light tan areas that commonly occur as rectangular patterns in the east part of the photograph and represent mature agricultural crops or grazing lands. Analysis of the photographic data from the earth terrain camera will be conducted by Dr. H. Jayroe of the Marshall Space Flight Center in developing analytical techniques. All EREP photography is available to the public through the Department of Interior's Earth Resources Observations Systems Data Center, Sioux Falls, South Dakota, 57198. Photo credit: NASA
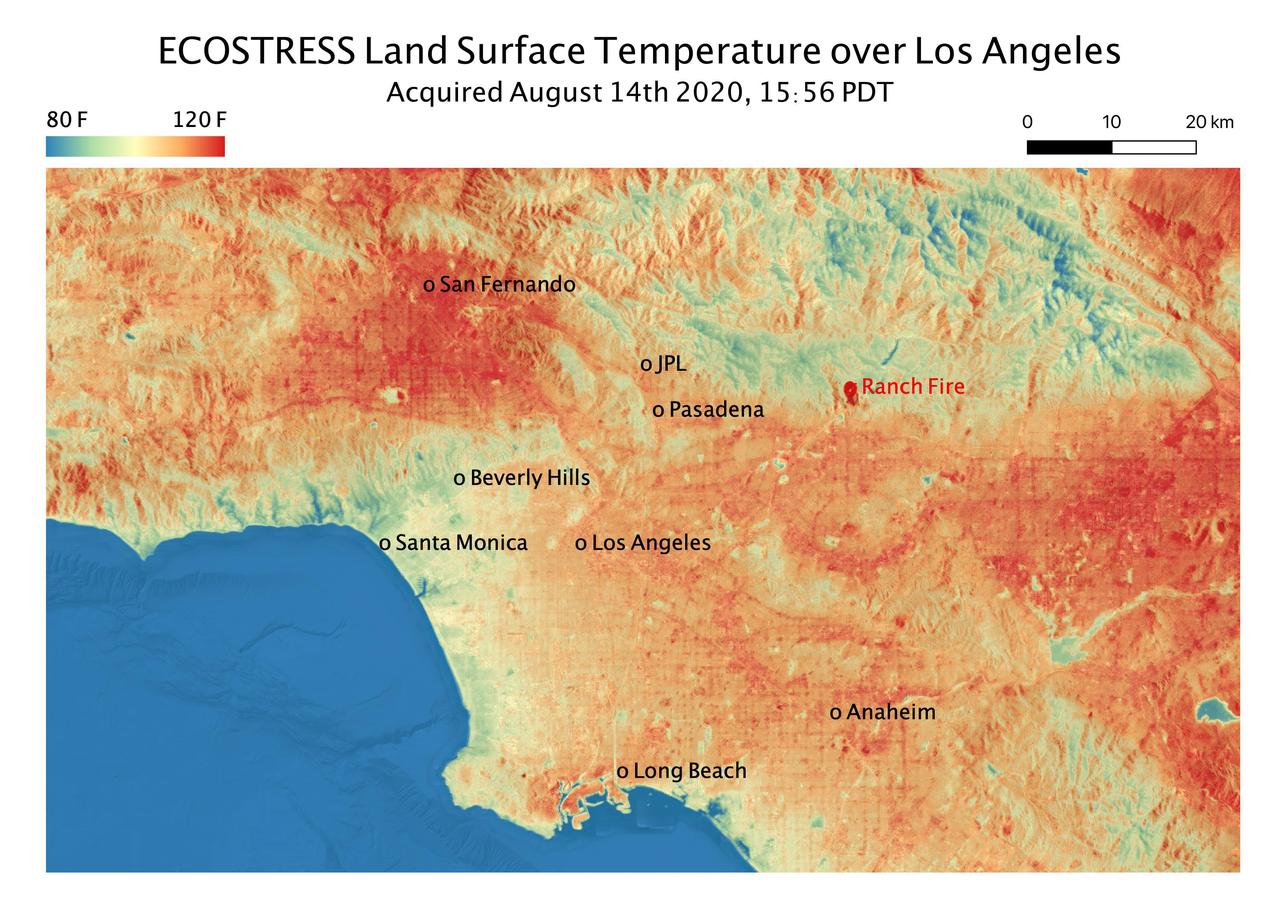
This temperature map shows the land surface temperatures throughout Los Angeles County on Aug. 14, 2020. The observation was made possible by NASA's Ecosystem Spaceborne Thermal Radiometer Experiment on Space Station (ECOSTRESS), which measured a peak land surface temperature in the San Fernando Valley, northwest of downtown Los Angeles, of 128.3 degrees Fahrenheit (53.5 degrees Celsius). ECOSTRESS collected this data as the space station passed over California at about 3:56 p.m. PDT (6:56 p.m. EDT) during a record-breaking heat wave that gripped the region. The Ranch fire, that burned near the city of Azuza was also detected by ECOSTRESS. With a resolution of about 77 by 77 yards (70 by 70 meters), the image enables the study of surface-temperature conditions down to the size of a football field. The hottest temperatures are shown in dark red, with the coolest temperatures in blue. ECOSTRESS measures the temperature of plants as they heat up when they run out of water. But it can also measure and track heat-related phenomena like heat waves, fires, and volcanoes. https://photojournal.jpl.nasa.gov/catalog/PIA23786
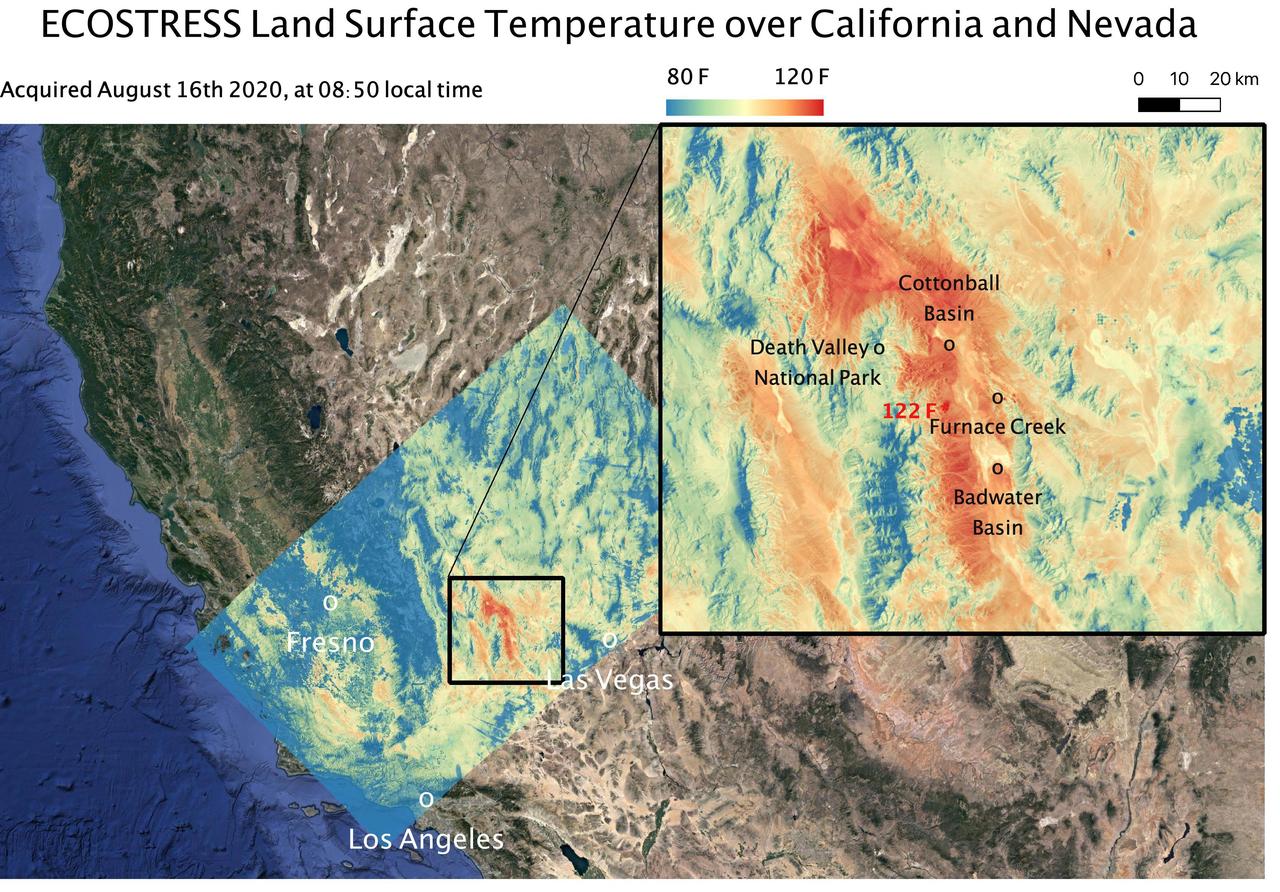
This temperature map shows the land surface temperatures around Death Valley in California's Mojave Desert on Aug. 16, 2020. The observation was made possible by NASA's Ecosystem Spaceborne Thermal Radiometer Experiment on Space Station (ECOSTRESS), which measured a peak land surface temperature of 122.52 degrees Fahrenheit (50.29 degrees Celsius) near Furnace Creek. ECOSTRESS collected this data when the space station passed over California at about 8:50 a.m. PDT (11:50 a.m. EDT) during a record-breaking heat wave that gripped the region. With a resolution of about 77 by 77 yards (70 by 70 meters), the image enables the study of surface-temperature conditions down to the size of a football field. The hottest temperatures are shown in dark red, with the coolest temperatures in blue. ECOSTRESS measures the temperature of plants as they heat up when they run out of water. But it can also measure and track heat-related phenomena like heat waves, fires, and volcanoes. https://photojournal.jpl.nasa.gov/catalog/PIA23787
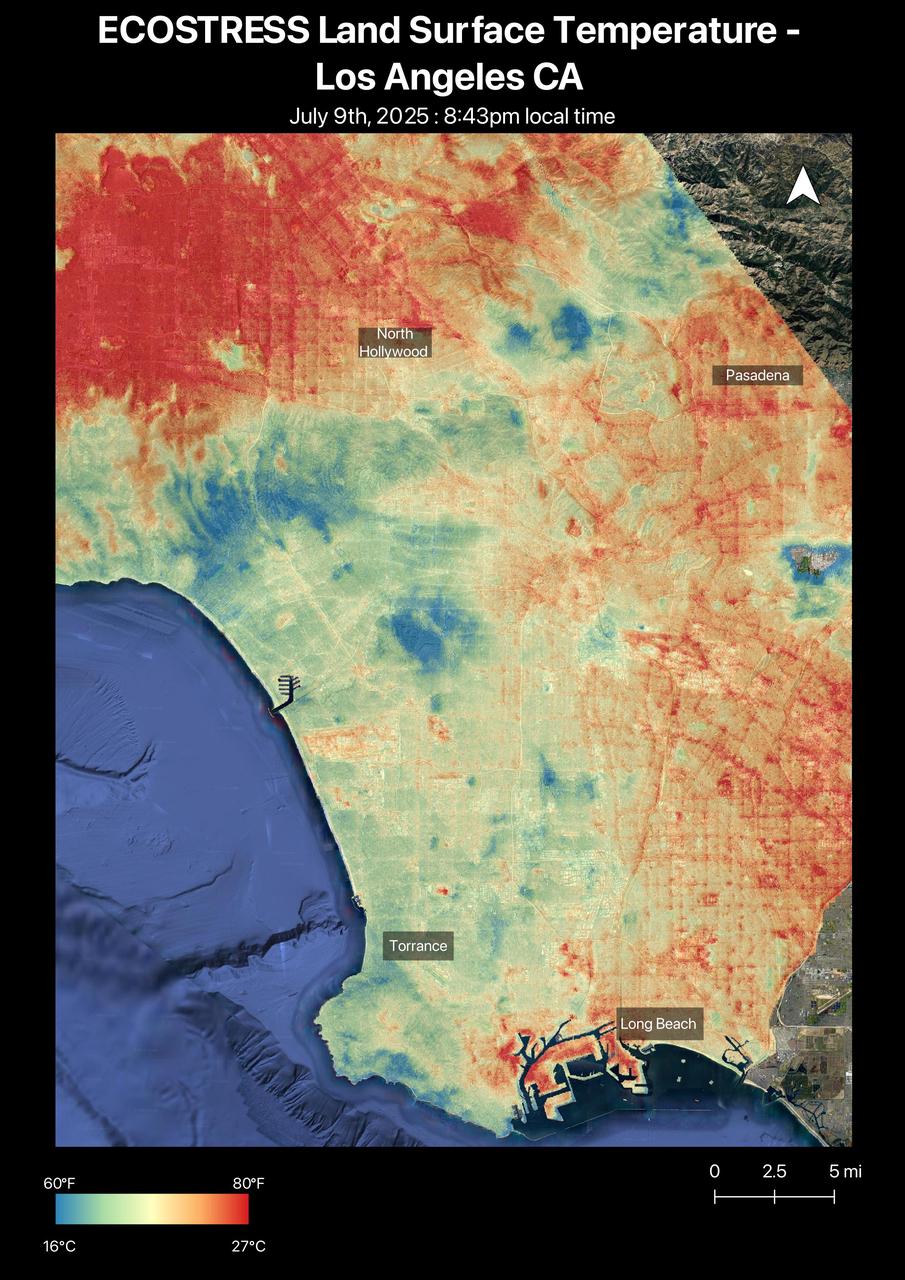
A short-lived heat wave that hit the Los Angeles area the week of July 7, 2025, was the first of summer. The heat lingered into the evening hours, as captured by NASA's Ecosystem Spaceborne Thermal Radiometer Experiment on Space Station (ECOSTRESS) instrument. By nearly 8:45 p.m. local time July 9, surface temperatures in the San Fernando Valley were still over 80 degrees Fahrenheit (27 degrees Celsius). The ECOSTRESS sensor recorded similar temperatures for downtown Pasadena (Figure A) and parts of Altadena, east of NASA's Jet Propulsion Laboratory, which manages the mission. In these data visualizations, dark red indicates higher temperatures, while areas in blue and green are cooler. Coastal regions remained significantly cooler than inland areas. The ECOSTRESS instrument measures thermal infrared emissions from Earth's surface. This enables researchers to monitor plant health, the progress of wildfires, land surface temperatures, and the burn risk to people from hot surfaces such as asphalt. Land surface temperatures are hotter than air temperatures during the day. Air temperatures, which are measured out of direct sunlight, are usually what meteorologists report in a weather forecast. https://photojournal.jpl.nasa.gov/catalog/PIA26651
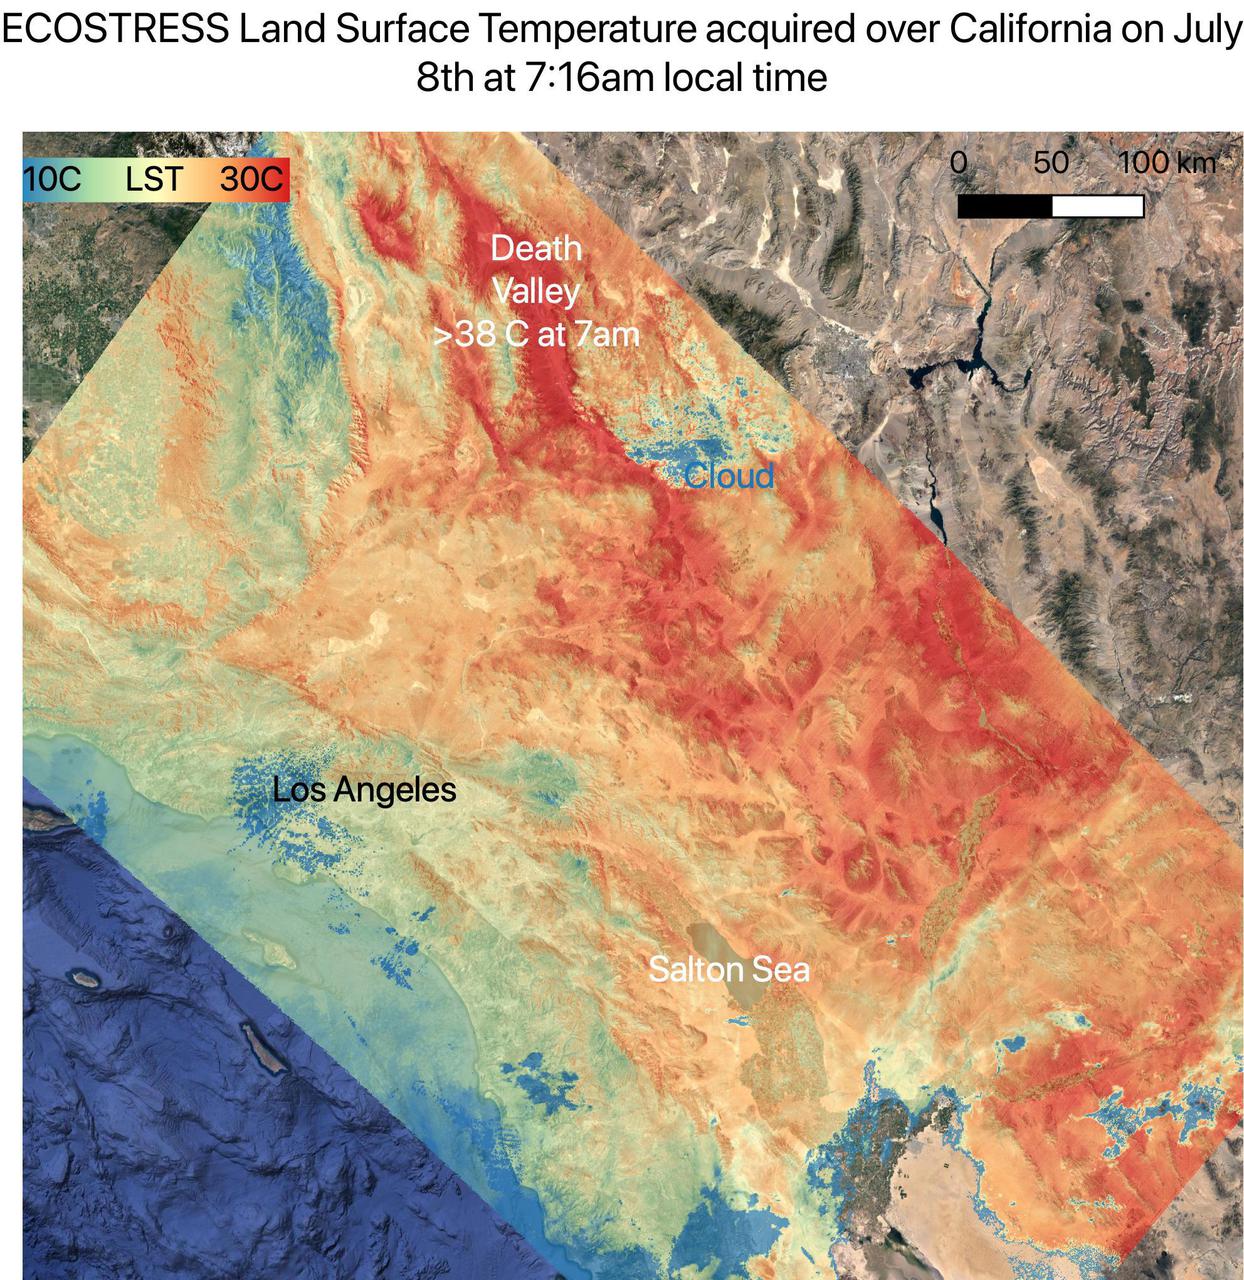
On July 8, NASA's ECOsystem Spaceborne Thermal Radiometer Experiment on Space Station (ECOSTRESS) instrument captured ground surface temperature data over California. In the image, areas in red – including Death Valley – had surpassed 86 degrees Fahrenheit (30 degrees Celsius) by 7:16 a.m. local time, well above average ground surface temperatures for the area. Tasked with detecting plant water use and stress, ECOSTRESS's primary mission is to measure the temperature of plants heating up as they run out of water. But it can also measure and track heat-related phenomena like heat waves, wildfires, and volcanoes. ECOSTRESS observations have a spatial resolution of about 77 by 77 yards (70 by 70 meters), which enables researchers to study surface-temperature conditions down to the size of a football field. Due to the space station's unique orbit, the mission can acquire images of the same regions at different times of the day, as opposed to crossing over each area at the same time of day like satellites in other orbits do. This is advantageous when monitoring plant stress in the same area throughout the day, for example. https://photojournal.jpl.nasa.gov/catalog/PIA23694
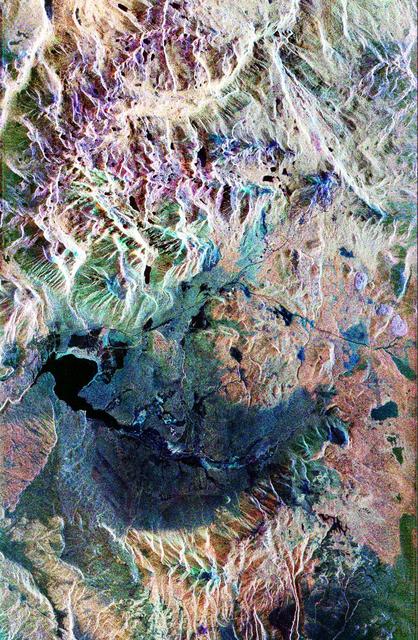
This false-color composite radar image of the Mammoth Mountain area in the Sierra Nevada Mountains, California, was acquired by the Spaceborne Imaging Radar-C and X-band Synthetic Aperture Radar aboard the space shuttle Endeavour on its 67th orbit on October 3, 1994. The image is centered at 37.6 degrees north latitude and 119.0 degrees west longitude. The area is about 39 kilometers by 51 kilometers (24 miles by 31 miles). North is toward the bottom, about 45 degrees to the right. In this image, red was created using L-band (horizontally transmitted/vertically received) polarization data; green was created using C-band (horizontally transmitted/vertically received) polarization data; and blue was created using C-band (horizontally transmitted and received) polarization data. Crawley Lake appears dark at the center left of the image, just above or south of Long Valley. The Mammoth Mountain ski area is visible at the top right of the scene. The red areas correspond to forests, the dark blue areas are bare surfaces and the green areas are short vegetation, mainly brush. The purple areas at the higher elevations in the upper part of the scene are discontinuous patches of snow cover from a September 28 storm. New, very thin snow was falling before and during the second space shuttle pass. In parallel with the operational SIR-C data processing, an experimental effort is being conducted to test SAR data processing using the Jet Propulsion Laboratory's massively parallel supercomputing facility, centered around the Cray Research T3D. These experiments will assess the abilities of large supercomputers to produce high throughput Synthetic Aperture Radar processing in preparation for upcoming data-intensive SAR missions. The image released here was produced as part of this experimental effort. http://photojournal.jpl.nasa.gov/catalog/PIA01746
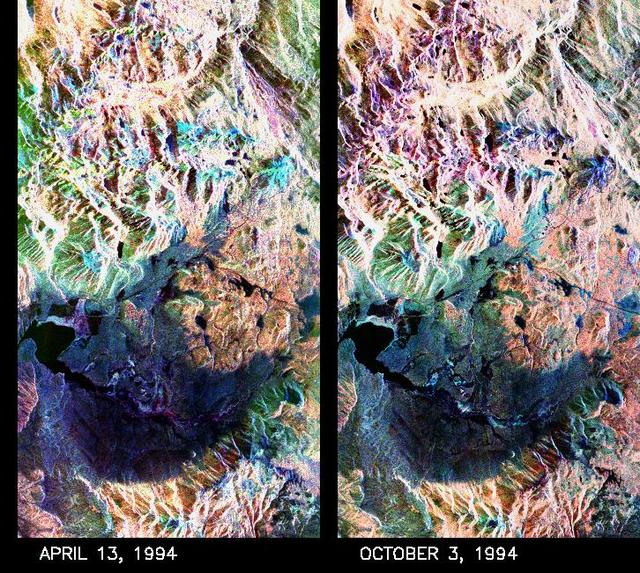
These two false-color composite images of the Mammoth Mountain area in the Sierra Nevada Mountains, Calif., show significant seasonal changes in snow cover. The image at left was acquired by the Spaceborne Imaging Radar-C and X-band Synthetic Aperture Radar aboard the space shuttle Endeavour on its 67th orbit on April 13, 1994. The image is centered at 37.6 degrees north latitude and 119 degrees west longitude. The area is about 36 kilometers by 48 kilometers (22 miles by 29 miles). In this image, red is L-band (horizontally transmitted and vertically received) polarization data; green is C-band (horizontally transmitted and vertically received) polarization data; and blue is C-band (horizontally transmitted and received) polarization data. The image at right was acquired on October 3, 1994, on the space shuttle Endeavour's 67th orbit of the second radar mission. Crowley Lake appears dark at the center left of the image, just above or south of Long Valley. The Mammoth Mountain ski area is visible at the top right of the scene. The red areas correspond to forests, the dark blue areas are bare surfaces and the green areas are short vegetation, mainly brush. The changes in color tone at the higher elevations (e.g. the Mammoth Mountain ski area) from green-blue in April to purple in September reflect changes in snow cover between the two missions. The April mission occurred immediately following a moderate snow storm. During the mission the snow evolved from a dry, fine-grained snowpack with few distinct layers to a wet, coarse-grained pack with multiple ice inclusions. Since that mission, all snow in the area has melted except for small glaciers and permanent snowfields on the Silver Divide and near the headwaters of Rock Creek. On October 3, 1994, only discontinuous patches of snow cover were present at very high elevations following the first snow storm of the season on September 28, 1994. For investigations in hydrology and land-surface climatology, seasonal snow cover and alpine glaciers are critical to the radiation and water balances. SIR-C/X-SAR is a powerful tool because it is sensitive to most snowpack conditions and is less influenced by weather conditions than other remote sensing instruments, such as Landsat. In parallel with the operational SIR-C data processing, an experimental effort is being conducted to test SAR data processing using the Jet Propulsion Laboratory's massively parallel supercomputing facility, centered around the Cray Research T3D. These experiments will assess the abilities of large supercomputers to produce high throughput SAR processing in preparation for upcoming data-intensive SAR missions. The images released here were produced as part of this experimental effort. http://photojournal.jpl.nasa.gov/catalog/PIA01753