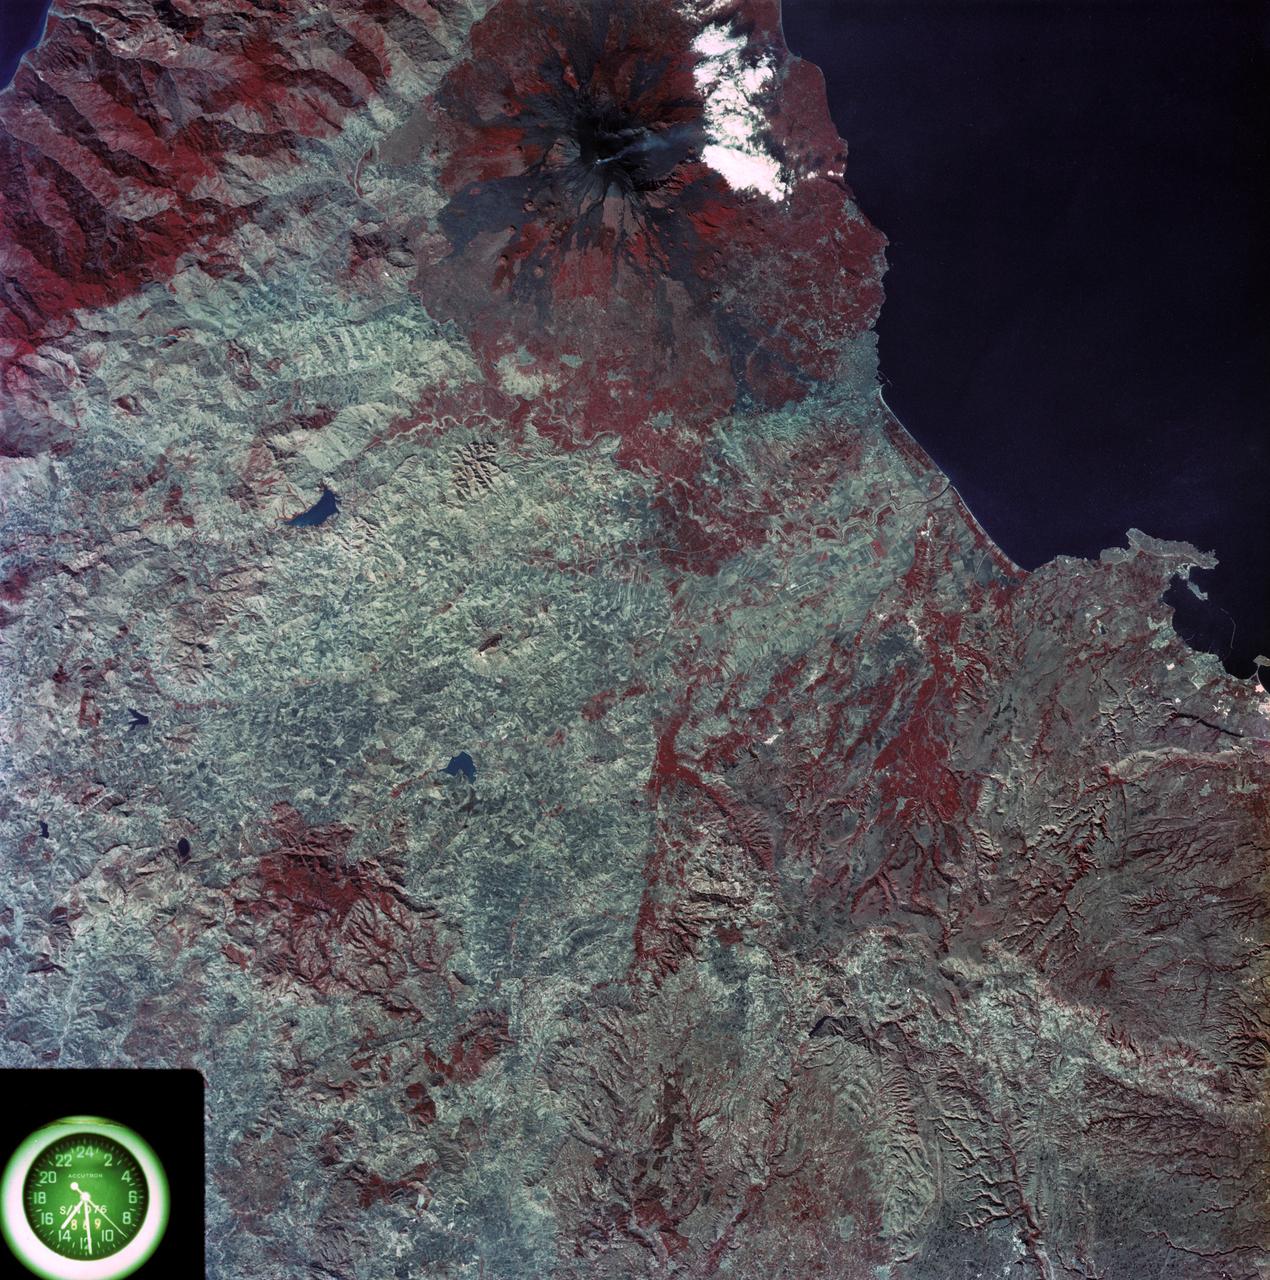
SL3-87-355 (July-September 1973) --- A vertical view of the eastern coast of Sicily area is seen in this Skylab 3 Earth Resources Experiments Package S190-B (five-inch earth terrain camera) infrared photograph taken from the Skylab space station in Earth orbit. Mount Etna, the highest volcano in Europe (10,958 feet), is still active as evidenced by the thin plume of smoke emanating from its crest. (The altitude is approximate because the height of the volcano changes with each eruption). On the flanks of Etna recent lava flows appear black in contrast to the older flows and volcanic debris that are red. Numerous small, circular cinder cones on the flanks represent sites of previous eruptions. Catania, on the Mediterranean coast south of Etna, is the largest of several cities and villages which appear as light-gray patches on the lower slopes of the volcano. Plano de Catania, south of the city of Catania, is outlined by polygonal light and dark agricultural tracts. Several lakes, the largest of which is Lake Pozzillo, show up as dark blue in the photograph. The unusual colors in the picture are due to the use of color infrared film in which vegetation appears red. This is very evident on the slopes of Etna, in the Monti Nebrodi area at upper let, and in the local areas in the lower part of the picture. Studies of Mount Etna and related volcanic features will be undertaken by Professor Roberto Cassinis of Servizio Geologio d?Italia, Rome. Federal agencies participating with NASA on the EREP project are the Departments of Agriculture, Commerce, Interior, the Environmental Protection Agency and the Corps of Engineers. All EREP photography is available to the public through the Department of Interior?s Earth Resources Observation Systems Data Center, Sioux Falls, South Dakota, 57198. Photo credit: NASA
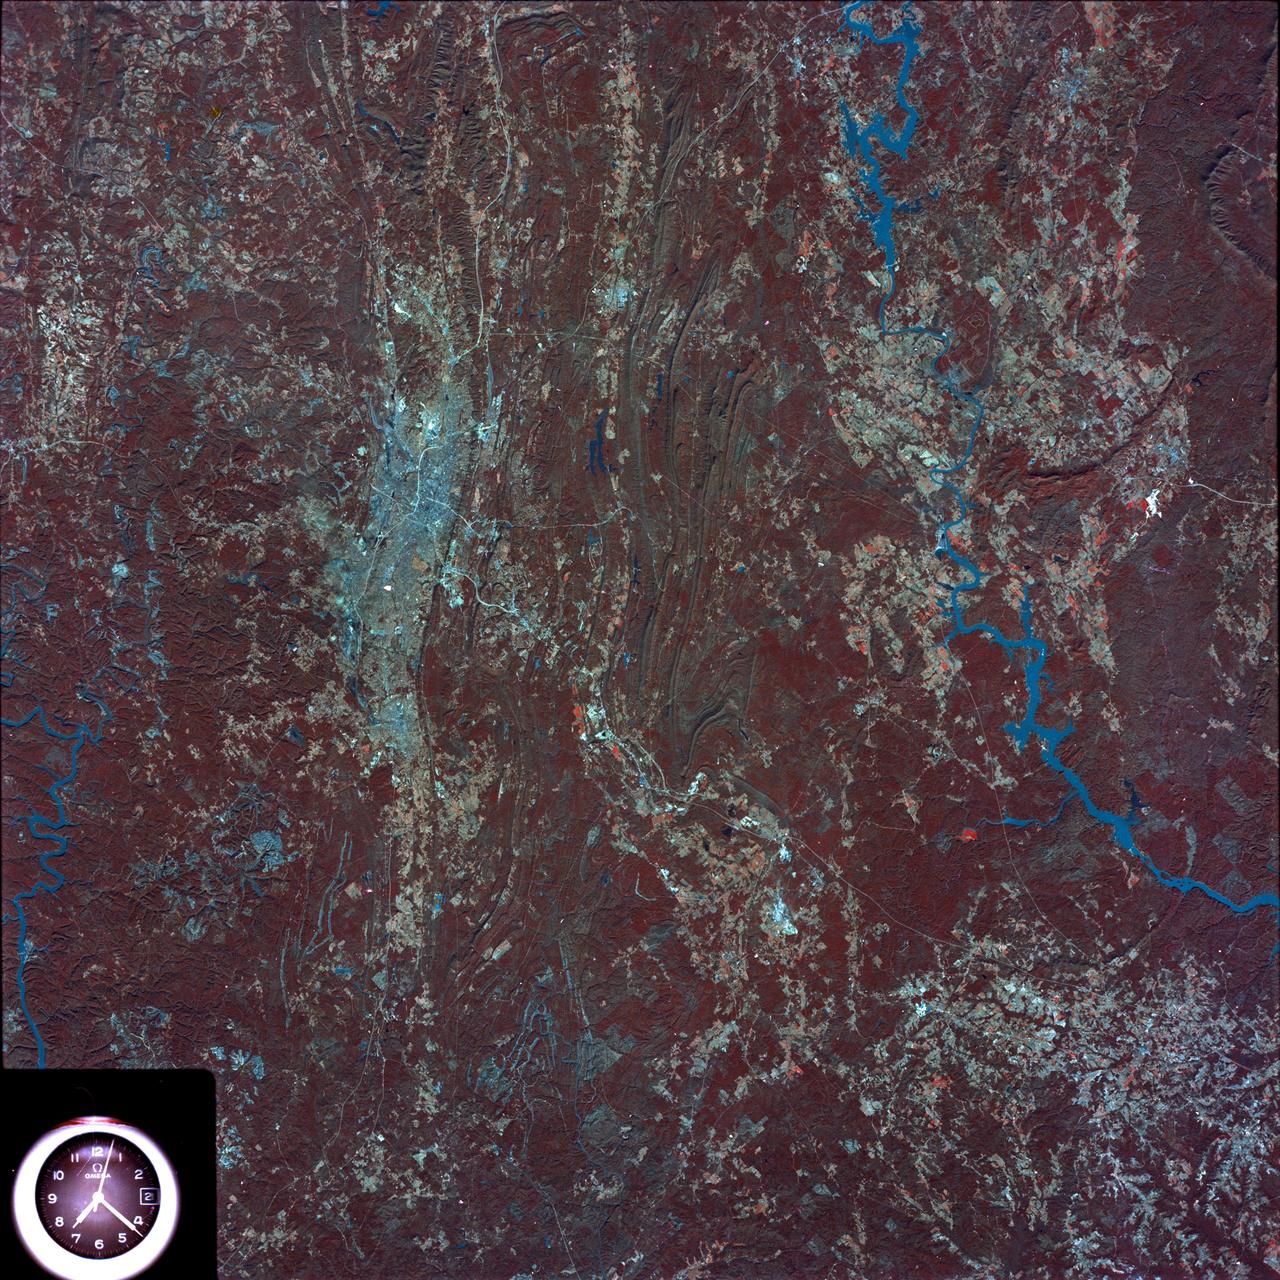
SL4-93-153 (February 1974) --- A vertical view of the Birmingham and central Alabama area is seen in this Skylab 4 Earth Resources Experiments Package S190-B (five-inch earth terrain camera) infrared photographed taken from the Skylab space station in Earth orbit. Illustrated here is the utility of color infrared film in depicting distribution of living vegetation in the 3,600 square mile Birmingham region. The Birmingham industrial complex, with a population of nearly 850,000, is the light gray area nestled in the valley between the northeast-trending ridges that are prominent topographic features in the southern Appalachian Mountains. The narrow ridges and adjacent valleys reflect folded and faulted sedimentary rocks, indicating the complex geological history of the region. Two major rivers and several reservoirs are easily distinguished in this photograph. Bankhand Lake, formed by a dam on the Black Warrior River, appears as bright blue west of Birmingham. Two lakes are formed by dams on the Goosa River east of Birmingham. Federal and state highways appear as thin white lines and are easily identified. Interstate 65 to Montgomery is the prominent white line extending southward from Birmingham. Power line clearings are visible in the center of the picture along the Goosa River, and can be traced northwestward to northern parts of Birmingham. The predominant deep red color of the picture is due to the reflections from living vegetation. In contrast are the light tan areas that commonly occur as rectangular patterns in the east part of the photograph and represent mature agricultural crops or grazing lands. Analysis of the photographic data from the earth terrain camera will be conducted by Dr. H. Jayroe of the Marshall Space Flight Center in developing analytical techniques. All EREP photography is available to the public through the Department of Interior's Earth Resources Observations Systems Data Center, Sioux Falls, South Dakota, 57198. Photo credit: NASA
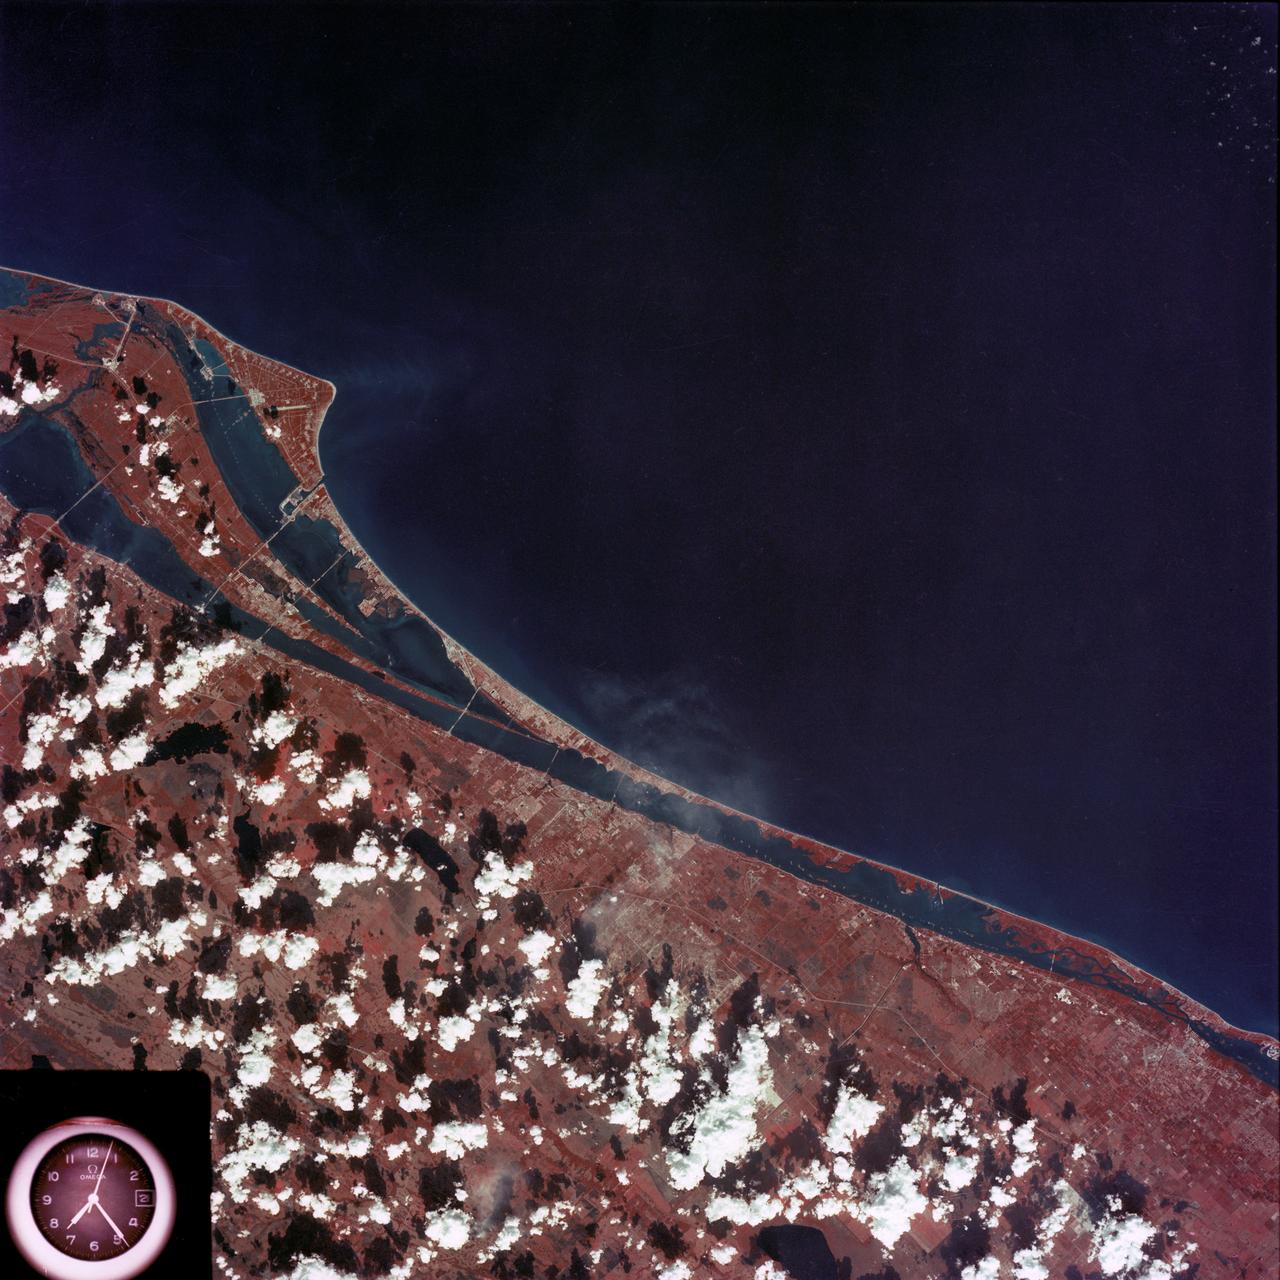
SL4-93-167 (February 1974) --- A vertical view of the Kennedy Space Center and the Florida Atlantic coast area is seen in this Skylab 4 Earth Resources Experiments Package S190-B (five-inch earth terrain camera) infrared photography taken from the Skylab space station in Earth orbit. This photograph shows the major land-ocean features of the Florida coast near Vero Beach northward to Cape Canaveral and the KSC complex. The launch pads for the Skylab missions are clearly visible. Identification of living vegetation is possible through the use of the color infrared film. Various shades of red portray differences in the vegetation such as shown in the patterns in the agricultural area near Vero Beach. In the Kennedy Space Center, the nearly continuous and uniform red color shows that most of the land areas are heavily vegetated. The white coastal beach areas are strongly contrasted to the red land and the blue Atlantic Ocean. Old dunal areas in KSC are visible on Merritt Island which is separated from the Launch areas by the Banana River and the mainland by the Indian River. Federal and state highways and numerous causeways over the rivers are easily identified. The Florida mainland is partly shadowed by small white clouds which cast a pronounced shadow to the east of each cloud indicated the Sun is west of solar noon. Federal agencies participating with NASA on the EREP project are the Departments of Agriculture, Commerce, Interior, the Environmental Protection Agency and the Core of Engineers. All EREP photography is available to the public through the Department of Interior's Earth Resources Observations Systems Data Center, Sioux Falls, South Dakota, 57198. Photo credit: NASA
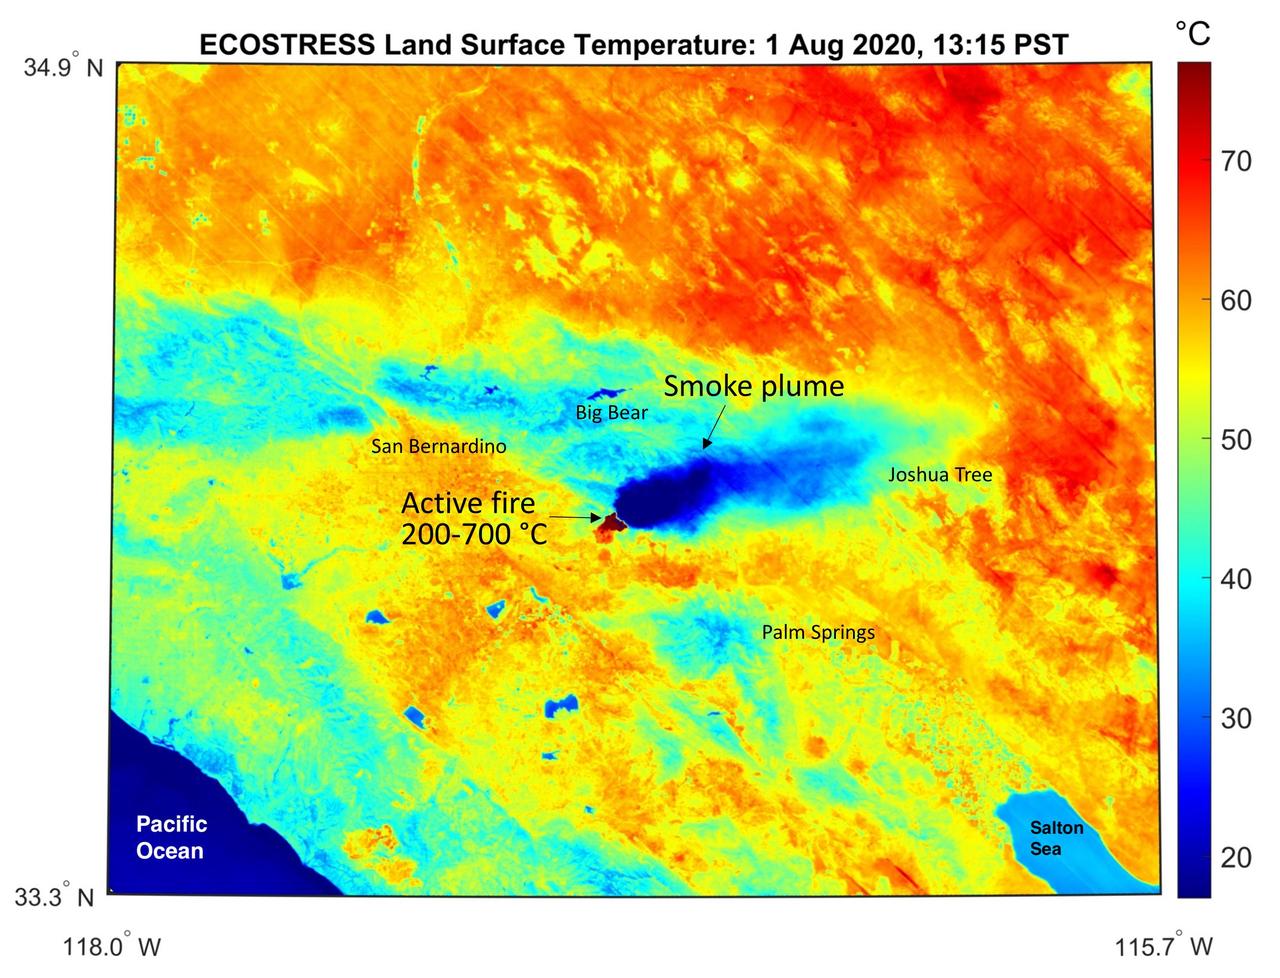
This temperature map shows the stressed and dry vegetation surrounding the Apple fire in Southern California on Aug. 1, 2020. The observation was made possible by NASA's Ecosystem Spaceborne Thermal Radiometer Experiment on Space Station (ECOSTRESS) that measured the temperature of the burn area and tracked the dark smoke plume drifting east from California to Arizona. ECOSTRESS collected this data when the space station passed over the region at about 1:15 p.m. PST on Saturday, Aug. 1, 2020, when the burn area was approximately 4,000 acres in size. Black smoke can be seen drifting east and over Joshua Tree National Park in the Mojave Desert. With a resolution of about 77 by 77 yards (70 by 70 meters), the image enables surface-temperature conditions down to the size of a football field to be studied. In the active burn area, temperatures of between 390-1290 F (200-700 C) were recorded, and in one pixel in the ECOSTRESS image of the burn zone, a peak temperature of 1387 F (753 C) was detected. Tasked with detecting plant water use and stress, ECOSTRESS measures the temperature of plants as they heat up when they run out of water. But it can also measure and track heat-related phenomena like fires, heat waves, and volcanoes. https://photojournal.jpl.nasa.gov/catalog/PIA23798
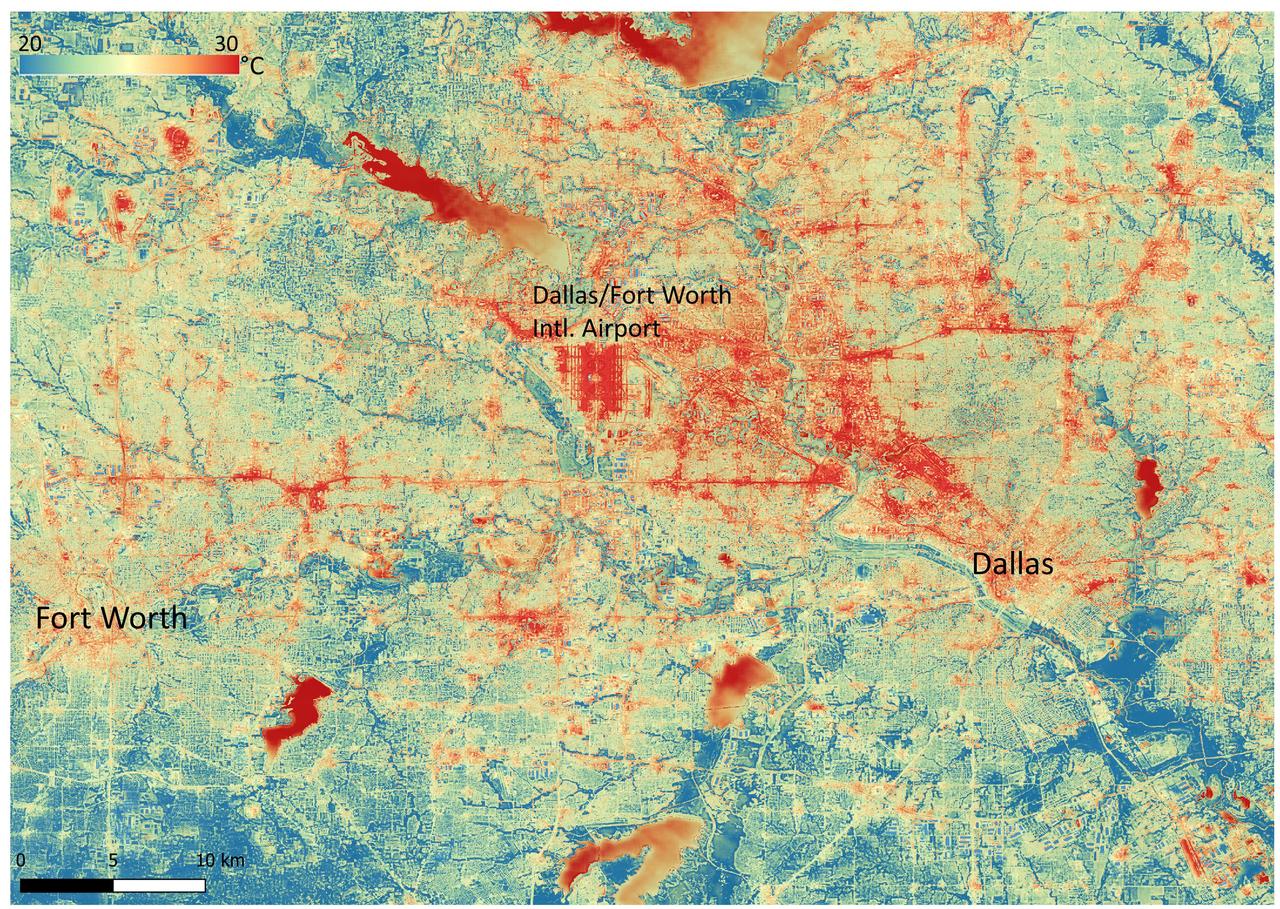
NASA's Ecosystem Spaceborne Thermal Radiometer Experiment on Space Station (ECOSTRESS) instrument recorded this image of ground surface temperatures in Dallas and Fort Worth, Texas, on June 20, 2022, at 7:17 a.m. Central Daylight Time. Even early in the day, manmade urban surfaces near city centers and transportation networks – streets, roads, and highways shown in red and orange – are warmer than the outskirts by up to 18 degrees Fahrenheit (10 degrees Celsius). The paved surfaces at Dallas/Fort Worth International Airport, shown in red near the top-center of the image, had the warmest temperatures, exceeding 86 F (30 C). Natural land surfaces such as vegetation and streams in rural areas, shown in green and blue, are cooler than nearby large bodies of water, shown in red and yellow, that tend to retain more heat overnight due to their higher heat capacity. Cities are usually warmer than open land because of human activities and the materials used in building and construction. Streets are often the hottest part of the built environment due to asphalt paving. Dark-colored surfaces absorb more heat from the Sun than lighter-colored ones; asphalt absorbs up to 95% of solar radiation and retains the heat for hours into the nighttime. ECOSTRESS measures the temperature of the ground, which is hotter than the air temperature during the daytime. The instrument launched to the space station in 2018. Its primary mission is to identify plants' thresholds for water use and water stress, giving insight into their ability to adapt to a warming climate. However, ECOSTRESS is also useful for documenting other heat-related phenomena, like patterns of heat absorption and retention. Its high-resolution images, with a pixel size of about 225 feet (70 meters) by 125 feet (38 meters), are a powerful tool for understanding our environment. https://photojournal.jpl.nasa.gov/catalog/PIA25422
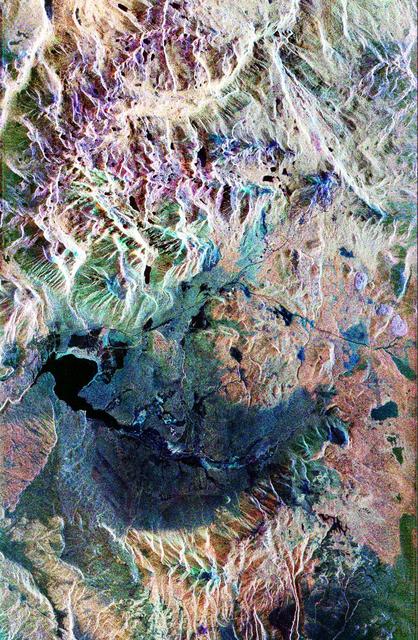
This false-color composite radar image of the Mammoth Mountain area in the Sierra Nevada Mountains, California, was acquired by the Spaceborne Imaging Radar-C and X-band Synthetic Aperture Radar aboard the space shuttle Endeavour on its 67th orbit on October 3, 1994. The image is centered at 37.6 degrees north latitude and 119.0 degrees west longitude. The area is about 39 kilometers by 51 kilometers (24 miles by 31 miles). North is toward the bottom, about 45 degrees to the right. In this image, red was created using L-band (horizontally transmitted/vertically received) polarization data; green was created using C-band (horizontally transmitted/vertically received) polarization data; and blue was created using C-band (horizontally transmitted and received) polarization data. Crawley Lake appears dark at the center left of the image, just above or south of Long Valley. The Mammoth Mountain ski area is visible at the top right of the scene. The red areas correspond to forests, the dark blue areas are bare surfaces and the green areas are short vegetation, mainly brush. The purple areas at the higher elevations in the upper part of the scene are discontinuous patches of snow cover from a September 28 storm. New, very thin snow was falling before and during the second space shuttle pass. In parallel with the operational SIR-C data processing, an experimental effort is being conducted to test SAR data processing using the Jet Propulsion Laboratory's massively parallel supercomputing facility, centered around the Cray Research T3D. These experiments will assess the abilities of large supercomputers to produce high throughput Synthetic Aperture Radar processing in preparation for upcoming data-intensive SAR missions. The image released here was produced as part of this experimental effort. http://photojournal.jpl.nasa.gov/catalog/PIA01746
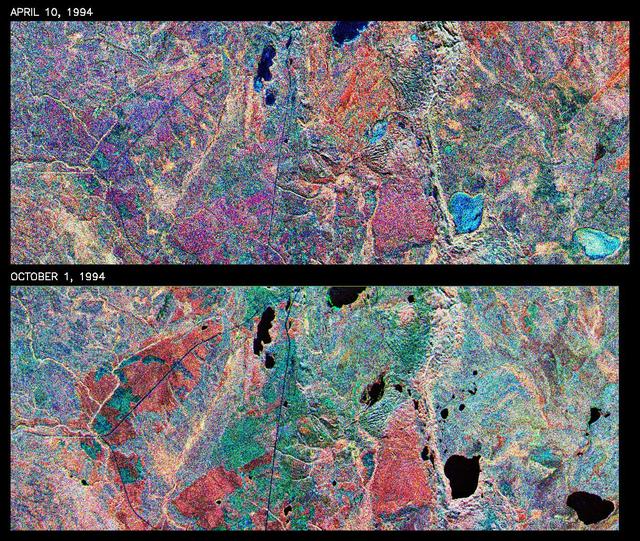
This is a comparison of images over Prince Albert, produced by NASA Spaceborne Imaging Radar-C and X-band Synthetic Aperture Radar aboard the space shuttle Endeavour on its 20th orbit on April 10, 1994. The area is centered at 53.91 degrees north latitude and 104.69 degrees west longitude and is located 40 kilometers (25 miles) north and 30 kilometers (18.5 miles) east of the town of Prince Albert in the Saskatchewan province of Canada. The image covers the area east of Candle Lake, between the gravel highway of 120 and west of highway 106. The area imaged is near the southern limit of the boreal forest. The boreal forest of North America is a continuous vegetation belt at high latitudes stretching across the continent from the Atlantic shoreline of central Labrador and then westward across Canada to the interior mountains and central coastal plains of Alaska. The forest is also part of a larger northern hemisphere circumpolar boreal forest belt. Coniferous trees dominate the entire forest but deciduous trees are also present. During the month of April, the forest experiences seasonal changes from a frozen condition to a thawed condition. The trees are completely frozen over the winter season and the forest floor is covered by snow. As the average temperature rises in the spring, the trees are thawed and the snow melts. This transition has an impact on the rate of moisture evaporation and release of carbon dioxide into the atmosphere. In late September and early October, the boreal forest experiences a relatively different seasonal change. At this time, the leaves on deciduous trees start changing color and dropping off. The soil and trees are quite often moist due to frequent rainfall and cloud cover. The evaporation of moisture and carbon dioxide into the atmosphere also diminishes at this time. SIR-C/X-SAR is sensitive to the moisture of soil and vegetation and can sense this freeze-thaw cycle and the summer-fall seasonal transition over forested areas in particular. Optical sensors, by contrast, are blind to these regions, which are perpetually obscured by thick cloud cover. These changes were detected by comparing the April and October color composite images of L-band data in red, C-band data in green and X-band (vertically received and transmitted) in blue. The changes in intensity of each color over lakes, various forest stands and clear cuts in the two images is striking. Lakes such as Lake Heiberg, Crabtree Lake and Williams Lake, in the right middle part of the image, are frozen in April (appearing in bright blue) and melted (appearing in black) in October. The higher intensity of blue over lakes in April is due to low penetration of the X-band (vertically received and transmitted) and the radar's high sensitivity to surface features. Forest stands also exhibit major changes between the two images. The red areas in the October image are old jack pine canopies that cause higher return at L-band because of their moist condition in late summer compared to their partially frozen condition in April (in purple). Similarly, in the areas near the middle of the image, where black spruce and mixed aspen and jack pine trees dominate, the contrast between blue in October and red and green in April is an indication that the top of the canopy (needles and branches) were frozen in April and moist in October. The changes due to deforestation by logging companies or natural fires can also be detected by comparing the images. For example, the small blue area near the intersection of Harding Road and Highway 120 is the result of logging which occurred after the April data was acquired. The surface area of clear cut is approximately 4 hectares, which is calculated from the high-resolution capability of the radar images and verified by scientists participating in field work during the mission. http://photojournal.jpl.nasa.gov/catalog/PIA01732
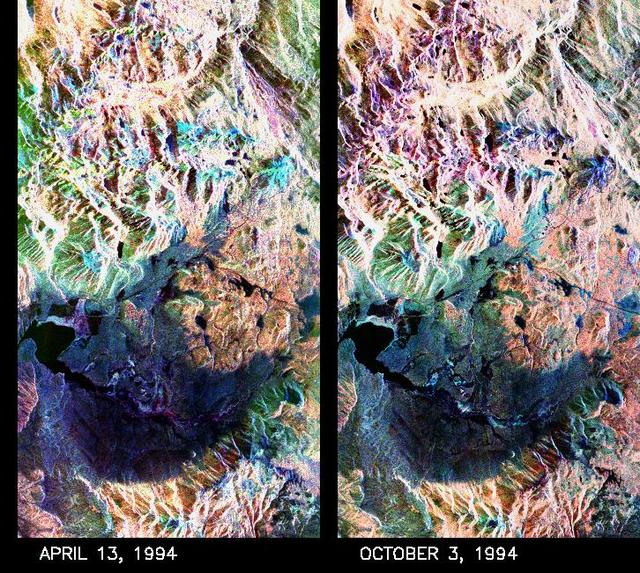
These two false-color composite images of the Mammoth Mountain area in the Sierra Nevada Mountains, Calif., show significant seasonal changes in snow cover. The image at left was acquired by the Spaceborne Imaging Radar-C and X-band Synthetic Aperture Radar aboard the space shuttle Endeavour on its 67th orbit on April 13, 1994. The image is centered at 37.6 degrees north latitude and 119 degrees west longitude. The area is about 36 kilometers by 48 kilometers (22 miles by 29 miles). In this image, red is L-band (horizontally transmitted and vertically received) polarization data; green is C-band (horizontally transmitted and vertically received) polarization data; and blue is C-band (horizontally transmitted and received) polarization data. The image at right was acquired on October 3, 1994, on the space shuttle Endeavour's 67th orbit of the second radar mission. Crowley Lake appears dark at the center left of the image, just above or south of Long Valley. The Mammoth Mountain ski area is visible at the top right of the scene. The red areas correspond to forests, the dark blue areas are bare surfaces and the green areas are short vegetation, mainly brush. The changes in color tone at the higher elevations (e.g. the Mammoth Mountain ski area) from green-blue in April to purple in September reflect changes in snow cover between the two missions. The April mission occurred immediately following a moderate snow storm. During the mission the snow evolved from a dry, fine-grained snowpack with few distinct layers to a wet, coarse-grained pack with multiple ice inclusions. Since that mission, all snow in the area has melted except for small glaciers and permanent snowfields on the Silver Divide and near the headwaters of Rock Creek. On October 3, 1994, only discontinuous patches of snow cover were present at very high elevations following the first snow storm of the season on September 28, 1994. For investigations in hydrology and land-surface climatology, seasonal snow cover and alpine glaciers are critical to the radiation and water balances. SIR-C/X-SAR is a powerful tool because it is sensitive to most snowpack conditions and is less influenced by weather conditions than other remote sensing instruments, such as Landsat. In parallel with the operational SIR-C data processing, an experimental effort is being conducted to test SAR data processing using the Jet Propulsion Laboratory's massively parallel supercomputing facility, centered around the Cray Research T3D. These experiments will assess the abilities of large supercomputers to produce high throughput SAR processing in preparation for upcoming data-intensive SAR missions. The images released here were produced as part of this experimental effort. http://photojournal.jpl.nasa.gov/catalog/PIA01753