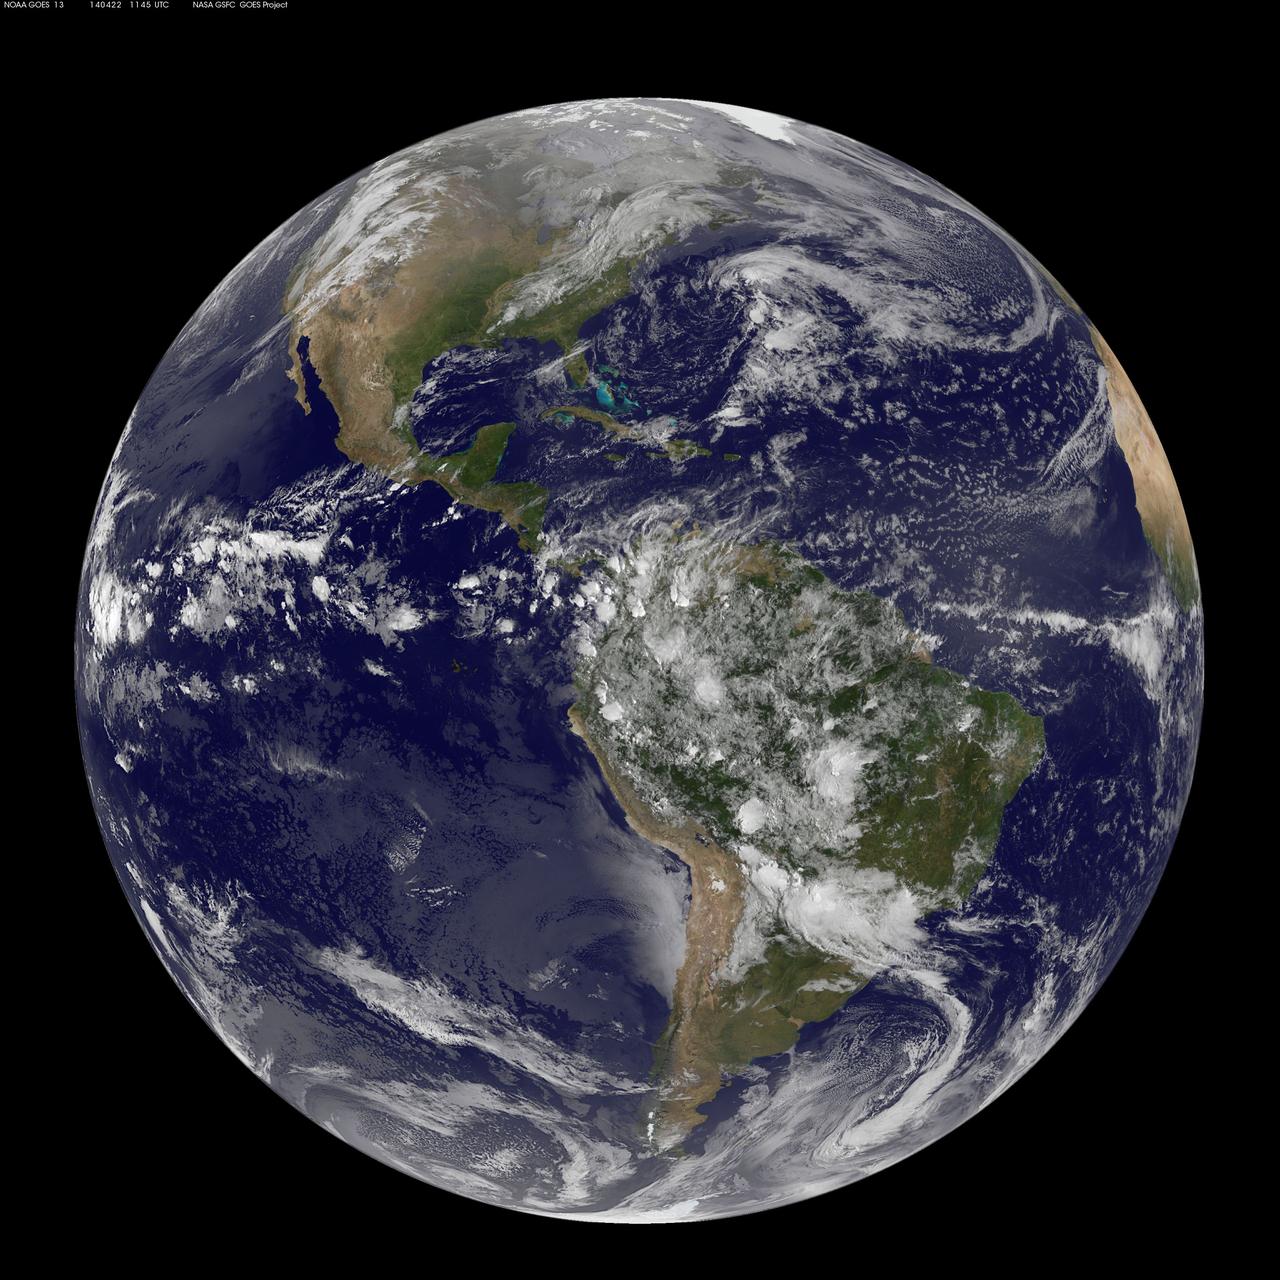
Today, April 22, 2014 is Earth Day, and what better way to celebrate than taking a look at our home planet from space. NOAA's GOES-East satellite captured this stunning view of the Americas on Earth Day, April 22, 2014 at 11:45 UTC/7:45 a.m. EDT. The data from GOES-East was made into an image by the NASA/NOAA GOES Project at NASA's Goddard Space Flight Center in Greenbelt, Md. In North America, clouds associated with a cold front stretch from Montreal, Canada, south through the Tennessee Valley, and southwest to southern Texas bringing rain east of the front today. A low pressure area in the Pacific Northwest is expected to bring rainfall in Oregon, Washington, Idaho, stretching into the upper Midwest, according to NOAA's National Weather Service. That low is also expected to bring precipitation north into the provinces of British Columbia and Alberta, Canada. Another Pacific low is moving over southern Nevada and the National Weather Service expects rain from that system to fall in central California, Nevada, and northern Utah. Near the equator, GOES imagery shows a line of pop up thunderstorms. Those thunderstorms are associated with the Intertropical Convergence Zone (ITCZ). The ITCZ encircles the Earth near the equator. In South America, convective (rapidly rising air that condenses and forms clouds) thunderstorms pepper Colombia, Venezuela, Ecuador, Peru, Bolivia, Paraguay and northwestern and southeastern Brazil. GOES satellites provide the kind of continuous monitoring necessary for intensive data analysis. Geostationary describes an orbit in which a satellite is always in the same position with respect to the rotating Earth. This allows GOES to hover continuously over one position on Earth's surface, appearing stationary. As a result, GOES provide a constant vigil for the atmospheric "triggers" for severe weather conditions such as tornadoes, flash floods, hail storms and hurricanes. For more information about GOES satellites, visit: <a href="http://www.goes.noaa.gov/" rel="nofollow">www.goes.noaa.gov/</a> or <a href="http://goes.gsfc.nasa.gov/" rel="nofollow">goes.gsfc.nasa.gov/</a> Rob Gutro NASA's Goddard Space Flight Center <b><a href="http://www.nasa.gov/audience/formedia/features/MP_Photo_Guidelines.html" rel="nofollow">NASA image use policy.</a></b> <b><a href="http://www.nasa.gov/centers/goddard/home/index.html" rel="nofollow">NASA Goddard Space Flight Center</a></b> enables NASA’s mission through four scientific endeavors: Earth Science, Heliophysics, Solar System Exploration, and Astrophysics. Goddard plays a leading role in NASA’s accomplishments by contributing compelling scientific knowledge to advance the Agency’s mission. <b>Follow us on <a href="http://twitter.com/NASAGoddardPix" rel="nofollow">Twitter</a></b> <b>Like us on <a href="http://www.facebook.com/pages/Greenbelt-MD/NASA-Goddard/395013845897?ref=tsd" rel="nofollow">Facebook</a></b> <b>Find us on <a href="http://instagram.com/nasagoddard?vm=grid" rel="nofollow">Instagram</a></b>
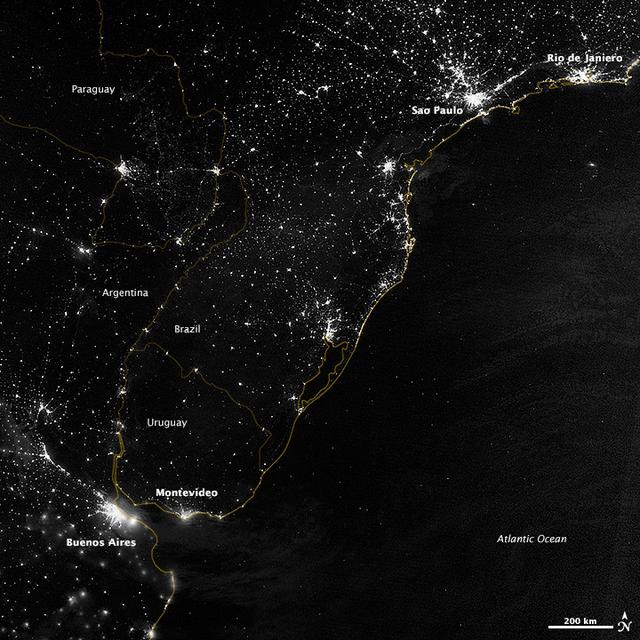
This image of part of the Atlantic coast of South America was acquired by the Suomi NPP satellite on the night of July 20, 2012. The image was made possible by the “day-night band” of the Visible Infrared Imaging Radiometer Suite (VIIRS), which detects light in a range of wavelengths from green to near-infrared and uses filtering techniques to observe dim signals such as city lights, gas flares, auroras, wildfires, and reflected moonlight. “Nothing tells us more about the spread of humans across the Earth than city lights,” says Chris Elvidge, who leads the Earth Observation Group at NOAA’s National Geophysical Data Center. Named for satellite meteorology pioneer Verner Suomi, NPP flies over any given point on Earth's surface twice each day at roughly 1:30 a.m. and p.m. The polar-orbiting satellite flies 824 kilometers (512 miles) above the surface, sending its data once per orbit to a ground station in Svalbard, Norway, and continuously to local direct broadcast users distributed around the world. Suomi NPP is managed by NASA with operational support from NOAA and its Joint Polar Satellite System, which manages the satellite's ground system. NASA Earth Observatory image by Jesse Allen and Robert Simmon, using VIIRS Day-Night Band data from the Suomi National Polar-orbiting Partnership. Suomi NPP is the result of a partnership between NASA, the National Oceanic and Atmospheric Administration, and the Department of Defense. Caption by Mike Carlowicz. Instrument: Suomi NPP - VIIRS Credit: <b><a href="http://www.earthobservatory.nasa.gov/" rel="nofollow"> NASA Earth Observatory</a></b> <b>Click here to view all of the <a href="http://earthobservatory.nasa.gov/Features/NightLights/" rel="nofollow"> Earth at Night 2012 images </a></b> <b>Click here to <a href="http://earthobservatory.nasa.gov/NaturalHazards/view.php?id=79822" rel="nofollow"> read more </a> about this image </b> <b><a href="http://www.nasa.gov/audience/formedia/features/MP_Photo_Guidelines.html" rel="nofollow">NASA image use policy.</a></b> <b><a href="http://www.nasa.gov/centers/goddard/home/index.html" rel="nofollow">NASA Goddard Space Flight Center</a></b> enables NASA’s mission through four scientific endeavors: Earth Science, Heliophysics, Solar System Exploration, and Astrophysics. Goddard plays a leading role in NASA’s accomplishments by contributing compelling scientific knowledge to advance the Agency’s mission. <b>Follow us on <a href="http://twitter.com/NASA_GoddardPix" rel="nofollow">Twitter</a></b> <b>Like us on <a href="http://www.facebook.com/pages/Greenbelt-MD/NASA-Goddard/395013845897?ref=tsd" rel="nofollow">Facebook</a></b> <b>Find us on <a href="http://instagram.com/nasagoddard?vm=grid" rel="nofollow">Instagram</a></b>
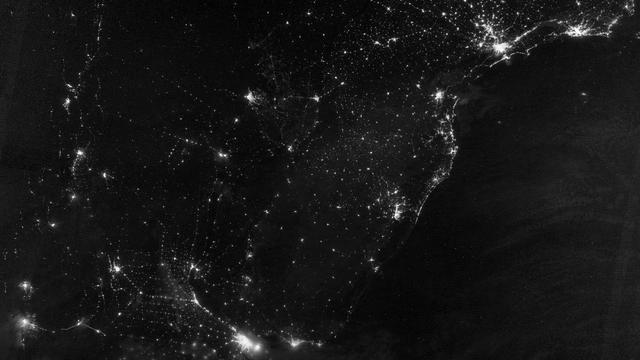
This image of part of the Atlantic coast of South America was acquired by the Suomi NPP satellite on the night of July 20, 2012. The image was made possible by the “day-night band” of the Visible Infrared Imaging Radiometer Suite (VIIRS), which detects light in a range of wavelengths from green to near-infrared and uses filtering techniques to observe dim signals such as city lights, gas flares, auroras, wildfires, and reflected moonlight. “Nothing tells us more about the spread of humans across the Earth than city lights,” says Chris Elvidge, who leads the Earth Observation Group at NOAA’s National Geophysical Data Center. Named for satellite meteorology pioneer Verner Suomi, NPP flies over any given point on Earth's surface twice each day at roughly 1:30 a.m. and p.m. The polar-orbiting satellite flies 824 kilometers (512 miles) above the surface, sending its data once per orbit to a ground station in Svalbard, Norway, and continuously to local direct broadcast users distributed around the world. Suomi NPP is managed by NASA with operational support from NOAA and its Joint Polar Satellite System, which manages the satellite's ground system. NASA Earth Observatory image by Jesse Allen and Robert Simmon, using VIIRS Day-Night Band data from the Suomi National Polar-orbiting Partnership. Suomi NPP is the result of a partnership between NASA, the National Oceanic and Atmospheric Administration, and the Department of Defense. Caption by Mike Carlowicz. Instrument: Suomi NPP - VIIRS Credit: <b><a href="http://www.earthobservatory.nasa.gov/" rel="nofollow"> NASA Earth Observatory</a></b> <b>Click here to view all of the <a href="http://earthobservatory.nasa.gov/Features/NightLights/" rel="nofollow"> Earth at Night 2012 images </a></b> <b>Click here to <a href="http://earthobservatory.nasa.gov/NaturalHazards/view.php?id=79822" rel="nofollow"> read more </a> about this image </b> <b><a href="http://www.nasa.gov/audience/formedia/features/MP_Photo_Guidelines.html" rel="nofollow">NASA image use policy.</a></b> <b><a href="http://www.nasa.gov/centers/goddard/home/index.html" rel="nofollow">NASA Goddard Space Flight Center</a></b> enables NASA’s mission through four scientific endeavors: Earth Science, Heliophysics, Solar System Exploration, and Astrophysics. Goddard plays a leading role in NASA’s accomplishments by contributing compelling scientific knowledge to advance the Agency’s mission. <b>Follow us on <a href="http://twitter.com/NASA_GoddardPix" rel="nofollow">Twitter</a></b> <b>Like us on <a href="http://www.facebook.com/pages/Greenbelt-MD/NASA-Goddard/395013845897?ref=tsd" rel="nofollow">Facebook</a></b> <b>Find us on <a href="http://instagram.com/nasagoddard?vm=grid" rel="nofollow">Instagram</a></b>
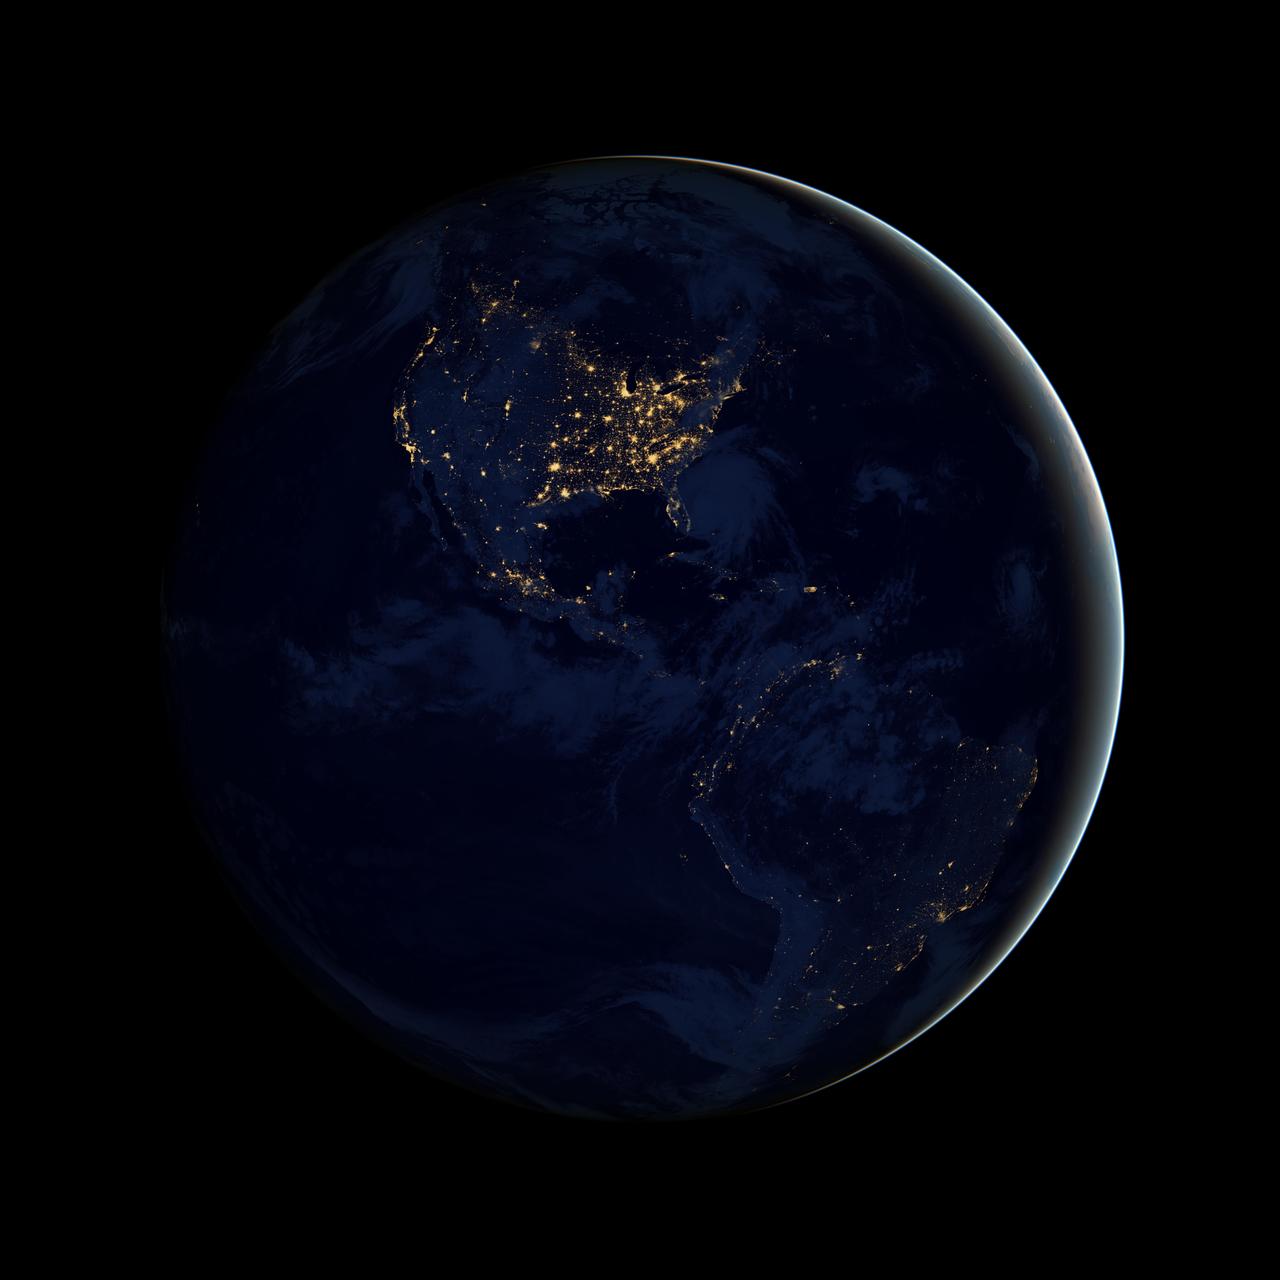
NASA image acquired April 18 - October 23, 2012 This image of North and South America at night is a composite assembled from data acquired by the Suomi NPP satellite in April and October 2012. The new data was mapped over existing Blue Marble imagery of Earth to provide a realistic view of the planet. The nighttime view was made possible by the new satellite’s “day-night band” of the Visible Infrared Imaging Radiometer Suite. VIIRS detects light in a range of wavelengths from green to near-infrared and uses filtering techniques to observe dim signals such as city lights, gas flares, auroras, wildfires, and reflected moonlight. In this case, auroras, fires, and other stray light have been removed to emphasize the city lights. “Artificial lighting is a excellent remote sensing observable and proxy for human activity,” says Chris Elvidge, who leads the Earth Observation Group at NOAA’s National Geophysical Data Center. Social scientists and demographers have used night lights to model the spatial distribution of economic activity, of constructed surfaces, and of populations. Planners and environmental groups have used maps of lights to select sites for astronomical observatories and to monitor human development around parks and wildlife refuges. Electric power companies, emergency managers, and news media turn to night lights to observe blackouts. Named for satellite meteorology pioneer Verner Suomi, NPP flies over any given point on Earth's surface twice each day at roughly 1:30 a.m. and p.m. The polar-orbiting satellite flies 824 kilometers (512 miles) above the surface, sending its data once per orbit to a ground station in Svalbard, Norway, and continuously to local direct broadcast users distributed around the world. The mission is managed by NASA with operational support from NOAA and its Joint Polar Satellite System, which manages the satellite's ground system. NASA Earth Observatory image by Robert Simmon, using Suomi NPP VIIRS data provided courtesy of Chris Elvidge (NOAA National Geophysical Data Center). Suomi NPP is the result of a partnership between NASA, NOAA, and the Department of Defense. Caption by Mike Carlowicz. Instrument: Suomi NPP - VIIRS Credit: <b><a href="http://www.earthobservatory.nasa.gov/" rel="nofollow"> NASA Earth Observatory</a></b> <b>Click here to view all of the <a href="http://earthobservatory.nasa.gov/Features/NightLights/" rel="nofollow"> Earth at Night 2012 images </a></b> <b>Click here to <a href="http://earthobservatory.nasa.gov/NaturalHazards/view.php?id=79787" rel="nofollow"> read more </a> about this image </b> <b><a href="http://www.nasa.gov/audience/formedia/features/MP_Photo_Guidelines.html" rel="nofollow">NASA image use policy.</a></b> <b><a href="http://www.nasa.gov/centers/goddard/home/index.html" rel="nofollow">NASA Goddard Space Flight Center</a></b> enables NASA’s mission through four scientific endeavors: Earth Science, Heliophysics, Solar System Exploration, and Astrophysics. Goddard plays a leading role in NASA’s accomplishments by contributing compelling scientific knowledge to advance the Agency’s mission. <b>Follow us on <a href="http://twitter.com/NASA_GoddardPix" rel="nofollow">Twitter</a></b> <b>Like us on <a href="http://www.facebook.com/pages/Greenbelt-MD/NASA-Goddard/395013845897?ref=tsd" rel="nofollow">Facebook</a></b> <b>Find us on <a href="http://instagram.com/nasagoddard?vm=grid" rel="nofollow">Instagram</a></b>
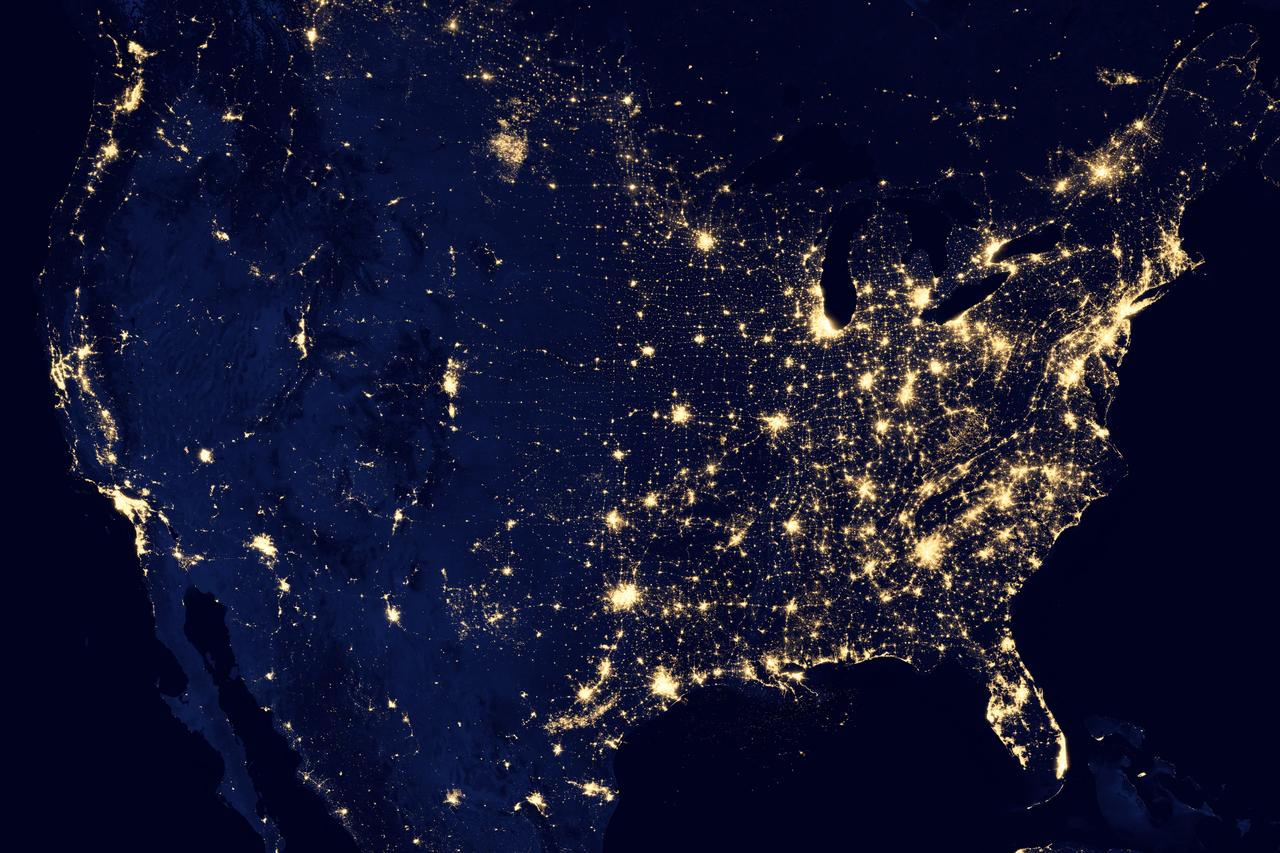
NASA image acquired April 18 - October 23, 2012 This image of the United States of America at night is a composite assembled from data acquired by the Suomi NPP satellite in April and October 2012. The image was made possible by the new satellite’s “day-night band” of the Visible Infrared Imaging Radiometer Suite (VIIRS), which detects light in a range of wavelengths from green to near-infrared and uses filtering techniques to observe dim signals such as city lights, gas flares, auroras, wildfires, and reflected moonlight. “Nighttime light is the most interesting data that I’ve had a chance to work with,” says Chris Elvidge, who leads the Earth Observation Group at NOAA’s National Geophysical Data Center. “I’m always amazed at what city light images show us about human activity.” His research group has been approached by scientists seeking to model the distribution of carbon dioxide emissions from fossil fuels and to monitor the activity of commercial fishing fleets. Biologists have examined how urban growth has fragmented animal habitat. Elvidge even learned once of a study of dictatorships in various parts of the world and how nighttime lights had a tendency to expand in the dictator’s hometown or province. Named for satellite meteorology pioneer Verner Suomi, NPP flies over any given point on Earth's surface twice each day at roughly 1:30 a.m. and p.m. The polar-orbiting satellite flies 824 kilometers (512 miles) above the surface, sending its data once per orbit to a ground station in Svalbard, Norway, and continuously to local direct broadcast users distributed around the world. Suomi NPP is managed by NASA with operational support from NOAA and its Joint Polar Satellite System, which manages the satellite's ground system. NASA Earth Observatory image by Robert Simmon, using Suomi NPP VIIRS data provided courtesy of Chris Elvidge (NOAA National Geophysical Data Center). Suomi NPP is the result of a partnership between NASA, NOAA, and the Department of Defense. Caption by Mike Carlowicz. Instrument: Suomi NPP - VIIRS Credit: <b><a href="http://www.earthobservatory.nasa.gov/" rel="nofollow"> NASA Earth Observatory</a></b> <b>Click here to view all of the <a href="http://earthobservatory.nasa.gov/Features/NightLights/" rel="nofollow"> Earth at Night 2012 images </a></b> <b>Click here to <a href="http://earthobservatory.nasa.gov/NaturalHazards/view.php?id=79800" rel="nofollow"> read more </a> about this image </b> <b><a href="http://www.nasa.gov/audience/formedia/features/MP_Photo_Guidelines.html" rel="nofollow">NASA image use policy.</a></b> <b><a href="http://www.nasa.gov/centers/goddard/home/index.html" rel="nofollow">NASA Goddard Space Flight Center</a></b> enables NASA’s mission through four scientific endeavors: Earth Science, Heliophysics, Solar System Exploration, and Astrophysics. Goddard plays a leading role in NASA’s accomplishments by contributing compelling scientific knowledge to advance the Agency’s mission. <b>Follow us on <a href="http://twitter.com/NASA_GoddardPix" rel="nofollow">Twitter</a></b> <b>Like us on <a href="http://www.facebook.com/pages/Greenbelt-MD/NASA-Goddard/395013845897?ref=tsd" rel="nofollow">Facebook</a></b> <b>Find us on <a href="http://instagram.com/nasagoddard?vm=grid" rel="nofollow">Instagram</a></b>
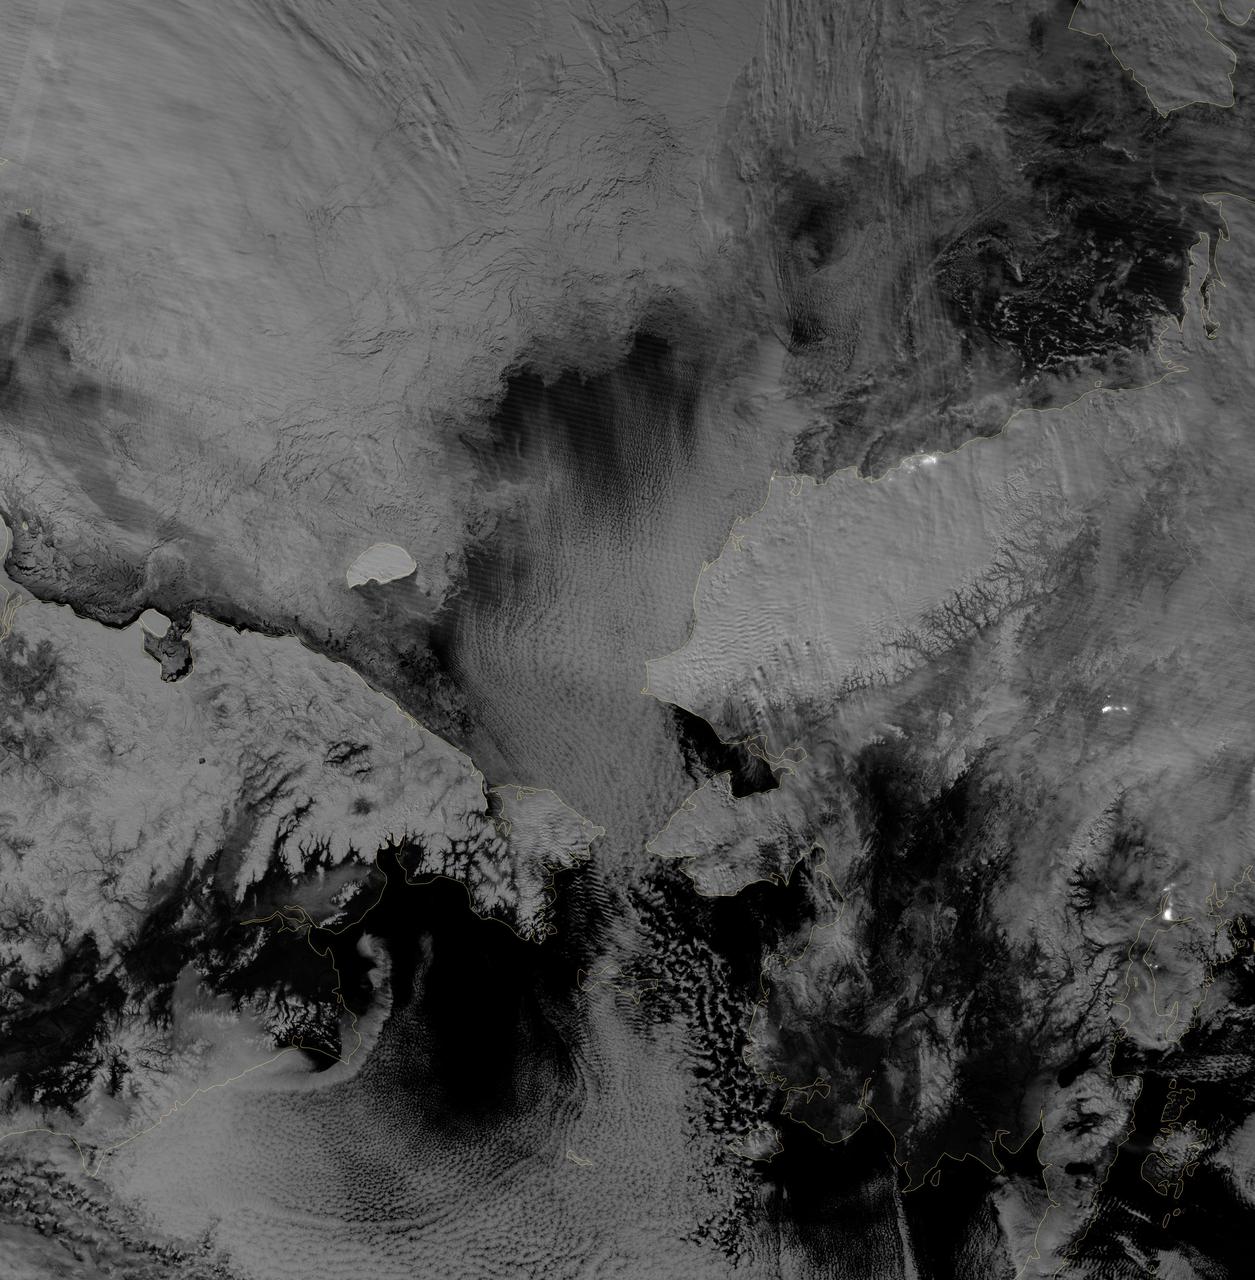
Image acquired October 30, 2012 Scientists watched the Arctic with particular interest in the summer of 2012, when Arctic sea ice set a new record low. The behavior of sea ice following such a low extent also interests scientists, but as Arctic sea ice was advancing in the autumn of 2012, so was polar darkness. Fortunately, the Visible Infrared Imaging Radiometer Suite (VIIRS) on the Suomi NPP satellite can see in the dark. The VIIRS “day-night band” detects light in a range of wavelengths from green to near-infrared and uses filtering techniques to observe signals such as gas flares, auroras, wildfires, city lights, and reflected moonlight. VIIRS acquired this nighttime view of sea ice north of Russia and Alaska on October 30, 2012. The day-night band takes advantage of moonlight, airglow (the atmosphere’s self-illumination through chemical reactions), zodiacal light (sunlight scattered by interplanetary dust), and starlight from the Milky Way. By using these dim light sources, the day-night band can detect changes in clouds, snow cover, and sea ice. The VIIRS day-night band offers a unique perspective because once polar night has descended, satellite sensors relying on visible light can no longer produce photo-like images. And although passive microwave sensors can monitor sea ice through the winter, they offer much lower resolution. Steve Miller of the Cooperative Institute for Research in the Atmosphere at Colorado State University has used the day-night band to study nighttime behavior of weather systems and sees advantages in studying the polar regions. “There’s a lot of use with these measurements as we look back at a season of record ice melt in the Arctic,” Miller says. “We can observe areas where there is ice melt and reformation, where there’s clear water and ships can pass through—especially as the ‘great darkness’ approaches with winter.” Ted Scambos of the National Snow and Ice Data Center at the University of Colorado concurs. “Things start changing rapidly in the late fall: sea ice formation and snow cover extent at the highest latitudes. This lets us see rapid-growth areas in detail.” The day-night band is also useful for following weather systems, including severe storms, which can develop and strike populous areas at night as well as day. Geostationary Operational Environmental Satellites orbit the Earth’s equator. The satellites offer uninterrupted observations of North America, but high-latitude areas such as Alaska may benefit more from polar-orbiting satellites. Miller explains, “In the high latitudes, the orbits begin to overlap considerably, which gives you a lot more passes in Alaska. If you start to look at multiple passes and stitch them together, you can get a version of a poor man’s geostationary time loop of the weather.” Day-night band imagery at high latitudes has already proven useful for tracking rapid ice movement and diagnosing Gulf of Alaska circulations. The day-night band is even useful at tracking ship movement at high latitudes. NASA Earth Observatory image by Jesse Allen and Robert Simmon, using VIIRS Day-Night Band data from the Suomi National Polar-orbiting Partnership. Suomi NPP is the result of a partnership between NASA, the National Oceanic and Atmospheric Administration, and the Department of Defense. Caption by Michon Scott. Instrument: Suomi NPP - VIIRS Credit: <b><a href="http://www.earthobservatory.nasa.gov/" rel="nofollow"> NASA Earth Observatory</a></b> <b>Click here to view all of the <a href="http://earthobservatory.nasa.gov/Features/NightLights/" rel="nofollow"> Earth at Night 2012 images </a></b> <b>Click here to <a href="http://earthobservatory.nasa.gov/NaturalHazards/view.php?id=79825" rel="nofollow"> read more </a> about this image </b> <b><a href="http://www.nasa.gov/audience/formedia/features/MP_Photo_Guidelines.html" rel="nofollow">NASA image use policy.</a></b> <b><a href="http://www.nasa.gov/centers/goddard/home/index.html" rel="nofollow">NASA Goddard Space Flight Center</a></b> enables NASA
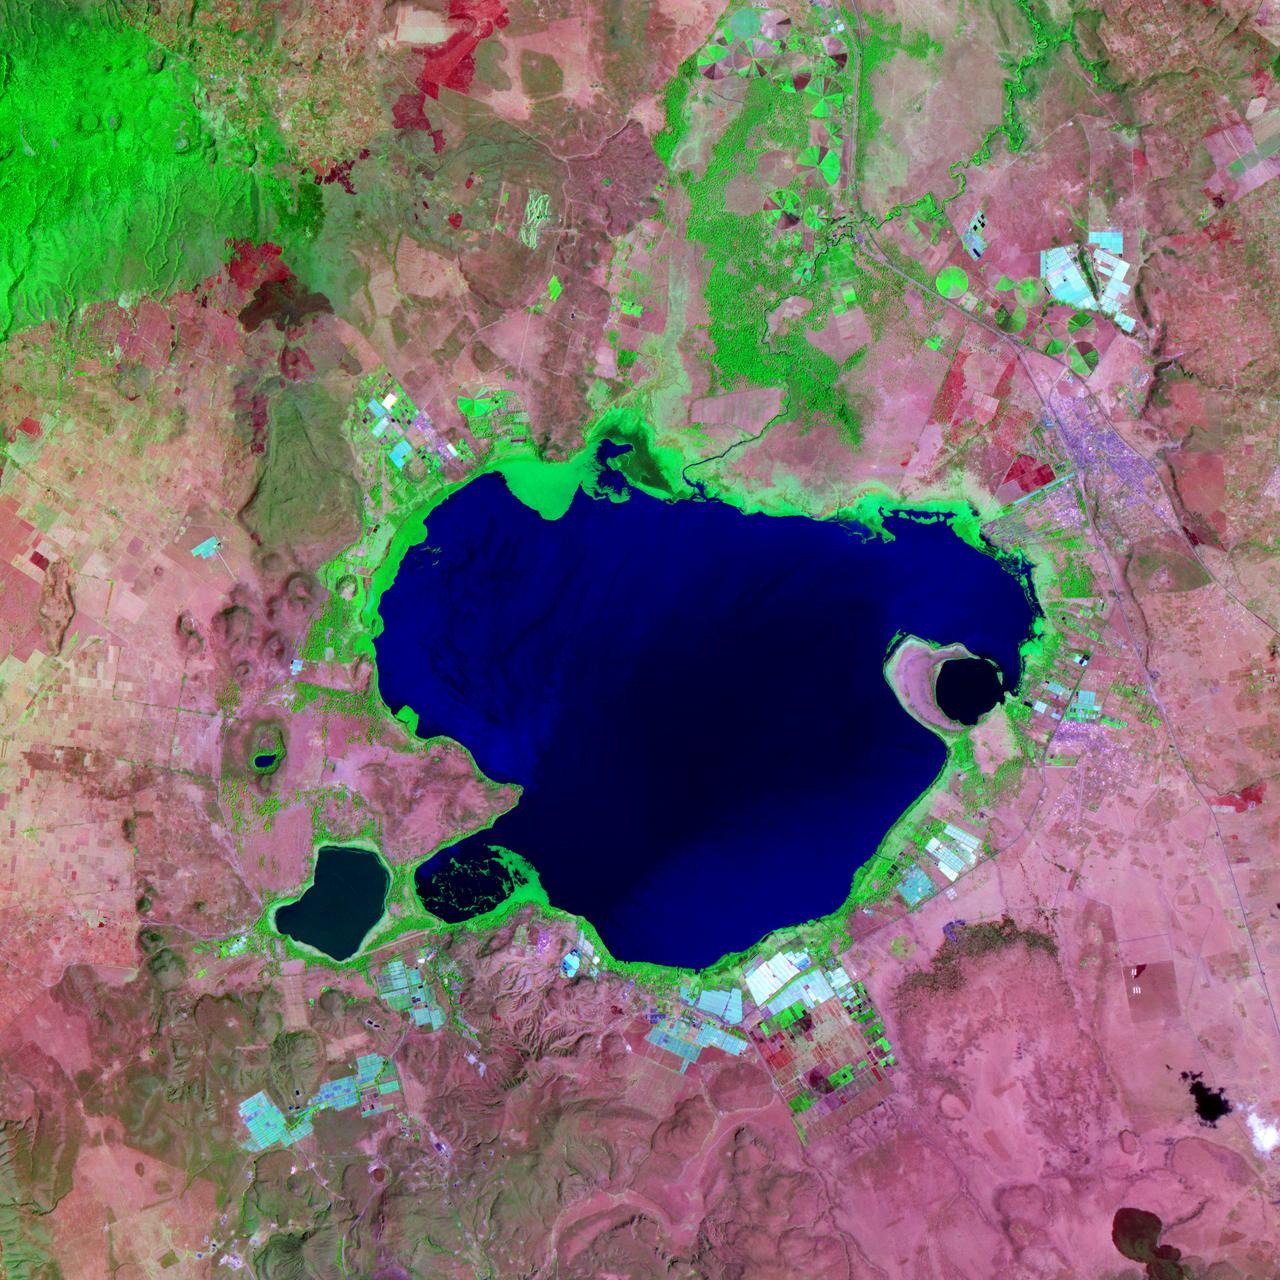
NASA satellite image acquired February 2, 2008. Outside the ground is frozen, quite possibly covered in snow and ice, and yet, stroll through a supermarket in North America or Europe in February, and you’ll be confronted with large displays of roses. We expect flowers in winter, and equatorial countries meet those expectations. A quarter of the cut flowers sold in Europe are grown in Kenya. Straddling the equator, Kenya gets steady sunlight dealt out in days that vary little in length. It’s the perfect climate for flowers year-round. The center of Kenya’s flower industry is Lake Naivasha, shown here. The Advanced Spaceborne Thermal Emission and Reflection Radiometer (ASTER) flying on NASA’s Terra satellite captured this image of Lake Naivasha on February 2, 2008. Bright white squares mix with fields of green, tan, and purple along the shores of the lake. Sunlight glints off the long rows of glass greenhouses, turning them silvery blue and white in this view from space. Fallow fields are tan and pink, while growing plants turn the ground bright green. Roses, lilies, and carnations are the most common flowers grown in the greenhouses and fields scattered around the lake. The large-scale industry shown here extends into small-scale rural farms elsewhere in Kenya, where smaller filler flowers are grown. The flowers provide an important source of income to Kenya, but the industry comes with a price. Flowers are not held to the same standards for chemical residues as food products, which are tightly regulated. Strong chemical pesticides can be used on the flowers to produce the perfect, pest-free bloom, and this could pose a health risk to workers and local wildlife, including hippos, environmental groups told the Food and Agriculture Organization of the United Nations in 2002. The chemicals may also have threatened the water quality of Lake Naivasha, one of Kenya’s few freshwater lakes. The Kenya Flower Council instituted a code of conduct establishing guidelines for pesticide that phases out the use of one of the most toxic pesticides. NASA image created by Jesse Allen, using data provided courtesy of NASA/GSFC/METI/ERSDAC/JAROS, and U.S./Japan ASTER Science Team. Caption by Holli Riebeek. Instrument: Terra - ASTER <b><a href="http://www.nasa.gov/centers/goddard/home/index.html" rel="nofollow">NASA Goddard Space Flight Center</a></b> is home to the nation's largest organization of combined scientists, engineers and technologists that build spacecraft, instruments and new technology to study the Earth, the sun, our solar system, and the universe.
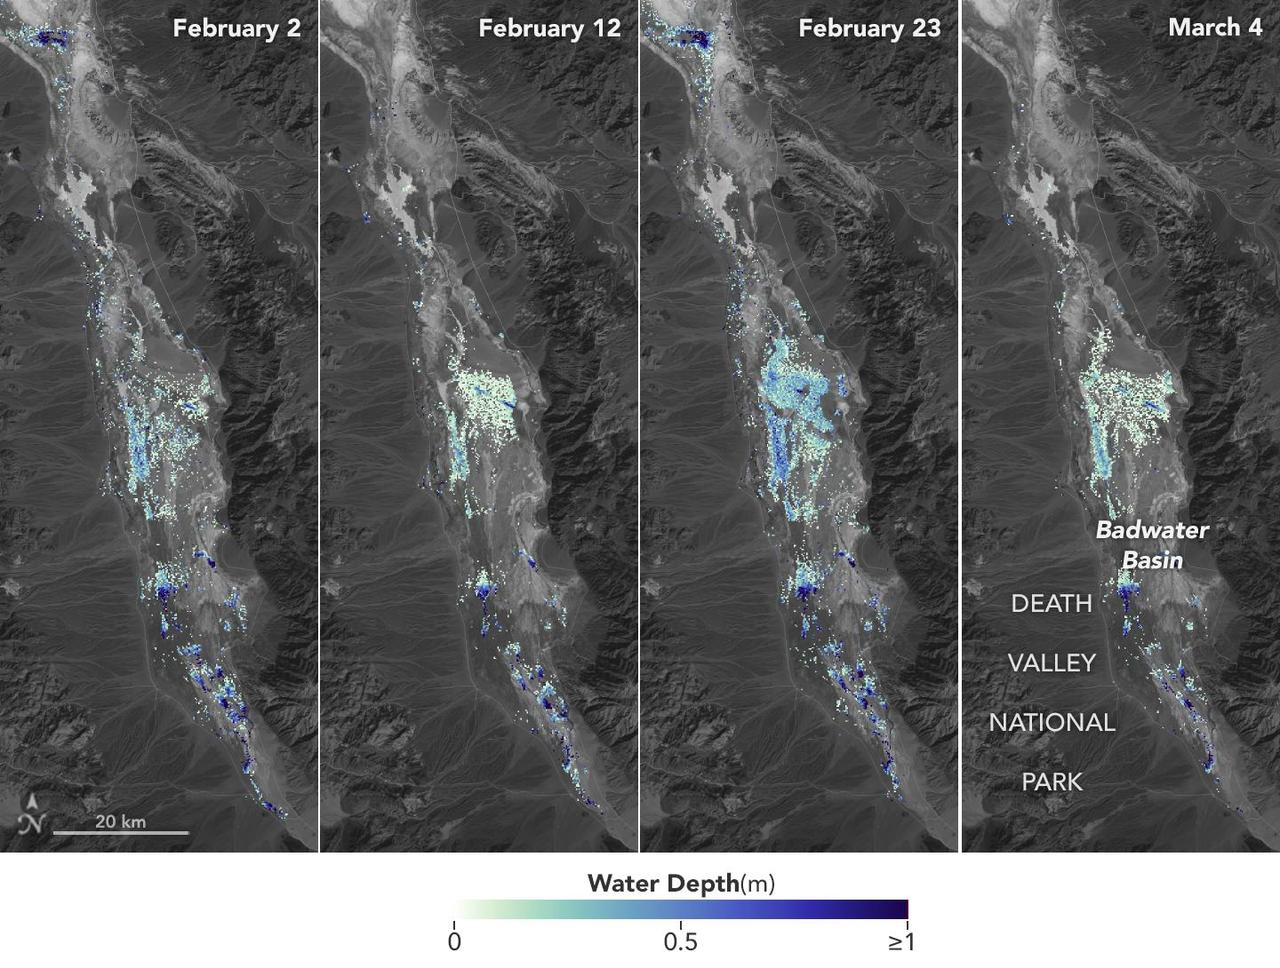
California's Death Valley, the driest place in North America, has hosted an ephemeral lake since late 2023. In March 2024, a NASA-led analysis calculated water depths in the temporary lake over several weeks in February and March 2024, demonstrating the possibilities of the latest water-observing mission, the U.S.-French Surface Water and Ocean Topography (SWOT) satellite. The analysis found that water depths in the lake ranged between about 3 feet (1 meter) to less than 1.5 feet (0.5 meters) over the course of several weeks. This period included a series of storms that swept across California, bringing record amounts of rainfall. To estimate the depth of the lake, known informally as Lake Manly, researchers used water level data collected by SWOT and subtracted corresponding U.S. Geological Survey land elevation information for Badwater Basin. The researchers found that the water levels varied across space and time in the roughly 10-day period between SWOT observations. In the visualization above, water depths of about 3 feet (1 meter) appear dark blue; those of less than 1.5 feet (0.5 meters) appear light yellow. Right after a series of storms in early February, the temporary lake was about 6 miles (10 kilometers) long and 3 miles (5 kilometers) wide. Each pixel in the image represents an area that is about 330 feet by 330 feet (100 meters by 100 meters). Unlike many lakes around the world, Death Valley's lake is temporary, relatively shallow, and strong winds are enough to move the freshwater body a couple of miles, as happened from Feb. 29 to March 2. Since there isn't typically water in Badwater Basin, researchers don't have permanent instruments in place for studying water in this area. SWOT can fill the data gap for when places like this, and others around the world, become inundated. Since shortly after launch in December 2022, SWOT has been measuring the height of nearly all water on Earth's surface, developing one of the most detailed and comprehensive views of the planet's oceans and freshwater lakes and rivers. Not only can the satellite detect the extent of water, as other satellites can, but SWOT can also measure water surface levels. Combined with other types of information, SWOT measurements can yield water depth data for inland features like lakes and rivers. The SWOT science team makes its measurements using the Ka-band Radar Interferometer (KaRIn) instrument. With two antennas spread 33 feet (10 meters) apart on a boom, KaRIn produces a pair of data swaths as it circles the globe, bouncing radar pulses off water surfaces to collect surface-height information. Launched from Vandenberg Space Force Base in central California, SWOT is now in its operations phase, collecting data that will be used for research and other purposes. Animation available at https://photojournal.jpl.nasa.gov/catalog/PIA26184