
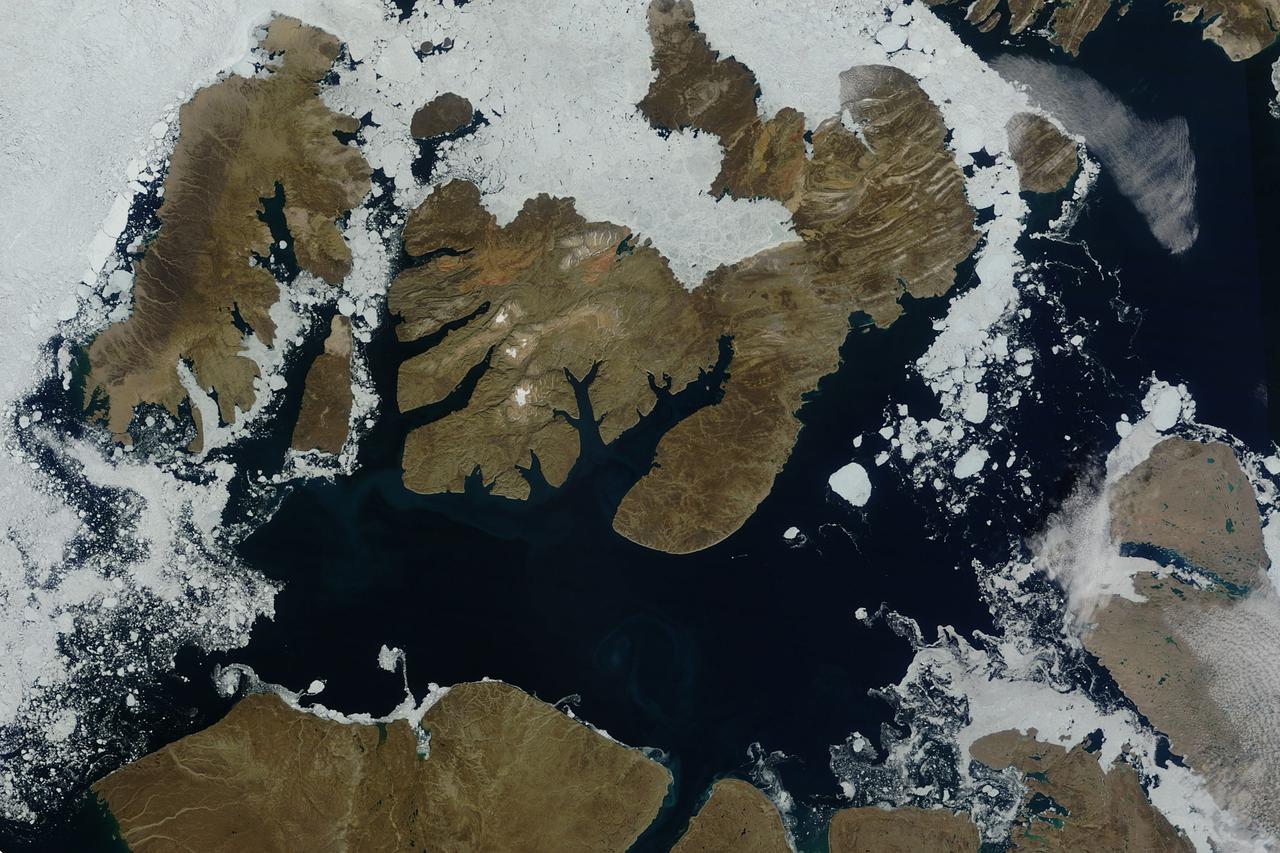
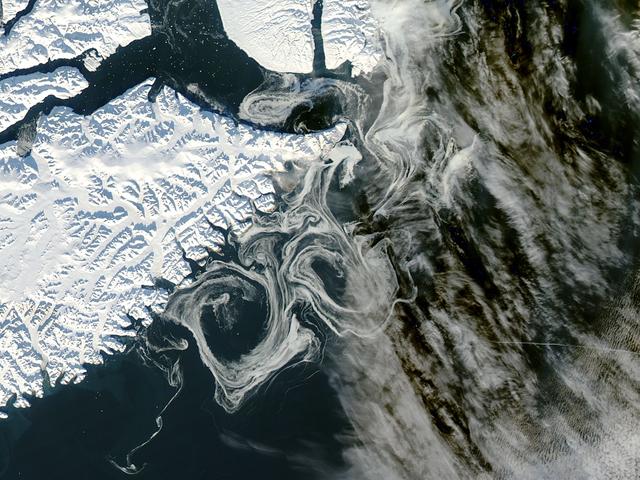
As the northern hemisphere experiences the heat of summer, ice moves and melts in the Arctic waters and the far northern lands surrounding it. The Moderate Resolution Imaging Spectroradiometer (MODIS) aboard NASA’s Aqua satellite captured this true-color image of sea ice off Greenland on July 16, 2015. Large chunks of melting sea ice can be seen in the sea ice off the coast, and to the south spirals of ice have been shaped by the winds and currents that move across the Greenland Sea. Along the Greenland coast, cold, fresh melt water from the glaciers flows out to the sea, as do newly calved icebergs. Frigid air from interior Greenland pushes the ice away from the shoreline, and the mixing of cold water and air allows some sea ice to be sustained even at the height of summer. According to observations from satellites, 2015 is on track to be another low year for arctic summer sea ice cover. The past ten years have included nine of the lowest ice extents on record. The annual minimum typically occurs in late August or early September. The amount of Arctic sea ice cover has been dropping as global temperatures rise. The Arctic is two to three times more sensitive to temperature changes as the Earth as a whole. Credit: NASA/GSFC/Jeff Schmaltz/MODIS Land Rapid Response Team <b><a href="http://www.nasa.gov/audience/formedia/features/MP_Photo_Guidelines.html" rel="nofollow">NASA image use policy.</a></b> <b><a href="http://www.nasa.gov/centers/goddard/home/index.html" rel="nofollow">NASA Goddard Space Flight Center</a></b> enables NASA’s mission through four scientific endeavors: Earth Science, Heliophysics, Solar System Exploration, and Astrophysics. Goddard plays a leading role in NASA’s accomplishments by contributing compelling scientific knowledge to advance the Agency’s mission. <b>Follow us on <a href="http://twitter.com/NASAGoddardPix" rel="nofollow">Twitter</a></b> <b>Like us on <a href="http://www.facebook.com/pages/Greenbelt-MD/NASA-Goddard/395013845897?ref=tsd" rel="nofollow">Facebook</a></b> <b>Find us on <a href="http://instagrid.me/nasagoddard/?vm=grid" rel="nofollow">Instagram</a></b>
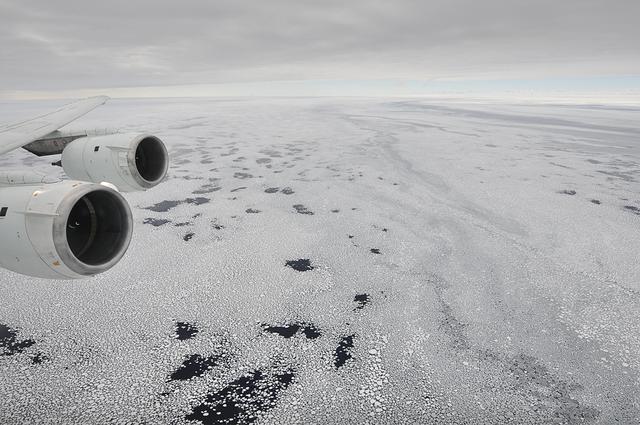
Sea ice is seen out the window of NASA's DC-8 research aircraft as it flies 2,000 feet above the Bellingshausen Sea in West Antarctica on Wednesday, Oct., 21, 2009. This was the fourth science flight of NASA’s Operation Ice Bridge airborne Earth science mission to study Antarctic ice sheets, sea ice, and ice shelves. Photo Credit: (NASA/Jane Peterson)

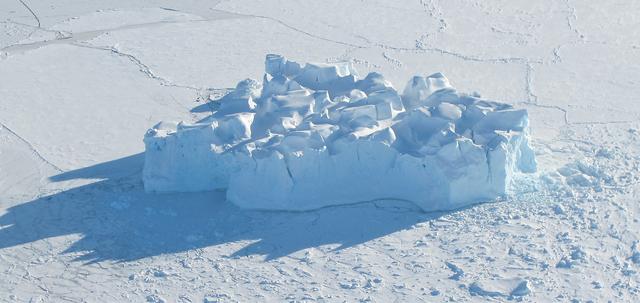
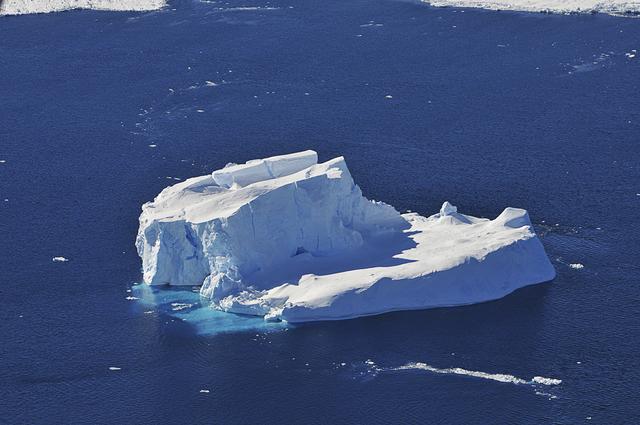
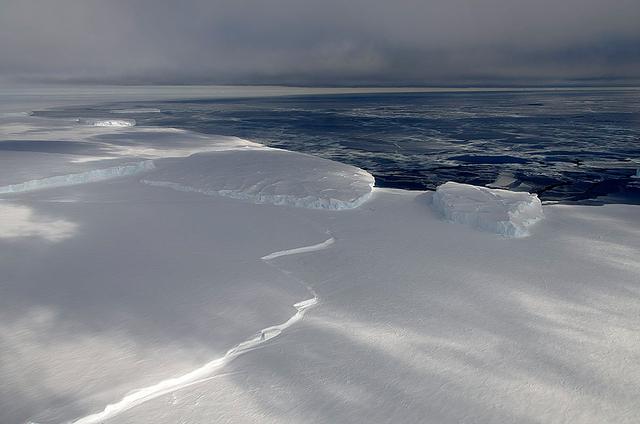
Antarctica—the continent at the southernmost reach of the planet—is fringed by cold, often frozen waters of the Southern Ocean. The extent of sea ice around the continent typically reaches a peak in September and a minimum in February. The photograph above shows Antarctic sea ice on November 5, 2014, during the annual cycle of melt. The image was acquired by the Digital Mapping System (DMS), a digital camera installed in the belly of research aircraft to capture images of terrain below. In this case, the system flew on the DC-8 during a flight as part of NASA’s Operation IceBridge. Most of the view shows first-year sea ice in the Bellingshausen Sea, as it appeared from an altitude of 328 meters (1,076 feet). The block of ice on the right side of the image is older, thicker, and was once attached to the Antarctic Ice Sheet. By the time this image was acquired, however, the ice had broken away to form an iceberg. Given its close proximity to the ice sheet, this could have been a relatively new berg. Read more: <a href="http://earthobservatory.nasa.gov/IOTD/view.php?id=86721" rel="nofollow">earthobservatory.nasa.gov/IOTD/view.php?id=86721</a> Credit: NASA/Goddard/IceBridge DMS L0 Raw Imagery courtesy of the Digital Mapping System (DMS) team and the NASA DAAC at the National Snow and Ice Data Center Credit: <b><a href="http://www.earthobservatory.nasa.gov/" rel="nofollow"> NASA Earth Observatory</a></b> <b><a href="http://www.nasa.gov/audience/formedia/features/MP_Photo_Guidelines.html" rel="nofollow">NASA image use policy.</a></b> <b><a href="http://www.nasa.gov/centers/goddard/home/index.html" rel="nofollow">NASA Goddard Space Flight Center</a></b> enables NASA’s mission through four scientific endeavors: Earth Science, Heliophysics, Solar System Exploration, and Astrophysics. Goddard plays a leading role in NASA’s accomplishments by contributing compelling scientific knowledge to advance the Agency’s mission. <b>Follow us on <a href="http://twitter.com/NASAGoddardPix" rel="nofollow">Twitter</a></b> <b>Like us on <a href="http://www.facebook.com/pages/Greenbelt-MD/NASA-Goddard/395013845897?ref=tsd" rel="nofollow">Facebook</a></b> <b>Find us on <a href="http://instagrid.me/nasagoddard/?vm=grid" rel="nofollow">Instagram</a></b>
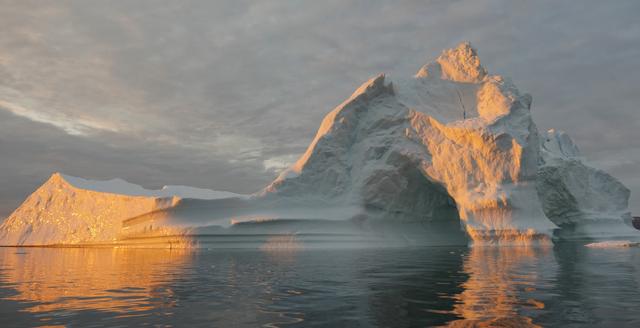
Sea level rise is a natural consequence of the warming of our planet. We know this from basic physics. When water heats up, it expands. So when the ocean warms, sea level rises. When ice is exposed to heat, it melts. And when ice on land melts and water runs into the ocean, sea level rises. For thousands of years, sea level has remained relatively stable and human communities have settled along the planet’s coastlines. But now Earth’s seas are rising. Globally, sea level has risen about eight inches since the beginning of the 20th century and more than two inches in the last 20 years alone. All signs suggest that this rise is accelerating. Read more: <a href="http://go.nasa.gov/1heZn29" rel="nofollow">go.nasa.gov/1heZn29</a> Caption: An iceberg floats in Disko Bay, near Ilulissat, Greenland, on July 24, 2015. The massive Greenland ice sheet is shedding about 300 gigatons of ice a year into the ocean, making it the single largest source of sea level rise from melting ice. Credits: NASA/Saskia Madlener <b><a href="http://www.nasa.gov/audience/formedia/features/MP_Photo_Guidelines.html" rel="nofollow">NASA image use policy.</a></b> <b><a href="http://www.nasa.gov/centers/goddard/home/index.html" rel="nofollow">NASA Goddard Space Flight Center</a></b> enables NASA’s mission through four scientific endeavors: Earth Science, Heliophysics, Solar System Exploration, and Astrophysics. Goddard plays a leading role in NASA’s accomplishments by contributing compelling scientific knowledge to advance the Agency’s mission. <b>Follow us on <a href="http://twitter.com/NASAGoddardPix" rel="nofollow">Twitter</a></b> <b>Like us on <a href="http://www.facebook.com/pages/Greenbelt-MD/NASA-Goddard/395013845897?ref=tsd" rel="nofollow">Facebook</a></b> <b>Find us on <a href="http://instagrid.me/nasagoddard/?vm=grid" rel="nofollow">Instagram</a></b>

The U.S. Coast Guard Cutter Healy encountered only small patches of sea ice in the Chukchi Sea during the final days collecting ocean data for the 2011 ICESCAPE mission. The ICESCAPE mission, or "Impacts of Climate on Ecosystems and Chemistry of the Arctic Pacific Environment," is a NASA shipborne investigation to study how changing conditions in the Arctic affect the ocean's chemistry and ecosystems. The bulk of the research took place in the Beaufort and Chukchi seas in summer 2010 and 2011. Credit: NASA/Kathryn Hansen <b><a href="http://www.nasa.gov/audience/formedia/features/MP_Photo_Guidelines.html" rel="nofollow">NASA image use policy.</a></b> <b><a href="http://www.nasa.gov/centers/goddard/home/index.html" rel="nofollow">NASA Goddard Space Flight Center</a></b> enables NASA’s mission through four scientific endeavors: Earth Science, Heliophysics, Solar System Exploration, and Astrophysics. Goddard plays a leading role in NASA’s accomplishments by contributing compelling scientific knowledge to advance the Agency’s mission. <b>Follow us on <a href="http://twitter.com/NASA_GoddardPix" rel="nofollow">Twitter</a></b> <b>Like us on <a href="http://www.facebook.com/pages/Greenbelt-MD/NASA-Goddard/395013845897?ref=tsd" rel="nofollow">Facebook</a></b> <b>Find us on <a href="http://instagrid.me/nasagoddard/?vm=grid" rel="nofollow">Instagram</a></b>
NASA image acquired August 17, 2010 In mid-August 2010, the Northwest Passage was almost—but not quite—free of ice. The ice content in the northern route through the passage (through the Western Parry Channel) was very light, but ice remained in McClure (or M’Clure) Strait. The Moderate Resolution Imaging Spectroradiometer (MODIS) on NASA’s Terra satellite captured this natural-color image on August 17, 2010. Although most of McClure Strait looks perfectly ice-free, immediately west of Prince Patrick Island, a band of sea ice stretches southward across the strait (left edge of the image). The National Snow and Ice Data Center Sea Ice News and Analysis blog reported that even more ice remained in the southern route (through Amundsen’s Passage) of the Northwest Passage in mid-August 2010. Nevertheless, the ice content in the northern route was not only well below the 1968–2000 average, but also nearly a month ahead of the clearing observed in 2007, when Arctic sea ice set a record low. As of mid-August 2010, however, overall sea ice extent was higher than it had been at the same time of year in 2007. Credit: NASA/GSFC/Jeff Schmaltz/MODIS Land Rapid Response Team Caption by Michon Scott. To learn more go to: <a href="http://earthobservatory.nasa.gov/NaturalHazards/view.php?id=45333" rel="nofollow">earthobservatory.nasa.gov/NaturalHazards/view.php?id=45333</a> Instrument: Terra - MODIS <b><a href="http://www.nasa.gov/centers/goddard/home/index.html" rel="nofollow">NASA Goddard Space Flight Center</a></b> is home to the nation's largest organization of combined scientists, engineers and technologists that build spacecraft, instruments and new technology to study the Earth, the sun, our solar system, and the universe. <b>Follow us on <a href="http://twitter.com/NASA_GoddardPix" rel="nofollow">Twitter</a></b> <b>Join us on <a href="http://www.facebook.com/pages/Greenbelt-MD/NASA-Goddard/395013845897?ref=tsd" rel="nofollow">Facebook</a><b> Click here to see more images from <b><a href="#//earthobservatory.nasa.gov/" rel="nofollow"> NASA Goddard’s Earth Observatory</a></b></b></b>

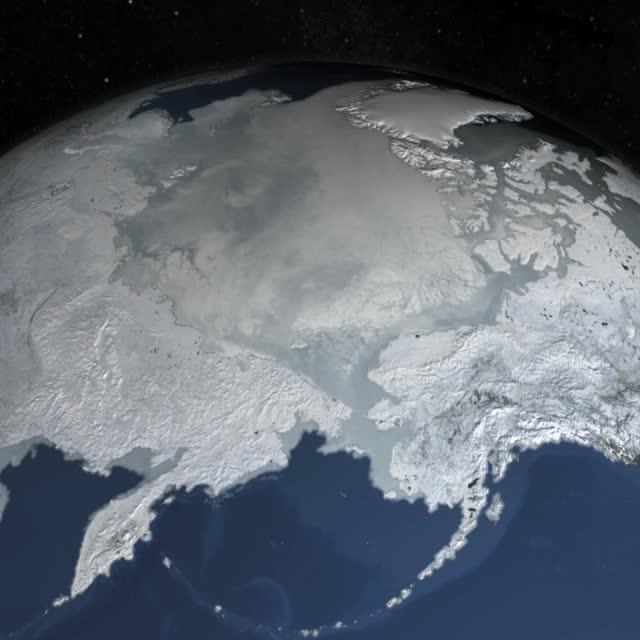
On February 4, 2014 the Moderate Resolution Imaging Spectroradiometer (MODIS) flying aboard NASA’s Aqua satellite captured a true-color image of sea ice off of western Alaska. In this true-color image, the snow and ice covered land appears bright white while the floating sea ice appears a duller grayish-white. Snow over the land is drier, and reflects more light back to the instrument, accounting for the very bright color. Ice overlying oceans contains more water, and increasing water decreases reflectivity of ice, resulting in duller colors. Thinner ice is also duller. The ocean waters are tinted with green, likely due to a combination of sediment and phytoplankton. Alaska lies to the east in this image, and Russia to the west. The Bering Strait, covered with ice, lies between to two. South of the Bering Strait, the waters are known as the Bering Sea. To the north lies the Chukchi Sea. The bright white island south of the Bering Strait is St. Lawrence Island. Home to just over 1200 people, the windswept island belongs to the United States, but sits closer to Russia than to Alaska. To the southeast of the island a dark area, loosely covered with floating sea ice, marks a persistent polynya – an area of open water surrounded by more frozen sea ice. Due to the prevailing winds, which blow the sea ice away from the coast in this location, the area rarely completely freezes. The ice-covered areas in this image, as well as the Beaufort Sea, to the north, are critical areas for the survival of the ringed seal, a threatened species. The seals use the sea ice, including ice caves, to rear their young, and use the free-floating sea ice for molting, raising the young and breeding. In December 2014, the National Oceanic and Atmospheric Administration (NOAA) proposed that much of this region be set aside as critical, protected habitat for the ringed seal. Credit: NASA/GSFC/Jeff Schmaltz/MODIS Land Rapid Response Team <b><a href="http://www.nasa.gov/audience/formedia/features/MP_Photo_Guidelines.html" rel="nofollow">NASA image use policy.</a></b> <b><a href="http://www.nasa.gov/centers/goddard/home/index.html" rel="nofollow">NASA Goddard Space Flight Center</a></b> enables NASA’s mission through four scientific endeavors: Earth Science, Heliophysics, Solar System Exploration, and Astrophysics. Goddard plays a leading role in NASA’s accomplishments by contributing compelling scientific knowledge to advance the Agency’s mission. <b>Follow us on <a href="http://twitter.com/NASAGoddardPix" rel="nofollow">Twitter</a></b> <b>Like us on <a href="http://www.facebook.com/pages/Greenbelt-MD/NASA-Goddard/395013845897?ref=tsd" rel="nofollow">Facebook</a></b> <b>Find us on <a href="http://instagram.com/nasagoddard?vm=grid" rel="nofollow">Instagram</a></b>
An iceberg embedded in sea ice as seen from the IceBridge DC-8 over the Bellingshausen Sea on Oct. 19, 2012. Credit: NASA / James Yungel NASA's Operation IceBridge is an airborne science mission to study Earth's polar ice. For more information about IceBridge, visit: <a href="http://www.nasa.gov/icebridge" rel="nofollow">www.nasa.gov/icebridge</a> <b><a href="http://www.nasa.gov/audience/formedia/features/MP_Photo_Guidelines.html" rel="nofollow">NASA image use policy.</a></b> <b><a href="http://www.nasa.gov/centers/goddard/home/index.html" rel="nofollow">NASA Goddard Space Flight Center</a></b> enables NASA’s mission through four scientific endeavors: Earth Science, Heliophysics, Solar System Exploration, and Astrophysics. Goddard plays a leading role in NASA’s accomplishments by contributing compelling scientific knowledge to advance the Agency’s mission. <b>Follow us on <a href="http://twitter.com/NASA_GoddardPix" rel="nofollow">Twitter</a></b> <b>Like us on <a href="http://www.facebook.com/pages/Greenbelt-MD/NASA-Goddard/395013845897?ref=tsd" rel="nofollow">Facebook</a></b> <b>Find us on <a href="http://instagrid.me/nasagoddard/?vm=grid" rel="nofollow">Instagram</a></b>

On April 5, 2015, the Moderate Resolution Imaging Spectroradiometer (MODIS) on NASA’s Terra satellite acquired this natural-color image of sea ice off the coast of East Antarctica’s Princess Astrid Coast. White areas close to the continent are sea ice, while white areas in the northeast corner of the image are clouds. One way to better distinguish ice from clouds is with false-color imagery. In the false-color view of the scene here, ice is blue and clouds are white. The image was acquired after Antarctic sea ice had passed its annual minimum extent (reached on February 20, 2015), and had resumed expansion toward its maximum extent (usually reached in September). Credit: NASA image by Jeff Schmaltz, LANCE/EOSDIS Rapid Response. Caption by Kathryn Hansen via NASA's Earth Observatory Read more: <a href="http://www.nasa.gov/content/sea-ice-off-east-antarcticas-princess-astrid-coast/" rel="nofollow">www.nasa.gov/content/sea-ice-off-east-antarcticas-princes...</a> <b><a href="http://www.nasa.gov/audience/formedia/features/MP_Photo_Guidelines.html" rel="nofollow">NASA image use policy.</a></b> <b><a href="http://www.nasa.gov/centers/goddard/home/index.html" rel="nofollow">NASA Goddard Space Flight Center</a></b> enables NASA’s mission through four scientific endeavors: Earth Science, Heliophysics, Solar System Exploration, and Astrophysics. Goddard plays a leading role in NASA’s accomplishments by contributing compelling scientific knowledge to advance the Agency’s mission. <b>Follow us on <a href="http://twitter.com/NASAGoddardPix" rel="nofollow">Twitter</a></b> <b>Like us on <a href="http://www.facebook.com/pages/Greenbelt-MD/NASA-Goddard/395013845897?ref=tsd" rel="nofollow">Facebook</a></b> <b>Find us on <a href="http://instagrid.me/nasagoddard/?vm=grid" rel="nofollow">Instagram</a></b>

Located off the east coast of Russia, the Sea of Okhotsk stretches down to 45 degrees North latitude, and sea ice forms regularly in the basin. In fact, it is the lowest latitude for seasonal sea ice formation in the world. On January 4, 2015, the Moderate Resolution Imaging Spectroradiometer (MODIS) on NASA’s Terra satellite captured this true-color image of the ice-covered Sea of Okhotsk. Every winter, winds from East Siberia, frigid air temperatures, and a large amount of freshwater flowing out from rivers promote the formation of sea ice in the region. Much of the freshwater comes from the Amur River, one of the ten longest rivers in the world. From year to year, variations in temperature and wind speed can cause large fluctuations in sea ice extent. The sea spans more than 1,500,000 square kilometers (600,000 square miles), and ice cover can spread across 50 to 90 percent of it at its annual peak. On average, that ice persists for 180 days. According to research published in 2014, the region's sea ice has been decreasing over a 34-year period. Annual ice production in the Sea of Okhotsk dropped by more than 11 percent from 1974 to 2008. The researchers suggest that this decline has, at least in part, "led to weakening of the overturning in the North Pacific." Water with less sea ice is fresher, less dense, and unable to sink and circulate as well as salty, dense water. A weakened circulation in the North Pacific has implications for the supply of nutrients, such as iron, that affect biological productivity. Credit: NASA/GSFC/Jeff Schmaltz/MODIS Land Rapid Response Team <b><a href="http://www.nasa.gov/audience/formedia/features/MP_Photo_Guidelines.html" rel="nofollow">NASA image use policy.</a></b> <b><a href="http://www.nasa.gov/centers/goddard/home/index.html" rel="nofollow">NASA Goddard Space Flight Center</a></b> enables NASA’s mission through four scientific endeavors: Earth Science, Heliophysics, Solar System Exploration, and Astrophysics. Goddard plays a leading role in NASA’s accomplishments by contributing compelling scientific knowledge to advance the Agency’s mission. <b>Follow us on <a href="http://twitter.com/NASAGoddardPix" rel="nofollow">Twitter</a></b> <b>Like us on <a href="http://www.facebook.com/pages/Greenbelt-MD/NASA-Goddard/395013845897?ref=tsd" rel="nofollow">Facebook</a></b> <b>Find us on <a href="http://instagram.com/nasagoddard?vm=grid" rel="nofollow">Instagram</a></b>
Mosaic image of sea ice in the Beaufort Sea created by the Digital Mapping System (DMS) instrument aboard the IceBridge P-3B. The dark area in the middle of the image is open water seen through a lead, or opening, in the ice. Light blue areas are thick sea ice and dark blue areas are thinner ice formed as water in the lead refreezes. Leads are formed when cracks develop in sea ice as it moves in response to wind and ocean currents. DMS uses a modified digital SLR camera that points down through a window in the underside of the plane, capturing roughly one frame per second. These images are then combined into an image mosaic using specialized computer software. Credit: NASA/DMS <b><a href="http://www.nasa.gov/audience/formedia/features/MP_Photo_Guidelines.html" rel="nofollow">NASA image use policy.</a></b> <b><a href="http://www.nasa.gov/centers/goddard/home/index.html" rel="nofollow">NASA Goddard Space Flight Center</a></b> enables NASA’s mission through four scientific endeavors: Earth Science, Heliophysics, Solar System Exploration, and Astrophysics. Goddard plays a leading role in NASA’s accomplishments by contributing compelling scientific knowledge to advance the Agency’s mission. <b>Follow us on <a href="http://twitter.com/NASA_GoddardPix" rel="nofollow">Twitter</a></b> <b>Like us on <a href="http://www.facebook.com/pages/Greenbelt-MD/NASA-Goddard/395013845897?ref=tsd" rel="nofollow">Facebook</a></b> <b>Find us on <a href="http://instagram.com/nasagoddard?vm=grid" rel="nofollow">Instagram</a></b>
As the sun sets over the Arctic, the end of this year’s melt season is quickly approaching and the sea ice cover has already shrunk to the fourth lowest in the satellite record. With possibly some days of melting left, the sea ice extent could still drop to the second or third lowest on record. Arctic sea ice, which regulates the planet’s temperature by bouncing solar energy back to space, has been on a steep decline for the last two decades. This animation shows the evolution of Arctic sea ice in 2015, from its annual maximum wintertime extent, reached on February 25, to September 6. Credit: NASA Scientific Visualization Studio DOWNLOAD THIS VIDEO HERE: <a href="https://svs.gsfc.nasa.gov/cgi-bin/details.cgi?aid=11999" rel="nofollow">svs.gsfc.nasa.gov/cgi-bin/details.cgi?aid=11999</a> <b><a href="http://www.nasa.gov/audience/formedia/features/MP_Photo_Guidelines.html" rel="nofollow">NASA image use policy.</a></b> <b><a href="http://www.nasa.gov/centers/goddard/home/index.html" rel="nofollow">NASA Goddard Space Flight Center</a></b> enables NASA’s mission through four scientific endeavors: Earth Science, Heliophysics, Solar System Exploration, and Astrophysics. Goddard plays a leading role in NASA’s accomplishments by contributing compelling scientific knowledge to advance the Agency’s mission. <b>Follow us on <a href="http://twitter.com/NASAGoddardPix" rel="nofollow">Twitter</a></b> <b>Like us on <a href="http://www.facebook.com/pages/Greenbelt-MD/NASA-Goddard/395013845897?ref=tsd" rel="nofollow">Facebook</a></b> <b>Find us on <a href="http://instagrid.me/nasagoddard/?vm=grid" rel="nofollow">Instagram</a></b>
On July 20, the U.S. Coast Guard Cutter Healy steamed south in the Arctic Ocean toward the edge of the sea ice. The ICESCAPE mission, or "Impacts of Climate on Ecosystems and Chemistry of the Arctic Pacific Environment," is NASA's two-year shipborne investigation to study how changing conditions in the Arctic affect the ocean's chemistry and ecosystems. The bulk of the research takes place in the Beaufort and Chukchi seas in summer 2010 and 2011. Credit: NASA/Kathryn Hansen For updates on the five-week ICESCAPE voyage, visit the mission blog at: go.usa.gov/WwU <b><a href="http://www.nasa.gov/audience/formedia/features/MP_Photo_Guidelines.html" rel="nofollow">NASA image use policy.</a></b> <b><a href="http://www.nasa.gov/centers/goddard/home/index.html" rel="nofollow">NASA Goddard Space Flight Center</a></b> enables NASA’s mission through four scientific endeavors: Earth Science, Heliophysics, Solar System Exploration, and Astrophysics. Goddard plays a leading role in NASA’s accomplishments by contributing compelling scientific knowledge to advance the Agency’s mission. <b>Follow us on <a href="http://twitter.com/NASA_GoddardPix" rel="nofollow">Twitter</a></b> <b>Like us on <a href="http://www.facebook.com/pages/Greenbelt-MD/NASA-Goddard/395013845897?ref=tsd" rel="nofollow">Facebook</a></b> <b>Find us on <a href="http://instagrid.me/nasagoddard/?vm=grid" rel="nofollow">Instagram</a></b>
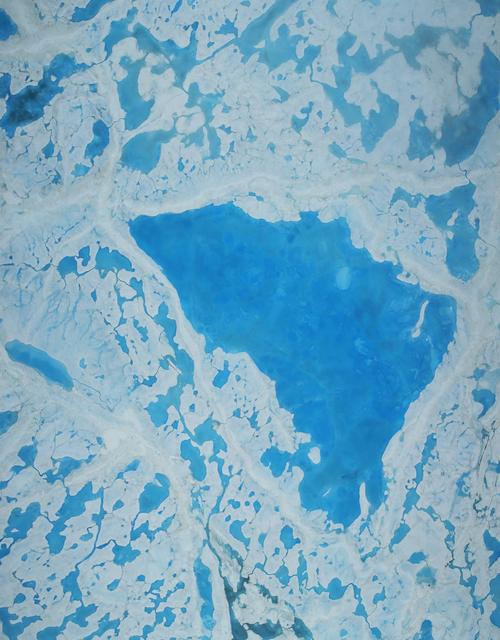
This summer, with sea ice across the Arctic Ocean shrinking to below-average levels, a NASA airborne survey of polar ice just completed its first flights. Its target: aquamarine pools of melt water on the ice surface that may be accelerating the overall sea ice retreat. NASA’s Operation IceBridge completed the first research flight of its new 2016 Arctic summer campaign on July 13. The science flights, which continue through July 25, are collecting data on sea ice in a year following a record-warm winter in the Arctic. Read more: <a href="http://go.nasa.gov/29T6mxc" rel="nofollow">go.nasa.gov/29T6mxc</a> Caption: A large pool of melt water over sea ice, as seen from an Operation IceBridge flight over the Beaufort Sea on July 14, 2016. During this summer campaign, IceBridge will map the extent, frequency and depth of melt ponds like these to help scientists forecast the Arctic sea ice yearly minimum extent in September. Credit: NASA/Operation IceBridge
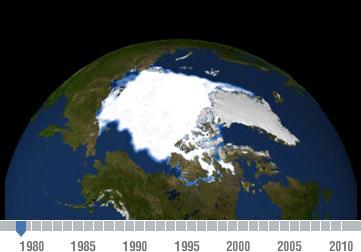
Declining Arctic Sea Ice: 1979-2010

An iceberg trapped in sea ice in the Amundsen Sea, seen from the IceBridge DC-8 during the Getz 07 mission on Oct. 27. Credit: NASA / Maria-Jose Vinas NASA's Operation IceBridge is an airborne science mission to study Earth's polar ice. For more information about IceBridge, visit: <a href="http://www.nasa.gov/icebridge" rel="nofollow">www.nasa.gov/icebridge</a> <b><a href="http://www.nasa.gov/audience/formedia/features/MP_Photo_Guidelines.html" rel="nofollow">NASA image use policy.</a></b> <b><a href="http://www.nasa.gov/centers/goddard/home/index.html" rel="nofollow">NASA Goddard Space Flight Center</a></b> enables NASA’s mission through four scientific endeavors: Earth Science, Heliophysics, Solar System Exploration, and Astrophysics. Goddard plays a leading role in NASA’s accomplishments by contributing compelling scientific knowledge to advance the Agency’s mission. <b>Follow us on <a href="http://twitter.com/NASA_GoddardPix" rel="nofollow">Twitter</a></b> <b>Like us on <a href="http://www.facebook.com/pages/Greenbelt-MD/NASA-Goddard/395013845897?ref=tsd" rel="nofollow">Facebook</a></b> <b>Find us on <a href="http://instagrid.me/nasagoddard/?vm=grid" rel="nofollow">Instagram</a></b>

Low-lying clouds over sea ice on the Bellingshausen Sea. Credit: NASA / Maria-Jose Vinas NASA's Operation IceBridge is an airborne science mission to study Earth's polar ice. For more information about IceBridge, visit: <a href="http://www.nasa.gov/icebridge" rel="nofollow">www.nasa.gov/icebridge</a> <b><a href="http://www.nasa.gov/audience/formedia/features/MP_Photo_Guidelines.html" rel="nofollow">NASA image use policy.</a></b> <b><a href="http://www.nasa.gov/centers/goddard/home/index.html" rel="nofollow">NASA Goddard Space Flight Center</a></b> enables NASA’s mission through four scientific endeavors: Earth Science, Heliophysics, Solar System Exploration, and Astrophysics. Goddard plays a leading role in NASA’s accomplishments by contributing compelling scientific knowledge to advance the Agency’s mission. <b>Follow us on <a href="http://twitter.com/NASA_GoddardPix" rel="nofollow">Twitter</a></b> <b>Like us on <a href="http://www.facebook.com/pages/Greenbelt-MD/NASA-Goddard/395013845897?ref=tsd" rel="nofollow">Facebook</a></b> <b>Find us on <a href="http://instagrid.me/nasagoddard/?vm=grid" rel="nofollow">Instagram</a></b>

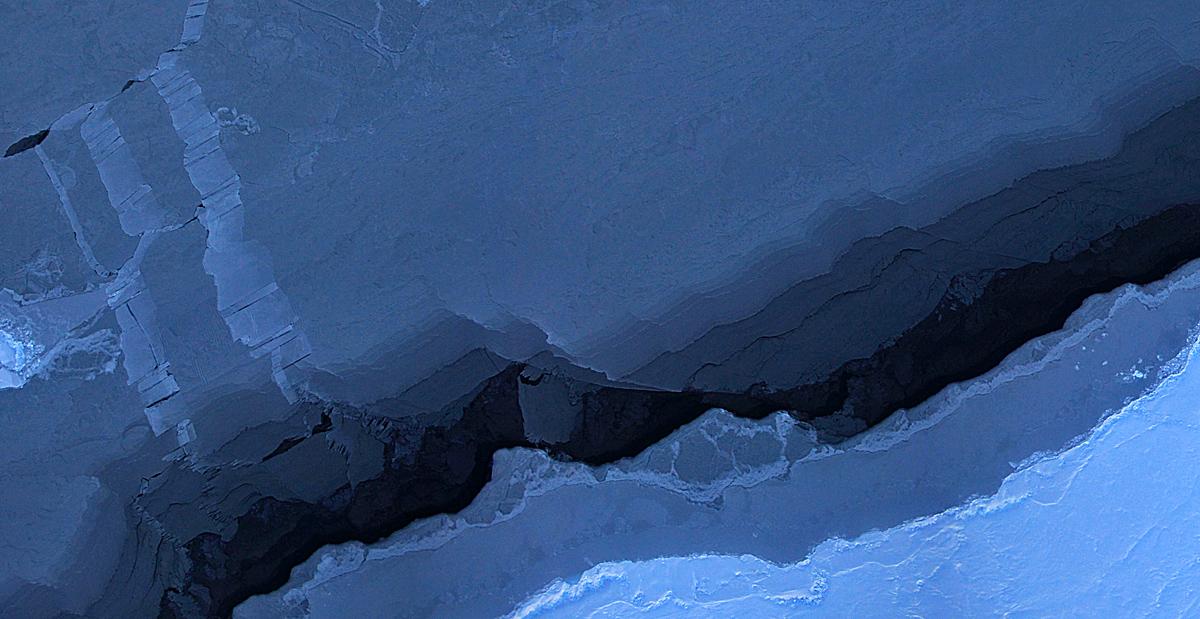
The Visible Infrared Imaging Radiometer Suite (VIIRS) on the Suomi NPP satellite captured this view of extensive sea-ice fracturing off the northern coast of Alaska. The event began in late-January and spread west toward Banks Island throughout February and March 2013. Visualizations of the Arctic often give the impression that the ice cap is a continuous sheet of stationary, floating ice. In fact, it is a collection of smaller pieces that constantly shift, crack, and grind against one another as they are jostled by winds and ocean currents. Especially during the summer—but even during the height of winter—cracks—or leads—open up between pieces of ice. That was what was happening on the left side of the animation (seen here: <a href="http://bit.ly/10kE7sh" rel="nofollow">bit.ly/10kE7sh</a>) in late January. A high-pressure weather system was parked over the region, producing warmer temperatures and winds that flowed in a southwesterly direction. That fueled the Beaufort Gyre, a wind-driven ocean current that flows clockwise. The gyre was the key force pulling pieces of ice west past Point Barrow, the northern nub of Alaska that protrudes into the Beaufort Sea. “A fracturing event in this area is not unusual because the Beaufort Gyre tends to push ice away from Banks Island and the Canadian Archipelago,” explained Walt Meier of the National Snow & Ice Data Center (NSIDC). “Point Barrow can act like a ‘pin point’ where the ice catches and fractures to the north and east.” In February, however, a series of storms passing over central Alaska exacerbated the fracturing. Strong westerly winds prompted several large pieces of ice to break away in an arc-shaped wave that moved progressively east. By the end of February, large pieces of ice had fractured all the way to the western coast of Banks Island, a distance of about 1,000 kilometers (600 miles). The data used to create the animation came from the longwave infrared (thermal) portion of the electromagnetic spectrum, so the animation illustrates how much heat the surface was emitting as VIIRS surveyed the area. Cooler areas (sea ice) appear white, while warmer areas (open water) are dark. The light gray plume near the cracks is warmer, moister air escaping from the ocean and blowing downwind. Clouds do not show up well in the VIIRS thermal band, so the storms that fueled the fracturing are not readily visible. While fracturing events are common, few events sprawl across such a large area or produce cracks as long and wide as those seen here. The age of the sea ice in this area was one of the key reasons this event became so widespread. “The region is covered almost completely by seasonal or first-year ice—ice that has formed since last September,” said Meier. “This ice is thinner and weaker than the older, multi-year ice, so it responds more readily to winds and is more easily broken up.” NASA Earth Observatory images by Jesse Allen using VIIRS day-night band data from the Suomi National Polar-orbiting Partnership. Suomi NPP is the result of a partnership between NASA, the National Oceanic and Atmospheric Administration, and the Department of Defense. Caption by Adam Voiland. Instrument: Suomi NPP - VIIRS For more info go to: <a href="http://earthobservatory.nasa.gov/IOTD/view.php?id=80752" rel="nofollow">earthobservatory.nasa.gov/IOTD/view.php?id=80752</a> Credit: <b><a href="http://www.earthobservatory.nasa.gov/" rel="nofollow"> NASA Earth Observatory</a></b> <b><a href="http://www.nasa.gov/audience/formedia/features/MP_Photo_Guidelines.html" rel="nofollow">NASA image use policy.</a></b> <b><a href="http://www.nasa.gov/centers/goddard/home/index.html" rel="nofollow">NASA Goddard Space Flight Center</a></b> enables NASA’s mission through four scientific endeavors: Earth Science, Heliophysics, Solar System Exploration, and Astrophysics. Goddard plays a leading role in NASA’s accomplishments by contributing compelling scientific knowledge to advance the Agency’s mission. <b>Follow us on <a href="http://twitter.com/NASA_GoddardPix" rel="nofollow">Twitter</a></b> <b>Like us on <a href="http://www.facebook.com/pages/Greenbelt-MD/NASA-Goddard/395013845897?ref=tsd" rel="nofollow">Facebook</a></b> <b>Find us on <a href="http://instagram.com/nasagoddard?vm=grid" rel="nofollow">Instagram</a></b>
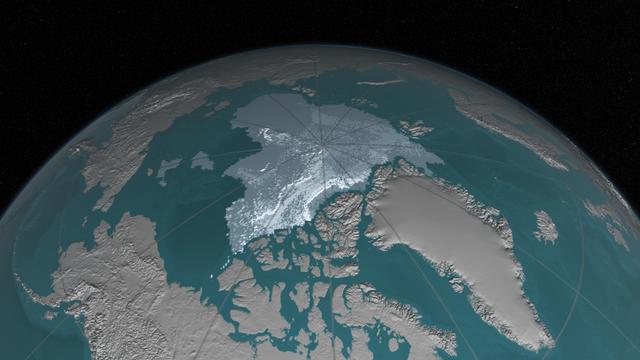
Arctic sea ice, the vast sheath of frozen seawater floating on the Arctic Ocean and its neighboring seas, has been hit with a double whammy over the past decades: as its extent shrunk, the oldest and thickest ice has either thinned or melted away, leaving the sea ice cap more vulnerable to the warming ocean and atmosphere. “What we’ve seen over the years is that the older ice is disappearing,” said Walt Meier, a sea ice researcher at NASA’s Goddard Space Flight Center in Greenbelt, Maryland. “This older, thicker ice is like the bulwark of sea ice: a warm summer will melt all the young, thin ice away but it can’t completely get rid of the older ice. But this older ice is becoming weaker because there’s less of it and the remaining old ice is more broken up and thinner, so that bulwark is not as good as it used to be.” Read more: <a href="http://go.nasa.gov/2dPJ9zT" rel="nofollow">go.nasa.gov/2dPJ9zT</a> <b><a href="http://www.nasa.gov/audience/formedia/features/MP_Photo_Guidelines.html" rel="nofollow">NASA image use policy.</a></b> <b><a href="http://www.nasa.gov/centers/goddard/home/index.html" rel="nofollow">NASA Goddard Space Flight Center</a></b> enables NASA’s mission through four scientific endeavors: Earth Science, Heliophysics, Solar System Exploration, and Astrophysics. Goddard plays a leading role in NASA’s accomplishments by contributing compelling scientific knowledge to advance the Agency’s mission. <b>Follow us on <a href="http://twitter.com/NASAGoddardPix" rel="nofollow">Twitter</a></b> <b>Like us on <a href="http://www.facebook.com/pages/Greenbelt-MD/NASA-Goddard/395013845897?ref=tsd" rel="nofollow">Facebook</a></b> <b>Find us on <a href="http://instagrid.me/nasagoddard/?vm=grid" rel="nofollow">Instagram</a></b>
There has been considerable interest in the recent state of Arctic sea ice for scientific research and for operational applications especially along the Northern Sea Route and the Northwest Passage.
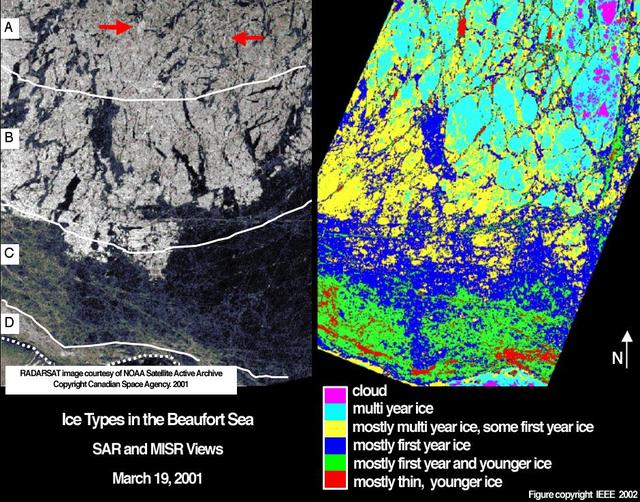
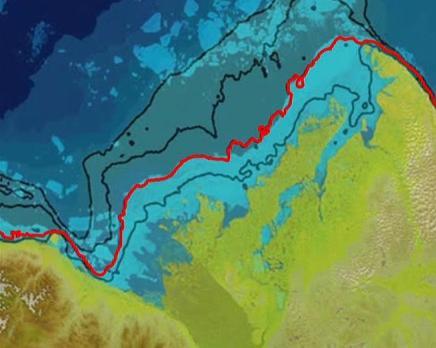
Sea ice in the Beaufort Sea off the north coast of Alaska was classified and mapped in these concurrent images acquired March 19, 2001 by NASA Terra spacecraft.
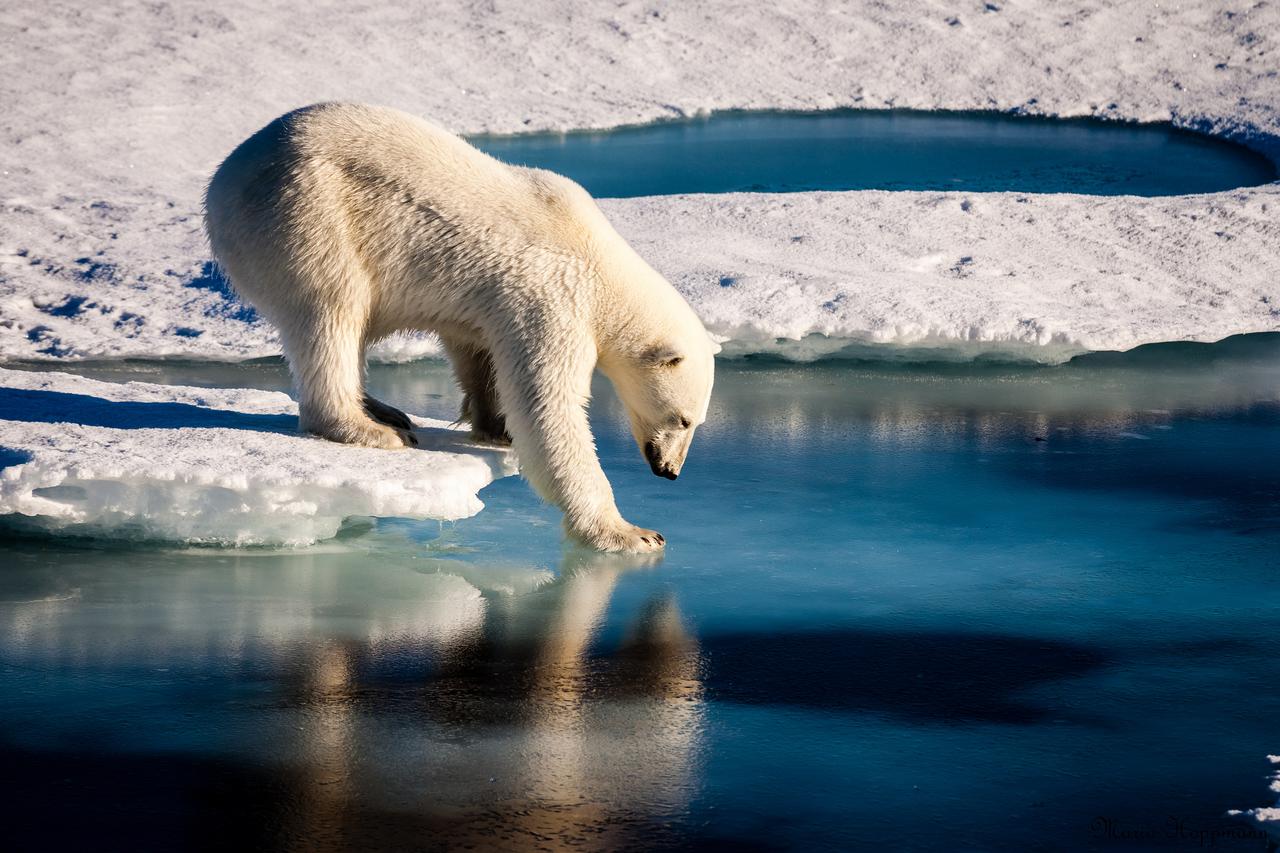
Polar bears already face shorter ice seasons - limiting prime hunting and breeding opportunities. Nineteen separate polar bear subpopulations live throughout the Arctic, spending their winters and springs roaming on sea ice and hunting. The bears have evolved mainly to eat seals, which provide necessary fats and nutrients in the harsh Arctic environment. Polar bears can't outswim their prey, so instead they perch on the ice as a platform and ambush seals at breathing holes or break through the ice to access their dens. The total number of ice-covered days declined at the rate of seven to 19 days per decade between 1979 and 2014. The decline was even greater in the Barents Sea and the Arctic basin. Sea ice concentration during the summer months — an important measure because summertime is when some subpopulations are forced to fast on land — also declined in all regions, by 1 percent to 9 percent per decade. Read more: <a href="http://go.nasa.gov/2cIZSSc" rel="nofollow">go.nasa.gov/2cIZSSc</a> Photo credit: Mario Hoppmann

The Visible Infrared Imaging Radiometer Suite (VIIRS) on the Suomi NPP satellite captured this view of extensive sea-ice fracturing off the northern coast of Alaska. The event began in late-January and spread west toward Banks Island throughout February and March 2013. Visualizations of the Arctic often give the impression that the ice cap is a continuous sheet of stationary, floating ice. In fact, it is a collection of smaller pieces that constantly shift, crack, and grind against one another as they are jostled by winds and ocean currents. Especially during the summer—but even during the height of winter—cracks—or leads—open up between pieces of ice. That was what was happening on the left side of the animation (seen here: <a href="http://bit.ly/10kE7sh" rel="nofollow">bit.ly/10kE7sh</a>) in late January. A high-pressure weather system was parked over the region, producing warmer temperatures and winds that flowed in a southwesterly direction. That fueled the Beaufort Gyre, a wind-driven ocean current that flows clockwise. The gyre was the key force pulling pieces of ice west past Point Barrow, the northern nub of Alaska that protrudes into the Beaufort Sea. “A fracturing event in this area is not unusual because the Beaufort Gyre tends to push ice away from Banks Island and the Canadian Archipelago,” explained Walt Meier of the National Snow & Ice Data Center (NSIDC). “Point Barrow can act like a ‘pin point’ where the ice catches and fractures to the north and east.” In February, however, a series of storms passing over central Alaska exacerbated the fracturing. Strong westerly winds prompted several large pieces of ice to break away in an arc-shaped wave that moved progressively east. By the end of February, large pieces of ice had fractured all the way to the western coast of Banks Island, a distance of about 1,000 kilometers (600 miles). The data used to create the animation came from the longwave infrared (thermal) portion of the electromagnetic spectrum, so the animation illustrates how much heat the surface was emitting as VIIRS surveyed the area. Cooler areas (sea ice) appear white, while warmer areas (open water) are dark. The light gray plume near the cracks is warmer, moister air escaping from the ocean and blowing downwind. Clouds do not show up well in the VIIRS thermal band, so the storms that fueled the fracturing are not readily visible. While fracturing events are common, few events sprawl across such a large area or produce cracks as long and wide as those seen here. The age of the sea ice in this area was one of the key reasons this event became so widespread. “The region is covered almost completely by seasonal or first-year ice—ice that has formed since last September,” said Meier. “This ice is thinner and weaker than the older, multi-year ice, so it responds more readily to winds and is more easily broken up.” NASA Earth Observatory images by Jesse Allen using VIIRS day-night band data from the Suomi National Polar-orbiting Partnership. Suomi NPP is the result of a partnership between NASA, the National Oceanic and Atmospheric Administration, and the Department of Defense. Caption by Adam Voiland. Instrument: Suomi NPP - VIIRS For more info go to: <a href="http://earthobservatory.nasa.gov/IOTD/view.php?id=80752" rel="nofollow">earthobservatory.nasa.gov/IOTD/view.php?id=80752</a> Credit: <b><a href="http://www.earthobservatory.nasa.gov/" rel="nofollow"> NASA Earth Observatory</a></b> <b><a href="http://www.nasa.gov/audience/formedia/features/MP_Photo_Guidelines.html" rel="nofollow">NASA image use policy.</a></b> <b><a href="http://www.nasa.gov/centers/goddard/home/index.html" rel="nofollow">NASA Goddard Space Flight Center</a></b> enables NASA’s mission through four scientific endeavors: Earth Science, Heliophysics, Solar System Exploration, and Astrophysics. Goddard plays a leading role in NASA’s accomplishments by contributing compelling scientific knowledge to advance the Agency’s mission. <b>Follow us on <a href="http://twitter.com/NASA_GoddardPix" rel="nofollow">Twitter</a></b> <b>Like us on <a href="http://www.facebook.com/pages/Greenbelt-MD/NASA-Goddard/395013845897?ref=tsd" rel="nofollow">Facebook</a></b> <b>Find us on <a href="http://instagram.com/nasagoddard?vm=grid" rel="nofollow">Instagram</a></b>

The Visible Infrared Imaging Radiometer Suite (VIIRS) on the Suomi NPP satellite captured this view of extensive sea-ice fracturing off the northern coast of Alaska. The event began in late-January and spread west toward Banks Island throughout February and March 2013. Visualizations of the Arctic often give the impression that the ice cap is a continuous sheet of stationary, floating ice. In fact, it is a collection of smaller pieces that constantly shift, crack, and grind against one another as they are jostled by winds and ocean currents. Especially during the summer—but even during the height of winter—cracks—or leads—open up between pieces of ice. That was what was happening on the left side of the animation (seen here: <a href="http://bit.ly/10kE7sh" rel="nofollow">bit.ly/10kE7sh</a>) in late January. A high-pressure weather system was parked over the region, producing warmer temperatures and winds that flowed in a southwesterly direction. That fueled the Beaufort Gyre, a wind-driven ocean current that flows clockwise. The gyre was the key force pulling pieces of ice west past Point Barrow, the northern nub of Alaska that protrudes into the Beaufort Sea. “A fracturing event in this area is not unusual because the Beaufort Gyre tends to push ice away from Banks Island and the Canadian Archipelago,” explained Walt Meier of the National Snow & Ice Data Center (NSIDC). “Point Barrow can act like a ‘pin point’ where the ice catches and fractures to the north and east.” In February, however, a series of storms passing over central Alaska exacerbated the fracturing. Strong westerly winds prompted several large pieces of ice to break away in an arc-shaped wave that moved progressively east. By the end of February, large pieces of ice had fractured all the way to the western coast of Banks Island, a distance of about 1,000 kilometers (600 miles). The data used to create the animation came from the longwave infrared (thermal) portion of the electromagnetic spectrum, so the animation illustrates how much heat the surface was emitting as VIIRS surveyed the area. Cooler areas (sea ice) appear white, while warmer areas (open water) are dark. The light gray plume near the cracks is warmer, moister air escaping from the ocean and blowing downwind. Clouds do not show up well in the VIIRS thermal band, so the storms that fueled the fracturing are not readily visible. While fracturing events are common, few events sprawl across such a large area or produce cracks as long and wide as those seen here. The age of the sea ice in this area was one of the key reasons this event became so widespread. “The region is covered almost completely by seasonal or first-year ice—ice that has formed since last September,” said Meier. “This ice is thinner and weaker than the older, multi-year ice, so it responds more readily to winds and is more easily broken up.” NASA Earth Observatory images by Jesse Allen using VIIRS day-night band data from the Suomi National Polar-orbiting Partnership. Suomi NPP is the result of a partnership between NASA, the National Oceanic and Atmospheric Administration, and the Department of Defense. Caption by Adam Voiland. Instrument: Suomi NPP - VIIRS For more info go to: <a href="http://earthobservatory.nasa.gov/IOTD/view.php?id=80752" rel="nofollow">earthobservatory.nasa.gov/IOTD/view.php?id=80752</a> Credit: <b><a href="http://www.earthobservatory.nasa.gov/" rel="nofollow"> NASA Earth Observatory</a></b> <b><a href="http://www.nasa.gov/audience/formedia/features/MP_Photo_Guidelines.html" rel="nofollow">NASA image use policy.</a></b> <b><a href="http://www.nasa.gov/centers/goddard/home/index.html" rel="nofollow">NASA Goddard Space Flight Center</a></b> enables NASA’s mission through four scientific endeavors: Earth Science, Heliophysics, Solar System Exploration, and Astrophysics. Goddard plays a leading role in NASA’s accomplishments by contributing compelling scientific knowledge to advance the Agency’s mission. <b>Follow us on <a href="http://twitter.com/NASA_GoddardPix" rel="nofollow">Twitter</a></b> <b>Like us on <a href="http://www.facebook.com/pages/Greenbelt-MD/NASA-Goddard/395013845897?ref=tsd" rel="nofollow">Facebook</a></b> <b>Find us on <a href="http://instagram.com/nasagoddard?vm=grid" rel="nofollow">Instagram</a></b>
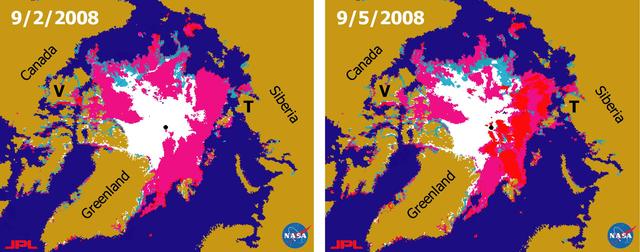
This frame from a NASA MODIS animation depicts warming sea surface temperatures in the Arctic Beaufort Sea after warm waters from Canada Mackenzie River broke through a shoreline sea ice barrier in summer 2012, enhancing the melting of sea ice.
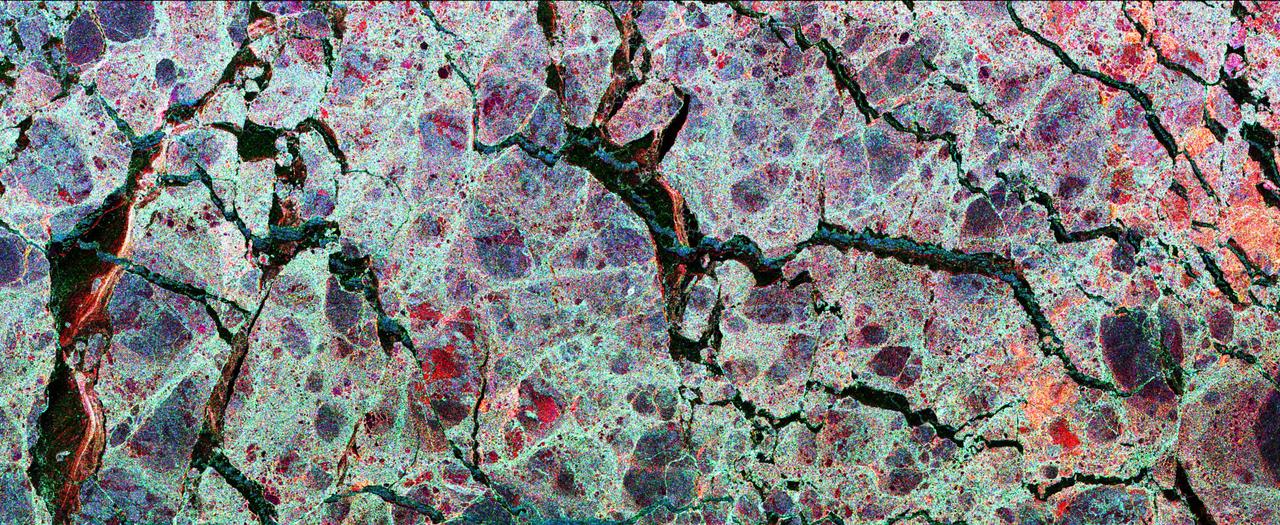
This is the first calibrated, multi-frequency, multi-polarization spaceborne radar image of the seasonal sea-ice cover in the Weddell Sea, Antarctica. The multi-channel data provide scientists with details about the ice pack they cannot see any other way and indicates that the large expanse of sea-ice is, in fact, comprised of many smaller rounded ice floes, shown in blue-gray. These data are particularly useful in helping scientists estimate the thickness of the ice cover which is often extremely difficult to measure with other remote sensing systems. The extent, and especially thickness, of the polar ocean's sea-ice cover together have important implications for global climate by regulating the loss of heat from the ocean to the cold polar atmosphere. The image was acquired on October 3, 1994, by the Spaceborne Imaging Radar-C/X-Band Synthetic Aperture Radar (SIR-C/X-SAR) onboard the space shuttle Endeavour. This image is produced by overlaying three channels of radar data in the following colors: red (C-band, HH-polarization), green (L-band HV-polarization), and blue (L-band, HH-polarization). The image is oriented almost east-west with a center location of 58.2 degrees South and 21.6 degrees East. Image dimensions are 45 kilometers by 18 kilometers (28 miles by 11 miles). Most of the ice cover is composed of rounded, undeformed blue-gray floes, about 0.7 meters (2 feet) thick, which are surrounded by a jumble of red-tinged deformed ice pieces which are up to 2 meters (7 feet) thick. The winter cycle of ice growth and deformation often causes this ice cover to split apart, exposing open water or "leads." Ice growth within these openings is rapid due to the cold, brisk Antarctic atmosphere. Different stages of new-ice growth can be seen within the linear leads, resulting from continuous opening and closing. The blue lines within the leads are open water areas in new fractures which are roughened by wind. The bright red lines are an intermediate stage of new-ice growth perhaps 5 to 10 centimeters (2 to 4 inches) thick. The more extensive dark zones are covered by a slightly thicker layer of smooth, level ice up to 70 centimeters (28 inches) thick. http://photojournal.jpl.nasa.gov/catalog/PIA01786
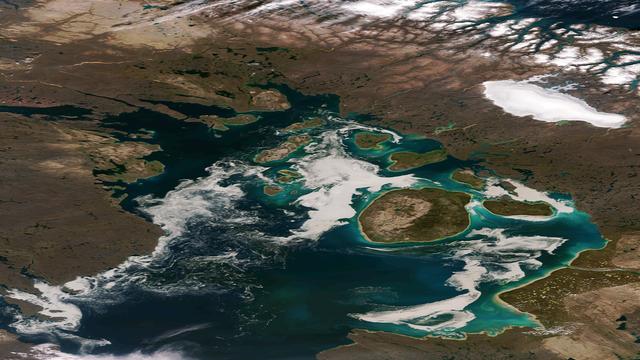
The remnants of sea ice along the Northwestern Passage in northern Canada are seen swirling with the blue green of phytoplankton in this image from the Suomi NPP VIIRS sensor, acquired on August 11, 2013. NASA/NOAA <b><a href="http://www.nasa.gov/audience/formedia/features/MP_Photo_Guidelines.html" rel="nofollow">NASA image use policy.</a></b> <b><a href="http://www.nasa.gov/centers/goddard/home/index.html" rel="nofollow">NASA Goddard Space Flight Center</a></b> enables NASA’s mission through four scientific endeavors: Earth Science, Heliophysics, Solar System Exploration, and Astrophysics. Goddard plays a leading role in NASA’s accomplishments by contributing compelling scientific knowledge to advance the Agency’s mission. <b>Follow us on <a href="http://twitter.com/NASA_GoddardPix" rel="nofollow">Twitter</a></b> <b>Like us on <a href="http://www.facebook.com/pages/Greenbelt-MD/NASA-Goddard/395013845897?ref=tsd" rel="nofollow">Facebook</a></b> <b>Find us on <a href="http://instagram.com/nasagoddard?vm=grid" rel="nofollow">Instagram</a></b>
An iceberg is seen out the window of NASA's DC-8 research aircraft as it flies 2,000 feet above the Amundsen Sea in West Antarctica on Wednesday, Oct., 21, 2009. This was the fourth science flight of NASA’s Operation Ice Bridge airborne Earth science mission to study Antarctic ice sheets, sea ice, and ice shelves. Photo Credit: (NASA/Jane Peterson)
NASA image acquired October 16, 2012 The MODIS instrument on NASA's Aqua satellite captured this visible image of Sea Ice off eastern Greenland on October 16, 2012. NASA/GSFC/Jeff Schmaltz/MODIS Land Rapid Response Team <b><a href="http://www.nasa.gov/audience/formedia/features/MP_Photo_Guidelines.html" rel="nofollow">NASA image use policy.</a></b> <b><a href="http://www.nasa.gov/centers/goddard/home/index.html" rel="nofollow">NASA Goddard Space Flight Center</a></b> enables NASA’s mission through four scientific endeavors: Earth Science, Heliophysics, Solar System Exploration, and Astrophysics. Goddard plays a leading role in NASA’s accomplishments by contributing compelling scientific knowledge to advance the Agency’s mission. <b>Follow us on <a href="http://twitter.com/NASA_GoddardPix" rel="nofollow">Twitter</a></b> <b>Like us on <a href="http://www.facebook.com/pages/Greenbelt-MD/NASA-Goddard/395013845897?ref=tsd" rel="nofollow">Facebook</a></b> <b>Find us on <a href="http://instagrid.me/nasagoddard/?vm=grid" rel="nofollow">Instagram</a></b>
![NASA researchers have new [sic] insights into the mysteries of Arctic sea ice, thanks to the unique abilities of Canada Radarsat satellite.](https://images-assets.nasa.gov/image/PIA02971/PIA02971~thumb.jpg)
NASA researchers have new [sic] insights into the mysteries of Arctic sea ice, thanks to the unique abilities of Canada Radarsat satellite.

On July 12, 2011, crew from the U.S. Coast Guard Cutter Healy retrieved a canister dropped by parachute from a C-130, which brought supplies for some mid-mission fixes. The ICESCAPE mission, or "Impacts of Climate on Ecosystems and Chemistry of the Arctic Pacific Environment," is NASA's two-year shipborne investigation to study how changing conditions in the Arctic affect the ocean's chemistry and ecosystems. The bulk of the research takes place in the Beaufort and Chukchi seas in summer 2010 and 2011. Credit: NASA/Kathryn Hansen For updates on the five-week ICESCAPE voyage, visit the mission blog at: go.usa.gov/WwU <b><a href="http://www.nasa.gov/audience/formedia/features/MP_Photo_Guidelines.html" rel="nofollow">NASA image use policy.</a></b> <b><a href="http://www.nasa.gov/centers/goddard/home/index.html" rel="nofollow">NASA Goddard Space Flight Center</a></b> enables NASA’s mission through four scientific endeavors: Earth Science, Heliophysics, Solar System Exploration, and Astrophysics. Goddard plays a leading role in NASA’s accomplishments by contributing compelling scientific knowledge to advance the Agency’s mission. <b>Follow us on <a href="http://twitter.com/NASA_GoddardPix" rel="nofollow">Twitter</a></b> <b>Like us on <a href="http://www.facebook.com/pages/Greenbelt-MD/NASA-Goddard/395013845897?ref=tsd" rel="nofollow">Facebook</a></b> <b>Find us on <a href="http://instagrid.me/nasagoddard/?vm=grid" rel="nofollow">Instagram</a></b>
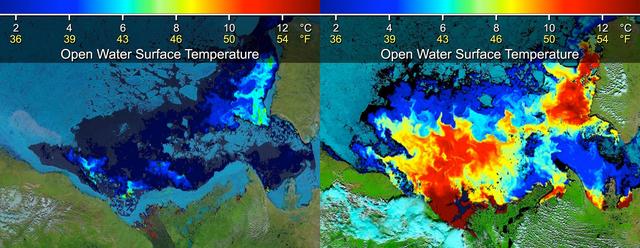
Beaufort Sea surface temperatures where Canada Mackenzie River discharges into the Arctic Ocean, measured by NASA MODIS instrument; warm river waters had broken through a shoreline sea ice barrier to enhance sea ice melt.
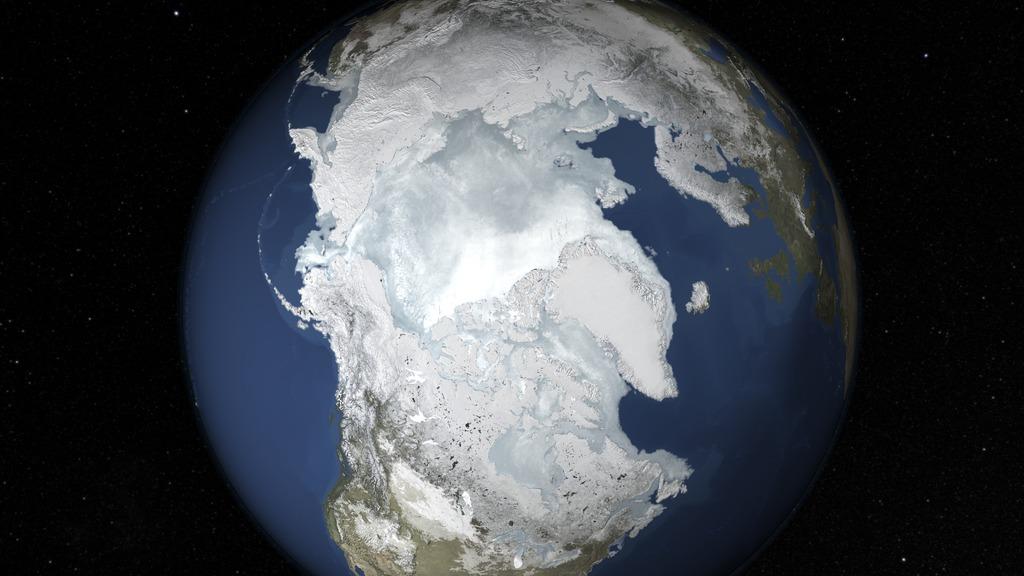
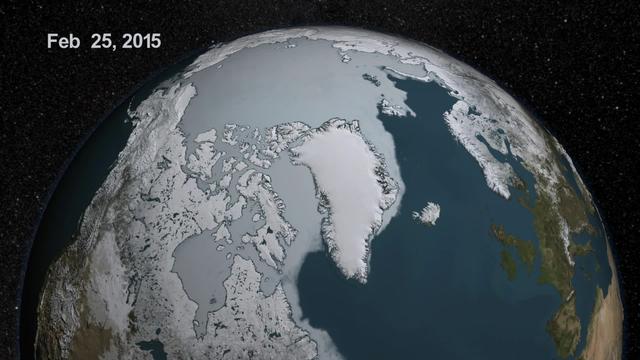
The sea ice cap of the Arctic appeared to reach its annual maximum winter extent on Feb. 25, according to data from the NASA-supported National Snow and Ice Data Center (NSIDC) at the University of Colorado, Boulder. At 5.61 million square miles (14.54 million square kilometers), this year’s maximum extent was the smallest on the satellite record and also one of the earliest. Read more: <a href="http://1.usa.gov/1Eyvelz" rel="nofollow">1.usa.gov/1Eyvelz</a> Credit: NASA's Goddard Space Flight Center <b><a href="http://www.nasa.gov/audience/formedia/features/MP_Photo_Guidelines.html" rel="nofollow">NASA image use policy.</a></b> <b><a href="http://www.nasa.gov/centers/goddard/home/index.html" rel="nofollow">NASA Goddard Space Flight Center</a></b> enables NASA’s mission through four scientific endeavors: Earth Science, Heliophysics, Solar System Exploration, and Astrophysics. Goddard plays a leading role in NASA’s accomplishments by contributing compelling scientific knowledge to advance the Agency’s mission. <b>Follow us on <a href="http://twitter.com/NASAGoddardPix" rel="nofollow">Twitter</a></b> <b>Like us on <a href="http://www.facebook.com/pages/Greenbelt-MD/NASA-Goddard/395013845897?ref=tsd" rel="nofollow">Facebook</a></b> <b>Find us on <a href="http://instagrid.me/nasagoddard/?vm=grid" rel="nofollow">Instagram</a></b>
The sea ice cap of the Arctic appeared to reach its annual maximum winter extent on February 25, according to data from the NASA-supported National Snow and Ice Data Center (NSIDC) at the University of Colorado, Boulder. At 5.61 million square miles (14.54 million square kilometers), this year’s maximum extent was the smallest on the satellite record and also one of the earliest. Credit: NASA Goddard Space Flight Center <b><a href="http://www.nasa.gov/audience/formedia/features/MP_Photo_Guidelines.html" rel="nofollow">NASA image use policy.</a></b> <b><a href="http://www.nasa.gov/centers/goddard/home/index.html" rel="nofollow">NASA Goddard Space Flight Center</a></b> enables NASA’s mission through four scientific endeavors: Earth Science, Heliophysics, Solar System Exploration, and Astrophysics. Goddard plays a leading role in NASA’s accomplishments by contributing compelling scientific knowledge to advance the Agency’s mission. <b>Follow us on <a href="http://twitter.com/NASAGoddardPix" rel="nofollow">Twitter</a></b> <b>Like us on <a href="http://www.facebook.com/pages/Greenbelt-MD/NASA-Goddard/395013845897?ref=tsd" rel="nofollow">Facebook</a></b> <b>Find us on <a href="http://instagrid.me/nasagoddard/?vm=grid" rel="nofollow">Instagram</a></b>
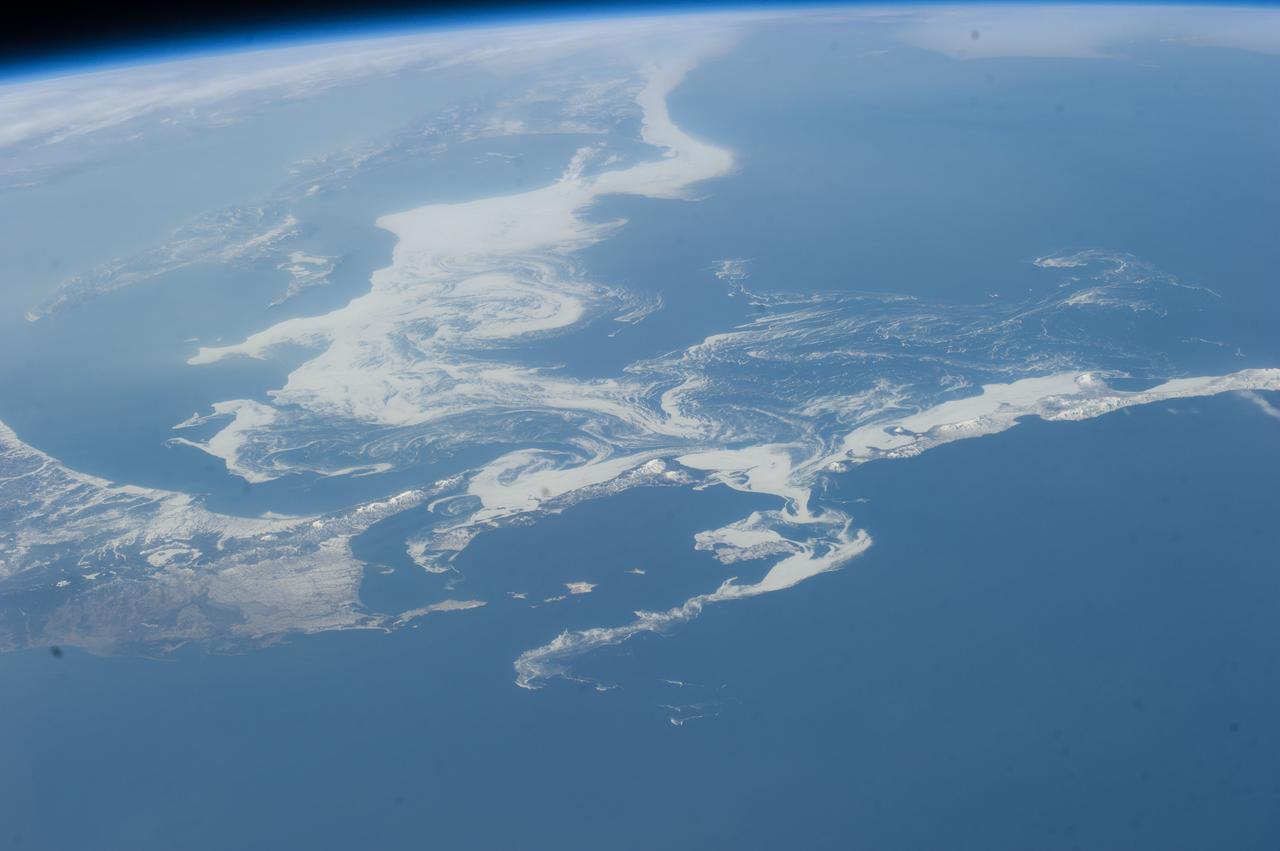
iss071e046021 (April 27, 2024) -- Off the coast of Newfoundland, NASA astronaut Mike Barratt captured this image of sea ice as the International Space Station orbited 258 miles above the North Atlantic Ocean. The sea ice appears in swirls floating on the ocean's surface. From the orbiting laboratory's unique vantage point, astronauts can observe events on our home planet that are otherwise impossible to witness on the ground.

A small hole in the clouds revealed newly formed sea ice in the Bellingshausen Sea next to an ice berg on Nov. 5, 2014 flight. Image Credit: NASA/Digital Mapping System NASA’s Operation IceBridge collected some rare images on a flight out of Punta Arenas, Chile on Nov. 5, 2014, on a science flight over western Antarctica dubbed Ferrigno-Alison-Abbott 01. The crew snapped a few shots of a calving front of the Antarctic ice sheet. This particular flight plan was designed to collect data on changes in ice elevation along the coast near the Ferrigno and Alison ice streams, on the Abbot Ice Shelf, and grounded ice along the Eights Coast.
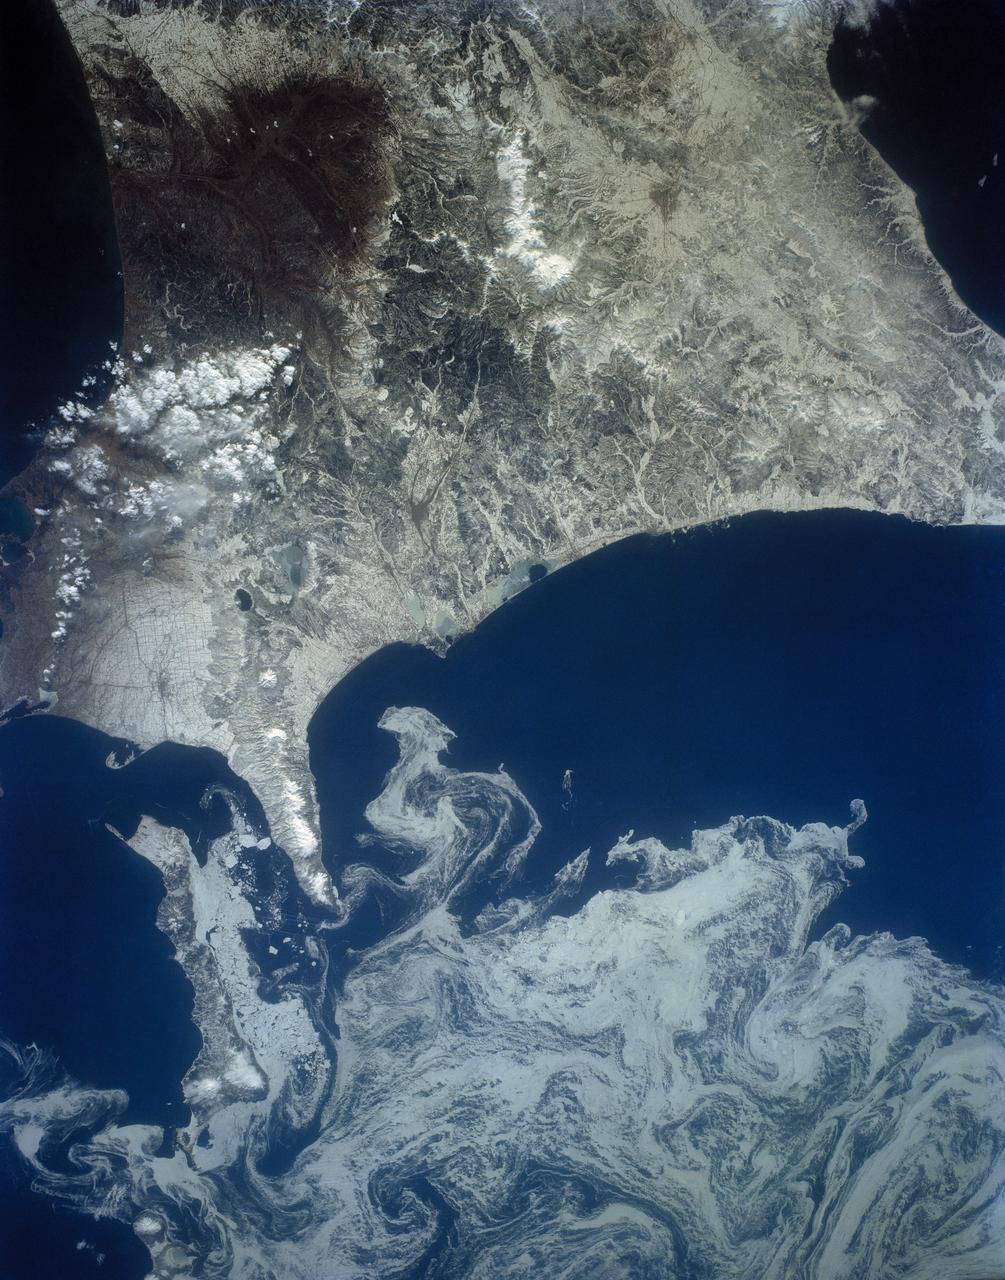
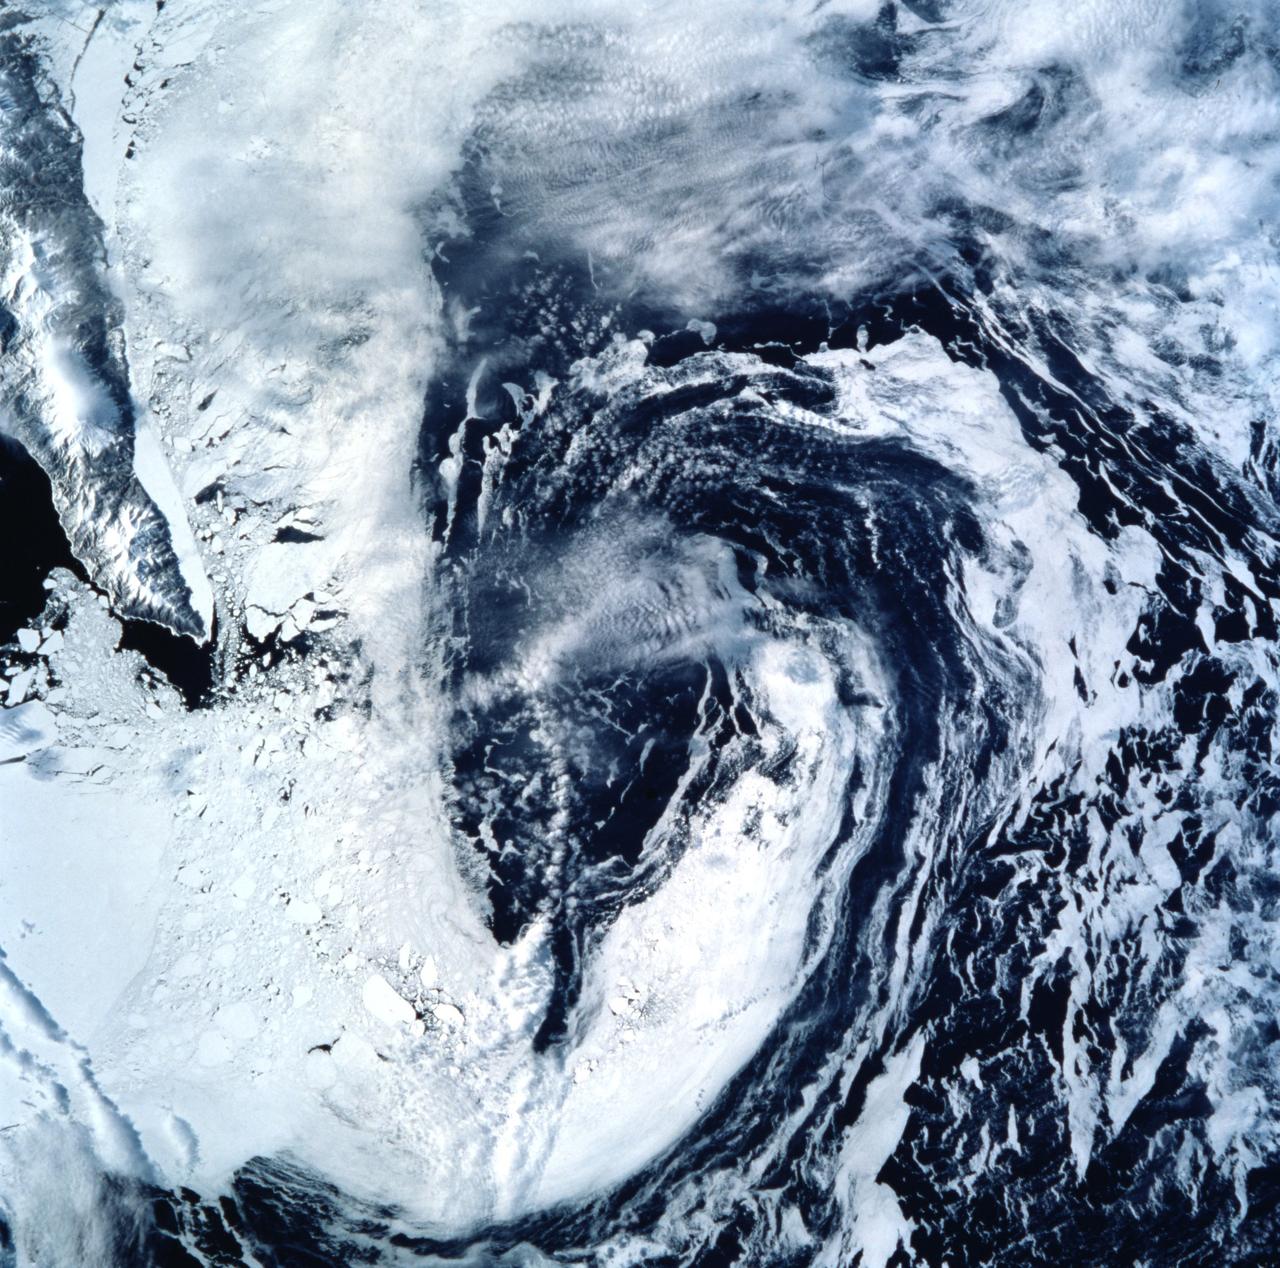
The northeast coast of Hokkaido and Kunashir Island, Japan (44.0N, 143.0E) are seen bordered by drifting sea ice. The sea ice has formed a complex pattern of eddies in response to surface water currents and winds. Photos of this kind aid researchers in describing local ocean current patterns and the effects of wind speed and direction on the drift of surface material, such as ice floes or oil. Kunashir is the southernmost of the Kuril Islands.
SL4-141-4340 (20 Jan. 1974) --- An oblique view of the southern part of the Sea of Okhotsk, north of Japan, as photographed from the Skylab space station in Earth orbit by one of the Skylab 4 crewmen. The camera used was a hand-held 70mm Hasselblad, and SO-368 medium-speed Ektachrome. NORTH IS AT THE TOP WHEN THE PICTURE IS HELD WITH THE LARGEST LAND MASS AT THE BOTTOM. Most of the land area is Hokkaido Island, Japan. The southern tip of Sakhalin Island (Soviet Union) is in the northwest corner. This photograph was taken to aid in the study of the formation of sea ice. Comparison of these photographs will be made with observations made during a joint USSR-U.S. experiment in the Bering Sea a year earlier. Observations in the Sea of Okhotsk are of interest because the ice has a morphology similar to that of the Bering Sea. Photo credit: NASA
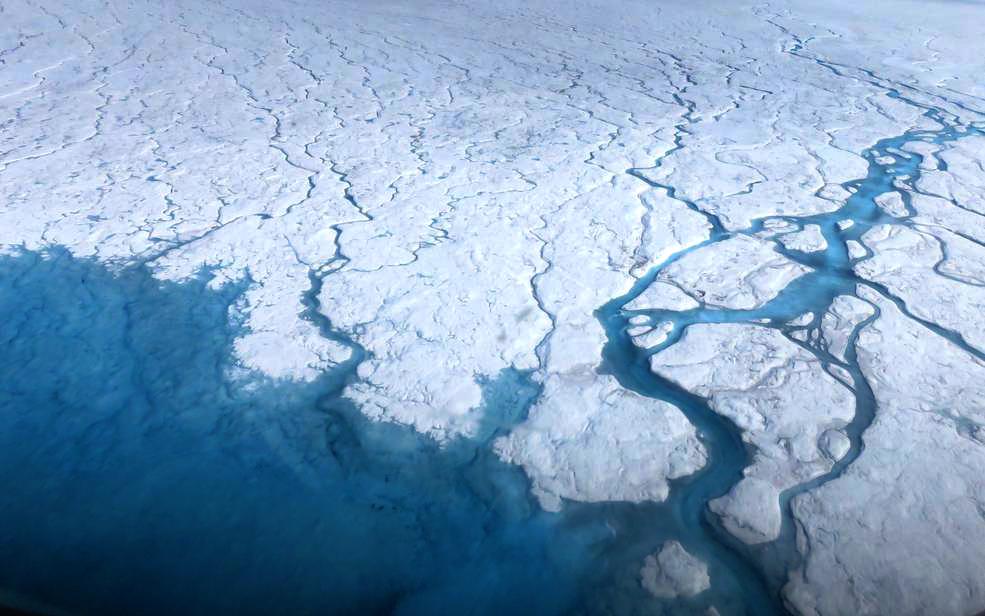
Streams and rivers that form on top of the Greenland ice sheet during spring and summer are the main agent transporting melt runoff from the ice sheet to the ocean. “Surface melting in Greenland has increased recently, and we lacked a rigorous estimate of the water volumes being produced and their transport,” said Tom Wagner, the cryosphere program scientist at NASA Headquarters in Washington. “NASA funds fieldwork like Smith’s because it helps us to interpret satellite data, and to extrapolate measurements from the local field sites to the larger ice sheet." Credit: NASA/Goddard/Maria-José Viñas Read more: <a href="http://www.nasa.gov/feature/a-summer-of-nasa-research-on-sea-level-rise-in-greenland" rel="nofollow">www.nasa.gov/feature/a-summer-of-nasa-research-on-sea-lev...</a> <b><a href="http://www.nasa.gov/audience/formedia/features/MP_Photo_Guidelines.html" rel="nofollow">NASA image use policy.</a></b> <b><a href="http://www.nasa.gov/centers/goddard/home/index.html" rel="nofollow">NASA Goddard Space Flight Center</a></b> enables NASA’s mission through four scientific endeavors: Earth Science, Heliophysics, Solar System Exploration, and Astrophysics. Goddard plays a leading role in NASA’s accomplishments by contributing compelling scientific knowledge to advance the Agency’s mission. <b>Follow us on <a href="http://twitter.com/NASAGoddardPix" rel="nofollow">Twitter</a></b> <b>Like us on <a href="http://www.facebook.com/pages/Greenbelt-MD/NASA-Goddard/395013845897?ref=tsd" rel="nofollow">Facebook</a></b> <b>Find us on <a href="http://instagrid.me/nasagoddard/?vm=grid" rel="nofollow">Instagram</a></b>
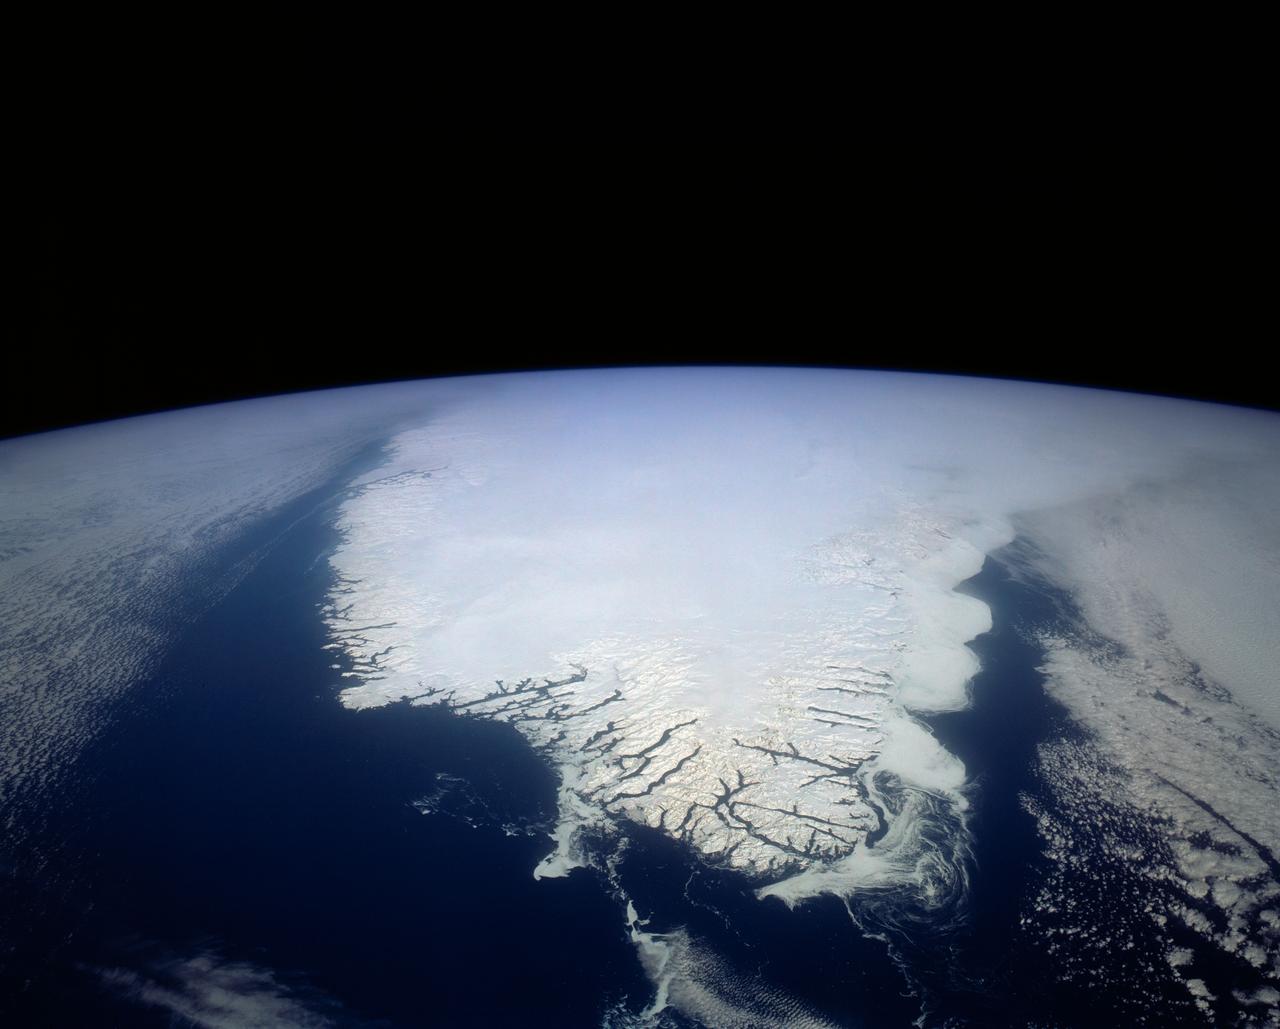
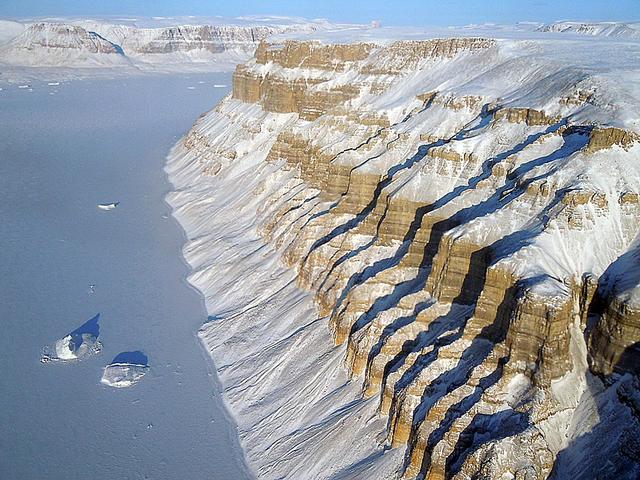
This spectacular north looking view of south Greenland (62.0N, 46.0W) shows numerous indentations along the coastline, many of which contain small settlements. These indentations are fiords carved by glaciers of the last ice age. Even today, ice in the center of Greenland is as much as 10,000 ft. thick and great rivers of ice continuously flow toward the sea, where they melt or break off as icebergs - some of which may be seen floating offshore.
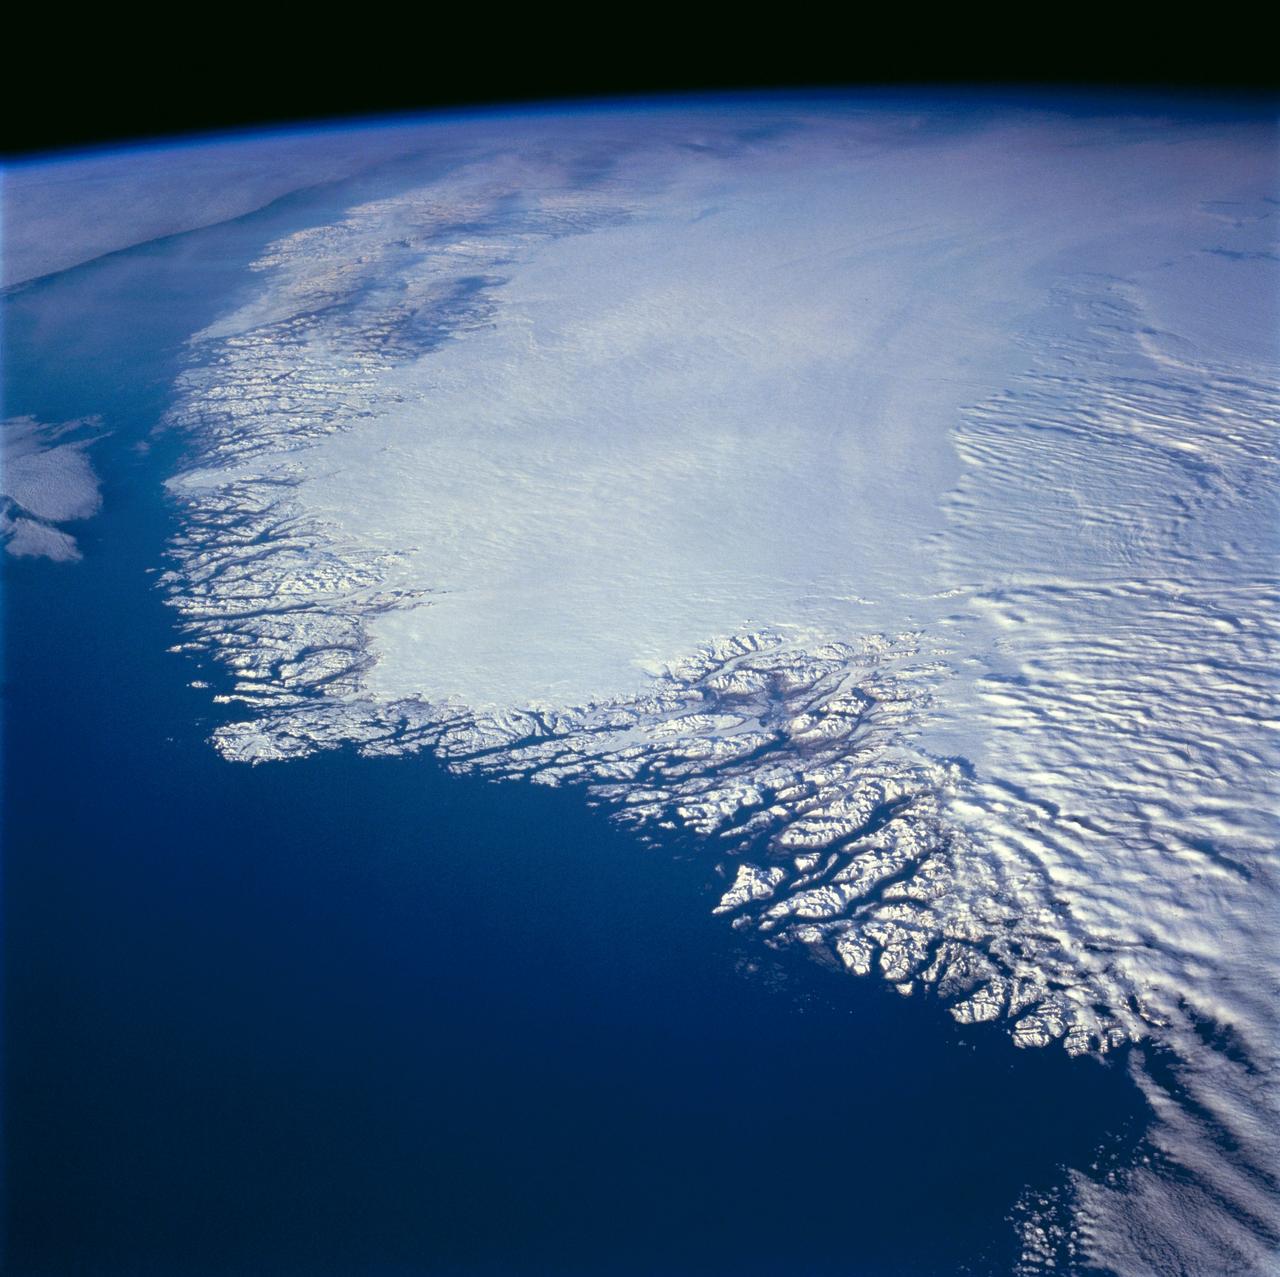
This north-looking view of southwestern Greenland was taken in November, 1994, and shows numerous indentations, many of which contain small settlements. These fjords were carved by the glaciers of the last ice age 10,000 years ago. Even today, the ice in the center of Greenland is nearly 3,500 meters (11,000 feet) thick and great rivers of ice continuously flow down toward the sea, where they melt or break off as icebergs. Some Icebergs exceed the size of small islands, weigh several million tons, and rise several hundred feet above the sea surface. Cape Farewell is visible toward the bottom right of the view. Julianehab Bay and the Bredev fjord can be seen toward the center of the photograph. Godthab, the main settlement on Greenland, is barely visible to the north of the Frederikeshabs Icefield near the left center of the view.
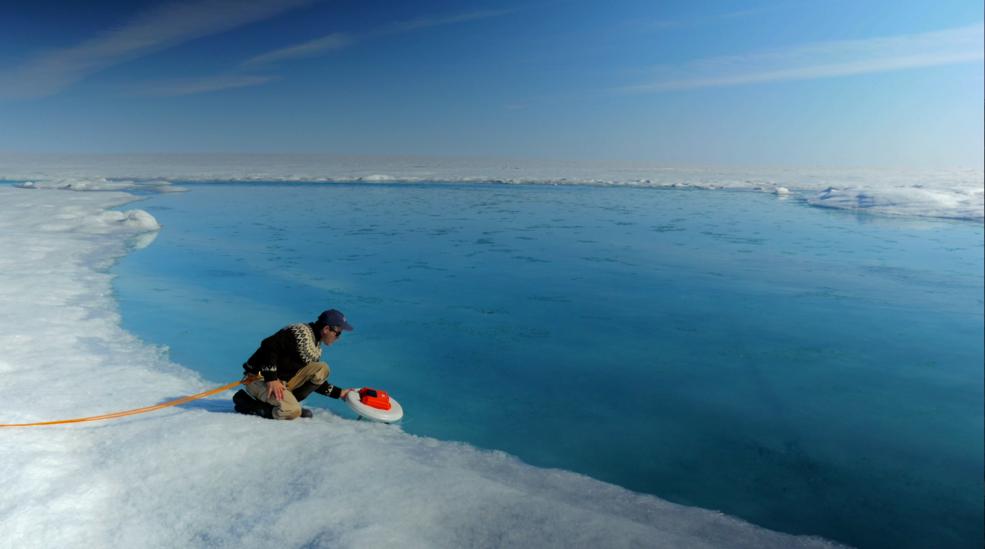
Laurence Smith, chair of geography at University of California, Los Angeles, deploys an autonomous drift boat equipped with several sensors in a meltwater river on the surface of the Greenland ice sheet on July 19, 2015. “Surface melting in Greenland has increased recently, and we lacked a rigorous estimate of the water volumes being produced and their transport,” said Tom Wagner, the cryosphere program scientist at NASA Headquarters in Washington. “NASA funds fieldwork like Smith’s because it helps us to interpret satellite data, and to extrapolate measurements from the local field sites to the larger ice sheet." Credit: NASA/Goddard/Jefferson Beck Read more: <a href="http://www.nasa.gov/feature/a-summer-of-nasa-research-on-sea-level-rise-in-greenland" rel="nofollow">www.nasa.gov/feature/a-summer-of-nasa-research-on-sea-lev...</a> <b><a href="http://www.nasa.gov/audience/formedia/features/MP_Photo_Guidelines.html" rel="nofollow">NASA image use policy.</a></b> <b><a href="http://www.nasa.gov/centers/goddard/home/index.html" rel="nofollow">NASA Goddard Space Flight Center</a></b> enables NASA’s mission through four scientific endeavors: Earth Science, Heliophysics, Solar System Exploration, and Astrophysics. Goddard plays a leading role in NASA’s accomplishments by contributing compelling scientific knowledge to advance the Agency’s mission. <b>Follow us on <a href="http://twitter.com/NASAGoddardPix" rel="nofollow">Twitter</a></b> <b>Like us on <a href="http://www.facebook.com/pages/Greenbelt-MD/NASA-Goddard/395013845897?ref=tsd" rel="nofollow">Facebook</a></b> <b>Find us on <a href="http://instagrid.me/nasagoddard/?vm=grid" rel="nofollow">Instagram</a></b>
November 21, 2013 - NASA's Operation IceBridge P-3 landed a few minutes ago after a successful survey of sea ice in the Ross Sea. In this photo taken by project scientist Michael Studinger we see icebergs in Sulzberger Bay off of the eastern portion of the Ross Sea. NASA's Operation IceBridge is an airborne science mission to study Earth's polar ice. In 2013, IceBridge is conducting its first field campaign directly from Antarctica. For more information about IceBridge, visit: <a href="http://www.nasa.gov/icebridge" rel="nofollow">www.nasa.gov/icebridge</a> Credit: NASA/GSFC/Michael Studinger <b><a href="http://www.nasa.gov/audience/formedia/features/MP_Photo_Guidelines.html" rel="nofollow">NASA image use policy.</a></b> <b><a href="http://www.nasa.gov/centers/goddard/home/index.html" rel="nofollow">NASA Goddard Space Flight Center</a></b> enables NASA’s mission through four scientific endeavors: Earth Science, Heliophysics, Solar System Exploration, and Astrophysics. Goddard plays a leading role in NASA’s accomplishments by contributing compelling scientific knowledge to advance the Agency’s mission. <b>Follow us on <a href="http://twitter.com/NASA_GoddardPix" rel="nofollow">Twitter</a></b> <b>Like us on <a href="http://www.facebook.com/pages/Greenbelt-MD/NASA-Goddard/395013845897?ref=tsd" rel="nofollow">Facebook</a></b> <b>Find us on <a href="http://instagram.com/nasagoddard?vm=grid" rel="nofollow">Instagram</a></b>
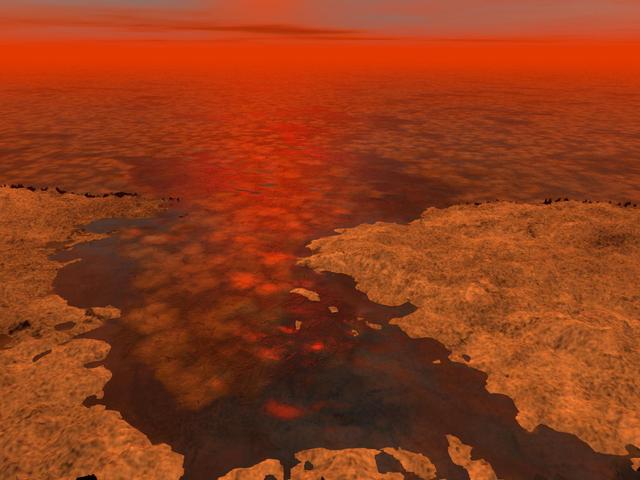
This artist concept envisions what hydrocarbon ice forming on a liquid hydrocarbon sea of Saturn moon Titan might look like.

The figure demonstrates of the capability of the SeaWinds instrument on NASA QuikScat satellite in monitoring both sea ice and ocean surface wind, thus helping to further our knowledge in wind-ice interaction and its effect on climate change.
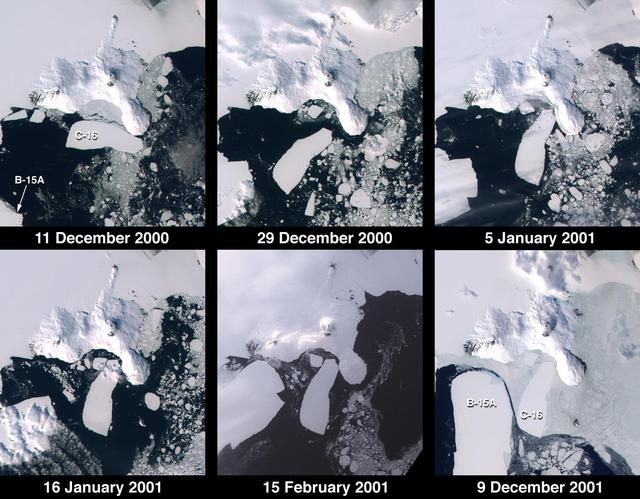
These images from NASA Terra satellite documented iceberg movements and changes in sea ice between December 11, 2000 and December 9, 2001.
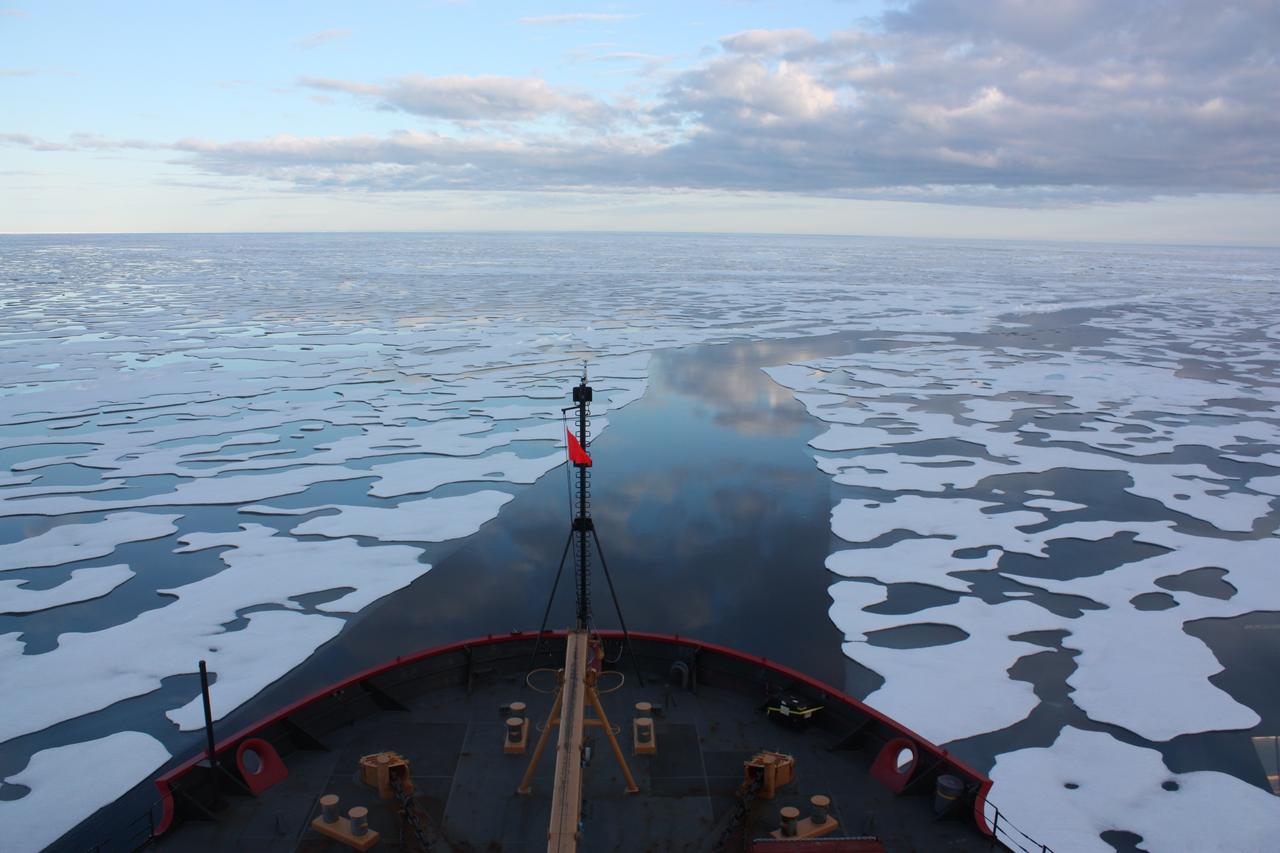
Scientists on board the U.S. Coast Guard Cutter Healy in the Beaufort Sea, northeast of Barrow, Alaska, finished collecting the mission¹s sea ice data and cruised south on July 20, 2011, through thin ice and ultimately into the open ocean. The ICESCAPE mission, or "Impacts of Climate on Ecosystems and Chemistry of the Arctic Pacific Environment," is a NASA shipborne investigation to study how changing conditions in the Arctic affect the ocean's chemistry and ecosystems. The bulk of the research took place in the Beaufort and Chukchi seas in summer 2010 and 2011. Credit: NASA/Kathryn Hansen Credit: NASA/Kathryn Hansen <b><a href="http://www.nasa.gov/audience/formedia/features/MP_Photo_Guidelines.html" rel="nofollow">NASA image use policy.</a></b> <b><a href="http://www.nasa.gov/centers/goddard/home/index.html" rel="nofollow">NASA Goddard Space Flight Center</a></b> enables NASA’s mission through four scientific endeavors: Earth Science, Heliophysics, Solar System Exploration, and Astrophysics. Goddard plays a leading role in NASA’s accomplishments by contributing compelling scientific knowledge to advance the Agency’s mission. <b>Follow us on <a href="http://twitter.com/NASA_GoddardPix" rel="nofollow">Twitter</a></b> <b>Like us on <a href="http://www.facebook.com/pages/Greenbelt-MD/NASA-Goddard/395013845897?ref=tsd" rel="nofollow">Facebook</a></b> <b>Find us on <a href="http://instagrid.me/nasagoddard/?vm=grid" rel="nofollow">Instagram</a></b>

Wonders in the Antarctic Sea and Sky NASA aircraft and scientists have returned to the United States after a short ice-surveying mission to #Antarctica. Despite having only a week of flying time, the team returned with crucial scientific data and a trove of spectacular aerial photographs. The flights over Antarctica were part of Operation #IceBridge, a multi-year mission to monitor conditions in Antarctica and the Arctic until a new ice-monitoring satellite, ICESat-2, launches in 2016. ICESat-1 was decommissioned in 2009, and IceBridge aircraft have been flying ever since. Laser altimeter and radar data are the primary products of the mission, but IceBridge project scientist Michael Studinger almost always has his digital camera ready as well. On November 24, 2013, he took this photograph of a multi-layered lenticular cloud hovering near Mount Discovery, a volcano about 70 kilometers (44 miles) southwest of McMurdo. Lenticular #clouds are a type of wave cloud. They usually form when a layer of air near the surface encounters a topographic barrier, gets pushed upward, and flows over it as a series of atmospheric gravity waves. Lenticular clouds form at the crest of the waves, where the air is coolest and water vapor is most likely to condense into cloud droplets. The bulging sea ice in the foreground is a pressure ridge, which formed when separate ice floes collided and piled up on each other. Read more: <a href="http://1.usa.gov/18lXIQS" rel="nofollow">1.usa.gov/18lXIQS</a> Photograph courtesy of Michael Studinger. Caption by Adam Voiland of NASA's Earth Observatory. <b><a href="http://www.nasa.gov/audience/formedia/features/MP_Photo_Guidelines.html" rel="nofollow">NASA image use policy.</a></b> <b><a href="http://www.nasa.gov/centers/goddard/home/index.html" rel="nofollow">NASA Goddard Space Flight Center</a></b> enables NASA’s mission through four scientific endeavors: Earth Science, Heliophysics, Solar System Exploration, and Astrophysics. Goddard plays a leading role in NASA’s accomplishments by contributing compelling scientific knowledge to advance the Agency’s mission. <b>Follow us on <a href="http://twitter.com/NASA_GoddardPix" rel="nofollow">Twitter</a></b> <b>Like us on <a href="http://www.facebook.com/pages/Greenbelt-MD/NASA-Goddard/395013845897?ref=tsd" rel="nofollow">Facebook</a></b> <b>Find us on <a href="http://instagram.com/nasagoddard?vm=grid" rel="nofollow">Instagram</a></b>

Clark University's Luke Trusel works amid sea ice in the Chukchi Sea on July 9, 2010, and logs the depths at which measurements are collected below the ice. The research is part of NASA's ICESCAPE mission to sample the physical, chemical and biological characteristics of the ocean and sea ice. Impacts of Climate change on the Eco-Systems and Chemistry of the Arctic Pacific Environment (ICESCAPE) is a multi-year NASA shipborne project. The bulk of the research will take place in the Beaufort and Chukchi Sea’s in summer of 2010 and fall of 2011. Photo Credit: (NASA/Kathryn Hansen)
Jupiter moon Europa, as seen in this image taken June 27, 1996 by NASA Galileo spacecraft, displays features in some areas resembling ice floes seen in Earth polar seas. http://photojournal.jpl.nasa.gov/catalog/PIA00291
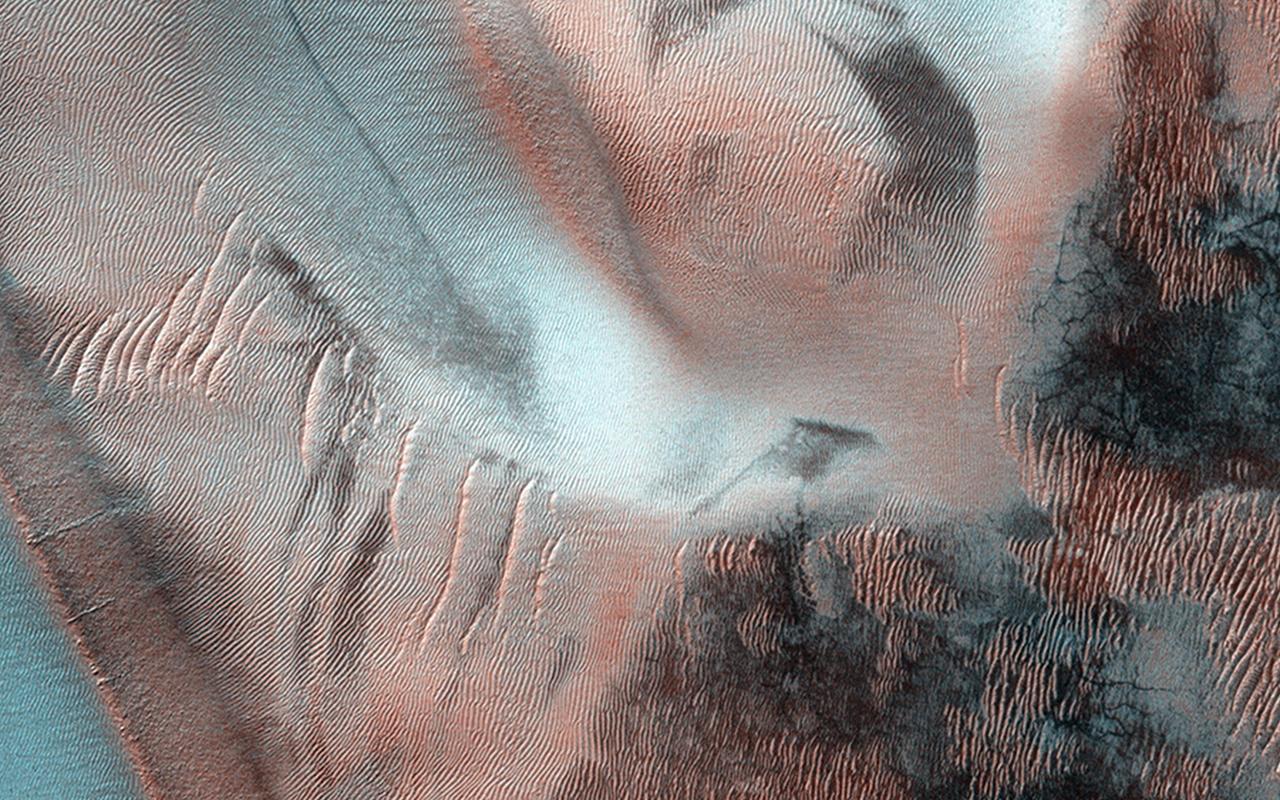
Richardson Crater is home to this sea of sand dunes. It was fall in the Southern hemisphere when NASA MRO acquired this image of the dunes frosted with the first bit of carbon dioxide ice condensed from the atmosphere.
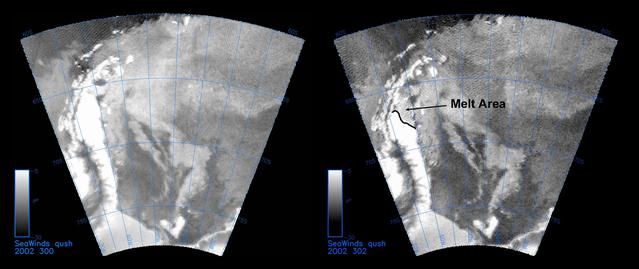
The SeaWinds instrument on NASA Quick Scatterometer QuikScat spacecraft captured these near-real-time backscatter images of melting on the Larsen C ice shelf in Antarctica Weddell Sea between October 27 left and October 29 right.
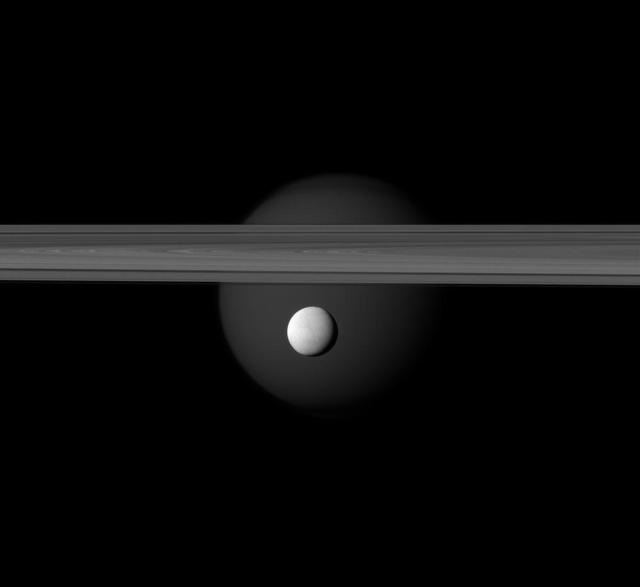
The brightly reflective moon Enceladus appears before Saturn rings while the larger moon Titan looms in the distance. Jets of water ice and vapor emanating from the south pole of Enceladus hinting at subsurface sea rich in organics.
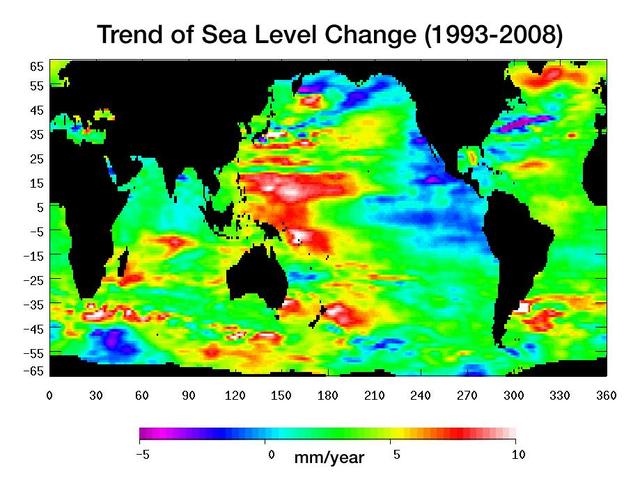
Warming water and melting land ice have raised global mean sea level 4.5 centimeters 1.7 inches from 1993 to 2008. But the rise is by no means uniform.
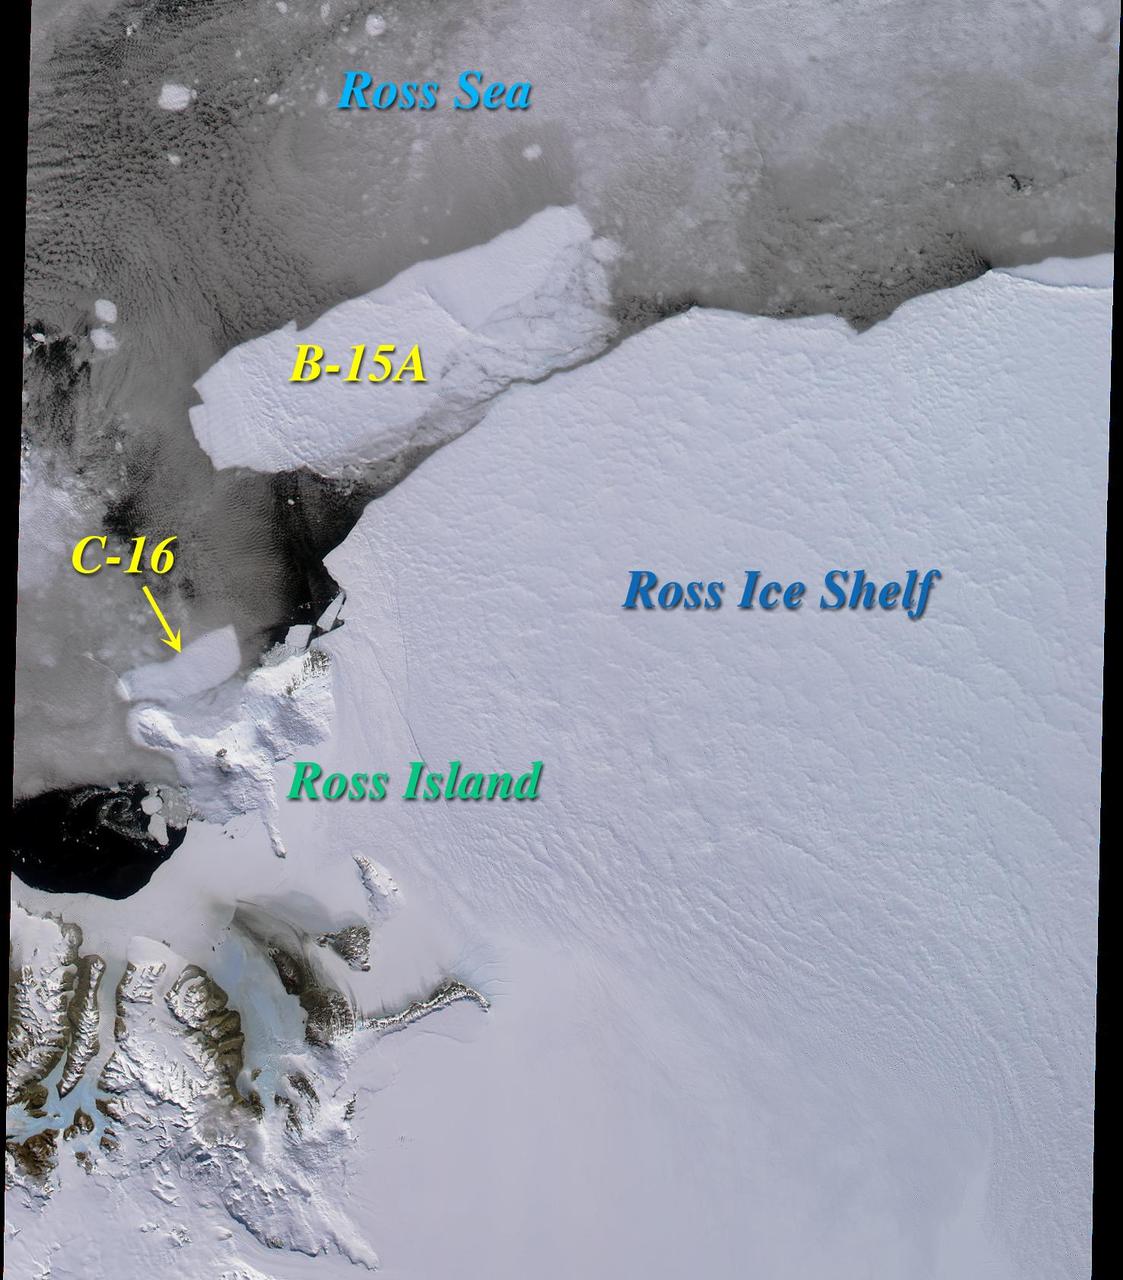
Two large icebergs, designated B-15A and C-16, captured by NASA Terra satellite, are of the Ross Ice Shelf and Ross Sea in Antarctica, acquired on December 10, 2000 during Terra orbit 5220, show
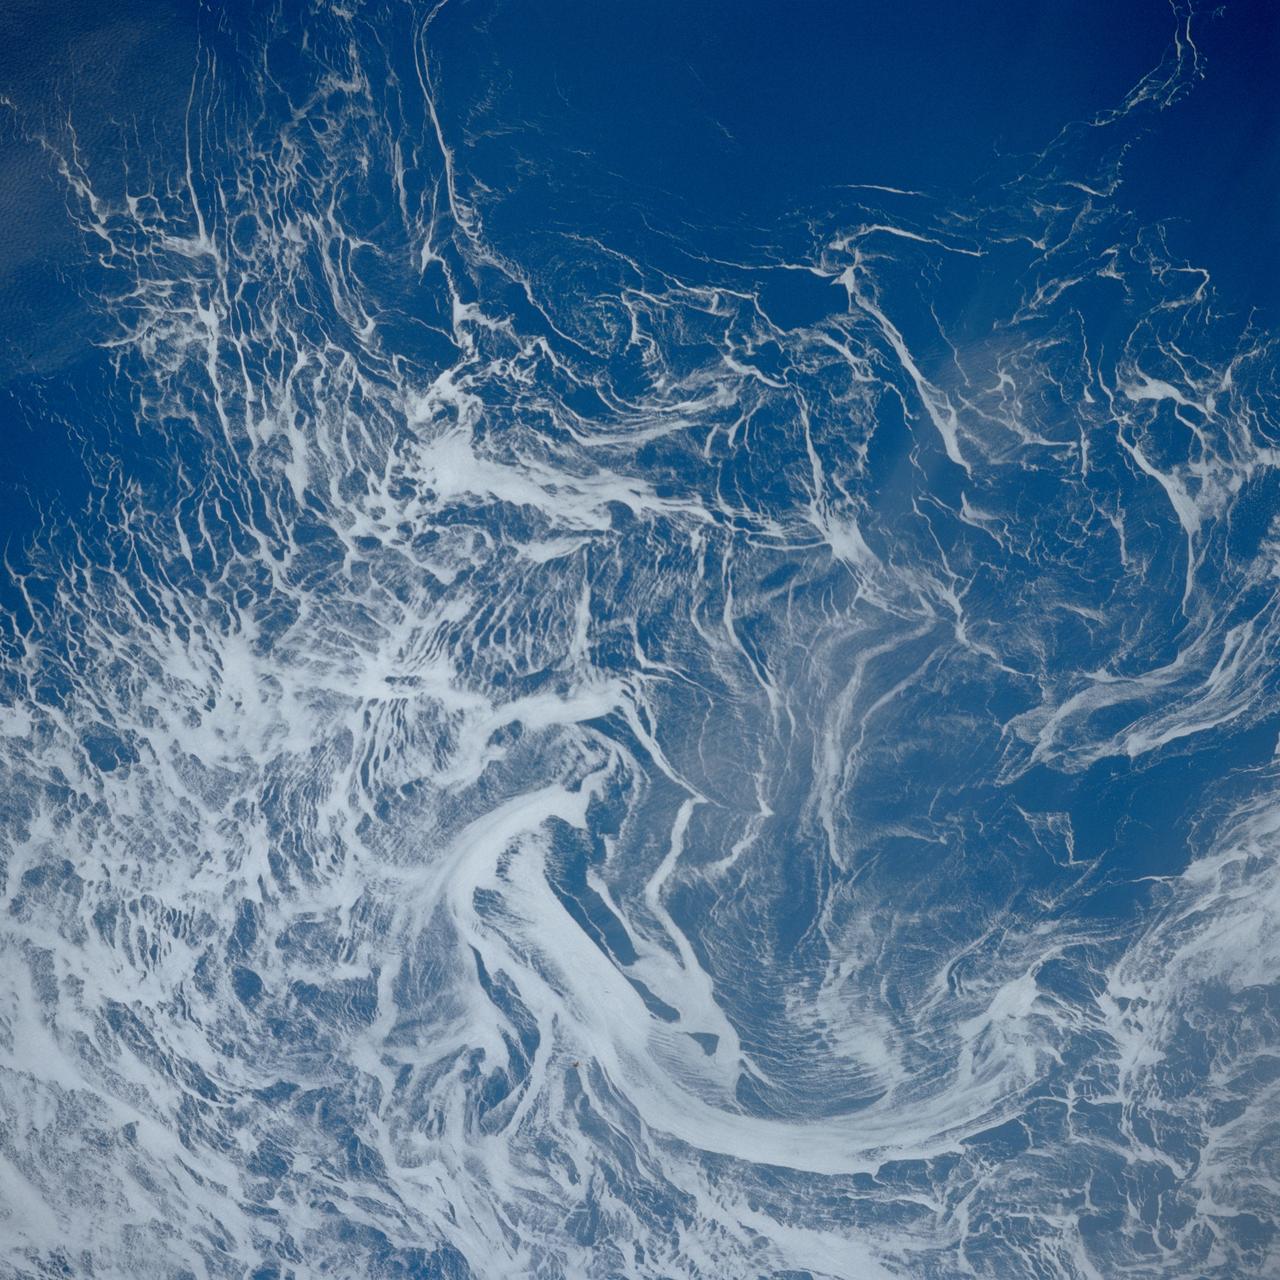
STS039-84-29AL (28 April-6 May 1991) --- This nearly vertical photograph of the North Atlantic, taken outside of the sunglint pattern, illustrates the extreme contrast between highly reflective ice, having a large percentage of between-crystal air space, and the low-reflectance water, which absorbs most of the light that propagates into it from the air. The ice drifts along with the surface currents and wind and may therefore be used as a natural Langranian* tracer. Photographs such as this, taken several times over the course of a mission, may be used to investigate near-surface circulation in high-latitude oceans. *A Langranian tracer is anything that can be tracked as it drifts along with the water, as opposed to staying in one position and measuring how fast the water goes by.
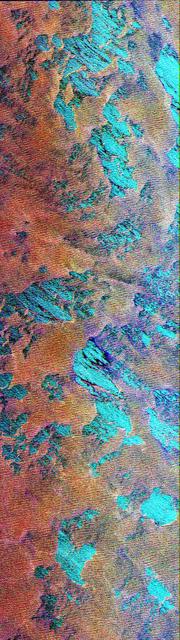
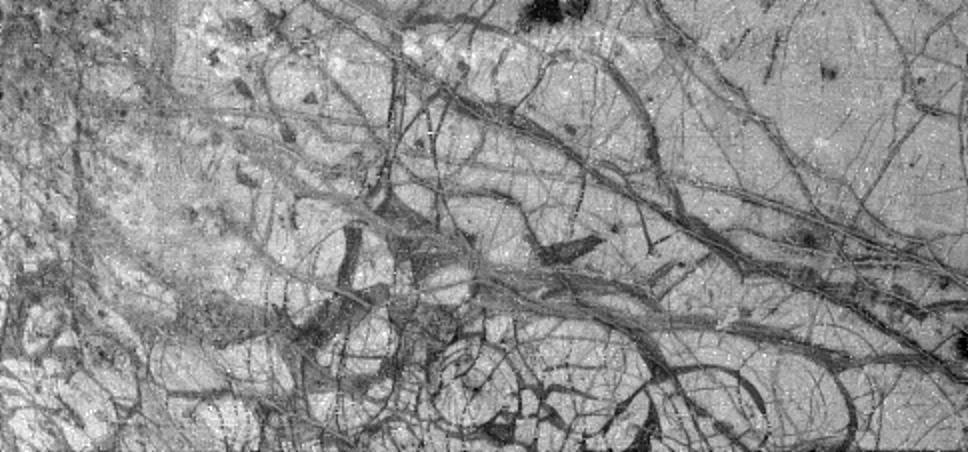
This Spaceborne Imaging Radar-C/X-band Synthetic Aperture Radar color composite shows a portion of the Weddell Sea, which is adjacent to the continent of Antarctica. The image shows extensive coverage of first-year sea ice mixtures and patches of open water inside the ice margin. The image covers a 100 kilometer by 30 kilometer (62 mile by 18.5 mile) region of the southern ocean, centered at approximately 57 degrees south latitude and 3 degrees east longitude, which was acquired on October 3, 1994. Data used to create this image were obtained using the L-band (horizontally transmitted and vertically received) in red; the L-band (horizontally transmitted and received) in green; and the C-band (horizontally transmitted and received) in blue. The sea ice, which appears rust-brown in the image, is composed of loosely packed floes from approximately 1 meter to 2 meters (3 feet to 6.5 feet) thick and ranging from 1 meter to 20 meters (3 feet to 65.5 feet) in diameter. Large patches of open water, shown as turquoise blue, are scattered throughout the area, which is typical for ice margins experiencing off-ice winds. The thin, well-organized lines clearly visible in the ice pack are caused by radar energy reflected by floes riding the crest of ocean swells. The wispy, black features seen throughout the image represent areas where new ice is forming. Sea ice, because it acts as an insulator, reduces the loss of heat between the relatively warm ocean and cold atmosphere. This interaction is an important component of the global climate system. Because of the unique combination of winds, currents and temperatures found in this region, ice can extend many hundreds of kilometers north of Antarctica each winter, which classifies the Weddell Sea as one of nature's greatest ice-making engines. During the formation of sea ice, great quantities of salt are expelled from the frozen water. The salt increases the density of the upper layer of sea water, which then sinks to great depths. Oceanographers believe this process forms most of the oceans' deep water. Sea ice covering all of the southern oceans, including the Weddell Sea, typically reaches its most northerly extent in about September. As periods of daylight become gradually longer in the Southern Hemisphere, ice formation stops and the ice edge retreats southward. By February, most of the sea ice surrounding Antarctica disappears. Imaging radar is extremely useful for studying the polar regions because of the long periods of darkness and extensive cloud cover. The multiple frequencies of the SIR-C/X-SAR instruments allow further study into ways of improving the separation of the various thickness ranges of sea ice, which are vital to understanding the heat balance in the ice, ocean and atmospheric system. http://photojournal.jpl.nasa.gov/catalog/PIA01737

Scientists on the sea ice in the Chukchi Sea off the north coast of Alaska disperse equipment on July 4, 2010, as they prepare to collect data on and below the ice. The research is part of NASA's ICESCAPE mission onboard the U.S. Coast Guard icebreaker Healy to sample the physical, chemical and biological characteristics of the ocean and sea ice. Impacts of Climate change on the Eco-Systems and Chemistry of the Arctic Pacific Environment (ICESCAPE) is a multi-year NASA shipborne project. The bulk of the research will take place in the Beaufort and Chukchi Sea’s in summer of 2010 and fall of 2011. Photo Credit: (NASA/Kathryn Hansen)

Dartmouth College's Chris Polashenski cuts a block of ice from below a melt pond on sea ice in the Chukchi Sea on July 9, 2010, for analysis upon return from the mission. The research is part of NASA's ICESCAPE mission onboard the U.S. Coast Guard icebreaker Healy to sample the physical, chemical and biological characteristics of the ocean and sea ice. Impacts of Climate change on the Eco-Systems and Chemistry of the Arctic Pacific Environment (ICESCAPE) is a multi-year NASA shipborne project. The bulk of the research will take place in the Beaufort and Chukchi Sea’s in summer of 2010 and fall of 2011. Photo Credit: (NASA/Kathryn Hansen)
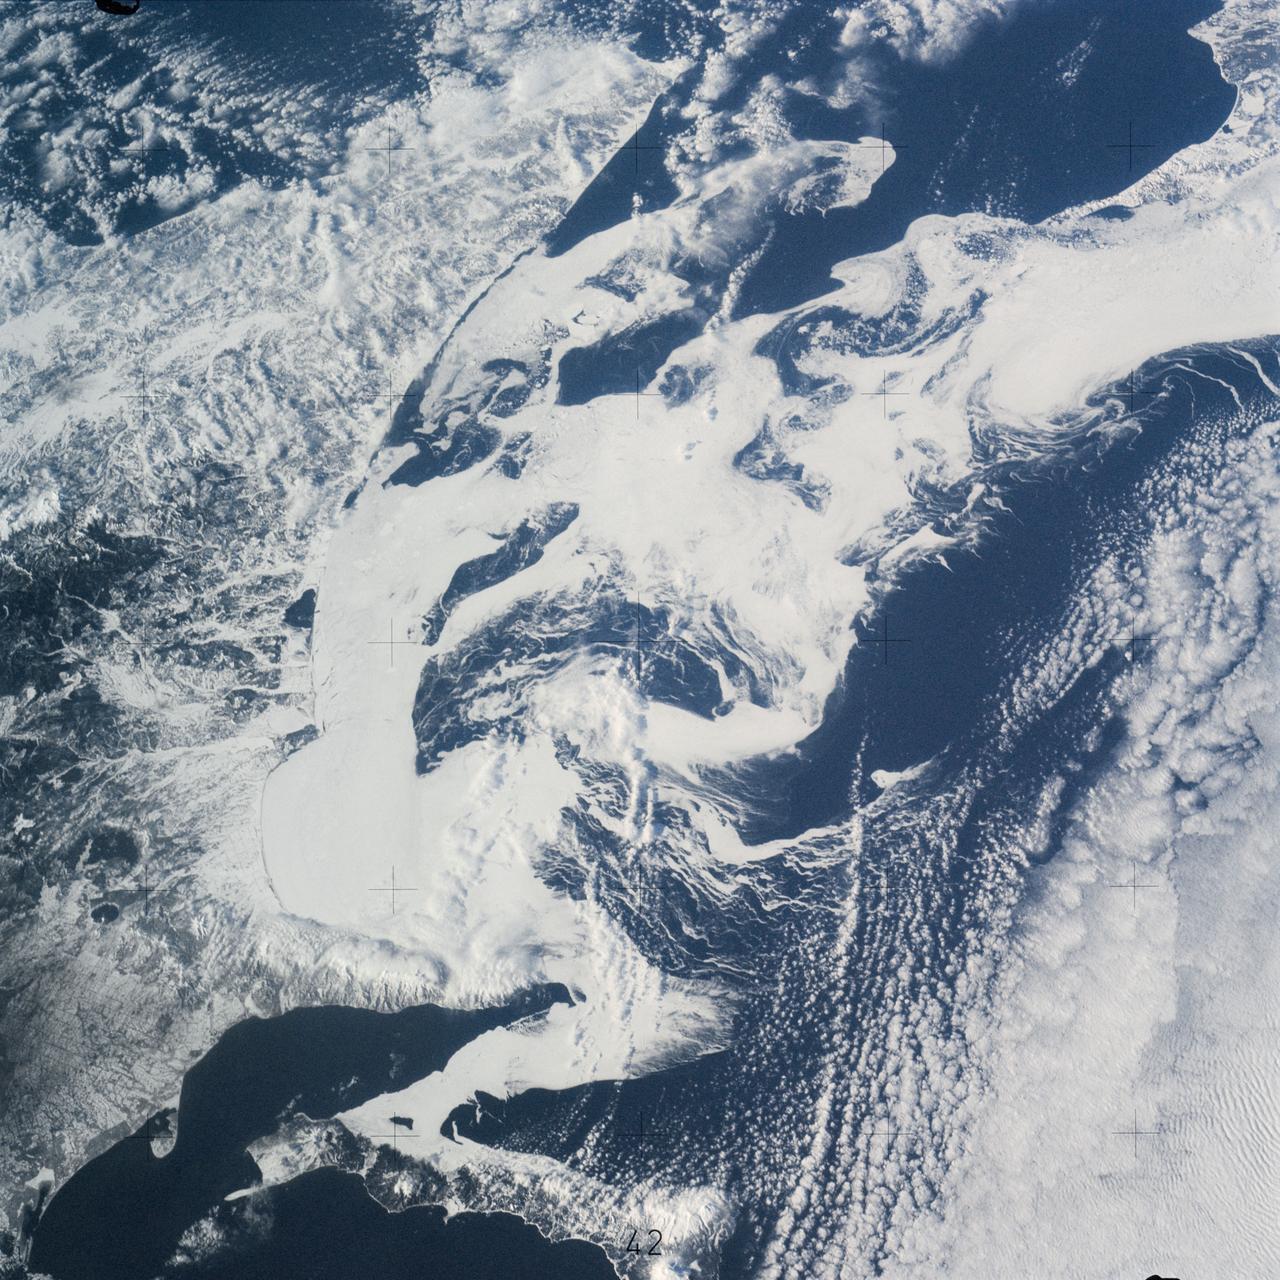
STS099-722-077 (11-22 February 2000) ---Both topography and bathymetry combine with wind and sea currents to produce a pattern of sea ice in the extreme southern Sea of Okhotsk, in this scene photographed by one of the STS-99 crew members aboard the Space Shuttle Endeavour. The rugged shoreline of north Hokkaido and the Kurile Archipelago have channeled northerly winds and surface waters into a gyre here, clearly depicted in the pattern of sea ice.

The terrain for the scientific work conducted by ICESCAPE scientists on July 4, 2010, is Arctic sea ice and melt ponds in the Chukchi Sea. The five-week field mission is dedicated to sampling the physical, chemical and biological characteristics of the ocean and sea ice. Impacts of Climate change on the Eco-Systems and Chemistry of the Arctic Pacific Environment (ICESCAPE) is a multi-year NASA shipborne project. The bulk of the research will take place in the Beaufort and Chukchi Sea’s in summer of 2010 and fall of 2011. Photo Credit: (NASA/Kathryn Hansen)
![NASA researchers have new [sic] insights into the mysteries of Arctic sea ice, thanks to the unique abilities of Canada's Radarsat satellite. The Arctic is the smallest of the world's four oceans, but it may play a large role in helping scientists monitor Earth's climate shifts. Using Radarsat's special sensors to take images at night and to peer through clouds, NASA researchers can now see the complete ice cover of the Arctic. This allows tracking of any shifts and changes, in unprecedented detail, over the course of an entire winter. The radar-generated, high-resolution images are up to 100 times better than those taken by previous satellites. http://photojournal.jpl.nasa.gov/catalog/PIA02970](https://images-assets.nasa.gov/image/PIA02970/PIA02970~thumb.jpg)
NASA researchers have new [sic] insights into the mysteries of Arctic sea ice, thanks to the unique abilities of Canada's Radarsat satellite. The Arctic is the smallest of the world's four oceans, but it may play a large role in helping scientists monitor Earth's climate shifts. Using Radarsat's special sensors to take images at night and to peer through clouds, NASA researchers can now see the complete ice cover of the Arctic. This allows tracking of any shifts and changes, in unprecedented detail, over the course of an entire winter. The radar-generated, high-resolution images are up to 100 times better than those taken by previous satellites. http://photojournal.jpl.nasa.gov/catalog/PIA02970
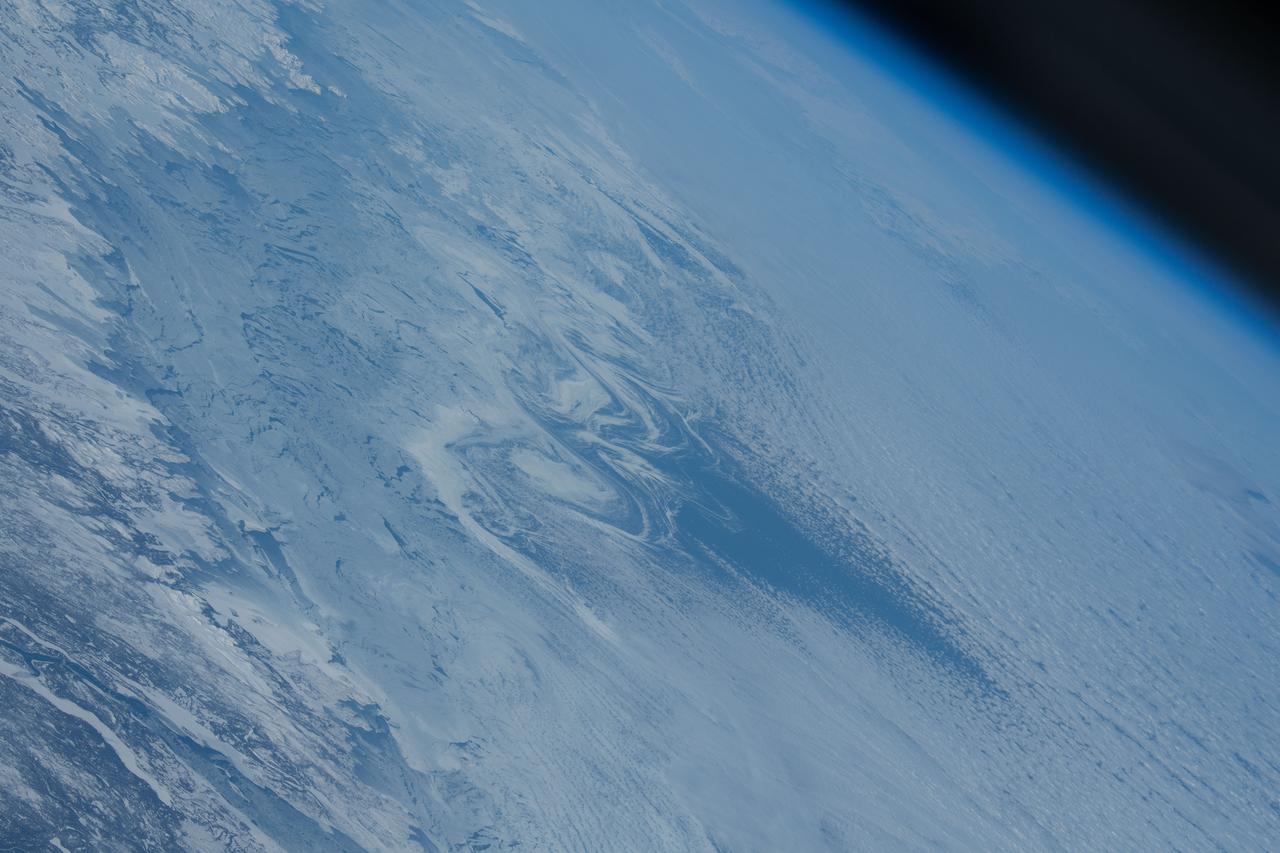
iss070e086805 (2/3/2024) --- NASA astronaut Loral O’Hara captured this arctic region of Canada using a handheld digital camera. Sea ice traces ocean currents, creating swirls visible along the coast of Labrador in eastern Canada. According to the National Snow and Ice Data Center, sea ice throughout the Arctic region grew more slowly than usual in January 2024. Monitoring Earth’s climate via space station can provide scientists with more data and information about the planet we call home.

Teams of scientists set up equipment on sea ice not far from the U.S. Coast Guard icebreaker Healy in the Chukchi Sea on July 4, 2010, where they spent the day collecting data. The research is part of NASA's ICESCAPE oceanographic mission to sample the physical, chemical and biological characteristics of the ocean and sea ice. Impacts of Climate change on the Eco-Systems and Chemistry of the Arctic Pacific Environment (ICESCAPE) is a multi-year NASA shipborne project. The bulk of the research will take place in the Beaufort and Chukchi Sea’s in summer of 2010 and fall of 2011. Photo Credit: (NASA/Kathryn Hansen)

Scientists and Coast Guard swimmers test the integrity a melt pond on sea ice in the Chukchi Sea on July 9, 2010, before drilling holes through which instruments can be deployed to collect data. The research is part of NASA's ICESCAPE mission onboard the U.S. Coast Guard icebreaker Healy to sample the physical, chemical and biological characteristics of the ocean and sea ice. Impacts of Climate change on the Eco-Systems and Chemistry of the Arctic Pacific Environment (ICESCAPE) is a multi-year NASA shipborne project. The bulk of the research will take place in the Beaufort and Chukchi Sea’s in summer of 2010 and fall of 2011. Photo Credit: (NASA/Kathryn Hansen)

Clark University's Karen Frey and Luke Trusel work amid sea ice in the Chukchi Sea on July 4, 2010, setting up an instrument that measures the optical properties of melt ponds. The research is part of NASA's ICESCAPE mission to sample the physical, chemical and biological characteristics of the ocean and sea ice. Impacts of Climate change on the Eco-Systems and Chemistry of the Arctic Pacific Environment (ICESCAPE) is a multi-year NASA shipborne project. The bulk of the research will take place in the Beaufort and Chukchi Sea’s in summer of 2010 and fall of 2011. Photo Credit: (NASA/Kathryn Hansen)
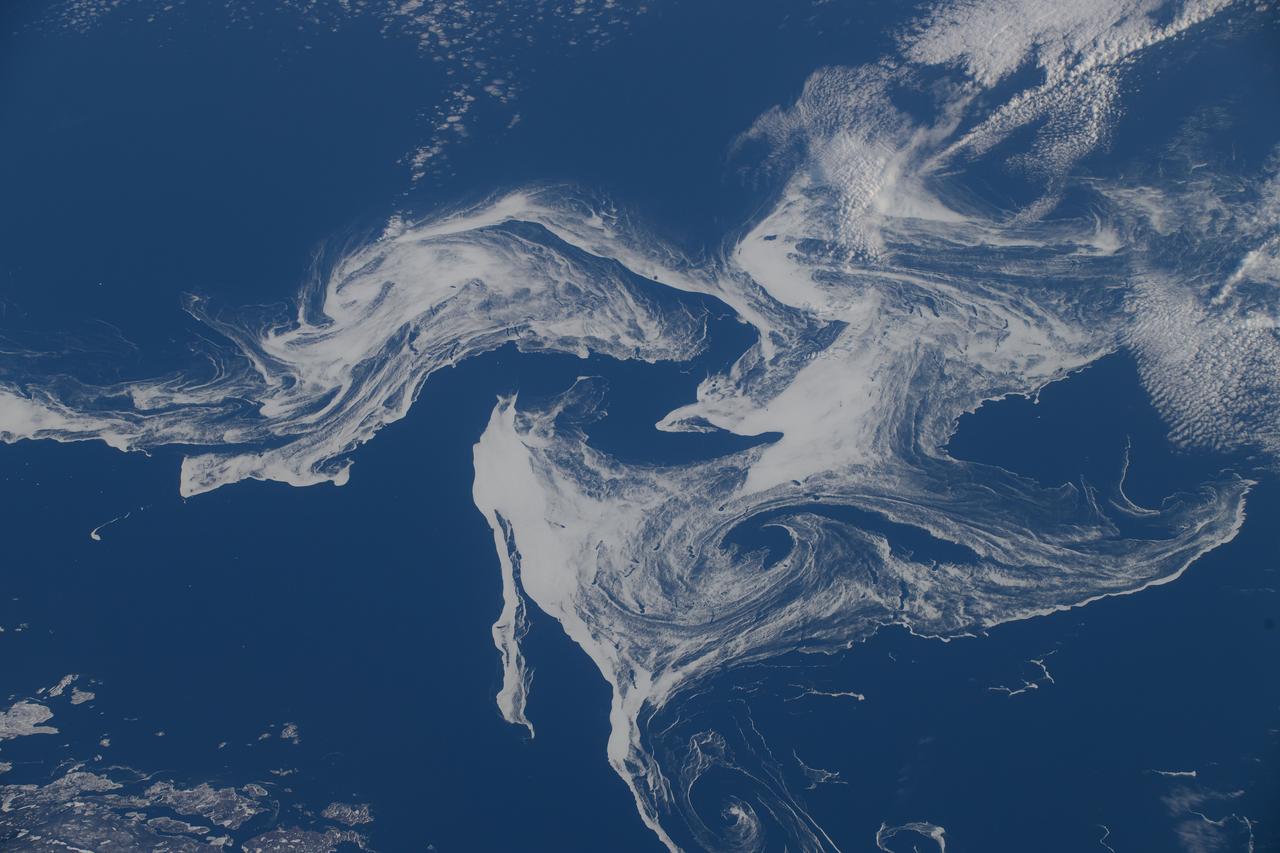
ISS039-E-11773 (14 April 2014) --- Photographed with a camera equipped with an 80mm lens from the International Space Station, patterns of sea ice in the Sea of Okhotsk reveal the dynamics of ocean currents that could otherwise only be seen in sunglint. In this Expedition 39 photo, one can see nearly 1,000 kilometers (600 miles) of the East Sakhalin Current, which is carrying winter ice south toward Japan’s Hokkaido Island. The current is marked by the narrow corridor of dense ice that hugs the coast of Russia’s Sakhalin Island. As it approaches Hokkaido, the ice patterns show a series of eddies and swirls. The East Sakhalin Current wanes in summer when the Soya Current begins to enter the Sea of Okhotsk. This inrush of summer water starts in April and, according to NASA scientists, probably expresses itself in this image as ice pattern to the east above Hokkaido. The Sakhalin current turns east and transports ice toward the Kuril Island chain. Some ice can spill through gaps in the islands, where it is swept southwest by the Kuril Current (lower right).
On March 31, the P-3 departed Thule, Greenland. IceBridge teams flew a science transit flight to Kangerlussaq, Greenland, where missions will be based for the next several weeks before returning to Thule. Along the route, instruments surveyed several targets of opportunity including two ground tracks of the Ice, Cloud and land Elevation Satellite (ICESat) and several glaciers (Rink, Kangerdlugssuaq, Jakobshavn and Russell), turning up great data and spectacular views. March 29 was another perfect day for a land ice flight. The P-3 flew between deep canyons and over glaciers along the northwest coast of Greenland. But before the start of land ice flights, IceBridge reached a key milestone over sea ice. On March 28, IceBridge flew its eighth sea ice flight marking the completion of all high- and medium-priority sea ice missions planned from Thule. Among the sea ice missions was a science transit back from Fairbanks to Thule on March 25, during which the P-3 surveyed in complete darkness. Researchers watched the scanning pattern of the green lasers on the sea ice below and the beautiful Aurora Borealis above. To learn more about Ice Bridge go to: <a href="http://www.nasa.gov/mission_pages/icebridge/news/spr11/index.html" rel="nofollow">www.nasa.gov/mission_pages/icebridge/news/spr11/index.html</a> <b><a href="http://www.nasa.gov/centers/goddard/home/index.html" rel="nofollow">NASA Goddard Space Flight Center</a></b> enables NASA’s mission through four scientific endeavors: Earth Science, Heliophysics, Solar System Exploration, and Astrophysics. Goddard plays a leading role in NASA’s accomplishments by contributing compelling scientific knowledge to advance the Agency’s mission. <b>Follow us on <a href="http://twitter.com/NASA_GoddardPix" rel="nofollow">Twitter</a></b> <b>Join us on <a href="http://www.facebook.com/pages/Greenbelt-MD/NASA-Goddard/395013845897?ref=tsd" rel="nofollow">Facebook</a></b>
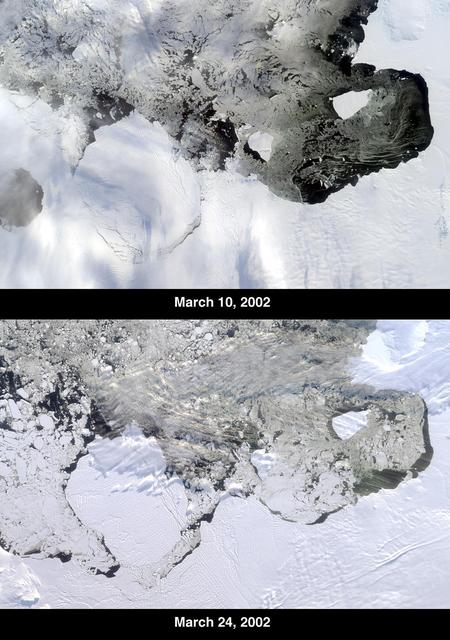
The Thwaites Ice Tongue is a large sheet of glacial ice extending from the West Antarctic mainland into the southern Amundsen Sea. A large crack in the Thwaites Tongue was discovered in imagery from Terra's Moderate Resolution Imaging SpectroRadiometer (MODIS). Subsequent widening of the crack led to the calving of a large iceberg. The development of this berg, designated B-22 by the National Ice Center, can be observed in these images from the Multi-angle Imaging SpectroRadiometer, also aboard Terra. The two views were acquired by MISR's nadir (vertical-viewing) camera on March 10 and 24, 2002. The B-22 iceberg, located below and to the left of image center, measures approximately 82 kilometers long x 62 kilometers wide. Comparison of the two images shows the berg to have drifted away from the ice shelf edge. The breakup of ice near the shelf edge, in the area surrounding B-22, is also visible in the later image. These natural-color images were acquired during Terra orbits 11843 and 12047, respectively. At the right-hand edge is Pine Island Bay, where the calving of another large iceberg (B-21) occurred in November 2001. B-21 subsequently split into two smaller bergs, both of which are visible to the right of B-22. http://photojournal.jpl.nasa.gov/catalog/PIA03700

Clark University student Christie Wood lowers a water sampler into a borehole on July 4, 2010, to collect water samples from below the Arctic sea ice off the north coast of Alaska. The research is part of NASA's ICESCAPE oceanographic mission to sample the physical, chemical and biological characteristics of the ocean and sea ice. Impacts of Climate change on the Eco-Systems and Chemistry of the Arctic Pacific Environment (ICESCAPE) is a multi-year NASA shipborne project. The bulk of the research will take place in the Beaufort and Chukchi Sea’s in summer of 2010 and fall of 2011. Photo Credit: (NASA/Kathryn Hansen)
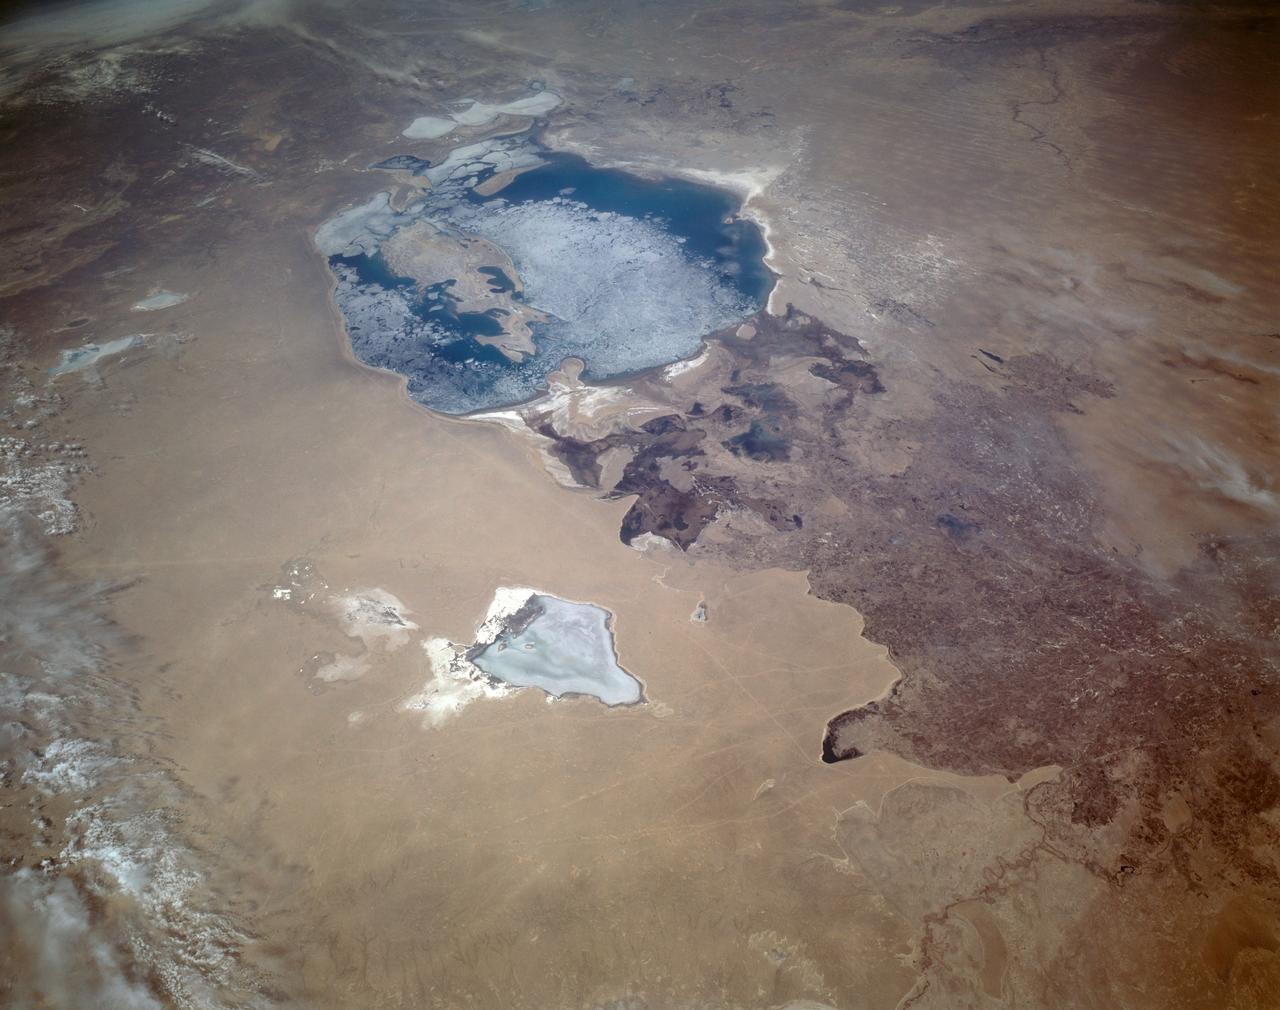
STS059-L22-140 (9-20 April 1994) --- View northeastward across Uzbekastan to the partly-ice-covered Aral Sea and Kazakhstan. The irrigated fan-delta of the Amu Darya extends from the right side of the photograph to end in extensive salt flats at the south end of the sea. The Aral was the fourth-largest inland sea or lake in the world, until diversion and over-use of the river water for irrigation led, in this arid climate, to the sea's decline. Linhof camera.

In May 2014, two new studies concluded that a section of the land-based West Antarctic ice sheet had reached a point of inevitable collapse. Meanwhile, fresh observations from September 2014 showed sea ice around Antarctica had reached its greatest extent since the late 1970s. To better understand such dynamic and dramatic differences in the region's land and sea ice, researchers are travelling south to Antarctica this month for the sixth campaign of NASA’s Operation IceBridge. The airborne campaign, which also flies each year over Greenland, makes annual surveys of the ice with instrumented research aircraft. Instruments range from lasers that map the elevation of the ice surface, radars that "see" below it, and downward looking cameras to provide a natural-color perspective. The Digital Mapping System (DMS) camera acquired the above photo during the mission’s first science flight on October 16, 2009. At the time of the image, the DC-8 aircraft was flying at an altitude of 515 meters (1,700 feet) over heavily compacted first-year sea ice along the edge of the Amundsen Sea. Since that first flight, much has been gleaned from IceBridge data. For example, images from an IceBridge flight in October 2011 revealed a massive crack running about 29 kilometers (18 miles) across the floating tongue of Antarctica's Pine Island Glacier. The crack ultimately led to a 725-square-kilometer (280-square-mile) iceberg. In 2012, IceBridge data was a key part of a new map of Antarctica called Bedmap2. By combining surface elevation, ice thickness, and bedrock topography, Bedmap2 gives a clearer picture of Antarctica from the ice surface down to the land surface. Discoveries have been made in Greenland, too, including the identification of a 740-kilometer-long (460-mile-long) mega canyon below the ice sheet. Repeated measurements of land and sea ice from aircraft extend the record of observations once made by NASA’s Ice, Cloud, and Land Elevation Satellite, or ICESat, which stopped functioning in 2009. In addition to extending the ICESat record, IceBridge also sets the stage for ICESat-2, which is scheduled for launch in 2017. Credit: IceBridge DMS L0 Raw Imagery courtesy of the Digital Mapping System (DMS) team/NASA DAAC at the National Snow and Ice Data Center More info: <a href="http://earthobservatory.nasa.gov/IOTD/view.php?id=84549" rel="nofollow">earthobservatory.nasa.gov/IOTD/view.php?id=84549</a> <a href="http://earthobservatory.nasa.gov/IOTD/view.php?id=84549" rel="nofollow">earthobservatory.nasa.gov/IOTD/view.php?id=84549</a>
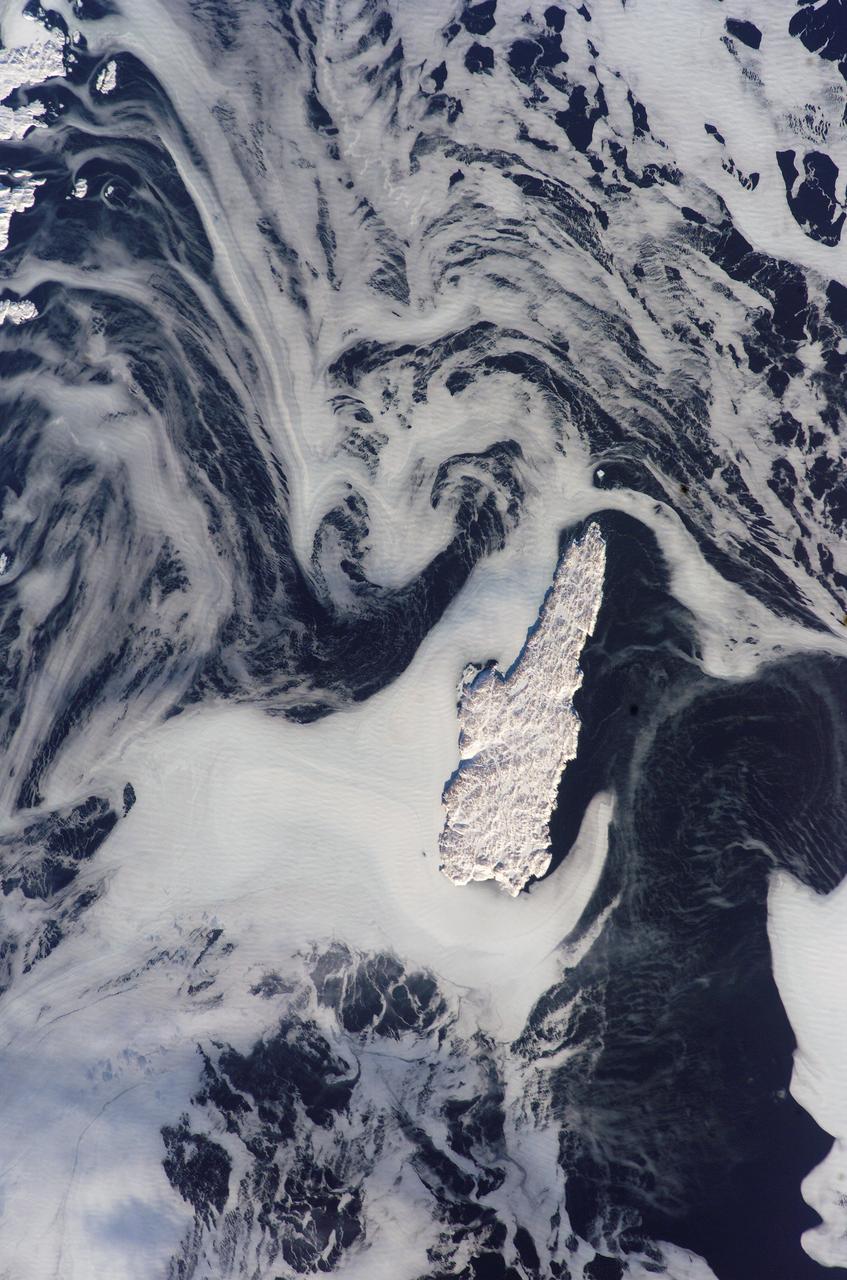
ISS012-E-15918 (24 Jan. 2006) --- Belle Isle and a portion of Newfoundland, Canada are featured in this image photographed by an Expedition 12 crew member on the International Space Station. Belle Isle (center) is surrounded by sea ice in this recent winter view. Belle Isle lies in the strait between the Island of Newfoundland and Labrador (the mainland portion of Canada’s province of Newfoundland). Small islands along the coast of Labrador appear in the top left corner. In this key location Belle Isle lies on the shortest shipping lanes between the Great Lakes and Europe, and also on the main north-south shipping route to Hudson Bay and the Northwest Territories. Snow and ice in this recent winter view obliterate the dozens of glacier-scoured lakes that dot the surface of the island. The single community of Belle Isle Landing on the southeast tip is equally hard to see. Ice patterns also show that the island lies at the meeting point of two sea currents. The Labrador Current flows from the northwest (top left), and a smaller current, driven by dominant westerly winds, flows from the southwest (lower left) out of the narrow Belle Isle Strait (out of frame lower left). Flow lines in sea ice indicate the sense of movement of the ice. Ice floes embedded in the Labrador Current appear in the upper part of the image as a relatively open pattern. Sea ice with a denser pattern enters from the lower left corner, banking against the west side of Belle Isle. Tendrils flow around capes at either end of the island, with an ice-free “shadow” on the opposite, downstream side. Eddies (center) in the ice patterns show where the currents interact, north and west of the island.

KENNEDY SPACE CENTER, FLA. - The Ice, Cloud, and Land Elevation Satellite, or ICESat, undergoes final processing before launch. ICESat is a 661-pound satellite known as Geoscience Laser Altimeter System (GLAS) that will revolutionize our understanding of ice and its role in global climate change and how we protect and understand our home planet. It will help scientists determine if the global sea level is rising or falling. It will look at the ice sheets that blanket the Earth's poles to see if they are growing or shrinking. It will assist in developing an understanding of how changes in the Earth's atmosphere and climate effect polar ice masses and global sea level. ICESat is scheduled for launch, with the Cosmic Hot Interstellar Plasma Spectrometer or CHIPSat, on a Delta II expendable launch vehicle from Vandenberg Air Force Base, Calif., on Jan. 11, 2003, between 4:45 p.m. - 5:30 p.m. PST.

KENNEDY SPACE CENTER, FLA. - The Ice, Cloud, and Land Elevation Satellite, or ICESat, logo features an artist's rendition of the satellite orbiting the Earth. ICESat is a 661-pound satellite known as Geoscience Laser Altimeter System (GLAS) that will revolutionize our understanding of ice and its role in global climate change and how we protect and understand our home planet. It will help scientists determine if the global sea level is rising or falling. It will look at the ice sheets that blanket the Earth's poles to see if they are growing or shrinking. It will assist in developing an understanding of how changes in the Earth's atmosphere and climate effect polar ice masses and global sea level. ICESat is scheduled for launch, with the Cosmic Hot Interstellar Plasma Spectrometer or CHIPSat, on a Delta II expendable launch vehicle from Vandenberg Air Force Base, Calif., on Jan. 11, 2003, between 4:45 p.m. - 5:30 p.m. PST.

KENNEDY SPACE CENTER, FLA. - The Ice, Cloud, and Land Elevation Satellite, or ICESat, undergoes final processing before launch. ICESat is a 661-pound satellite known as Geoscience Laser Altimeter System (GLAS) that will revolutionize our understanding of ice and its role in global climate change and how we protect and understand our home planet. It will help scientists determine if the global sea level is rising or falling. It will look at the ice sheets that blanket the Earth's poles to see if they are growing or shrinking. It will assist in developing an understanding of how changes in the Earth's atmosphere and climate effect polar ice masses and global sea level. ICESat is scheduled for launch, with the Cosmic Hot Interstellar Plasma Spectrometer or CHIPSat, on a Delta II expendable launch vehicle from Vandenberg Air Force Base, Calif., on Jan. 11, 2003, between 4:45 p.m. - 5:30 p.m. PST.

SL4-139-4072 (February 1974) --- A high oblique view of the North Atlantic coast of Canada as seen from the Skylab space station in Earth orbit. A Skylab 4 crewman used a hand-held 70mm Hasselblad camera to take this picture. The Strait of Belle Isle, near the center of the picture, separates the Island of Newfoundland from the Canadian mainland. The Strait also connects the Gulf of St. Lawrence with North Atlantic Ocean. The elongated land mass (lower center) is the northern-most peninsula of the Island of Newfoundland. The large land mass at left center is mainland Newfoundland and Quebec. Note the sea ice in the Atlantic. Snow and some ice intermittently cover the land masses, and ice plumes of brash ice or pancake ice can be seen in various shapes and formations. General terrain and ice conditions can be distinguished and evaluated up to at least 55 degrees north latitude in this north looking view. Dr. William Campbell, sea and ice expert with the U.S. Geological Survey, will use this photograph in the study of ice dynamics. Photo credit: NASA
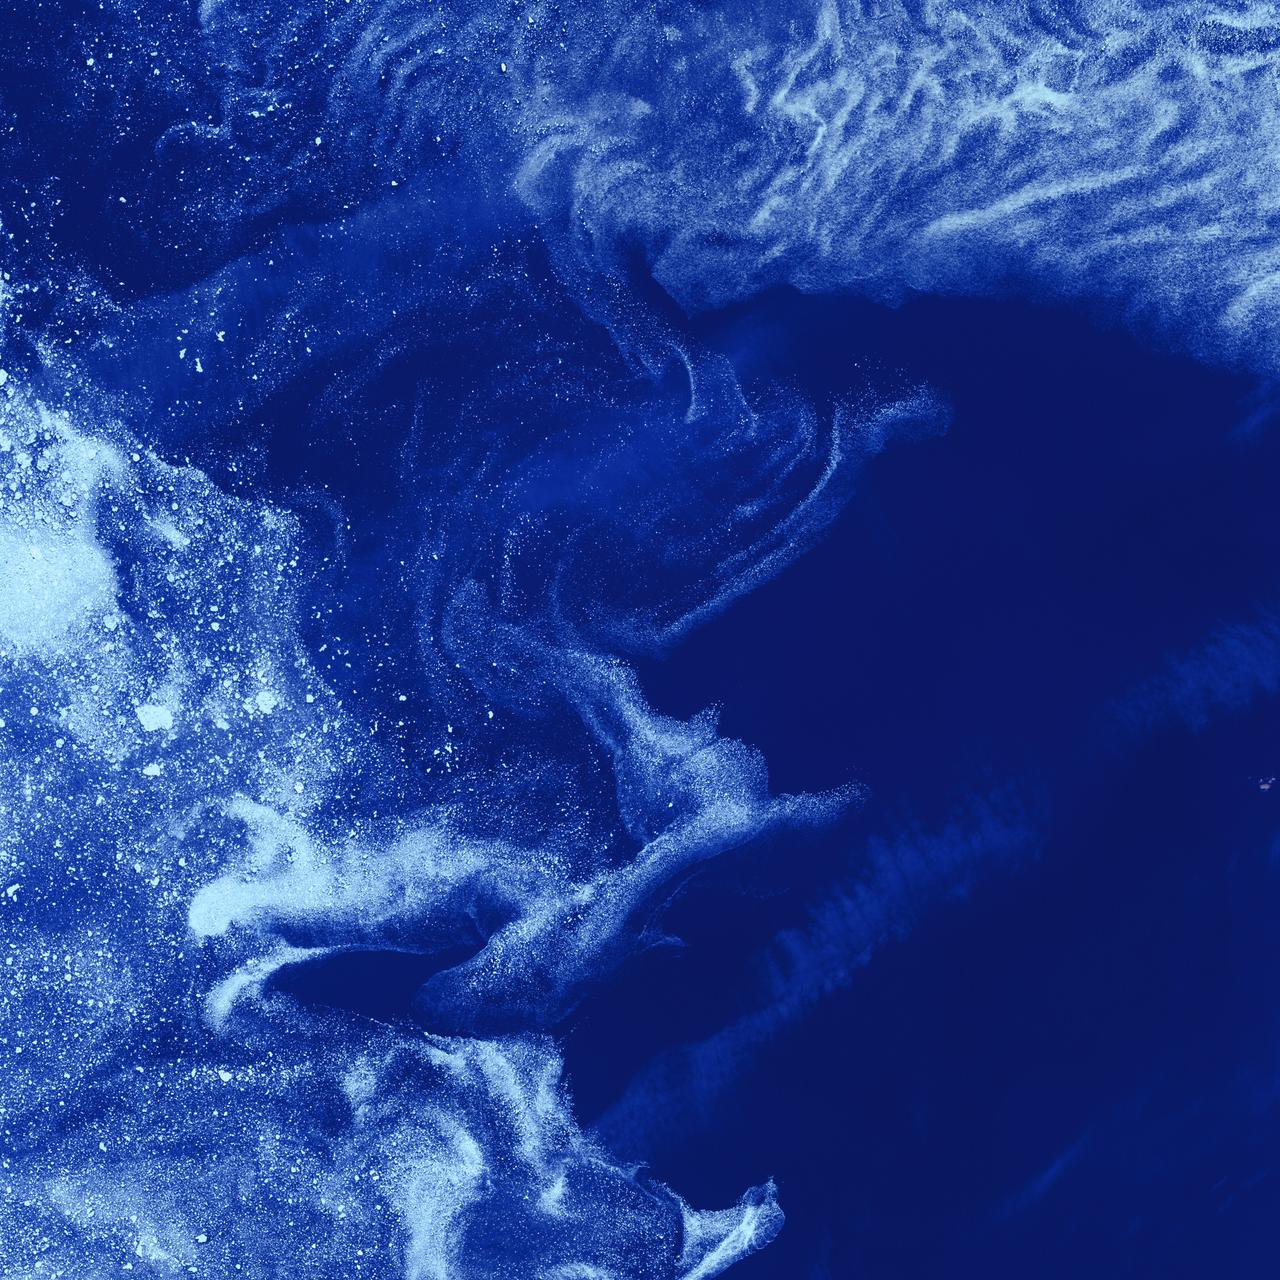
Ice Stars - August 4th, 2002 Description: Like distant galaxies amid clouds of interstellar dust, chunks of sea ice drift through graceful swirls of grease ice in the frigid waters of Foxe Basin near Baffin Island in the Canadian Arctic. Sea ice often begins as grease ice, a soupy slick of tiny ice crystals on the ocean's surface. As the temperature drops, grease ice thickens and coalesces into slabs of more solid ice. Credit: USGS/NASA/Landsat 7 To learn more about the Landsat satellite go to: <a href="http://landsat.gsfc.nasa.gov/" rel="nofollow">landsat.gsfc.nasa.gov/</a> <b><a href="http://www.nasa.gov/centers/goddard/home/index.html" rel="nofollow">NASA Goddard Space Flight Center</a></b> enables NASA’s mission through four scientific endeavors: Earth Science, Heliophysics, Solar System Exploration, and Astrophysics. Goddard plays a leading role in NASA’s accomplishments by contributing compelling scientific knowledge to advance the Agency’s mission. <b>Follow us on <a href="http://twitter.com/NASA_GoddardPix" rel="nofollow">Twitter</a></b> <b>Join us on <a href="http://www.facebook.com/pages/Greenbelt-MD/NASA-Goddard/395013845897?ref=tsd" rel="nofollow">Facebook</a></b>

A sea of icebergs float near the Thurston Island calving front off of western Antarctica as seen on the IceBridge flight on Nov. 5, 2014. Image Credit: NASA/Jim Yungel NASA’s Operation IceBridge collected some rare images on a flight out of Punta Arenas, Chile on Nov. 5, 2014, on a science flight over western Antarctica dubbed Ferrigno-Alison-Abbott 01. The crew snapped a few shots of a calving front of the Antarctic ice sheet. This particular flight plan was designed to collect data on changes in ice elevation along the coast near the Ferrigno and Alison ice streams, on the Abbot Ice Shelf, and grounded ice along the Eights Coast.
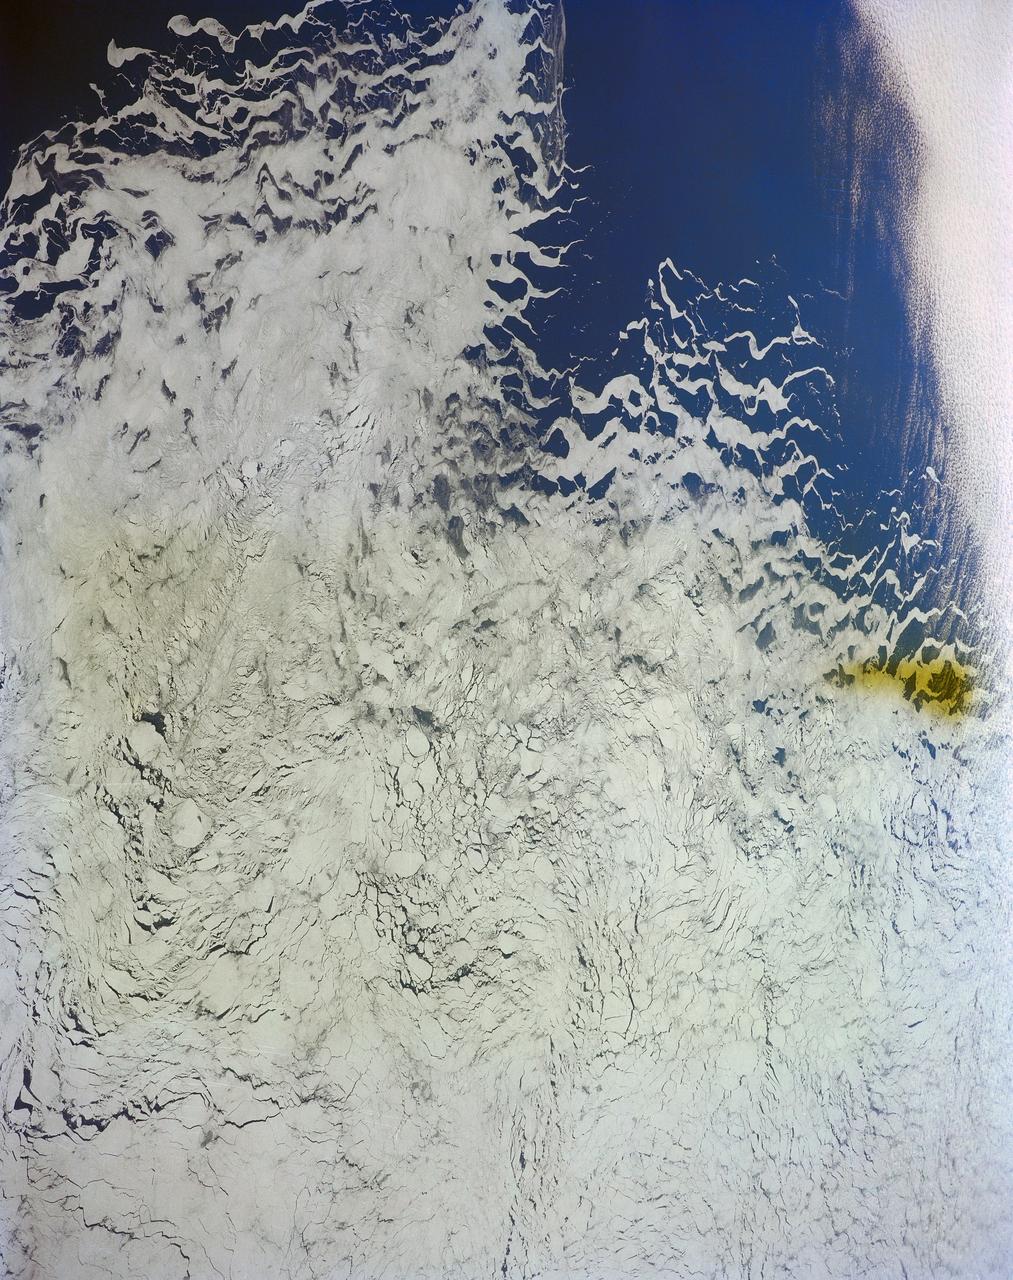
STS048-152-007 (12-18 Sept 1991) --- The periphery of the Antarctic ice shelf and the Antarctic Peninsula were photographed by the STS 48 crew members. Strong offshore winds, probably associated with katabatic winds from the interior of the continent, are peeling off the edges of the ice shelf into ribbons of sea ice, icebergs, bergy bits and growlers into the cold waters of the circum-Antarctic southern ocean.

In early Martian summer, at the time NASA's Mars Reconnaissance Orbiter (MRO) acquired this image, the dunes are almost free of their seasonal ice cover. Only pockets of ice protected in the shade most of the day remain. The North Pole of Mars is surrounded by a vast sea of sand dunes. In this dune field, the dunes are covered by a seasonal cap of dry ice in the winter. https://photojournal.jpl.nasa.gov/catalog/PIA22463
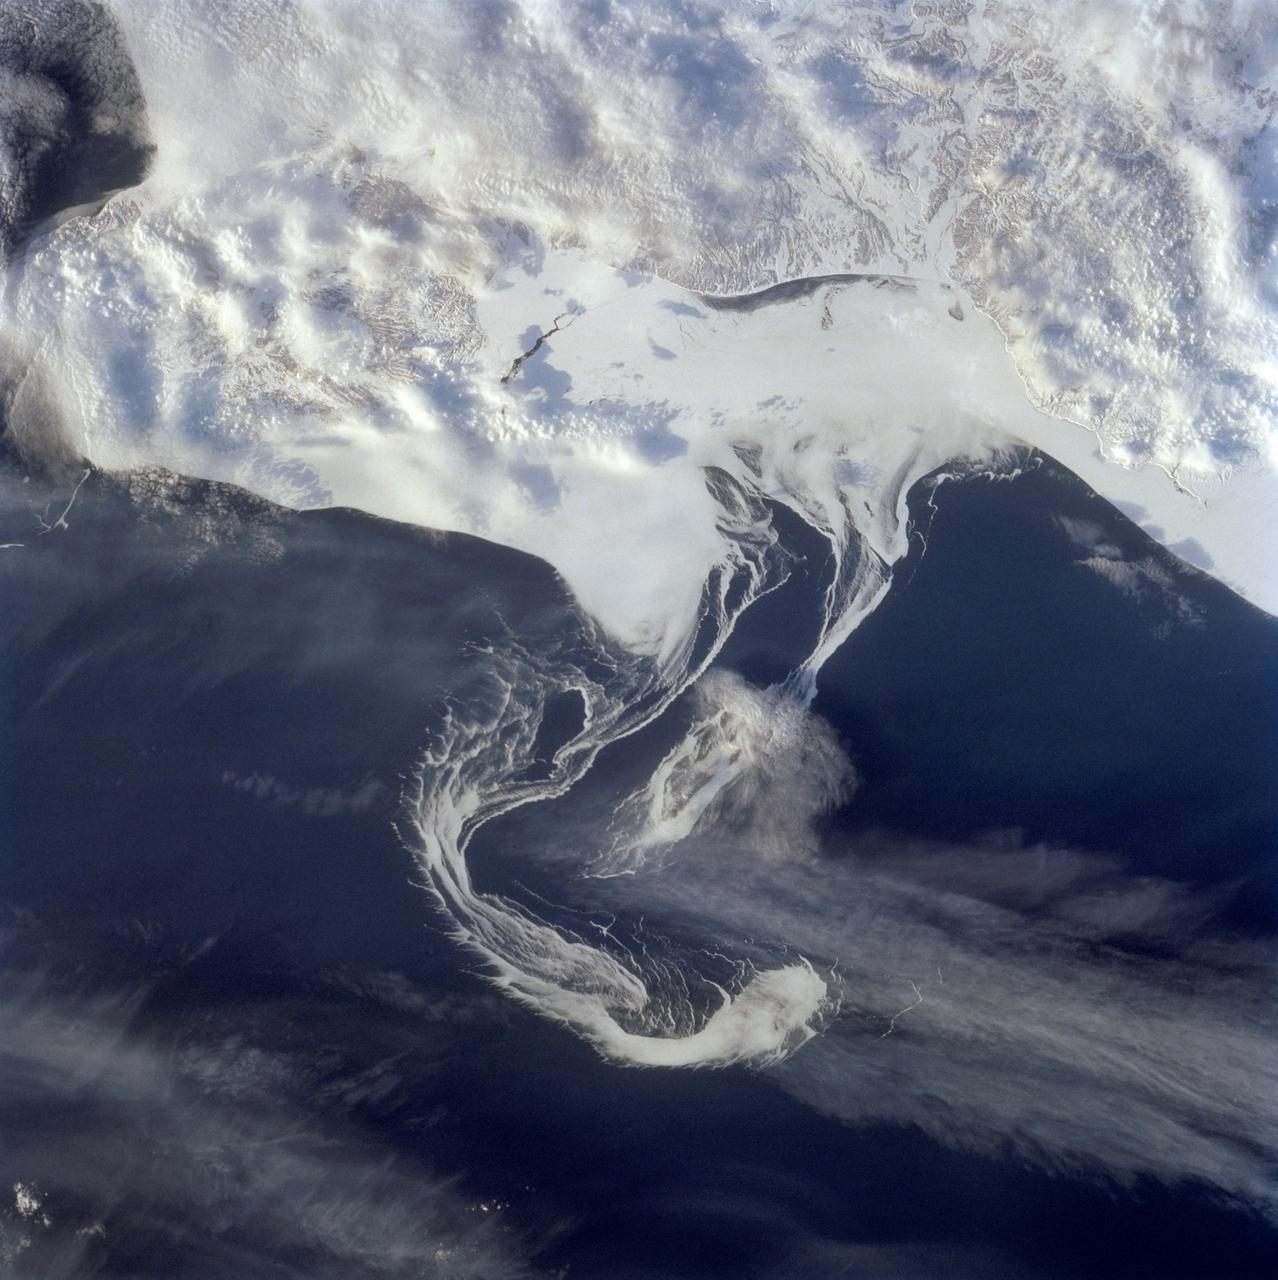
STS060-73-038 (3-11 Feb 1994) --- Pack ice is documented in this photograph along the coast of the Kamchatka Peninsula of Russia in Zaliv Ozernoj. Newly formed ice continually breaks away from the land and takes the form imposed by coastal currents. Detailed photographs of the ice provide information to scientists in both Russia and the united States about the location and fluctuation of ice edges, and how this new sea ice interacts with ocean and littoral currents. This information results in better ice warnings to shipping traffic and provides data points for long-range climate change research for both the Mission-To-Planet Earth and the Russian Priroda ("Nature") monitoring and assessment programs that are respectively coordinated by NASA and the Russian Academy of Sciences. This photography of ice development in the North Pacific, North Atlantic, the Southern Ocean, the Baltic and North Seas, and the Great Lakes is of great interest to the international scientific community. NASA scientists feel high-resolution analog and digital photography from the Space Shuttle and future craft can be a particularly important component in satisfying their data needs on both an operational and a long-term research basis.
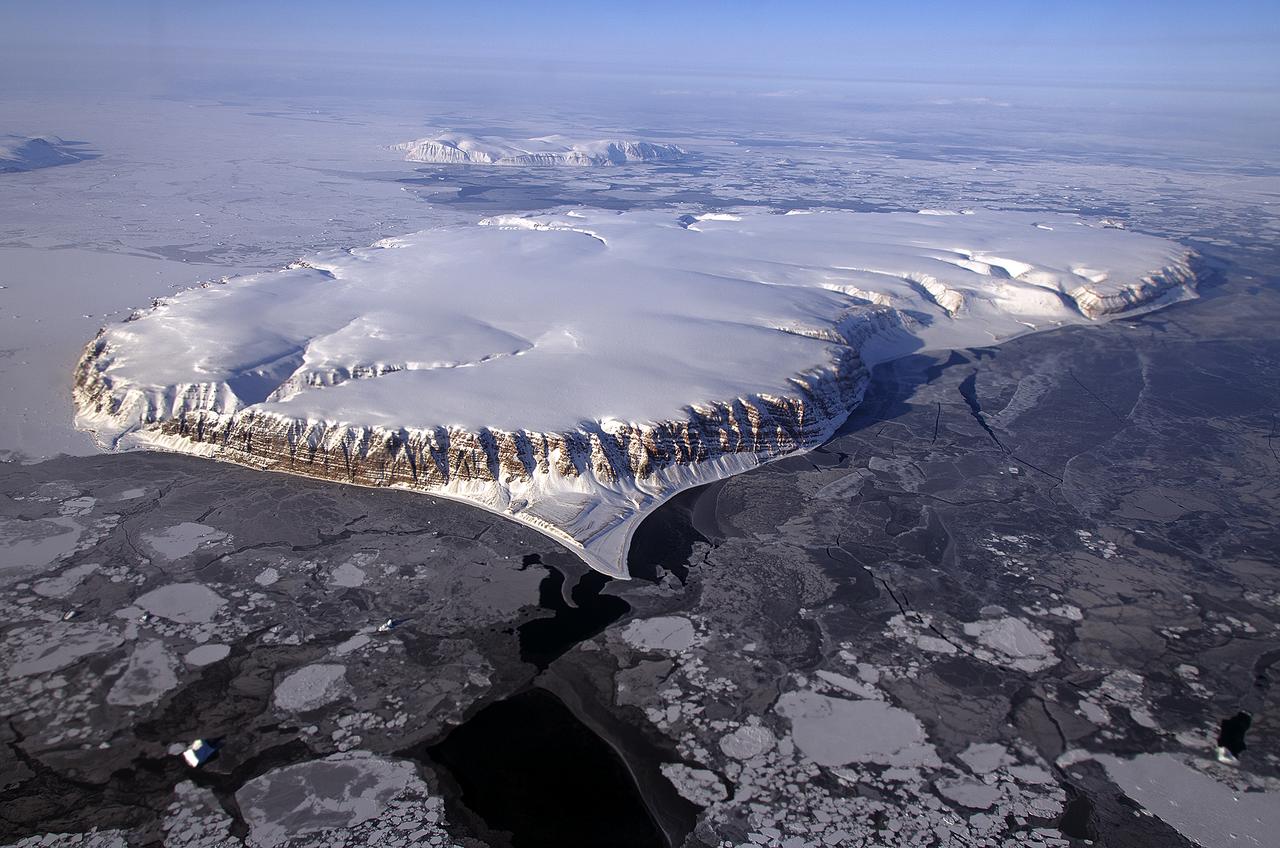
This image of Saunders Island and Wolstenholme Fjord with Kap Atholl in the background was taken during an Operation IceBridge survey flight in April, 2013. Sea ice coverage in the fjord ranges from thicker, white ice seen in the background, to thinner grease ice and leads showing open ocean water in the foreground. In March 2013, NASA's Operation IceBridge scientists began another season of research activity over Arctic ice sheets and sea ice. IceBridge, a six-year NASA mission, is the largest airborne survey of Earth's polar ice ever flown. It will yield an unprecedented three-dimensional view of Arctic and Antarctic ice sheets, ice shelves and sea ice. These flights will provide a yearly, multi-instrument look at the behavior of the rapidly changing features of the Greenland and Antarctic ice. Image Credit: NASA / Michael Studinger Read more about the mission here: <a href="http://www.nasa.gov/mission_pages/icebridge/index.html" rel="nofollow">www.nasa.gov/mission_pages/icebridge/index.html</a> <b><a href="http://www.nasa.gov/audience/formedia/features/MP_Photo_Guidelines.html" rel="nofollow">NASA image use policy.</a></b> <b><a href="http://www.nasa.gov/centers/goddard/home/index.html" rel="nofollow">NASA Goddard Space Flight Center</a></b> enables NASA’s mission through four scientific endeavors: Earth Science, Heliophysics, Solar System Exploration, and Astrophysics. Goddard plays a leading role in NASA’s accomplishments by contributing compelling scientific knowledge to advance the Agency’s mission. <b>Follow us on <a href="http://twitter.com/NASA_GoddardPix" rel="nofollow">Twitter</a></b> <b>Like us on <a href="http://www.facebook.com/pages/Greenbelt-MD/NASA-Goddard/395013845897?ref=tsd" rel="nofollow">Facebook</a></b> <b>Find us on <a href="http://instagram.com/nasagoddard?vm=grid" rel="nofollow">Instagram</a></b>
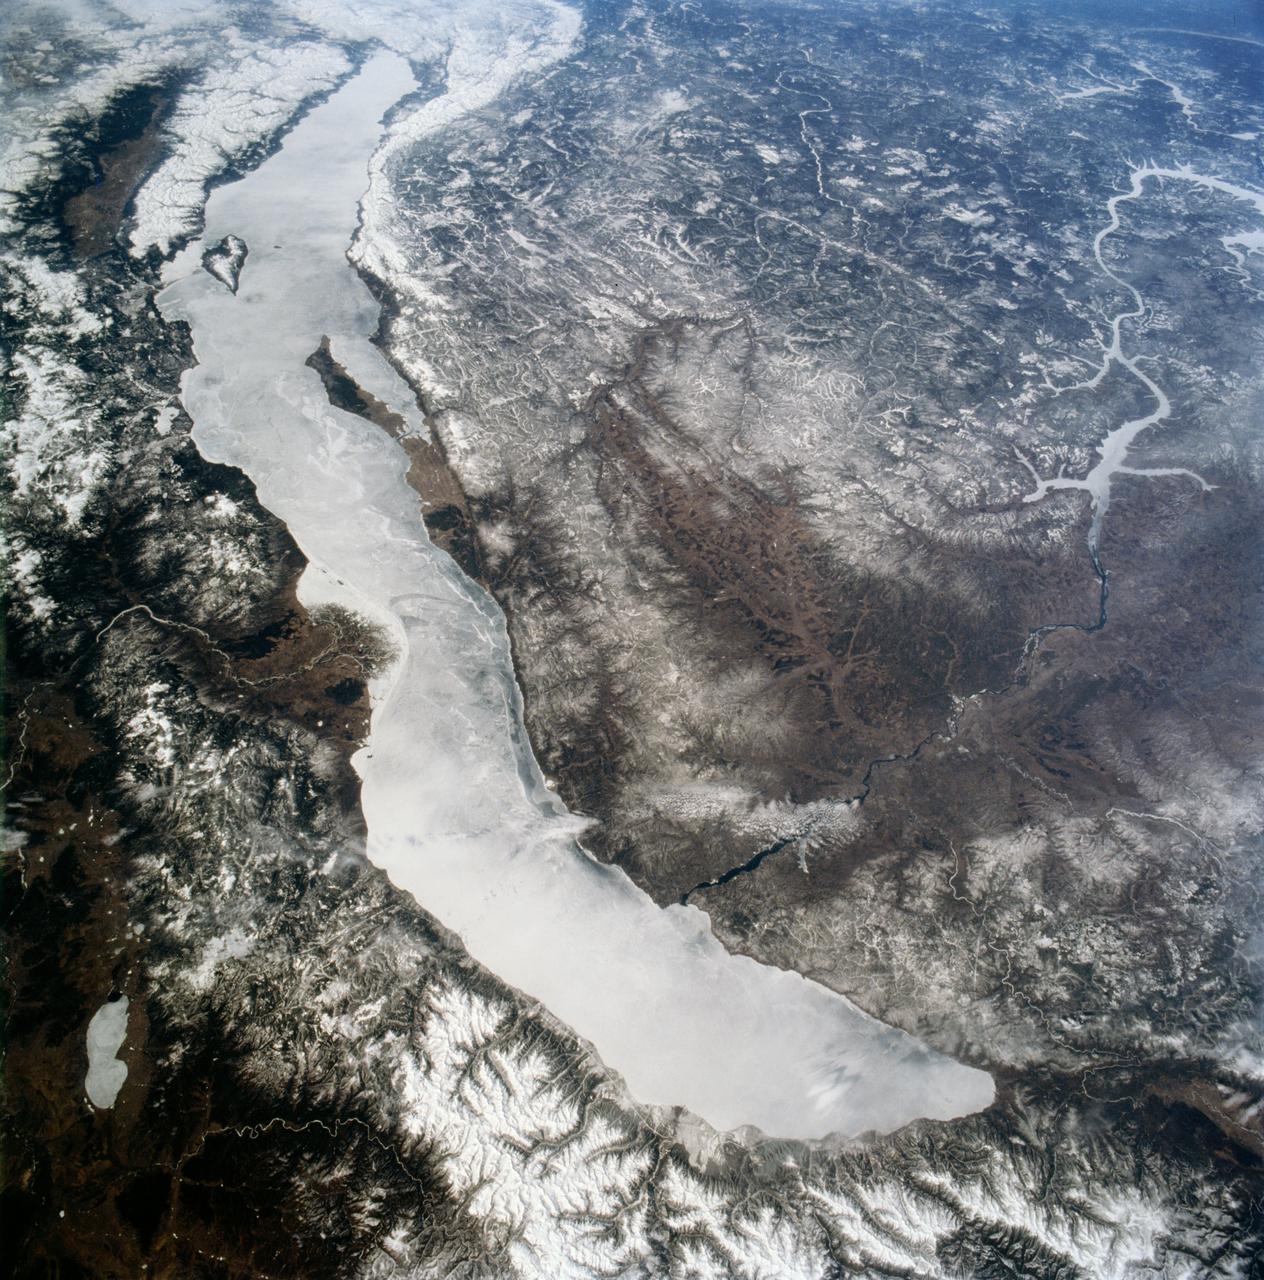
STS059-90-098 (9-20 April 1994) --- Ice-covered Lake Baikal, in Siberia, is about 400 miles long within a major rift valley. The water surface is 455 meters above sea level, but the bottom is 1,295 meters below sea level; the lake represents the largest body of fresh water in the world, except for the Antarctic and Greenland ice sheets. A tributary, the Senusi River, has built a delta on the east side. The Angara River exits the lake to the northwest; the city of Irkutsk is under the small, rippled cloud bank that crosses the river. Hasselblad camera.
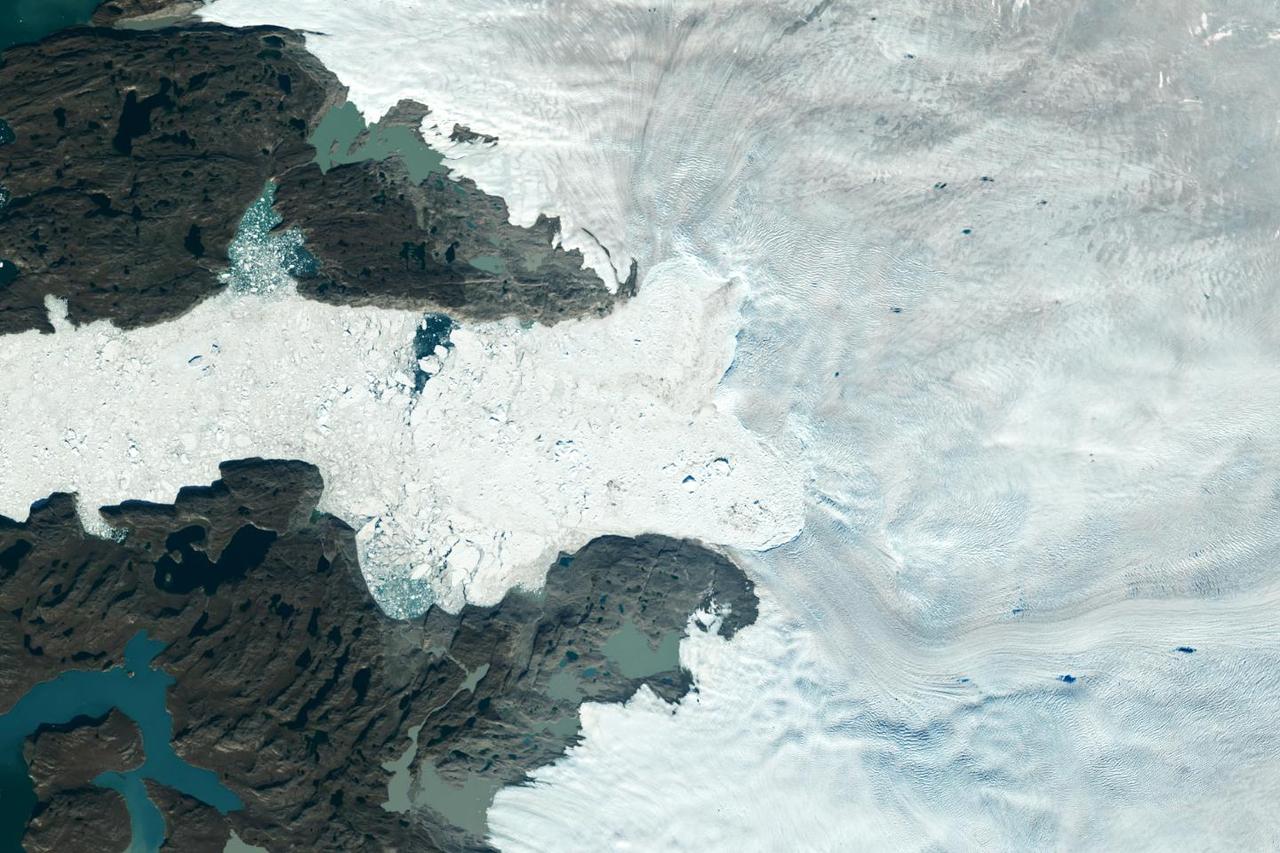
Satellite images from 2022 (Main image) and 1985 (Figure A) capture the retreat of Jakobshavn Isbrae, a glacier on Greenland's western coast, as icebergs broke off its edge over nearly four decades. In a recent study in Nature, researchers from NASA's Jet Propulsion Laboratory in Southern California calculated that Jakobshavn lost an estimated 97 billion tons (88 billion metric tons) of ice in the period between the two images. The earlier image was taken by the Thematic Mapper instrument on the Landsat 5 satellite on Sept. 5, 1985, while the later image was captured by the Operational Land Imager on the Landsat 8 satellite on Sept. 4, 2022. Of the 207 glaciers analyzed in the study, Jakobshavn lost the second most ice mass, trailing only Zachariae Isstrom, a glacier in northeast Greenland. The study took a comprehensive look at glacial retreat around the edges of the entire Greenland Ice Sheet from 1985 to 2022 and found that 179 glaciers retreated significantly since 1985, 27 held steady, and just one advanced slightly. The study found that overall the ice sheet shed about 1,140 billion tons (1,034 billion metric tons) of ice from 1985 to 2022, one-fifth more mass than previously estimated, as icebergs fell into the ocean at an accelerating rate. Most of the ice loss came from below sea level, in fjords on Greenland's periphery. Once occupied by ancient glacial ice, many of these deep coastal valleys have filled with seawater – meaning the ice that broke off made little net contribution to sea level. But the loss likely accelerated the movement of ice flowing down from higher elevations, which in turn added to sea level rise. It also added previously unaccounted-for fresh water to the North Atlantic Ocean, which could have impacts on global ocean currents. https://photojournal.jpl.nasa.gov/catalog/PIA26117

VANDENBERG AFB, Calif. -- A Boeing Delta II rocket soars above the clouds here today at Vandenberg AFB, Calif. The NASA payloads aboard the rocket are the ICESat, an Ice Cloud and land Elevation Satellite, and CHIPSat, a Cosmic Hot Interstellar Plasma Spectrometer. ICESat, a 661-pound satellite, is a benchmark satellite for the Earth Observing System that will help scientists determine if the global sea level is rising or falling. It will observe the ice sheets that blanket the Earth’s poles to determine if they are growing or shrinking. It will assist in developing an understanding of how changes in the Earth’s atmosphere and climate affect polar ice masses and global sea level. The Geoscience Laser Altimeter System is the sole instrument on the satellite. CHIPSat, a suitcase-size 131-pound satellite, will provide information about the origin, physical processes and properties of the hot gas contained in the interstellar medium. This launch marks the first Delta from Vandenberg this year. (USAF photo by: SSgt. Lee A Osberry Jr.)
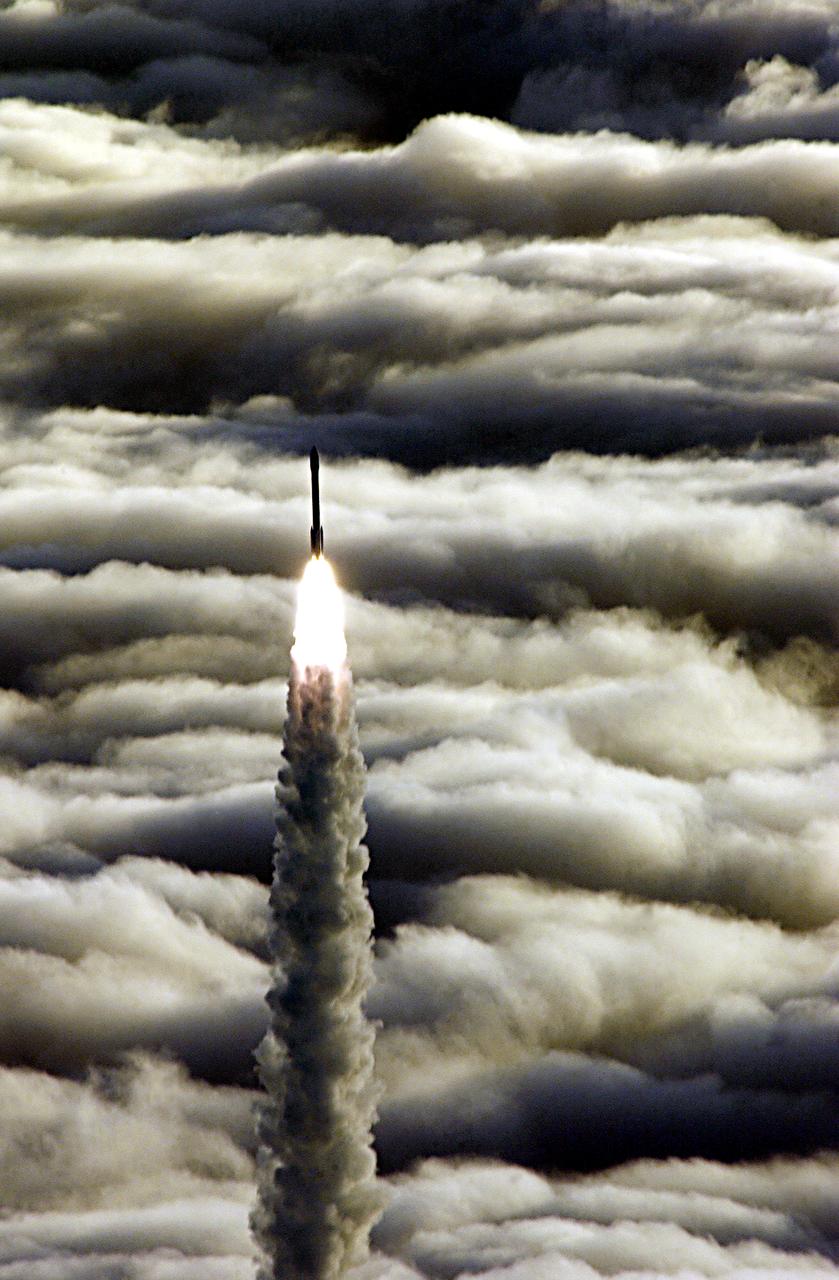
Vandenberg AFB CA-- A Boeing Delta II rocket soars above the clouds here today at Vandenberg AFB CA. The NASA payload aboard the rocket is the ICESat, an Ice Cloud and land Elevation Satellite, and CHIPSat, a Cosmic Hot Interstellar Plasma Spectrometer. ICESat, a 661-pound satellite, is a benchmark satellite for the Earth Observing System that will help scientists determine if the global sea level is rising or falling. It will observe the ice sheets that blanket the Earth’s poles to determine if they are growing or shrinking. It will assist in developing an understanding of how changes in the Earth’s atmosphere and climate affect polar ice masses and global sea level. The Geoscience Laser Altimeter System is the sole instrument on the satellite. CHIPSat, a suitcase-size 131-pound satellite, will provide information about the origin, physical processes and properties of the hot gas contained in the interstellar medium. This launch, marks the first Delta from Vandenberg this year. (USAF photo by: SSgt Lee A Osberry Jr.)

VANDENBERG AFB, Calif. -- A Boeing Delta II rocket soars above the clouds here today at Vandenberg AFB, Calif. The NASA payload aboard the rocket are the ICESat, an Ice Cloud and land Elevation Satellite, and CHIPSat, a Cosmic Hot Interstellar Plasma Spectrometer. ICESat, a 661-pound satellite, is a benchmark satellite for the Earth Observing System that will help scientists determine if the global sea level is rising or falling. It will observe the ice sheets that blanket the Earth’s poles to determine if they are growing or shrinking. It will assist in developing an understanding of how changes in the Earth’s atmosphere and climate affect polar ice masses and global sea level. The Geoscience Laser Altimeter System is the sole instrument on the satellite. CHIPSat, a suitcase-size 131-pound satellite, will provide information about the origin, physical processes and properties of the hot gas contained in the interstellar medium. This launch marks the first Delta from Vandenberg this year. (USAF photo by: SSgt Lee A Osberry Jr.)
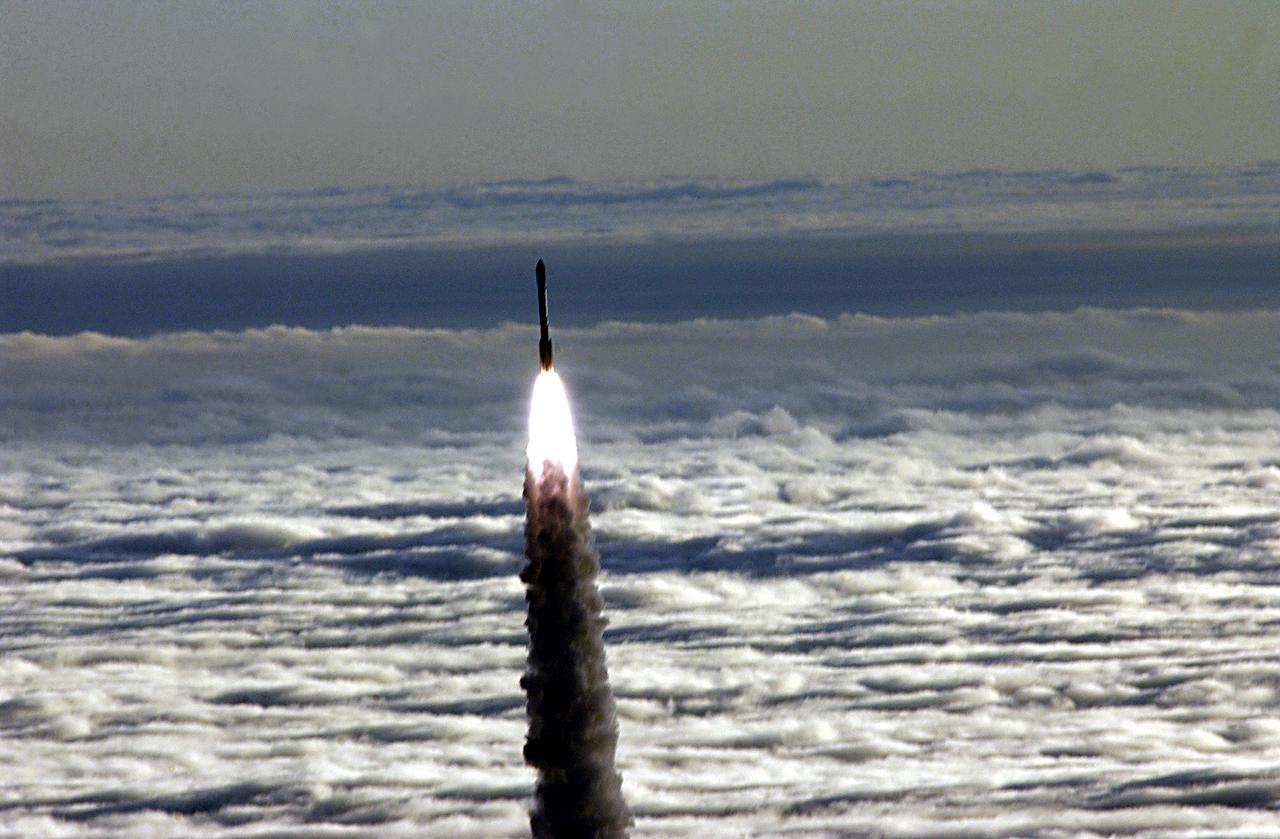
Vandenberg AFB CA-- A Boeing Delta II rocket soars above the clouds here today at Vandenberg AFB CA. The NASA payload aboard the rocket is the ICESat, an Ice Cloud and land Elevation Satellite, and CHIPSat, a Cosmic Hot Interstellar Plasma Spectrometer. ICESat, a 661-pound satellite, is a benchmark satellite for the Earth Observing System that will help scientists determine if the global sea level is rising or falling. It will observe the ice sheets that blanket the Earth’s poles to determine if they are growing or shrinking. It will assist in developing an understanding of how changes in the Earth’s atmosphere and climate affect polar ice masses and global sea level. The Geoscience Laser Altimeter System is the sole instrument on the satellite. CHIPSat, a suitcase-size 131-pound satellite, will provide information about the origin, physical processes and properties of the hot gas contained in the interstellar medium. This launch, marks the first Delta from Vandenberg this year. (USAF photo by: SSgt Lee A Osberry Jr.)
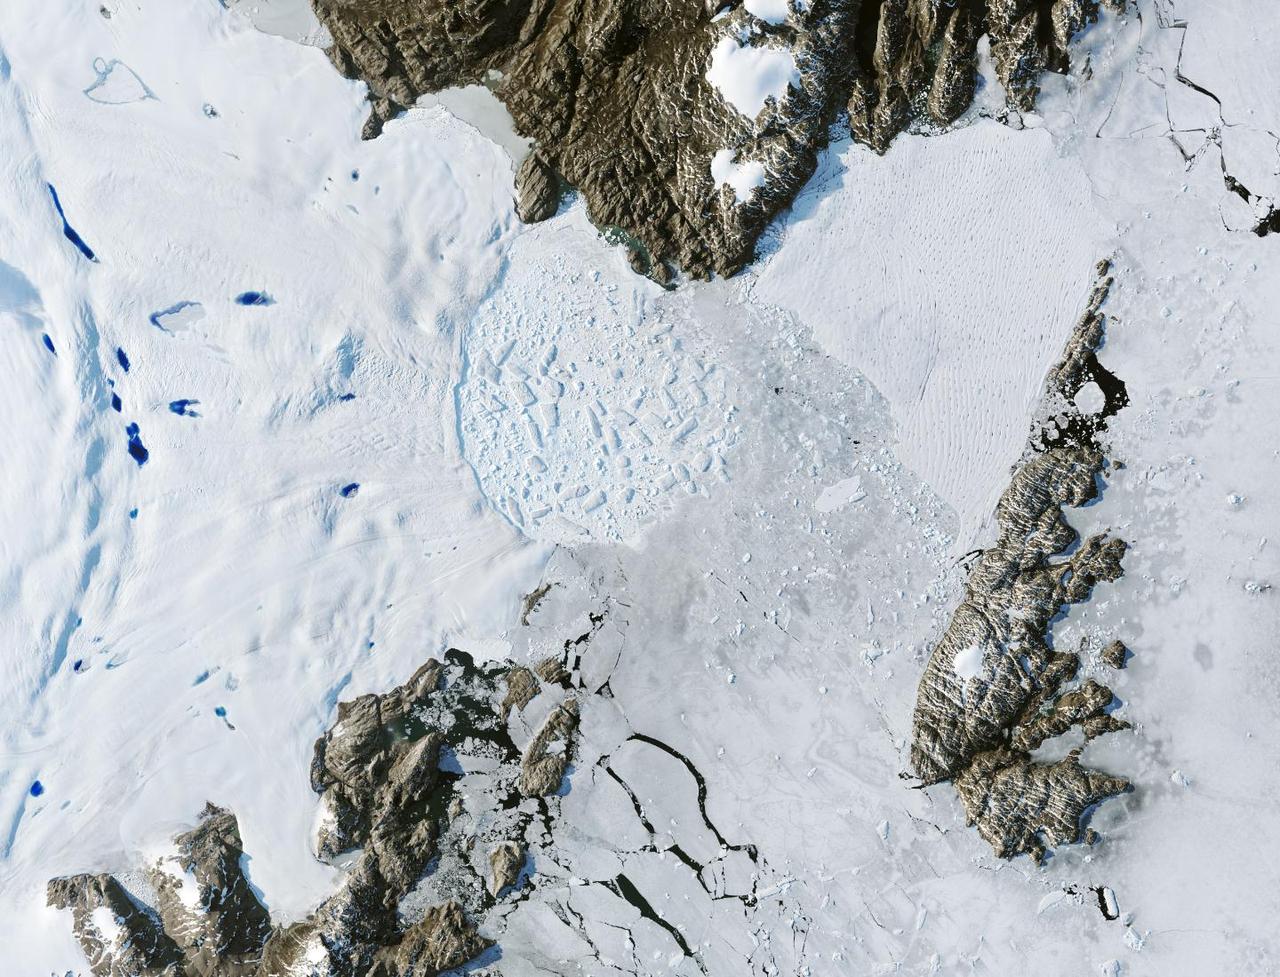
Satellite images from 2022 (Main image) and 1999 (Figure A) capture the retreat of Zachariae Isstrom, a glacier in northeast Greenland, as icebergs broke off its edge over the course of 23 years. In a recent study in Nature, researchers from NASA's Jet Propulsion Laboratory in Southern California calculated that Zachariae lost an estimated 176 billion tons (160 billion metric tons) of ice in the period between 1985 and 2022. That was the greatest mass lost for the period of any of the 207 glaciers analyzed in the paper. The earlier image was taken by the Enhanced Thematic Mapper Plus on the Landsat 7 satellite on Aug. 5, 1999, while the later image was captured by the Operational Land Imager on the Landsat 8 satellite on Aug. 22, 2022. The study took a comprehensive look at glacial retreat around the edges of the entire Greenland Ice Sheet from 1985 to 2022 and found that 179 glaciers retreated significantly since 1985, 27 held steady, and just one advanced slightly. The study found that overall the ice sheet shed about 1,140 billion tons (1,034 billion metric tons) of ice from 1985 to 2022, one-fifth more mass than previously estimated, as icebergs fell into the ocean at an accelerating rate. Most of the ice loss came from below sea level, in fjords on Greenland's periphery. Once occupied by ancient glacial ice, many of these deep coastal valleys have filled with seawater – meaning the ice that broke off made little net contribution to sea level. But the loss likely accelerated the movement of ice flowing down from higher elevations, which in turn added to sea level rise. It also added previously unaccounted-for fresh water to the North Atlantic Ocean, which could have impacts on global ocean currents. https://photojournal.jpl.nasa.gov/catalog/PIA26118
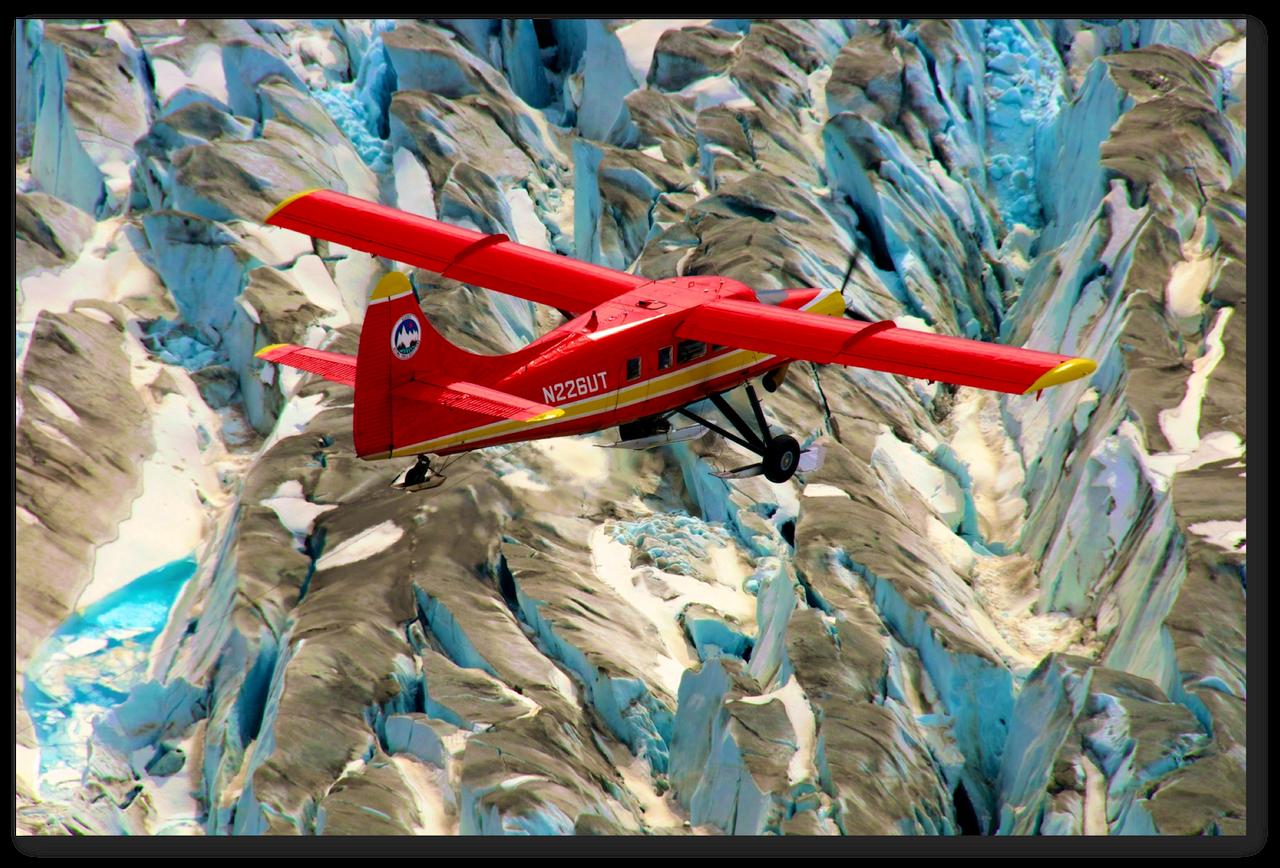
This red plane is a DHC-3 Otter, the plane flown in NASA's Operation IceBridge-Alaska surveys of mountain glaciers in Alaska. Credit: Chris Larsen, University of Alaska-Fairbanks Over the past few decades, average global temperatures have been on the rise, and this warming is happening two to three times faster in the Arctic. As the region’s summer comes to a close, NASA is hard at work studying how rising temperatures are affecting the Arctic. NASA researchers this summer and fall are carrying out three Alaska-based airborne research campaigns aimed at measuring greenhouse gas concentrations near Earth’s surface, monitoring Alaskan glaciers, and collecting data on Arctic sea ice and clouds. Observations from these NASA campaigns will give researchers a better understanding of how the Arctic is responding to rising temperatures. The Arctic Radiation – IceBridge Sea and Ice Experiment, or ARISE, is a new NASA airborne campaign to collect data on thinning sea ice and measure cloud and atmospheric properties in the Arctic. The campaign was designed to address questions about the relationship between retreating sea ice and the Arctic climate. Arctic sea ice reflects sunlight away from Earth, moderating warming in the region. Loss of sea ice means more heat from the sun is absorbed by the ocean surface, adding to Arctic warming. In addition, the larger amount of open water leads to more moisture in the air, which affects the formation of clouds that have their own effect on warming, either enhancing or reducing it. Read more: <a href="http://www.nasa.gov/earthrightnow" rel="nofollow">www.nasa.gov/earthrightnow</a> <b><a href="http://www.nasa.gov/audience/formedia/features/MP_Photo_Guidelines.html" rel="nofollow">NASA image use policy.</a></b> <b><a href="http://www.nasa.gov/centers/goddard/home/index.html" rel="nofollow">NASA Goddard Space Flight Center</a></b> enables NASA’s mission through four scientific endeavors: Earth Science, Heliophysics, Solar System Exploration, and Astrophysics. Goddard plays a leading role in NASA’s accomplishments by contributing compelling scientific knowledge to advance the Agency’s mission. <b>Follow us on <a href="http://twitter.com/NASAGoddardPix" rel="nofollow">Twitter</a></b> <b>Like us on <a href="http://www.facebook.com/pages/Greenbelt-MD/NASA-Goddard/395013845897?ref=tsd" rel="nofollow">Facebook</a></b> <b>Find us on <a href="http://instagram.com/nasagoddard?vm=grid" rel="nofollow">Instagram</a></b>
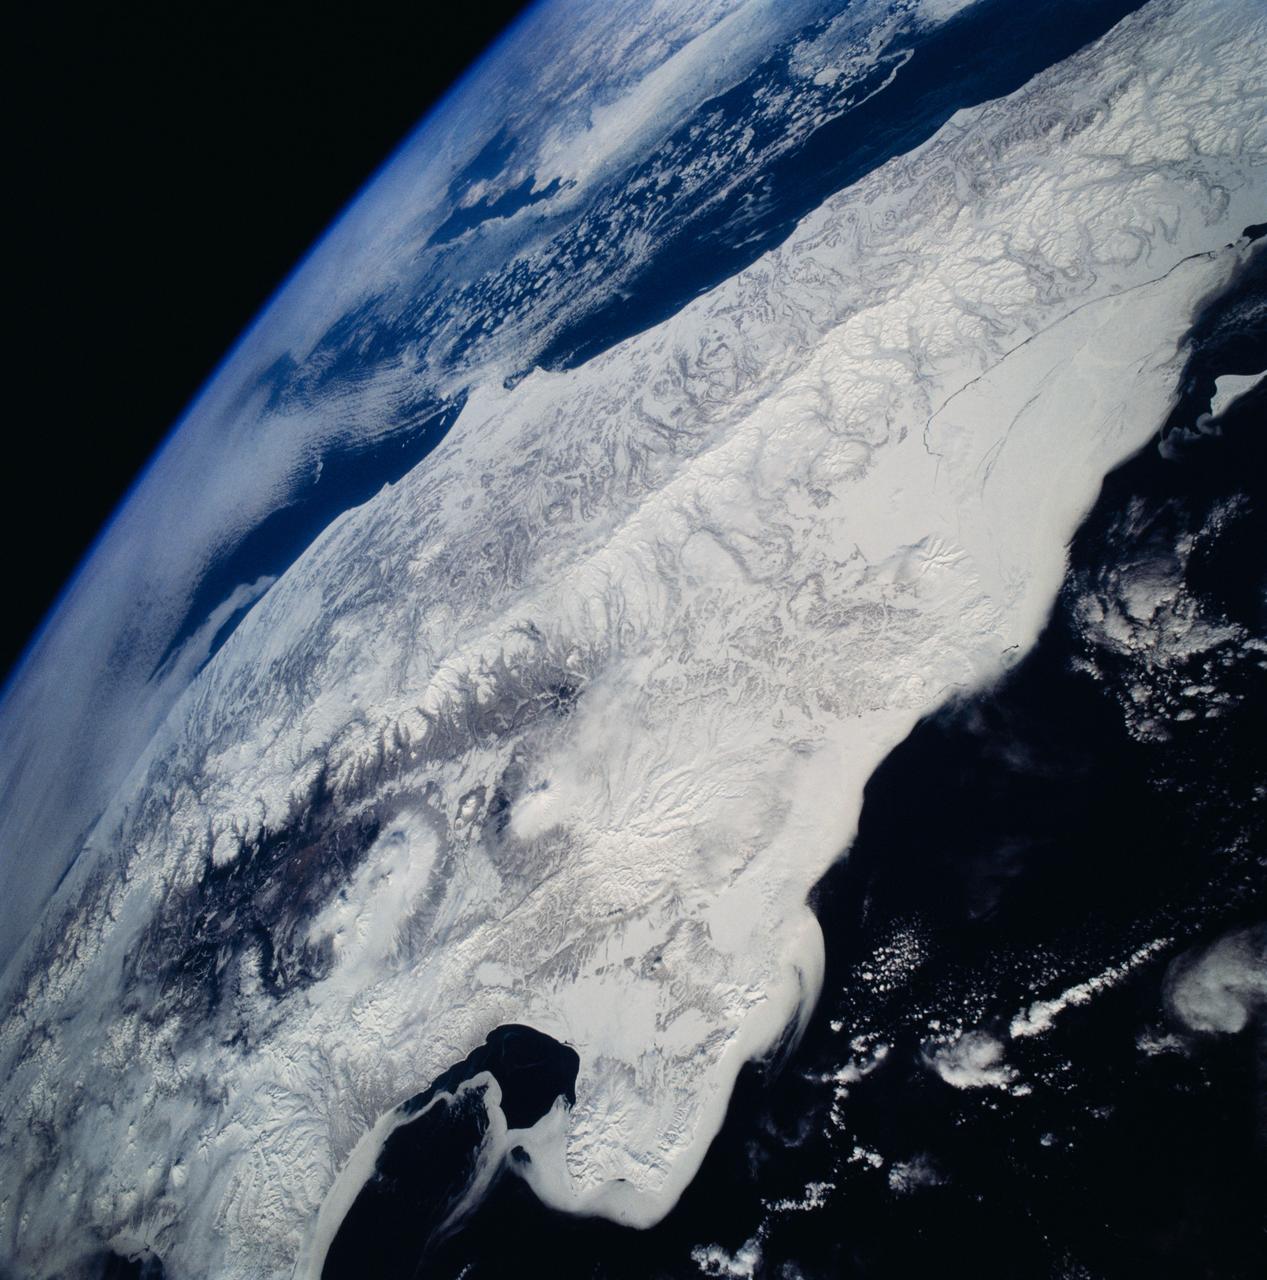
STS059-81-095 (9-20 April 1994) --- View southwestward across the Kamchatka Peninsula. The cluster of volcanoes in the middle distance are active, including Klutchevskaya whose summit reaches 15,580 feet. Changes in volcanic deposits, snow, and ice are being studied by Russian and American SRL investigators. Seasonal changes in sea ice are also of interest, for example, in Kamchatskiy Bay (upper left). Hasselblad camera, 40mm lens.
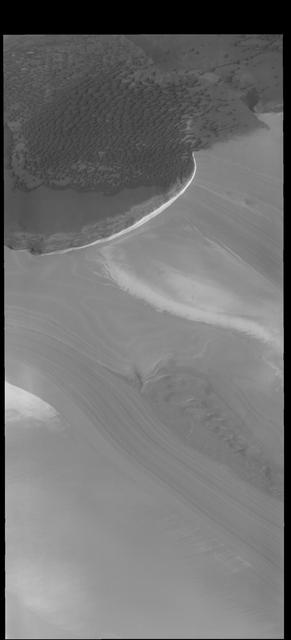
Today's VIS image is located along the edge of the north polar cap. The ice of the cap covers most of the image, with only the upper 1/4 of the image showing the ice free plains. Dunes cover most of the plains and are 'climbing' up onto the cap. This region of dunes in near Olympia Undae, the immense sand sea that surrounds part of the polar cap. Orbit Number: 80094 Latitude: 83.6465 Longitude: 118.114 Instrument: VIS Captured: 2020-01-04 06:40
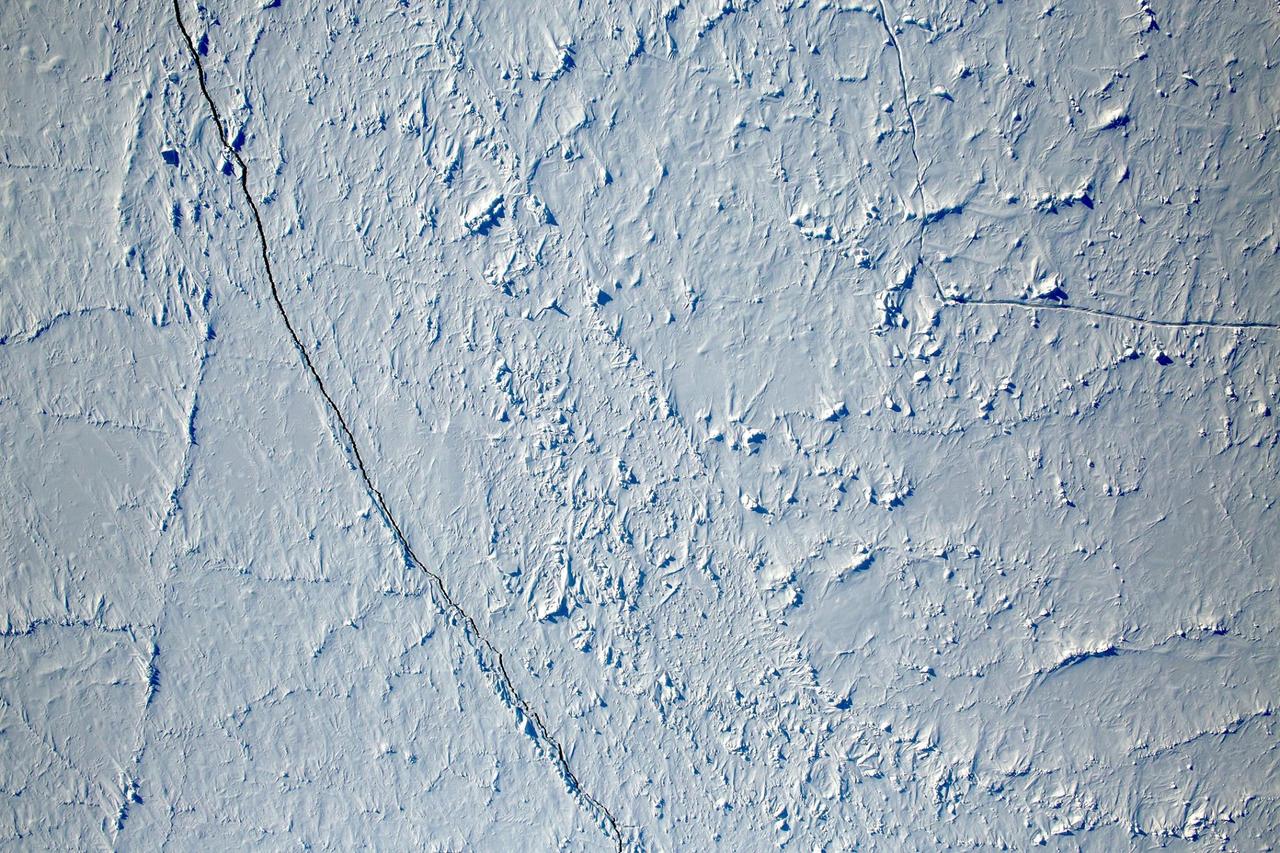
Want to know what the North Pole looked like yesterday afternoon? Well, our friends from NASA Operation IceBridge brought us this view from 500 meters about the North Pole. So what are you seeing? That's sea ice, with a few ridges and a bit of snow cover, and with a few small cracks, almost leads in the ice. Credit: NASA/Goddard/Operation IceBridge/Eric Fraim

Benny Hopson from the Barrow (Alaska) Arctic Science Consortium drills a core sample from sea ice in the Chukchi Sea on July 4, 2010. The core is sliced up into puck-sized sections and stored onboard the U.S. Coast Guard Healy for analysis in the ship's lab. Impacts of Climate change on the Eco-Systems and Chemistry of the Arctic Pacific Environment (ICESCAPE) is a multi-year NASA shipborne project. The bulk of the research will take place in the Beaufort and Chukchi Sea’s in summer of 2010 and fall of 2011. Photo Credit: (NASA/Kathryn Hansen)
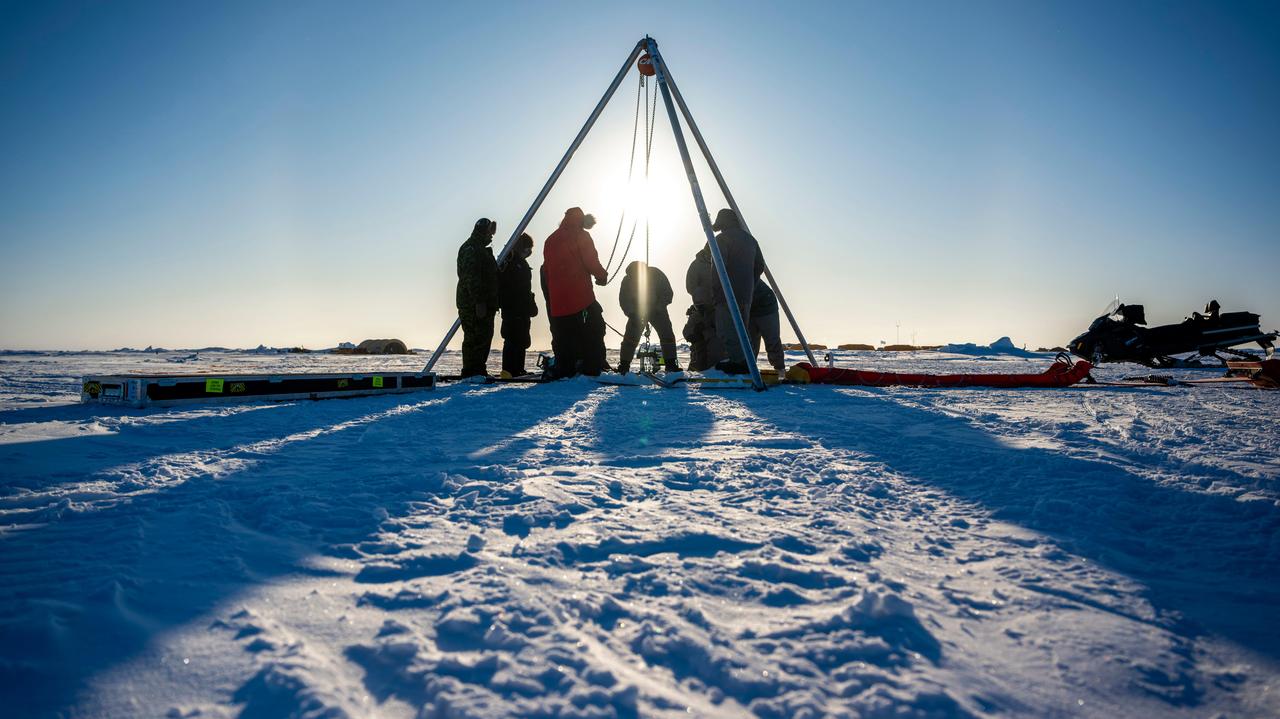
A prototype of an autonomous robot, part of a project called IceNode being developed at NASA's Jet Propulsion Laboratory, was tested in the Beaufort Sea north of Alaska in March 2024. The project envisions a fleet of such robots to venture beneath Antarctic ice shelves and gather data that would help scientists calculate how rapidly the ice shelves there are melting – and how fast that melting could cause global sea levels to rise. This image, as well as Figures A and B, shows the team lowering the prototype through a borehole in the sea ice. During this Arctic field test, the robot descended on a tether about 330 feet (100 meters) into the ocean, where its instruments gathered salinity, temperature, and flow data. The team also conducted tests to determine adjustments that would enable them to take the robot off-tether. Each about 8 feet (2.4 meters) long and 10 inches (25 centimeters) in diameter, the robots use three-legged "landing gear" that springs out from one end to attach the robot to the underside of the ice. Rather than using propulsion, the robots would autonomously position themselves with the help of novel algorithms based on models of ocean currents. Released from a borehole or a vessel in the open ocean, the robots would ride those currents on a long journey beneath an ice shelf. They would target the underwater area known as the "grounding zone," where floating ice shelves, ocean, and land meet, deep inside unmapped cavities where the ice may be melting the fastest. Each robot would detach a ballast and rise up to affix itself to the underside of the ice, where their suite of sensors would measure how fast warm, salty ocean water is circulating up to melt the ice, and how quickly cold meltwater is sinking. As conceived, the IceNode fleet would operate for up to a year, continuously capturing data, including seasonal fluctuations. Then the robots would detach themselves from the ice, drift back out to open ocean, and transmit their data via satellite. This test was conducted through the U.S. Navy Arctic Submarine Laboratory's biennial Ice Camp, a three-week operation that provides researchers a temporary base camp from which to conduct field work in the harsh Arctic environment. IceNode has been funded through JPL's internal research and technology development program and its Earth Science and Technology Directorate. JPL is managed for NASA by Caltech in Pasadena, California. https://photojournal.jpl.nasa.gov/catalog/PIA26349
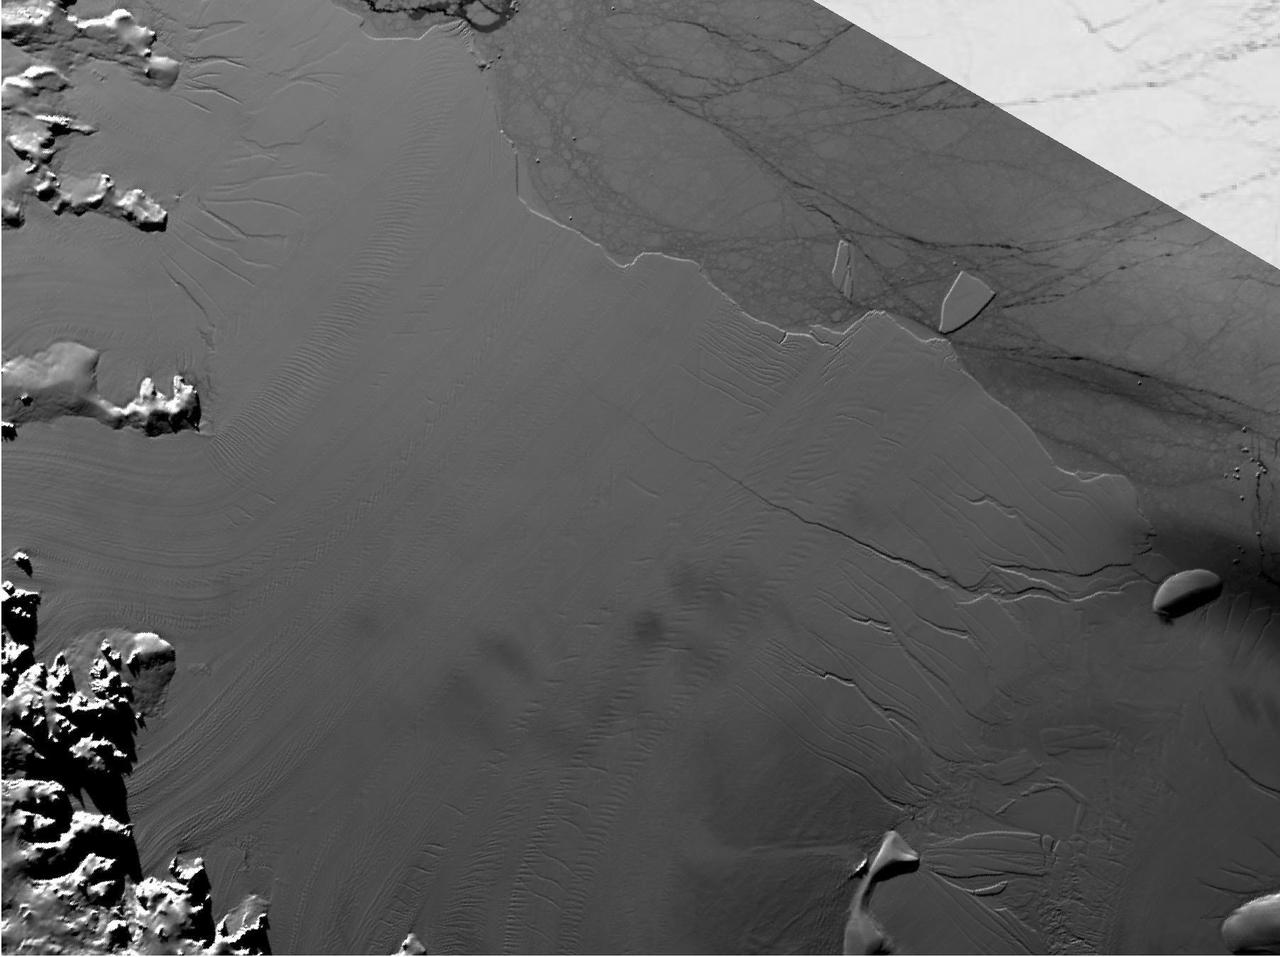
Between July 10 and 12, 2017, the Larsen C Ice Shelf in West Antarctica calved one of the largest icebergs in history (named "A-68"), weighing approximately one trillion tons. The rift in the ice shelf that spawned the iceberg has been present on the shelf since at least the beginning of the Landsat era (approximately the 1970s), but remained relatively dormant until around 2012, when it was observed actively moving through a suture zone in the ice shelf (Jansen et al., 2015). Suture zones are wide bands of ice that extend from glacier grounding lines (the boundary between a floating ice shelf and ice resting on bedrock) to the sea comprised of a frozen mixture of glacial ice and sea water, traditionally considered to be stabilizing features in ice shelves. When the Antarctic entered its annual dark period in late April, scientists knew the rift only had a few more miles to go before it completely calved the large iceberg. However, due to the lack of sunlight during the Antarctic winter, visible imagery is generally not available each year between May and August. This frame is from an animation that shows the ice shelf as imaged by the NASA/NOAA satellite Suomi NPP, which features the VIIRS (Visible Infrared Imaging Radiometer Suite) instrument. VIIRS has a day/night panchromatic band capable of collecting nighttime imagery of Earth with a spatial resolution of 2,460 feet (750 meters). An image from the Moderate Resolution Imaging Spectroradiometer (MODIS) instrument on NASA's Terra satellite shows the last cloud-free, daytime image of the ice shelf on April 6; the MODIS thermal imagery band is shown on April 29. The images from May 9 to July 14 show available cloud-free imagery from Suomi NPP. Luckily, despite several cloudy days leading up to the break, the weather mostly cleared on July 11, allowing scientists to see the newly formed iceberg on July 12. The animation is available at https://photojournal.jpl.nasa.gov/catalog/PIA21785
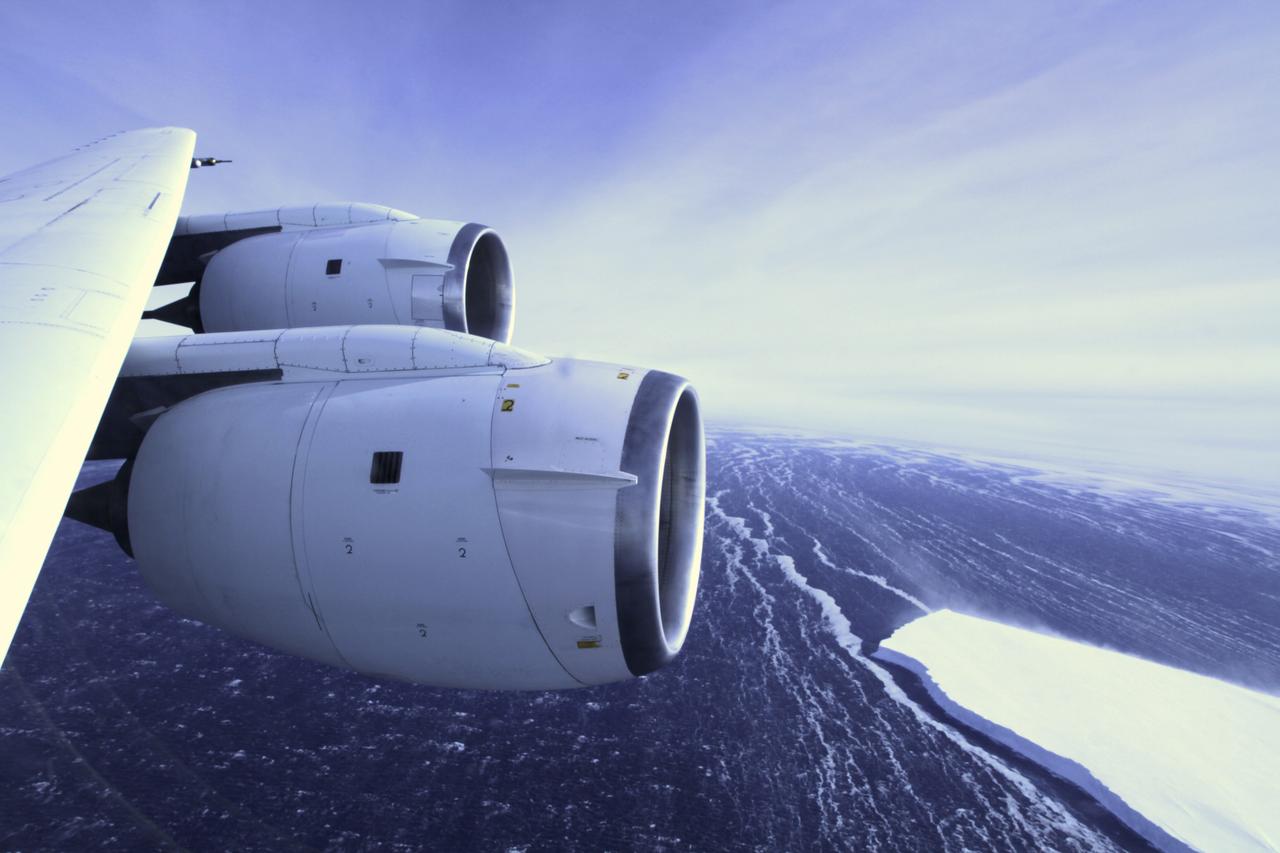
During a flight over the Pine Island Glacier ice shelf, the DC-8 banks over the Amundsen Sea and the clean edge of the ice shelf front. The shelf drops about 200 feet from its surface to sea level. This image was taken on Oct. 26, 2011. Credit: NASA/GSFC/Jefferson Beck NASA's Operation IceBridge returns to a base camp of Punta Arenas, Chile for the third year of flights over Antarctica's changing sea ice, glaciers and ice sheets. NASA's DC-8, outfitted with seven remote-sensing instruments, and a Gulfstream 5 operated by the National Science Foundation and National Center for Atmospheric Research and outfitted with a high-altitude laser-ranging mapper, will fly from Chile over Antarctica in October and November. The mission is designed to record changes to Antarctica's ice sheets and give scientists insight into what is driving those changes. Follow the progress of the mission: Campaign News site: <a href="http://www.nasa.gov/mission_pages/icebridge/index.html" rel="nofollow">www.nasa.gov/mission_pages/icebridge/index.html</a> IceBridge blog: <a href="http://blogs.nasa.gov/cm/newui/blog/viewpostlist.jsp?blogname=icebridge" rel="nofollow">blogs.nasa.gov/cm/newui/blog/viewpostlist.jsp?blogname=ic...</a> Twitter: @nasa_ice <b><a href="http://www.nasa.gov/audience/formedia/features/MP_Photo_Guidelines.html" rel="nofollow">NASA image use policy.</a></b> <b><a href="http://www.nasa.gov/centers/goddard/home/index.html" rel="nofollow">NASA Goddard Space Flight Center</a></b> enables NASA’s mission through four scientific endeavors: Earth Science, Heliophysics, Solar System Exploration, and Astrophysics. Goddard plays a leading role in NASA’s accomplishments by contributing compelling scientific knowledge to advance the Agency’s mission. <b>Follow us on <a href="http://twitter.com/NASA_GoddardPix" rel="nofollow">Twitter</a></b> <b>Like us on <a href="http://www.facebook.com/pages/Greenbelt-MD/NASA-Goddard/395013845897?ref=tsd" rel="nofollow">Facebook</a></b> <b>Find us on <a href="http://instagrid.me/nasagoddard/?vm=grid" rel="nofollow">Instagram</a></b>
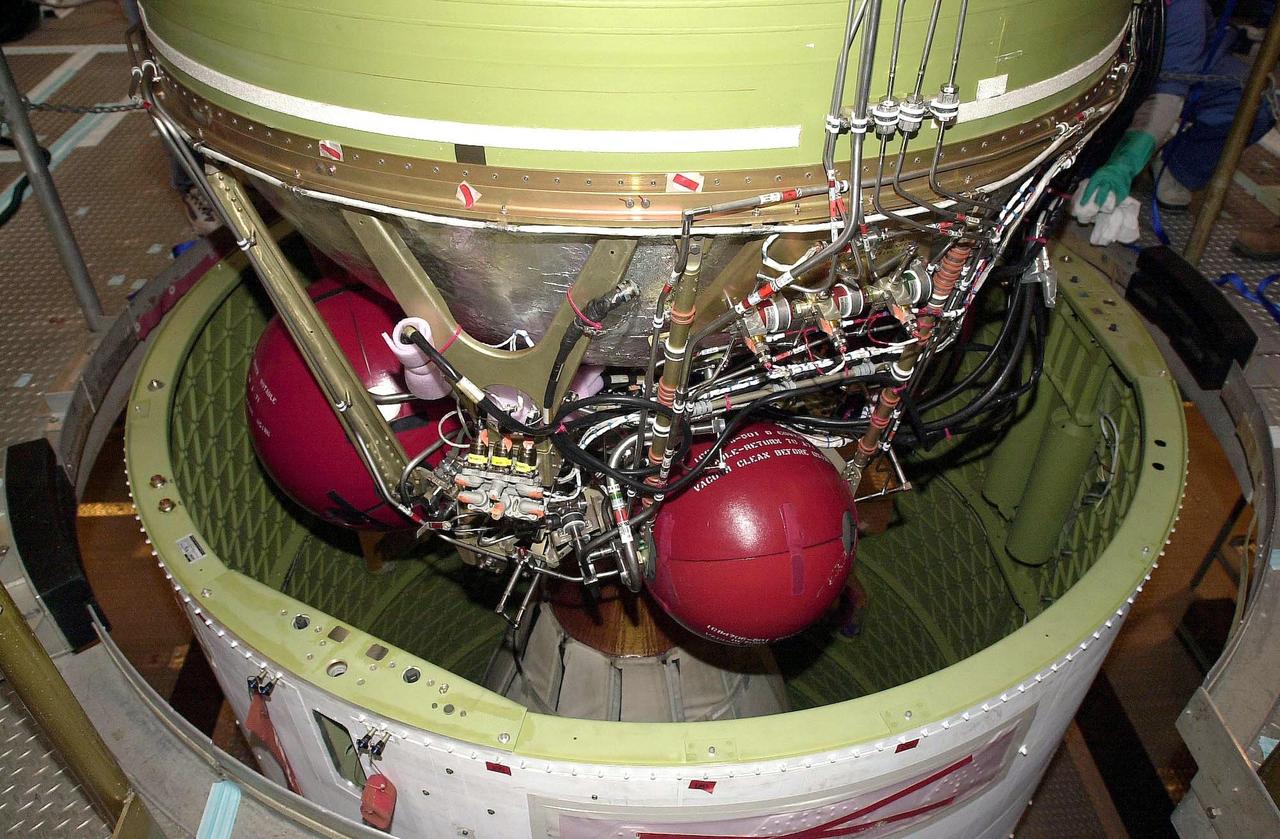
KENNEDY SPACE CENTER, FLA. - A second stage is inserted into an interstage atop a Delta II rocket at NASA's Space Launch Complex 2 (SLC-2) at Vandenberg Air Force Base, Calif. The rocket will carry the ICESat and CHIPSat satellites into Earth orbits. The Ice, Cloud, and Land Elevation Satellite, or ICESat, is a 661-pound satellite carrying the Geoscience Laser Altimeter System (GLAS) that will revolutionize our understanding of ice and its role in global climate change and how we protect and understand our home planet. It will help scientists determine if the global sea level is rising or falling. It will look at the ice sheets that blanket the Earth's poles to see if they are growing or shrinking. It will assist in developing an understanding of how changes in the Earth's atmosphere and climate effect polar ice masses and global sea level. The Cosmic Hot Interstellar Plasma Spectrometer, or CHIPSat, a suitcase-size 131-pound satellite, will provide invaluable information into the origin, physical processes and properties of the hot gas contained in the interstellar medium. This can provide important clues about the formation and evolution of galaxies since the interstellar medium literally contains the seeds of future stars. The Delta II launch is scheduled for Jan. 11, 2003, between 4:45 p.m. - 5:30 p.m. PST.
KENNEDY SPACE CENTER, FLA. - A second stage is lifted at NASA's Space Launch Complex 2 (SLC-2) at Vandenberg Air Force Base, Calif., for placement atop a Delta II rocket. The rocket will carry the ICESat and CHIPSat satellites into Earth orbits. The Ice, Cloud, and Land Elevation Satellite, or ICESat, is a 661-pound satellite carrying the Geoscience Laser Altimeter System (GLAS) that will revolutionize our understanding of ice and its role in global climate change and how we protect and understand our home planet. It will help scientists determine if the global sea level is rising or falling. It will look at the ice sheets that blanket the Earth's poles to see if they are growing or shrinking. It will assist in developing an understanding of how changes in the Earth's atmosphere and climate effect polar ice masses and global sea level. The Cosmic Hot Interstellar Plasma Spectrometer, or CHIPSat, a suitcase-size 131-pound satellite, will provide invaluable information into the origin, physical processes and properties of the hot gas contained in the interstellar medium. This can provide important clues about the formation and evolution of galaxies since the interstellar medium literally contains the seeds of future stars. The Delta II launch is scheduled for Jan. 11, 2003, between 4:45 p.m. - 5:30 p.m. PST.