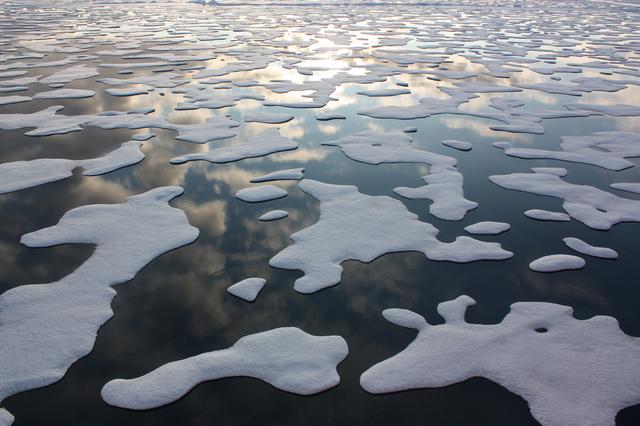
On July 20, the U.S. Coast Guard Cutter Healy steamed south in the Arctic Ocean toward the edge of the sea ice. The ICESCAPE mission, or "Impacts of Climate on Ecosystems and Chemistry of the Arctic Pacific Environment," is NASA's two-year shipborne investigation to study how changing conditions in the Arctic affect the ocean's chemistry and ecosystems. The bulk of the research takes place in the Beaufort and Chukchi seas in summer 2010 and 2011. Credit: NASA/Kathryn Hansen For updates on the five-week ICESCAPE voyage, visit the mission blog at: go.usa.gov/WwU <b><a href="http://www.nasa.gov/audience/formedia/features/MP_Photo_Guidelines.html" rel="nofollow">NASA image use policy.</a></b> <b><a href="http://www.nasa.gov/centers/goddard/home/index.html" rel="nofollow">NASA Goddard Space Flight Center</a></b> enables NASA’s mission through four scientific endeavors: Earth Science, Heliophysics, Solar System Exploration, and Astrophysics. Goddard plays a leading role in NASA’s accomplishments by contributing compelling scientific knowledge to advance the Agency’s mission. <b>Follow us on <a href="http://twitter.com/NASA_GoddardPix" rel="nofollow">Twitter</a></b> <b>Like us on <a href="http://www.facebook.com/pages/Greenbelt-MD/NASA-Goddard/395013845897?ref=tsd" rel="nofollow">Facebook</a></b> <b>Find us on <a href="http://instagrid.me/nasagoddard/?vm=grid" rel="nofollow">Instagram</a></b>
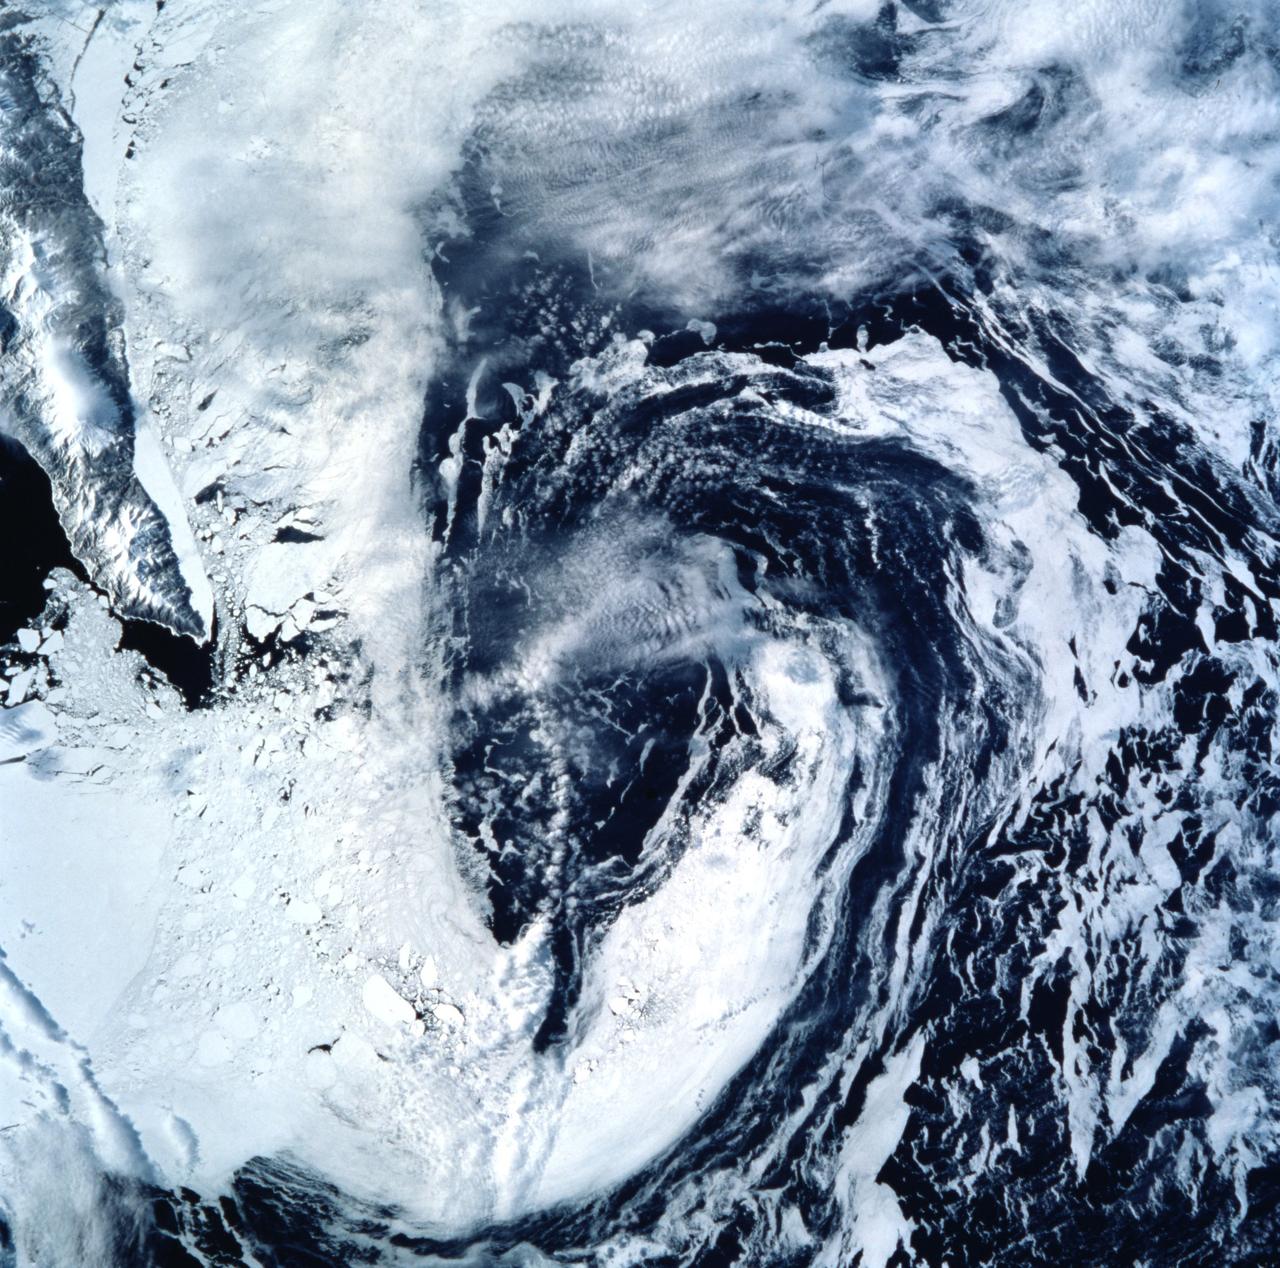
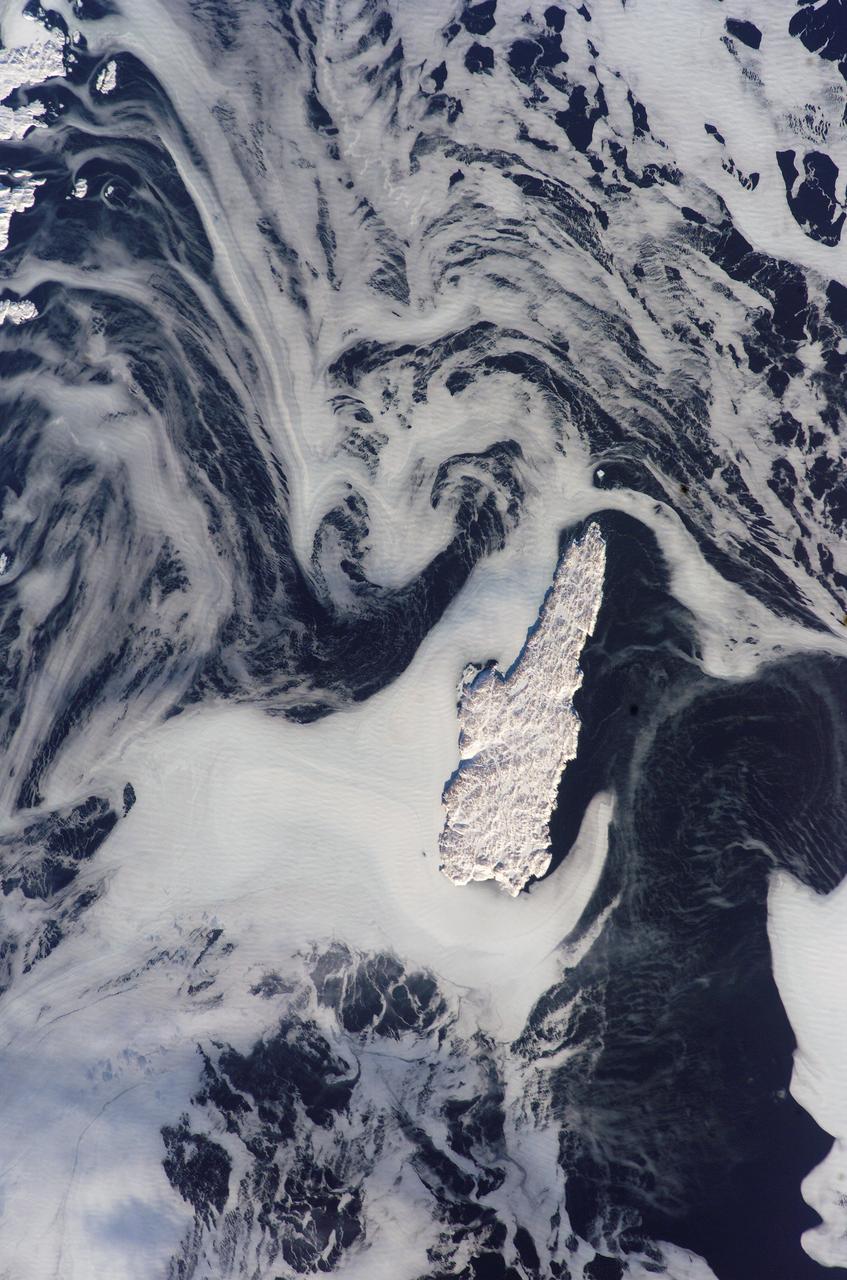
STS099-722-077 (11-22 February 2000) ---Both topography and bathymetry combine with wind and sea currents to produce a pattern of sea ice in the extreme southern Sea of Okhotsk, in this scene photographed by one of the STS-99 crew members aboard the Space Shuttle Endeavour. The rugged shoreline of north Hokkaido and the Kurile Archipelago have channeled northerly winds and surface waters into a gyre here, clearly depicted in the pattern of sea ice.
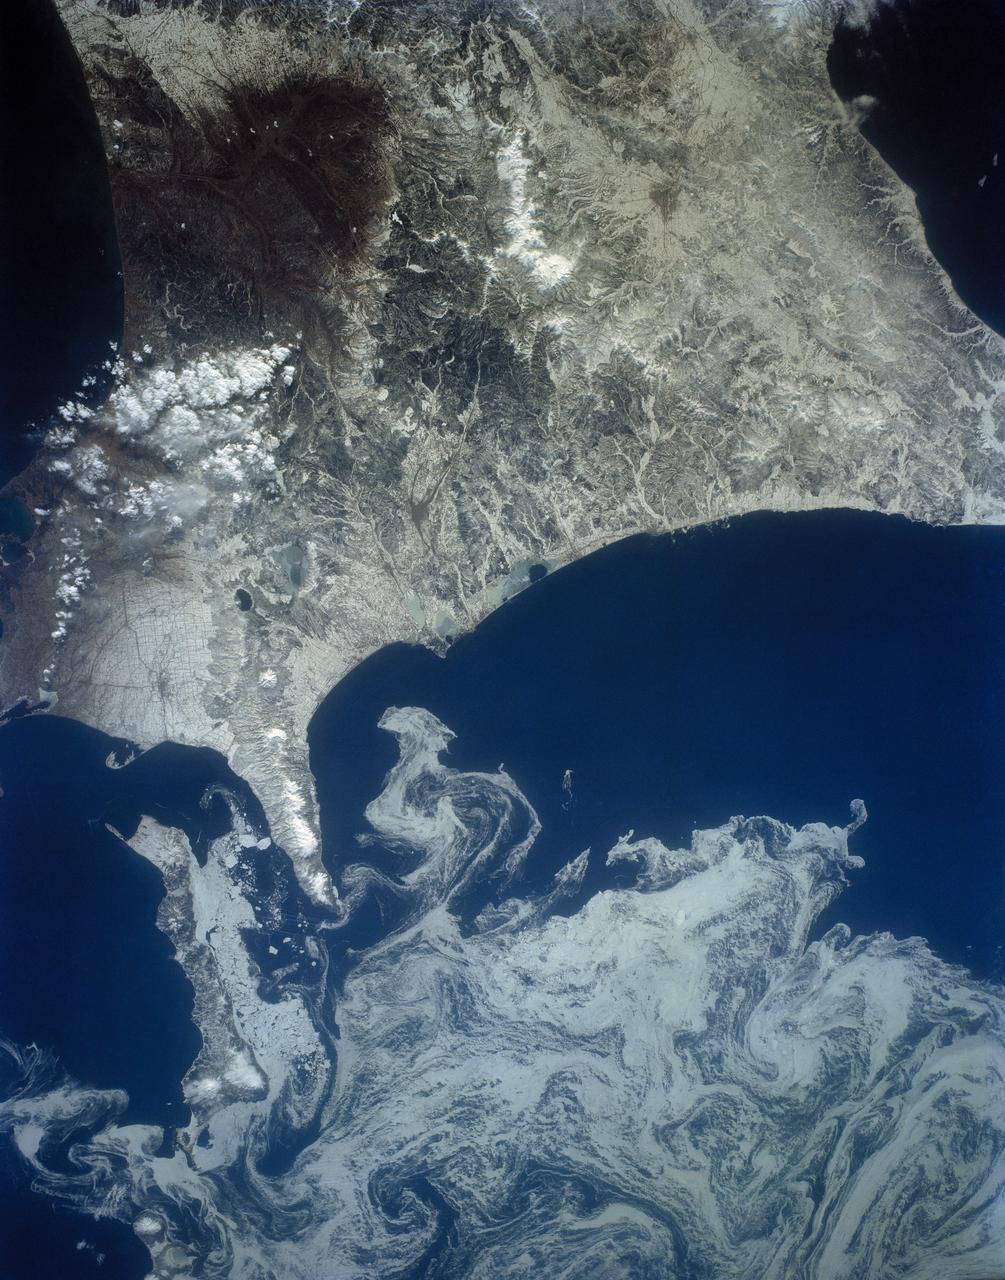
The northeast coast of Hokkaido and Kunashir Island, Japan (44.0N, 143.0E) are seen bordered by drifting sea ice. The sea ice has formed a complex pattern of eddies in response to surface water currents and winds. Photos of this kind aid researchers in describing local ocean current patterns and the effects of wind speed and direction on the drift of surface material, such as ice floes or oil. Kunashir is the southernmost of the Kuril Islands.
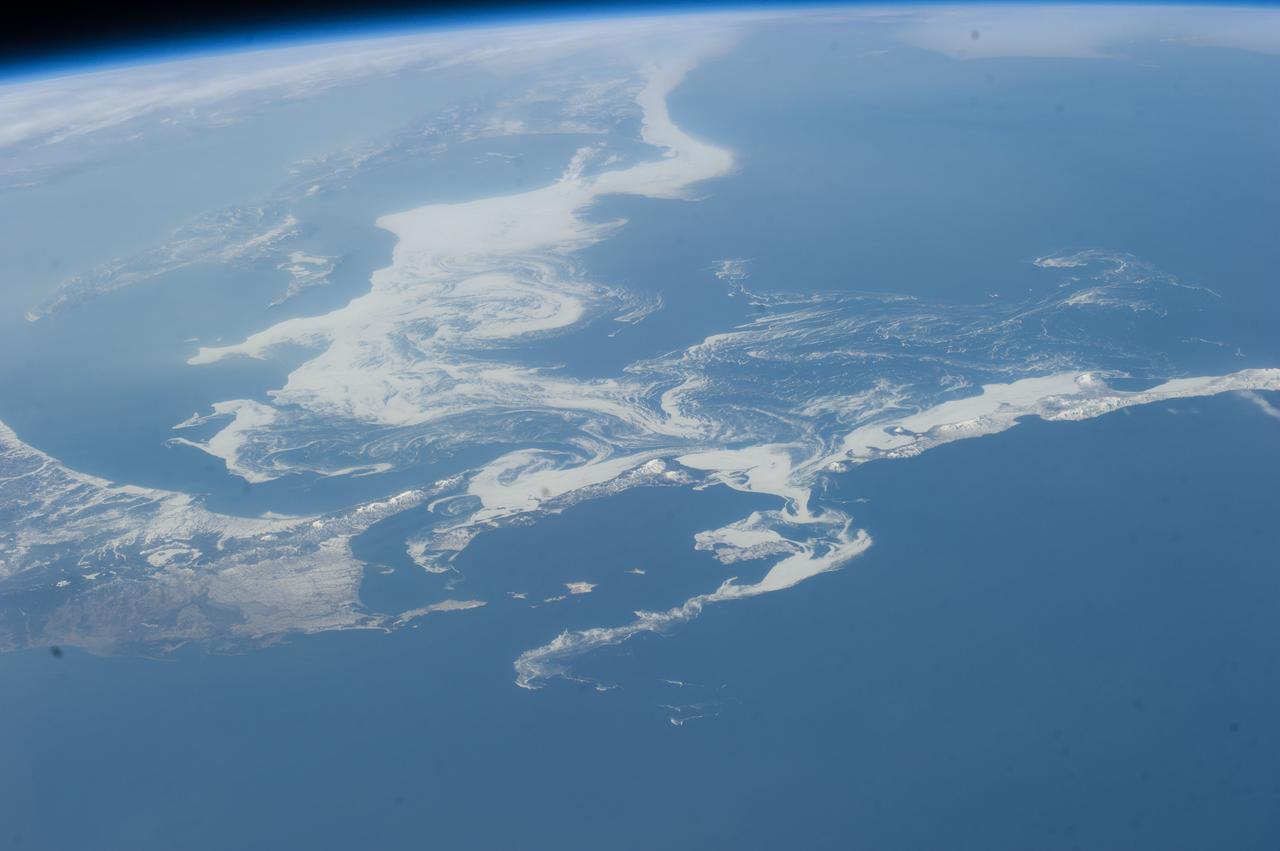
ISS039-E-11773 (14 April 2014) --- Photographed with a camera equipped with an 80mm lens from the International Space Station, patterns of sea ice in the Sea of Okhotsk reveal the dynamics of ocean currents that could otherwise only be seen in sunglint. In this Expedition 39 photo, one can see nearly 1,000 kilometers (600 miles) of the East Sakhalin Current, which is carrying winter ice south toward Japan’s Hokkaido Island. The current is marked by the narrow corridor of dense ice that hugs the coast of Russia’s Sakhalin Island. As it approaches Hokkaido, the ice patterns show a series of eddies and swirls. The East Sakhalin Current wanes in summer when the Soya Current begins to enter the Sea of Okhotsk. This inrush of summer water starts in April and, according to NASA scientists, probably expresses itself in this image as ice pattern to the east above Hokkaido. The Sakhalin current turns east and transports ice toward the Kuril Island chain. Some ice can spill through gaps in the islands, where it is swept southwest by the Kuril Current (lower right).
ISS012-E-15918 (24 Jan. 2006) --- Belle Isle and a portion of Newfoundland, Canada are featured in this image photographed by an Expedition 12 crew member on the International Space Station. Belle Isle (center) is surrounded by sea ice in this recent winter view. Belle Isle lies in the strait between the Island of Newfoundland and Labrador (the mainland portion of Canada’s province of Newfoundland). Small islands along the coast of Labrador appear in the top left corner. In this key location Belle Isle lies on the shortest shipping lanes between the Great Lakes and Europe, and also on the main north-south shipping route to Hudson Bay and the Northwest Territories. Snow and ice in this recent winter view obliterate the dozens of glacier-scoured lakes that dot the surface of the island. The single community of Belle Isle Landing on the southeast tip is equally hard to see. Ice patterns also show that the island lies at the meeting point of two sea currents. The Labrador Current flows from the northwest (top left), and a smaller current, driven by dominant westerly winds, flows from the southwest (lower left) out of the narrow Belle Isle Strait (out of frame lower left). Flow lines in sea ice indicate the sense of movement of the ice. Ice floes embedded in the Labrador Current appear in the upper part of the image as a relatively open pattern. Sea ice with a denser pattern enters from the lower left corner, banking against the west side of Belle Isle. Tendrils flow around capes at either end of the island, with an ice-free “shadow” on the opposite, downstream side. Eddies (center) in the ice patterns show where the currents interact, north and west of the island.
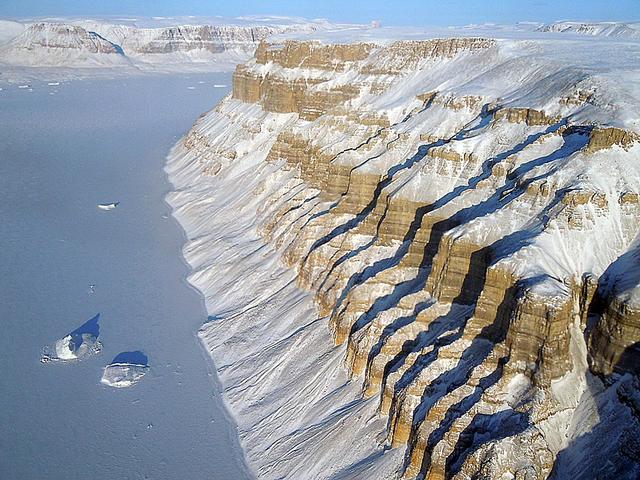
On March 31, the P-3 departed Thule, Greenland. IceBridge teams flew a science transit flight to Kangerlussaq, Greenland, where missions will be based for the next several weeks before returning to Thule. Along the route, instruments surveyed several targets of opportunity including two ground tracks of the Ice, Cloud and land Elevation Satellite (ICESat) and several glaciers (Rink, Kangerdlugssuaq, Jakobshavn and Russell), turning up great data and spectacular views. March 29 was another perfect day for a land ice flight. The P-3 flew between deep canyons and over glaciers along the northwest coast of Greenland. But before the start of land ice flights, IceBridge reached a key milestone over sea ice. On March 28, IceBridge flew its eighth sea ice flight marking the completion of all high- and medium-priority sea ice missions planned from Thule. Among the sea ice missions was a science transit back from Fairbanks to Thule on March 25, during which the P-3 surveyed in complete darkness. Researchers watched the scanning pattern of the green lasers on the sea ice below and the beautiful Aurora Borealis above. To learn more about Ice Bridge go to: <a href="http://www.nasa.gov/mission_pages/icebridge/news/spr11/index.html" rel="nofollow">www.nasa.gov/mission_pages/icebridge/news/spr11/index.html</a> <b><a href="http://www.nasa.gov/centers/goddard/home/index.html" rel="nofollow">NASA Goddard Space Flight Center</a></b> enables NASA’s mission through four scientific endeavors: Earth Science, Heliophysics, Solar System Exploration, and Astrophysics. Goddard plays a leading role in NASA’s accomplishments by contributing compelling scientific knowledge to advance the Agency’s mission. <b>Follow us on <a href="http://twitter.com/NASA_GoddardPix" rel="nofollow">Twitter</a></b> <b>Join us on <a href="http://www.facebook.com/pages/Greenbelt-MD/NASA-Goddard/395013845897?ref=tsd" rel="nofollow">Facebook</a></b>
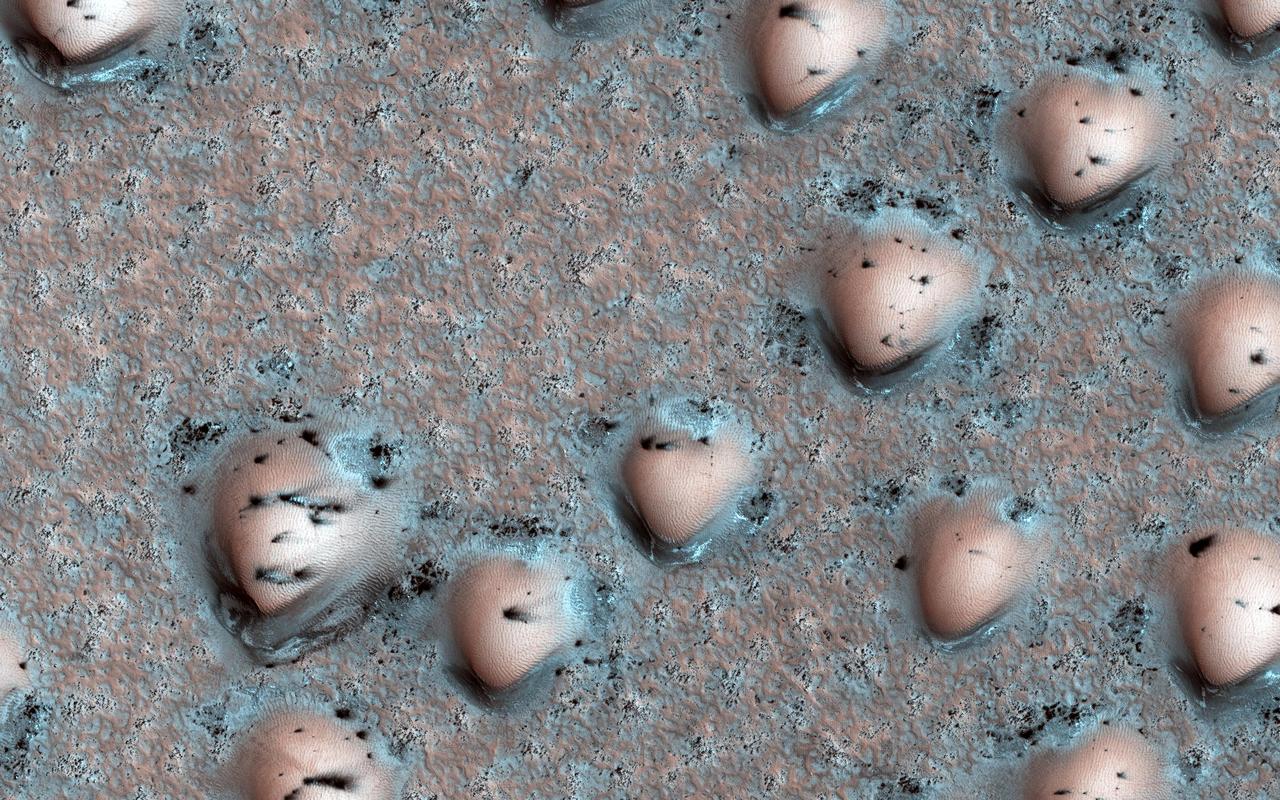
It's spring in the Northern Hemisphere of Mars, and the polar region is still blanketed by seasonal carbon dioxide frost (dry ice). This image shows an area near the sand sea (called an "erg") that is surrounding the water ice-rich layered deposits. The many bumps are sand dunes less than 100 meters across that are mostly covered by seasonal frost, appearing in a manner that looks artificial but is a natural consequence of the wind patterns in this region. The smaller, darker spots are places where the seasonal frost has sublimed away, exposing the dark surface below. The combination of these features makes for an unearthly scene! https://photojournal.jpl.nasa.gov/catalog/PIA23527
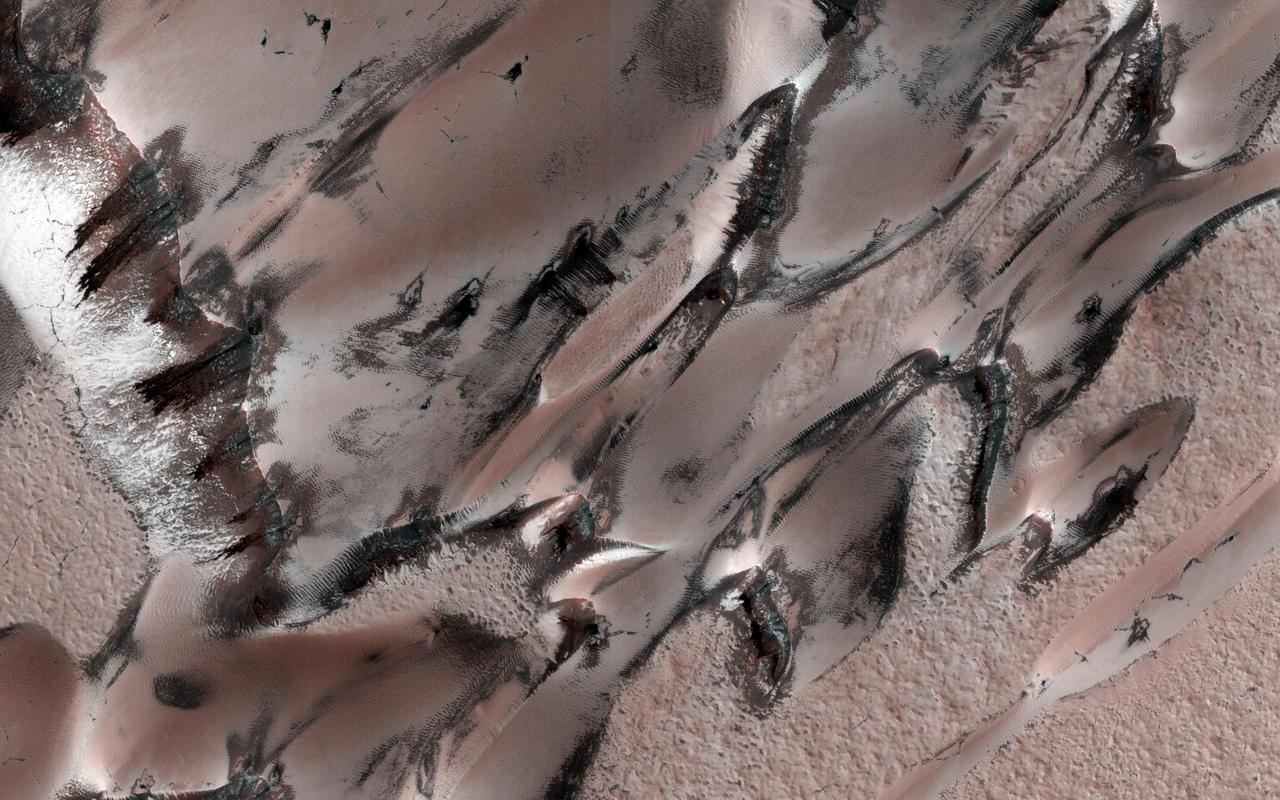
This image covers a unique polar dune field during northern spring, revealing some interesting patterns. The main "megadune" formation comprises giant crescent-shaped dunes called "barchans," which have been migrating (from upper-right to lower-left) over the past several centuries or more. Light-toned seasonal carbon dioxide frost and ice that accumulated over the winter still covers the majority of the surface, and is now starting to defrost and sublimate in complex patterns. (This depends on the slope aspect and incoming solar illumination). As frost is removed, the darker "coal-black" nature of the dune sand is revealed. For example, compare with this image taken in summer, when frost is gone and the dunes are migrating. The striped patterns of the carbon dioxide frost and linear nature of the dune field give it a sea serpent-like appearance. https://photojournal.jpl.nasa.gov/catalog/PIA24699
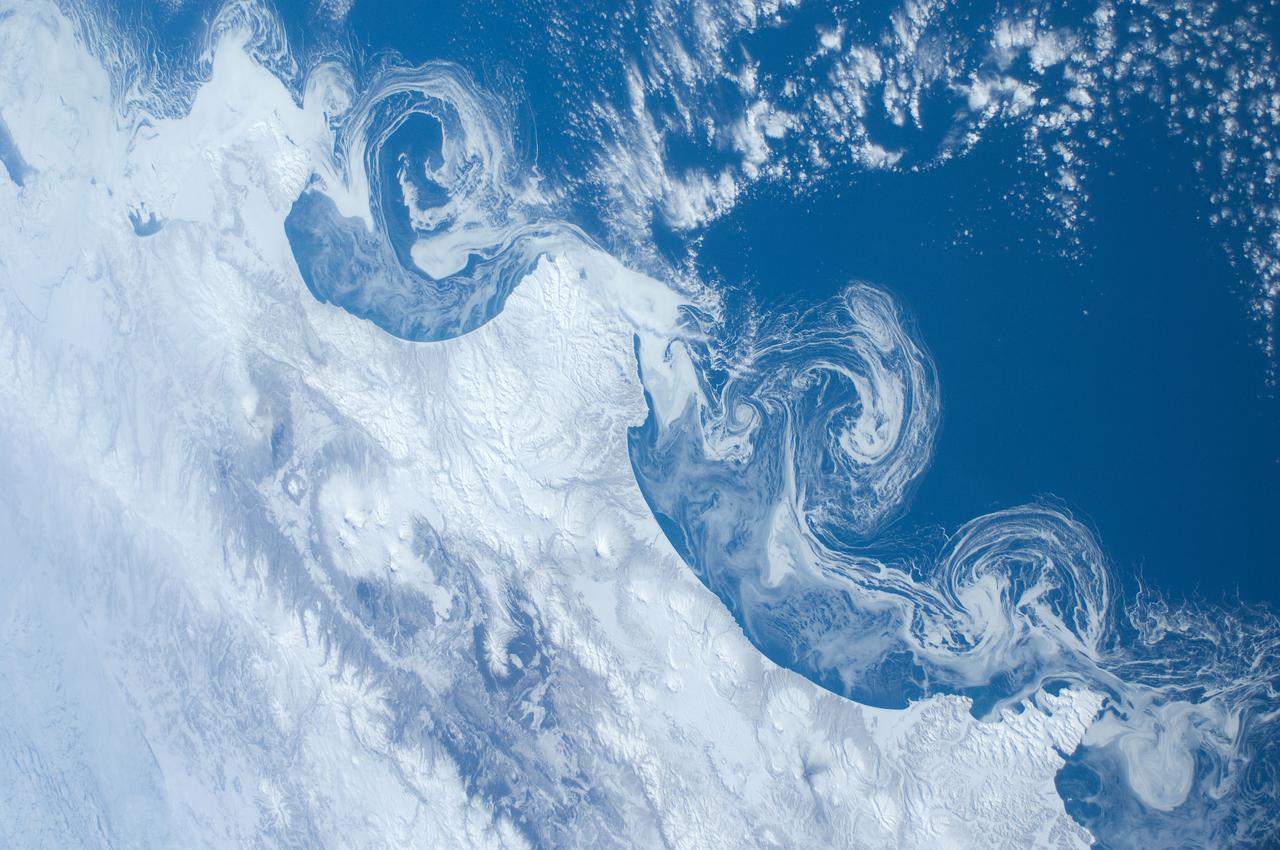
ISS030-E-162344 (15 March 2012) --- Ice floes along the Kamchatka coastline are featured in this image photographed by an Expedition 30 crew member on the International Space Station. The vantage point from orbit frequently affords the opportunity to observe processes that are impossible to see on the ground – or in this case the northeastern Pacific Ocean. The winter season blankets the Kamchatka Peninsula of Russia in snow, but significant amounts of sea ice can also form and collect along the coastline. As ice floes grind against each other, they produce smaller floes that can be moved by wind and water currents acting along the coastline. The irregular southeastern coastline of Kamchatka helps to produce large circular eddy currents from the main southwestward-flowing Kamchatka current. Three such eddies are clearly highlighted by surface ice floe patterns at center. The ice patterns are very difficult (and dangerous) to navigate in an ocean vessel – while the floes may look thin and delicate from the space station vantage point, even the smaller ice chunks are likely several meters across. White clouds at top right are distinguished from the sea ice and snow cover in the image by their high brightness and discontinuous nature. The Kamchatka Peninsula also hosts many currently and historically active stratovolcanoes. Kliuchevskoi Volcano, the highest in Kamchatka (summit elevation 4,835 meters) and one of the most active, had its most recent confirmed eruption in June of 2011, while Karymsky Volcano to the south likely produced ash plumes days before this image was taken; the snow cover near the volcano to the south and east of the summit is darkened, probably due to a cover of fresh ash, or melted away altogether (bottom center). In contrast, Kronotsky Volcano – a “textbook” symmetrical cone-shaped stratovolcano – last erupted in 1923.
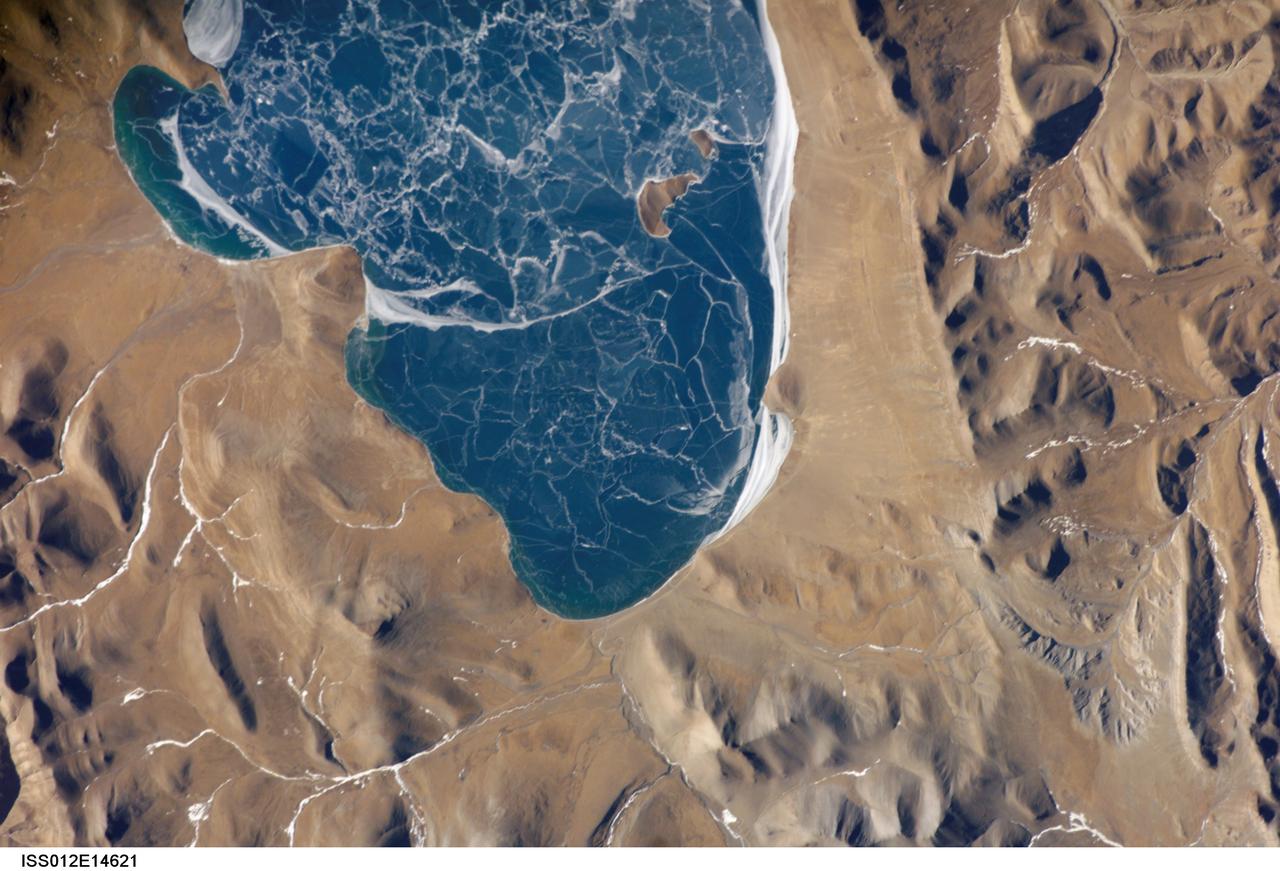
ISS012-E-14621 (6 Jan. 2006) --- A portion of Lake Puma Yumco and parts of Tibet and China are featured in this image photographed by an Expedition 12 crew member on the International Space Station. The alpine lakes of the Tibetan Plateau are some of the most remote in the world. This image depicts Lake Puma Yumco during the winter season. The lake is located at an elevation of 5,030 meters above sea level, and is considered ultraoligotrophic in that nutrient concentrations in both the water column and lake sediments are extremely low. Water in such lakes tends to be blue to blue-green and have high clarity due to the lack of abundant photosynthesizing organisms such as phytoplankton. Water color change in these lakes is usually due to shallowing of the water – blue indicating deeper water. The maximum dimensions of the lake are 31 kilometers by 14 kilometers, indicating that the ice blocks range from less than ten to hundreds of meters in diameter. According to scientists, the ice pattern is caused by repeated cycles of freezing, fracturing, and refreezing of the ice due to variations in temperature and wind-induced ice motion. A prominent white linear feature across the center of the lake (not visible in this image) is suggestive of an ice ridge formed by east-west winds subsequently highlighted by snow.
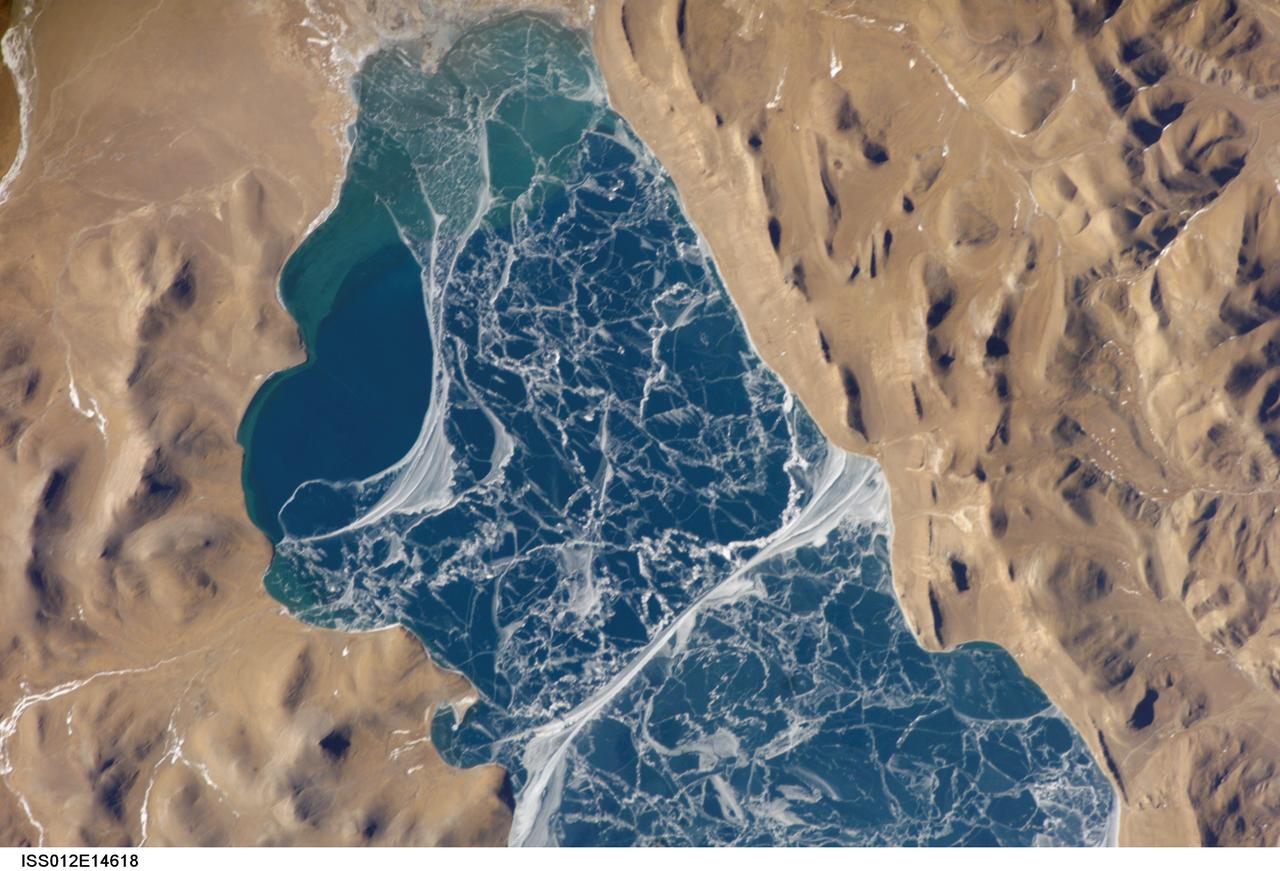
ISS012-E-14618 (6 Jan. 2006) --- A portion of Lake Puma Yumco and parts of Tibet and China are featured in this image photographed by an Expedition 12 crew member on the International Space Station. The alpine lakes of the Tibetan Plateau are some of the most remote in the world. This image depicts Lake Puma Yumco during the winter season. The lake is located at an elevation of 5,030 meters above sea level, and is considered ultraoligotrophic in that nutrient concentrations in both the water column and lake sediments are extremely low. Water in such lakes tends to be blue to blue-green and have high clarity due to the lack of abundant photosynthesizing organisms such as phytoplankton. Water color change in these lakes is usually due to shallowing of the water – blue indicating deeper water - as is visible in the depth transition along the west/southwestern shoreline (left). The maximum dimensions of the lake are 31 kilometers by 14 kilometers, indicating that the ice blocks range from less than ten to hundreds of meters in diameter. According to scientists, the ice pattern is caused by repeated cycles of freezing, fracturing, and refreezing of the ice due to variations in temperature and wind-induced ice motion. A prominent white linear feature extending north-south across the center of the lake (lower center) is suggestive of an ice ridge formed by east-west winds subsequently highlighted by snow.
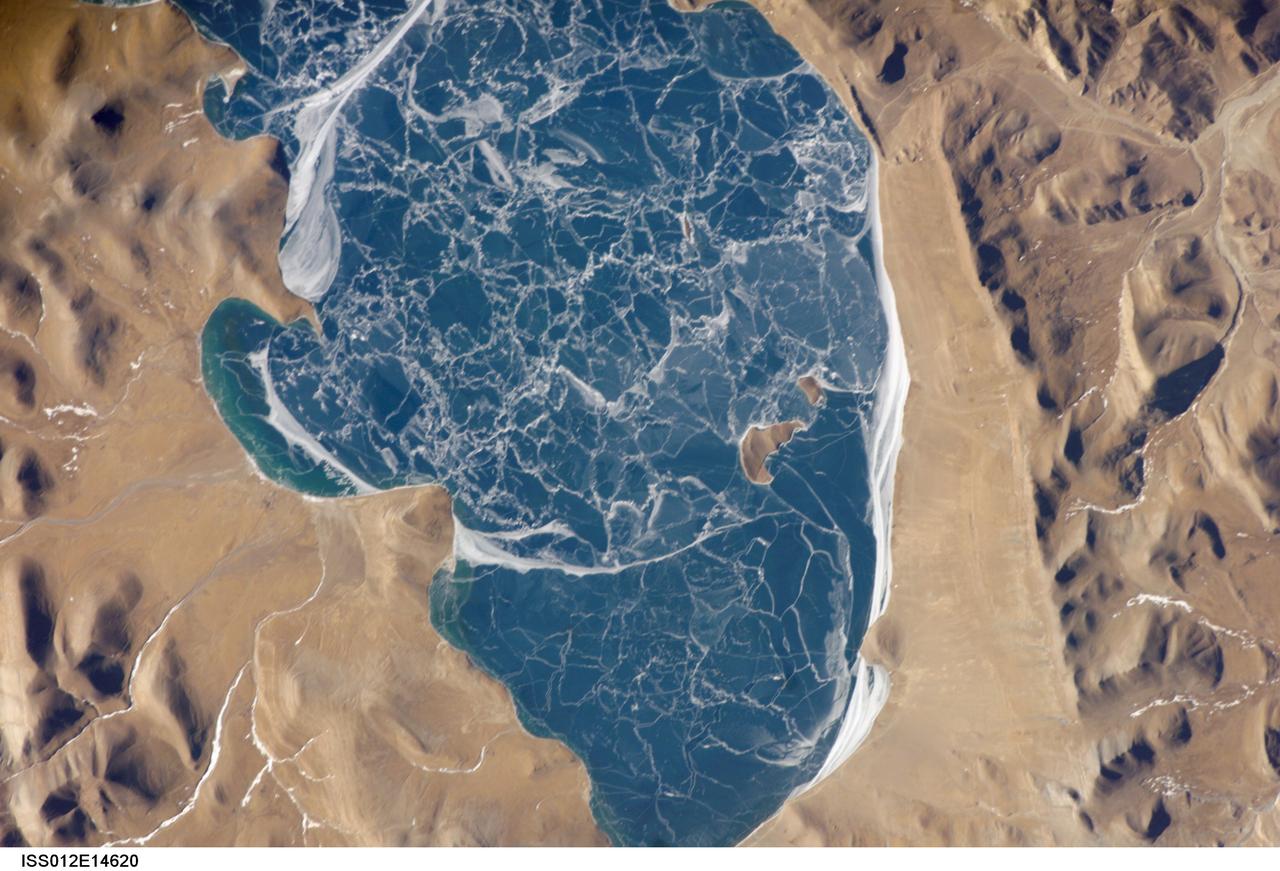
ISS012-E-14620 (6 Jan. 2006) --- A portion of Lake Puma Yumco and parts of Tibet and China are featured in this image photographed by an Expedition 12 crew member on the International Space Station. The alpine lakes of the Tibetan Plateau are some of the most remote in the world. This image depicts Lake Puma Yumco during the winter season. The lake is located at an elevation of 5,030 meters above sea level, and is considered ultraoligotrophic in that nutrient concentrations in both the water column and lake sediments are extremely low. Water in such lakes tends to be blue to blue-green and have high clarity due to the lack of abundant photosynthesizing organisms such as phytoplankton. The maximum dimensions of the lake are 31 kilometers by 14 kilometers, indicating that the ice blocks range from less than ten to hundreds of meters in diameter. According to scientists, the ice pattern is caused by repeated cycles of freezing, fracturing, and refreezing of the ice due to variations in temperature and wind-induced ice motion. A prominent white linear feature across the center of the lake (partially visible in upper left in this image) is suggestive of an ice ridge formed by east-west winds subsequently highlighted by snow.
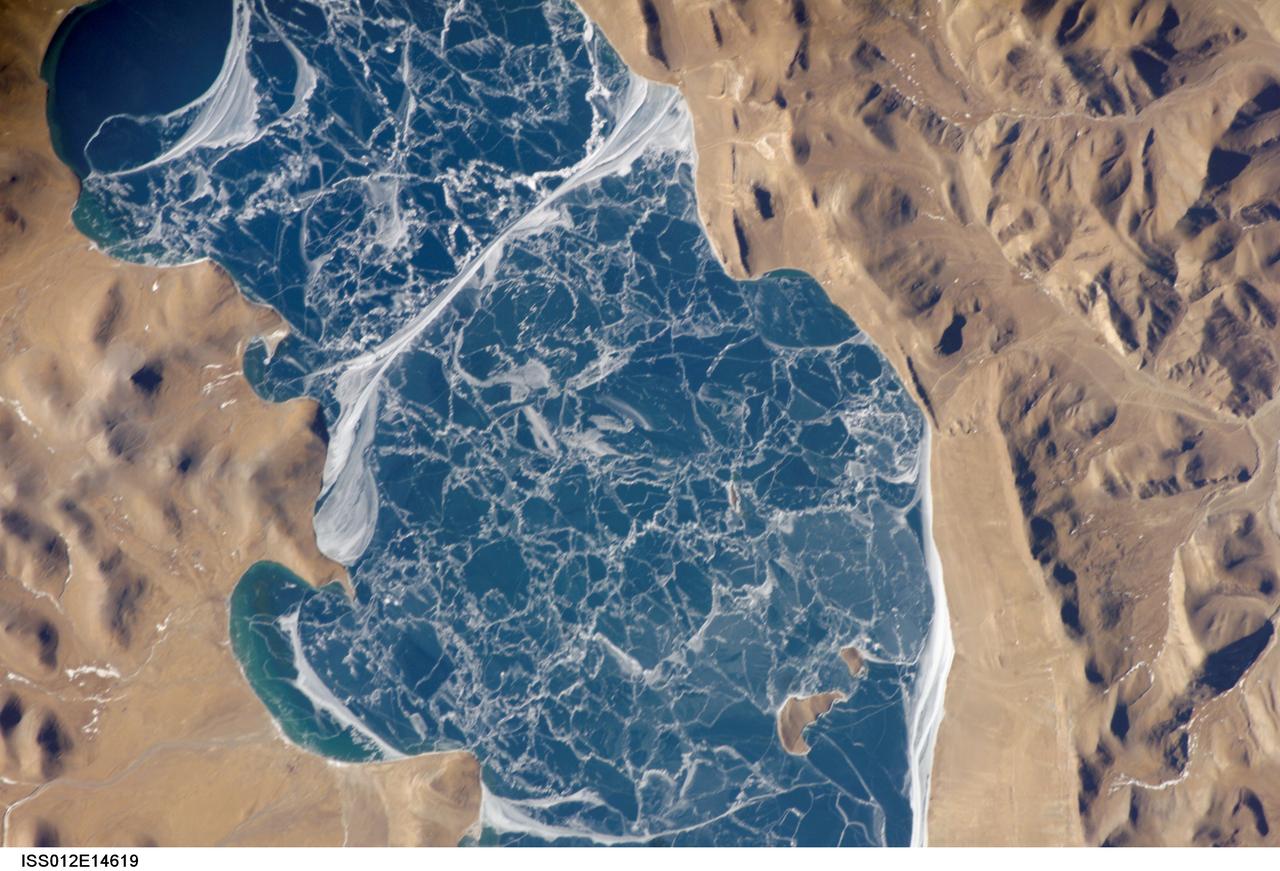
ISS012-E-14619 (6 Jan. 2006) --- A portion of Lake Puma Yumco and parts of Tibet and China are featured in this image photographed by an Expedition 12 crew member on the International Space Station. The alpine lakes of the Tibetan Plateau are some of the most remote in the world. This image depicts Lake Puma Yumco during the winter season. The lake is located at an elevation of 5,030 meters above sea level, and is considered ultraoligotrophic in that nutrient concentrations in both the water column and lake sediments are extremely low. Water in such lakes tends to be blue to blue-green and have high clarity due to the lack of abundant photosynthesizing organisms such as phytoplankton. Water color change in these lakes is usually due to shallowing of the water – blue indicating deeper water - as is visible in the depth transition along the west/southwestern shoreline (upper left). The maximum dimensions of the lake are 31 kilometers by 14 kilometers, indicating that the ice blocks range from less than ten to hundreds of meters in diameter. According to scientists, the ice pattern is caused by repeated cycles of freezing, fracturing, and refreezing of the ice due to variations in temperature and wind-induced ice motion. A prominent white linear feature across the center of the lake is suggestive of an ice ridge formed by east-west winds subsequently highlighted by snow.
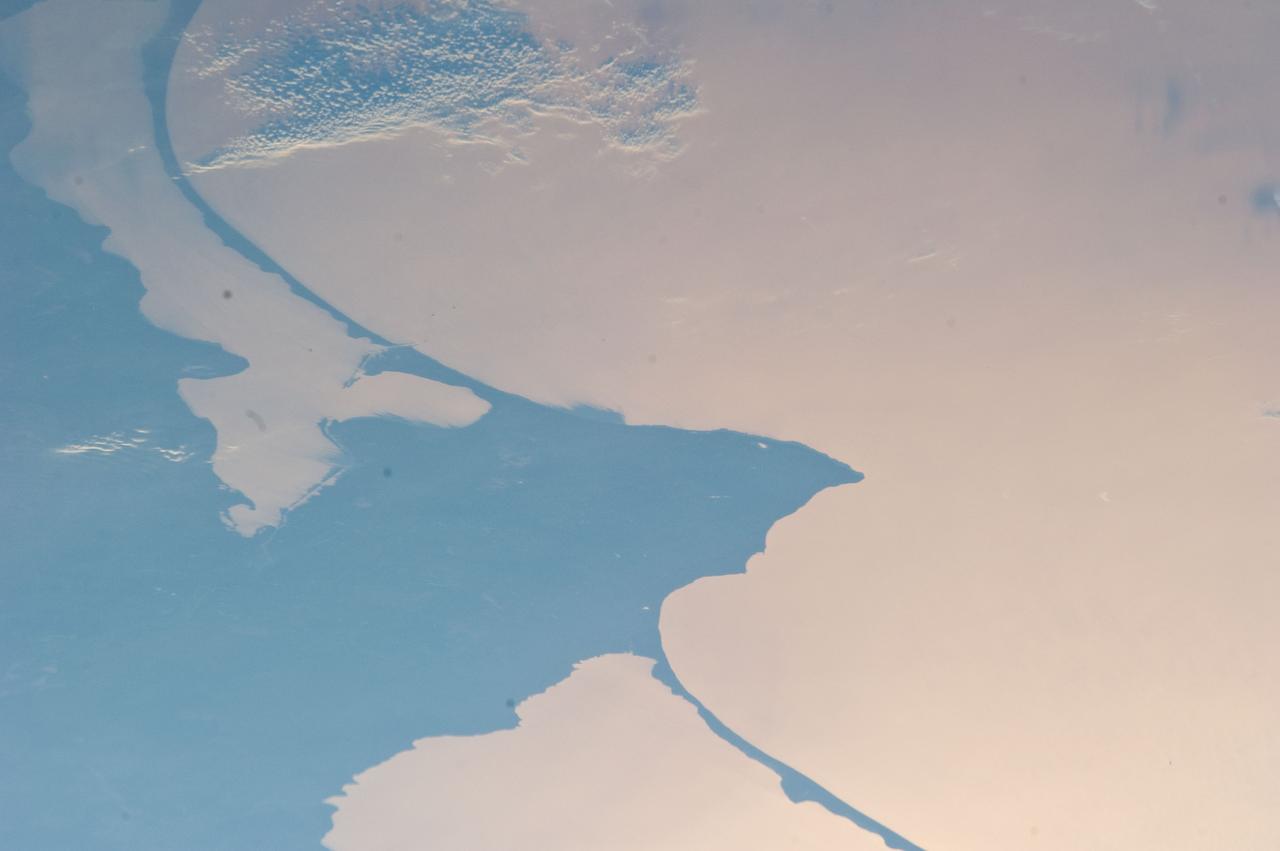
ISS028-E-024146 (2 Aug. 2011) --- Kaliningrad and Baltic Sea, Russia are featured in this image photographed by an Expedition 28 crew member on the International Space Station. This striking photograph reveals detail of the two great lagoons to the north and south of Kaliningrad, each protected from the open waters of the Baltic Sea by the thin perfect curves of current-generated sand spits. A broad arm of agricultural country separates the freshwater lagoons?known as Kurshsky Bay (or the Curonian Lagoon further north in Lithuania, just outside the top of the image) and the Vistula Lagoon. From the crew member perspective in low Earth orbit, land surfaces usually appear brighter than water, which normally appears darker and often black. Reflected sunlight, or sunglint, inverts this pattern. The reflected light in this image is a pink or coppery hue, indicating the likely existence of smog in the air since smog particles enhance the red part of the light spectrum. Camera settings used to acquire sunglint images result in high contrast that reveals excellent detail of coastlines and surface features of waterbodies, but masks land surface detail. The thin, 50 kilometer-long barge canal leading from the Baltic Sea to Kaliningrad is visible but the great port of Kaliningrad itself is not. Other human patterns on this intensively developed landscape such as towns, highways and farm boundaries are likewise masked in the image. The area has a long human history. The growth of the Vistula spit finally cut off the north Polish city of Elblag (just outside the bottom of the image) from the Baltic Sea in the 13th century. To reconnect Elblag directly with the Baltic Sea, the EU is considering funding the digging of another canal through the spit at lower right, despite ecological concerns. Kaliningrad was heavily damaged during WWII and then annexed by Russia and cleared of its German population. As the only Russian port on the Baltic Sea to be ice-free year-round, Kaliningrad then gained importance strategically as home of the Baltic Fleet.
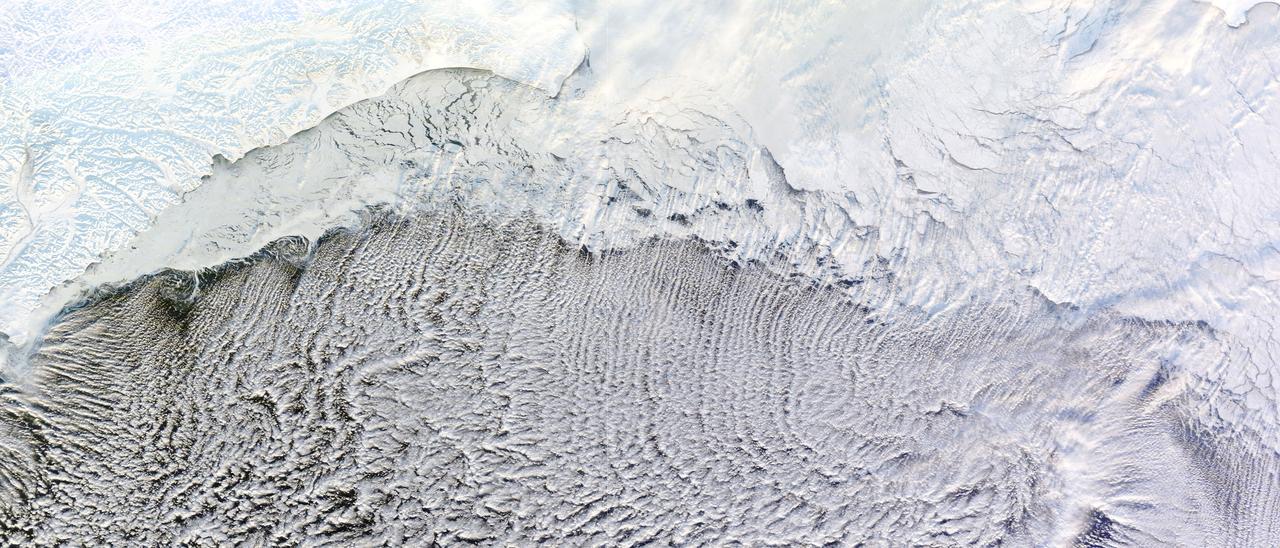
NASA image captured January 4, 2012 Most of us prefer our winter roads free of ice, but one kind of road depends on it: a cloud street. Such streets formed over the Bering Sea in early January 2012, thanks to snow and ice blanketing the nearby land, and sea ice clinging to the shore. The Moderate Resolution Imaging Spectroradiometer (MODIS) on NASA’s Terra satellite captured this natural-color image of the cloud streets on January 4, 2012. Air blowing over frigid ice then warmer ocean water can lead to the development of parallel cylinders of spinning air. Above the upward cycle of these cylinders (rising air), small clouds form. Along the downward cycle (descending air), skies are clear. The resulting cloud formations resemble streets. This image shows that some of the cloud streets begin over the sea ice, but most of the clouds hover over the open ocean water. These streets are not perfectly straight, but curve to the east and west after passing over the sea ice. By lining up along the prevailing wind direction, the tiny clouds comprising the streets indicate the wind patterns around the time of their formation. NASA images courtesy LANCE/EOSDIS MODIS Rapid Response Team at NASA GSFC. Caption by Michon Scott. Instrument: Terra - MODIS Credit: <b><a href="http://www.earthobservatory.nasa.gov/" rel="nofollow"> NASA Earth Observatory</a></b> <b><a href="http://www.nasa.gov/audience/formedia/features/MP_Photo_Guidelines.html" rel="nofollow">NASA image use policy.</a></b> <b><a href="http://www.nasa.gov/centers/goddard/home/index.html" rel="nofollow">NASA Goddard Space Flight Center</a></b> enables NASA’s mission through four scientific endeavors: Earth Science, Heliophysics, Solar System Exploration, and Astrophysics. Goddard plays a leading role in NASA’s accomplishments by contributing compelling scientific knowledge to advance the Agency’s mission. <b>Follow us on <a href="http://twitter.com/NASA_GoddardPix" rel="nofollow">Twitter</a></b> <b>Like us on <a href="http://www.facebook.com/pages/Greenbelt-MD/NASA-Goddard/395013845897?ref=tsd" rel="nofollow">Facebook</a></b> <b>Find us on <a href="http://instagrid.me/nasagoddard/?vm=grid" rel="nofollow">Instagram</a></b>
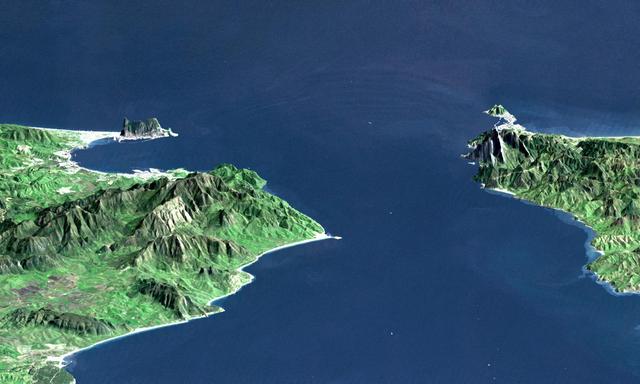
This perspective view shows the Strait of Gibraltar, which is the entrance to the Mediterranean Sea from the Atlantic Ocean. Europe (Spain) is on the left. Africa (Morocco) is on the right. The Rock of Gibraltar, administered by Great Britain, is the peninsula in the back left. The Strait of Gibraltar is the only natural gap in the topographic barriers that separate the Mediterranean Sea from the world's oceans. The Sea is about 3700 kilometers (2300 miles) long and covers about 2.5 million square kilometers (one million square miles), while the Strait is only about 13 kilometers (8 miles) wide. Sediment samples from the bottom of the Mediterranean Sea that include evaporite minerals, soils, and fossil plants show that about five million years ago the Strait was topographically blocked and the Sea had evaporated into a deep basin far lower in elevation than the oceans. Consequent changes in the world's hydrologic cycle, including effects upon ocean salinity, likely led to more ice formation in polar regions and more reflection of sunlight back to space, resulting in a cooler global climate at that time. Today, topography plays a key role in our regional climate patterns. But through Earth history, topographic change, even perhaps over areas as small as 13 kilometers across, has also affected the global climate. This image was generated from a Landsat satellite image draped over an elevation model produced by the Shuttle Radar Topography Mission (SRTM). The view is eastward with a 3-times vertical exaggeration to enhance topographic expression. Natural colors of the scene (green vegetation, blue water, brown soil, white beaches) are enhanced by image processing, inclusion of some infrared reflectance (as green) to highlight the vegetation pattern, and inclusion of shading of the elevation model to further highlight the topographic features. Landsat has been providing visible and infrared views of the Earth since 1972. SRTM elevation data matches the 30-meter (99-feet) resolution of most Landsat images and will substantially help in analyses of the large Landsat image archive. Elevation data used in this image was acquired by the Shuttle Radar Topography Mission (SRTM) aboard the Space Shuttle Endeavour, launched on February 11, 2000. http://photojournal.jpl.nasa.gov/catalog/PIA03397
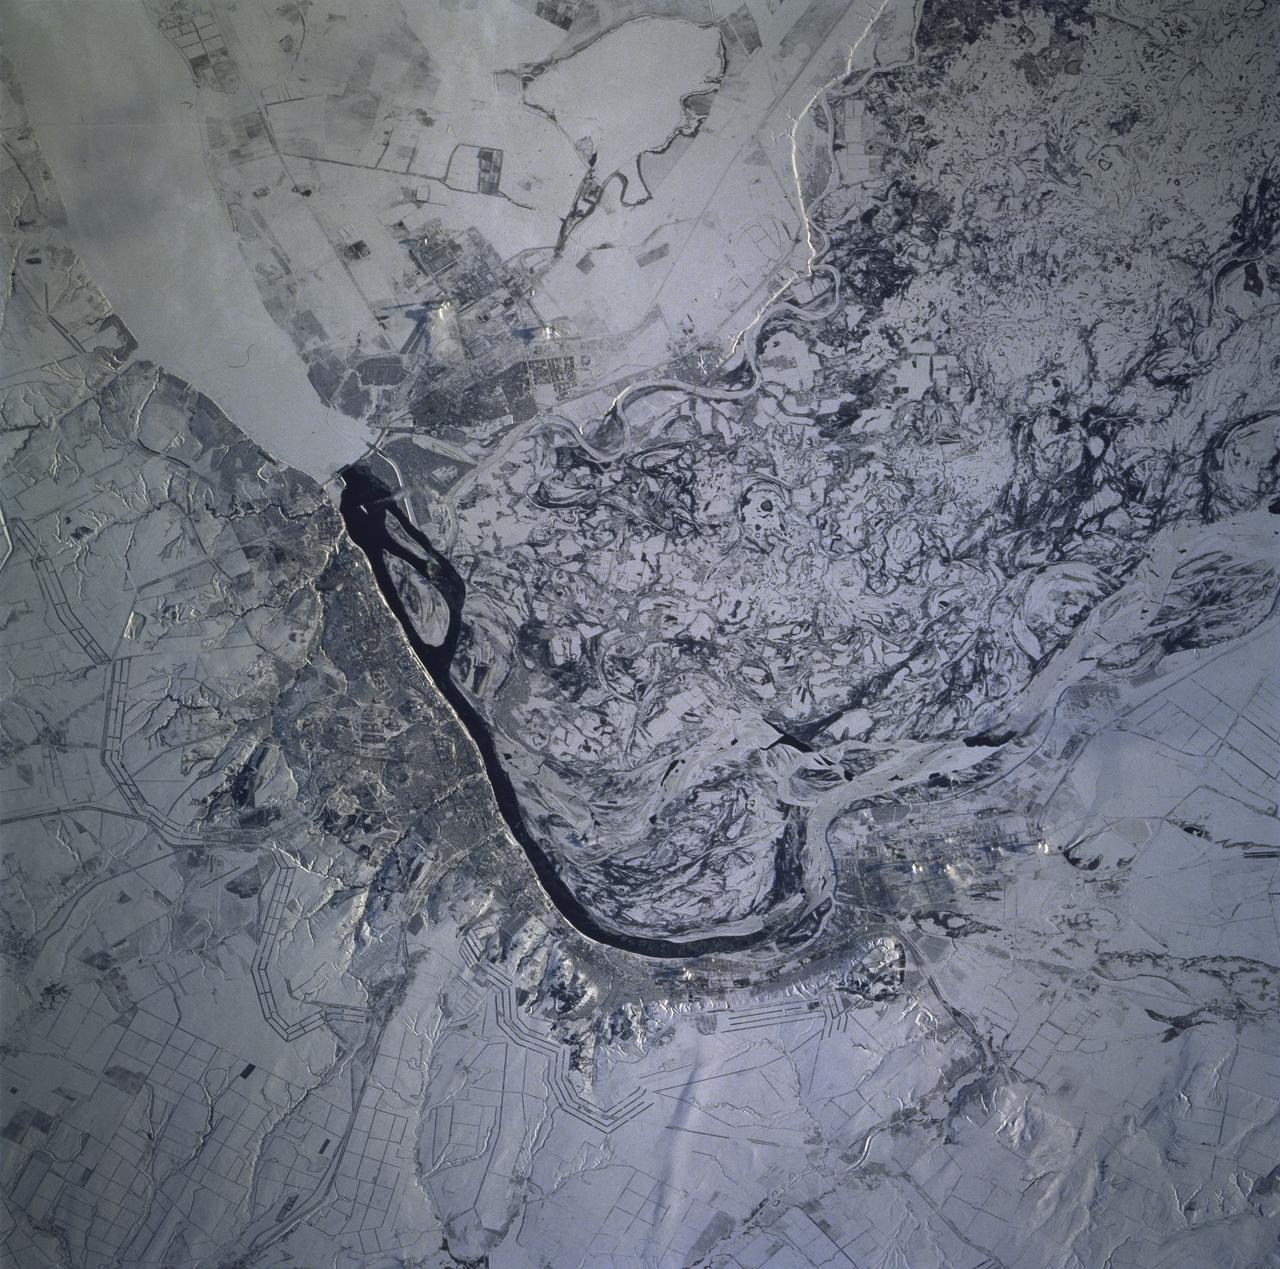
STS081-715-004 (12-22 Jan. 1997) --- As photographed with a 70mm camera aboard the Space Shuttle Atlantis, this scene features the Volga River and Volgograd under snow. Contrast in brightness shows up many features in this near-vertical view of the great bend of the Volga River's dark, open strip of water, center. The Volga flows south into the view from top right, then southeast from the center to the bottom. Volgograd appears as the gray zone along the left (west) side of the open water. Presumably the ice-free part of the river opposite Volgograd relates to the slightly warmer water which is spilled from prominent, ice-covered Lake Volgograd (top right). The wide patterns of swirls, center to lower right, are numerous meander bends on the Volga's floodplain (up to 20 miles wide), highlighted by snow. The main course of the Volga is once again ice covered in this floodplain belt. The Volga-Don Canal can be seen leaving the river just south of the bend, exiting the view center left. This canal, with others in the Moscow region, allows barge traffic to move through the Russian heartland, from the Black Sea to the Baltic at Leningrad. The long parallel lines in threes and fours are lines of trees used as wind breaks. They stretch across Russia for hundreds of miles.
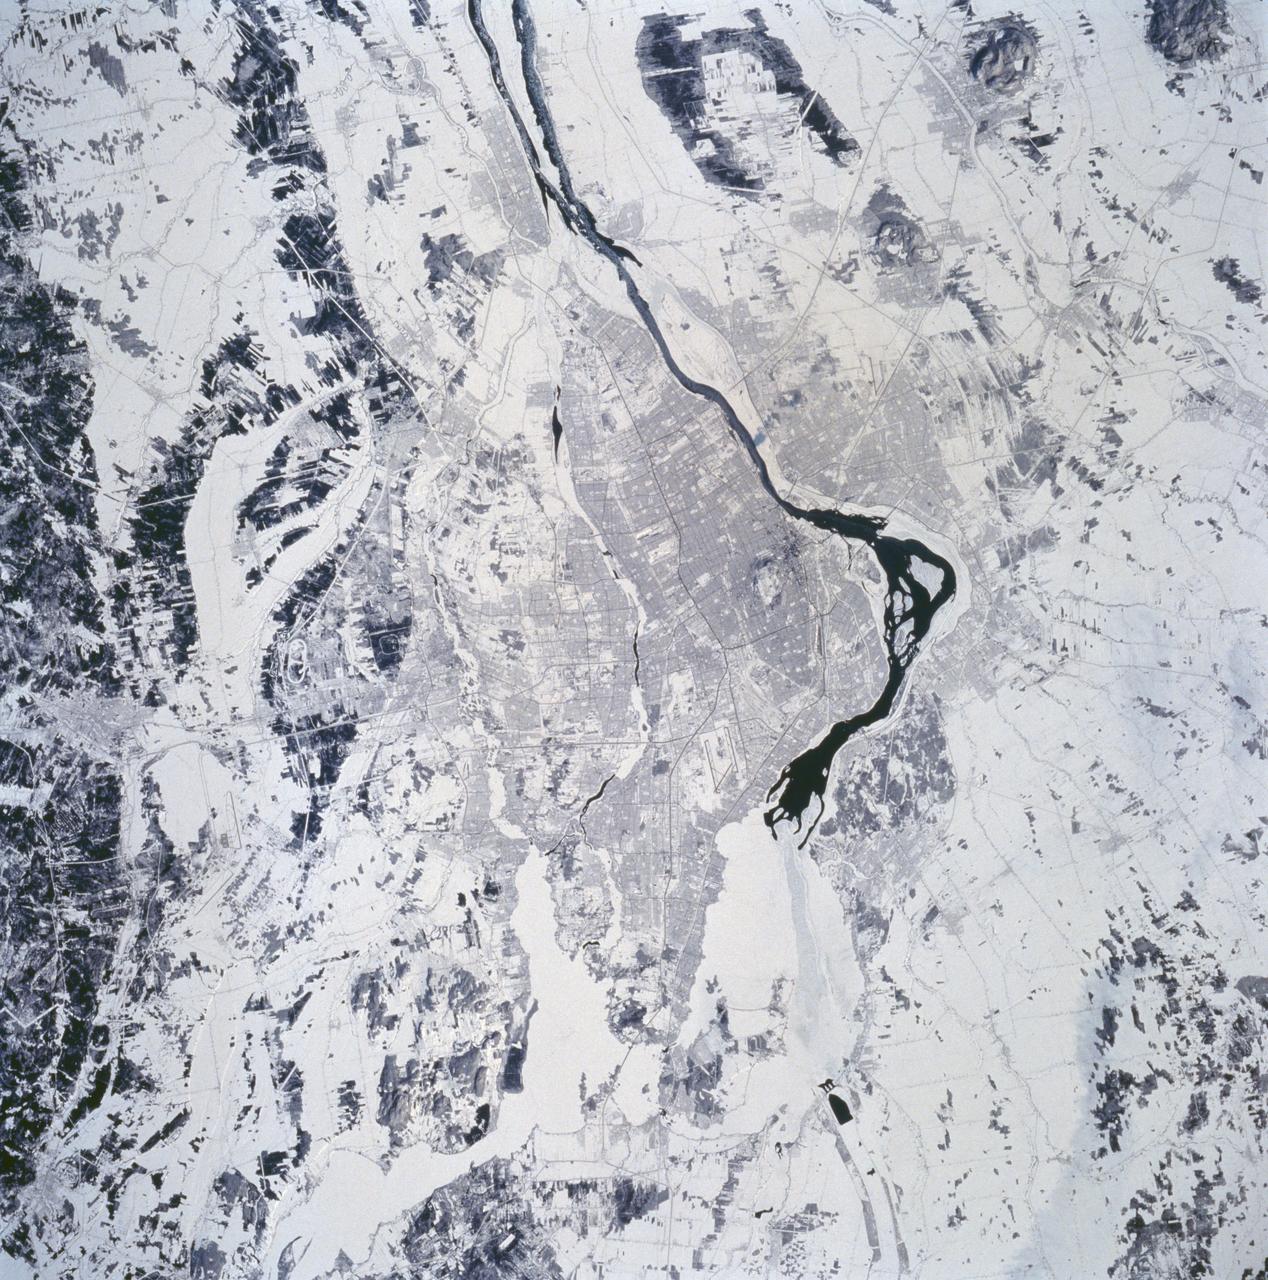
STS060-94-072 (3-11 Feb 1994) --- The city of Montreal is located on the island of Montreal at the confluence of the St. Lawrence and Ottawa Rivers. Despite its distance from the sea (1,000 miles) Montreal is a large inland port. It is also Canada's largest city and the second largest French speaking city in the world. This particular snow covered scene highlights the major highways and street patterns throughout the metropolitan Montreal area. The runways of the two large international airports of Mirabel (located 25 miles northwest of downtown Montreal) and Dorval (located approximately 8 miles west of the downtown area) are clearly visible on this photograph. Even the outline of Mount Royal Park, an imposing hilly feature near the downtown central business district, can be seen. Patches of open, ice-free (very dark areas) are detectable as the St. Lawrence River (Seaway) makes its way along the south and southeastern side of Montreal.

The late winter sun shone brightly on a stunning scene of clouds and ice in the Davis Strait in late February, 2013. The Moderate Resolution Imaging Spectroradiometer aboard NASA’s Aqua satellite captured this true-color image on February 22 at 1625 UTC. The Davis Strait connects the Labrador Sea (part of the Atlantic Ocean) in the south with Baffin Bay to the north, and separates Canada, to the west, from Greenland to the east. Strong, steady winds frequently blow southward from the colder Baffin Bay to the warmer waters of the Labrador Sea. Over ice, the air is dry and no clouds form. However, as the Arctic air moves over the warmer, open water the rising moist air and the temperature differential gives rise to lines of clouds. In this image, the clouds are aligned in a beautiful, parallel pattern. Known as “cloud streets”, this pattern is formed in a low-level wind, with the clouds aligning in the direction of the wind. Credit: NASA/GSFC/Jeff Schmaltz/MODIS Land Rapid Response Team <b><a href="http://www.nasa.gov/audience/formedia/features/MP_Photo_Guidelines.html" rel="nofollow">NASA image use policy.</a></b> <b><a href="http://www.nasa.gov/centers/goddard/home/index.html" rel="nofollow">NASA Goddard Space Flight Center</a></b> enables NASA’s mission through four scientific endeavors: Earth Science, Heliophysics, Solar System Exploration, and Astrophysics. Goddard plays a leading role in NASA’s accomplishments by contributing compelling scientific knowledge to advance the Agency’s mission. <b>Follow us on <a href="http://twitter.com/NASA_GoddardPix" rel="nofollow">Twitter</a></b> <b>Like us on <a href="http://www.facebook.com/pages/Greenbelt-MD/NASA-Goddard/395013845897?ref=tsd" rel="nofollow">Facebook</a></b> <b>Find us on <a href="http://instagram.com/nasagoddard?vm=grid" rel="nofollow">Instagram</a></b>
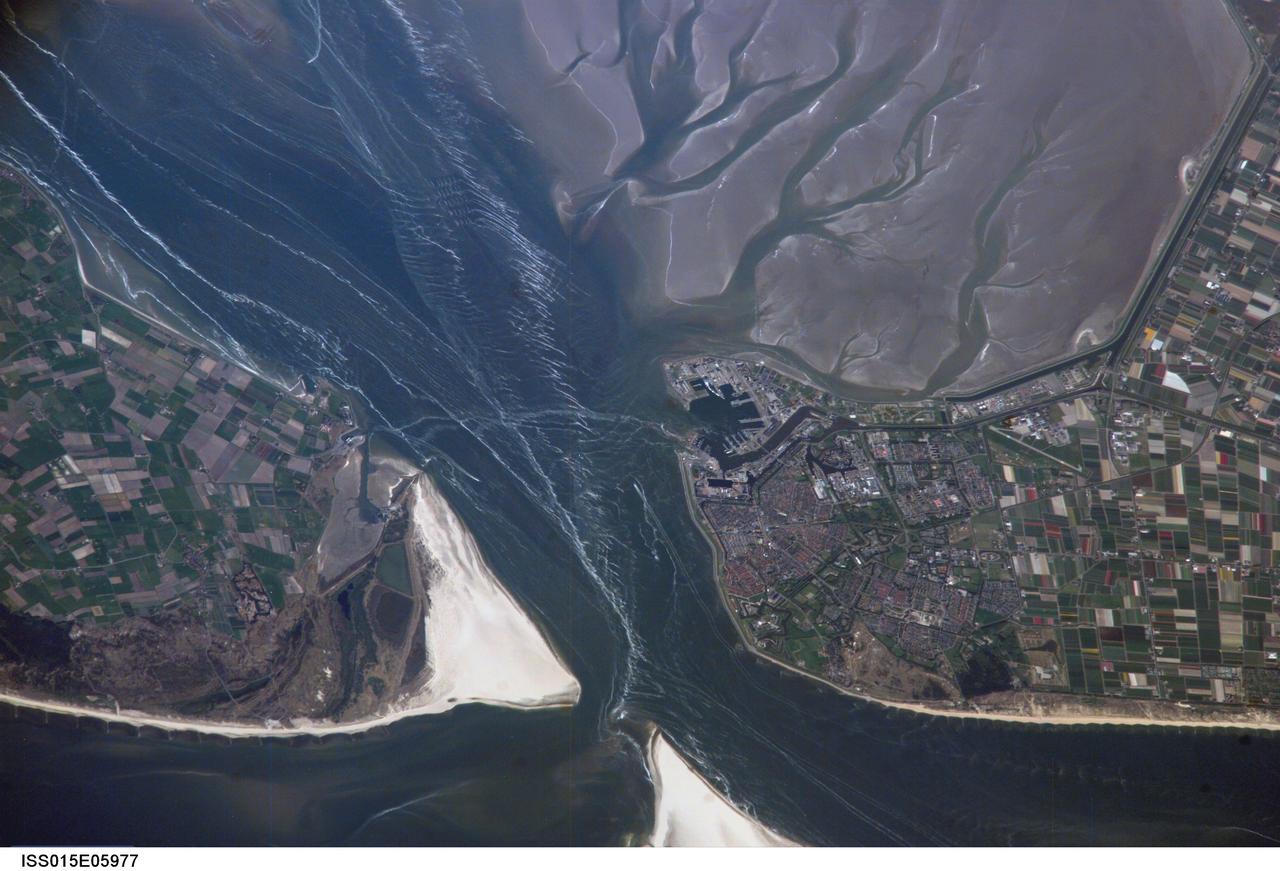
ISS015-E-05977 (1 May 2007) --- Den Helder, Netherlands is featured in this image photographed by an Expedition 15 crewmember on the International Space Station. The city and harbor of Den Helder in the northern Netherlands has been the home port of the Dutch Royal Navy for over 175 years. Its favorable location provides access to the North Sea, and has made it an important commercial shipping port in addition to its strategic role. Bright red agricultural fields to the south of Den Helder indicate another noteworthy aspect of the region--commercial farming of tulips and hyacinth. This image is an oblique view--the camera is oriented at an angle relative to "straight down"--of the Den Helder region taken from the space station, which was located to the southeast, near Dulmen, Germany (approximately 225 kilometers away in terms of ground distance) when the image was acquired. In addition to the manmade structures of the Den Helder urban area (reddish gray to gray street grids) and dockyards to the east of the city, several striking geomorphic features are visible. The extensive gray mudflats, with their prominent branching pattern (top right), indicate that this image was acquired at low tide, and suggest the general low elevation of the region. Parallel wave patterns along the mudflats and in the Marsdiep strait are formed as water interacts with the sea bottom between Den Helder and Texel Island during tidal flow. Some ship wakes are also visible. According to scientists, the bright white-gray triangular region at the southern tip of Texel Island (bottom center) is a dune field, consisting mainly of eolian (windborne) sands deposited during the last Ice Age. Subsequent sea level rise and shoreline processes have mobilized and re-deposited these sands into their current configuration -- including a new dune field island to the southwest of Texel (bottom center).
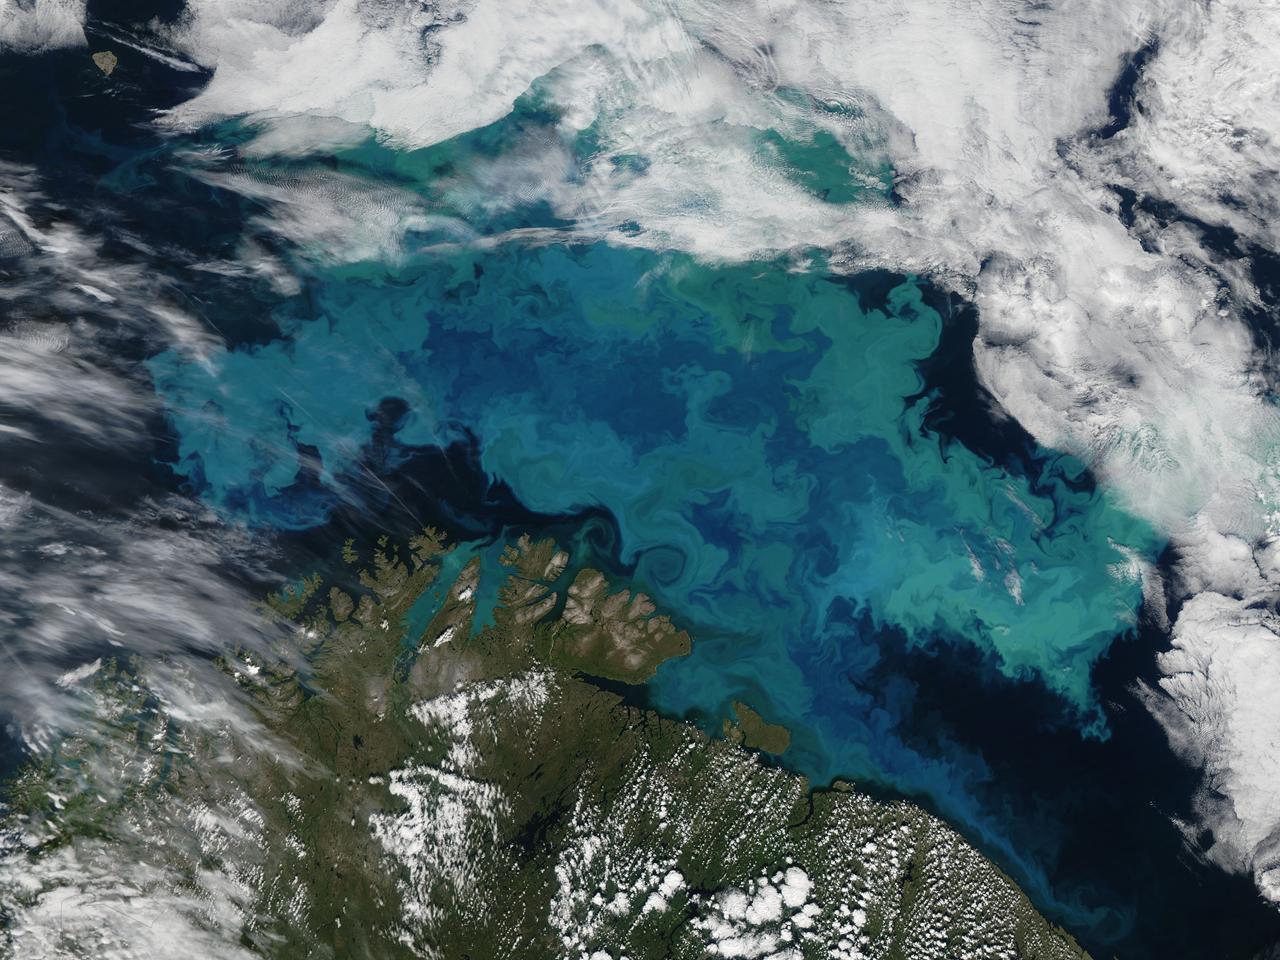
Phytoplankton bloom in the Barents Sea captured August 14, 2011. At times nature exceeds the ability of the artist’s brush to blend brilliant colors, interweave textures and combine patterns to create stunning panoramas, while using only the palette of land, water, cloud and vegetation. This stunning and artistic image of a phytoplankton bloom in the Barents Sea was by the Moderate Resolution Imaging Spectroradiometer (MODIS) aboard the Aqua satellite was captured on August 14, 2011. The peacock-hued swirls of blues and green that paint the navy-blue sea water are created by light reflecting off of millions of phytoplankton, microscopic plants that grow in the sunlit surface water of the world’s oceans. Different types of phytoplankton reflect different colored light, so a multi-color bloom such as this typically contains multiple species. The depth of the bloom also affects coloration – the deeper the organism, the less light is reflected and the duller the color. Coccolithophores, a type of phytoplankton which flourish in nutrient-poor, sub-polar waters, have unique limestone (calcite) scales. This white coating makes the plant highly reflective, and thus a bloom can appear to be a bright, almost iridescent blue. The chalky coating can also cause whitish swirls in the water, making the blues washed out with a milky hue. August is a highly active month for phytoplankton blooms in the Barents Sea, but the timing, development, abundance and species composition is variable in this area. The distribution of phytoplankton is largely controlled by the polar front, ice cover, freshwater runoff and ice melting. Each water source – the Artic, the Atlantic and the coastal water – all bring their own characteristic species into the Barents Sea, creating a multi-specie and multi-color spectacle. Because phytoplankton are the base of the marine food chain, places were blooms are large and frequent often support a thriving marine population. This is certainly the case in the Barents Sea where the fisheries, particularly the cod fisheries, are of great importance for both Norway and Russia. The coastlines of both of these countries can be seen in the bottom of the image. Russia forms the south-eastern most coast, while the remaining three-quarters of the coastline belongs to Norway. Two fjords in the west, Porsangerfjorden and Laksefjord are tinted bright blue with phytoplankton. Just to the east of these fjords, freshwater from the Tana River flows through Tanafjord, turning the waters here are a duller blue. As fresh water flows into the Barents Sea, phytoplankton bloom is affected by the flowing water, creating paisley-like patterns in the coastal eddies. Credit: NASA/GSFC/Jeff Schmaltz/MODIS Land Rapid Response Team <b><a href="http://www.nasa.gov/centers/goddard/home/index.html" rel="nofollow">NASA Goddard Space Flight Center</a></b> enables NASA’s mission through four scientific endeavors: Earth Science, Heliophysics, Solar System Exploration, and Astrophysics. Goddard plays a leading role in NASA’s accomplishments by contributing compelling scientific knowledge to advance the Agency’s mission. <b>Follow us on <a href="http://twitter.com/NASA_GoddardPix" rel="nofollow">Twitter</a></b> <b>Like us on <a href="http://www.facebook.com/pages/Greenbelt-MD/NASA-Goddard/395013845897?ref=tsd" rel="nofollow">Facebook</a></b> <b>Find us on <a href="http://web.stagram.com/n/nasagoddard/?vm=grid" rel="nofollow">Instagram</a></b>
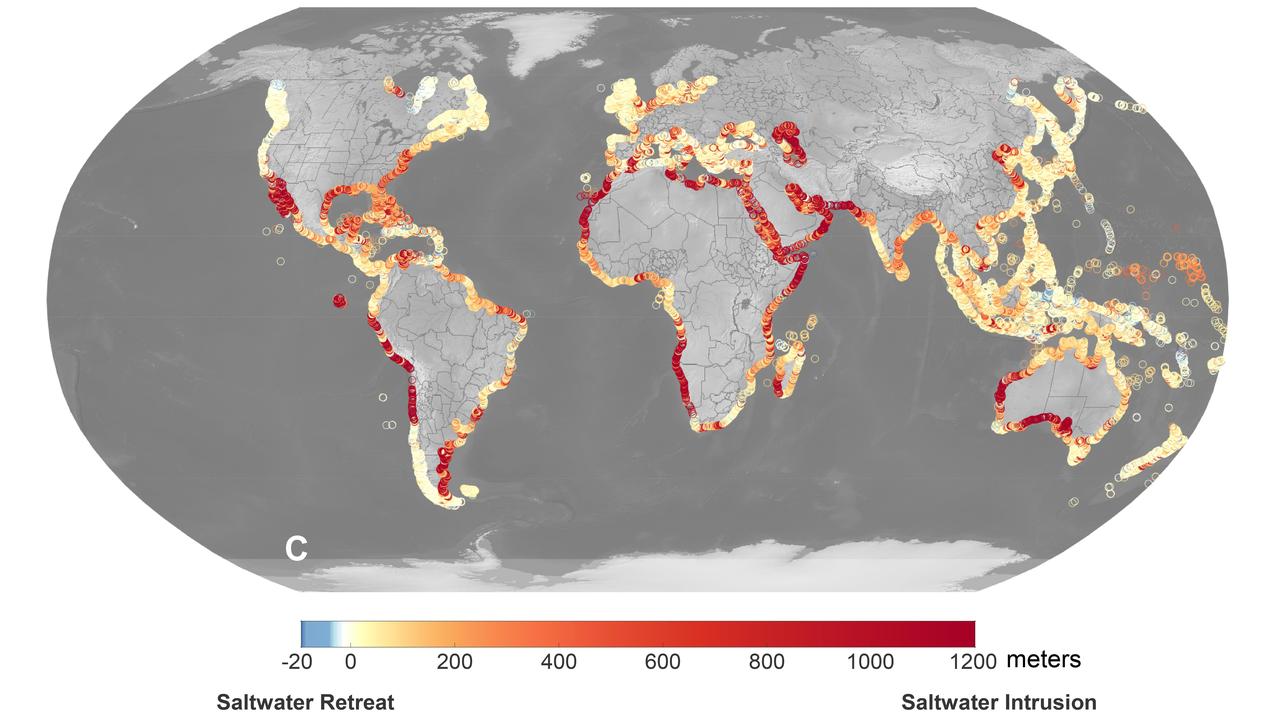
A recent study led by researchers at NASA's Jet Propulsion Laboratory in Southern California that seawater will infiltrate underground fresh water supplies in about 77% of coastal watersheds around the world by the year 2100, as illustrated in this graphic. Called saltwater intrusion, the phenomenon will result from the combined effects of sea level rise and slower replenishment of groundwater supplies due to warmer, drier regional climates, according to the study, which was funded by NASA and the U.S. Department of Defense and published in Geophysical Research Letters in November 2024. In the graphic, areas that the study projected will experience the most severe saltwater intrusion are marked with red, while the few areas that will experience the opposite phenomenon, called saltwater retreat, are marked with blue. Saltwater intrusion happens deep below coastlines, where two masses of water naturally run up against each other. Rainfall on land replenishes, or recharges, fresh water in coastal aquifers (essentially, underground rock and dirt that hold water), which tends to flow underground toward the ocean. Meanwhile, seawater, backed by the pressure of the ocean, tends to push inland. Although there's some mixing in the transition zone where the two meet, the balance of opposing forces typically keeps the water fresh on one side and salty on the other. Spurred by melting ice sheets and glaciers, sea level rise is causing coastlines to migrate inland and increasing the force pushing underground salt water landward. At the same time, slower groundwater recharge resulting from reduced rainfall and warmer weather patterns is weakening the force behind the fresh water in some areas. Saltwater intrusion can render water in coastal aquifers undrinkable and useless for irrigation. It can also harm ecosystems and damage infrastructure. https://photojournal.jpl.nasa.gov/catalog/PIA26491
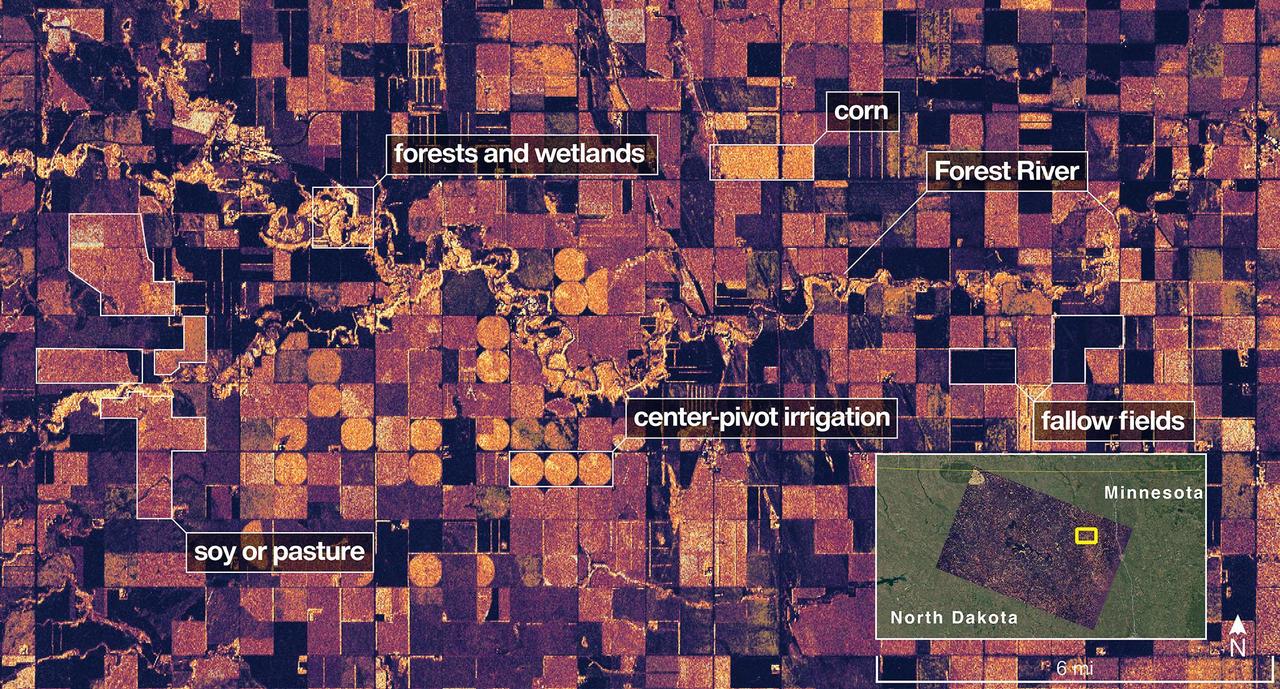
The NISAR (NASA-ISRO Synthetic Aperture Radar) Earth-observing radar satellite's L-band synthetic aperture radar (SAR) system captured an image of a portion of northeastern North Dakota straddling Grand Forks and Walsh counties on Aug. 23, 2025. Produced by scientists on the NISAR science team, the image shows forests and wetlands on the banks of the Forest River meandering through the middle of the frame from west to east and farmland to the north and south. The darker agricultural plots are fallow fields, while the lighter colors represent the presence of pasture or crops, such as soybean and corn. Circular patterns indicate the use of center-pivot irrigation. The satellite is a joint effort between NASA and the Indian Space Research Organisation (ISRO) and is the first satellite to combine L-band and S-band radar systems. The satellite's L-band system, provided by NASA's Jet Propulsion Laboratory in Southern California, uses a 10-inch (25-centimeter) wavelength that enables its signal to penetrate forest canopies and measure soil moisture as well as motion of ice surfaces and land down to fractions of an inch – a key measurement in understanding how the land surface moves before, during, and after earthquakes, volcanic eruptions, and landslides. The NISAR S-band radar, provided by ISRO's Space Applications Centre, uses a 4-inch (10-centimeter) microwave signal that's more sensitive to small vegetation, which makes it effective at monitoring certain types of agriculture and grassland ecosystems. Data used to create the image was collected during NISAR's commissioning phase, when the spacecraft's systems and instruments are powered on and tested. The NISAR mission will begin science operations in November, roughly 90 days after its July 30, 2025, launch from Satish Dhawan Space Centre on India's southeastern coast. Observations from NISAR will benefit humanity by helping researchers around the world better understand changes in our planet's surface, including its ice sheets, glaciers, and sea ice. It also will capture changes in forest and wetland ecosystems and track movement and deformation of our planet's crust by phenomena such as earthquakes, landslides, and volcanic activity. The global and rapid coverage from NISAR will provide unprecedented support for disaster response, producing data to assist in mitigating and assessing damage, with observations before and after catastrophic events available in short time frames. https://photojournal.jpl.nasa.gov/catalog/PIA26615
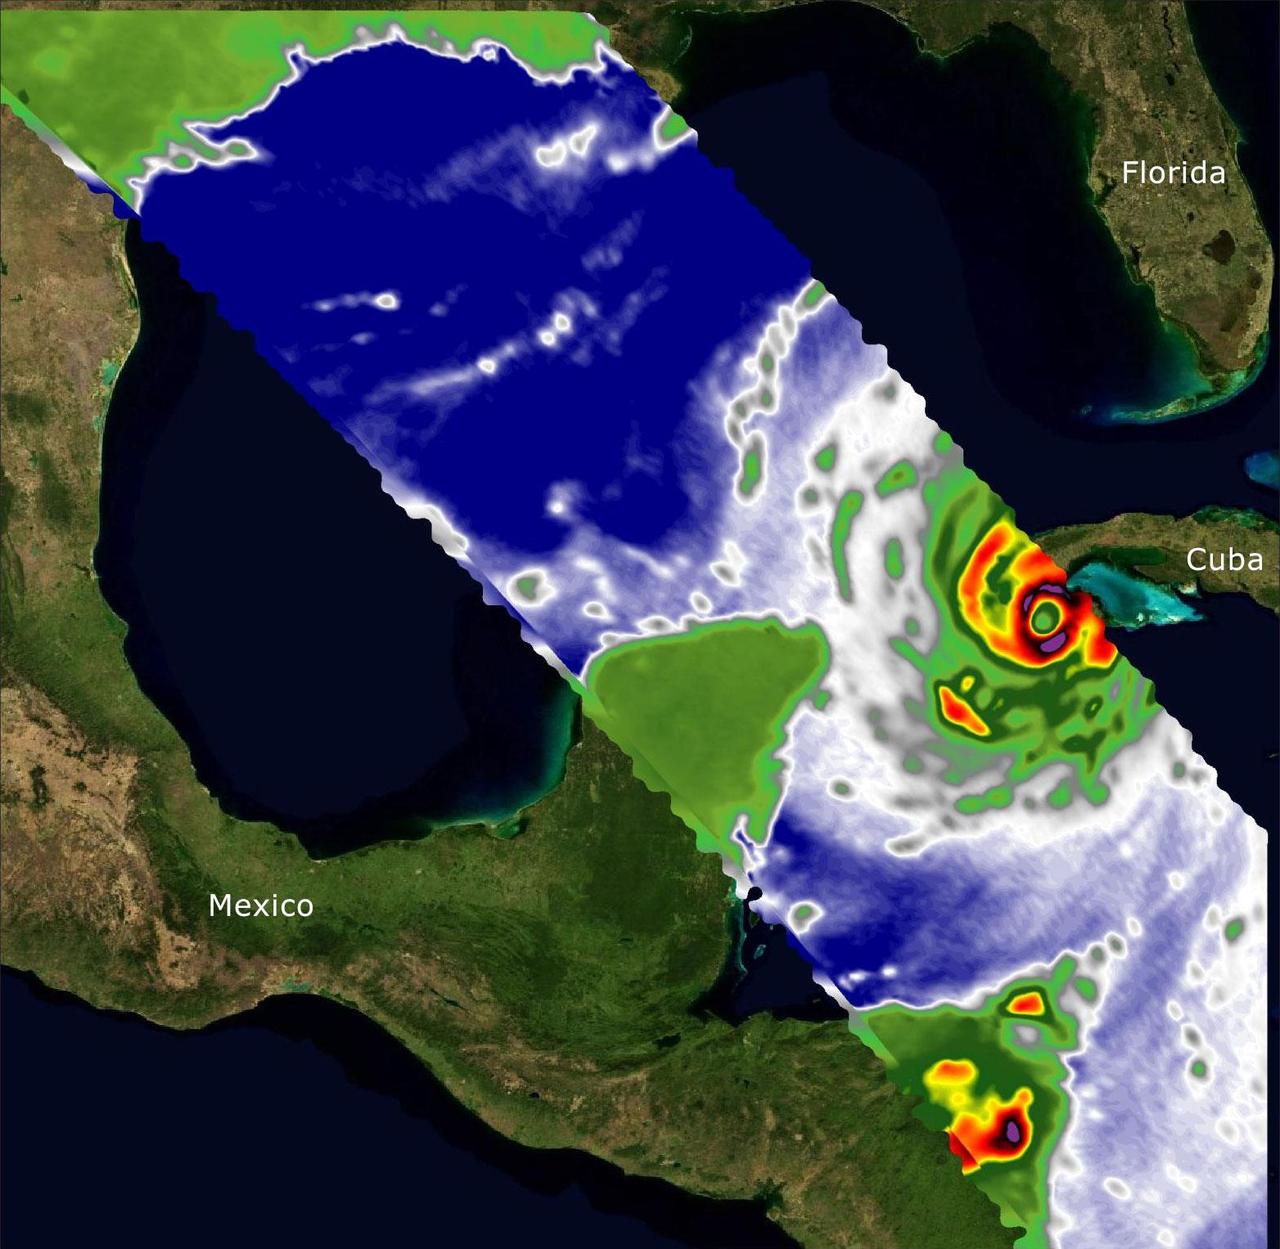
Two recently launched instruments that were designed and built at NASA's Jet Propulsion Laboratory in Southern California to provide forecasters data on weather over the open ocean captured images of Hurricane Ian on Sept. 27, 2022, as the storm approached Cuba on its way north toward the U.S. mainland. The instruments, Compact Ocean Wind Vector Radiometer (COWVR) and Temporal Experiment for Storms and Tropical Systems (TEMPEST), observe the planet's atmosphere and surface from aboard the International Space Station, which passed in low-Earth orbit over the Caribbean Sea at about 12:30 a.m. EDT. Ian made landfall in Cuba's Pinar del Rio province at 4:30 a.m. EDT, according to the National Hurricane Center. At that time, it was a Category 3 hurricane, with estimated wind speeds of 125 mph (205 kph). The image above combines microwave emissions measurements from both COWVR and TEMPEST. White sections indicate the presence of clouds. Green portions indicate rain. Yellow, red, and black indicate where air and water vapor were moving most swiftly. Ian's center is seen just off of Cuba's southern coast, and the storm is shown covering the island with rain and wind. COWVR and TEMPEST sent the data for this image back to Earth in a direct stream via NASA's tracking and data relay satellite (TDRS) constellation. The data were processed at JPL and made available to forecasters less than two hours after collection. About the size of a minifridge, COWVR measures natural microwave emissions over the ocean. The magnitude of the emissions increases with the amount of rain in the atmosphere, and the strongest rain produces the strongest microwave emissions. TEMPEST – comparable in size to a cereal box – tracks microwaves at a much shorter wavelength, allowing it to see ice particles within the hurricane's cloudy regions that are thrust into the upper atmosphere by the storm. Both microwave radiometers were conceived to demonstrate that smaller, more energy-efficient, more simply designed sensors can perform most of the same measurements as current space-based weather instruments that are heavier, consume more power, and cost much more to construct. COWVR's development was funded by the U.S. Space Force, and TEMPEST was developed with NASA funding. The U.S. Space Test Program-Houston 8 (STP-H8) is responsible for hosting the instruments on the space station under Space Force funding in partnership with NASA. Data from the instruments are being used by government and university weather forecasters and scientists. The mission will inform development of future space-based weather sensors, and scientists are working on mission concepts that would take advantage of the low-cost microwave sensor technologies to study long-standing questions, such as how heat from the ocean fuels global weather patterns. https://photojournal.jpl.nasa.gov/catalog/PIA25425