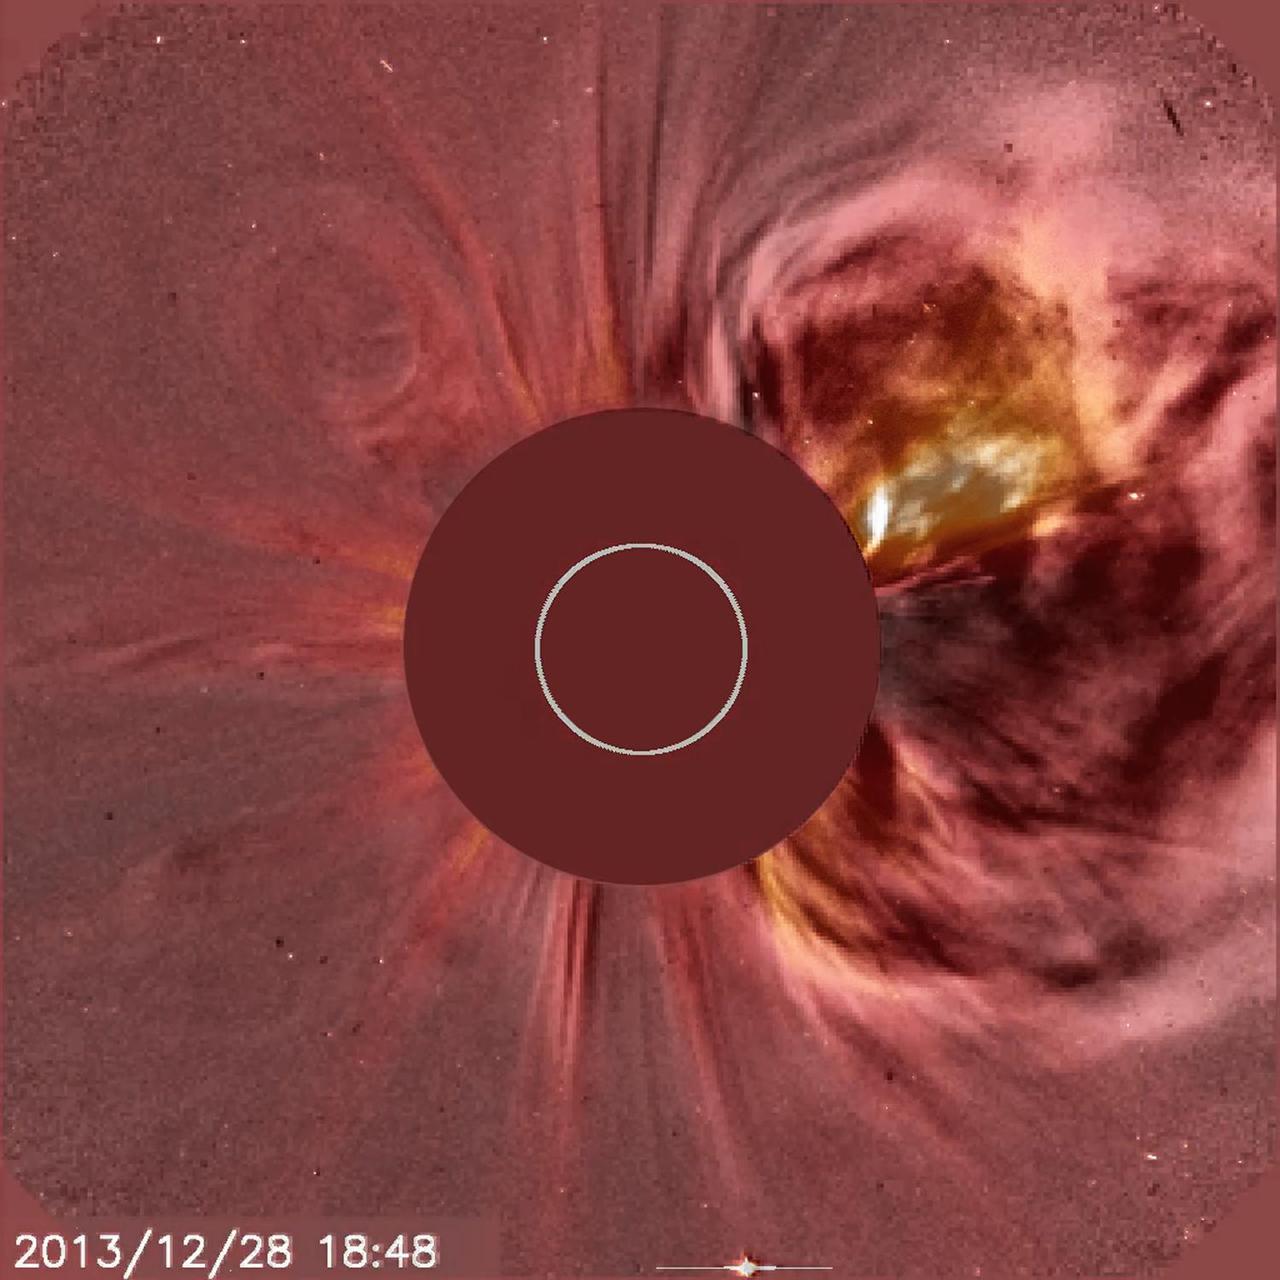
With its C2 coronagraph instrument, NASA's satellite SOHO captured a blossoming coronal mass ejection (CME) as it roared into space from the right side of the Sun (Dec. 28, 2013). SOHO also produces running difference images and movies of the Sun's corona in which the difference between one image and the next (taken about 10 minutes apart) is highlighted. This technique strongly emphasizes the changes that occurred. Here we have taken a single white light frame and shift it back and forth with a running difference image taken at the same time to illustrate the effect. Credit: NASA/GSFC/SOHO <b><a href="http://www.nasa.gov/audience/formedia/features/MP_Photo_Guidelines.html" rel="nofollow">NASA image use policy.</a></b> <b><a href="http://www.nasa.gov/centers/goddard/home/index.html" rel="nofollow">NASA Goddard Space Flight Center</a></b> enables NASA’s mission through four scientific endeavors: Earth Science, Heliophysics, Solar System Exploration, and Astrophysics. Goddard plays a leading role in NASA’s accomplishments by contributing compelling scientific knowledge to advance the Agency’s mission. <b>Follow us on <a href="http://twitter.com/NASA_GoddardPix" rel="nofollow">Twitter</a></b> <b>Like us on <a href="http://www.facebook.com/pages/Greenbelt-MD/NASA-Goddard/395013845897?ref=tsd" rel="nofollow">Facebook</a></b> <b>Find us on <a href="http://instagram.com/nasagoddard?vm=grid" rel="nofollow">Instagram</a></b>
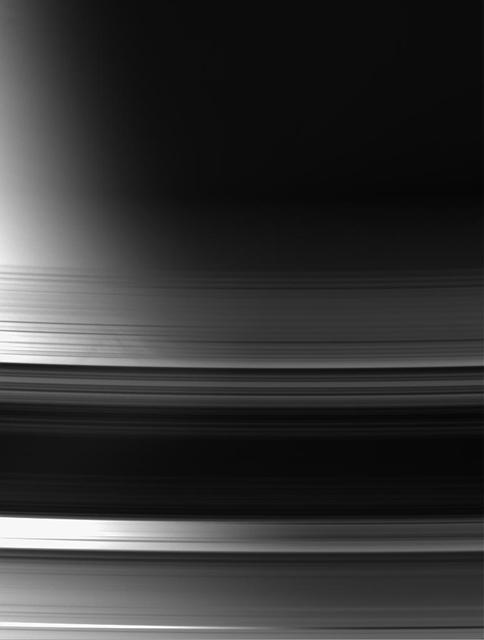
With Saturn terminator as a backdrop, this view of the unlit face of the rings makes it easy to distinguish between areas that are actual gaps, where light passes through essentially unimpeded, and areas where the rings block or scatter light
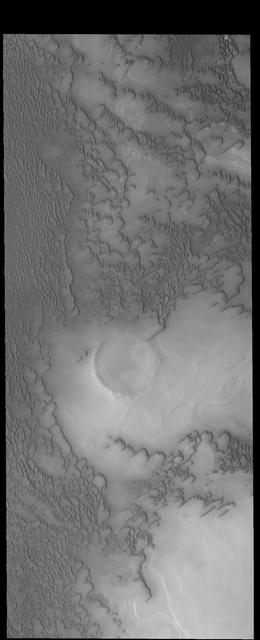
This image from NASA 2001 Mars Odyssey spacecraft shows more north polar dunes. If you compare multiple dune images, you will see that the dunes can take different forms and cover different amounts of the plains.
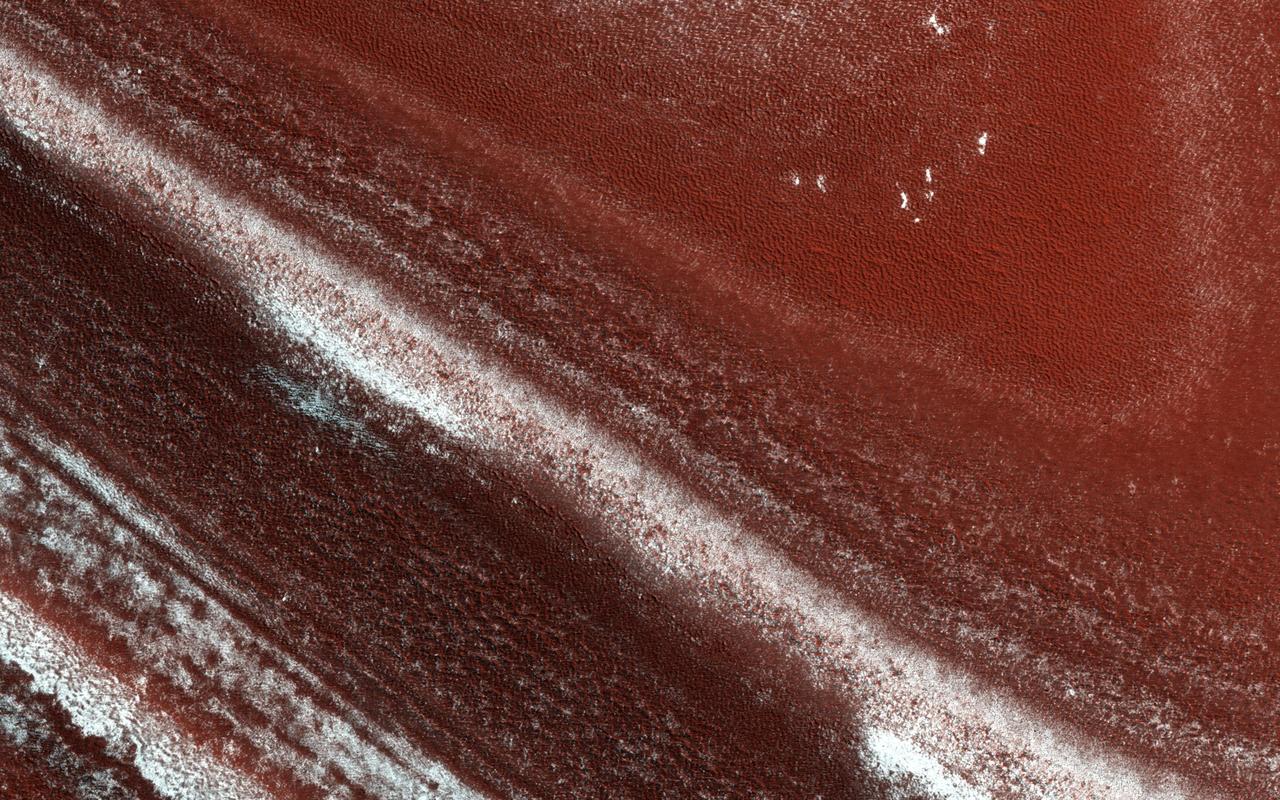
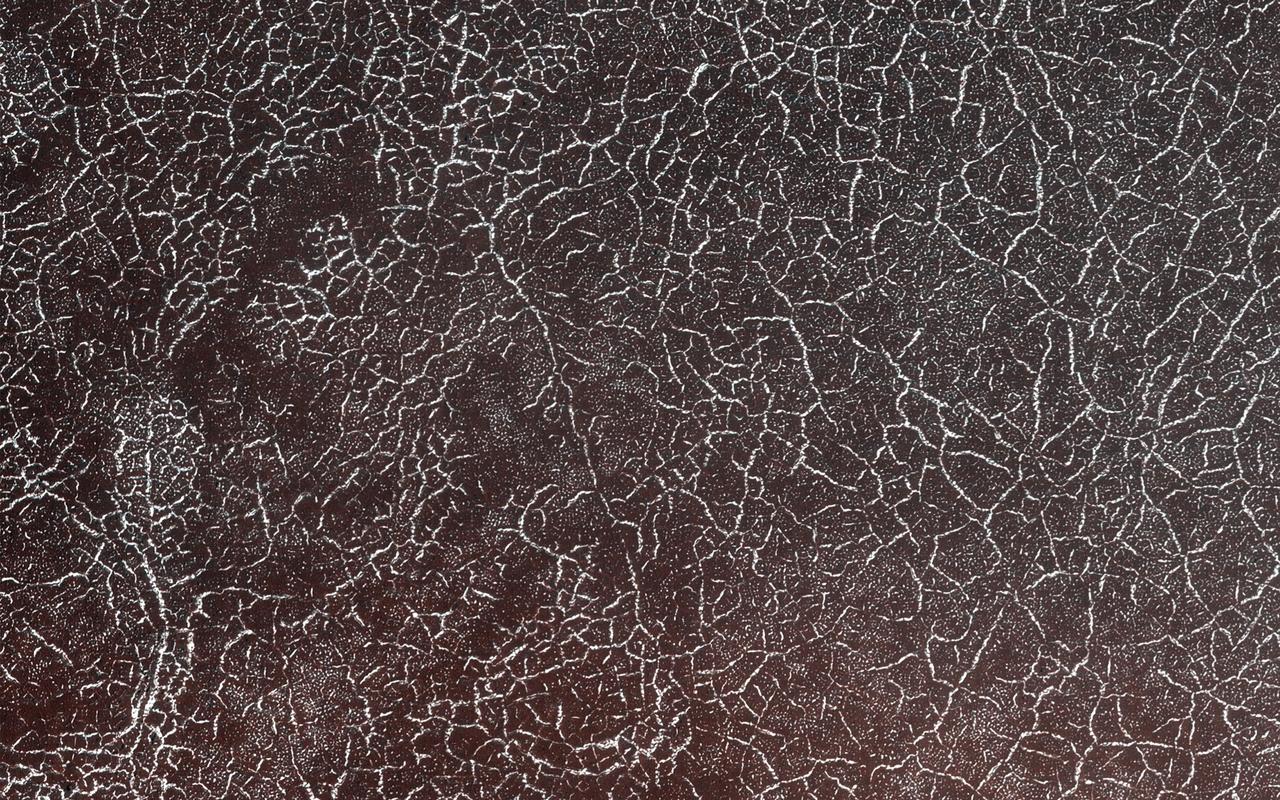
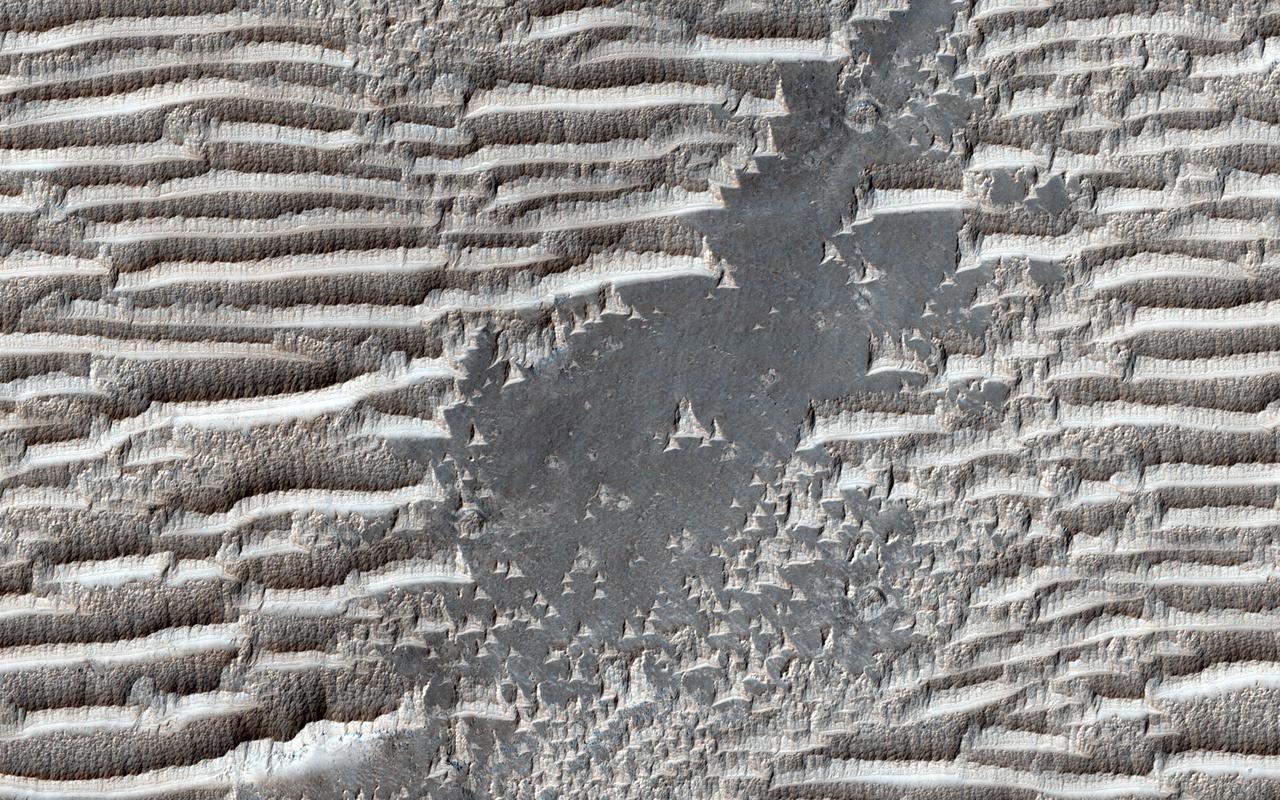
At the edge of Mars' permanent North Polar cap, we see an exposure of the internal layers, each with a different mix of water ice, dust and dirt. These layers are believed to correspond to different climate conditions over the past tens of thousands of years. When we zoom in closer, we see that the distinct layers erode differently. Some are stronger and more resistant to erosion, others only weakly cemented. The strong layers form ledges. http://photojournal.jpl.nasa.gov/catalog/PIA21022
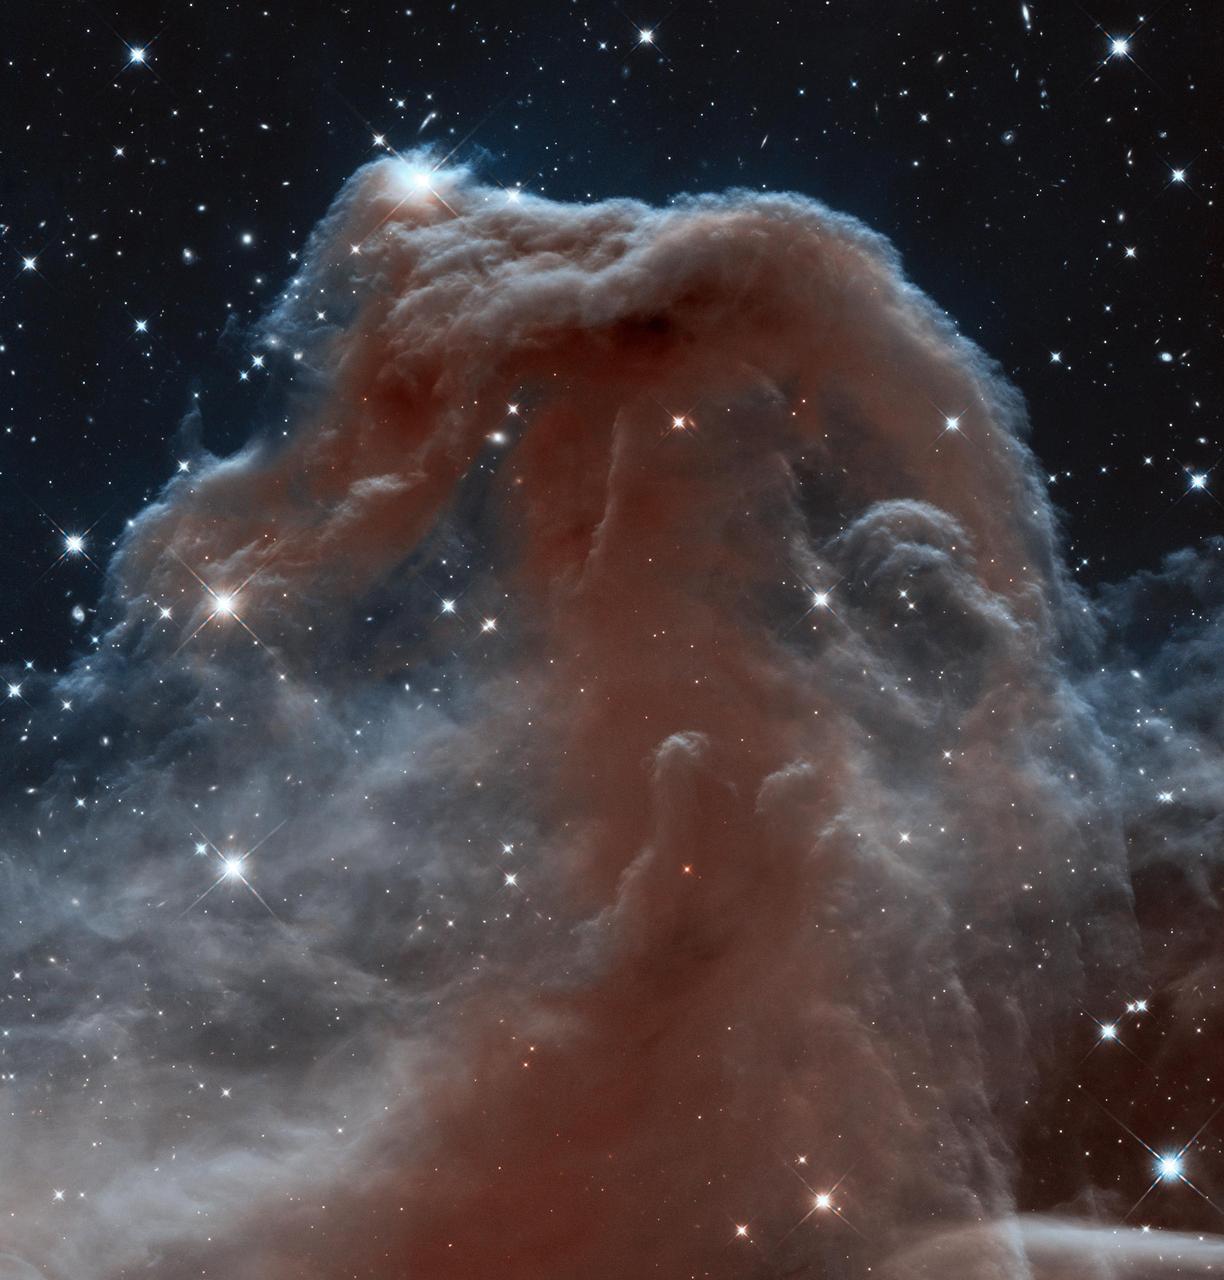
Backlit wisps along the Horsehead Nebula upper ridge are being illuminated by Sigma Orionis, a young five-star system just off the top of this image from the Hubble Space Telescope.
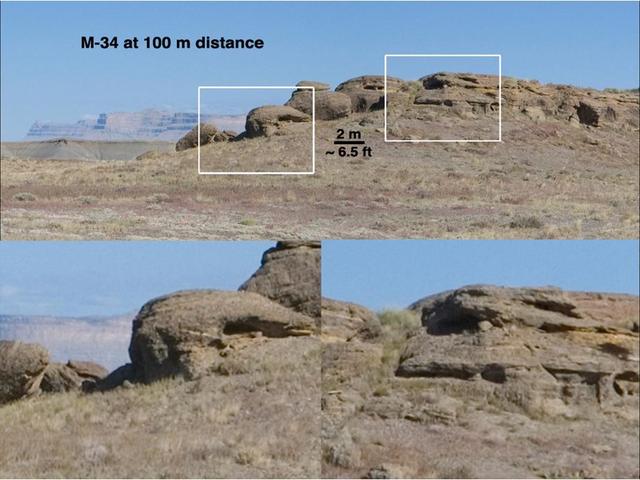
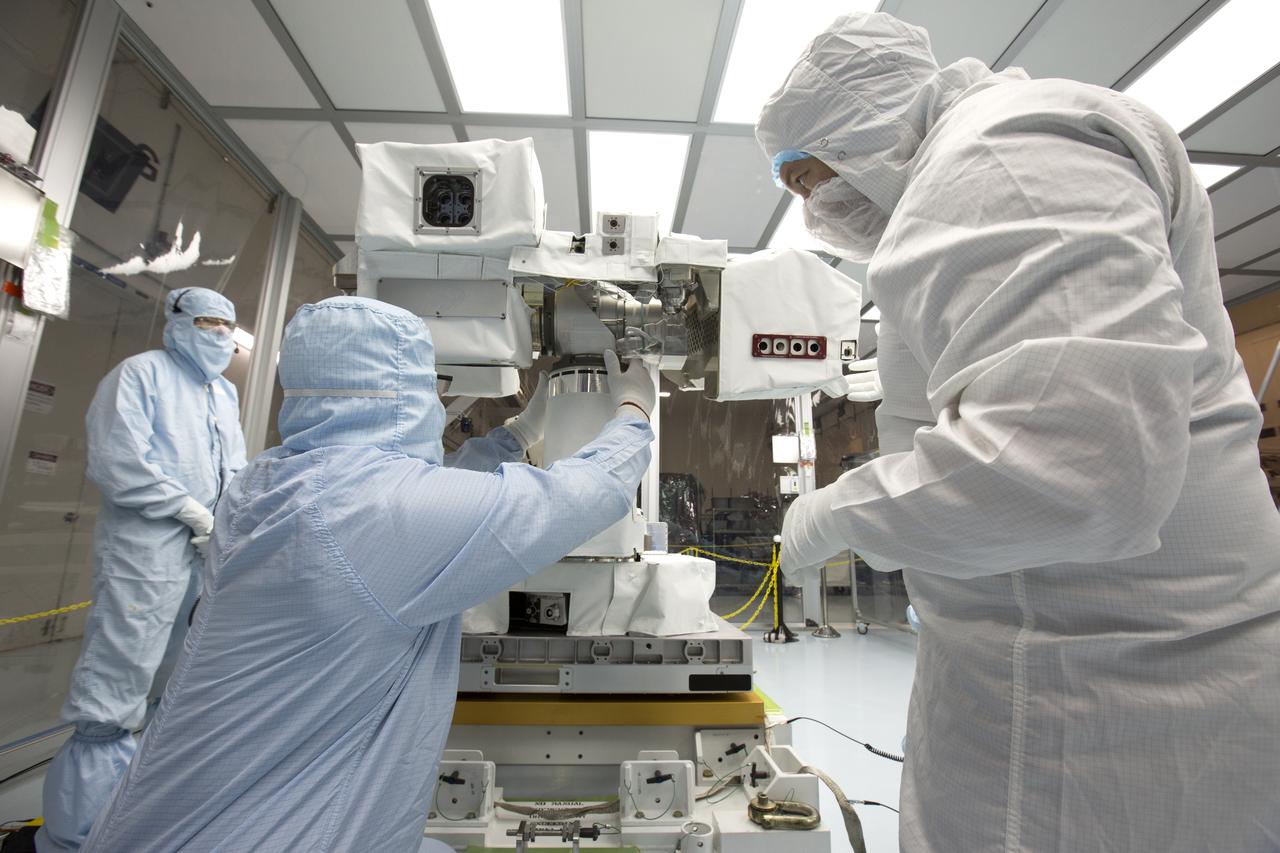
This set of views illustrates capabilities of the Mast Camera MastCam instrument on NASA Mars Science Laboratory Curiosity rover, using a scene on Earth as an example of what MastCam two cameras can see from different distances.
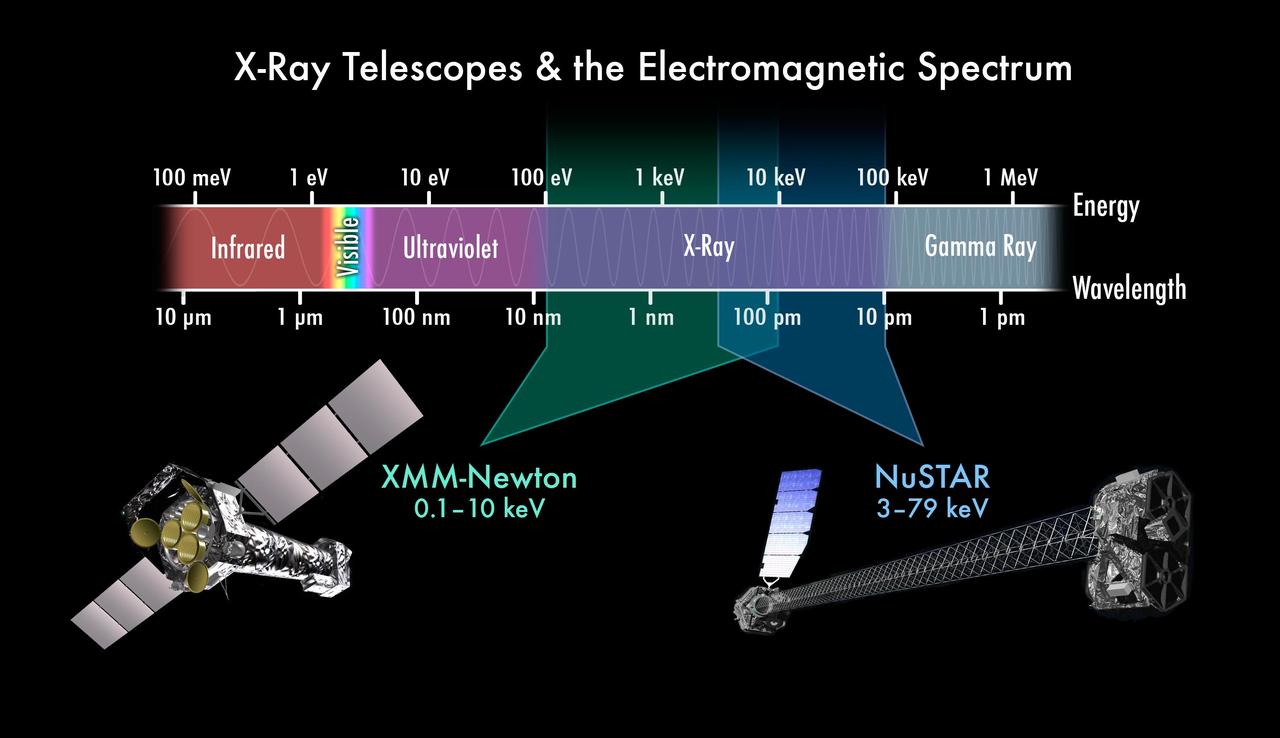
This chart depicts the electromagnetic spectrum, highlighting the X-ray portion. NASA NuSTAR and ESA XMM-Newton telescope complement each other by seeing different colors of X-ray light.
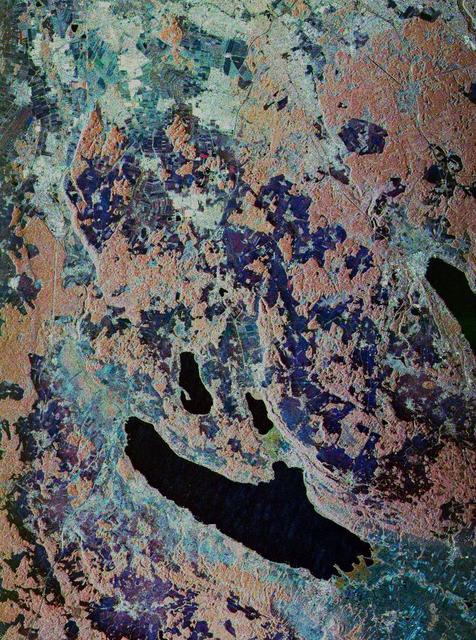
This is a false-color, three-frequency image of the Oberpfaffenhofen supersite, southwest of Munich in southern Germany, which shows the differences in what the three radar bands can see on the ground.
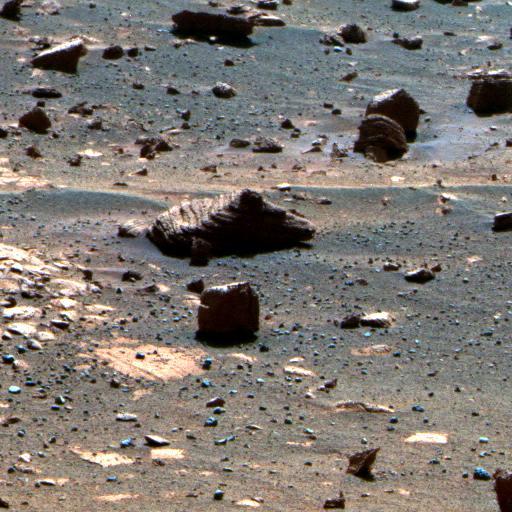
This image is the result of the first observation of a target selected autonomously by NASA Opportunity using newly developed and uploaded software called AEGIS. The false color makes some differences between materials easier to see.
This scene shows the Murray Ridge portion of the western rim of Endeavour Crater on Mars, as seen by NASA Opportunity rover. It is presented in false color to make some differences between materials easier to see.
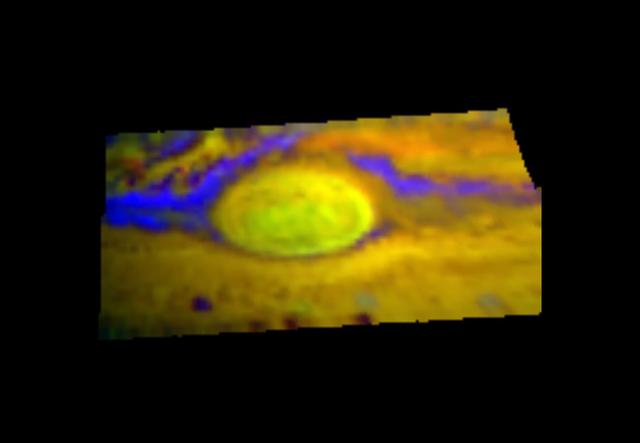
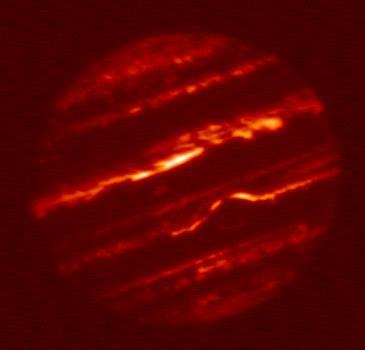
This infrared image, taken by NASA Galileo spacecraft in late June, 1996, of Jupiter Great Red Spot has different colors than what you normally see.
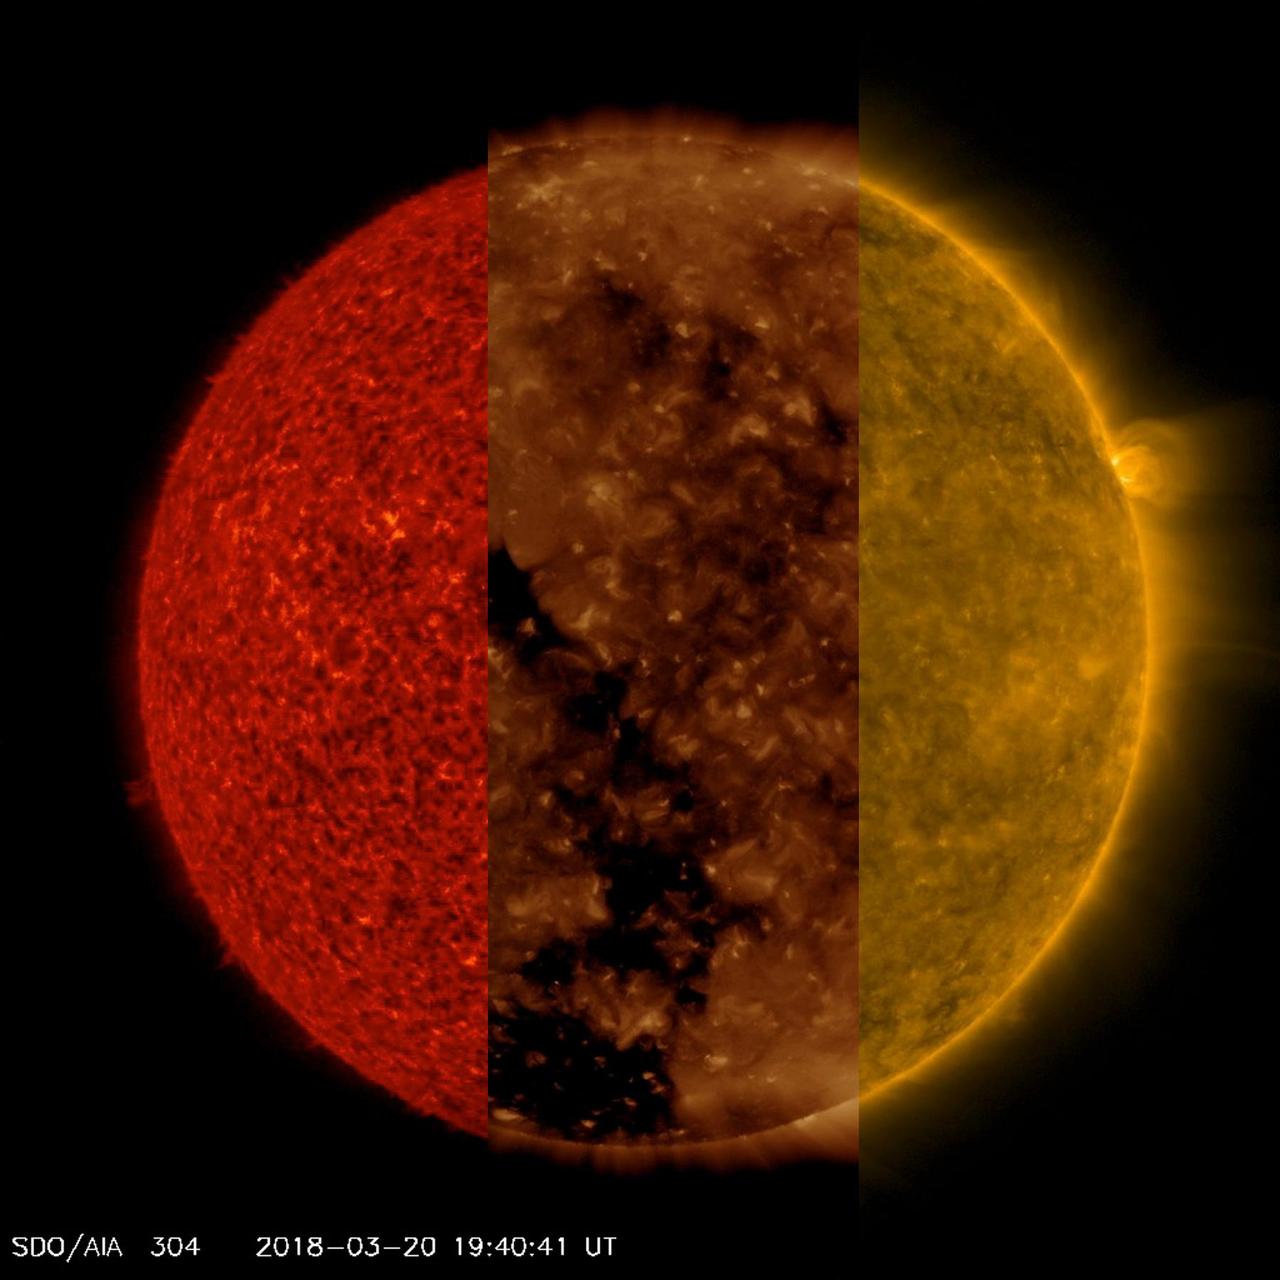
NASA's Solar Dynamics Observatory ran together three sequences of the sun taken in three different extreme ultraviolet wavelengths to better illustrate how different features that appear in one sequence are difficult if not impossible to see in the others (Mar. 20-21, 2018). In the red sequence (304 Angstroms), we can see very small spicules and some small prominences at the sun's edge, which are not easy to see in the other two sequences. In the second clip (193 Angstroms), we can readily observe the large and dark coronal hole, though it is difficult to make out in the others. In the third clip (171 wavelengths), we can see strands of plasma waving above the surface, especially above the one small, but bright, active region near the right edge. And these are just three of the 10 extreme ultraviolet wavelengths in which SDO images the sun every 12 seconds every day. That's a lot of data and a lot of science. Movies are available at https://photojournal.jpl.nasa.gov/catalog/PIA22360
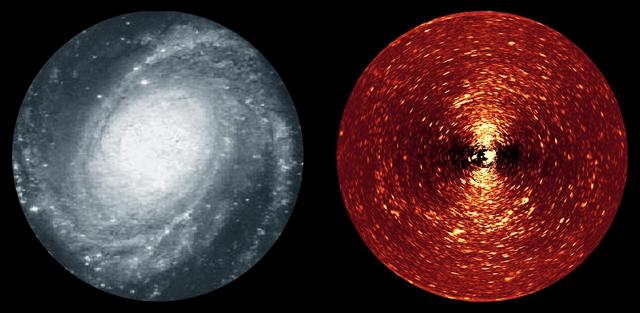
Here we see two different views of the spiral galaxy, Messier 81. On the left is an image taken in blue light, while on the right is a specially-processed version of an image taken with NASA Spitzer infrared array camera at 4.5 microns.
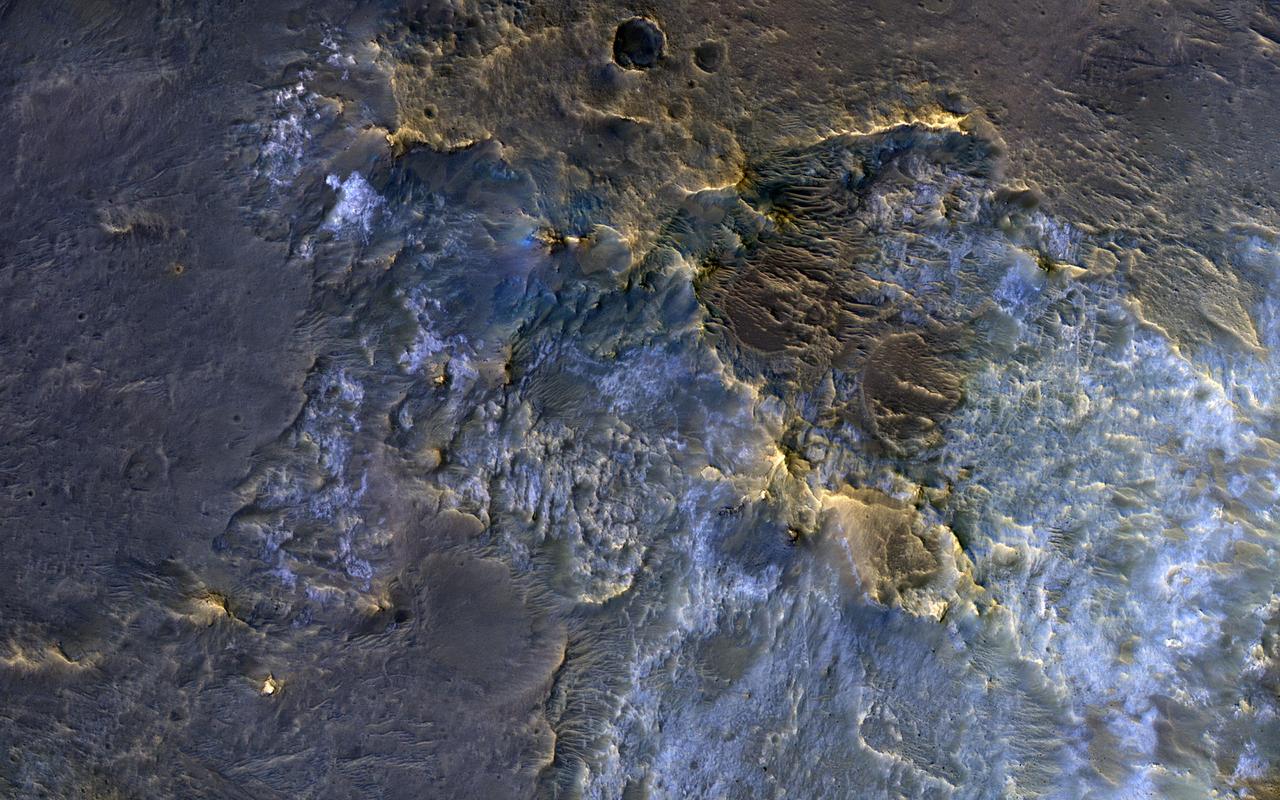
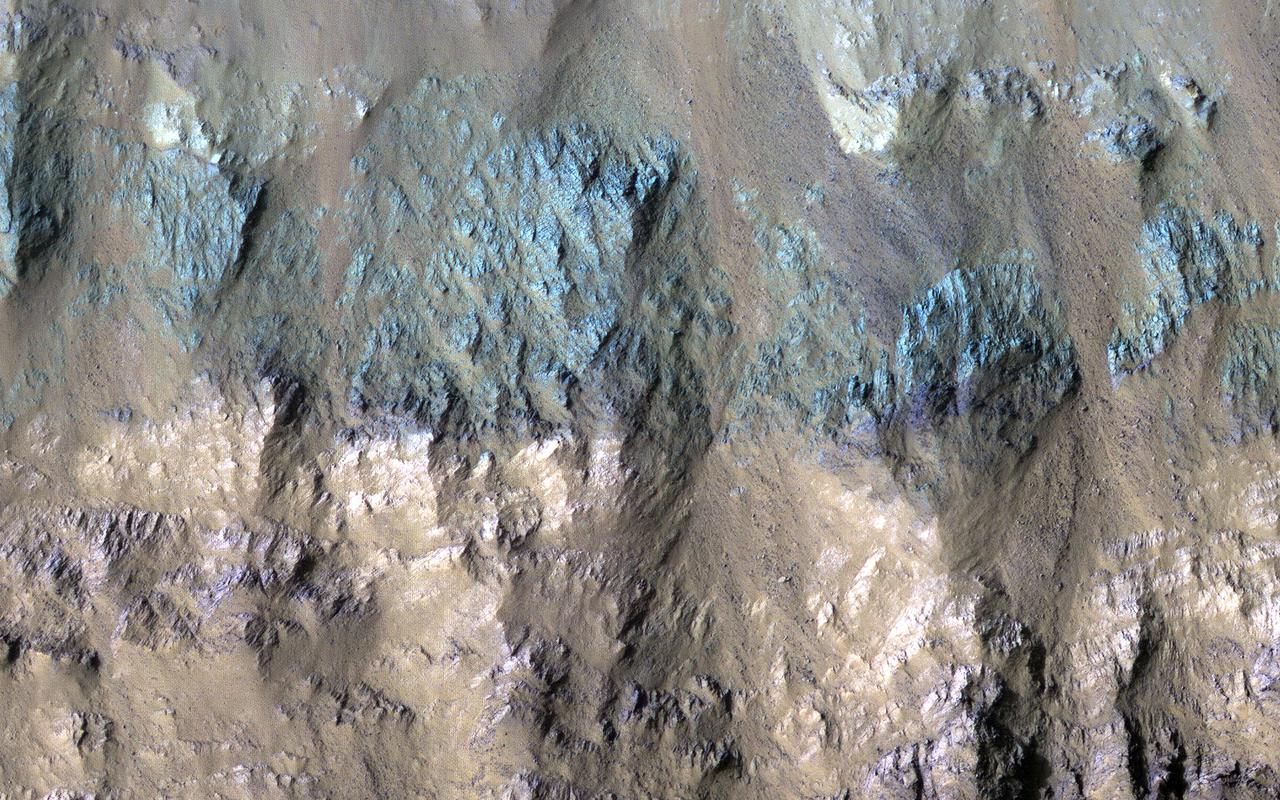
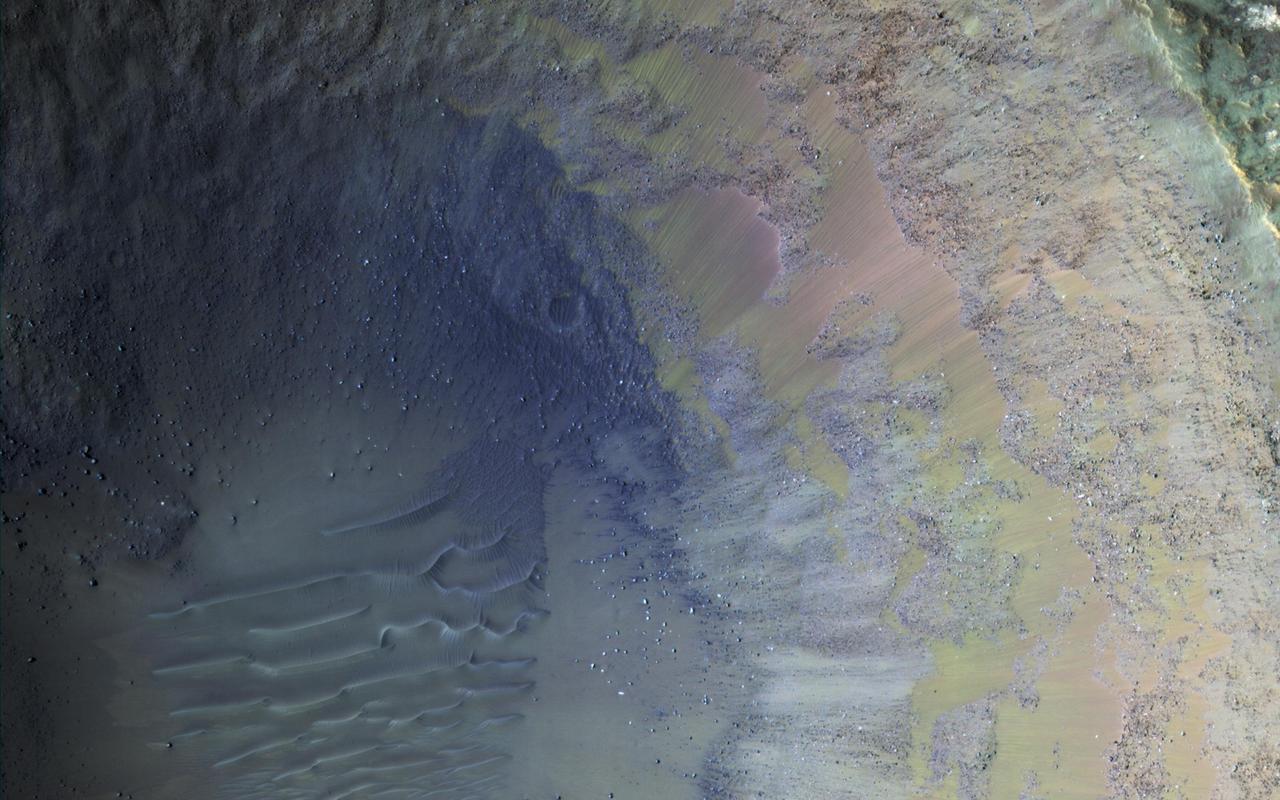
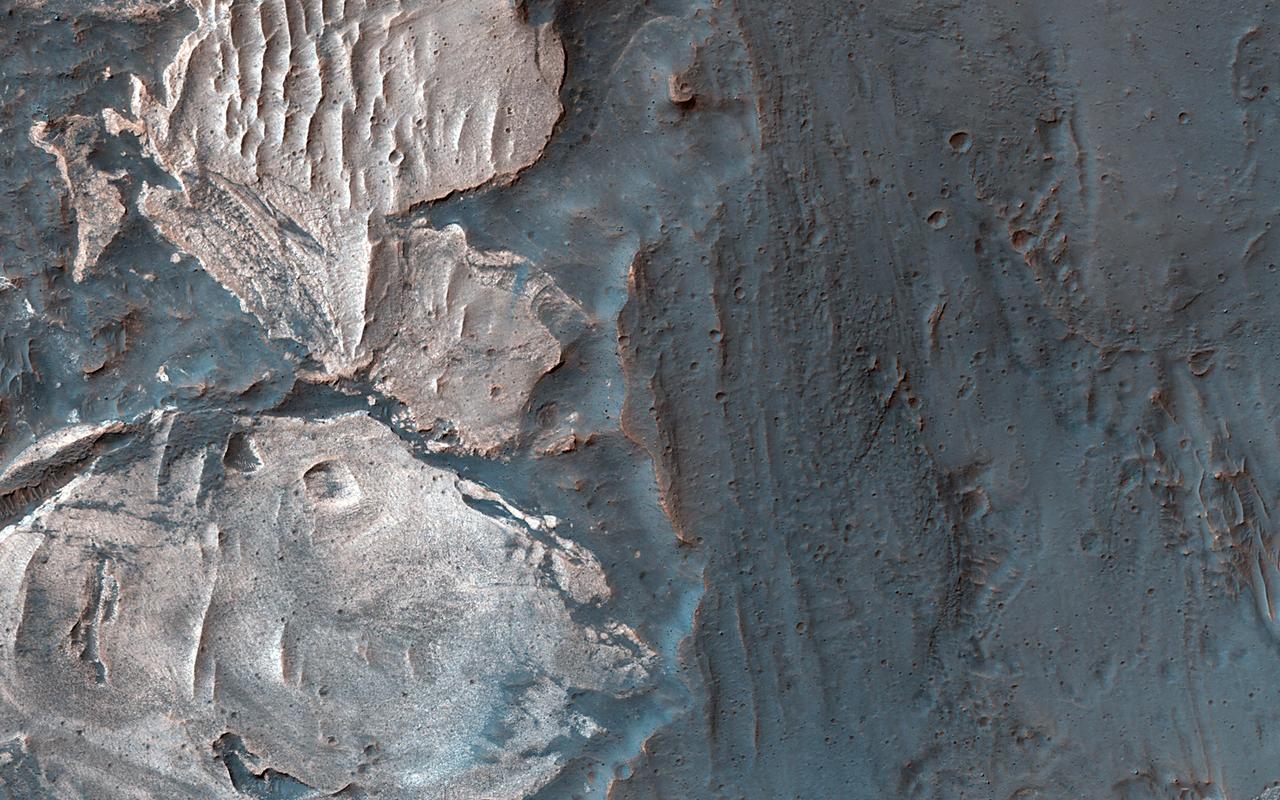
In this complex crater (about 44-kilometers in diameter), we see bedrock in several locations from different depths in the crust. The central uplift exposes large fragments of green-toned bedrock that possibly originated from several kilometers beneath the surface. To the south of the crater, we see more of this bedrock along with material that was excavated and thrown out after the impact. In craters of this size, the rim is unstable and collapses inwards forming terraces, which occasionally exposes more bedrock that would have originated from close to the surface than the rocks exposed within the uplift itself. Central uplifts have better exposures of bedrock, but in this example the terraces steal the show, displaying beautiful green- and light-toned bedrock at multiple locations. https://photojournal.jpl.nasa.gov/catalog/PIA23057
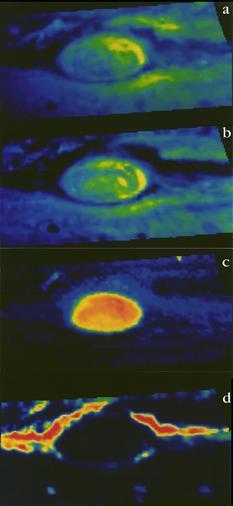
The Near-Infrared Mapping Spectrometer (NIMS) instrument looks at Jupiter's Great Red Spot, in these views from June 26, 1996. NIMS studies infrared wavelengths of light that our eye cannot see. These maps are at four different infrared wavelengths, each one picked to reveal something different about the atmosphere. The top image is a false color map of a wavelength that is at the red edge of our ability to see. It shows the shapes of features that we would see with our eyes. The second map is of ammonia ice, red showing where the most ice is, blue where none exists. The differences between this and the first image are due to the amount and size of ammonia ice crystals. The third map down is from a wavelength that shows cloud heights, with the highest clouds in red, and the lowest in blue. The bottom map uses a wavelength that shows the hot Jupiter shining through the clouds. Red represents the thinnest clouds, and blue is thickest where it is more difficult to see below. Comparing the bottom two images, note that the highest clouds are in the center of the Great Red Spot, while there are relatively few clouds around the edges. http://photojournal.jpl.nasa.gov/catalog/PIA00501
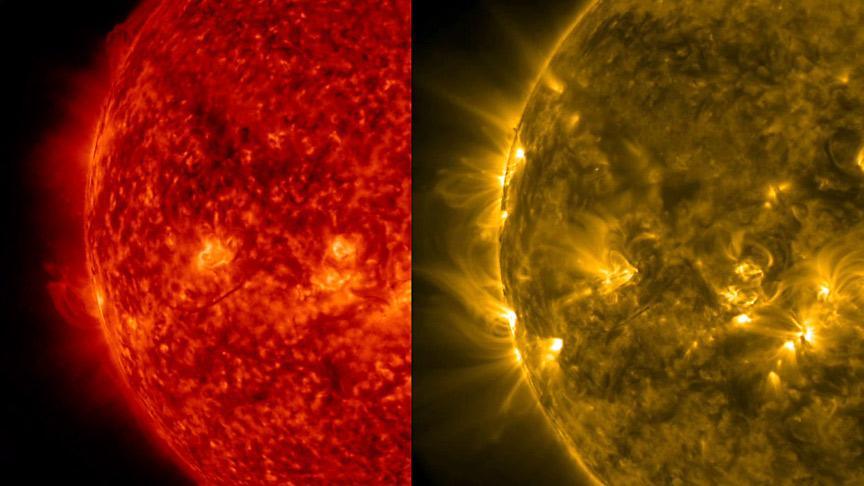
This side-by-side rendering of the Sun at the same time in two different wavelengths of extreme ultraviolet light helps to visualize the differing features visible in each wavelength (Dec. 10-11, 2015). Most prominently, we can see much finer strands of plasma looping above the surface in the 171 Angstrom wavelength (gold) than in the 304 Angstrom wavelength (red), which captures cooler plasma closer to the Sun's surface. SDO observes the Sun in 10 different wavelengths with each one capturing somewhat different features at various temperatures and elevations above the Sun. http://photojournal.jpl.nasa.gov/catalog/PIA20214
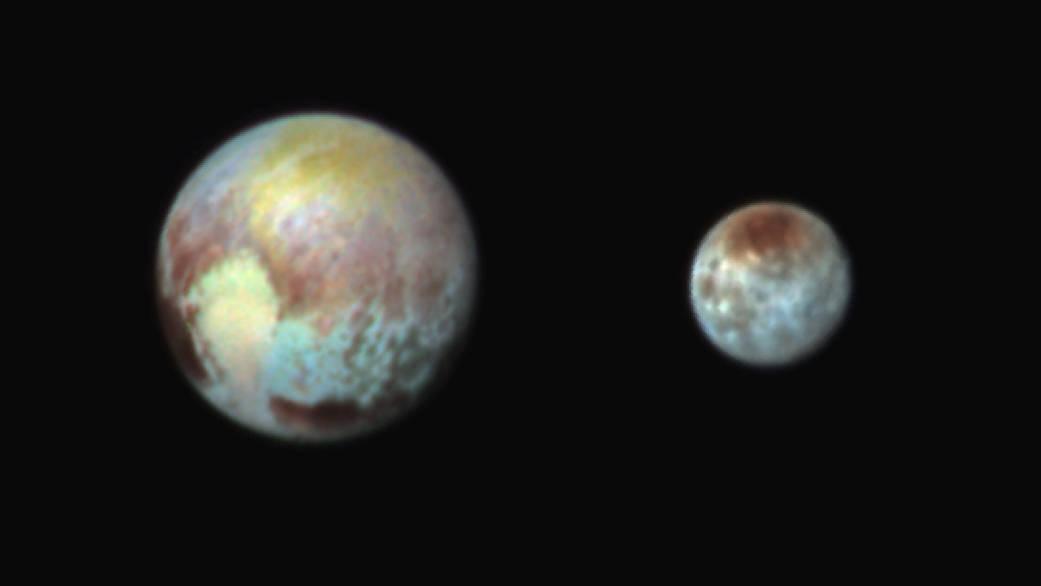
This July 13, 2015, image of Pluto and Charon is presented in false colors to make differences in surface material and features easy to see. It was obtained by the Ralph instrument on NASA's New Horizons spacecraft, using three filters to obtain color information, which is exaggerated in the image. These are not the actual colors of Pluto and Charon, and the apparent distance between the two bodies has been reduced for this side-by-side view. The image reveals that the bright heart-shaped region of Pluto includes areas that differ in color characteristics. The western lobe, shaped like an ice-cream cone, appears peach color in this image. A mottled area on the right (east) appears bluish. Even within Pluto's northern polar cap, in the upper part of the image, various shades of yellow-orange indicate subtle compositional differences. The surface of Charon is viewed using the same exaggerated color. The red on the dark northern polar cap of Charon is attributed to hydrocarbon materials including a class of chemical compounds called tholins. The mottled colors at lower latitudes point to the diversity of terrains on Charon. This image was taken at 3:38 a.m. EDT on July 13, one day before New Horizons' closest approach to Pluto. http://photojournal.jpl.nasa.gov/catalog/PIA19707

The faster a brown dwarf spins, the narrower the different-colored atmospheric bands on it likely become, as shown in this illustration. Some brown dwarfs glow in visible light, but they are typically brightest in infrared wavelengths, which are longer than what human eyes can see. https://photojournal.jpl.nasa.gov/catalog/PIA24380
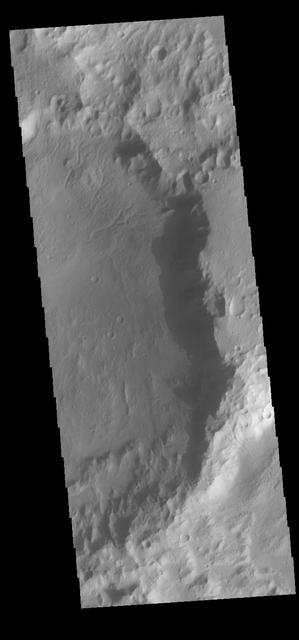
Over the course of the Odyssey mission, the spacecraft has flown covering the surface at many different times of local day. Right now Odyssey is looking down along the day/night terminator, seeing dawn and dusk. One of the benefits from imaging at these times of day (and lower sun angles) is seeing shadows. This VIS image shows the sunrise shadow of the crater rim on the crater floor. Orbit Number: 66810 Latitude: -32.1248 Longitude: 132.667 Instrument: VIS Captured: 2017-01-05 01:05 http://photojournal.jpl.nasa.gov/catalog/PIA21317

Although actively-forming gullies are common in the middle latitudes of Mars, there are also pristine-looking gullies in equatorial regions. In this scene, the gullies have very sharp channels and different colors where the gullies have eroded and deposited material. Over time, the topography becomes smoothed over and the color variations disappear, unless there is recent activity. Changes have not been visible here from before-and-after images, and maybe such differences are apparent compared to older images, but nobody has done a careful comparison. What may be needed to see subtle changes is a new image that matches the lighting conditions of an older one. Equatorial gully activity is probably much less common — perhaps there is major downslope avalanching every few centuries — so we need to be lucky to see changes. MRO has now been imaging Mars for over 16 years, and the chance of seeing rare activity increases as the time interval widens between repeat images. https://photojournal.jpl.nasa.gov/catalog/PIA25309
This image shows a crater on the floor of Eos Chasma, part of the Valles Marineris canyon system. Craters on Mars are useful for geologists because they provide cross-sections into the subsurface. The south wall of this crater shows evidence of several different types of rock, with diverse colors. In the black and white parts of the image, it appears that there are two types of rock: one relatively light and one dark. However, in the 1.1 kilometer-wide color swath we can see that the dark rocks are more complicated, as some have a greenish tint and others are purple. Note that these are not the colors your eyes would see if you were there! In enhanced color, the HiRISE near-infrared data appears as red, the red is shown as green, and the blue-green data is shown as blue, allowing us to see more information at once. https://photojournal.jpl.nasa.gov/catalog/PIA25182

"For me, representation is key. I want people from different backgrounds, different experiences, and different races and ethnicities to see themselves at this agency and across federal government, which is supposed to be representative of the American population. Especially for little girls like me — I grew up poor, the daughter of a former migrant worker. I grew up working in the fields, picking fruits and vegetables during weekends and school breaks. "I’m the first one in my family to get a four-year degree. I didn’t do it because it was what I was expected to do or because it was the obvious next step. I was able to go because I had teachers and advisors who saw potential even when I couldn’t. I was a first generation college student, and now I have nieces and nephews who have obtained or are in the process of obtaining their education." "It’s not only about opening doors, it’s about opening minds — giving people a vision of the possibilities that are out there. Because now you’re broadening that thinking. You’re helping them question their status quo and helping them to see a different version of themselves. When you meet someone who is doing something different but yet, you can relate to them because of what they look like or their background, it makes a huge difference." Portrait, Maria Santos, Tuesday, Oct.1, 2019 at NASA Headquarters in Washington. Photo Credit: (NASA/Aubrey Gemignani)

"For me, representation is key. I want people from different backgrounds, different experiences, and different races and ethnicities to see themselves at this agency and across federal government, which is supposed to be representative of the American population. Especially for little girls like me — I grew up poor, the daughter of a former migrant worker. I grew up working in the fields, picking fruits and vegetables during weekends and school breaks. "I’m the first one in my family to get a four-year degree. I didn’t do it because it was what I was expected to do or because it was the obvious next step. I was able to go because I had teachers and advisors who saw potential even when I couldn’t. I was a first generation college student, and now I have nieces and nephews who have obtained or are in the process of obtaining their education." "It’s not only about opening doors, it’s about opening minds — giving people a vision of the possibilities that are out there. Because now you’re broadening that thinking. You’re helping them question their status quo and helping them to see a different version of themselves. When you meet someone who is doing something different but yet, you can relate to them because of what they look like or their background, it makes a huge difference." Portrait, Maria Santos, Tuesday, Oct.1, 2019 at NASA Headquarters in Washington. Photo Credit: (NASA/Aubrey Gemignani)

"For me, representation is key. I want people from different backgrounds, different experiences, and different races and ethnicities to see themselves at this agency and across federal government, which is supposed to be representative of the American population. Especially for little girls like me — I grew up poor, the daughter of a former migrant worker. I grew up working in the fields, picking fruits and vegetables during weekends and school breaks. "I’m the first one in my family to get a four-year degree. I didn’t do it because it was what I was expected to do or because it was the obvious next step. I was able to go because I had teachers and advisors who saw potential even when I couldn’t. I was a first generation college student, and now I have nieces and nephews who have obtained or are in the process of obtaining their education." "It’s not only about opening doors, it’s about opening minds — giving people a vision of the possibilities that are out there. Because now you’re broadening that thinking. You’re helping them question their status quo and helping them to see a different version of themselves. When you meet someone who is doing something different but yet, you can relate to them because of what they look like or their background, it makes a huge difference." Portrait, Maria Santos, Tuesday, Oct.1, 2019 at NASA Headquarters in Washington. Photo Credit: (NASA/Aubrey Gemignani)

"For me, representation is key. I want people from different backgrounds, different experiences, and different races and ethnicities to see themselves at this agency and across federal government, which is supposed to be representative of the American population. Especially for little girls like me — I grew up poor, the daughter of a former migrant worker. I grew up working in the fields, picking fruits and vegetables during weekends and school breaks. "I’m the first one in my family to get a four-year degree. I didn’t do it because it was what I was expected to do or because it was the obvious next step. I was able to go because I had teachers and advisors who saw potential even when I couldn’t. I was a first generation college student, and now I have nieces and nephews who have obtained or are in the process of obtaining their education." "It’s not only about opening doors, it’s about opening minds — giving people a vision of the possibilities that are out there. Because now you’re broadening that thinking. You’re helping them question their status quo and helping them to see a different version of themselves. When you meet someone who is doing something different but yet, you can relate to them because of what they look like or their background, it makes a huge difference." Portrait, Maria Santos, Tuesday, Oct.1, 2019 at NASA Headquarters in Washington. Photo Credit: (NASA/Aubrey Gemignani)
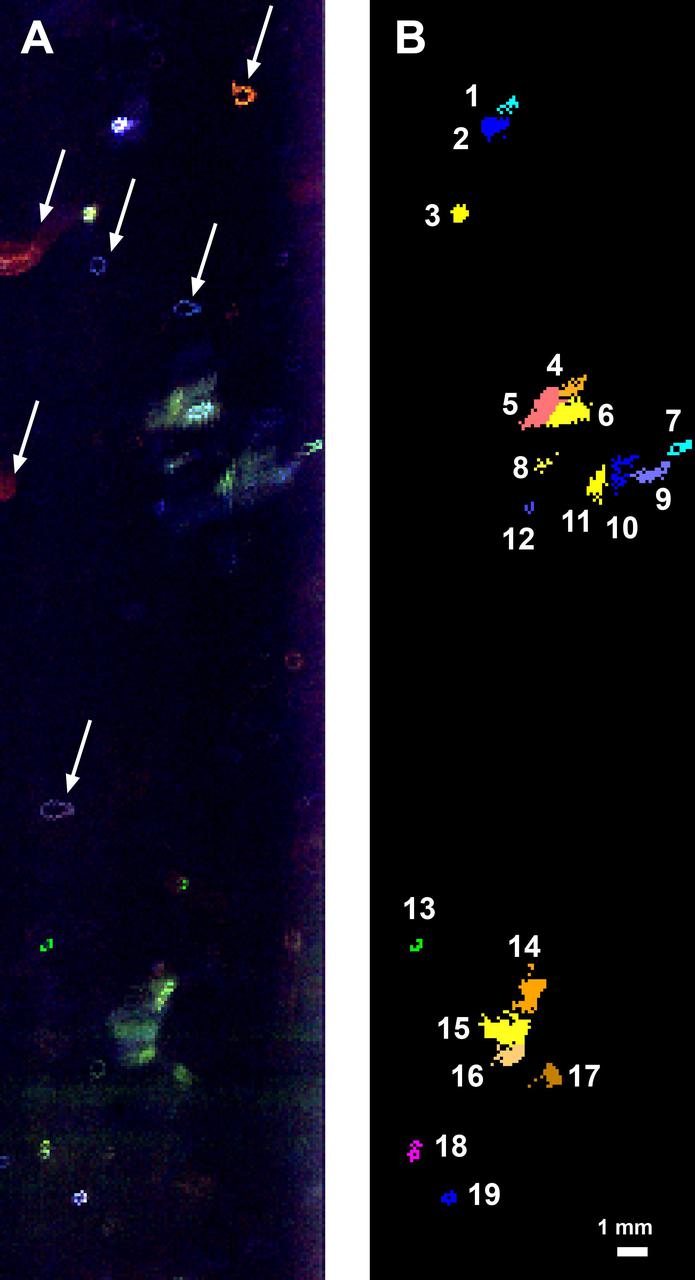
This fluorescence map of the inside wall of an ice borehole near Greenland's Summit Station was produced at a depth of 307.7 feet (93.8 meters) into the ice sheet by the WATSON (Wireline Analysis Tool for the Subsurface Observation of Northern ice sheets) instrument. Recorded during a 2019 field test of the WATSON instrument, the left panel shows the variety of biosignatures that were detected in the ice — different colors represent different organic molecules, some of which are likely microbes. The arrows highlight artifacts on the instrument's optical window, not biosignatures in the ice. In the right panel, the biosignature detections have been colorized to indicate the different features detected. Blotches that are the same color are likely made of the same chemicals. The numbers list the different and distinct features that WATSON detected at that depth in the ice. WATSON could one day be launched aboard a robotic mission to seek out biosignatures on the ocean moons of Enceladus, Europa, or even Titan. The WATSON team hopes to test the instrument in a variety of cold locations on Earth to see how the distribution and variety of biosignatures change depending on where they are. By testing WATSON in different "Earth analogs," scientists would be able to better understand the chemical fingerprints of any biosignatures detected on other worlds. https://photojournal.jpl.nasa.gov/catalog/PIA24140
Some regions of Mars are not very colorful, but we can be surprised by local features. This image of an impact crater in the south Syrtis Major region was acquired as a "ride-along" with a CRISM observation, which targeted this location because that instrument's team expected a distinct composition. Our enhanced image reveals colors ranging from red to green to blue. These are infra-red shifted colors (infrared-red-blue) so it's different than what we would see with our eyes. https://photojournal.jpl.nasa.gov/catalog/PIA22727

In this photo of the M2-F1 lifting body and the Paresev 1B on the ramp, the viewer sees two vehicles representing different approaches to building a research craft to simulate a spacecraft able to land on the ground instead of splashing down in the ocean as the Mercury capsules did. The M2-F1 was a lifting body, a shape able to re-enter from orbit and land. The Paresev (Paraglider Research Vehicle) used a Rogallo wing that could be (but never was) used to replace a conventional parachute for landing a capsule-type spacecraft, allowing it to make a controlled landing on the ground.
Southern spring on Mars brings sublimation of the seasonal dry ice polar cap. Gas trapped under the seasonal ice sheet carves channels on its way to escaping to the atmosphere. At this site, the channels are wider than we see elsewhere on Mars, perhaps meaning that the spider-like (or more scientifically, "araneiform") terrain here is older, or that the surface is more easily eroded. Seasonal fans of eroded surface material, pointed in two different directions, are deposited on the remaining ice. http://photojournal.jpl.nasa.gov/catalog/PIA13151

Scaled Composites' Proteus aircraft and an F/A-18 Hornet from NASA's Dryden Flight Research Center at Mojave Airport in Southern California. The unique tandem-wing Proteus was the testbed for a series of UAV collision-avoidance flight demonstrations. An Amphitech 35GHz radar unit installed below Proteus' nose was the primary sensor for the Detect, See and Avoid tests. NASA Dryden's F/A-18 Hornet was one of many different aircraft used in the tests.
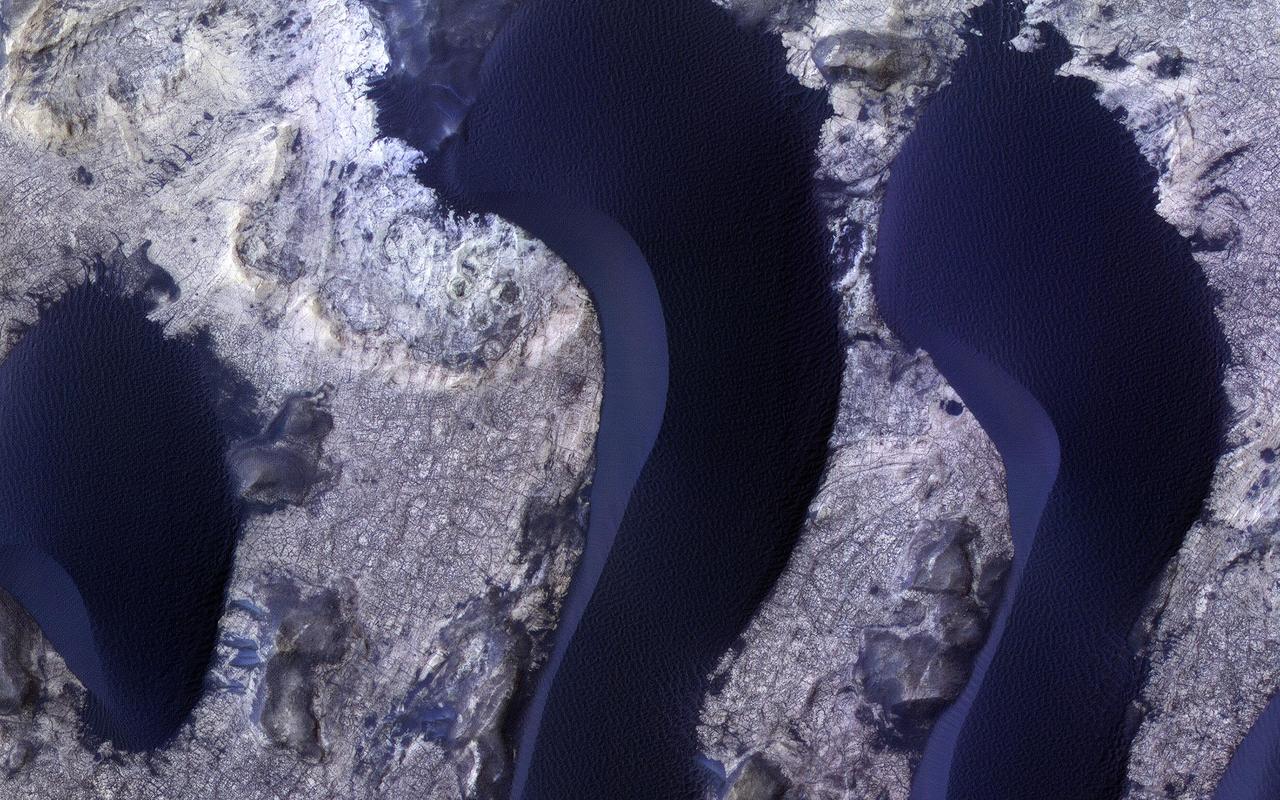
HiRISE monitors dune fields across Mars to track how they are changing. The mobile sand also cleans dust off of the bedrock in inter-dune areas, providing good views of the bedrock structures and colors. Here we see subtle color differences between layers, and a dense network of fractures. The dunes, in contrast, are uniformly dark and relatively blue in enhanced color (really grey but less red than the bedrock, so they appear blue here). https://photojournal.jpl.nasa.gov/catalog/PIA25351
In this observation from NASA's Mars Reconnaissance Orbiter, these two craters perched at the edge of an outflow channel, appear to have lost a portion of their crater rims during a flood event. Alternatively, it is also possible that the craters impacted the edge of the outflow channel after the flood occurred and we are seeing the difference in the strength of the material impacted. https://photojournal.jpl.nasa.gov/catalog/PIA21881
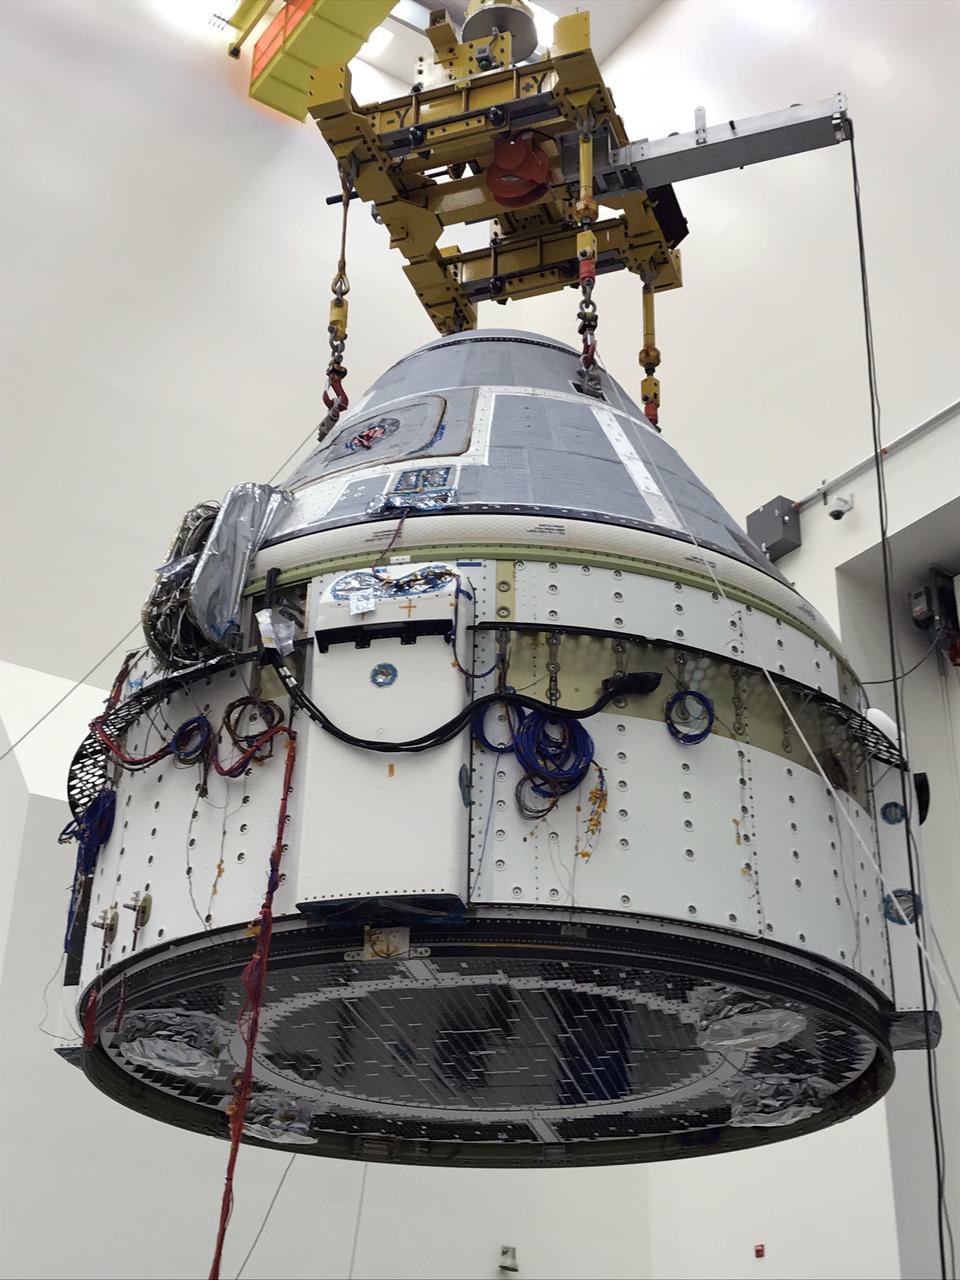
Boeing’s CST-100 Starliner is lifted into a test chamber at Boeing’s Space Environment Test Facility in El Segundo, Calif. There, Boeing engineers conducted different environmental qualification test programs, proving the vehicle is capable of withstanding the harsh environments it will see during launch, ascent and orbit. This is the Starliner that will be used for Boeing’s Crew Flight Test as part of NASA’s Commercial Crew Program, which is working with Boeing to return human spaceflight launches to the space station from U.S. soil.

In this observation from NASA Mars Reconnaissance Orbiter made for a study of ancient craters, we see the craters filled with smooth material that has subsequently degraded into scallops. These formations might be possibly due to ground ice sublimation. High resolution can help to estimate any differences in roughness on the smoother main mantle and in the eroded hollows. With the enhanced color swath, we might be able to view composition variations of the material. http://photojournal.jpl.nasa.gov/catalog/PIA19288
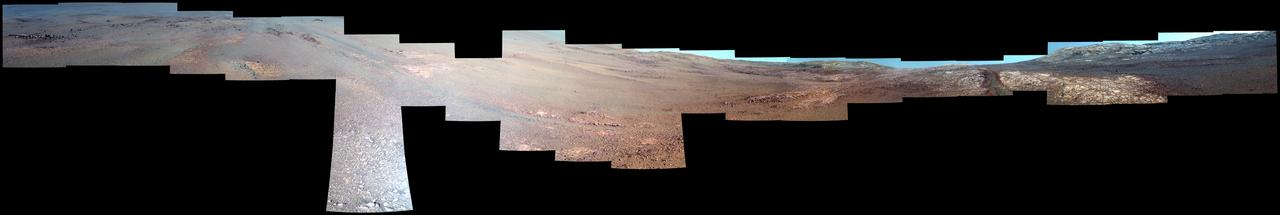
This enhanced-color view from within "Perseverance Valley," on the inner slope of the western rim of Endurance Crater on Mars, includes wheel tracks from the Opportunity rover's descent of the valley. The Panoramic Camera (Pancam) on Opportunity's mast took the component images of the scene during the period Sept. 4 through Oct. 6, 2017, corresponding to sols (Martian days) 4840 through 4871 of the rover's work on Mars. Perseverance Valley is a system of shallow troughs descending eastward about the length of two football fields from the crest of the crater rim to the floor of the crater. This panorama spans from northeast on the left to northwest on the right, including portions of the crater floor (eastward) in the left half and of the rim (westward) in the right half. Opportunity began descending Perseverance Valley in mid-2017 (see map) as part of an investigation into how the valley formed. Rover wheel tracks are darker brown, between two patches of bright bedrock, receding toward the horizon in the right half of the scene. This view combines multiple images taken through three different Pancam filters. The selected filters admit light centered on wavelengths of 753 nanometers (near-infrared), 535 nanometers (green) and 432 nanometers (violet). The three color bands are combined here with enhancement to make differences in surface materials easier to see. A map and full-resolution TIFF file are available at https://photojournal.jpl.nasa.gov/catalog/PIA22073
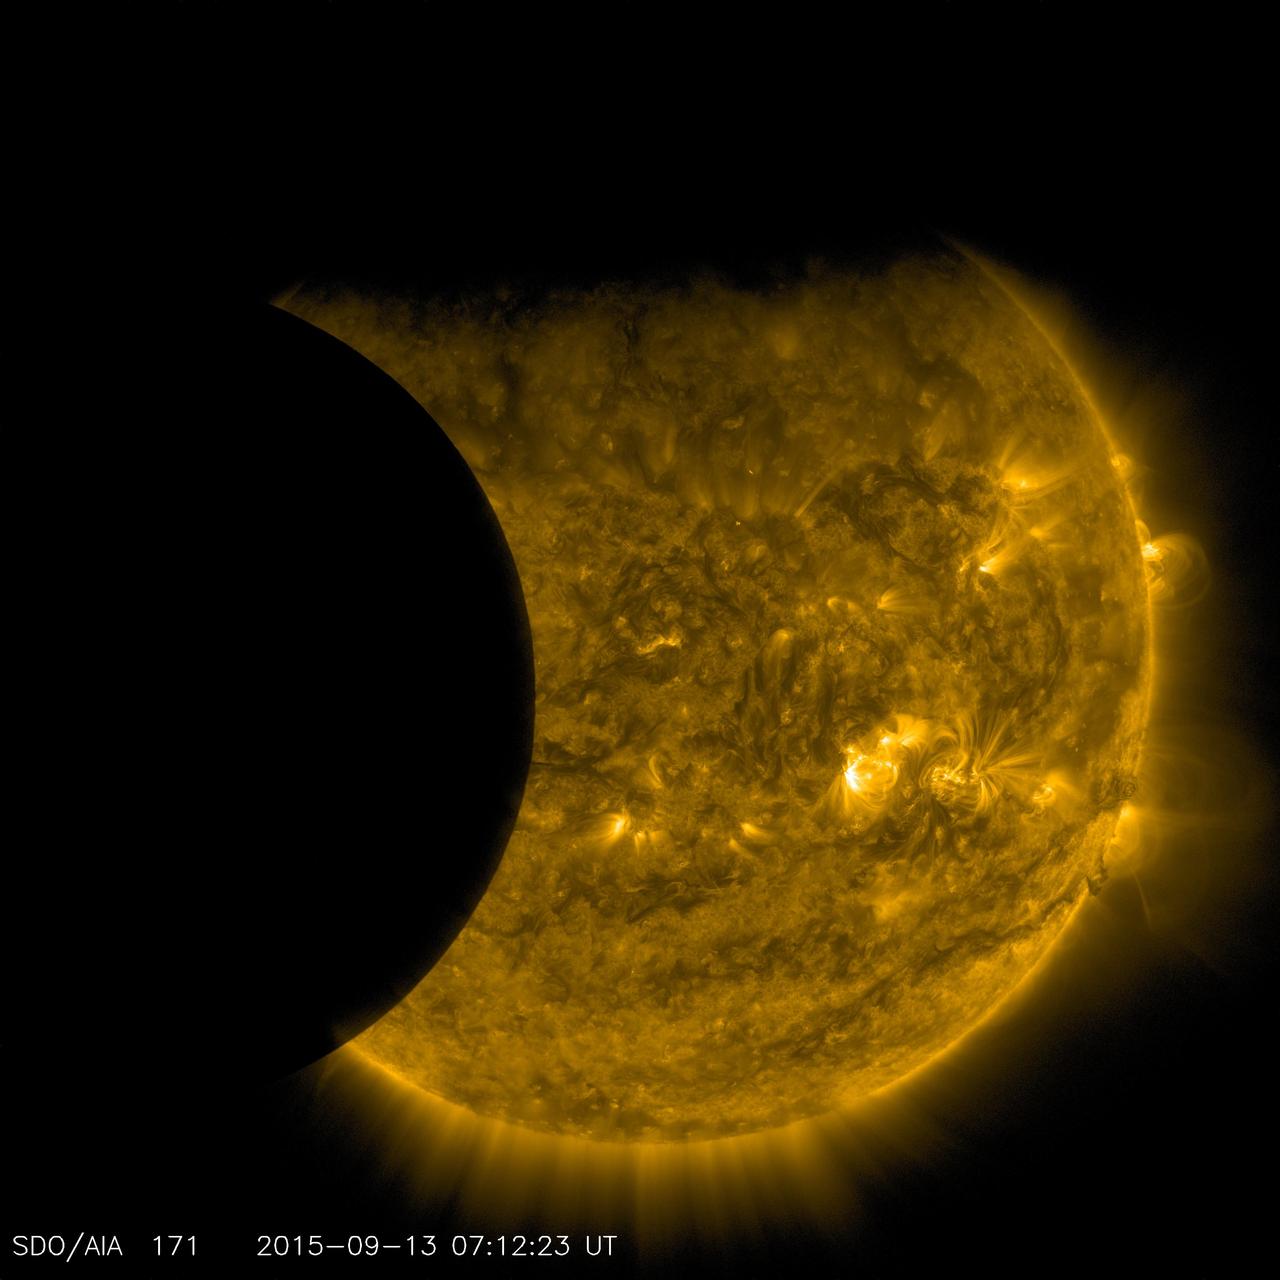
On Sept. 13, 2015, as NASA's Solar Dynamics Observatory, or SDO, kept up its constant watch on the sun, its view was photobombed not once, but twice. Just as the moon came into SDO's field of view on a path to cross the sun, Earth entered the picture, blocking SDO's view completely. When SDO's orbit finally emerged from behind Earth, the moon was just completing its journey across the sun's face. Though SDO sees dozens of Earth eclipses and several lunar transits each year, this is the first time ever that the two have coincided. SDO's orbit usually gives us unobstructed views of the sun, but Earth's revolution around the sun means that SDO's orbit passes behind Earth twice each year, for two to three weeks at a time. During these phases, Earth blocks SDO's view of the sun for anywhere from a few minutes to over an hour once each day. Earth's outline looks fuzzy, while the moon's is crystal-clear. This is because-while the planet itself completely blocks the sun's light-Earth's atmosphere is an incomplete barrier, blocking different amounts of light at different altitudes. However, the moon has no atmosphere, so during the transit we can see the crisp edges of the moon's horizon. http://photojournal.jpl.nasa.gov/catalog/PIA19949
Sublimation (ice vaporizing without passing through a liquid stage) is an important process affecting water ice in the mid-latitudes of Mars. This might be responsible for creating two different landforms: scalloped depressions and expanded craters. Scalloped depressions are oval or irregular pits with relatively steep pole-facing slopes, and expanded craters appear to be impact craters that have grown larger as the upper slopes sublimate, while dust and debris protect the bottom. The two usually do not occur together, but here we see what appears to be a slightly expanded crater in a field of scalloped depressions. It's possible that it will evolve over time to look more like the scallops. Unfortunately, this process is too slow to see with before-and-after HiRISE images, even if they were spaced years apart. https://photojournal.jpl.nasa.gov/catalog/PIA25557
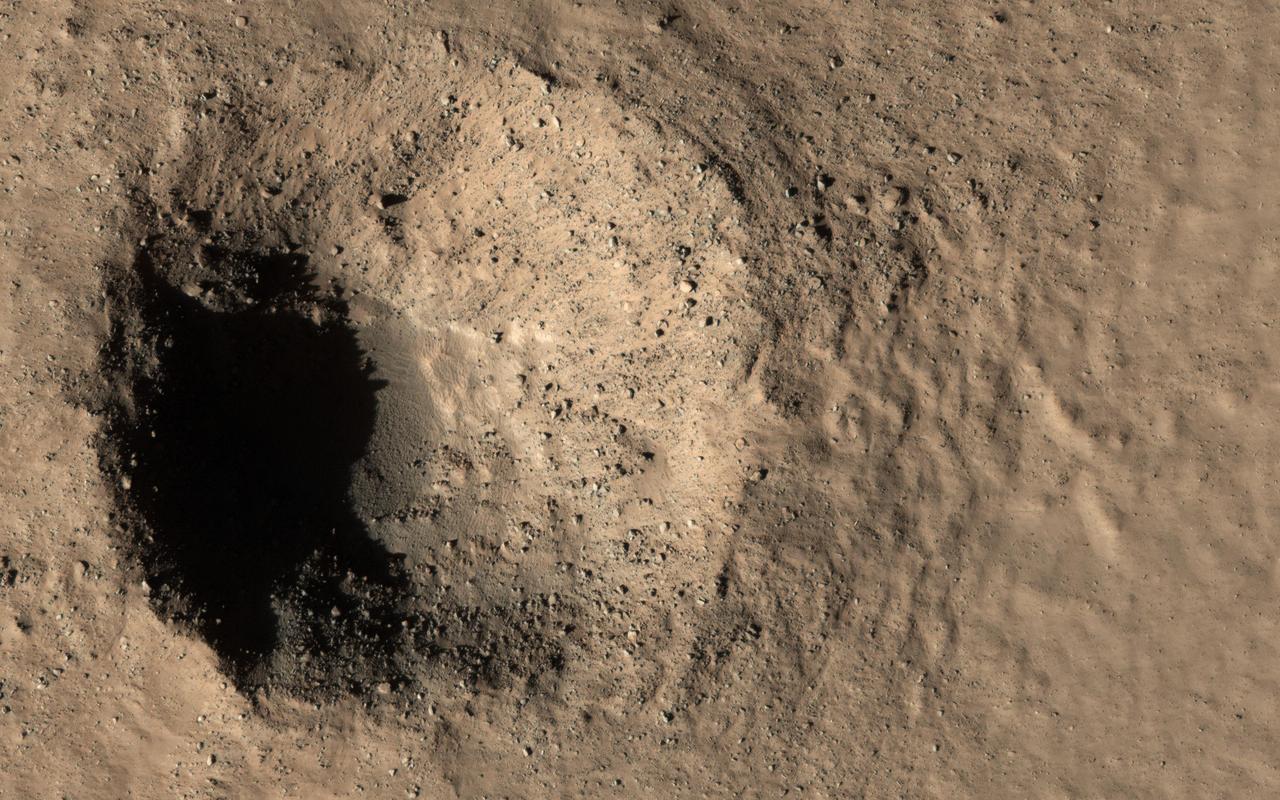
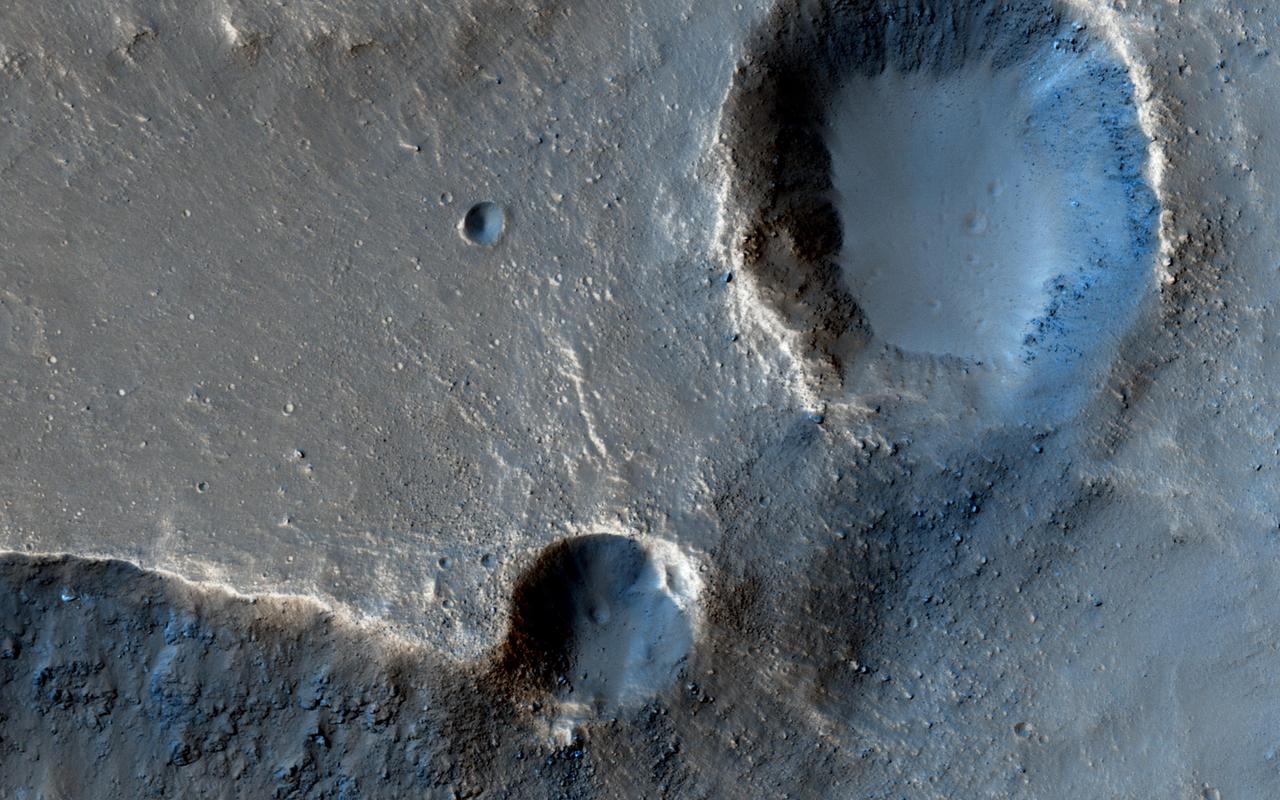
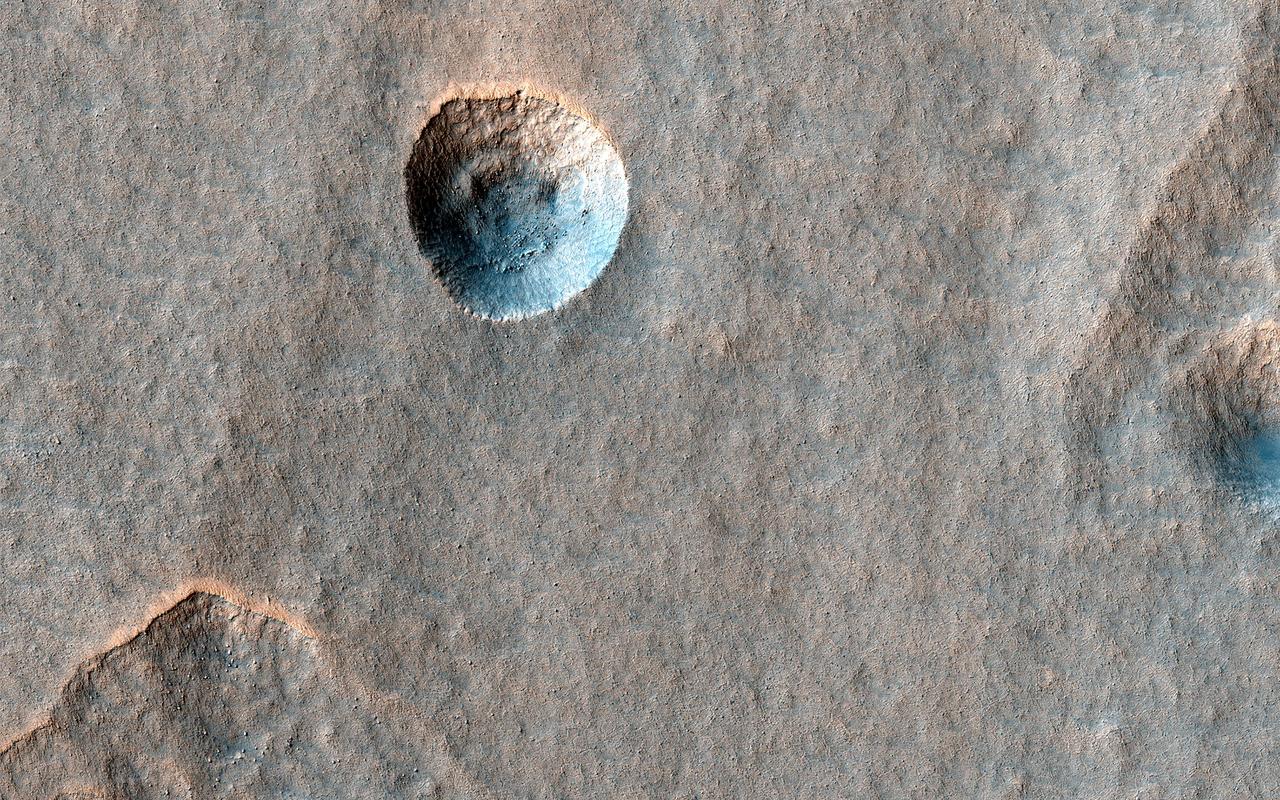
This image caught two different targets at once! In the top (northern) part there is a geologically-young crater about 300 meters in diameter, with rocky ejecta. The crater looks very fresh and steep and is not buried or filled in with the smooth deposits that cover the region. Craters like this tell us what is in the shallow subsurface and are very valuable for understanding the geology. In the bottom (southern) part is a smaller crater, only about 15 meters across. This one is even younger, having formed between 2008 and 2010, when it was detected by MRO's Context Camera. The smaller crater exposed subsurface ice, and HiRISE has been re-imaging it to see how it changes as the ice slowly sublimates away. Compare this image to ESP_017926_2310 to see what has happened in the last decade! https://photojournal.jpl.nasa.gov/catalog/PIA23852
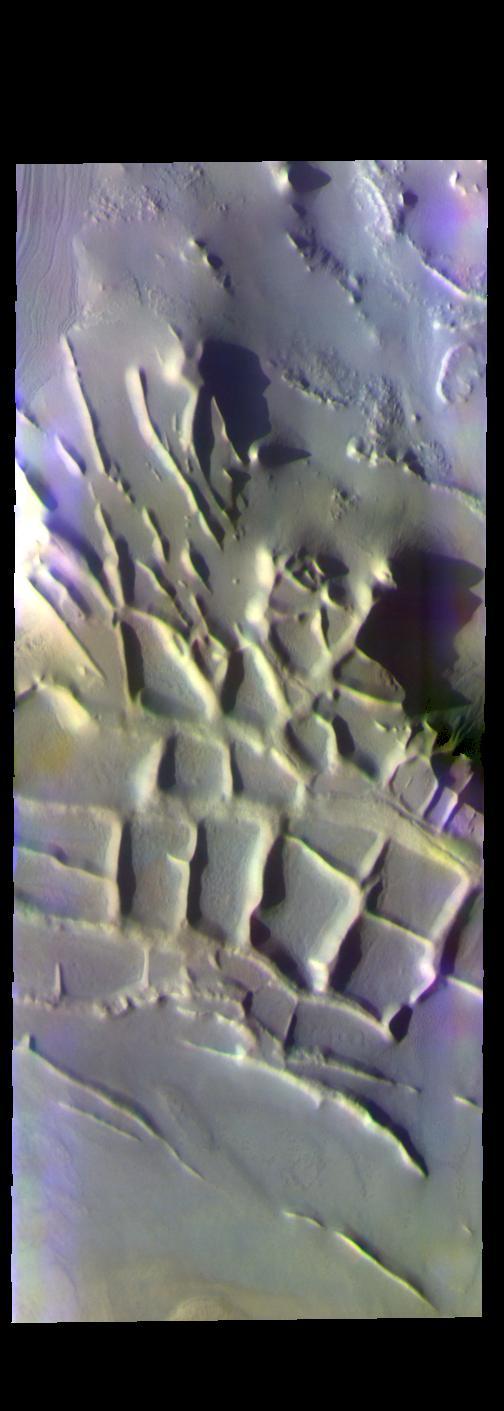
The THEMIS VIS camera contains 5 filters. The data from different filters can be combined in multiple ways to create a false color image. These false color images may reveal subtle variations of the surface not easily identified in a single band image. Today's false color image shows part of Angustus Labyrinthus. The intersecting ridges were most likely formed due to tectonic activity. When this feature was first observed by the Mariner 9 orbiter, project scientists informally dubbed it "the Inca City." It is very common to 'see' familiar objects in unfamiliar images, akin to seeing a 'face' in a wall outlet. To the scientists the orthogonal shapes resembled buildings. Orbit Number: 67658 Latitude: -81.392 Longitude: 296.2 Instrument: VIS Captured: 2017-03-15 21:34 https://photojournal.jpl.nasa.gov/catalog/PIA24073
This enhanced-color image shows a 45-meter-diameter crater that formed sometime between October 2010 and May 2012 in so-called "brain" terrain on Mars. HiRISE has been monitoring this crater to look for changes in the bright icy material exposed in the crater wall and some of the ejecta blocks. This material is interpreted as water ice because its extent changes with time, consistent with slow sublimation caused by solar heating. (Sublimation is the process when a solid converts directly into a gaseous state.) By comparing this image with another one (ESP_046707_2220) taken in July 2016, we see that some of the ejecta blocks have vanished since then. It appears that fresh ice has been exposed on the east wall of the crater since 2016, perhaps due to slumping of dirty material. When we apply different color enhancements to these two images, we see that the color of the scene did not actually change much. https://photojournal.jpl.nasa.gov/catalog/PIA23477
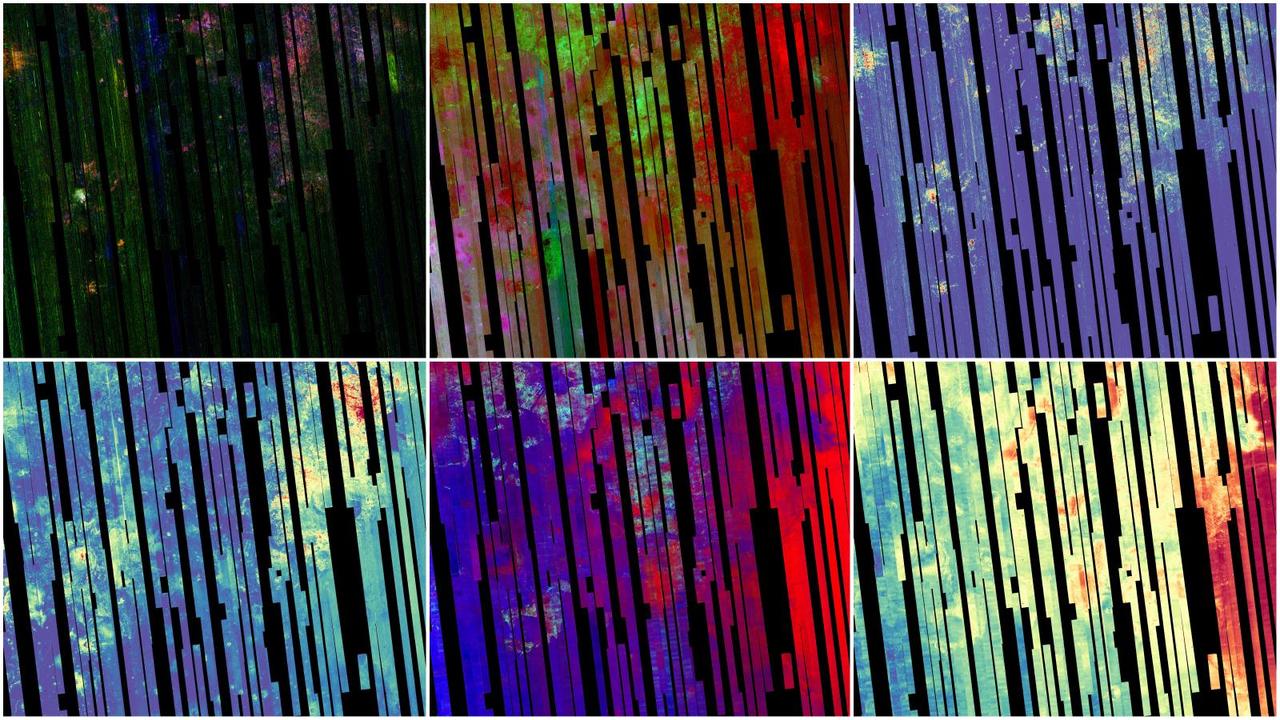
This image shows six views of the Nili Fossae region of Mars captured by the Compact Reconnaissance Imaging Spectrometer for Mars, or CRISM, one of the instruments aboard NASA's Mars Reconnaissance Orbiter. The varying colors represent minerals on the Martian surface seen in different wavelengths of light. Each of these views was produced as part of a near-global map made up of about 1,764 individual segments. The 72-color map is the last major dataset CRISM will ever produce; the instrument will be decommissioned by the end of 2022. Data for the 6.3-gigapixel map was collected over 11 years of CRISM operations. The instrument arrived at Mars with three cryocoolers that allowed it to see in a range of wavelengths, including infrared; in 2017, the last of those cryocoolers stopped working, severely limiting the number of wavelengths CRISM could "see." https://photojournal.jpl.nasa.gov/catalog/PIA25364

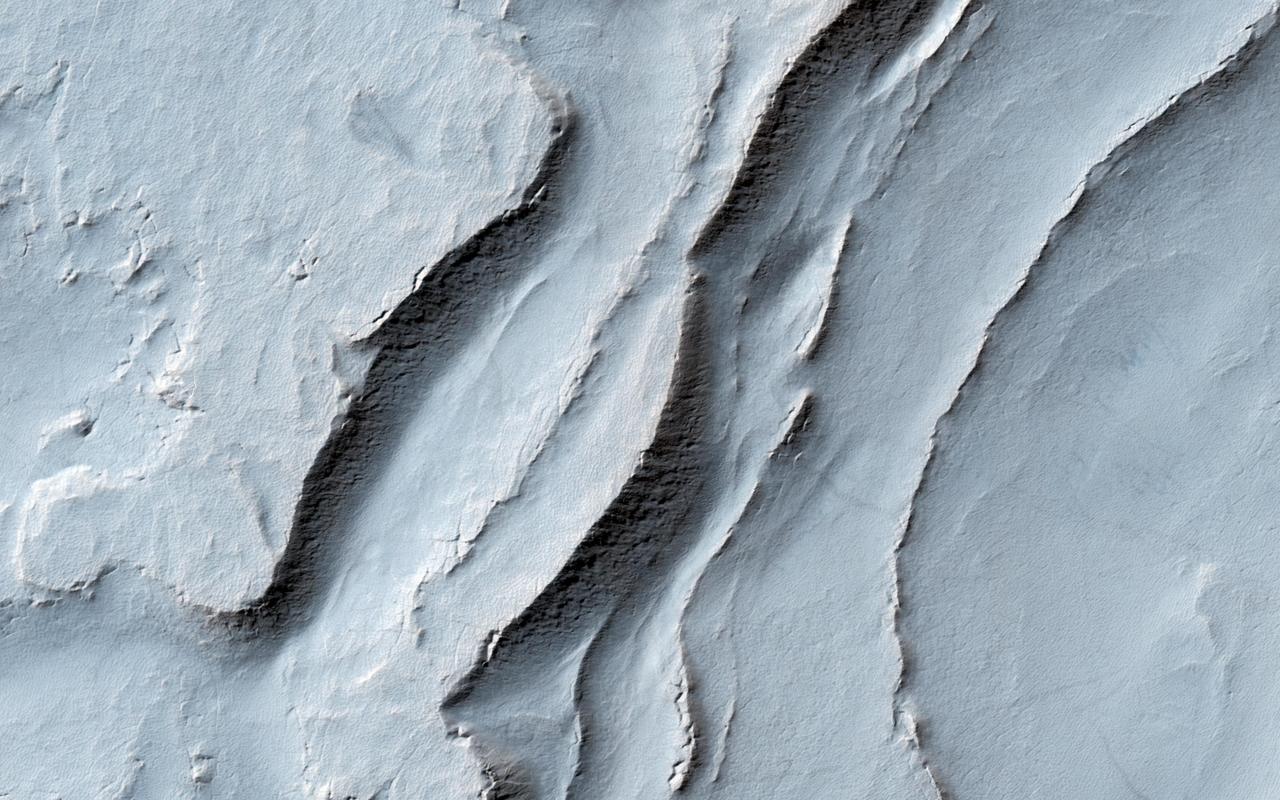
This HiRISE image shows a classic example of platy-ridged lava. Scientists think that this is the same as a lava type called "rubbly pahoehoe" on Earth. In this lava, a crust of rubble forms as the lava partially cools but then tears up its own cover. Eventually, the rubble can form plates that can be rafted apart as the lava cools further, producing textures like those visible on terrestrial lava lakes that have cooled. We see here a complex history of these processes. There are two different shapes of the rubble (at right, and top left/bottom center) indicating two stages of formation. The smooth area at center also is divided into two domains with different polygon styles, indicating that the rift opened, partially cooled, and then opened further. https://photojournal.jpl.nasa.gov/catalog/PIA25948
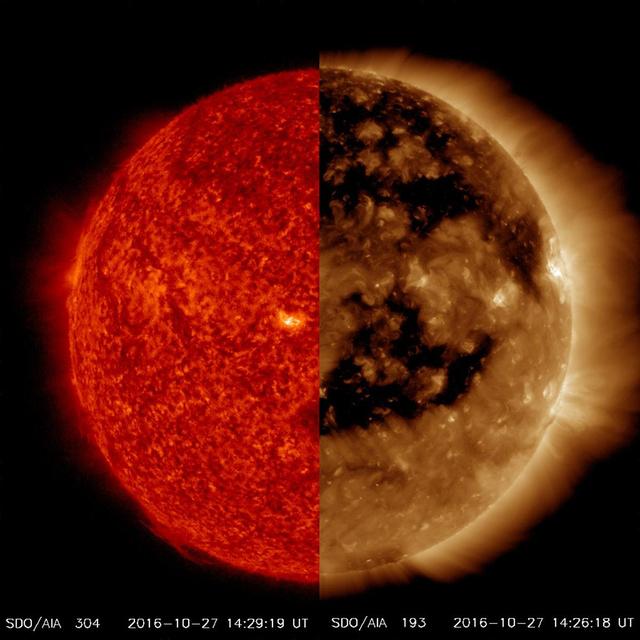
The difference in features that are visible in different wavelengths of extreme ultraviolet light can be stunning as we see when we compare very large coronal holes, easily seen in the AIA 171 image (colorized bronze) yet hardly perceptible in the AIA 304 image (colorized red). Both were taken at just about the same time (Oct. 27, 2016). Coronal holes are areas of open magnetic field that carry solar wind out into space. In fact, these holes are currently causing a lot of geomagnetic activity here on Earth. The bronze image wavelength captures material that is much hotter and further up in the corona than the red image. The comparison dramatizes the value of observing the sun in multiple wavelengths of light. Movies are available at http://photojournal.jpl.nasa.gov/catalog/PIA15377
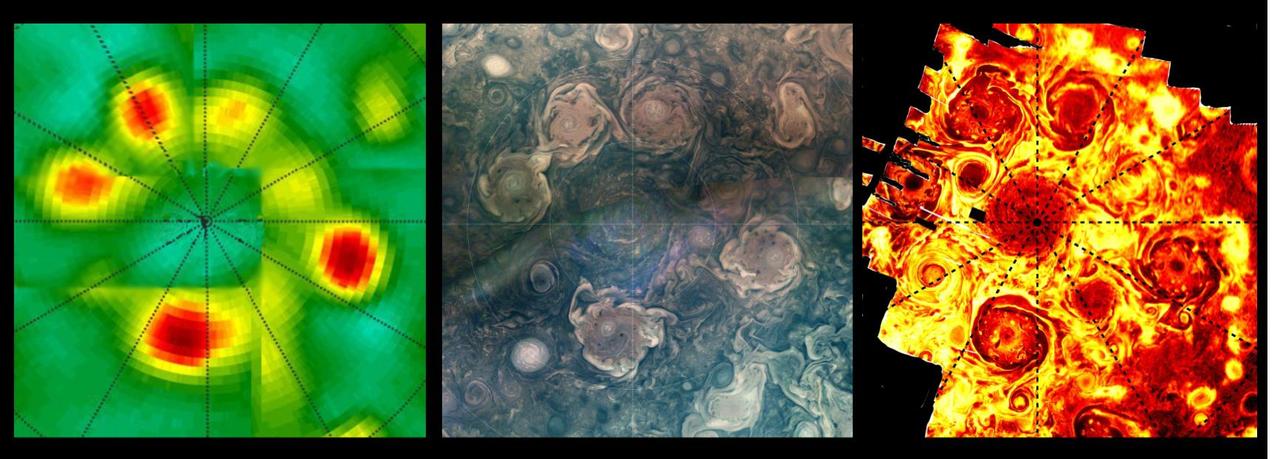
This composite shows views of Jupiter's northern polar cyclones in three different wavelengths of light – microwave, visible, and ultraviolet – as captured by NASA's Juno mission. These differing perspectives allowed Juno scientists to deduce that all Jovian polar cyclones are not created equal. The infrared image, on the far right, was derived from data collected by the spacecraft's Jovian Infrared Auroral Mapper (JIRAM) instrument. The composite image at center was collected by the JunoCam visible-light imager. Though taken with separate instruments that record different wavelengths of light, both images depict Jupiter's northern polar storms as well defined and of similar size. The data on the left, collected by Juno's Microwave Radiometer (MWR), shows the polar storms in another light. MWR enables Juno to see deep into Jupiter by recording the planet's microwave emissions. In the MWR graphic, the polar storms at the 4 and 6 o'clock positions have bright microwave signatures, indicating they extend well beneath the cloud tops, at least 62 miles (100 kilometers) below. The size of those two storms is comparable to what's found in the visible light and infrared light images, but the other storms, as seen through MWR, have a notably reduced emissions intensity. Another disparity in the MWR graphic versus visible light and infrared can be seen in how the central cyclone is depicted by the data. In the infrared and visible light images, the central cyclone is evident; with MWR data, it all but disappears. This disparity indicates that the central cyclone's subsurface structure must be very different from the surrounding storms. JIRAM "sees" in infrared light not visible to the human eye. It captures the infrared glow from the heat of Jupiter's upper atmosphere, probing the top of the weather layer, and gaps in the clouds allow glimpses as deep as 30 to 45 miles (50 to 70 kilometers) below Jupiter's cloud tops. JunoCam's visible light images catch reflected sunlight, with a view that is very similar to what a human eye would see if a person could ride along with Juno. JunoCam's raw images are available for the public to peruse and process into image products at https://missionjuno.swri.edu/junocam/processing. Like JIRAM, the MWR instrument records the glow of Jupiter's atmosphere, but the brightness results from the temperature at depths below anything achievable with previous spacecraft or Earth-based observations. The MWR's six radio channels peer progressively deeper below the visible cloud tops, with a range from the top of the clouds (for the highest frequency channel) to 200 miles (320 kilometers) or more below (for the lowest frequency channel). https://photojournal.jpl.nasa.gov/catalog/PIA26295
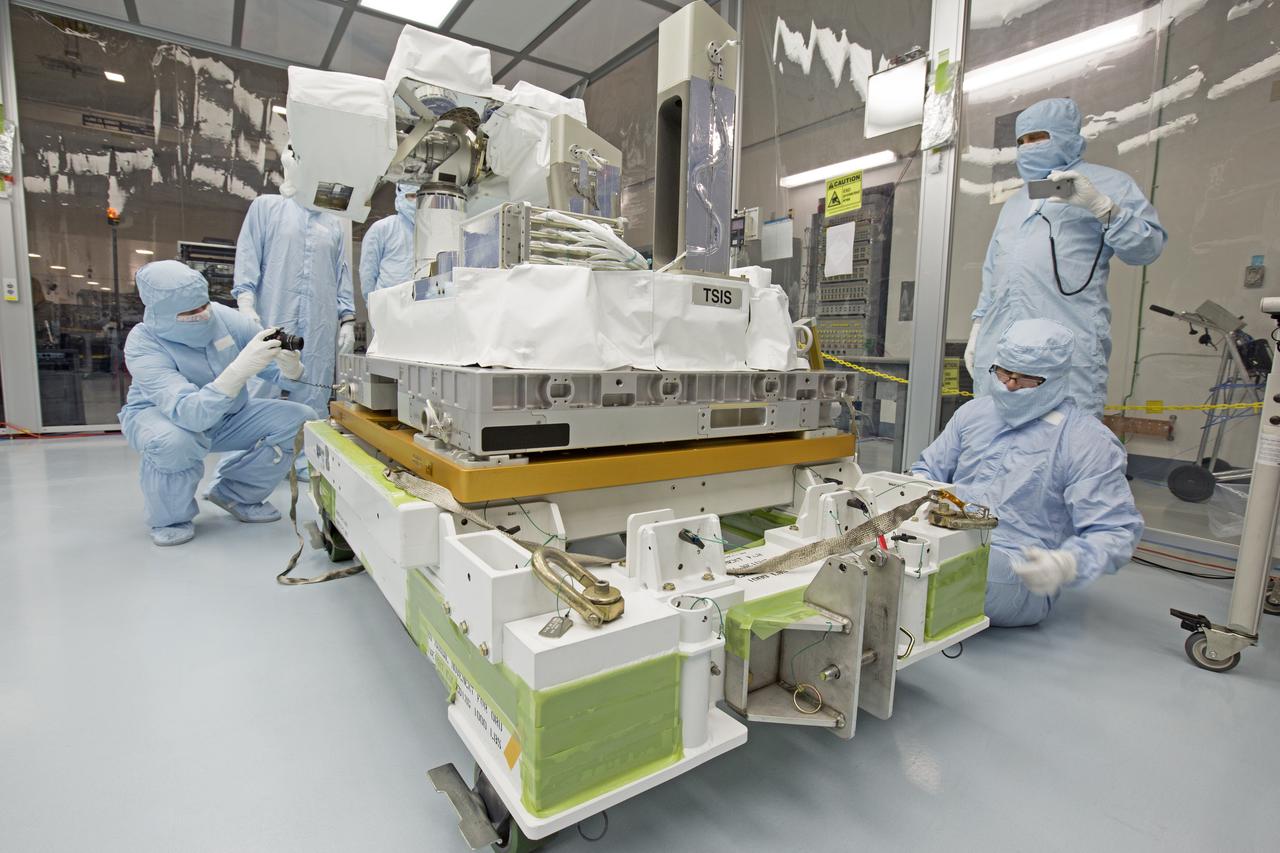
In the high bay of Kennedy Space Center's Space Station Processing Facility, Chris Hardcastle, left, of Stinger-Ghaffarian Technologies, and other payload team members performs spacewalk tool fit-checks of the integrated Total and Spectral Solar Irradiance Sensor-1 (TSIS-1) payload and the EXPRESS Pallet Adapter. TSIS-1 is designed to measure the Sun's energy input into Earth by seeing how it is distributed across different wavelengths of light. These measurements help scientists establish Earth's total energy and how our planet's atmosphere responds to changes in the Sun's energy output. TSIS-1 will launch on SpaceX's 13th commercial resupply mission to the International Space Station.
HiRISE commonly takes images of recent craters on Mars, which are usually found by the MRO Context Camera where they disturb surface dust. An impact site in this area was first imaged in December 2017. A year and a half later, the scene looks totally different! Dust has eroded from the surface, probably due to the planet-encircling dust storm from 2018. The dark spots around the fresh craters have vanished because they only affected the dust that has since disappeared. See if you can find the craters in the new image by comparing with the old one. https://photojournal.jpl.nasa.gov/catalog/PIA23233
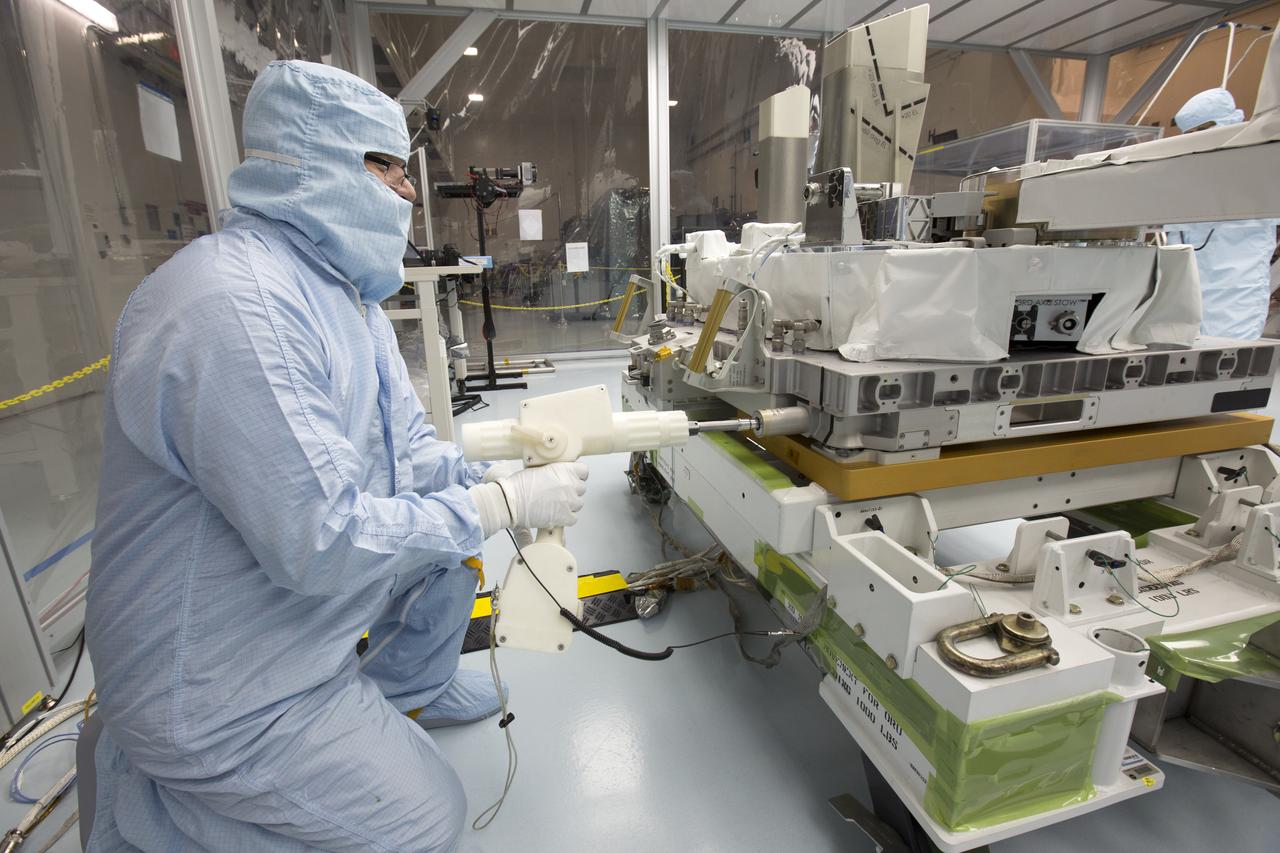
In the high bay of Kennedy Space Center's Space Station Processing Facility, Chris Hardcastle of Stinger-Ghaffarian Technologies performs spacewalk tool fit-checks of the integrated Total and Spectral Solar Irradiance Sensor-1 (TSIS-1) payload and the EXPRESS Pallet Adapter. TSIS-1 is designed to measure the Sun's energy input into Earth by seeing how it is distributed across different wavelengths of light. These measurements help scientists establish Earth's total energy and how our planet's atmosphere responds to changes in the Sun's energy output. TSIS-1 will launch on SpaceX's 13th commercial resupply mission to the International Space Station.
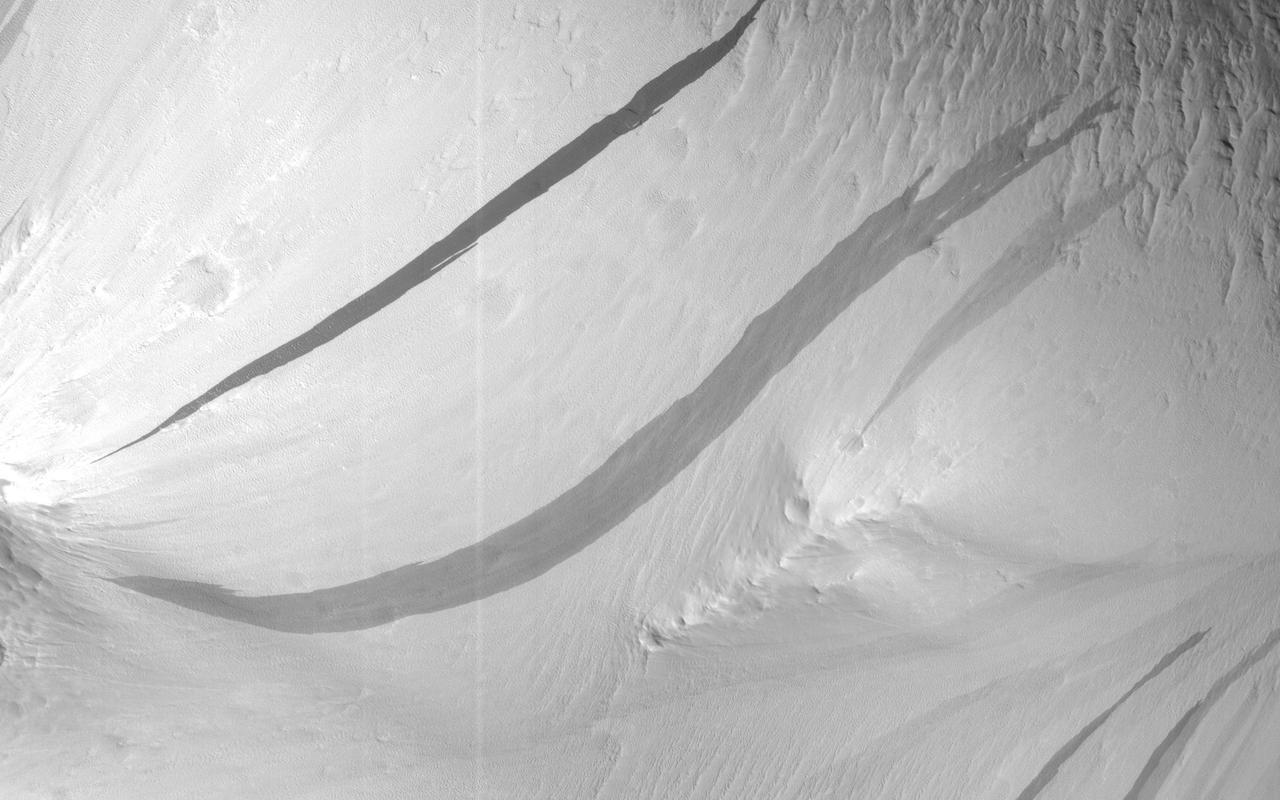
Many of the Valles Marineris canyons, called chasmata, have kilometer-high, light-toned layered mounds made up of sulfate materials. Ius Chasma, near the western end of Valles Marineris, is an exception. The light-toned deposits here are thinner and occur along both the floor and walls, as we see in this HiRISE image. Additionally, the sulfates are mixed with other minerals like clays and hydrated silica. Scientists are trying to use the combination of mineralogy, morphology, and stratigraphy to understand how the deposits formed in Ius Chasma and why they differ from those found elsewhere in Valles Marineris. https://photojournal.jpl.nasa.gov/catalog/PIA25982
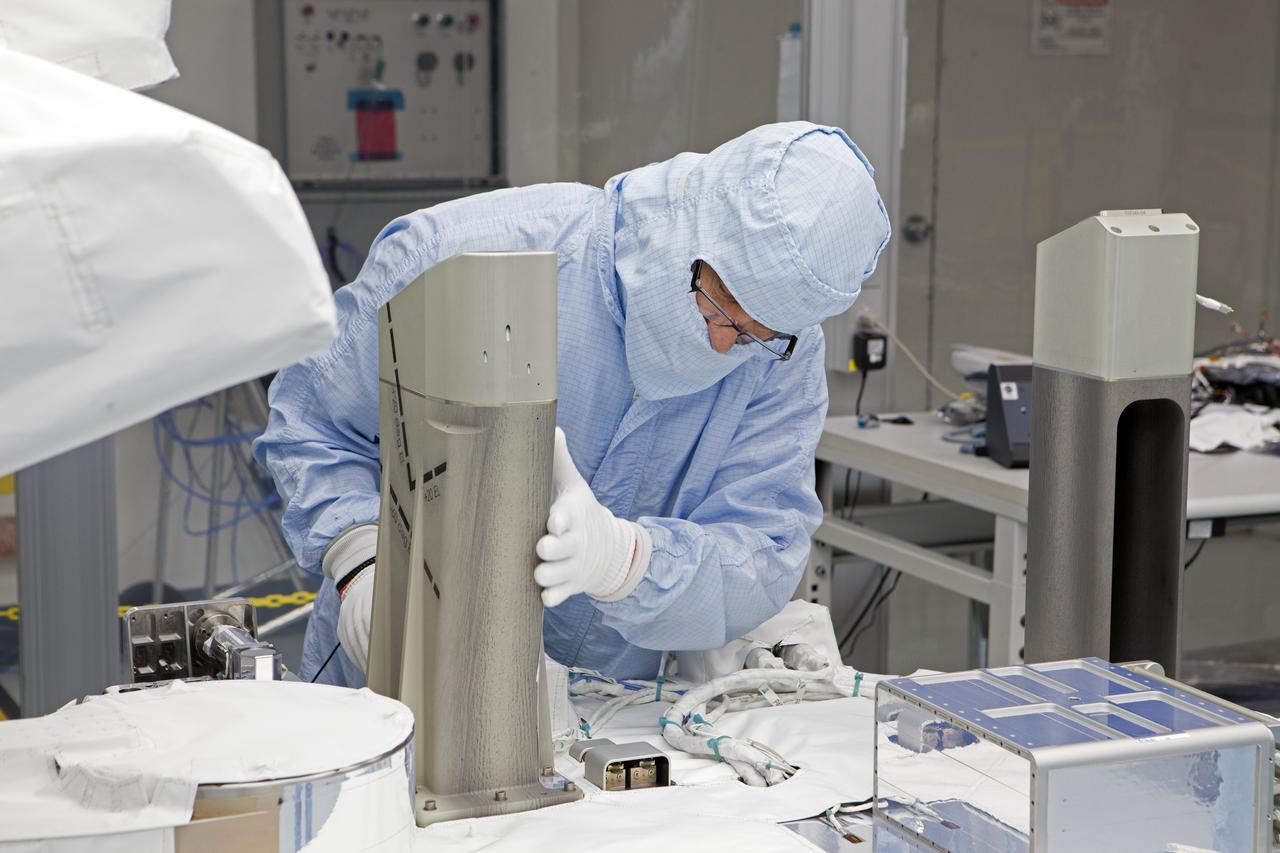
In the high bay of Kennedy Space Center's Space Station Processing Facility, Chris Hardcastle of Stinger-Ghaffarian Technologies performs a sharp edge inspection of the integrated Total and Spectral Solar Irradiance Sensor-1 (TSIS-1) payload and the EXPRESS Pallet Adapter. TSIS-1 is designed to measure the Sun's energy input into Earth by seeing how it is distributed across different wavelengths of light. These measurements help scientists establish Earth's total energy and how our planet's atmosphere responds to changes in the Sun's energy output. TSIS-1 will launch on SpaceX's 13th commercial resupply mission to the International Space Station.
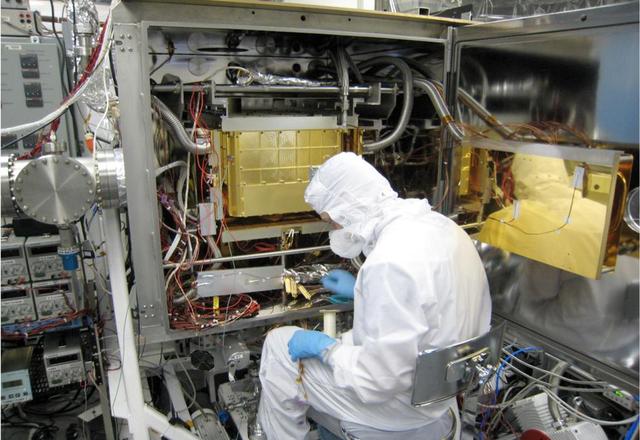
A Sample Analysis at Mars (SAM) team member at NASA's Goddard Space Flight Center, Greenbelt, Maryland, prepares the SAM testbed for an experiment. This test copy of the SAM suite of instruments is inside a chamber that, when closed, can model the pressure and temperature environment that SAM sees inside NASA's Curiosity rover on Mars. Many weeks of testing are often needed to develop and refine sequences of operations that SAM uses for making specific measurements on Mars. This was the case with preparation to pull a volume of gas from the atmosphere and extract the heavy noble gas xenon. SAM's measurements of different types of xenon in the Martian atmosphere provide clues about the planet's history. http://photojournal.jpl.nasa.gov/catalog/PIA19149
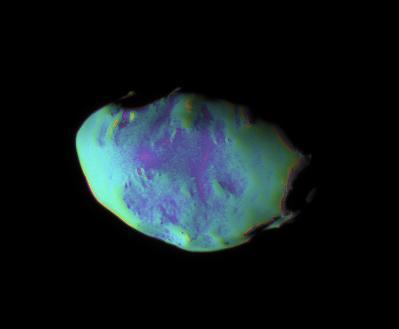
These views show surface features and color variation on the Trojan moon Telesto. The smooth surface of this moon suggests that, like Pandora, it is covered with a mantle of fine, dust-sized icy material. The monochrome image was taken in visible light (see PIA07696). To create the false-color view, ultraviolet, green and infrared images were combined into a single black and white picture that isolates and maps regional color differences. This "color map" was then superposed over a clear-filter image. The origin of the color differences is not yet understood, but may be caused by subtle differences in the surface composition or the sizes of grains making up the icy soil. Tiny Telesto is a mere 24 kilometers (15 miles) wide. The image was acquired with the Cassini spacecraft narrow-angle camera on Dec. 25, 2005 at a distance of approximately 20,000 kilometers (12,000 miles) from Telesto and at a Sun-Telesto-spacecraft, or phase, angle of 58 degrees. Image scale is 118 meters (387 feet) per pixel. http://photojournal.jpl.nasa.gov/catalog/PIA07697
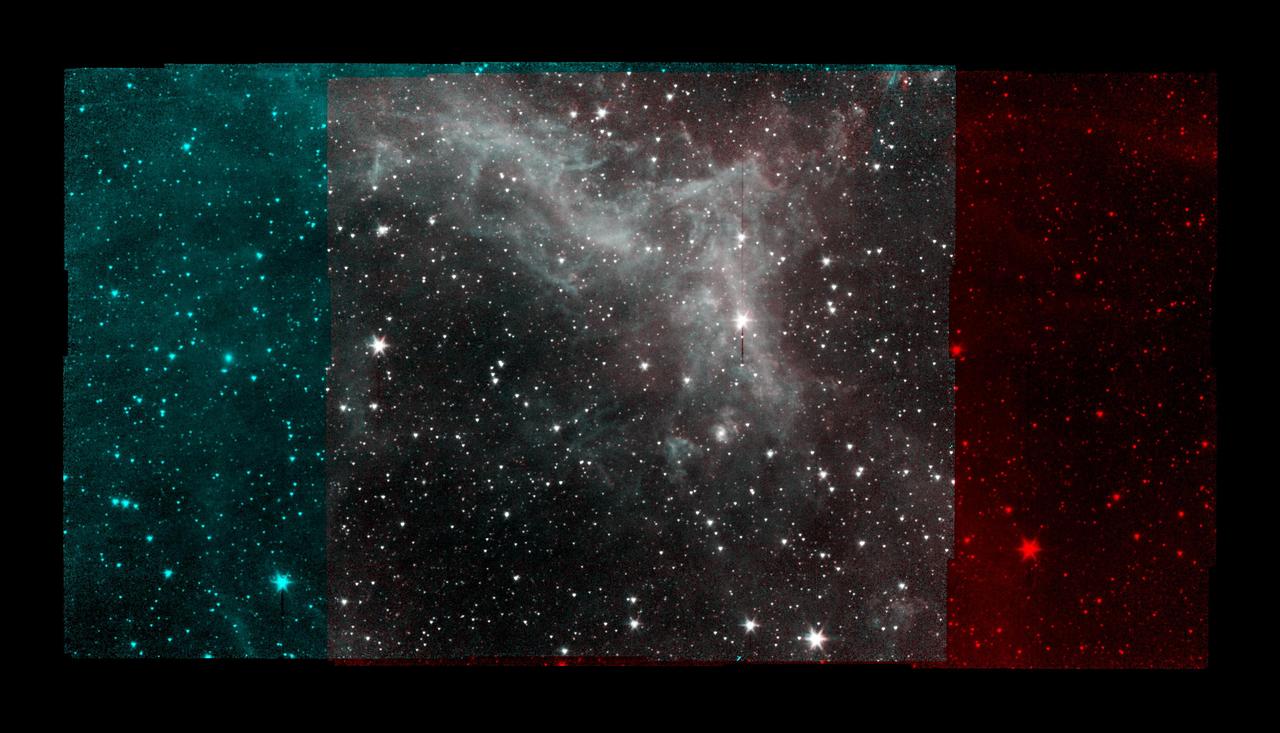
This series of image taken by NASA's Spitzer Space Telescope on Jan. 25, 2020, shows part of the California Nebula, which is located about 1,000 light-years from Earth. This is the final mosaic taken by the mission before it was decommissioned on Jan. 30, 2020. Spitzer's infrared detectors reveal the presence of warm dust, similar to soot, mixed in with the gas. The dust absorbs visible and ultraviolet light from nearby stars and then re-emits the absorbed energy as infrared light. The image displays Spitzer's observations much the way that research astronomers would view them: From 2009 to 2020, Spitzer operated two detectors simultaneously that imaged adjacent areas of the sky. The detectors captured different wavelengths of infrared light (referred to by their physical wavelength): 3.6 micrometers (shown in cyan) and 4.5 micrometers (shown in red). Different wavelengths of light can reveal different objects or features. Spitzer would scan the sky, taking multiple pictures in a grid pattern, so that both detectors would image the region at the center of the grid. By combining those images into a mosaic, it was possible to see what a given region looked like in multiple wavelengths, such as in the gray-hued part of the image above. https://photojournal.jpl.nasa.gov/catalog/PIA23650
In this image from NASA Mars Mars Reconnaissance Orbiter, we can see quite a spectacular layering pattern inside an impact crater called Spallanzani. Seeing layering is always exciting to geologists because it implies that the region has experienced multiple climatic conditions or geologic processes through time. The study of layering is so important in geology that it has its own dedicated branch of study: stratigraphy! Commonly, layering implies different lithologies (i.e., rock types). However, sometimes the layers could be of very similar composition but formed in different periods of time. This could happen for example in the case of annual flood deposits from rivers, multiple volcanic eruptions, or annual or periodic deposition of ice-rich material. We can also see in this image another feature called terracing, which happens when the layers form distinctive planes on top of one another like terraces. This could imply that the layers are being eroded with time but some of the layers are being eroded quicker than others because they are less resistant to erosion. So what is the composition of these layers? Spallanzani Crater lies in the high latitudes of the Southern hemisphere (around 60 degrees in latitude) so there is a good possibility that the deposits are ice-rich. If we look more closely we will notice fractured mounds, which sometimes indicate the presence of subsurface ice. Another interesting observation is the presence of grooves in the shaded slopes of some of the layers. Perhaps these grooves formed because of the sublimation (the direct transfer of solid ice to water vapor) of ice from these slopes since slopes tend to get warmer than the surrounding terrains. A close inspection of this image may help answer this question and investigate the multiple cycles in which these deposits were laid down as well as the duration of these individual cycles. http://photojournal.jpl.nasa.gov/catalog/PIA19367
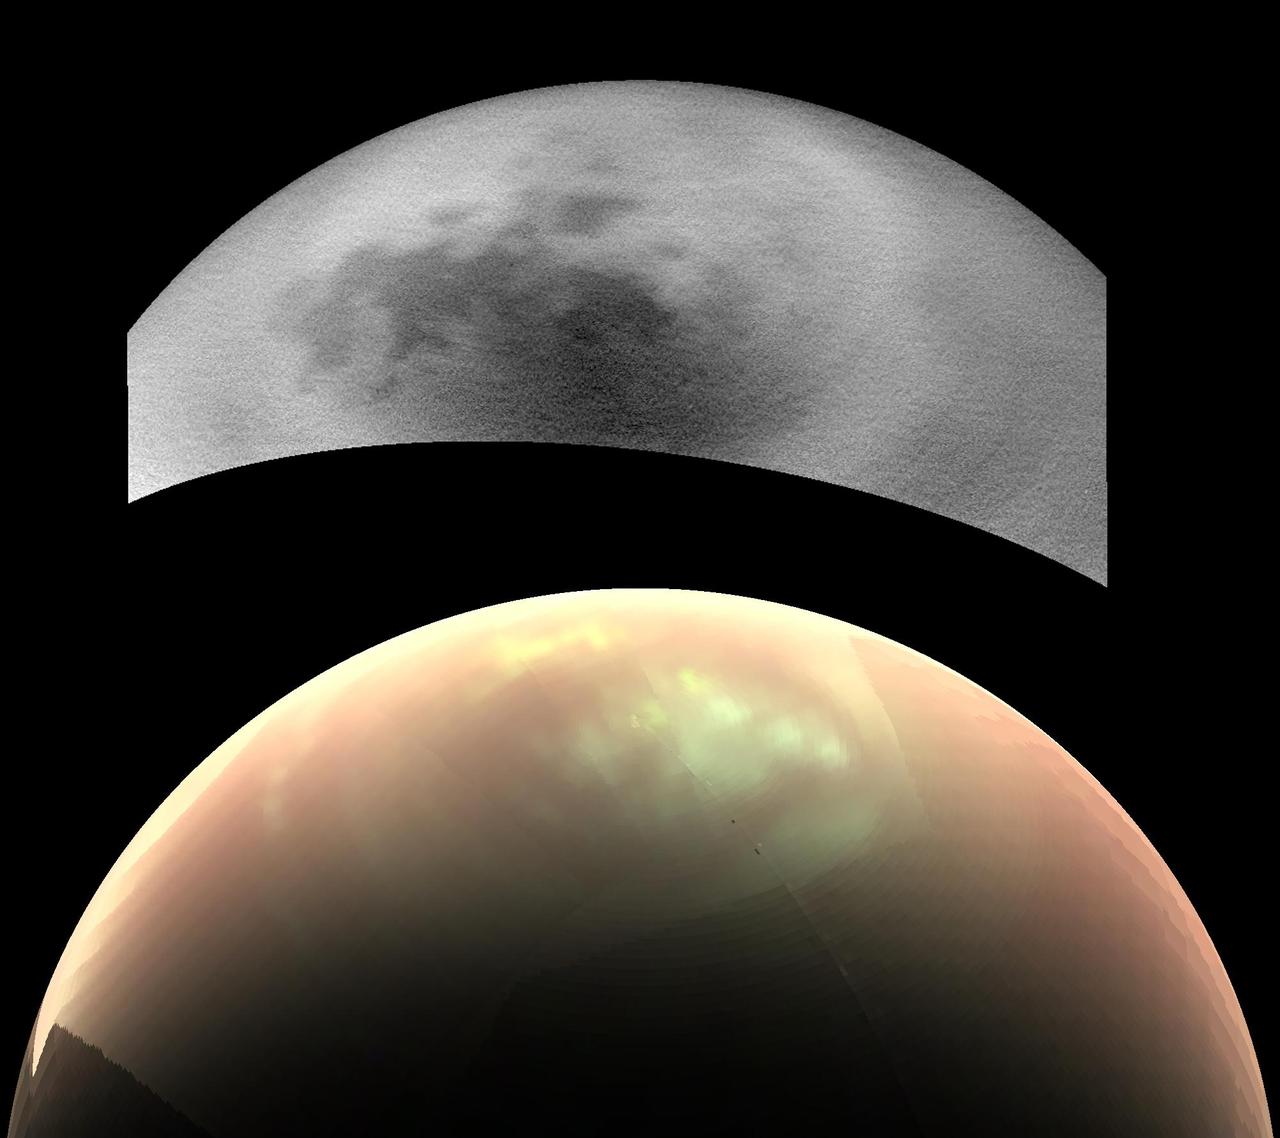
This comparison of two views from NASA's Cassini spacecraft, taken fairly close together in time, illustrates a peculiar mystery: Why would clouds on Saturn's moon Titan be visible in some images, but not in others? In the top view, a near-infrared image from Cassini's imaging cameras, the skies above Saturn's moon Titan look relatively cloud free. But in the bottom view, at longer infrared wavelengths, Cassini sees a large field of bright clouds. Even though these views were taken at different wavelengths, researchers would expect at least a hint of the clouds to show up in the upper image. Thus they have been trying to understand what's behind the difference. As northern summer approaches on Titan, atmospheric models have predicted that clouds will become more common at high northern latitudes, similar to what was observed at high southern latitudes during Titan's late southern summer in 2004. Cassini's Imaging Science Subsystem (ISS) and Visual and Infrared Mapping Spectrometer (VIMS) teams have been observing Titan to document changes in weather patterns as the seasons change, and there is particular interest in following the onset of clouds in the north polar region where Titan's lakes and seas are concentrated. Cassini's "T120" and "T121" flybys of Titan, on June 7 and July 25, 2016, respectively, provided views of high northern latitudes over extended time periods -- more than 24 hours during both flybys. Intriguingly, the ISS and VIMS observations appear strikingly different from each other. In the ISS observations (monochrome image at top), surface features are easily identifiable and only a few small, isolated clouds were detected. In contrast, the VIMS observations (color image at bottom) suggest widespread cloud cover during both flybys. The observations were made over the same time period, so differences in illumination geometry or changes in the clouds themselves are unlikely to be the cause for the apparent discrepancy: VIMS shows persistent atmospheric features over the entire observation period and ISS consistently detects surface features with just a few localized clouds. The answer to what could be causing the discrepancy appears to lie with Titan's hazy atmosphere, which is much easier to see through at the longer infrared wavelengths that VIMS is sensitive to (up to 5 microns) than at the shorter, near-infrared wavelength used by ISS to image Titan's surface and lower atmosphere (0.94 microns). High, thin cirrus clouds that are optically thicker than the atmospheric haze at longer wavelengths, but optically thinner than the haze at the shorter wavelength of the ISS observations, could be detected by VIMS and simultaneously lost in the haze to ISS -- similar to trying to see a thin cloud layer on a hazy day on Earth. This phenomenon has not been seen again since July 2016, but Cassini has several more opportunities to observe Titan over the last months of the mission in 2017, and scientists will be watching to see if and how the weather changes. These two images were taken as part of the T120 flyby on June 7 (VIMS) and 8 (ISS), 2016. The distance to Titan was about 28,000 miles (45,000 kilometers) for the VIMS image and about 398,000 miles (640,000 kilometers) for the ISS image. The VIMS image has been processed to enhance the visibility of the clouds; in this false-color view, clouds appear nearly white, atmospheric haze is pink, and surface areas would appear green. http://photojournal.jpl.nasa.gov/catalog/PIA21054
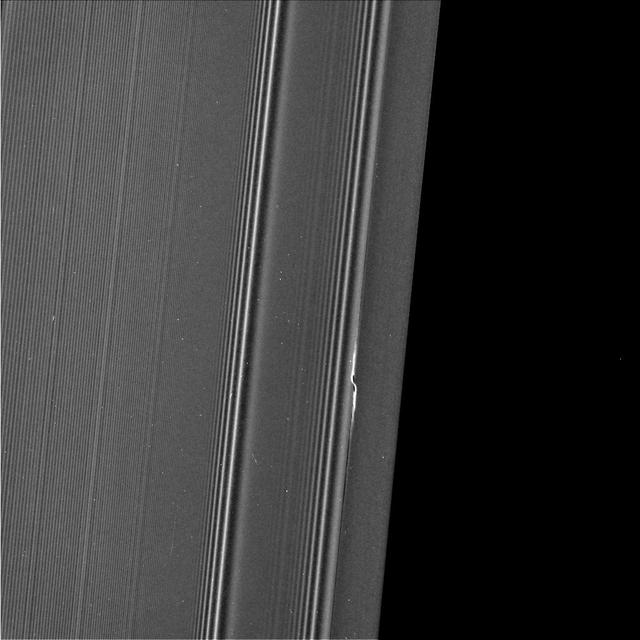
The propeller informally named "Earhart" is seen in this view from NASA's Cassini spacecraft at much higher resolution than ever before. This view, obtained on March 22, 2017, is the second time Cassini has deliberately targeted an individual propeller for close-up viewing during its ring-grazing orbits, after its images of Santos-Dumont (PIA21433) a month earlier. The biggest known propeller, informally named "Bleriot," is slated for the third and final propeller close-up in April 2017. Propellers are disturbances in the ring caused by a central moonlet. The moonlet itself would be a few pixels wide in this view, but it is difficult to distinguish from (and may be obscured by) the disturbed ring material that surrounds it. (See PIA20525 for more info on propellers.) The detailed structure of the Earhart propeller, as seen here, differs from that of Santos-Dumont. It is not clear whether these differences have to do with intrinsic differences between Earhart and Santos-Dumont, or whether they have to do with different viewing angles or differences in where the propellers were imaged in their orbits around Saturn. Earhart is situated very close to the 200-mile-wide (320-kilometer-wide) Encke Gap, which is held open by the much larger moon Pan. In this view, half of the Encke Gap is visible as the dark region at right. The gap and the propeller are a study in contrasts. The propeller is nothing more than Earhart's attempt to open a gap like Encke using its gravity. However, Earhart's attempt is thwarted by the mass of the ring, which fills in the nascent gap before it can extend very far. Pan is a few thousand times more massive than Earhart, which enables it to maintain a gap that extends all the way around the ring. To the left of the propeller are wave features in the rings caused by the moons Pandora, Prometheus and Pan. The visible-light image was acquired by the Cassini narrow-angle camera at a distance of 69,183 miles (111,340 kilometers) from the propeller feature. Image scale is 0.4 mile (670 meters) per pixel in the radial, or outward-from-Saturn, direction. The view looks toward the sunlit side of the rings. https://photojournal.jpl.nasa.gov/catalog/PIA21437
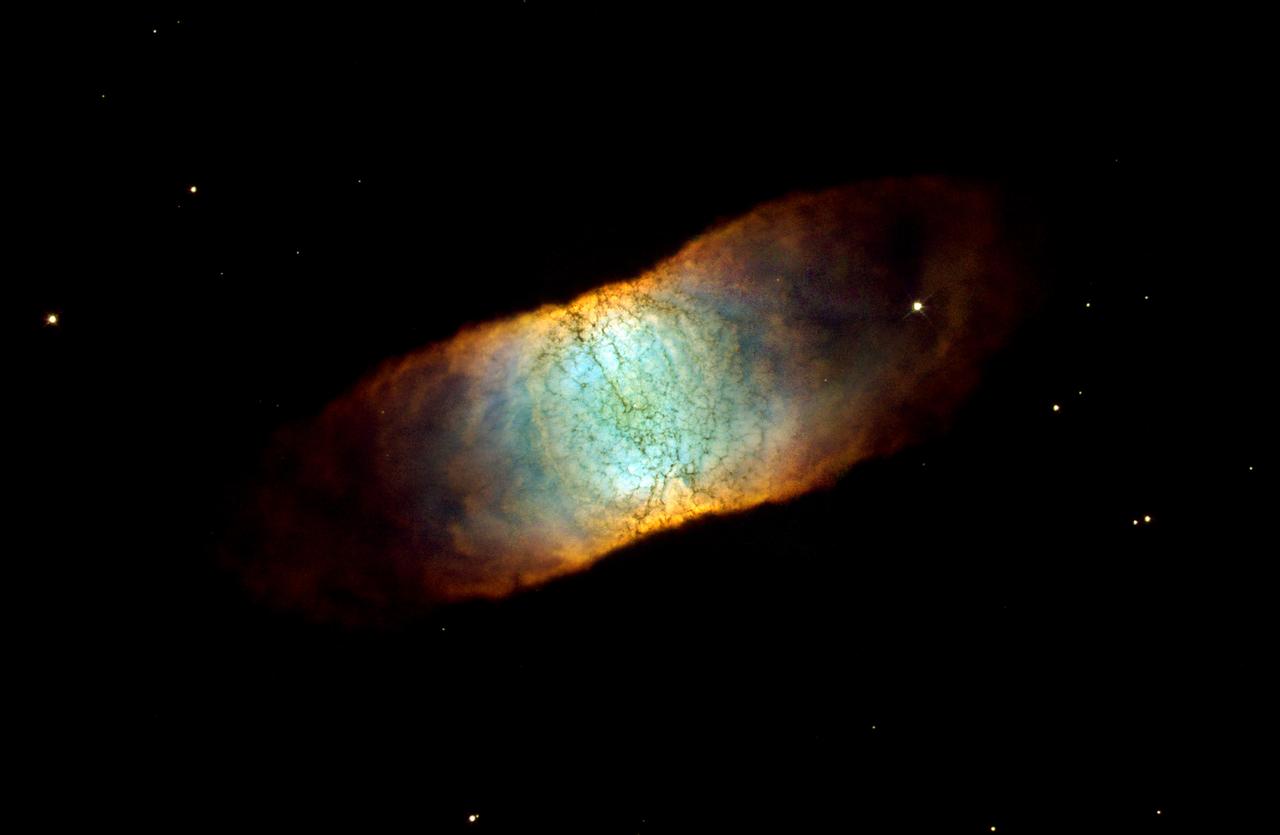
This Hubble Space Telescope image reveals a rainbow of colors in this dying star, called IC 446. Like many other so-called planetary nebulae, IC 4406 exhibits a high degree of symmetry. The nebula's left and right halves are nearly mirror images of the other. If we could fly around IC 446 in a spaceship, we would see that the gas and dust form a vast donut of material streaming outward from the dying star. We do not see the donut shape in this photograph because we are viewing IC 4406 from the Earth-orbiting HST. From this vantage point, we are seeing the side of the donut. This side view allows us to see the intricate tendrils of material that have been compared to the eye's retina. In fact, IC 4406 is dubbed the "Retina Nebula." The donut of material confines the intense radiation coming from the remnant of the dying star. Gas on the inside of the donut is ionized by light from the central star and glows. Light from oxygen atoms is rendered blue in this image; hydrogen is shown as green, and nitrogen as red. The range of color in the final image shows the differences in concentration of these three gases in the nebula. This image is a composite of data taken by HST's Wide Field Planetary Camera 2 in June 2001 and in January 2002 by Bob O'Dell (Vanderbilt University) and collaborators, and in January by the Hubble Heritage Team (STScI). Filters used to create this color image show oxygen, hydrogen, and nitrogen gas glowing in this object.
The image shows a region we see many slope streaks, typically dark features on slopes in the equatorial regions on Mars. They may extend for tens of meters in length and gradually fade away with time as new ones form. The most common hypothesis is that they are generated by dust avalanches that regularly occur on steep slopes exposing fresh dark materials from underneath the brighter dust. There are many types of slope streaks but one of the most recent and significant findings using HiRISE was the discovery of a new type called "recurring slope lineae," or RSL for short. Recent studies suggest that RSL may form through the flow of briny (extremely salty) liquid water that can be stable on the surface of Mars even under current climatic conditions for a limited time in summer when it is relatively warm. How can we distinguish between conventional slope streaks like the ones we see here and RSL? There are many criteria. For instance, RSL are usually smaller in size than regular slope streaks. However, one of the most important conditions is seasonal behavior, since RSL appear to be active only in summer while regular slope streaks can be active anytime of the year. This site is monitored regularly by HiRISE scientists because of the high density of slope streaks and their different sizes and orientations. If we look at a time-lapse sequence, we will see that a new slope streak has indeed formed in the period since April 2016 (and we can note how dark it is in comparison to the others indicating its freshness). However, this period corresponds mainly to the autumn season in this part of Mars, whereas we do not see any major changes in the summer season. This suggests that the feature that developed is a regular slope streak just like all the others in the area. http://photojournal.jpl.nasa.gov/catalog/PIA21272
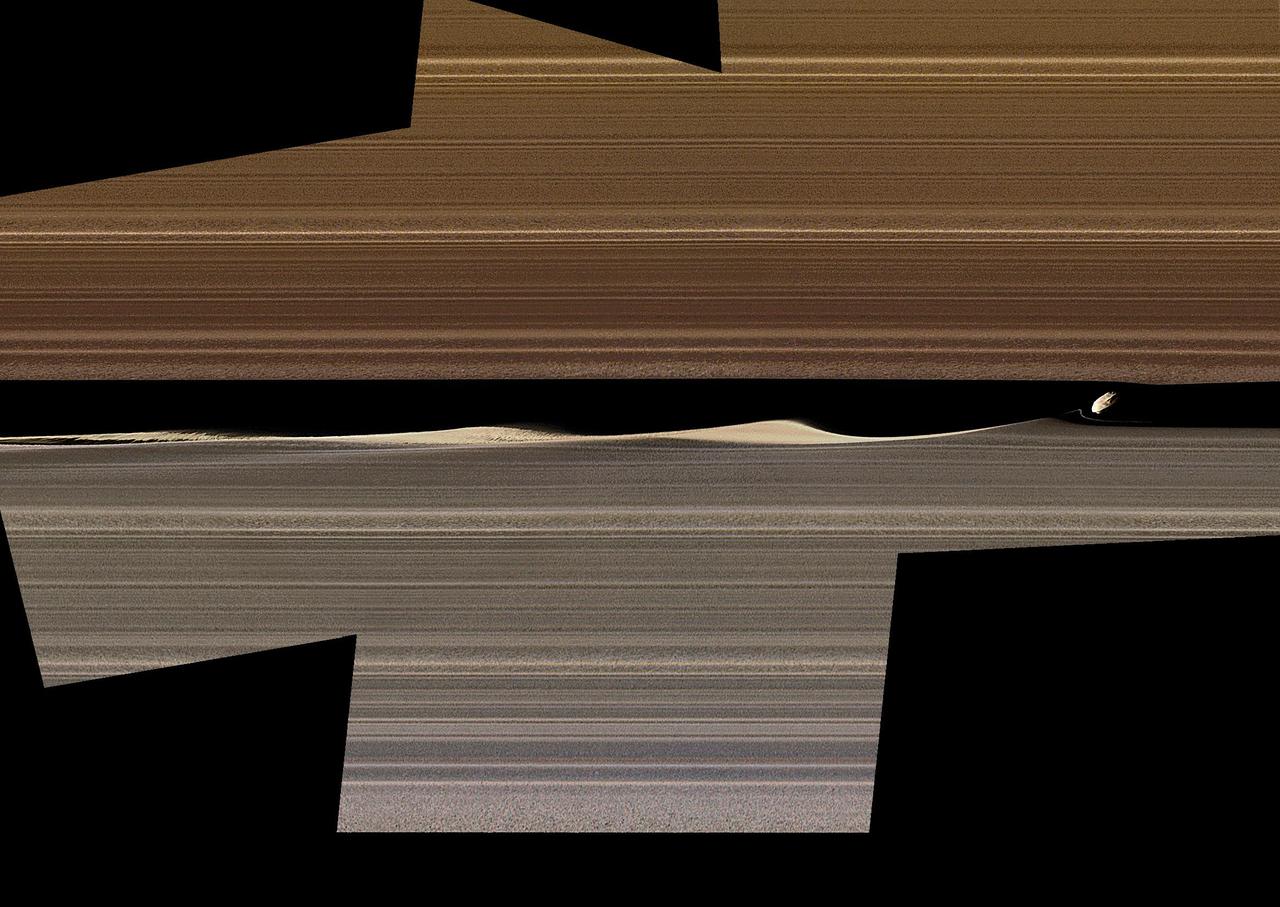
This enhanced-color image mosaic shows Daphnis, one of the moons embedded in Saturn's rings, in the Keeler gap on the sunlit side of the rings. Daphnis is seen kicking up three waves in the gap's outer edge. Three wave crests of diminishing sizes trail the moon. In each successive crest, the shape of the wave changes as the ring particles within the crest interact and collide with each other. A thin strand of ring material to the lower left of Daphnis is newly visible in this image, and there are intricate features that also hadn't been previously observed in the third wave crest downstream (see Figure 1). Cassini was at a very shallow angle above the rings (only about 15 degrees) when this image was taken. The resulting foreshortening makes it difficult to tell the difference in this image between features representing vertical structure and those representing radial, or outward from Saturn, structure within the ring plane. Nonetheless, Cassini imaging scientists have determined that the waves in the gap are largely vertical; compare this to the shadows that they were seen to cast during equinox (see PIA11547, PIA11653, PIA11655 and PIA11656). The thin strand of material is also probably vertical. Daphnis itself is actually five times smaller than the width of the gap, but it looks bigger here because of the foreshortening. The color in this image comes from using Imaging Science Subsystem images obtained by applying different filters to "paint" color onto the black-and-white version of this view previously released as PIA17212. The color of the ring region outward of the Keeler Gap (the "trans-Keeler region," in the lower portion of this image) is noticeably different from the color inward from the gap (upper portion of this image). In visible light, this color difference sharply coincides with the gap, while near-infrared Visible and Infrared Mapping Spectrometer (VIMS) images show some bleeding of the trans-Keeler region into the region inward from the gap. The reasons for the sharp change in color are mysterious, but they probably have more to do with a change in particle sizes and other properties than with a change in composition. The images in this mosaic were taken in visible light, using the Cassini spacecraft narrow-angle camera at a distance of approximately 17,000 miles (28,000 kilometers) from Daphnis and at a Sun-Daphnis-spacecraft angle, or phase angle, of 71 degrees (for the color images, 58 degrees). Image scale is 550 feet (170 meters) per pixel. The image was produced by Tilmann Denk at Freie Universität in Berlin. https://photojournal.jpl.nasa.gov/catalog/PIA23167
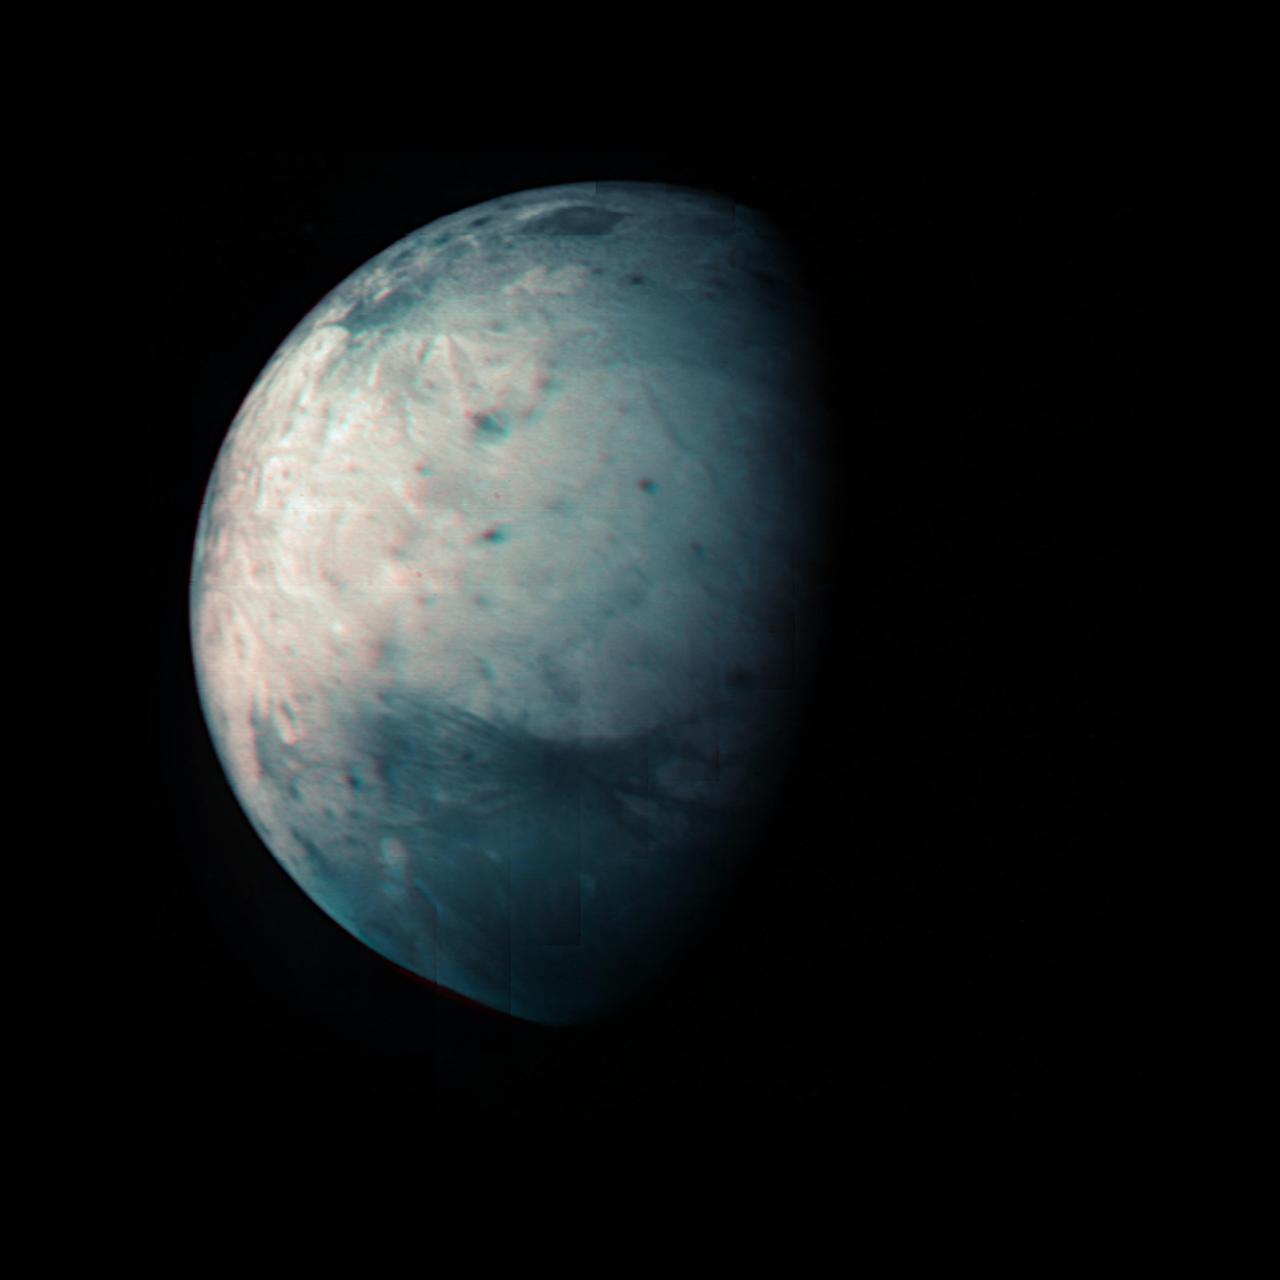
This infrared view of Ganymede was obtained by the Jovian Infrared Auroral Mapper (JIRAM) instrument aboard NASA's Juno spacecraft during its July 20th, 2021, flyby. JIRAM "sees" in infrared light not visible to the human eye, providing information on Ganymede's icy shell and the composition of the ocean of liquid water beneath. It was designed to capture the infrared light emerging from deep inside Jupiter, probing the weather layer down to 30 to 45 miles (50 to 70 kilometers) below Jupiter's cloud tops. During the flyby, Juno came within 31,136 miles (50,109 kilometers) of the icy orb. Together with the previous observational geometries provided, this data gives the opportunity for JIRAM to see different regions for the first time, as well as to compare the diversity in composition between the low and high latitudes. Because Ganymede has no atmosphere to impede the solar wind, or progress of charged particles from the Sun, the surface at its poles is constantly being bombarded by plasma from Jupiter's gigantic magnetosphere. The bombardment has a dramatic effect on Ganymede's ice: Ice is crystallized by heating at the equator and amorphized by particle radiation at the polar regions. https://photojournal.jpl.nasa.gov/catalog/PIA24791
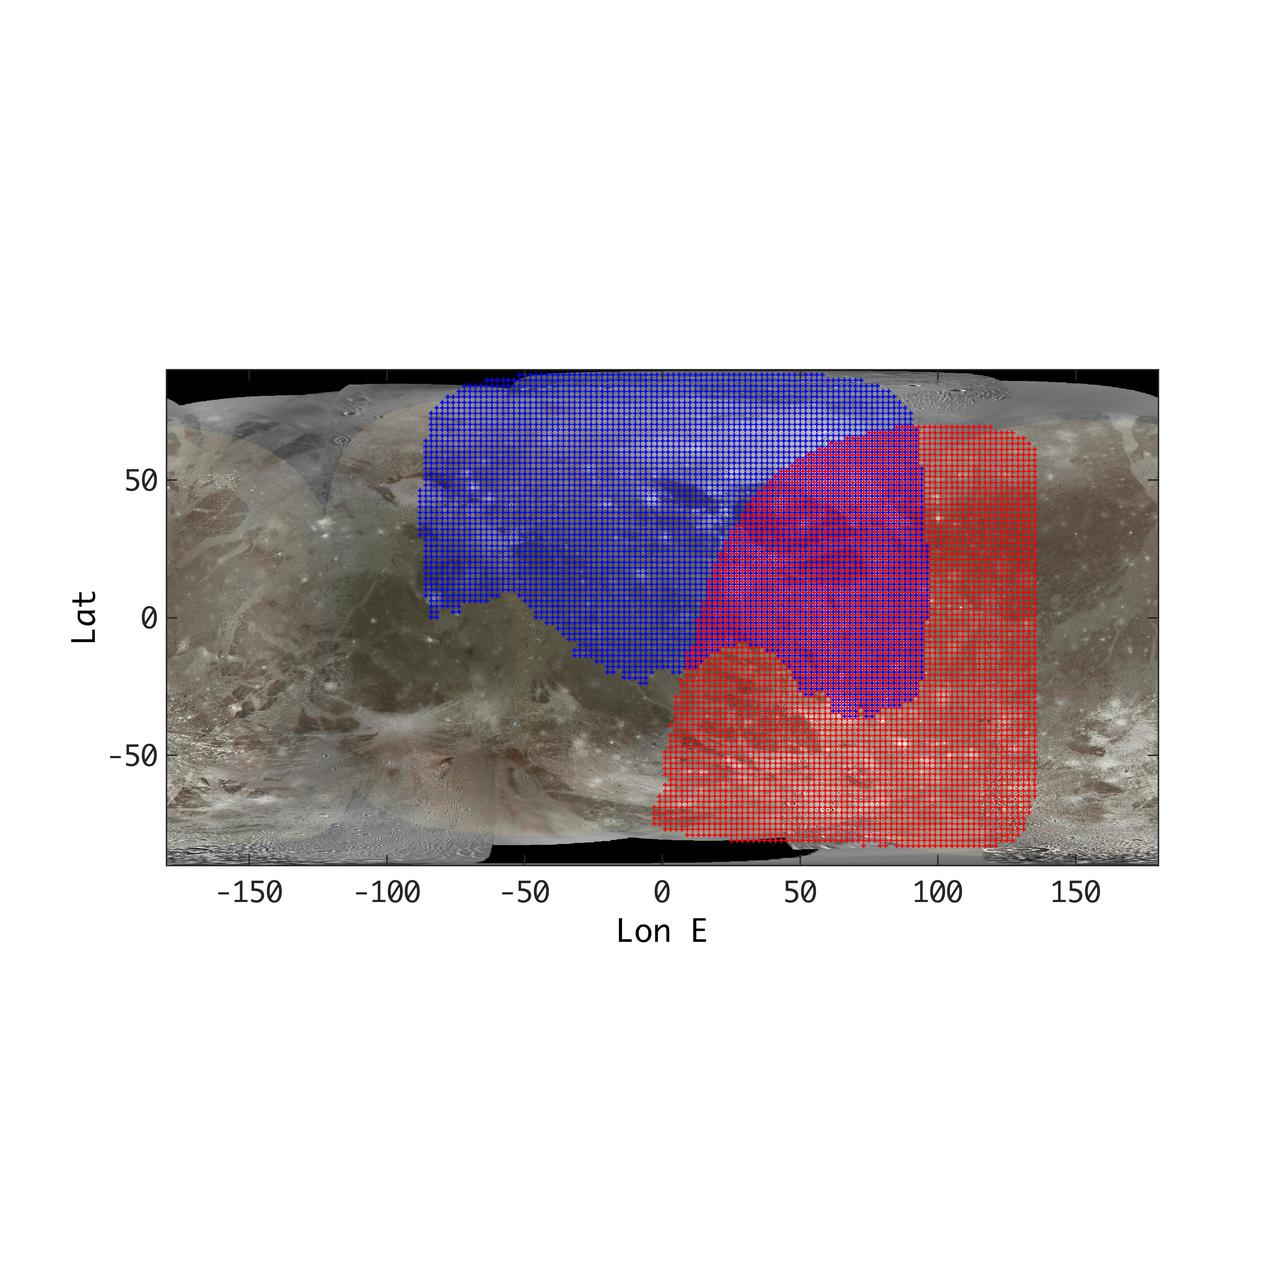
This annotated map of depicts the areas on the surface of Jupiter's moon Ganymede that were imaged by the Jovian Infrared Auroral Mapper (JIRAM) instrument aboard NASA's Juno spacecraft during two close approaches of the moon. The region shaded in blue depicts the area JIRAM covered as Juno flew past at a distance of 62,000 miles (100,000 kilometers) on Dec. 26, 2019. The infrared camera took 40 images during the encounter. The region shaded in red illustrates JIRAM coverage during the July 20, 2021, flyby, when Juno came within 31,000 miles (50,000 kilometers) of Ganymede's surface and JIRAM took 14 infrared images. The different observational geometry of the flybys provided an opportunity to see the north polar region for the first time as well as compare the diversity in composition between Ganymede's low and high latitudes. JIRAM "sees" in infrared light not visible to the human eye, providing information on Ganymede's icy shell and the composition of the ocean of liquid water beneath. It was designed to capture the infrared light emerging from deep inside Jupiter, probing the weather layer down to 30 to 45 miles (50 to 70 kilometers) below Jupiter's cloud tops. https://photojournal.jpl.nasa.gov/catalog/PIA24792
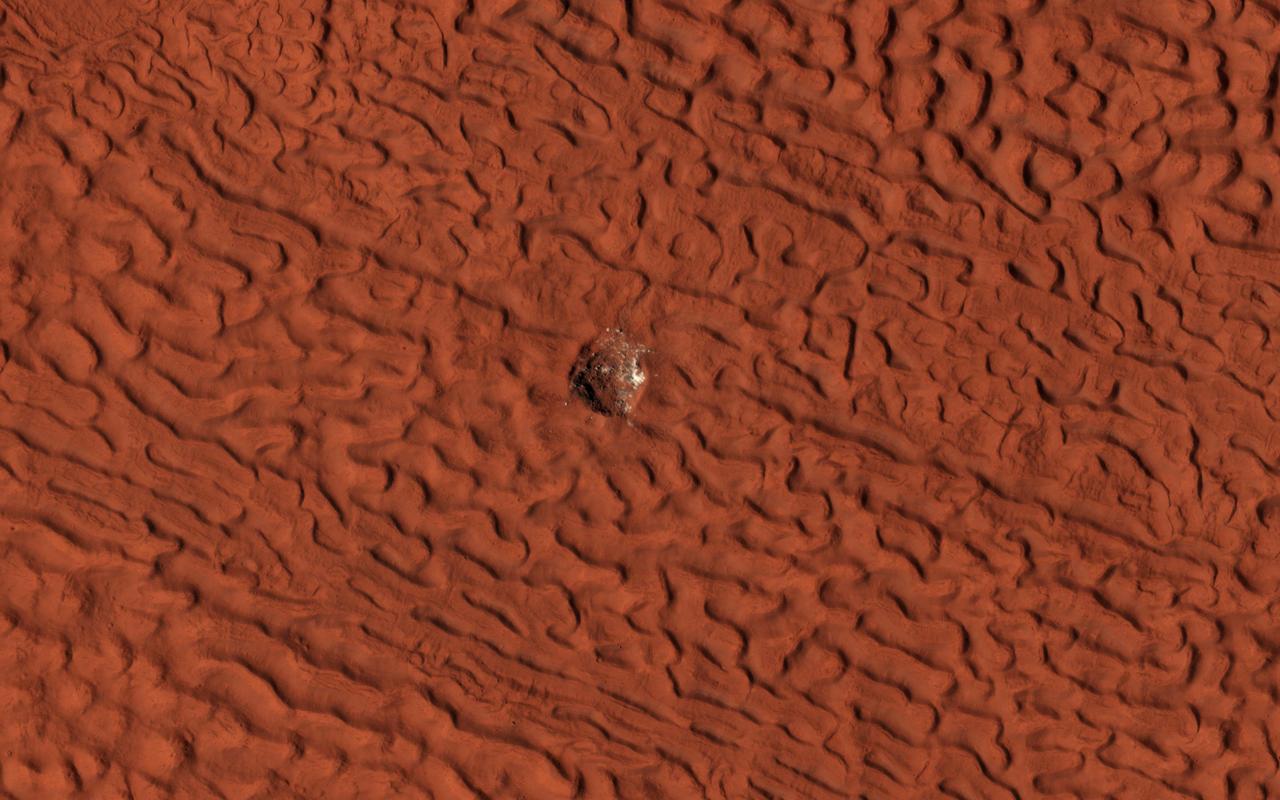
This small 2 kilometer-wide crater was sitting around, minding its own business when a meteoroid struck the ground just to the west and created a new, larger crater almost 10 kilometers in diameter (not pictured). The ejecta spraying out of the new crater landed back on the ground and then continued to flow away from the new crater, and the smaller crater was in the way of that muddy flow. You can see where much of the muddy material flowed around the crater's uplifted rim and forms a squiggly ridge, but you can also see where the mud flow slid over the rim and ponded down in the bottom of the crater. One question we don't know the answer to is: "how wet was the muddy ejecta?" Ongoing observations like this and laboratory-based experiments are trying to find the answer to that question. This image also illustrates a common theme in geology, namely, the law of superposition. Because the crater has been affected by ejecta from the larger crater to the west, the small crater had to be there first and then the second, larger crater and its ejecta had to form. This allows planetary geologists to decipher the relative ages of different landforms. Because a central goal of geology is to understand past events from present-day clues, geology is sometimes compared to forensic science. http://photojournal.jpl.nasa.gov/catalog/PIA13181
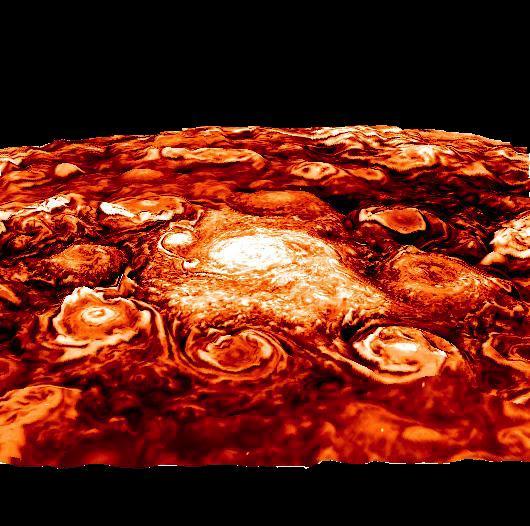
This computer-generated image is based on an infrared image of Jupiter's north polar region that was acquired on February 2, 2017, by the Jovian Infrared Auroral Mapper (JIRAM) instrument aboard Juno during the spacecraft's fourth pass over Jupiter. The image shows the structure of the cyclonic pattern observed over Jupiter's North pole: a central cyclone surrounded by eight circumpolar cyclones with diameters ranging from 2,500 to 2,900 miles (4,000 to 4,600 kilometers) across. JIRAM is able to collect images in the infrared wavelengths around 5 micrometers (µm) by measuring the intensity of the heat coming out of the planet. The heat from a planet that is radiated into space is called the radiance. This image is an enhancement of the original JIRAM image. In order to give the picture a 3-D shape, the enhancement starts from the idea that where the radiance has its highest value, there are no clouds and JIRAM can see deeper into the atmosphere. Consequently, all the other areas of the image are originally shaded more or less by clouds of different thickness. Then, to create these pictures, the originals have been inverted to give the thicker clouds the whitish color and the third dimension as the clouds we normally see here in the Earth's atmosphere. https://photojournal.jpl.nasa.gov/catalog/PIA22336

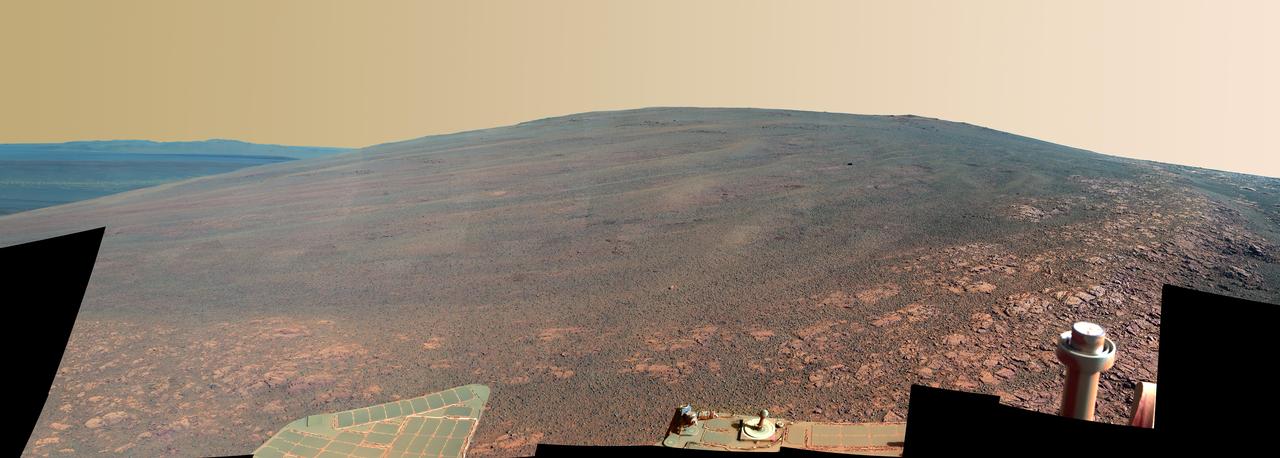
NASA's Mars Exploration Rover Opportunity worked for 30 months on a raised segment of Endeavour Crater's rim called "Cape Tribulation" until departing that segment in mid-April 2017, southbound toward a new destination. This view looks back at the southern end of Cape Tribulation from about two football fields' distance away. In this version of the scene the landscape is presented in enhanced color to make differences in surface materials more easily visible. The component images were taken by the rover's Panoramic Camera (Pancam) on April 21, during the 4,707th Martian day, or sol, of Opportunity's mission on Mars. Wheel tracks can be traced back to see the rover's route as it descended and departed Cape Tribulation. For scale, the distance between the two parallel tracks is about 3.3 feet (1 meter). The rover drove from the foot of Cape Tribulation to the head of "Perseverance Valley" in seven drives totaling about one-fifth of a mile (one-third of a kilometer). The elevation difference between the highest point visible in this scene and the rover's location when the images were taken is about 180 feet (55 meters). This view looks northward. It merges exposures taken through three of the Pancam's color filters, centered on wavelengths of 753 nanometers (near-infrared), 535 nanometers (green) and 432 nanometers (violet). https://photojournal.jpl.nasa.gov/catalog/PIA21498
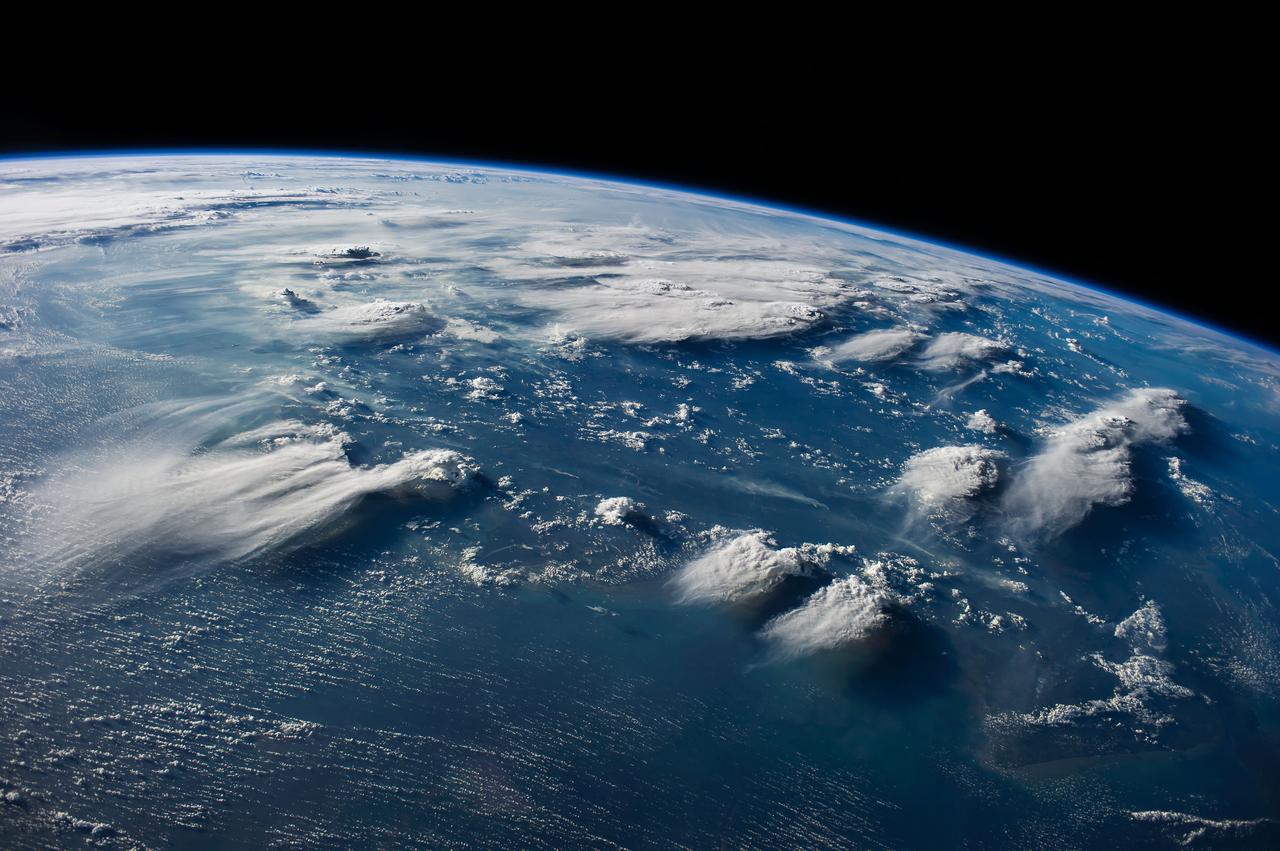
ISS040-E-088891 (5 Aug. 2014) --- Thunderheads near Borneo, Indonesia are featured in this image photographed by an Expedition 40 crew member on the International Space Station. Late afternoon sun casts long shadows from high thunderhead anvils over southern Borneo. Crews aboard the space station have recently concentrated on panoramic views of clouds?taken with lenses similar to the focal length of the human eye. These images reveal the kinds of views crews see -- huge areas of the planet, with a strong three-dimensional sense of what it is like to fly 350 kilometers above Earth. Winds usually blow in different directions at different altitudes. High-altitude winds are clearly sweeping the tops off the many tallest thunderclouds, generating long anvils of diffuse cirrus plumes that trail south. At low levels, ?streets? of white dots -- fair-weather cumulus clouds -- are aligned with west-moving winds (lower left). Small smoke plumes from forest fires onshore are also aligned west. Storm formation near the horizon -- more than 1,000 kilometers away (center) -- is assisted by air currents rising over the central mountains of Borneo.
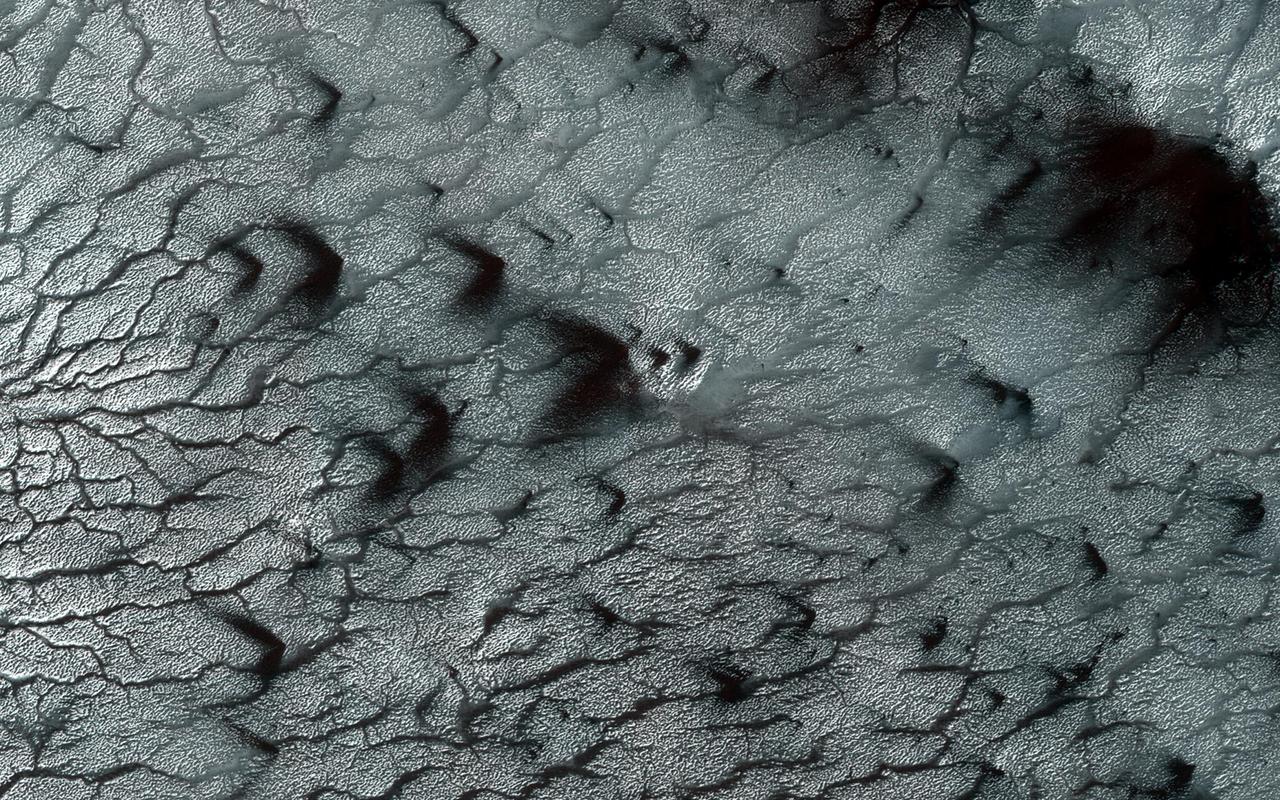
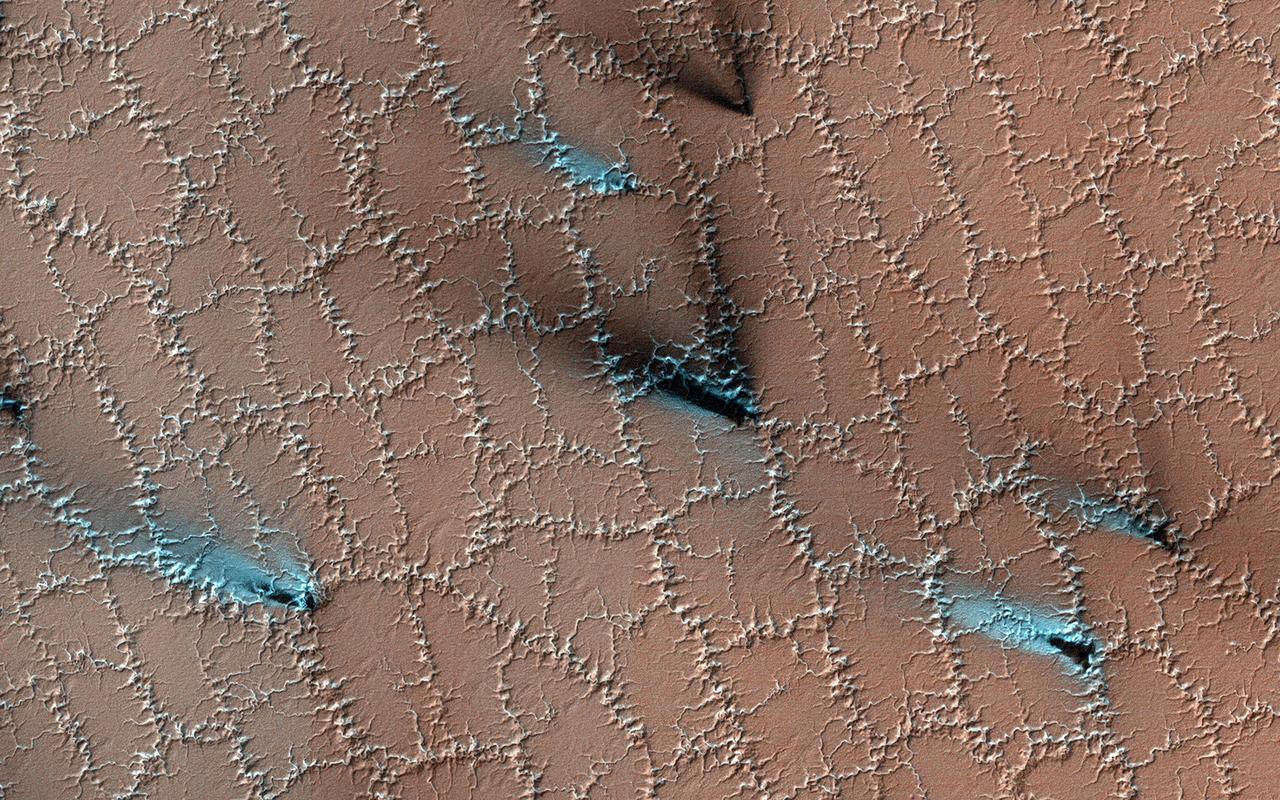
It's spring in the Northern Hemisphere of Mars (when this image was taken), and this area was recently completely covered by the seasonal frost cap. Here, we see polygonal patterns that are highlighted by carbon dioxide frost that has not entirely sublimed away. These organized patterns are likely caused by differences in the soil (regolith) characteristics such as grain size, density, even grain-shape and orientation in the underlying landforms and geologic materials. Variations in these characteristics strongly influence the strength of the ice-rich permafrost. This gives a preferred orientation to the stress field that produces the polygonal patterns. In this case, there appears to have been a meander in a fluvial channel in which sediments that differ from the native soil were deposited. The physical properties of these sediments probably change near the channel banks where flow rate drops off. Additionally, a high ice content might have resulted from a sediment-rich slurry flow that froze in place. Higher ice content will produce a weaker stress field and larger polygons, more so than just changes in grain size or orientation. https://photojournal.jpl.nasa.gov/catalog/PIA23581
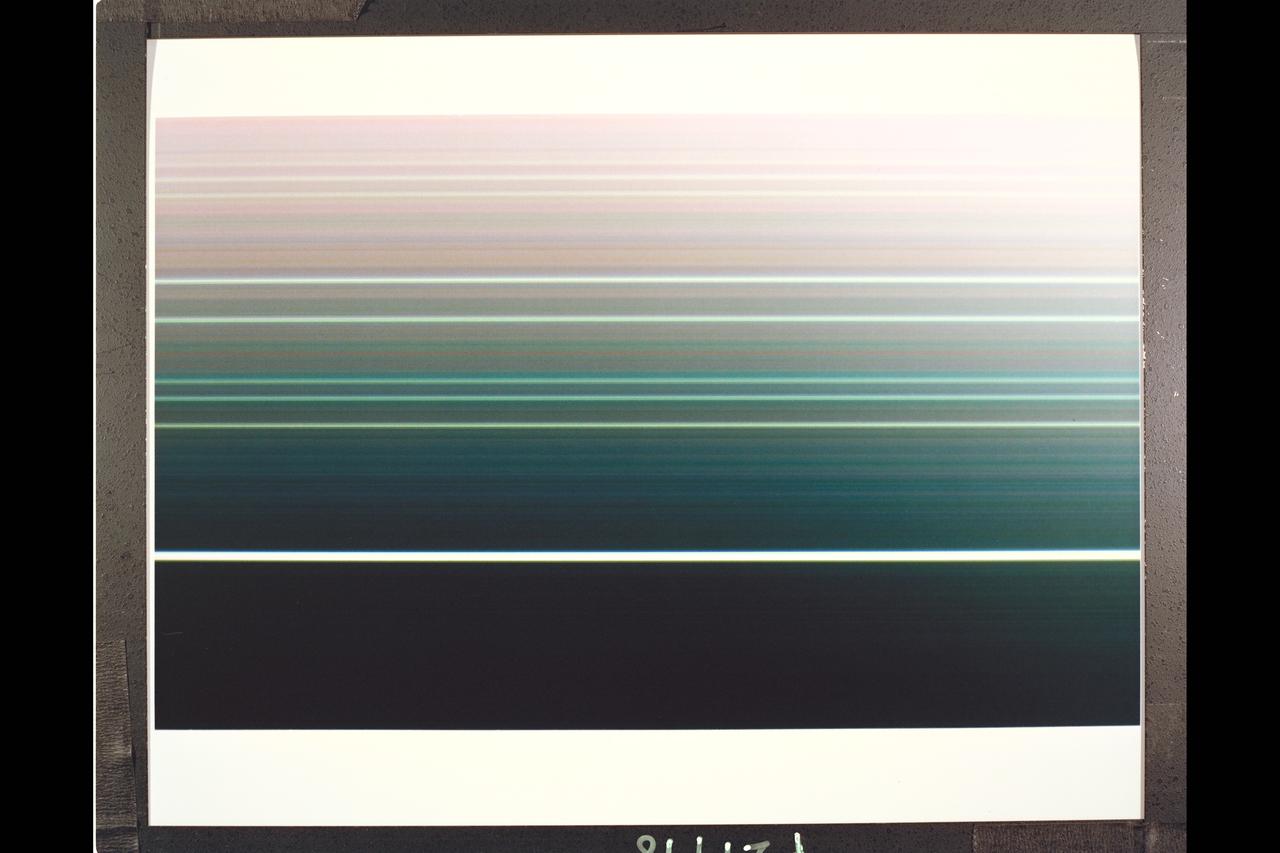
4.17 million miles (2.59 million miles) Resolution : 40 km. (25mi.) P-29498C This false color, Voyager 2 composite view of all nine of Uranian rings was made from six 15 second exposures through the narrow angle camera. The special computer processing used to extract color information from the extremely dark and faint rings, causing the even fainter, pastel lines seen between the rings. Two images, each in the green, clear, & violet filters, were added together and averaged to find the proper color difference between the rings. the final image was made from these three color averages and represents an enhanced, false color view. The image shows that the brightest, or Epsilon ring, at top ,is neutral in color, with the fainter eight other rings showing color differences between them. moving down, toward, Uranus, we see the Delta, Gamma, & Eta rings in shades of blue and green; the Beta & Alpha rings in somewhat lighter tones; and then finally, a set of three, known simply as 4, 5, & 6 rings, in faint off-white tones. Scientists will use this color information to try to understand the nature and origin of the ring material.
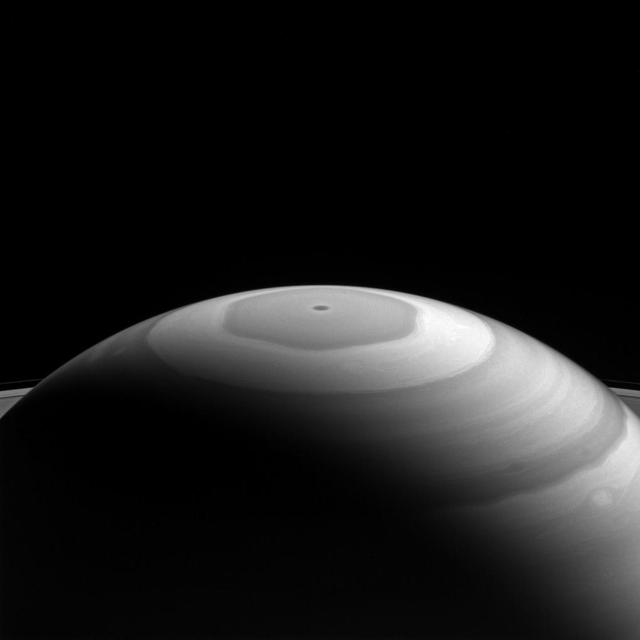
Saturn's north polar region displays its beautiful bands and swirls, which somewhat resemble the brushwork in a watercolor painting. Each latitudinal band represents air flowing at different speeds, and clouds at different heights, compared to neighboring bands. Where they meet and flow past each other, the bands' interactions produce many eddies and swirls. The northern polar region of Saturn is dominated by the famous hexagon shape (see PIA11682) which itself circumscribes the northern polar vortex -- seen as a dark spot at the planet's pole in the above image-- which is understood to the be eye of a hurricane-like storm (PIA14946). This view looks toward the sunlit side of the rings from about 20 degrees above the ring plane. The image was taken with the Cassini spacecraft wide-angle camera on Sept. 5, 2016 using a spectral filter which preferentially admits wavelengths of near-infrared light centered at 728 nanometers. The view was obtained at a distance of approximately 890,000 miles (1.4 million kilometers) from Saturn. Image scale is 53 miles (86 kilometers) per pixel. http://photojournal.jpl.nasa.gov/catalog/PIA20507
These strange features in Syria Planum are still being widely debated. They have the same general form as transverse aeolian ridges (TARs) elsewhere on Mars; windblown deposits that are common in the Martian tropics. Their height and spacing are similar to the more familiar looking TARs in other places, and they are similarly bright. Unless Nature is perverse, they were both made by the same process. Yet the TARs here in Syria Planum appear different than typical TARs elsewhere on the planet. They have blunt edges, in contrast to the tapering ends of typical TARs. The ridge crests are serrated, unlike the smooth crests of most TARs. They are layered on their upwind faces and scoured on the downwind sides, whereas TARs are usually smooth and symmetric. Why are these TARs bizarre? A possible answer is that the features here in Syria Planum are at a different stage of evolution than TARs elsewhere, and are either younger or older than typical TARs. We can look at an enhanced color cutout to see whether this can be the case. http://photojournal.jpl.nasa.gov/catalog/PIA19942
This still from an animation of four images shows Jupiter in infrared light as seen by NASA InfraRed Telescope Facility, or IRTF, on May 16, 2015. The observations were obtained in support of NASA's Juno mission by a team headed by Juno scientist Glenn Orton. Observations like these are helping to provide spatial and temporal context for what the science instruments on board Juno will see once the spacecraft arrives at the giant planet in mid-2016. Juno will pass very close to the planet -- coming within just a few thousand miles (or kilometers) of the cloud tops every two weeks. That up-close vantage point will be balanced by distant views of the planet that show how different features move and change over time in relation to each other. The IRTF is a three-meter telescope, optimized for infrared observations, and located at the summit of Mauna Kea, Hawaii. The observatory is operated and managed for NASA by the University of Hawaii Institute for Astronomy, Honolulu. http://photojournal.jpl.nasa.gov/catalog/PIA19640
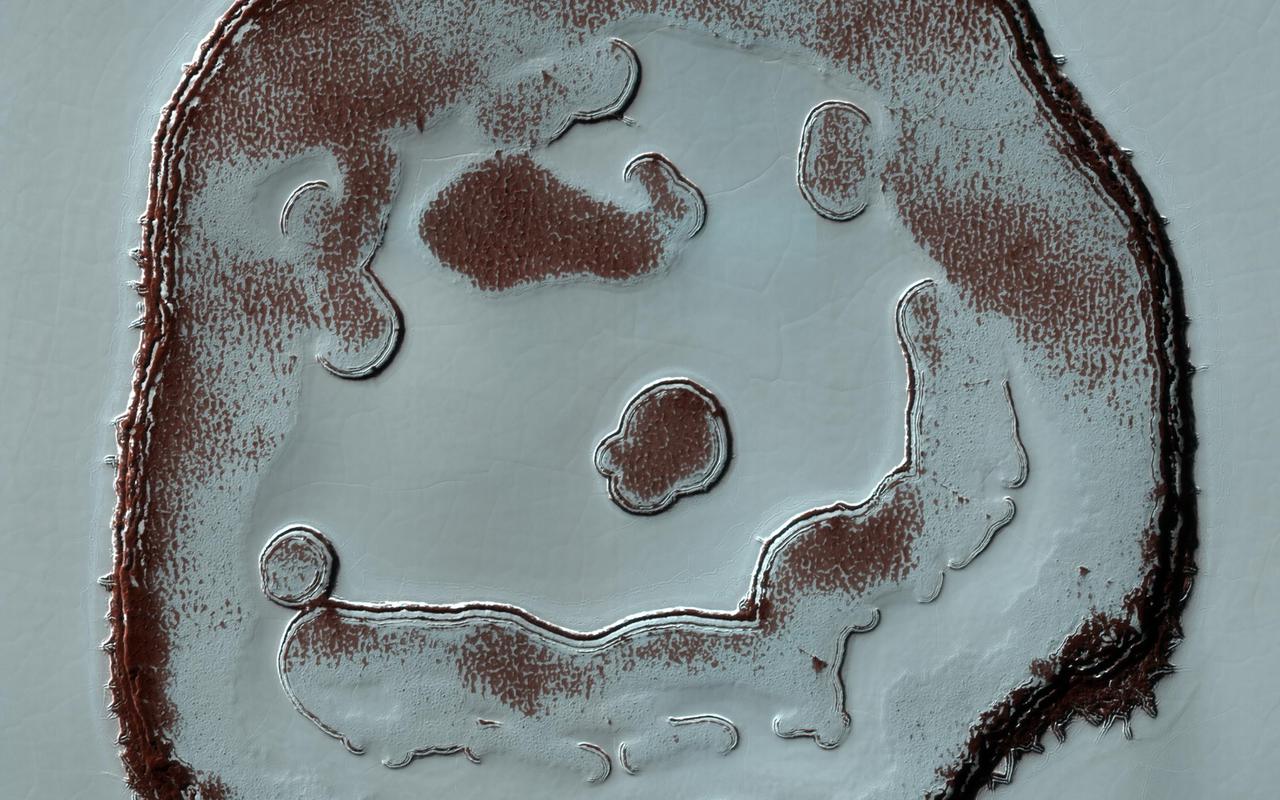
We've monitored the so-called Happy Face Crater in the south polar region of Mars for almost a decade. Two images that we took, one in 2011 and the other in 2020, at roughly the same season, show color variations that are due to different amounts of bright frost over darker red ground. The "blobby" features in the polar cap are due to the sun sublimating away the carbon dioxide into these round patterns. You can see how nine years of this thermal erosion have made the "mouth" of the face larger. The "nose" consisted of a two circular depressions in 2011, and in 2020, those two depressions have grown larger and merged. Measuring these changes throughout the Martian year help scientists understand the annual deposition and removal of polar frost, and monitoring these sites over long periods helps us understand longer term climate trends on the Red Planet. https://photojournal.jpl.nasa.gov/catalog/PIA24389
Both water and dry ice have a major role in sculpting Mars' surface at high latitudes. Water ice frozen in the soil splits the ground into polygons. Erosion of the channels forming the boundaries of the polygons by dry ice sublimating in the spring adds plenty of twists and turns to them. Spring activity is visible as the layer of translucent dry ice coating the surface develops vents that allow gas to escape. The gas carries along fine particles of material from the surface further eroding the channels. The particles drop to the surface in dark fan-shaped deposits. Sometimes the dark particles sink into the dry ice, leaving bright marks where the fans were originally deposited. Often the vent closes, then opens again, so we see two or more fans originating from the same spot but oriented in different directions as the wind changes. https://photojournal.jpl.nasa.gov/catalog/PIA25357
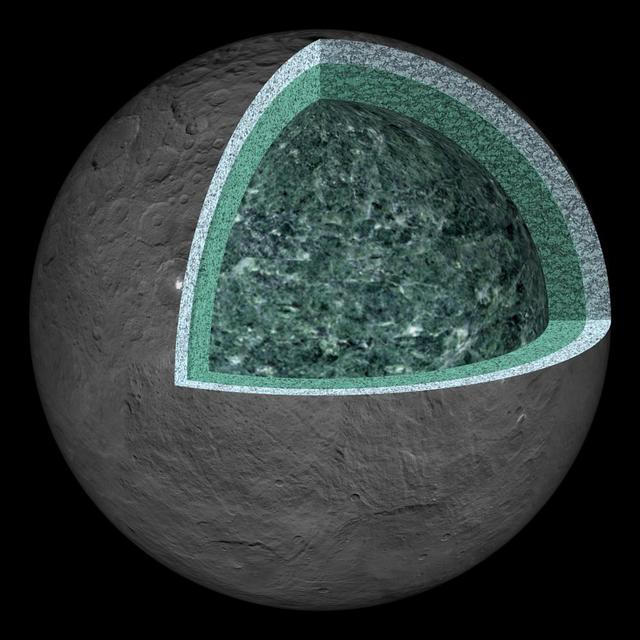
This artist's concept summarizes our understanding of how the inside of Ceres could be structured, based on the data returned by the NASA's Dawn mission. Using information about Ceres' gravity and topography, scientists found that Ceres is "differentiated," which means that it has compositionally distinct layers at different depths. The most internal layer, the "mantle" is dominated by hydrated rocks, like clays. The external layer, the 24.85-mile (40-kilometer) thick crust, is a mixture of ice, salts, and hydrated minerals. Between the two is a layer that may contain a little bit of liquid rich in salts, called brine. It extends down at least 62 miles (100 kilometers). The Dawn observations cannot "see" below about 62 miles (100 kilometers) in depth. Hence, it is not possible to tell if Ceres' deep interior contains more liquid or a core of dense material rich in metal. https://photojournal.jpl.nasa.gov/catalog/PIA22660
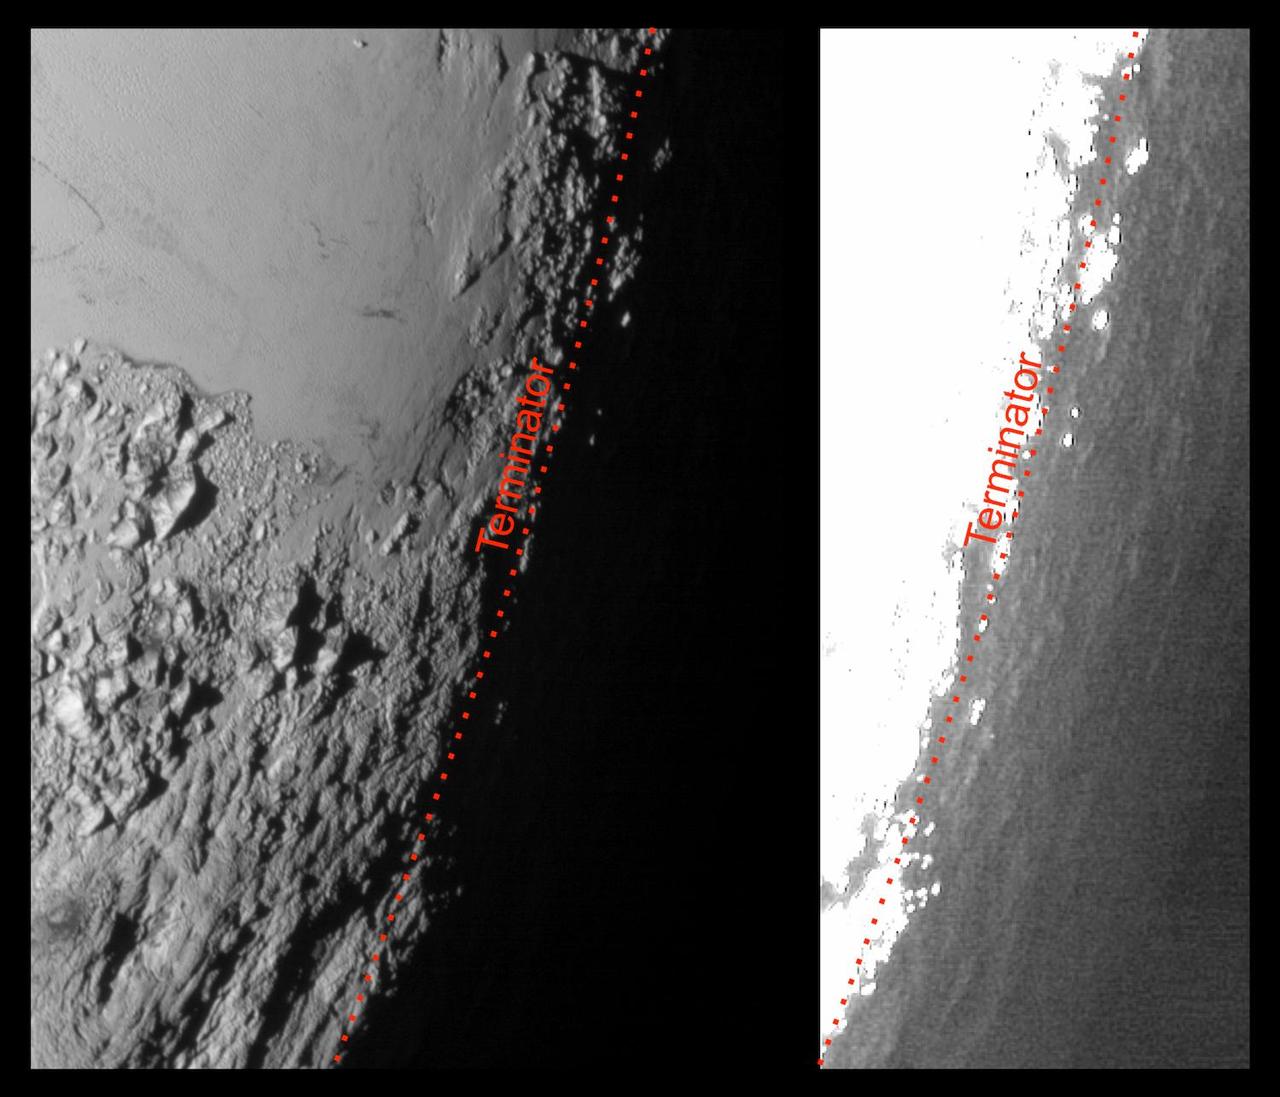
This image of Pluto from NASA's New Horizons spacecraft, processed in two different ways, shows how Pluto's bright, high-altitude atmospheric haze produces a twilight that softly illuminates the surface before sunrise and after sunset, allowing the sensitive cameras on New Horizons to see details in nighttime regions that would otherwise be invisible. The right-hand version of the image has been greatly brightened to bring out faint details of rugged haze-lit topography beyond Pluto's terminator, which is the line separating day and night. The image was taken as New Horizons flew past Pluto on July 14, 2015, from a distance of 50,000 miles (80,000 kilometers). http://photojournal.jpl.nasa.gov/catalog/PIA19931
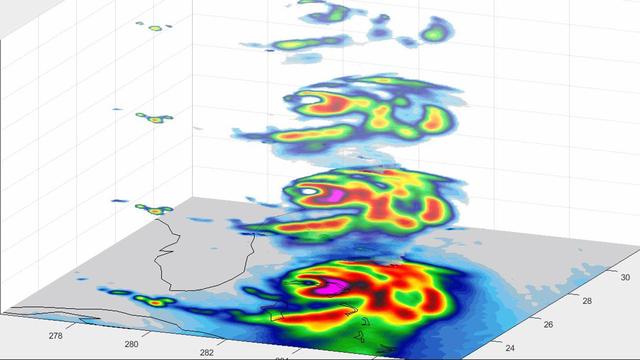
In this animation, TEMPEST-D — a weather-observing satellite the size of a cereal box — captured imagery of Hurricane Dorian off the coast of Florida at 2 a.m. EDT on Sep. 3, 2019 (11 p.m. PDT on Sept. 2, 2019). At a vantage point 250 miles (400 kilometers) above the storm, the CubeSat used its miniaturized radio-wave-based instrument to see through the clouds, revealing different depths of the hurricane with areas with heavy rainfall and moisture being pulled into the storm. The green colors indicate moisture spiraling into the storm's center, and the yellow, red and pink areas correspond to the most intense rainfall. TEMPEST-D — short for Temporal Experiment for Storms and Tropical Systems Demonstration — is an experiment in shrinking weather satellites to a size that makes them inexpensive enough to produce in multiples. The goal is eventual real-time storm coverage with many small satellites that can track storms around the world. Movie available at https://photojournal.jpl.nasa.gov/catalog/PIA23431
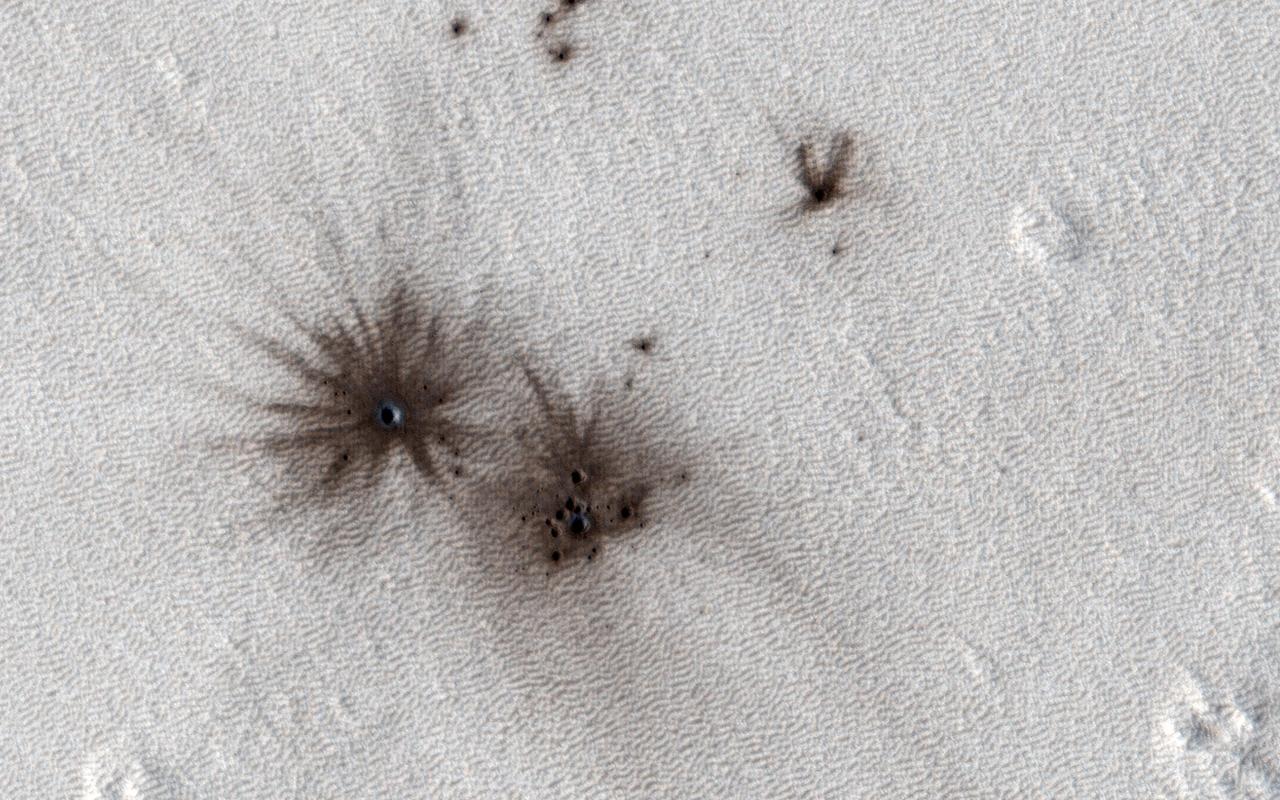
HiRISE and the Context Camera (CTX, also on board the Mars Reconnaissance Orbiter) are always on the lookout for new impact craters. New impacts can be identified by comparing images of the same region taken at different times (typically years apart) and looking for visual clues of recent impacts. CTX is more adept at identifying new impacts because of its larger and repeated surface coverage, but HiRISE allows us to study those impacts in higher resolution. In this image, we can see multiple dark spots corresponding to numerous new craters. We can also identify a slightly larger crater, and a number of smaller ones, particularly in a cluster next to it. That clustering gives us the first indication that these craters were formed in a single event. As the impactor was falling towards Mars, the friction with the atmosphere led to the body fragmenting into smaller pieces shortly before striking the surface creating this notable pattern. https://photojournal.jpl.nasa.gov/catalog/PIA26322
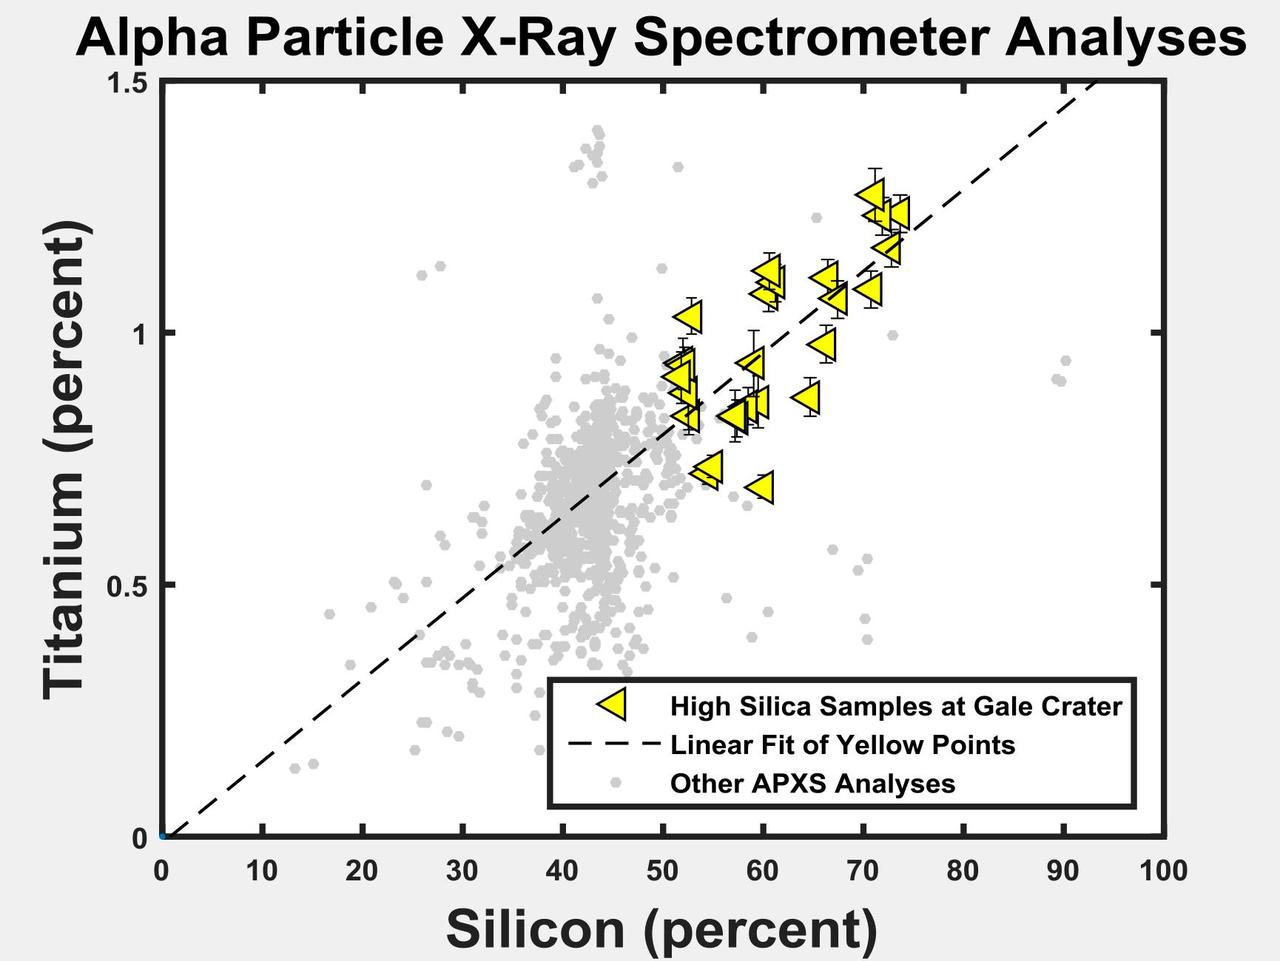
The yellow triangles on this graph indicate concentrations of the elements titanium and silicon in selected rock targets with high silica content analyzed by the Alpha Particle X-ray Spectrometer (APXS) instrument on NASA's Curiosity rover in Mars' Gale Crater. The pattern shows a correlation between enriched silicon content and enriched titanium content. Titanium is difficult to mobilize in weathering environments, and this correlation suggests that both titanium and silicon remain as the residue of acidic weathering. Ongoing research aims to distinguish between that possible explanation for silicon enrichment and an alternative of mobilized silicon being added to the site (see PIA20275). As a general comparison with these selected high-silica targets in Gale Crater, the gray dots in the graph show the range of titanium and silicon concentrations in all Martian targets analyzed by APXS instruments on three Mars rovers at three different areas of Mars. http://photojournal.jpl.nasa.gov/catalog/PIA20274
![“Discipline is one of the things that they instill with you [in the military.] All the way starting in boot camp, [the goal] is doing the right thing when nobody's looking. Integrity. Whenever you're in boot camp, they always say, ‘it's too easy.’ It's just too easy to follow the rules, read the book, read the regulations, and that's probably why I enjoy contracting. I like reading the regulations and following the regulations. …[Now that I work for Safety and Mission Assurance,] it's really cool to read everything about the different types of the scenarios. I always get to see the task orders and the type of work that is going on to keep people safe on the ground and in the air.” NASA Contract Specialist at NASA’s Goddard Space Flight Center (GSFC), Miranda Meyer, poses for a portrait, Wednesday, Feb. 7, 2024 at GSFC in Greenbelt, Maryland. Photo Credit: (NASA/Thalia Patrinos)](https://images-assets.nasa.gov/image/NHQ202402070015/NHQ202402070015~medium.jpg)
“Discipline is one of the things that they instill with you [in the military.] All the way starting in boot camp, [the goal] is doing the right thing when nobody's looking. Integrity. Whenever you're in boot camp, they always say, ‘it's too easy.’ It's just too easy to follow the rules, read the book, read the regulations, and that's probably why I enjoy contracting. I like reading the regulations and following the regulations. …[Now that I work for Safety and Mission Assurance,] it's really cool to read everything about the different types of the scenarios. I always get to see the task orders and the type of work that is going on to keep people safe on the ground and in the air.” NASA Contract Specialist at NASA’s Goddard Space Flight Center (GSFC), Miranda Meyer, poses for a portrait, Wednesday, Feb. 7, 2024 at GSFC in Greenbelt, Maryland. Photo Credit: (NASA/Thalia Patrinos)
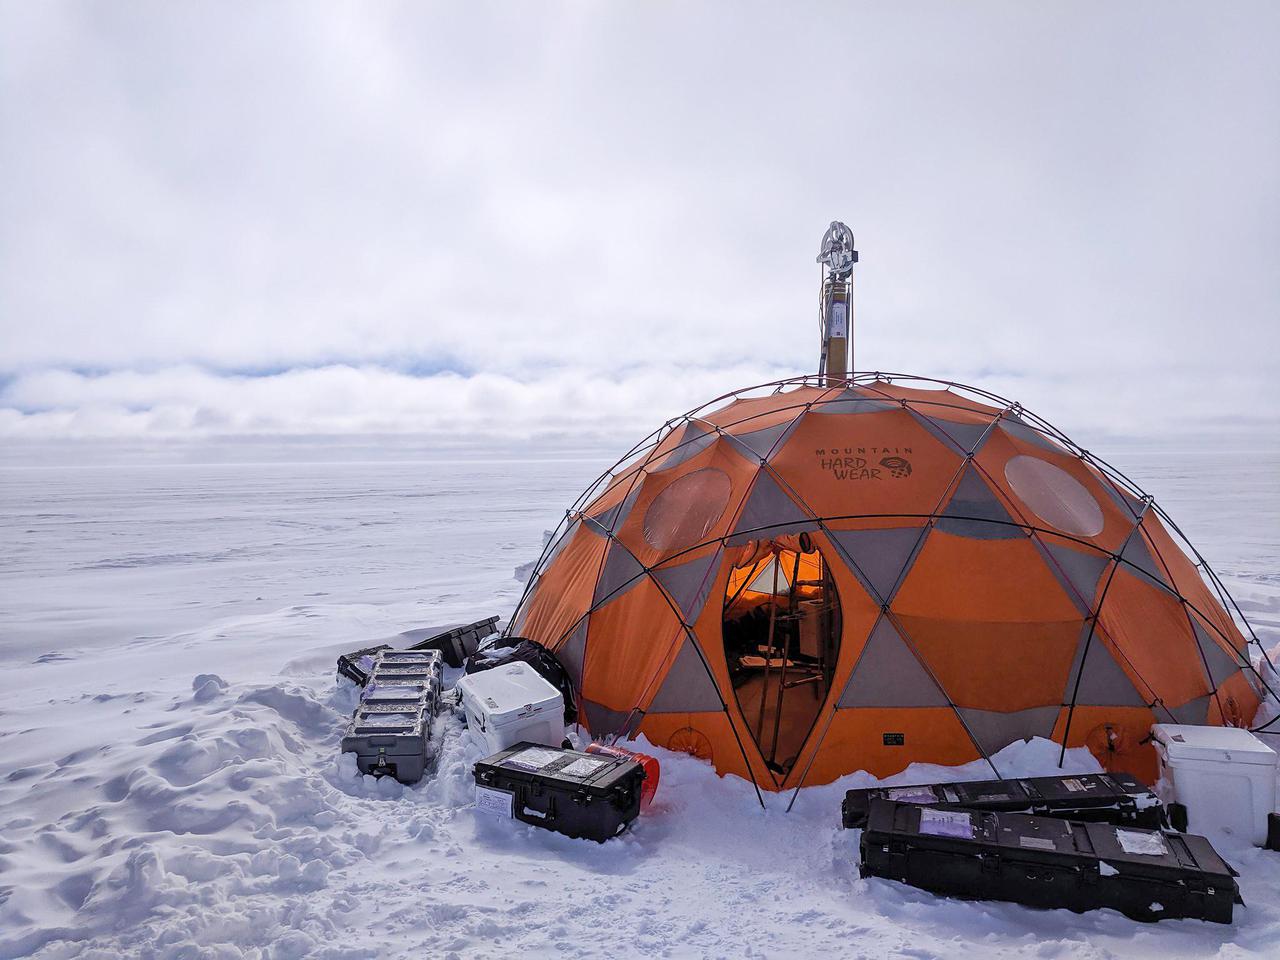
During 2019 field tests near Greenland's Summit Station, a high-elevation remote observing station, the WATSON (Wireline Analysis Tool for the Subsurface Observation of Northern ice sheets) instrument is put through its paces to seek out signs of life, or biosignatures, 360 feet (110 meters) down a borehole. In this photograph, the winch that holds the drill pokes out the top of the drill tent. WATSON could one day be launched aboard a robotic mission to seek out biosignatures on the ocean moons of Enceladus, Europa, or even Titan. The WATSON team hopes to test the instrument in a variety of cold locations on Earth to see how the distribution and variety of biosignatures change depending on where they are. By testing WATSON in different Earth analogs — areas on Earth that can stand in for those on other worlds — scientists would be able to better understand the chemical fingerprints of any biosignatures detected on other worlds. https://photojournal.jpl.nasa.gov/catalog/PIA24169
In the high bay of Kennedy Space Center's Space Station Processing Facility, Chris Hardcastle, center, of Stinger-Ghaffarian Technologies performs a sharp edge inspection of the integrated Total and Spectral Solar Irradiance Sensor-1 (TSIS-1) payload and the EXPRESS Pallet Adapter. Hardcastle is joined by Dwayne Swieter, left, and Norm Perish, right, TSIS-1 payload team members from the Laboratory for Atmospheric and Space Physics, a Research Institute at the University of Colorado (Boulder). TSIS-1 is designed to measure the Sun's energy input into Earth by seeing how it is distributed across different wavelengths of light. These measurements help scientists establish Earth's total energy and how our planet's atmosphere responds to changes in the Sun's energy output. TSIS-1 will launch on SpaceX's 13th commercial resupply mission to the International Space Station.
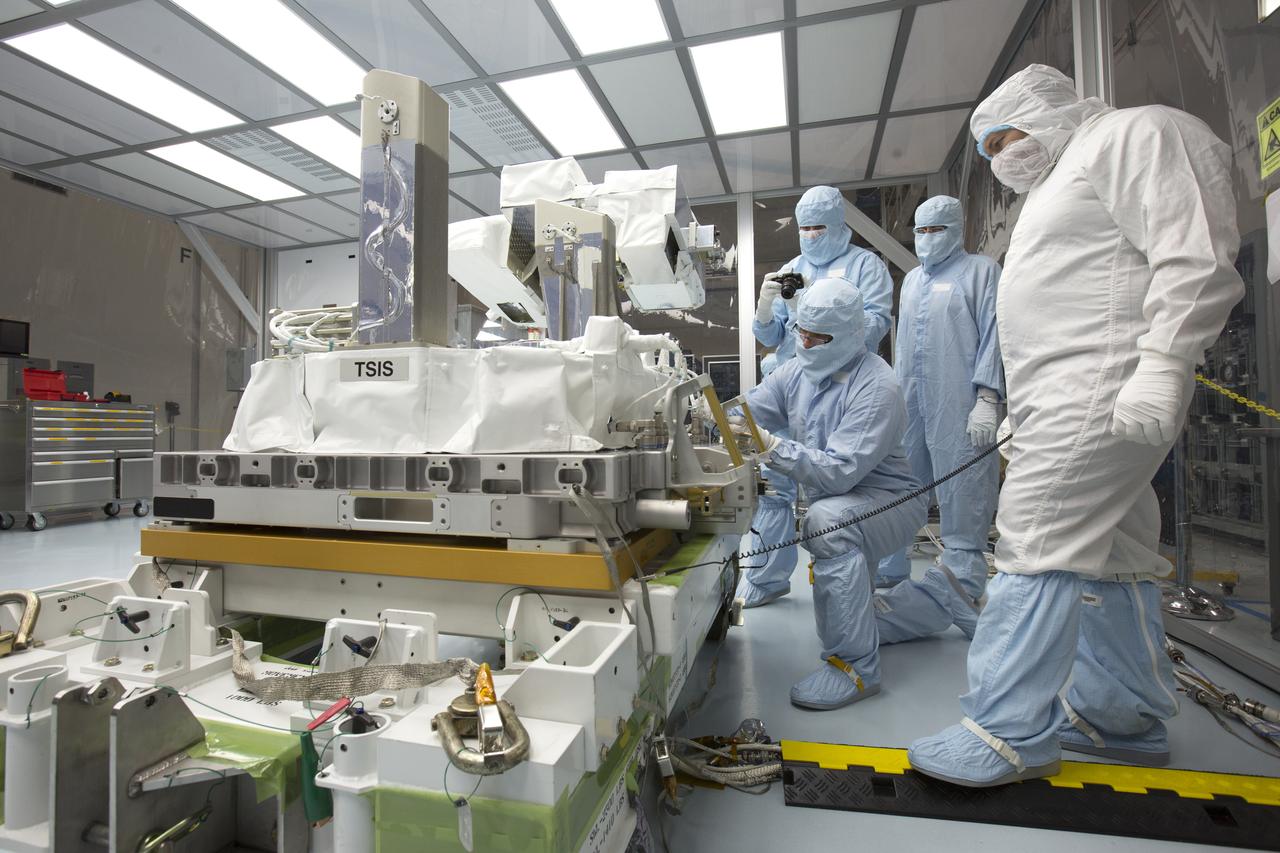
In the high bay of Kennedy Space Center's Space Station Processing Facility, Chris Hardcastle, left, of Stinger-Ghaffarian Technologies applies crew preference tape to the integrated Total and Spectral Solar Irradiance Sensor-1 (TSIS-1) payload and the EXPRESS Pallet Adapter. Hardcastle is joined by TSIS-1 payload team members from the Laboratory for Atmospheric and Space Physics, a Research Institute at the University of Colorado (Boulder). Standing from left to right are Tom Patton, Greg Ucker and Norm Perish. TSIS-1 is designed to measure the Sun's energy input into Earth by seeing how it is distributed across different wavelengths of light. These measurements help scientists establish Earth's total energy and how our planet's atmosphere responds to changes in the Sun's energy output. TSIS-1 will launch on SpaceX's 13th commercial resupply mission to the International Space Station.
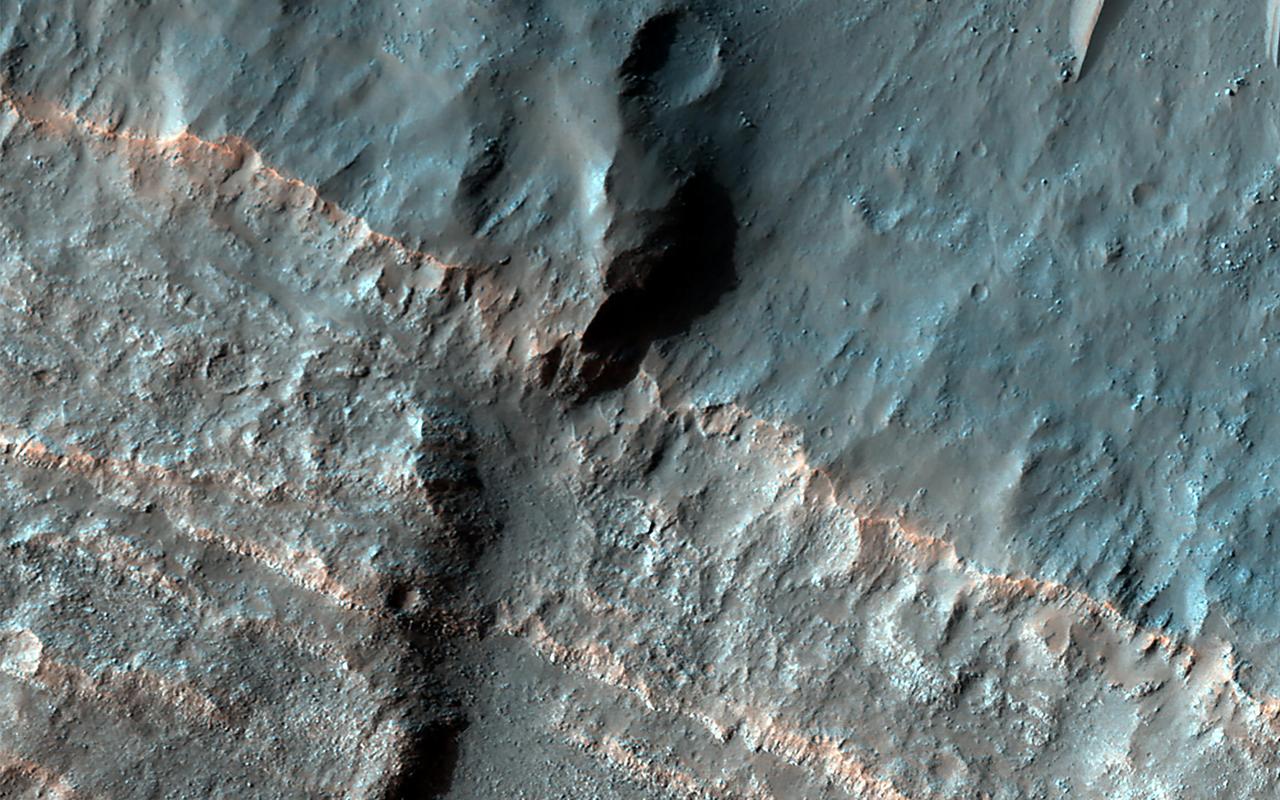
Many craters in the mid-latitudes of Mars are partially filled with deposits that have been interpreted to be ice-rich. We expect the deposits to have formed at an earlier (but relatively recent) time when Mars' orbital parameters were different and allowed ice to condense and deposit in these locations. The ice is covered by dust layers protecting it from sublimating away. The ice deposits are probably no older than a few million years, which is recent in geological terms. However, we can observe that these deposits have been affected by even more recent movement of the crust (the curving trough) that clearly post-dates the ice deposits because it is cutting through them. A wider view allows us to trace this crustal movement or "fault," and we can see it is also affecting the crater wall and the area surrounding it. This observation indicates that Mars' interior is still (or at least until recently was) warm enough to sustain such activity. https://photojournal.jpl.nasa.gov/catalog/PIA26323

In the high bay of Kennedy Space Center's Space Station Processing Facility, Chris Hardcastle, right, of Stinger-Ghaffarian Technologies performs a sharp edge inspection of the integrated Total and Spectral Solar Irradiance Sensor-1 (TSIS-1) payload and the EXPRESS Pallet Adapter. Hardcastle is joined by Norm Perish, left, a TSIS-1 payload team member from the Laboratory for Atmospheric and Space Physics, a Research Institute at the University of Colorado (Boulder). TSIS-1 is designed to measure the Sun's energy input into Earth by seeing how it is distributed across different wavelengths of light. These measurements help scientists establish Earth's total energy and how our planet's atmosphere responds to changes in the Sun's energy output. TSIS-1 will launch on SpaceX's 13th commercial resupply mission to the International Space Station.
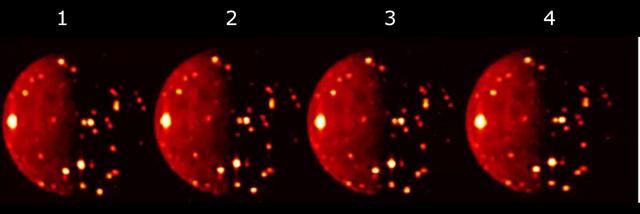
Data used to generate this composite image of volcanic activity on the Jovian moon Io was obtained by the JIRAM (Jovian Infrared Auroral Mapper) instrument aboard NASA's Juno spacecraft during a flyby of the moon on Oct. 16, 2021. JIRAM took the four images over a short time interval to observe volcanic activity on the moon from different view angles. JIRAM data collected over time could provide information on changes to Io's surface, including the number of active volcanoes or variations in their intensity. JIRAM "sees" infrared light not visible to the human eye. In this composite image, the measurements of thermal emission radiated from the planet were in the infrared wavelength of around 5 microns. https://photojournal.jpl.nasa.gov/catalog/PIA25886
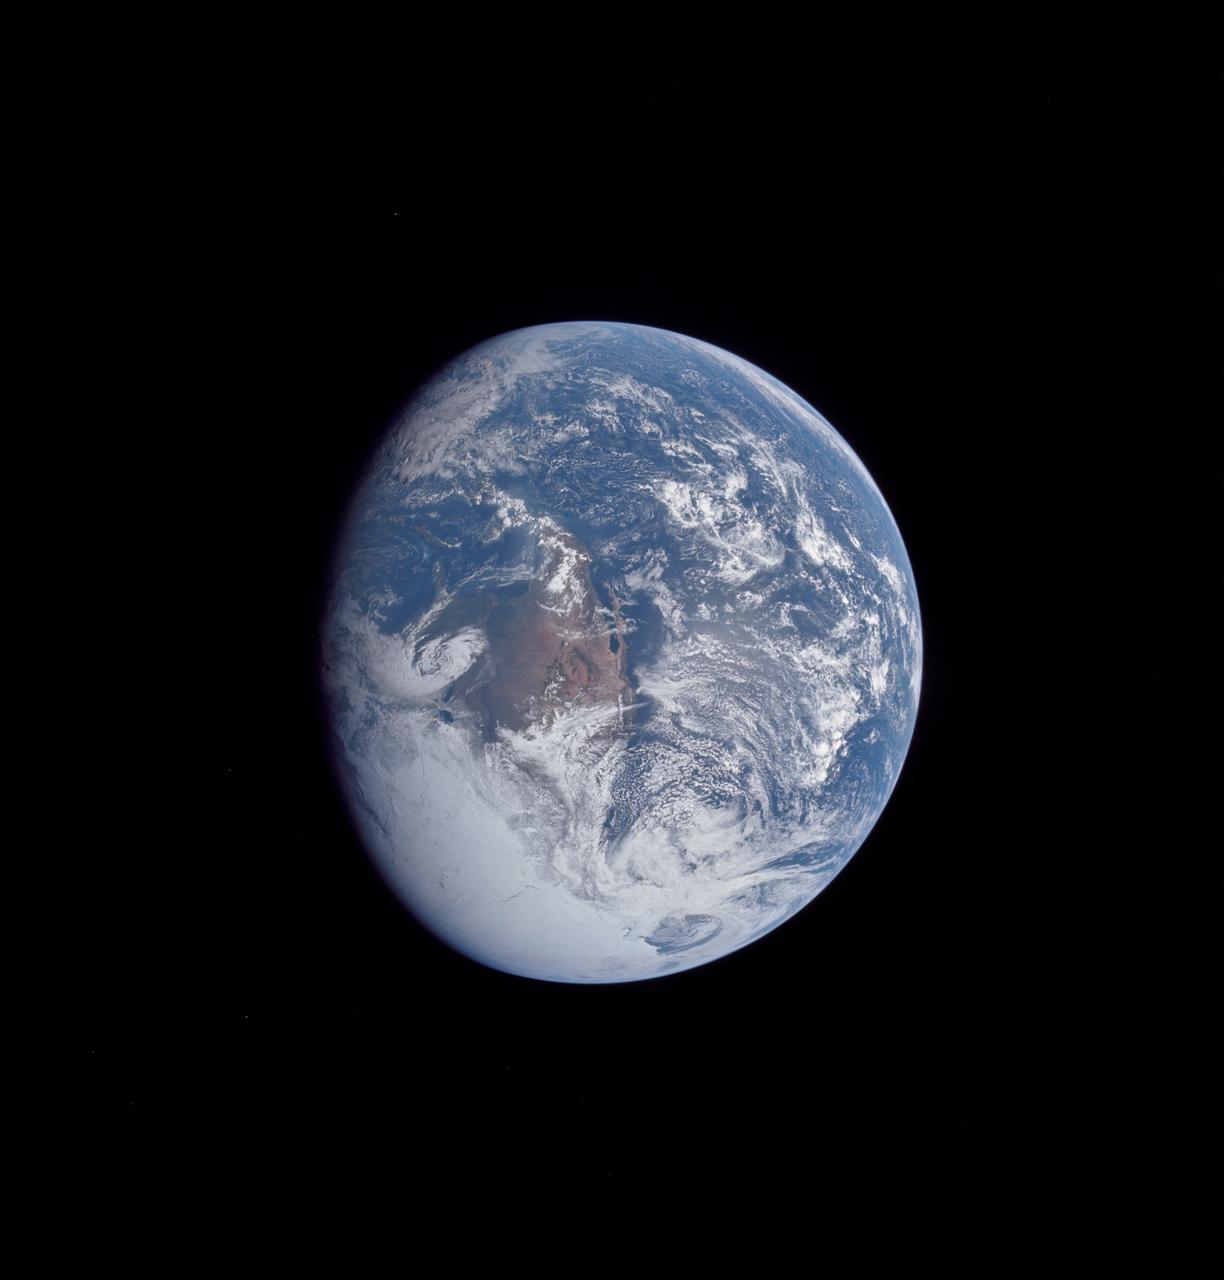
AS16-118-18885 (16 April 1972) --- A good view of Earth photographed about one and one-half hours after trans-lunar injection on April 16, 1972. Although there is much cloud cover, the United States in large part, most of Mexico and some parts of Central America are clearly visible. Note Lake Michigan and Lake Superior and the Bahama Banks (see different shade of blue below Florida). Just beginning man's fifth lunar landing mission were astronauts John W. Young, commander; Thomas K. Mattingly, II, command module pilot and Charles M. Duke Jr., lunar module pilot. While astronauts Young and Duke descended in the Lunar Module (LM) "Orion" to explore the Descartes highlands region of the moon, astronaut Mattingly remained with the Command and Service Modules (CSM) "Casper" in lunar orbit.
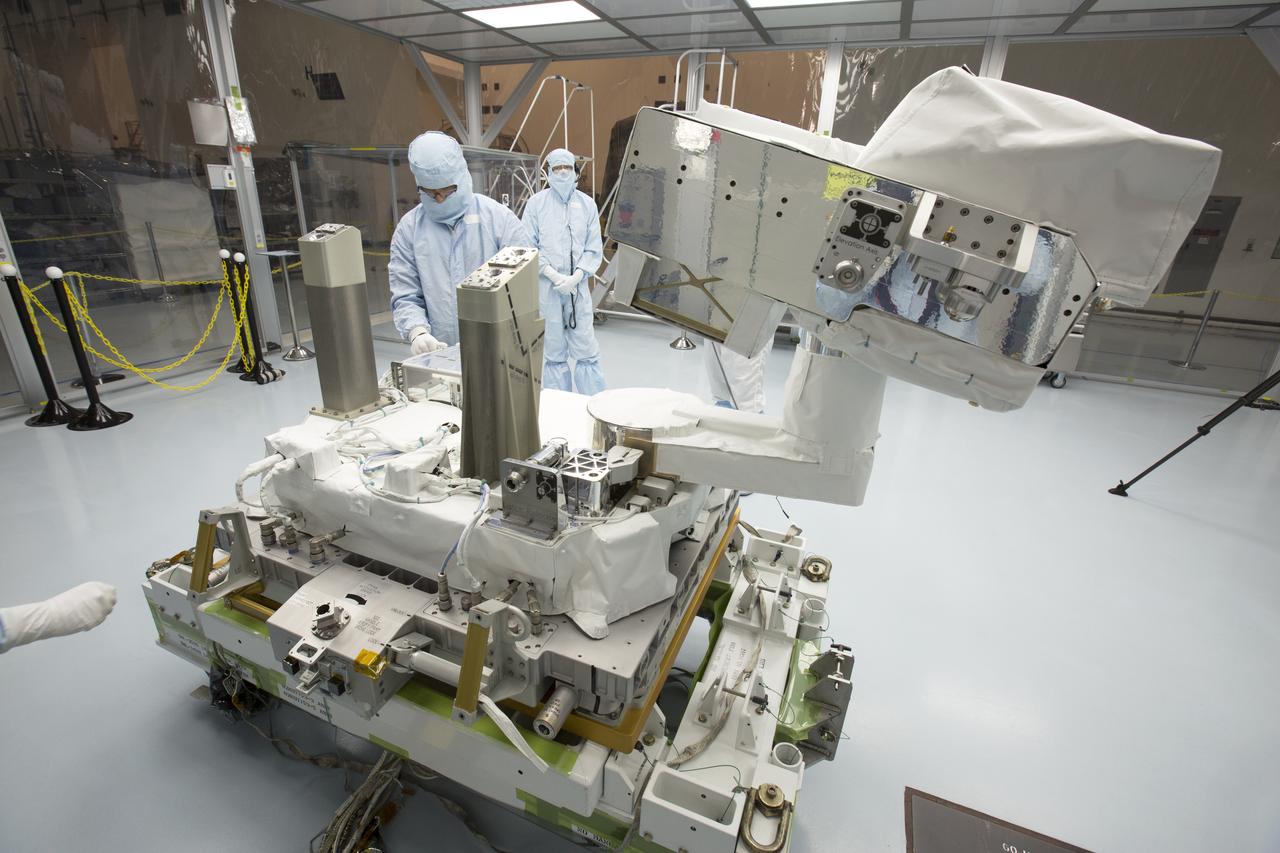
In the high bay of Kennedy Space Center's Space Station Processing Facility, Chris Hardcastle, left, of Stinger-Ghaffarian Technologies performs a sharp edge inspection of the integrated Total and Spectral Solar Irradiance Sensor-1 (TSIS-1) payload and the EXPRESS Pallet Adapter. Hardcastle is joined by Dwayne Swieter, right, a TSIS-1 payload team member from the Laboratory for Atmospheric and Space Physics, a Research Institute at the University of Colorado (Boulder). TSIS-1 is designed to measure the Sun's energy input into Earth by seeing how it is distributed across different wavelengths of light. These measurements help scientists establish Earth's total energy and how our planet's atmosphere responds to changes in the Sun's energy output. TSIS-1 will launch on SpaceX's 13th commercial resupply mission to the International Space Station.
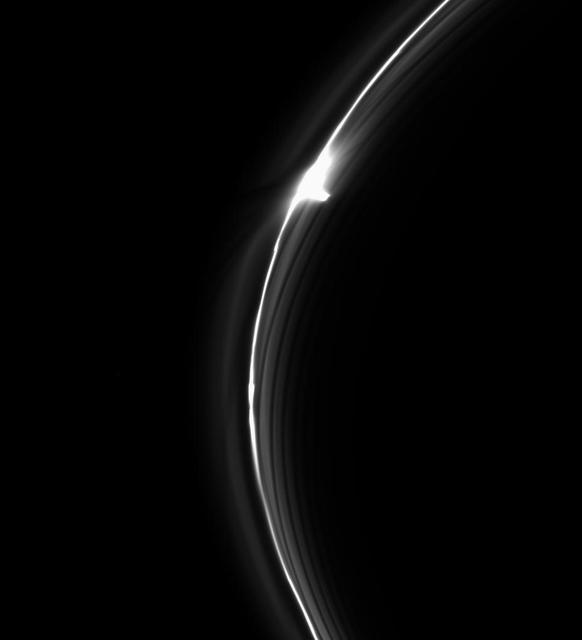
Saturn's dynamic F ring contains many different types of features to keep scientists perplexed. In this image we see features ring scientists call "gores," to the right of the bright clump, and a "jet," to the left of the bright spot. Thanks to the ring's interaction with the moons Prometheus and Pandora, and perhaps a host of smaller moonlets hidden in its core, the F ring is a constantly changing structure, with features that form, fade and re-appear on timescales of hours to days. This view looks toward the unilluminated side of the rings from about 7 degrees below the ring plane. The image was taken in visible light with the Cassini spacecraft narrow-angle camera on March 15, 2015. The view was acquired at a distance of approximately 295,000 miles (475,000 kilometers) from Saturn and at a Sun-ring-spacecraft, or phase, angle of 117 degrees. Image scale is 1.8 miles (2.9 kilometers) per pixel. http://photojournal.jpl.nasa.gov/catalog/PIA18337
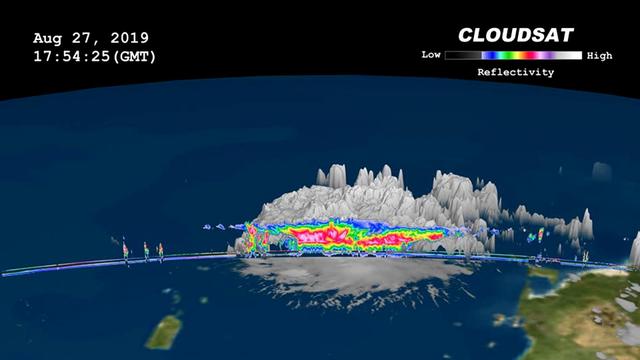
On, Aug. 27, 2019 NASA's CloudSat satellite passed over Dorian, still a tropical storm at the time, near Puerto Rico. CloudSat uses an advanced cloud-profiling radar that "slices" through clouds giving us the ability to see how tall they are, where the different cloud layers are, and where the heavier bands of rain are found within the storm system. The 3D animation shows Dorian when it had maximum sustained winds of 52 mph (84 kph) with some of its cloud tops extending about 9 miles (15 kilometer) into the atmosphere. The colors represent the size of water or ice droplets inside the storm — deep red and pink indicate larger droplets with areas of moderate and heavy rainfall. Movie available at https://photojournal.jpl.nasa.gov/catalog/PIA23359
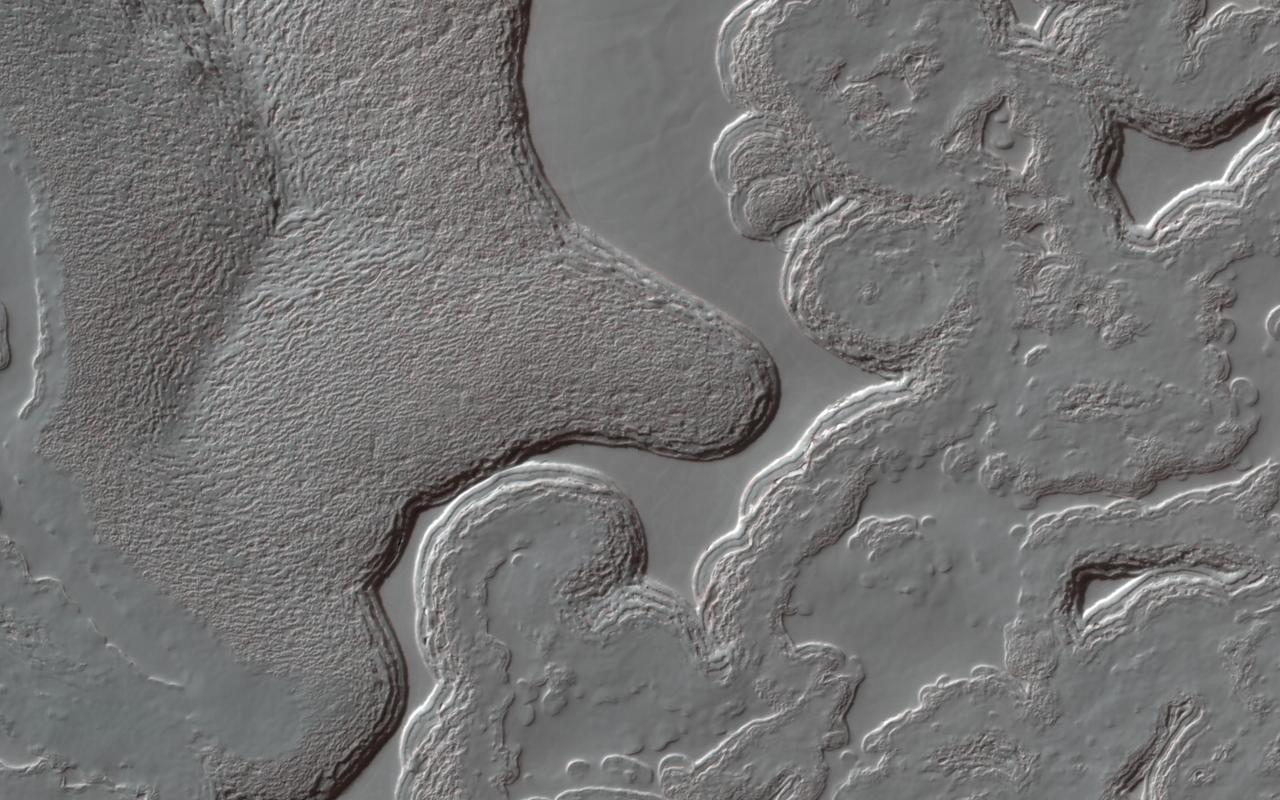
Mars has a small South Polar cap of carbon dioxide ice. Although this cap persists year round, it is always changing: it has pits and mesas that in some places resemble a slice of Swiss cheese. The pits are expanding because the carbon dioxide is sublimating, but in other places new carbon dioxide deposits are building up on flat ground. HiRISE monitors many areas of the cap to study these changes. Usually when we study changes, we can align the images with features that haven’t changed, but here that is difficult: nearly everything is different! By lining up the pattern of shallow pits on top of a mesa, which are not changing much, we can see the variations in the eight Mars years between observations (PSP_004992_0945 and this one). Some of the walls have retreated by more than 15 meters (about 50 feet). https://photojournal.jpl.nasa.gov/catalog/PIA25553
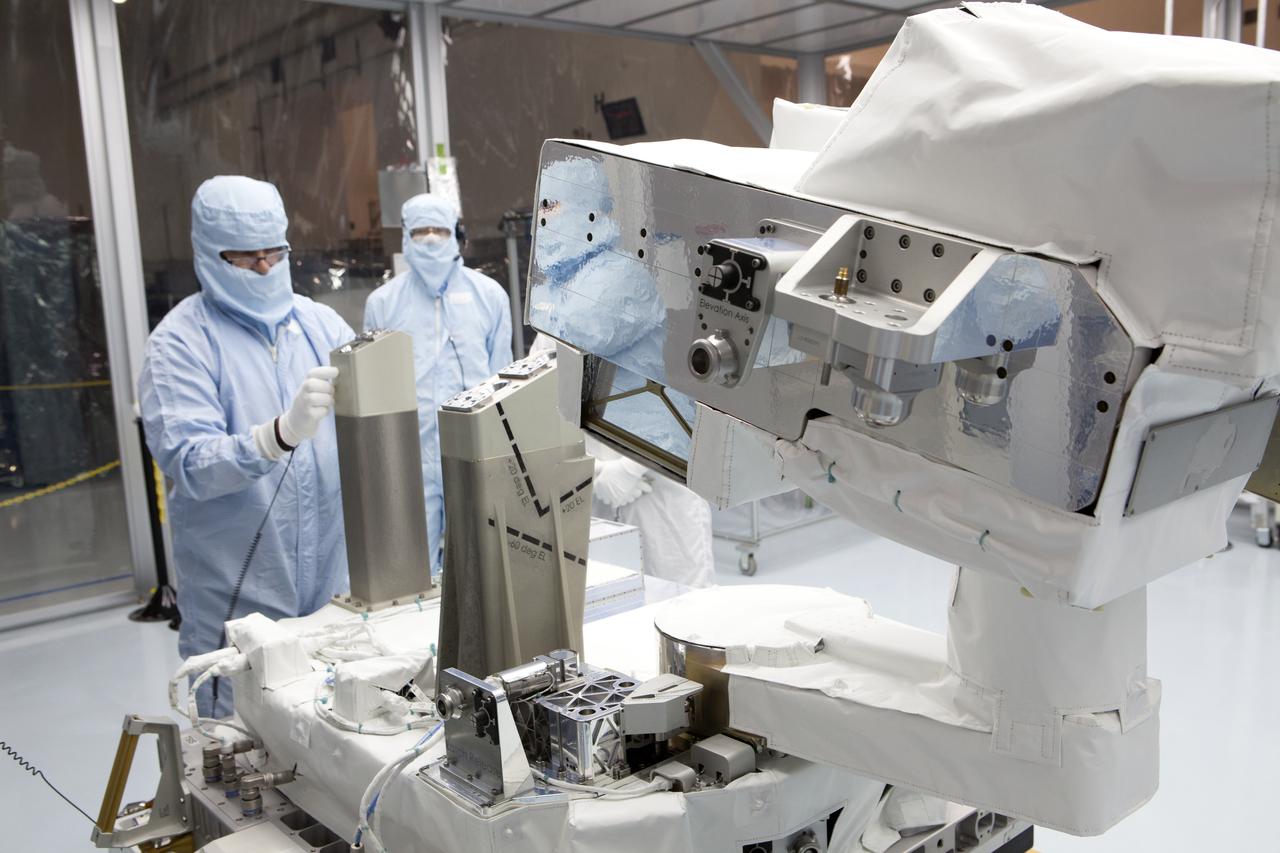
In the high bay of Kennedy Space Center's Space Station Processing Facility, Chris Hardcastle, left, of Stinger-Ghaffarian Technologies performs a sharp edge inspection of the integrated Total and Spectral Solar Irradiance Sensor-1 (TSIS-1) payload and the EXPRESS Pallet Adapter. Hardcastle is joined by Dwayne Swieter, right, a TSIS-1 payload team member from the Laboratory for Atmospheric and Space Physics, a Research Institute at the University of Colorado (Boulder). TSIS-1 is designed to measure the Sun's energy input into Earth by seeing how it is distributed across different wavelengths of light. These measurements help scientists establish Earth's total energy and how our planet's atmosphere responds to changes in the Sun's energy output. TSIS-1 will launch on SpaceX's 13th commercial resupply mission to the International Space Station.
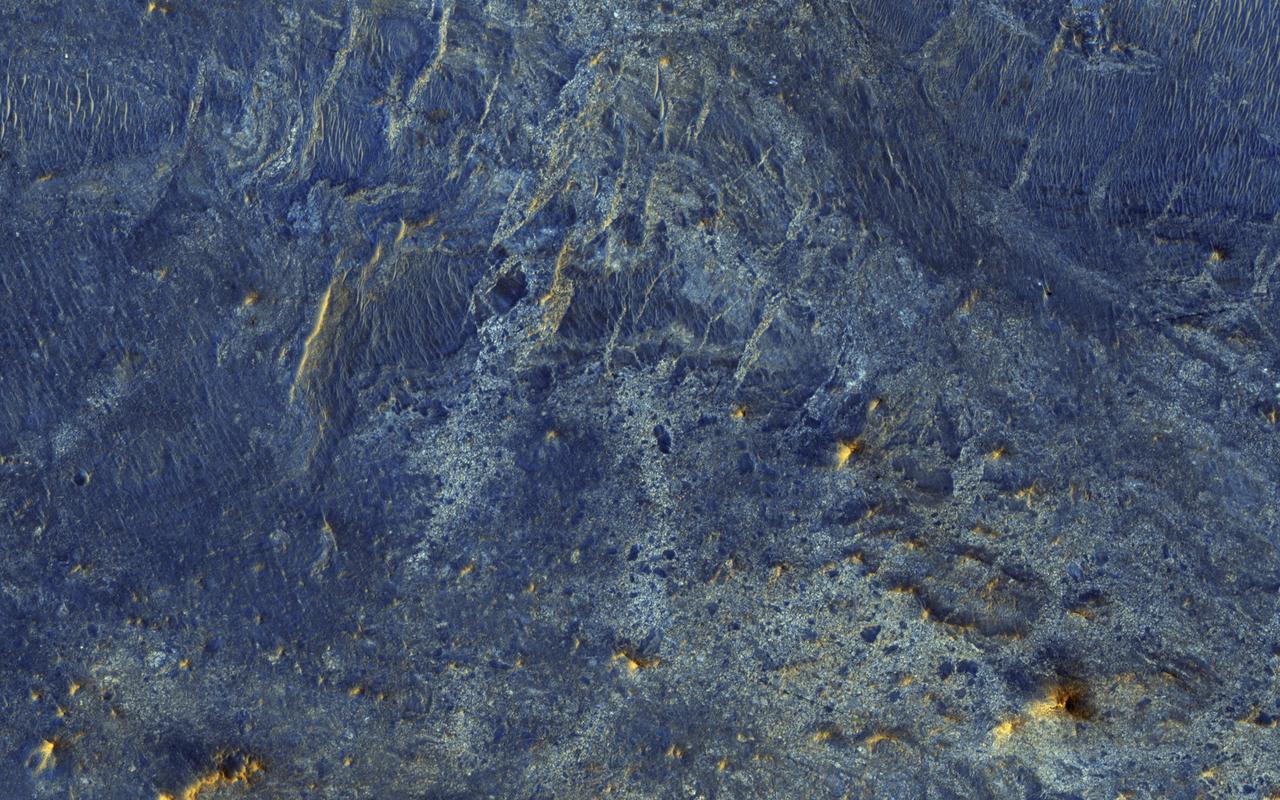
There have been several proposals to send people to Mars but not land them on the surface. Instead, they would either fly by Mars once and return to Earth, or orbit Mars for a period of time. Would they at least get spectacular naked-eye views of the Martian surface? Some parts of Mars would be interesting: for example the polar ice caps, and the bright (dust-covered) regions would be seen reasonably well, although the color is very uniform. The dark (low reflectance) regions of Mars are some of the most interesting and important regions studied by our orbiters and rovers, but they would appear very bland to humans outside of the planet's atmosphere. This is because the thin atmosphere of Mars is quite bright and dusty, so when looking at dark surface areas, most of what you would see is scattered light from the atmospheric dust, and the surface would have a very low contrast. It would also appear reddish, even if the surface materials are not reddish, from the scattered light. Here is an example from the Nili Patera region of Mars, a candidate future landing site. At the top is an approximation of the natural color as seen by people with normal color vision -- almost no surface detail is visible. In the middle is the standard HiRISE IRB color product, consisting of the infrared, red, and blue-green images displayed as red, green, and blue, respectively, and with a min-max stretch applied to each color. In other words, the darkest pixel in the entire image is set to black, the brightest pixel is set to white, and all others are linearly interpolated. At bottom is an enhanced color product, in which each bandpass is given a linear stretch for the local subimage, sometimes saturating a small percentage of data to black or white to give the rest of the scene more contrast, followed by color saturation enhancement. Now we can see a diversity of colors that distinguish different surface units: dust, sand, and rocks with different minerals. http://photojournal.jpl.nasa.gov/catalog/PIA21040
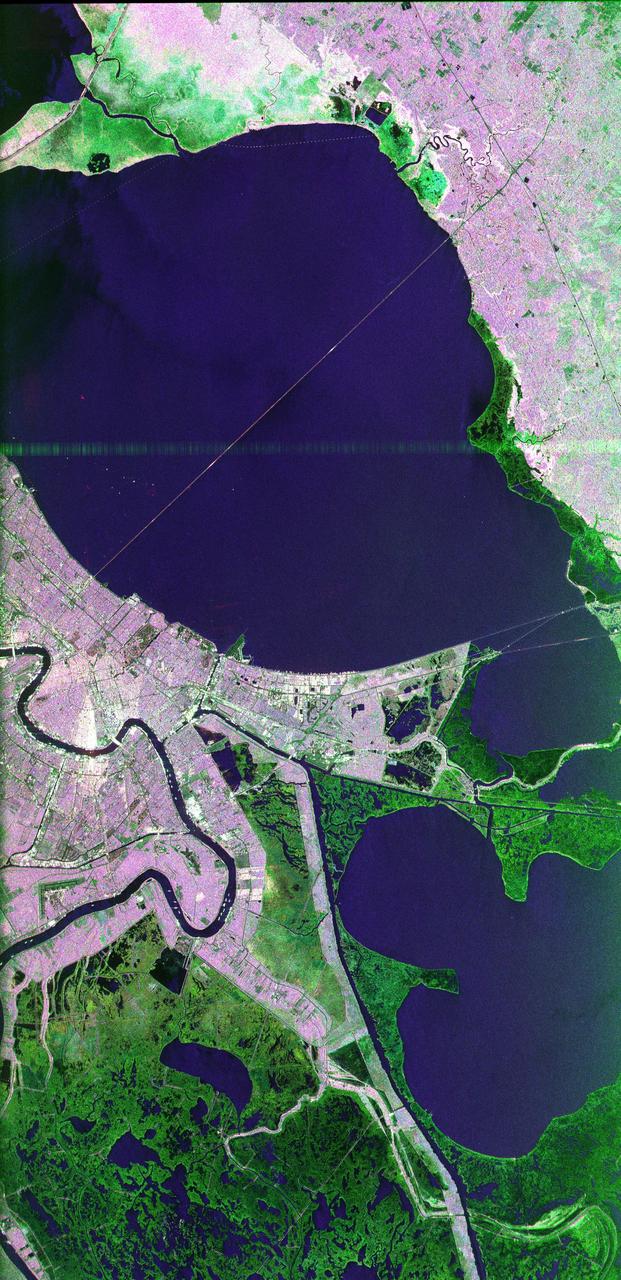
This image of the area surrounding the city of New Orleans, Louisiana in the southeastern United States demonstrates the ability of multi-frequency imaging radar to distinguish different types of land cover. The dark area in the center is Lake Pontchartrain. The thin line running across the lake is a causeway connecting New Orleans to the city of Mandeville. Lake Borgne is the dark area in the lower right of the image. The Mississippi River appears as a dark, wavy line in the lower left. The white dots on the Mississippi are ships. The French Quarter is the brownish square near the left center of the image. Lakefront Airport, a field used mostly for general aviation, is the bright spot near the center, jutting out into Lake Pontchartrain. The image was acquired by the Spaceborne Imaging Radar C/X-Band Synthetic Aperture Radar (SIR-C/X-SAR) during orbit 39 of space shuttle Endeavour on October 2, 1994. The area is located at 30.10 degrees north latitude and 89.1 degrees west longitude. The area shown is approximately 100 kilometers (60 miles) by 50 kilometers (30 miles). The colors in this image were obtained using the following radar channels: red represents the L-band (horizontally transmitted and received); green represents the C-band (horizontally transmitted and received); blue represents the L-band (vertically transmitted and received). The green areas are primarily vegetation consisting of swamp land and swamp forest (bayou) growing on sandy soil, while the pink areas are associated with reflections from buildings in urban and suburban areas. Different tones and colors in the vegetation areas will be studied by scientists to see how effective imaging radar data is in discriminating between different types of wetlands. Accurate maps of coastal wetland areas are important to ecologists studying wild fowl and the coastal environment. http://photojournal.jpl.nasa.gov/catalog/PIA01300
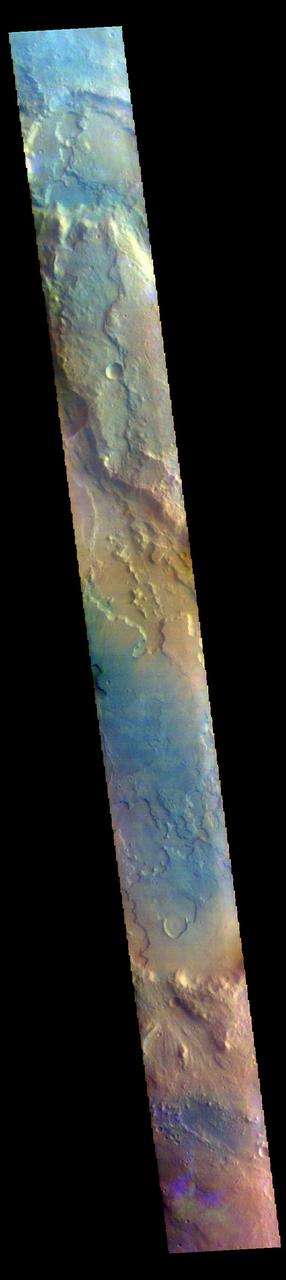
The THEMIS VIS camera contains 5 filters. The data from different filters can be combined in multiple ways to create a false color image. These false color images may reveal subtle variations of the surface not easily identified in a single band image. Today's false color image shows part of Margaritifer Terra just east of Ares Vallis. If you look closely at the bottom of the image, you will see spots of purple and yellow, with similar 'shapes'. These features are not image artifacts. These are clouds. When this image was collected there were high altitude ice clouds being blown across the sky, moving fast enough to reach a different location between the time each filter was collected. Color VIS images are typically the only image type where ice clouds can be identified. The THEMIS VIS camera is capable of capturing color images of the Martian surface using five different color filters. In this mode of operation, the spatial resolution and coverage of the image must be reduced to accommodate the additional data volume produced from using multiple filters. To make a color image, three of the five filter images (each in grayscale) are selected. Each is contrast enhanced and then converted to a red, green, or blue intensity image. These three images are then combined to produce a full color, single image. Because the THEMIS color filters don't span the full range of colors seen by the human eye, a color THEMIS image does not represent true color. Also, because each single-filter image is contrast enhanced before inclusion in the three-color image, the apparent color variation of the scene is exaggerated. Nevertheless, the color variation that does appear is representative of some change in color, however subtle, in the actual scene. Note that the long edges of THEMIS color images typically contain color artifacts that do not represent surface variation. Orbit Number: 85890 Latitude: 2.8487 Longitude: 344.415 Instrument: VIS Captured: 2021-04-25 11:47 https://photojournal.jpl.nasa.gov/catalog/PIA25097
![These six infrared images of Saturn's moon Titan represent some of the clearest, most seamless-looking global views of the icy moon's surface produced so far. The views were created using 13 years of data acquired by the Visual and Infrared Mapping Spectrometer (VIMS) instrument on board NASA's Cassini spacecraft. The images are the result of a focused effort to smoothly combine data from the multitude of different observations VIMS made under a wide variety of lighting and viewing conditions over the course of Cassini's mission. Previous VIMS maps of Titan (for example, PIA02145) display great variation in imaging resolution and lighting conditions, resulting in obvious seams between different areas of the surface. With the seams now gone, this new collection of images is by far the best representation of how the globe of Titan might appear to the casual observer if it weren't for the moon's hazy atmosphere, and it likely will not be superseded for some time to come. Observing the surface of Titan in the visible region of the spectrum is difficult, due to the globe enshrouding haze that envelops the moon. This is primarily because small particles called aerosols in Titan's upper atmosphere strongly scatter visible light. But Titan's surface can be more readily imaged in a few infrared "windows" -- infrared wavelengths where scattering and absorption is much weaker. This is where the VIMS instrument excelled, parting the haze to obtain clear images of Titan's surface. (For comparison, Figure 1 shows Titan as it appears in visible light, as does PIA11603.) Making mosaics of VIMS images of Titan has always been a challenge because the data were obtained over many different flybys with different observing geometries and atmospheric conditions. One result is that very prominent seams appear in the mosaics that are quite difficult for imaging scientists to remove. But, through laborious and detailed analyses of the data, along with time consuming hand processing of the mosaics, the seams have been mostly removed. This is an update to the work previously discussed in PIA20022. Any full color image is comprised of three color channels: red, green and blue. Each of the three color channels combined to create these views was produced using a ratio between the brightness of Titan's surface at two different wavelengths (1.59/1.27 microns [red], 2.03/1.27 microns [green] and 1.27/1.08 microns [blue]). This technique (called a "band-ratio" technique) reduces the prominence of seams, as well as emphasizing subtle spectral variations in the materials on Titan's surface. For example, the moon's equatorial dune fields appear a consistent brown color here. There are also bluish and purplish areas that may have different compositions from the other bright areas, and may be enriched in water ice. For a map of Titan with latitudes, longitudes and labeled surface features, see PIA20713. It is quite clear from this unique set of images that Titan has a complex surface, sporting myriad geologic features and compositional units. The VIMS instrument has paved the way for future infrared instruments that could image Titan at much higher resolution, revealing features that were not detectable by any of Cassini's instruments. https://photojournal.jpl.nasa.gov/catalog/PIA21923](https://images-assets.nasa.gov/image/PIA21923/PIA21923~medium.jpg)
These six infrared images of Saturn's moon Titan represent some of the clearest, most seamless-looking global views of the icy moon's surface produced so far. The views were created using 13 years of data acquired by the Visual and Infrared Mapping Spectrometer (VIMS) instrument on board NASA's Cassini spacecraft. The images are the result of a focused effort to smoothly combine data from the multitude of different observations VIMS made under a wide variety of lighting and viewing conditions over the course of Cassini's mission. Previous VIMS maps of Titan (for example, PIA02145) display great variation in imaging resolution and lighting conditions, resulting in obvious seams between different areas of the surface. With the seams now gone, this new collection of images is by far the best representation of how the globe of Titan might appear to the casual observer if it weren't for the moon's hazy atmosphere, and it likely will not be superseded for some time to come. Observing the surface of Titan in the visible region of the spectrum is difficult, due to the globe enshrouding haze that envelops the moon. This is primarily because small particles called aerosols in Titan's upper atmosphere strongly scatter visible light. But Titan's surface can be more readily imaged in a few infrared "windows" -- infrared wavelengths where scattering and absorption is much weaker. This is where the VIMS instrument excelled, parting the haze to obtain clear images of Titan's surface. (For comparison, Figure 1 shows Titan as it appears in visible light, as does PIA11603.) Making mosaics of VIMS images of Titan has always been a challenge because the data were obtained over many different flybys with different observing geometries and atmospheric conditions. One result is that very prominent seams appear in the mosaics that are quite difficult for imaging scientists to remove. But, through laborious and detailed analyses of the data, along with time consuming hand processing of the mosaics, the seams have been mostly removed. This is an update to the work previously discussed in PIA20022. Any full color image is comprised of three color channels: red, green and blue. Each of the three color channels combined to create these views was produced using a ratio between the brightness of Titan's surface at two different wavelengths (1.59/1.27 microns [red], 2.03/1.27 microns [green] and 1.27/1.08 microns [blue]). This technique (called a "band-ratio" technique) reduces the prominence of seams, as well as emphasizing subtle spectral variations in the materials on Titan's surface. For example, the moon's equatorial dune fields appear a consistent brown color here. There are also bluish and purplish areas that may have different compositions from the other bright areas, and may be enriched in water ice. For a map of Titan with latitudes, longitudes and labeled surface features, see PIA20713. It is quite clear from this unique set of images that Titan has a complex surface, sporting myriad geologic features and compositional units. The VIMS instrument has paved the way for future infrared instruments that could image Titan at much higher resolution, revealing features that were not detectable by any of Cassini's instruments. https://photojournal.jpl.nasa.gov/catalog/PIA21923
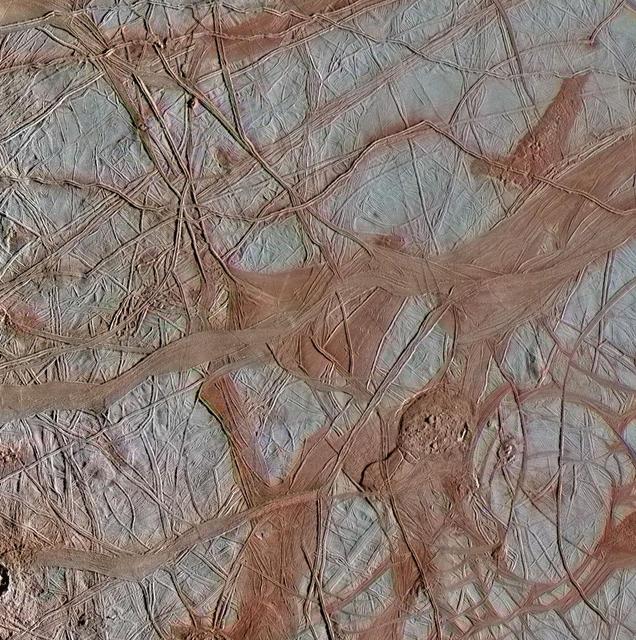
The surface of Jupiter's moon Europa features a widely varied landscape, including ridges, bands, small rounded domes and disrupted spaces that geologists called "chaos terrain." This newly reprocessed image, along with two others along the same longitude (see PIA23871 and PIA23873), were taken by NASA's Galileo spacecraft on Sept. 26, 1998, and reveal details of diverse surface features on Europa. All three images were captured along the same longitude of Europa as Galileo flew by on Sept. 26, 1998, in the spacecraft's 17th orbit of Jupiter (orbit E17). It was the eighth of Galileo's 11 targeted flybys of Europa. High-resolution images were taken through a clear filter in grayscale (black and white). Using lower-resolution, color images of the same region from a different flyby (orbit E14), technicians recently mapped color onto the higher-resolution images. (Orbit E14 resulted in this global view of Europa (see PIA19048). The color information gathered on that flyby was used to reprocess these new images.) Enhanced-color images like these allow scientists to highlight geologic features with different colors, which are related to chemical compositions of the surface. Areas that appear light blue or white are made up of relatively pure water ice, and reddish areas have more non-ice materials. This image shows a region of Europa's surface covered with ridges and bands, with a few small disrupted chaos regions. The long, linear ridges and bands that crisscross Europa's surface are thought to be related to the response of Europa's icy surface crust as it is stretched and pulled by Jupiter's strong gravity. Ridges, a common surface feature type, may form when a crack in the surface opens and closes repeatedly, building up a feature that's typically a few hundred yards tall, a few miles wide and that can stretch horizontally for thousands of miles. In contrast, bands are locations where a crack appears to have continued pulling apart horizontally, producing large, wide, relatively flat features. This image shows both ridges and bands, which interact with each other in complex ways that are somewhat similar to tectonic activity on the Earth. The image resolution is 244 yards (223 meters) per pixel, and this image depicts an area about 180 miles (285 kilometers) across. This image was produced by Mario Valenti at the SETI Institute in Mountain View, Calif. https://photojournal.jpl.nasa.gov/catalog/PIA23872
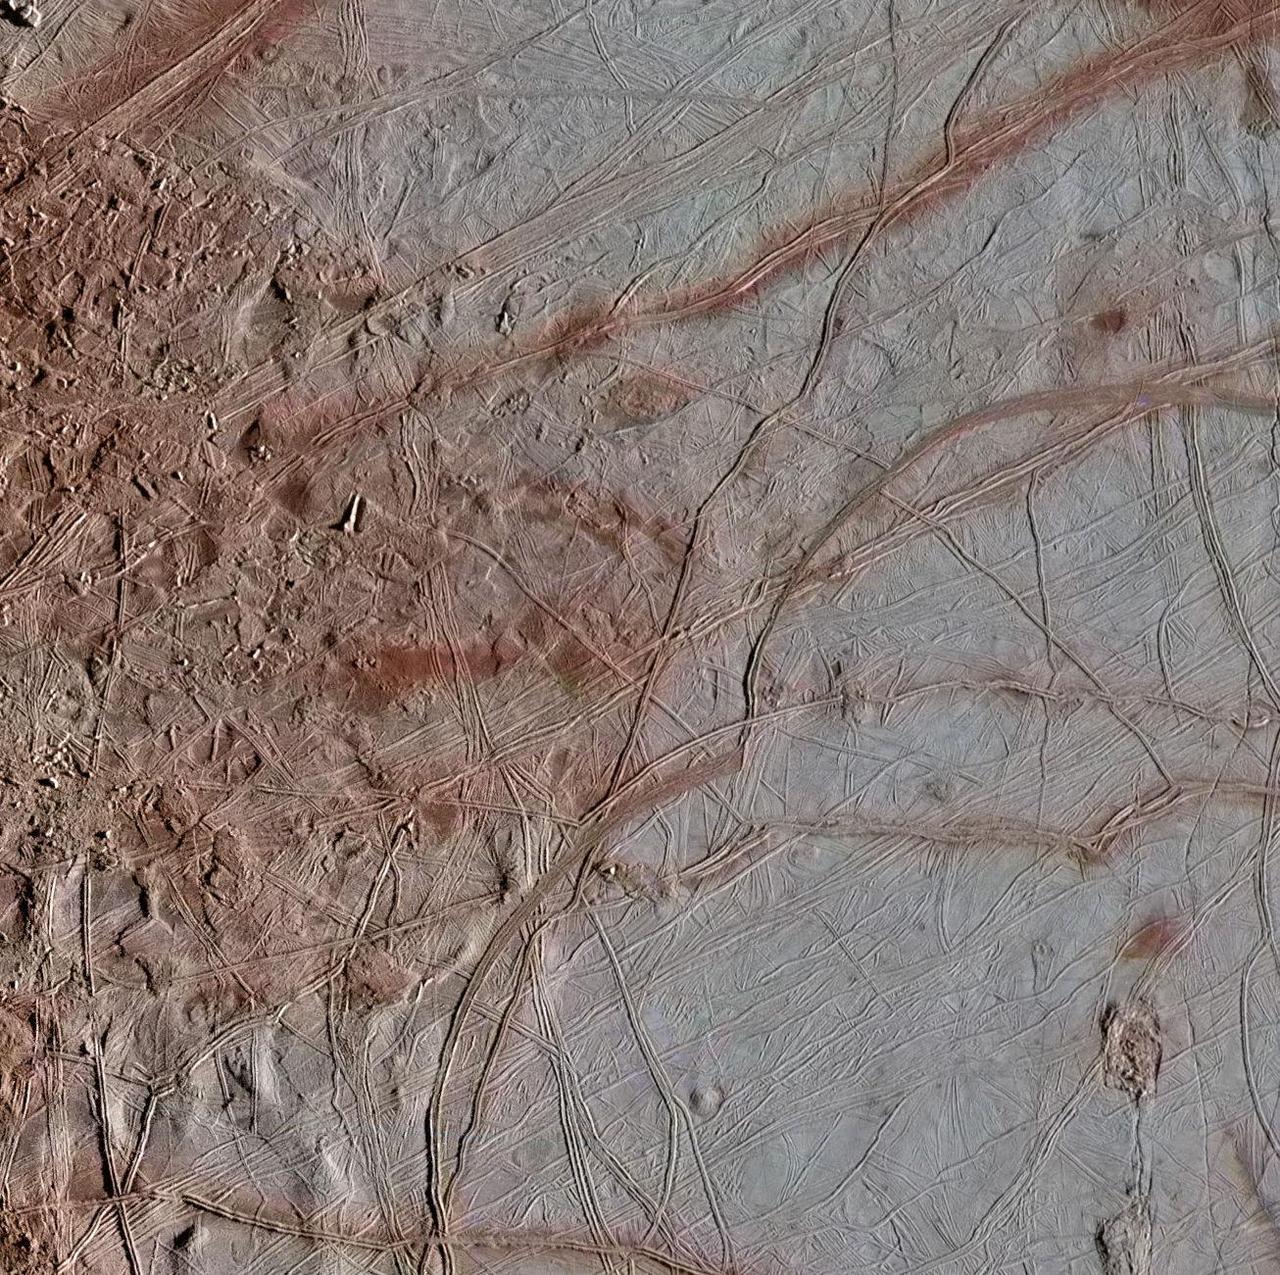
The surface of Jupiter's moon Europa features a widely varied landscape, including ridges, bands, small rounded domes and disrupted spaces that geologists called "chaos terrain." This newly reprocessed image, along with two others along the same longitude (see PIA23872 and PIA23873), were taken by NASA's Galileo spacecraft on Sept. 26, 1998, and reveal details of diverse surface features on Europa. All three images were captured along the same longitude of Europa as Galileo flew by on Sept. 26, 1998, in the spacecraft's 17th orbit of Jupiter (orbit E17). It was the eighth of Galileo's 11 targeted flybys of Europa. High-resolution images were taken through a clear filter in grayscale (black and white). Using lower-resolution, color images of the same region from a different flyby (orbit E14), technicians recently mapped color onto the higher-resolution images. (Orbit E14 resulted in this global view of Europa (see PIA19048). The color information gathered on that flyby was used to reprocess these new images.) Enhanced-color images like these allow scientists to highlight geologic features with different colors, which are related to chemical compositions of the surface. Areas that appear light blue or white are made up of relatively pure water ice, and reddish areas have more non-ice materials. This image shows a transitional location between blocky chaos terrain, on the left, and ridged plains on the right. A few chaos blocks are visible on the left as individually broken and rotated pieces of preexisting surface material; their shadows indicate that some of these blocks have tilted as well. A ridge passes through the center of this image. These ridges, which contain arc-shaped segments joined together by a series of cusps, may be related to how the icy surface crust of Europa fractures when subjected to stresses from Jupiter's strong gravity. The right side of this image shows a few lenticulae, which are small rounded surface features, commonly domed in appearance. The image resolution is 247 yards (226 meters per pixel, and this image depicts an area about 180 miles (300 kilometers) across. The image was produced by Mario Valenti at the SETI Institute in Mountain View, Calif. https://photojournal.jpl.nasa.gov/catalog/PIA23871

The surface of Jupiter's moon Europa features a widely varied landscape, including ridges, bands, small rounded domes and disrupted spaces that geologists called "chaos terrain." This newly reprocessed image, along with two others along the same longitude (see PIA23871 and PIA23872), were taken by NASA's Galileo spacecraft on Sept. 26, 1998, and reveal details of diverse surface features on Europa. All three images were captured along the same longitude of Europa as Galileo flew by on Sept. 26, 1998, in the spacecraft's 17th orbit of Jupiter (orbit E17). It was the eighth of Galileo's 11 targeted flybys of Europa. High-resolution images were taken through a clear filter in grayscale (black and white). Using lower-resolution, color images of the same region from a different flyby (orbit E14), technicians recently mapped color onto the higher-resolution images. (Orbit E14 resulted in this global view of Europa (see PIA19048). The color information gathered on that flyby was used to reprocess these new images.) Enhanced-color images like these allow scientists to highlight geologic features with different colors, which are related to chemical compositions of the surface. Areas that appear light blue or white are made up of relatively pure water ice, and reddish areas have more non-ice materials. This image shows a region of blocky chaos terrain, where the surface has broken apart into many smaller chaos blocks that are surrounded by featureless matrix material. Many of the chaos blocks have moved sideways, rotated, or tilted before being refrozen into their new locations, and some larger blocks preserve features of the pre-existing terrain before it was broken up. Using these features as clues, scientists have been able to reconstruct some chaos regions like jjgsaw puzzles to track the motion of blocks. Cutting through the chaos terrain near the bottom, from left to right, is a broad flat band. Called Agenor Linea, it is one of the longest bands on Europa and is distinctive for its two-color appearance, with a bright region at the top and a darker region below. Another rare bright band, Katreus Linea, cuts across the top portion of this image. The image resolution is 243 yards (222 meters) per pixel, and this image depicts an area about 170 miles (280 kilometers) across. This image was produced by Mario Valenti at the SETI Institute in Mountain View, Calif. https://photojournal.jpl.nasa.gov/catalog/PIA23873
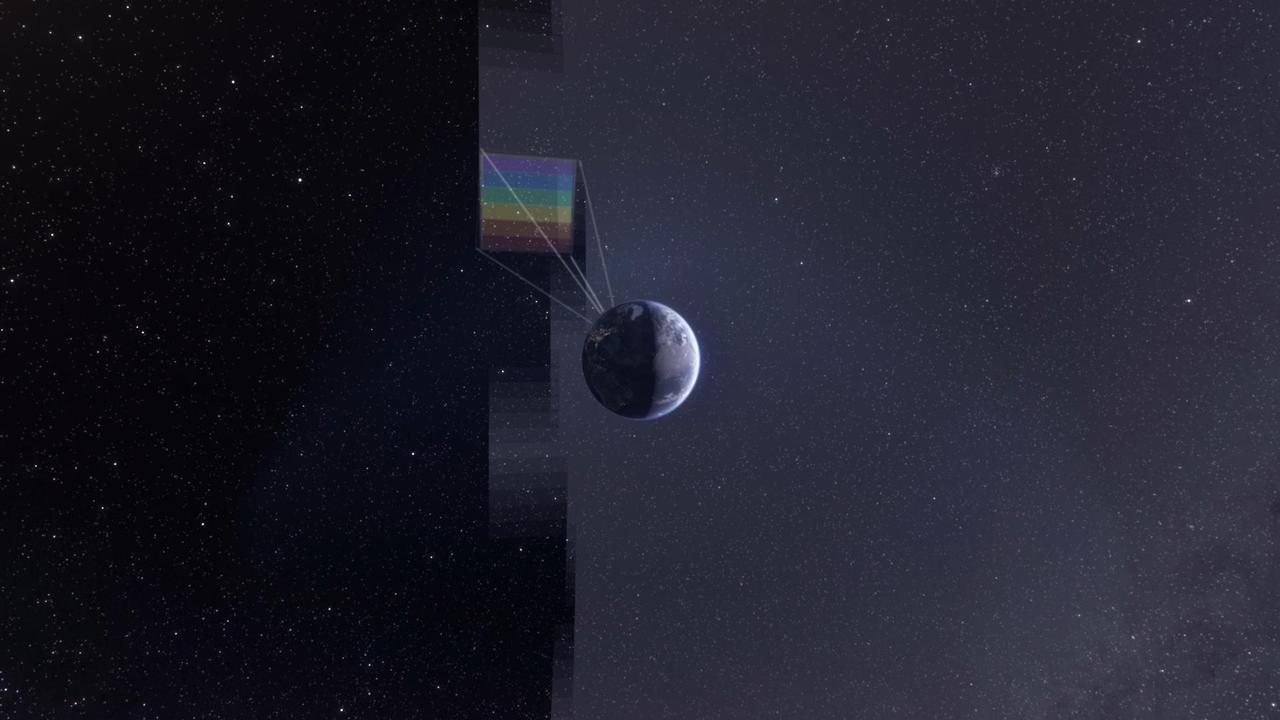
NASA's SPHEREx observatory will map the entire sky to help scientists answer big-picture questions about the origins of our universe, galaxies, and key ingredients for life in our galaxy, such as water. Operating from low Earth orbit, the telescope will sweep across the sky, taking about 600 exposures each day. Using a technique called spectroscopy, the observatory will image every section of the sky 102 times, each time using a different color filter that blocks all wavelengths except one. By combining those images, the mission will produce a map containing information about the composition of and distance to millions of stars and other objects in our galaxy and hundreds of millions of galaxies beyond. (See an animation of this process, depicted in a still artist's concept above, at spherex.caltech.edu/video/all-sky-survey.) Short for Spectro-Photometer for the History of the Universe, Epoch of Reionization and Ices Explorer, SPHEREx will help scientists study what happened in the first fraction of a second after the big bang, how galaxies formed and evolved, and the origins of water in planetary systems in our galaxy. https://photojournal.jpl.nasa.gov/catalog/PIA26533
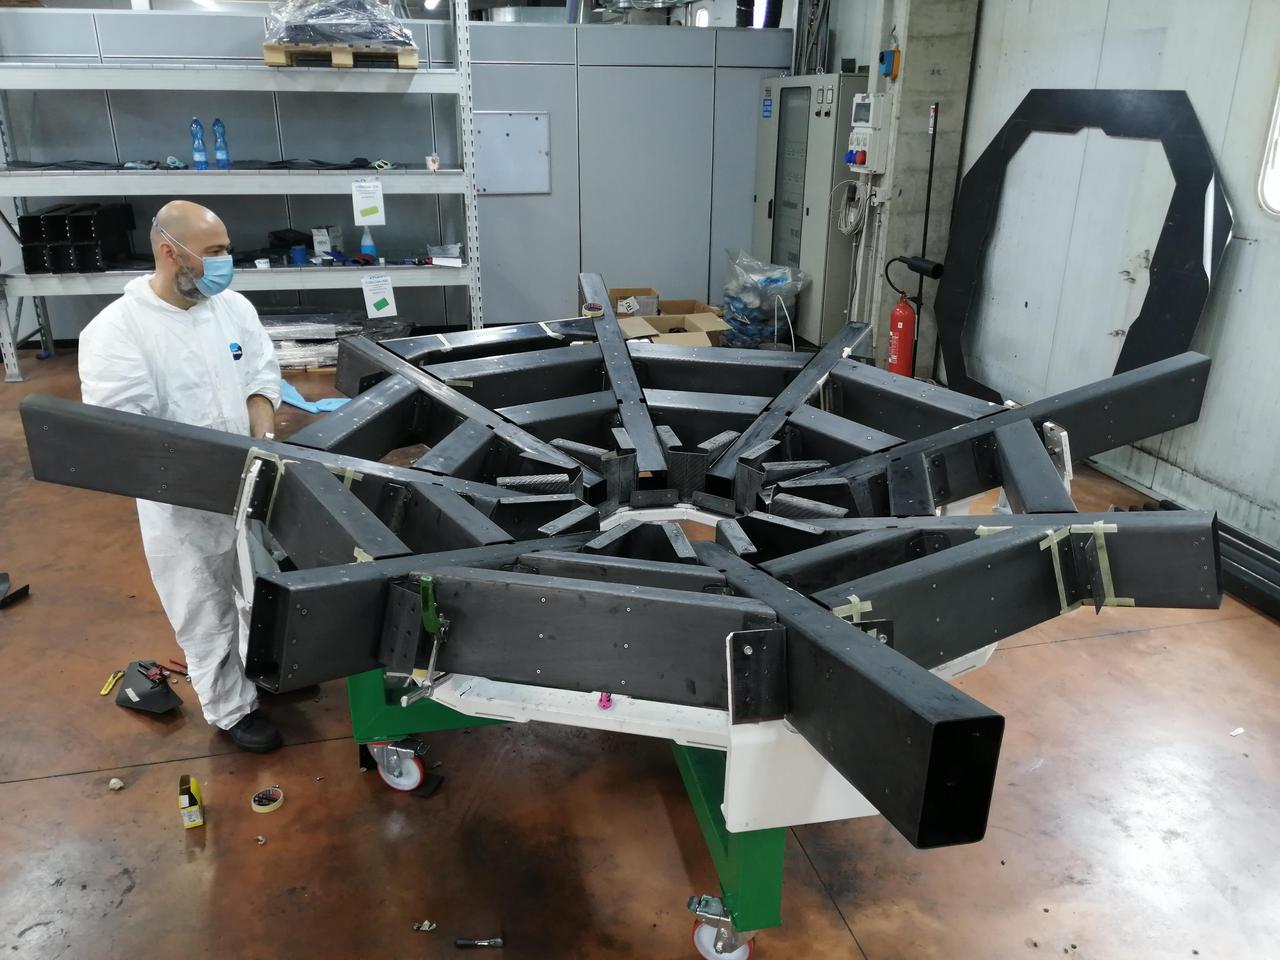
Known as the cradle, the structure that supports the primary mirror on NASA's Astrophysics Stratospheric Telescope for High Spectral Resolution Observations at Submillimeter-wavelengths mission, or ASTHROS, keeps the mirror panels aligned. Made from carbon fiber, it and must be both lightweight and extremely rigid. NASA contracted Media Lario, an optics company in Bosisio Parini, Italy, to design and produce ASTHROS' full telescope unit, including the primary mirror, a secondary mirror, and supporting structure (called the cradle). The cradle is shown here at Media Lario. The mission's main science goal is to study stellar feedback, the process by which living stars disperse and reshape clouds of gas and dust that may eventually form new stars. Feedback regulates star formation in many galaxies, and too much can halt star formation entirely. ASTHROS will look at several star-forming regions in our galaxy where feedback takes place, and at distant galaxies containing millions of stars to see how feedback plays out at large scales and in different environments. https://photojournal.jpl.nasa.gov/catalog/PIA25169
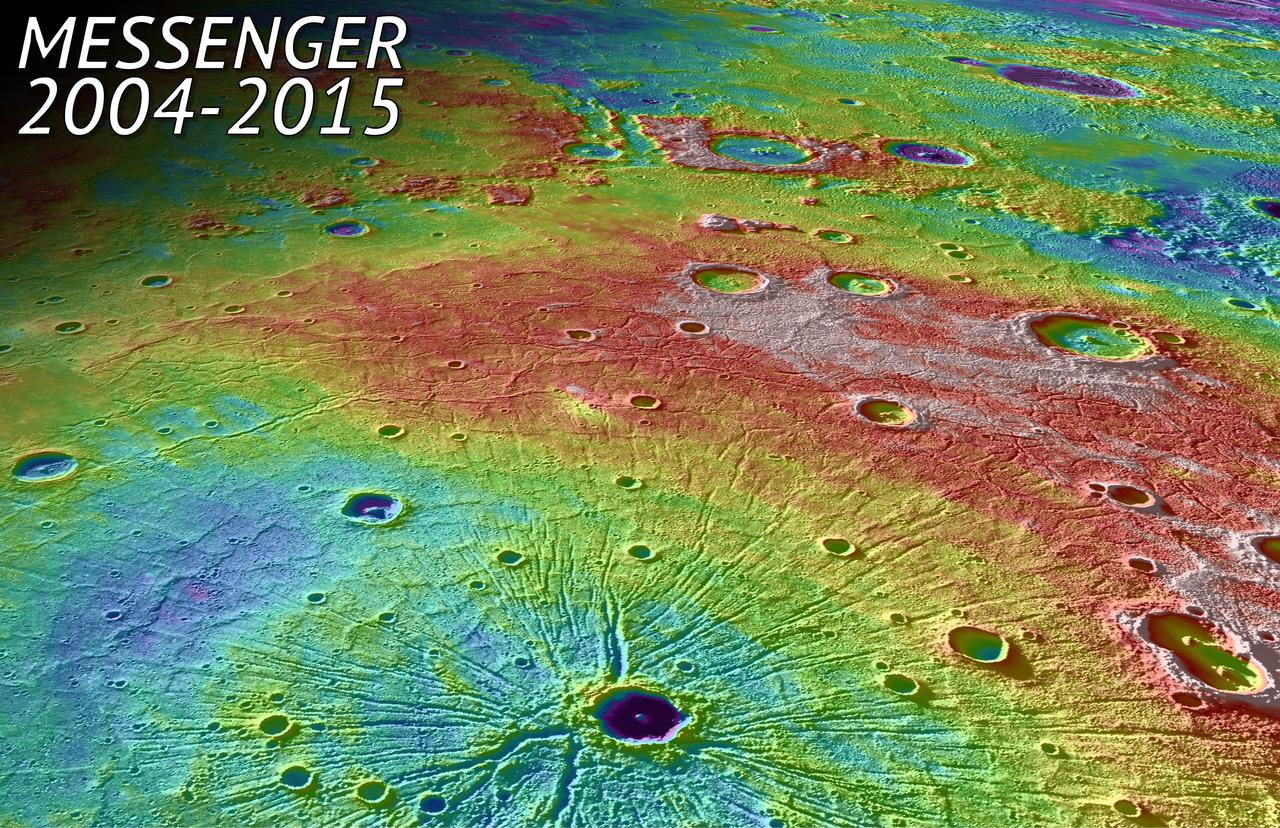
In this perspective view, NASA MESSENGER spacecraft looked northwest over the Caloris Basin, a depression about 1500 km in diameter formed several billion years ago by the impact of a large projectile into the surface of Mercury. The mountain range at the edge of the basin can be seen as an arc in the background. In the foreground, we see a set of tectonic troughs, known as Pantheon Fossae, radiating from the center of the basin outward toward the edge of the basin interior. A 41-km-diameter impact crater, Apollodorus, is superposed just slightly off from the center of Pantheon Fossae. White and red are high topography, and greens and blues are low topography, with a total height differences of roughly 4 km. The MESSENGER spacecraft was launched in 2004 and ended it's orbital operations yesterday, April 30, 2015, by impacting Mercury's surface. Background image texture is provided by the Mercury Dual Imaging System (MDIS) instrument while color corresponds to surface elevation data obtained from the Mercury Laser Altimeter (MLA) experiment, with both draped over a digital elevation model derived from MLA altimetric data. Instrument: Mercury Dual Imaging System (MDIS) and Mercury Laser Altimeter (MLA) Approximate Center Latitude: 33.7° N Approximate Center Longitude: 158.7° E Scale: Apollodorus crater is approximately 41 km (25 miles) in diameter http://photojournal.jpl.nasa.gov/catalog/PIA19450
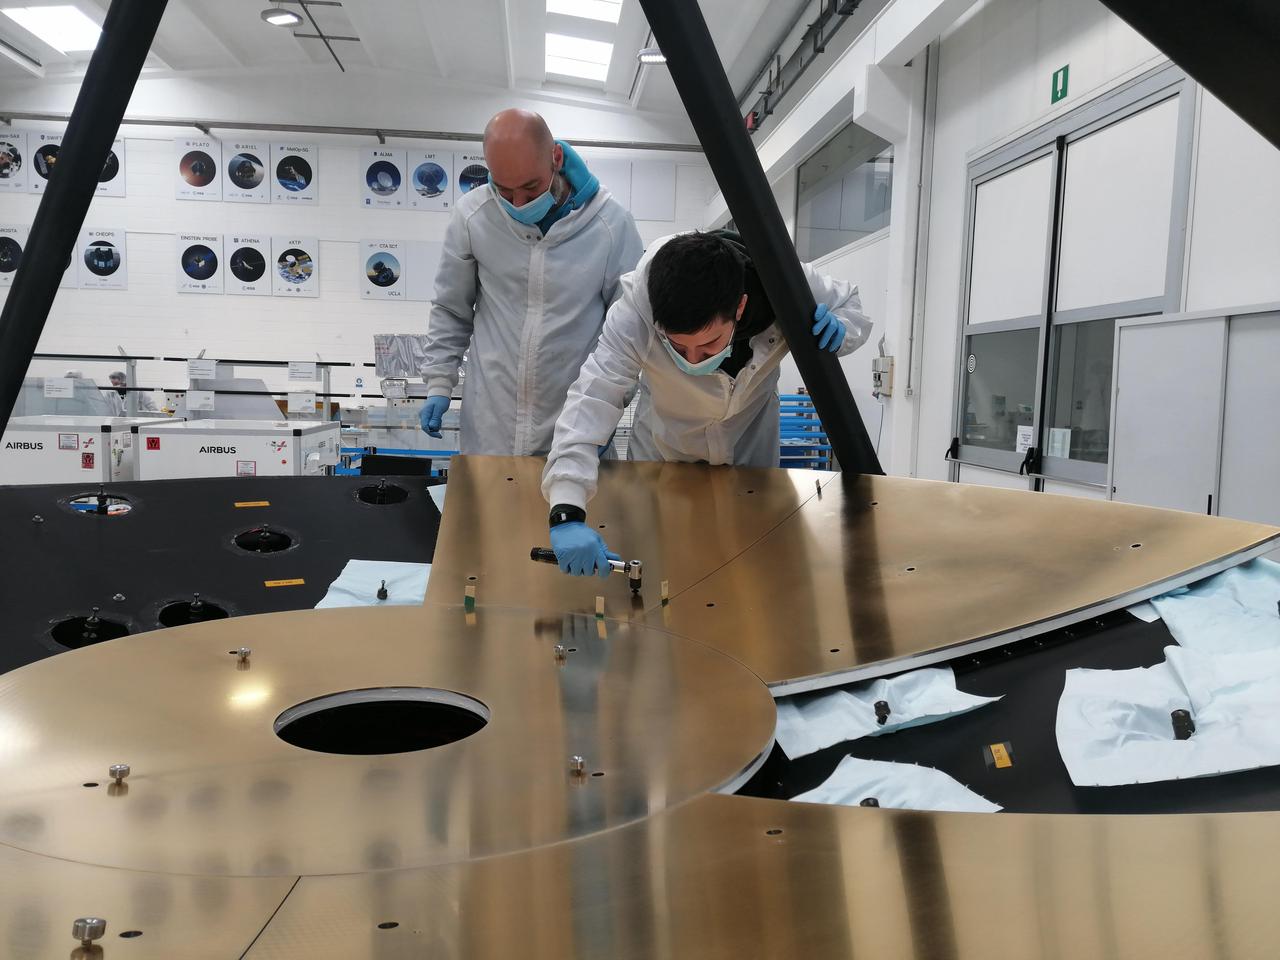
The mirror on NASA's Astrophysics Stratospheric Telescope for High Spectral Resolution Observations at Submillimeter-wavelengths mission, or ASTHROS, is composed of nine panels, coated in nickel and gold. Here, engineers attach panels to the mirror's support structure. The panels must be aligned to within 0.0001 inches (2.5 micrometers), or a fraction of the width of a human hair. Manufacturing multiple panels requires less time and expense than making the mirror as a single piece. NASA contracted Media Lario, an optics company in Bosisio Parini, Italy, to design and produce ASTHROS' full telescope unit, including the primary mirror, a secondary mirror, and supporting structure (called the cradle). The mirror is shown here at Media Lario. The mission's main science goal is to study stellar feedback, the process by which living stars disperse and reshape clouds of gas and dust that may eventually form new stars. Feedback regulates star formation in many galaxies, and too much can halt star formation entirely. ASTHROS will look at several star-forming regions in our galaxy where feedback takes place, and at distant galaxies containing millions of stars to see how feedback plays out at large scales and in different environments. https://photojournal.jpl.nasa.gov/catalog/PIA25167