This radar image acquired in February 2000 by NASA Shuttle Radar Topography Mission SRTM shows an area in the state of Bahia in Brazil.
Shaded Relief of South Africa, Northern Cape Province
This radar image acquired in February 2000 by NASA Shuttle Radar Topography Mission SRTM shows an area in the state of Bahia in Brazil.
Radar Image with Color as Height, Bahia State, Brazil
This image of the world was generated with data from NASA Shuttle Radar Topography Mission SRTM.
World in Mercator Projection, Shaded Relief and Colored Height
Volcanism and erosion are prominently seen in this view of the eastern flank of the Andes Mountains taken by NASA Shuttle Radar Topography Mission SRTM.
SRTM Colored Height and Shaded Relief: Corral de Piedra, Argentina
This topographic image acquired in February 2000 by NASA Shuttle Radar Topography Mission SRTM shows an area in the state of Bahia in Brazil.
Shaded Relief of Bahia State, Brazil
This image of South America was generated with data from NASA Shuttle Radar Topography Mission SRTM.
South America, Shaded Relief and Colored Height
The white, mottled area in the right-center of this image from NASA Shuttle Radar Topography Mission SRTM is Madrid, the capital of Spain.
Shaded Relief and Radar Image with Color as Height, Madrid, Spain
This image of North America was generated with data from NASA Shuttle Radar Topography Mission SRTM.
Shaded Relief with Height as Color, North America
This image of France was generated with data from NASA Shuttle Radar Topography Mission SRTM.
France, Shaded Relief and Colored Height
NASA Shuttle Radar Topography Mission SRTM has produced the first high-resolution, near-global elevation dataset of Earth.
Library of Congress Model, Perspective View
This perspective view, acquired by NASA Shuttle Radar Topography Mission SRTM in Feb. 2000, shows Honolulu, on the island of Oahu.
Perspective view, Landsat Overlay Oahu, Hawaii
This topographic radar image acquired by NASA Shuttle Radar Topography Mission SRTM in Feb. 2000 shows the Lanai left and western Maui right islands of Hawaii.
Radar Image, Wrapped Color as Height, Lanai and West Maui, Hawaii
This radar image acquired in February 2000 by NASA Shuttle Radar Topography Mission SRTM shows an area south of the Sao Francisco River in Brazil.
Radar Image of Rio Sao Francisco, Brazil
Honolulu, on the island of Oahu, is a large and growing urban area. This stereoscopic image pair, combining a Landsat image with topography measured by NASA Shuttle Radar Topography Mission SRTM, shows how topography controls the urban pattern.
Stereo Pair, Honolulu, Oahu
This image is of Mt. Pinos and San Joaquin Valley, California. NASA Shuttle Radar Topography Mission SRTM acquired this data on February 16, 2000.
SRTM Perspective View with Landsat Overlay: Mt. Pinos and San Joaquin Valley, California
Caliente Range and Cuyama Valley, California, are shown in this image acquired by NASA Shuttle Radar Topography Mission SRTM on February 16, 2000.
SRTM Perspective View with Landsat Overlay: Caliente Range and Cuyama Valley, California
The volcanic nature of the island of Bali is evident in this shaded relief image generated with data from NASA Shuttle Radar Topography Mission SRTM.
Bali, Shaded Relief and Colored Height
In this image of Manhattan, acquired by NASA Shuttle Radar Topography Mission SRTM on February 12, 2000, the city skyscrapers appear as ghostly white spikes.
SRTM Perspective View with Landsat Overlay: Manhattan Island, New York
Much of Honshu, Japan largest island, is seen in this image generated from NASA Shuttle Radar Topography Mission SRTM data on February 19, 2000.
Radar Image with Color as Height: Tokyo, Honshu, Japan
The Sovereign Democratic Republic of the Fiji Islands, commonly known as Fiji, is shown in this image acquired by NASA Shuttle Radar Topography Mission SRTM on February 19, 2000.
SRTM Stereo Pair: Fiji Islands
The topography of the island nation of Sri Lanka is well shown in this color-coded shaded relief map generated with digital elevation data from NASA Shuttle Radar Topography Mission SRTM.
Sri Lanka, Colored Height
From the desert to the mountains to the sea, this image acquired by NASA Shuttle Radar Topography Mission SRTM in Feb. 2000, shows in striking detail the varied topography of Southern California.
Southern California Shaded Relief, Color as Height
This radar image acquired by NASA Shuttle Radar Topography Mission SRTM from data collected on February 16, 2000 shows the San Francisco Bay Area in California.
Radar image San Francisco Bay Area, California
This topographic radar image acquired by NASA Shuttle Radar Topography Mission SRTM in Feb. 2000 shows the city of Honolulu, Hawaii and adjacent areas on the island of Oahu. Honolulu lies on the south shore of the island.
Honolulu, Hawaii Radar Image, Wrapped Color as Height
This topographic radar image acquired by NASA Shuttle Radar Topography Mission SRTM in Feb. 2000 shows the relationships of the dense urban development of Los Angeles, Calif. and the natural contours of the land.
Los Angeles, California, Radar Image, Wrapped Color as Height
This topographic radar image acquired by NASA Shuttle Radar Topography Mission SRTM from data collected on February 16, 2000 shows the relationship of the urban area of Pasadena, California to the natural contours of the land.
San Gabriel Mountains, California, Radar Image, Color as Height
This radar image acquired by NASA Shuttle Radar Topography Mission SRTM from data collected on February 15, 2000 includes the city of Salalah, the second largest city in Oman.
Radar Image, Color as Height , Salalah, Oman
This radar image acquired by NASA Shuttle Radar Topography Mission SRTM from data collected on February 18, 2000 shows the Dallas-Fort Worth metropolitan area in Texas.
C-Band Radar Imagery, Dallas-Fort Worth, Texas
NASA Shuttle Radar Topography Mission SRTM, flown aboard Space Shuttle Endeavour in February 2000, acquired elevation measurements for nearly all of Earth landmass between 60°N and 56°S latitudes.
Crater Highlands, Tanzania
This topographic map acquired by NASA Shuttle Radar Topography Mission SRTM from data collected on February 16, 2000 vividly displays California famous San Andreas Fault along the southwestern edge of the Mojave Desert, Calif.
San Andreas Fault, Southern California, Shaded Relief, Wrapped Color as Height
The prominent linear feature straight down the center of this perspective view is the San Andreas Fault in an image created with data from NASA shuttle Radar Topography Mission SRTM.
Perspective View, San Andreas Fault
This perspective view acquired by NASA Shuttle Radar Topography Mission SRTM from data collected in the year 2000 shows Patagonia, Argentina, a spectacular landscape formed by volcanoes, rivers, and wind.
Perspective view of shaded relief, color as height, Patagonia, Argentina
The 1,200-kilometer 800-mile San Andreas is the longest fault in California and one of the longest in North America as seen by NASA Shuttle Radar Topography Mission SRTM on February 16, 2000.
San Andreas Fault in the Carrizo Plain
San Joaquin, the name given to the southern portion of California vast Central Valley, as shown in this image acquired by NASA Shuttle Radar Topography Mission SRTM on February 16, 2000.
SRTM Perspective View with Landsat Overlay: San Joaquin Valley, California
This perspective view acquired by NASA Shuttle Radar Topography Mission SRTM from data collected in the year 2000 shows Lakes Managua and Nicaragua near the Pacific coast of Nicaragua.
Perspective View with Landsat Overlay, Lakes Managua and Nicaragua
This image is of Ventura, California, one of this state oldest cities, and Lake Casitas, California. NASA Shuttle Radar Topography Mission SRTM acquired this data on February 16, 2000.
SRTM Perspective View with Landsat Overlay: Ventura, and Lake Casitas, California
This topographic map acquired by NASA Shuttle Radar Topography Mission SRTM from data collected on February 16, 2000 vividly displays California famous San Andreas Fault along the southwestern edge of the Mojave Desert, Calif.
San Andreas Fault, Southern California , Radar Image, Wrapped Color as Height
The prominent linear feature straight down the center of this perspective view is California famous San Andreas Fault. The image was created with data from NASA Shuttle Radar Topography Mission SRTM.
Perspective View, San Andreas Fault
A site in the Crater Highlands of Tanzania reveals the difference between NASA Shuttle Radar Topography Mission SRTM digital elevation model data as originally released in 2004 left and as now released at full resolution in 2014 right.
Tanzania Images Highlight Improvements in Full-Resolution SRTM Africa Data
This topographic acquired by NASA Shuttle Radar Topography Mission SRTM from data collected on February 16, 2000 shows the relationship of the urban area of Pasadena, California to the natural contours of the land.
San Gabriel Mountains, California, Shaded relief, Color as Height
Pando Province, Bolivia, and adjacent parts of Brazil and Peru are seen in this visualization of NASA Shuttle Radar Topography Mission SRTM elevation data covering part of the Amazon Basin.
Pando Province, Northern Bolivia, Shaded Relief and Colored Height
The Kamchatka Peninsula in eastern Russia is shown in this scene created from a preliminary elevation model derived from the first data collected during NASA Shuttle Radar Topography Mission SRTM on February 12, 2000.
SRTM Colored Height and Shaded Relief: Sredinnyy Khrebet, Kamchatka Peninsula, Russia
Japan Mt. Fuji presents a beautiful backdrop for the city of Tokyo as seen in this image generated from NASA Shuttle Radar Topography Mission SRTM data on February 21, 2000.
Perspective View with Radar Image Overlaid, Color as Height: Mt. Fuji and Tokyo, Japan
This topographic map acquired by NASA Shuttle Radar Topography Mission SRTM from data collected on February 12, 2000 shows the western side of the volcanically active Kamchatka Peninsula, Russia.
Shaded Relief, Kamchatka Peninsula, Russia
This perspective view from NASA Shuttle Radar Topography Mission SRTM, acquired on February 2000, shows central Panama, with the remnants of the extinct volcano El Valle in the foreground and the Caribbean Sea in the distance.
Perspective View with Color-Coded Shaded Relief, Central Panama
Tokyo, located on the island of Honshu, with Mt. Fuji in the background as seen in this image generated from NASA Shuttle Radar Topography Mission SRTM data on February 21, 2000.
Perspective View with Radar Image Overlaid, Color as Height: Mt. Fuji and Tokyo, Japan
Santa Barbara, California, is often called America Riviera as seen in this image generated from NASA Shuttle Radar Topography Mission SRTM data on February 16, 2000.
SRTM Perspective View with Landsat Overlay: Santa Barbara, California
This stereoscopic satellite image showing Miquelon and Saint Pierre Islands, located south of Newfoundland, Canada, was generated by draping NASA Landsat satellite image over a preliminary Shuttle Radar Topography Mission SRTM elevation model.
SRTM Stereo Pair with Landsat Overlay: Miquelon and Saint Pierre Islands
This topographic image acquired by NASA Shuttle Radar Topography Mission SRTM from data collected on February 15, 2000, of Patagonia, Argentina shows a spectacular landscape formed by volcanoes, rivers, and wind.
Shaded relief, color as height Patagonia, Argentina
Digital elevation models DEMs, such as those produced by NASA Shuttle Radar Topography Mission SRTM, allow user-controlled visualization of the Earth landforms that is not possible using satellite imagery alone.
Landsat - SRTM Shaded Relief Comparison, Los Angeles and Vicinity
This perspective view acquired by NASA Shuttle Radar Topography Mission SRTM from data collected on February 12, 2000 shows the western side of the volcanically active Kamchatka Peninsula, Russia.
Perspective View, Kamchatka Peninsula, Russia
This shaded relief topographic acquired by NASA Shuttle Radar Topography Mission SRTM image from data collected on February 12, 2000 shows the western side of the volcanically active Kamchatka Peninsula, Russia.
Shaded Relief Color Wrapped, Kamchatka Peninsula, Russia
This image acquired by NASA Shuttle Radar Topography Mission SRTM from data collected on February 12, 2000 shows two islands, Miquelon and Saint Pierre, located south of Newfoundland, Canada.
Shaded Relief Image of Saint Pierre and Miquelon
The Alpine fault runs parallel to, and just inland of, much of the west coast of New Zealand South Island. This view was created from the near-global digital elevation model produced by NASA Shuttle Radar Topography Mission SRTM.
Alpine Fault, New Zealand, SRTM Shaded Relief and Colored Height
On January 26, 2001, the city of Bhuj suffered the most deadly earthquake in India history. This stereoscopic image was generated from NASA Landsat satellite and data from Shuttle Radar Topography Mission SRTM.
SRTM Stereo Pair: Bhuj, India, Two Weeks After Earthquake
This image acquired by NASA Shuttle Radar Topography Mission SRTM from data collected on February 12, 2000 shows two islands, Miquelon and Saint Pierre, located south of Newfoundland, Canada.
3-D perspective of Saint Pierre and Miquelon Islands
This perspective view, acquired by NASA Shuttle Radar Topography Mission SRTM in Feb. 2000, shows the western part of the city of Pasadena, California, looking north towards the San Gabriel Mountains.
Pasadena, California Perspective View with Aerial Photo and Landsat Overlay
This perspective view acquired by NASA Shuttle Radar Topography Mission SRTM from data collected on February 16, 2000 shows an area of Ventura County, California, including Simi Valley in the center of the image.
Simi Valley, California, Perspective View of Shaded Relief, Color as Height
This perspective view shows the western side of the volcanically active Kamchatka Peninsula in eastern Russia. The image was generated using the first data collected during NASA Shuttle Radar Topography Mission SRTM.
3-D Perspective View, Kamchatka Peninsula, Russia
Erosional features are prominent in this view of southern Colorado taken NASA Shuttle Radar Topography Mission SRTM. The area covers about 20,000 square kilometers and is located about 50 kilometers south of Pueblo, Colorado.
SRTM Colored Height and Shaded Relief: Piñon Canyon region, Colorado
The top picture is a shaded relief image of the northwest corner of Mexico Yucatan Peninsula generated from NASA Shuttle Radar Topography Mission SRTM data, and shows a subtle, but unmistakable, indication of the Chicxulub impact crater.
Shaded Relief with Height as Color and Landsat, Yucatan Peninsula, Mexico
This depiction of an area south of San Martin de Los Andes, Argentina, is the first Shuttle Radar Topography Mission SRTM view of the Andes Mountains, the tallest mountain chain in the western hemisphere.
SRTM Colored Height and Shaded Relief: Laguna Mellquina, Andes Mountains, Argentina
This perspective view shows the city of Bhuj, India, in the foreground gray area after an earthquake in western India on January 26, 2001. This image was generated from NASA Landsat satellite and data from Shuttle Radar Topography Mission SRTM.
SRTM Perspective View with Landsat Overlay: Bhuj, India
This perspective view acquired by NASA Shuttle Radar Topography Mission SRTM from data collected on February 18, 2000 shows three Hawaiian islands: Molokai lower left, Lanai right, and the northwest tip of Maui upper left.
Perspective View, Radar Image, Color as Height, Molokai, Lanai and Maui, Hawaii
This three-dimensional perspective view, looking up the Tigil River, acquired by NASA Shuttle Radar Topography Mission SRTM from data collected on February 16, 2000, shows the western side of the volcanically active Kamchatka Peninsula, Russia.
Kamchatka Peninsula, Russia 3-D Perspective with Landsat Overlay
These images of the world were generated with data from the Shuttle Radar Topography Mission (SRTM). The SRTM Project has recently released a new global data set called SRTM30, where the original one arcsecond of latitude and longitude resolution (about 30 meters, or 98 feet, at the equator) was reduced to 30 arcseconds (about 928 meters, or 1496 feet.) These images were created from that data set and show the Earth as it would be viewed from a point in space centered over the Americas, Africa and the western Pacific.  Two visualization methods were combined to produce the image: shading and color coding of topographic height. The shade image was derived by computing topographic slope in the northwest-southeast direction, so that northwest slopes appear bright and southeast slopes appear dark. Color coding is directly related to topographic height, with green at the lower elevations, rising through yellow and tan, to white at the highest elevations.  Elevation data used in this image were acquired by the Shuttle Radar Topography Mission aboard the Space Shuttle Endeavour, launched on Feb. 11, 2000.  http://photojournal.jpl.nasa.gov/catalog/PIA03394
World Globes, Shaded Relief and Colored Height
This topographic image acquired by SRTM shows an area south of the Sao Francisco River in Brazil. The scrub forest terrain shows relief of about 400 meters (1300 feet). Areas such as these are difficult to map by traditional methods because of frequent cloud cover and local inaccessibility. This region has little topographic relief, but even subtle changes in topography have far-reaching effects on regional ecosystems. The image covers an area of 57 km x 79 km and represents one quarter of the 225 km SRTM swath. Colors range from dark blue at water level to white and brown at hill tops. The terrain features that are clearly visible in this image include tributaries of the Sao Francisco, the dark-blue branch-like features visible from top right to bottom left, and on the left edge of the image, and hills rising up from the valley floor. The San Francisco River is a major source of water for irrigation and hydroelectric power. Mapping such regions will allow scientists to better understand the relationships between flooding cycles, forestation and human influences on ecosystems.  This shaded relief image was generated using topographic data from the Shuttle Radar Topography Mission. A computer-generated artificial light source illuminates the elevation data to produce a pattern of light and shadows. Slopes facing the light appear bright, while those facing away are shaded. On flatter surfaces, the pattern of light and shadows can reveal subtle features in the terrain. Shaded relief maps are commonly used in applications such as geologic mapping and land use planning.  http://photojournal.jpl.nasa.gov/catalog/PIA02700
Shaded Relief of Rio Sao Francisco, Brazil
The city of New Orleans, situated on the southern shore of Lake Pontchartrain, is shown in this radar image from the Shuttle Radar Topography Mission (SRTM). In this image bright areas show regions of high radar reflectivity, such as from urban areas, and elevations have been coded in color using height data also from the SRTM mission. Dark green colors indicate low elevations, rising through yellow and tan, to white at the highest elevations.  New Orleans is near the center of this scene, between the lake and the Mississippi River. The line spanning the lake is the Lake Pontchartrain Causeway, the world’s longest overwater highway bridge. Major portions of the city of New Orleans are actually below sea level, and although it is protected by levees and sea walls that are designed to protect against storm surges of 18 to 20 feet, flooding during storm surges associated with major hurricanes is a significant concern.   http://photojournal.jpl.nasa.gov/catalog/PIA04174
New Orleans Topography, Radar Image with Colored Height
inal Caption Released with Image:      The colored regions of this map show the extent of digital elevation data recently released by the Shuttle Radar Topography Mission (SRTM). This release includes data for most of Europe and Asia plus numerous islands in the Indian and Pacific Oceans. SRTM flew on board the Space Shuttle Endeavour in February 2000 and used an interferometric radar system to map the topography of Earth's landmass between latitudes 56 degrees south and 60 degrees north.      The data were processed into geographic "tiles," each of which represents one by one degree of latitude and longitude. A degree of latitude measures 111 kilometers (69 miles) north-south, and a degree of longitude measures 111 kilometers or less east-west, decreasing away from the equator. The data are being released to the public on a continent-by-continent basis. This Eurasia segment includes 5,940 tiles, more than a third of the total data set. Previous releases covered North America and South America. Forthcoming releases will include Africa-Arabia and Australia plus an "Islands" release for those islands not included in the continental releases. Together these data releases constitute the world's first high-resolution, near-global elevation model. The resolution of the publicly released data is three arcseconds (1/1,200 of a degree of latitude and longitude), which is about 90 meters (295 feet).      European coverage in the current data release stretches eastward from the British Isles and the Iberian Peninsula in the west, across the Alps and Carpathian Mountains, as well as the Northern European Plain, to the Ural and Caucasus Mountains bordering Asia. The Asian coverage includes a great diversity of landforms, including the Tibetan Plateau, Tarin Basin, Mongolian Plateau, and the mountains surrounding Lake Baikal, the world's deepest lake. Mt. Everest in the Himalayas, at 8,848 meters (29,029 feet) is the world's highest mountain. From India's Deccan Plateau, to Southeast Asia, coastal China, and Korea, various landforms place constraints upon land use planning for a great population. Volcanoes in the East Indies, the Philippines, Japan, and the Kamchatka Peninsula form the western part of the "Ring of Fire" around the Pacific Ocean.      Many of these regions were previously very poorly mapped due to persistent cloud cover or the inaccessibility of the terrain. Digital elevation data, such as provided by SRTM, are particularly in high demand by scientists studying earthquakes, volcanism, and erosion patterns for use in mapping and modeling hazards to human habitation. But the shape of Earth's surface affects nearly every natural process and human endeavor that occurs there, so elevation data are used in a wide range of applications.      In this index map color-coding is directly related to topographic height, with green at the lower elevations, rising through yellow and tan, to white at the highest elevations. The large, very dark green feature in western Asia is the Caspian Sea, which is below sea level. Blue areas on the map represent water within the mapped tiles, each of which includes shorelines or islands.  http://photojournal.jpl.nasa.gov/catalog/PIA03398
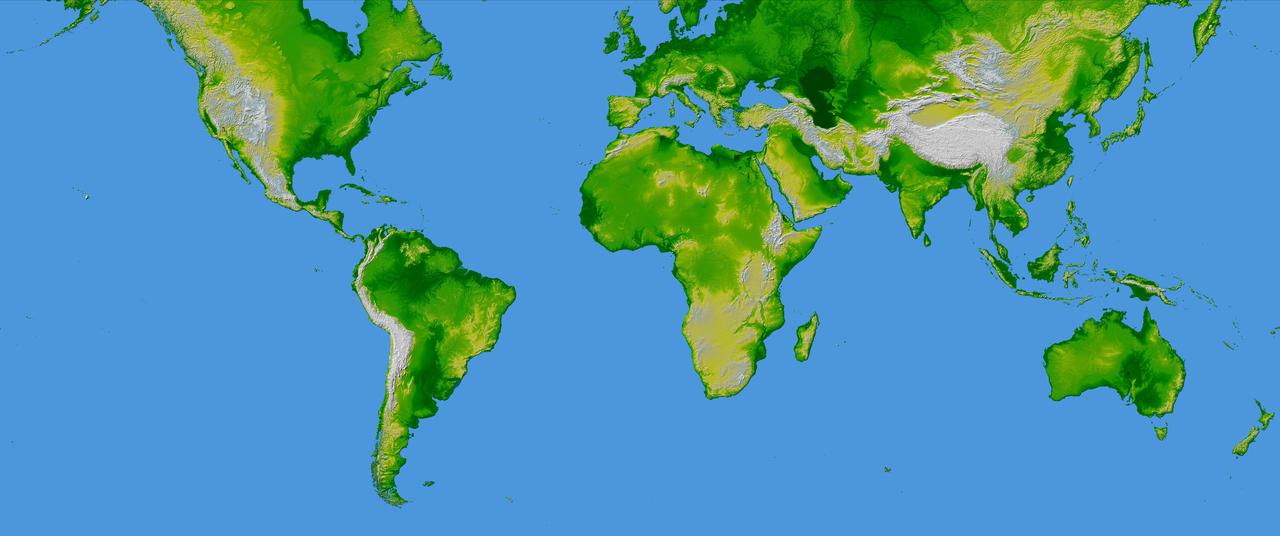
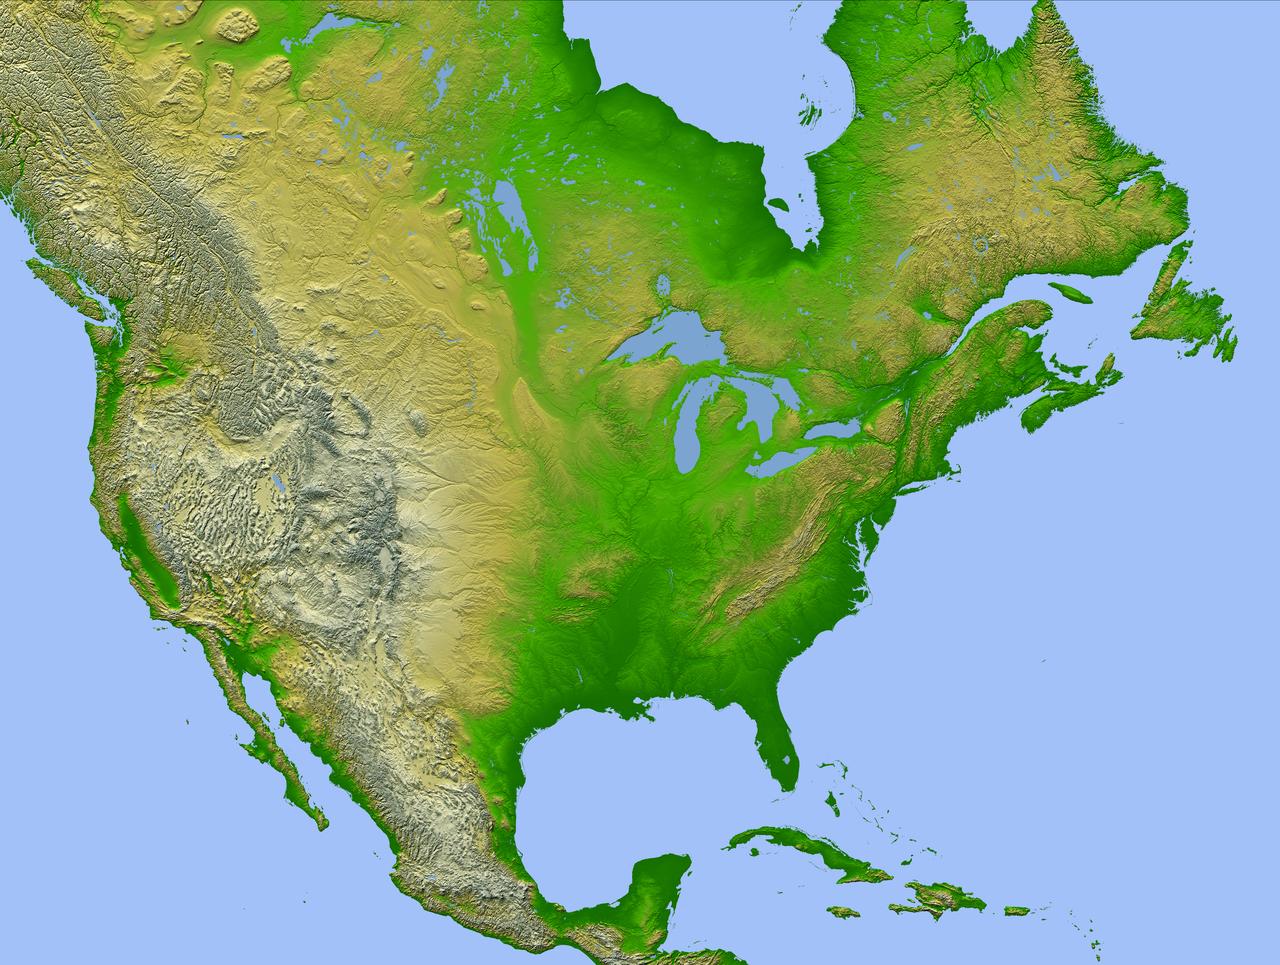
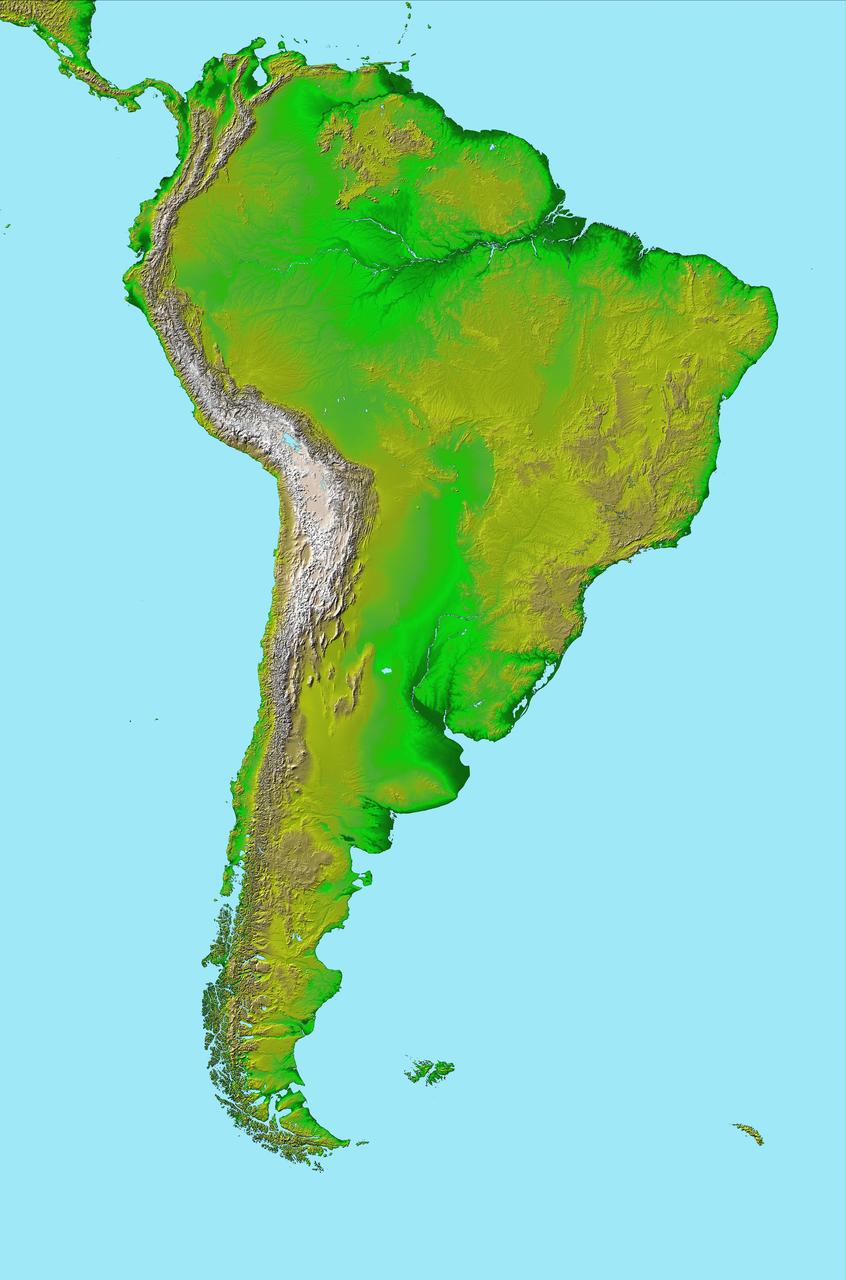
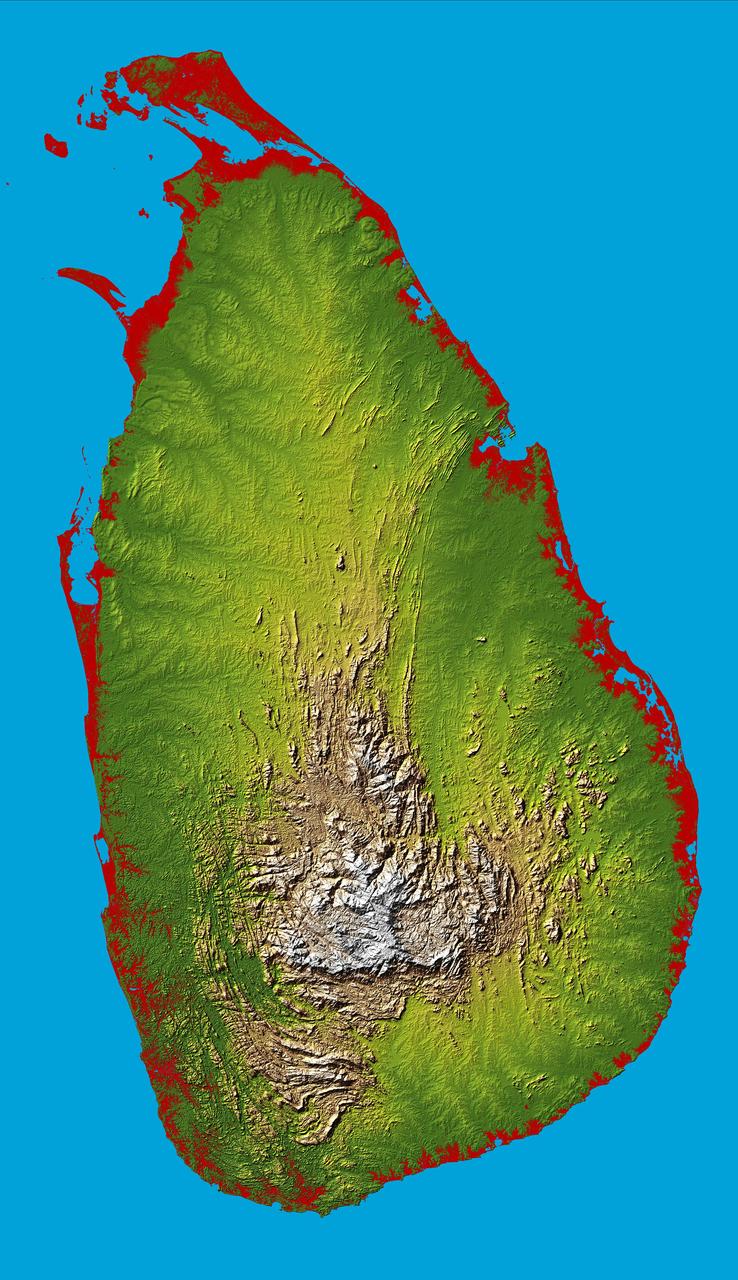
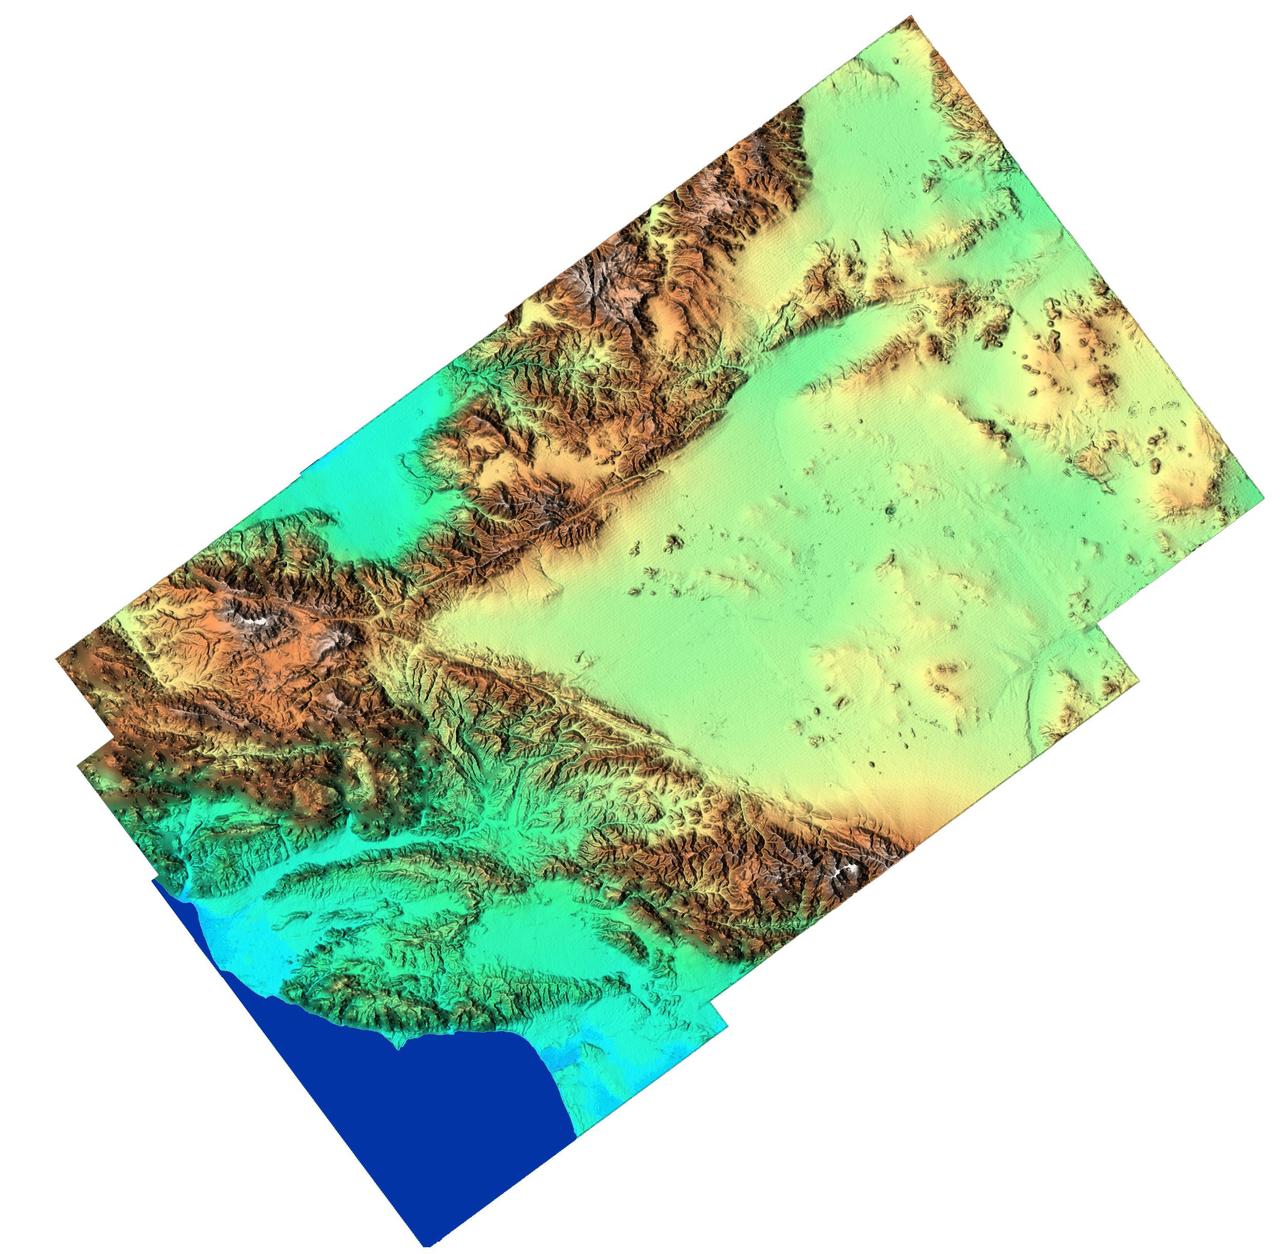
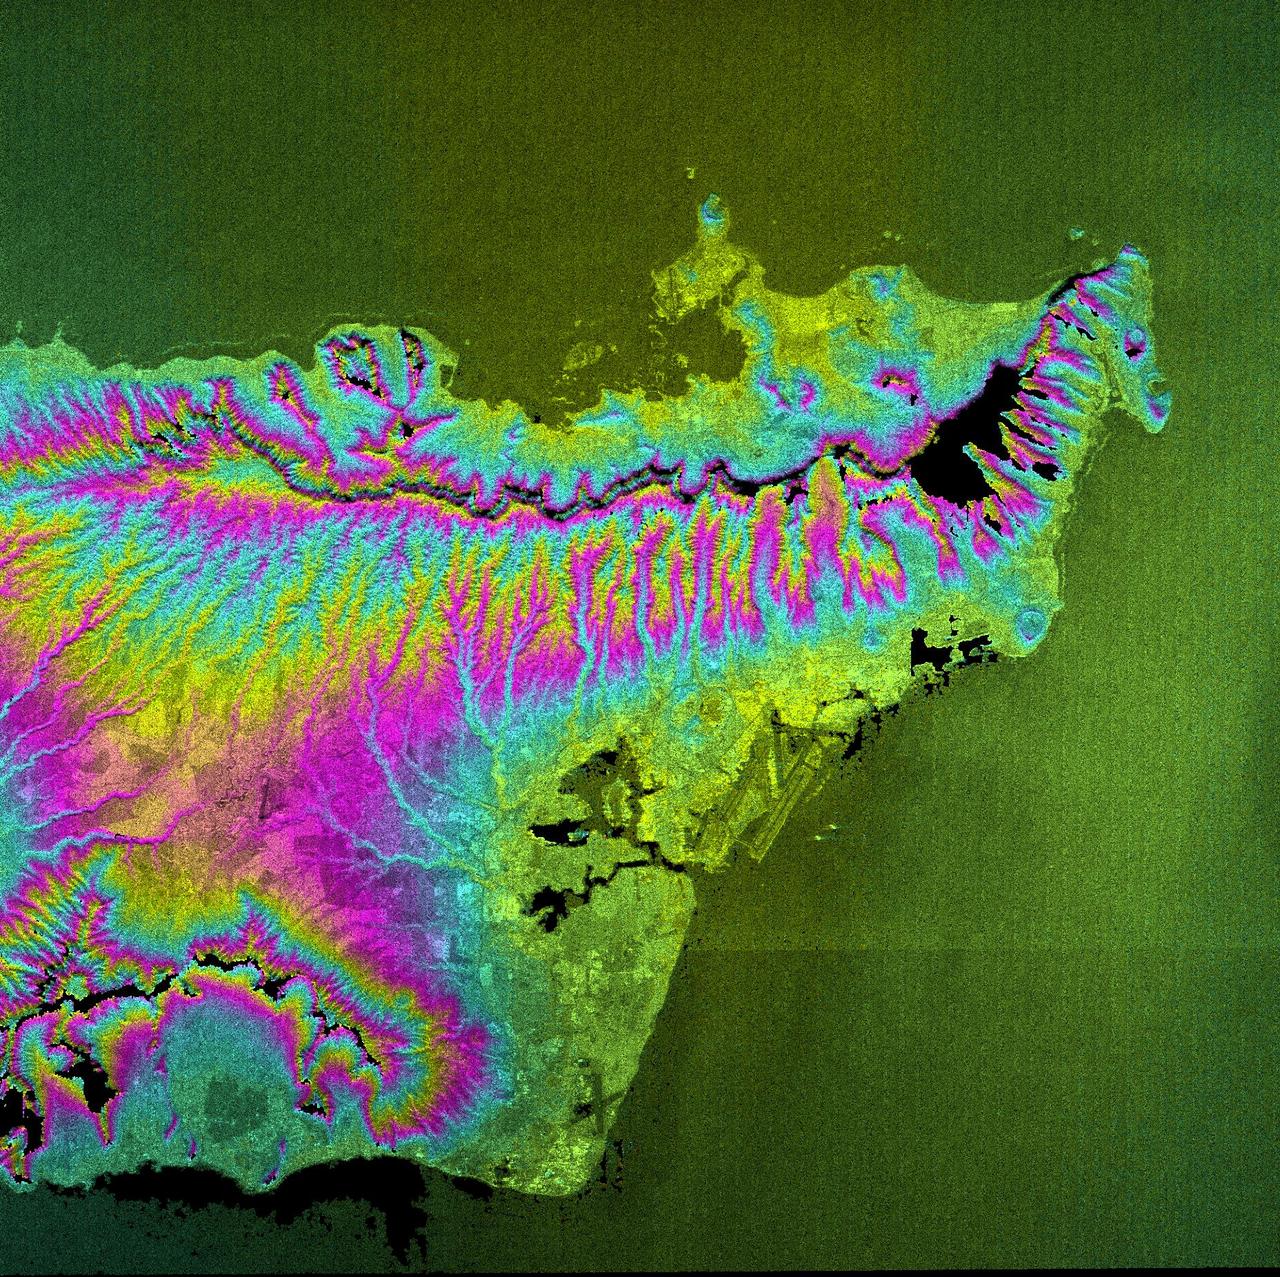
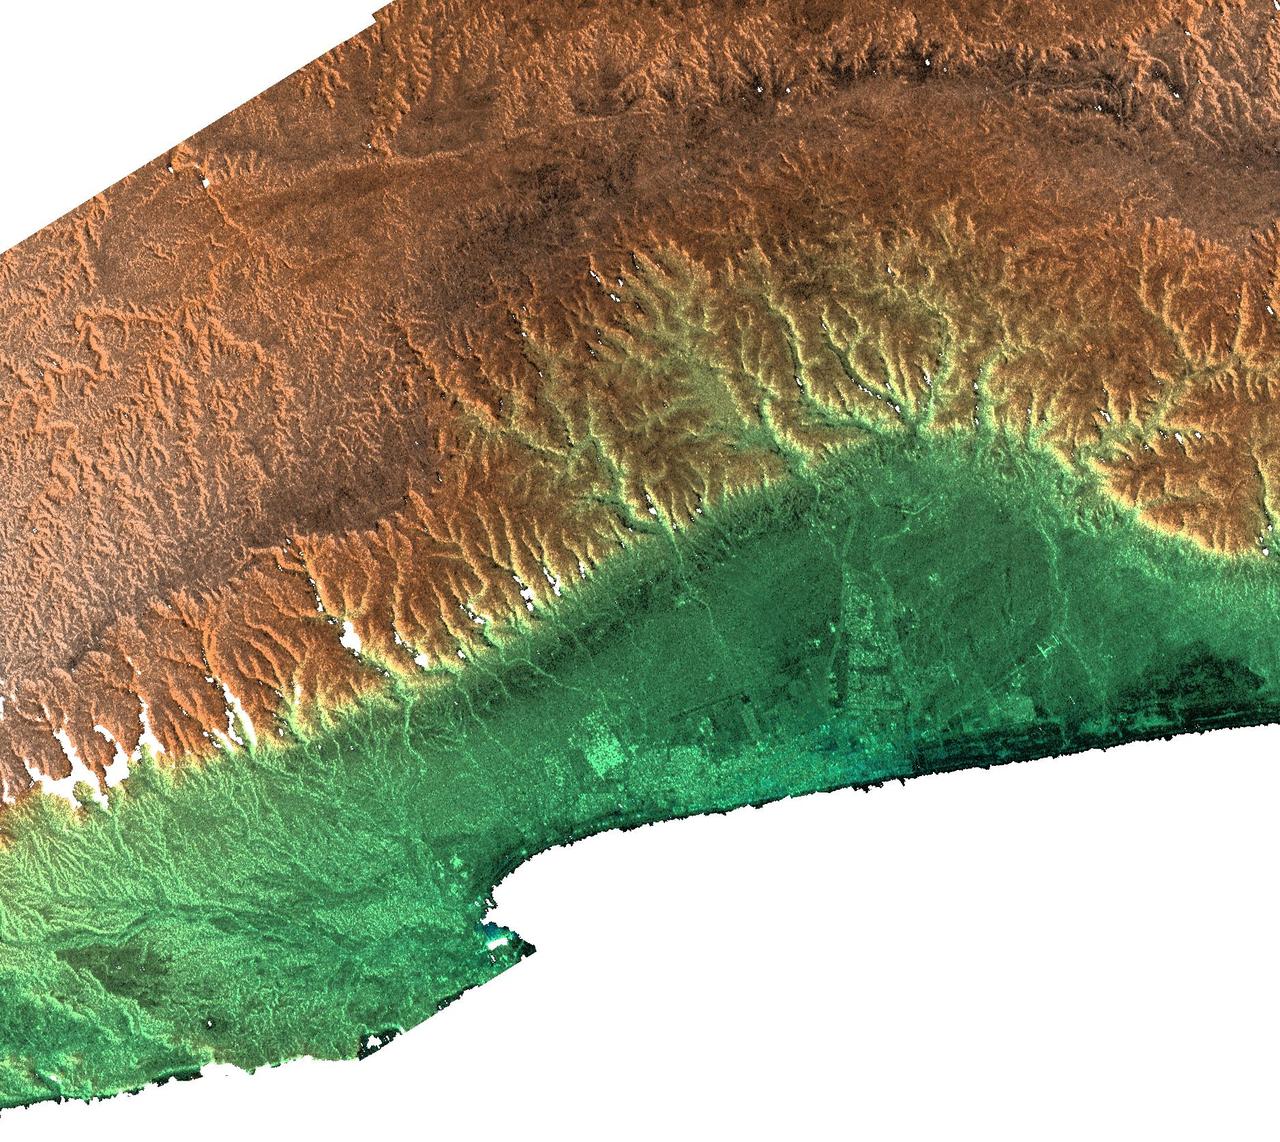
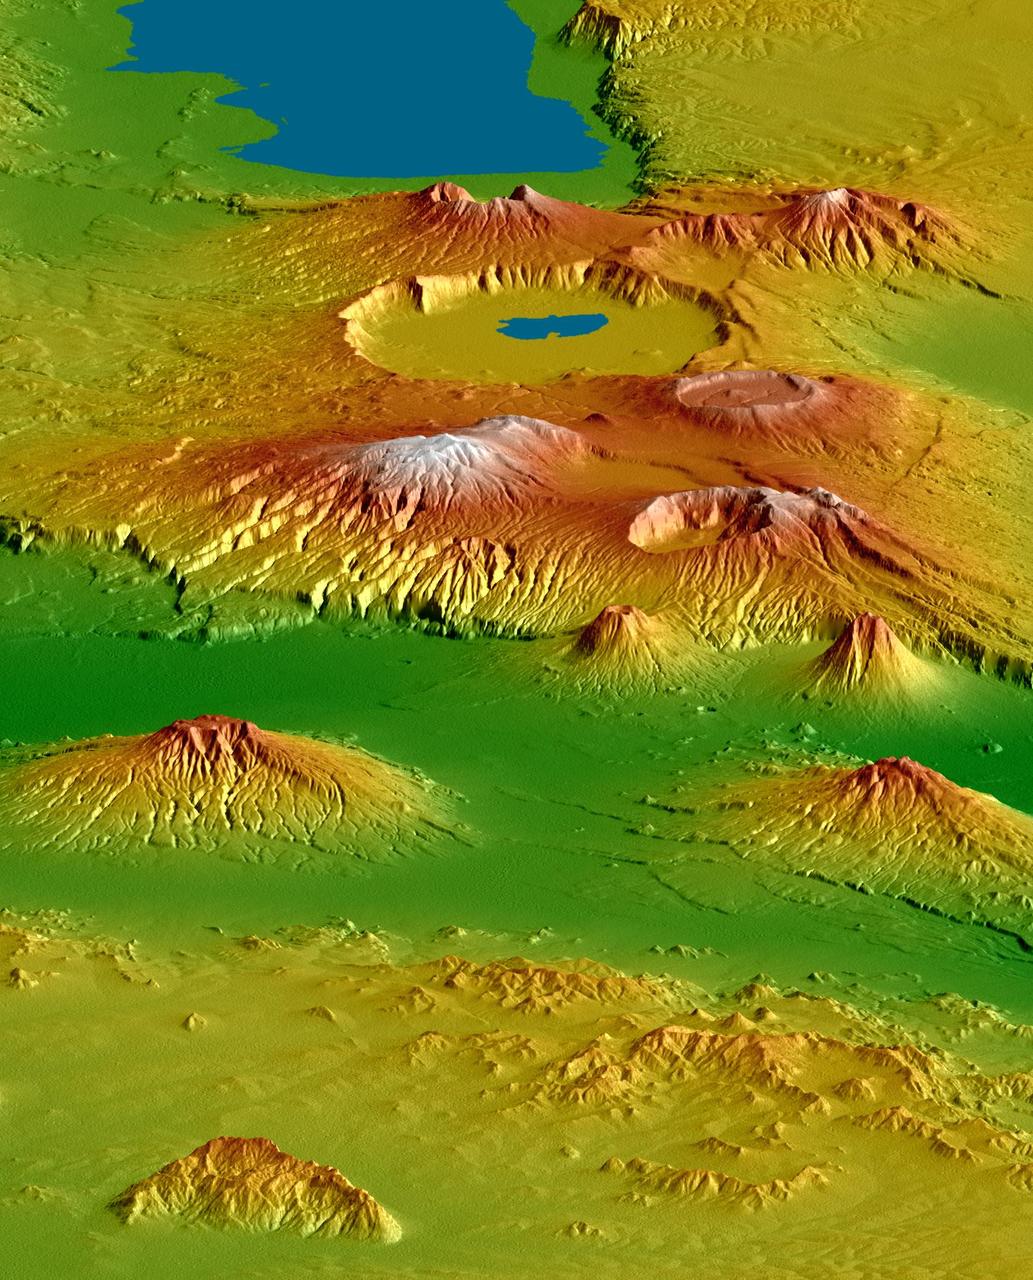
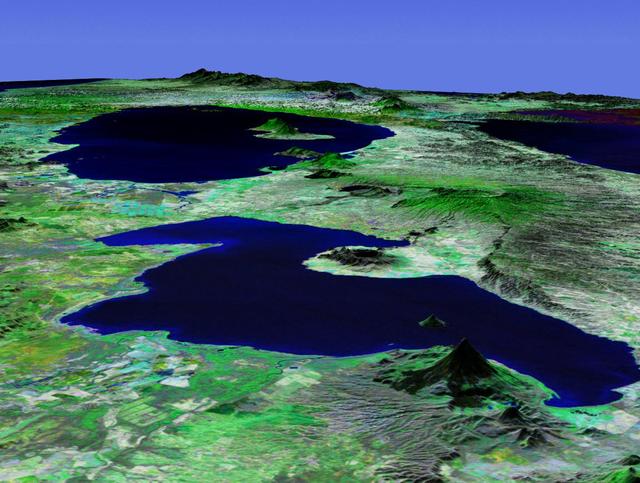
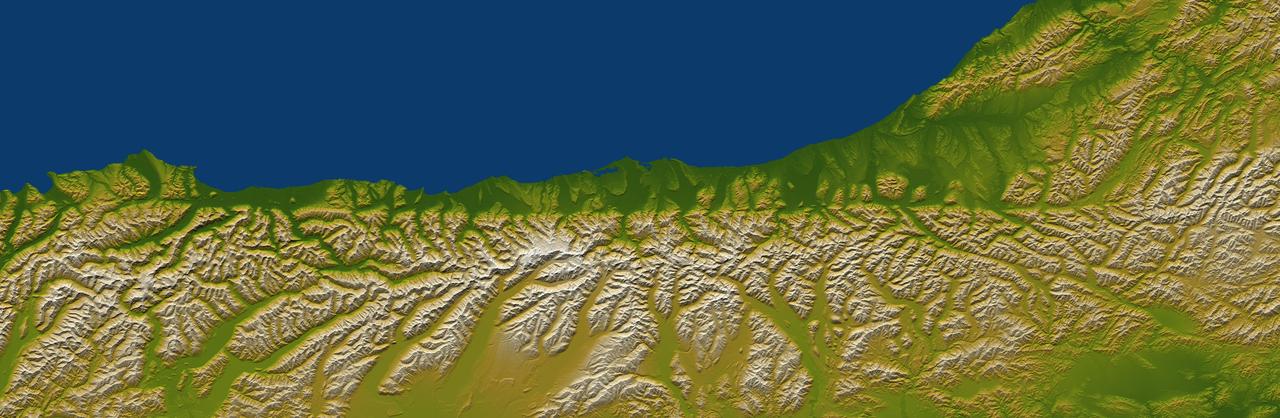
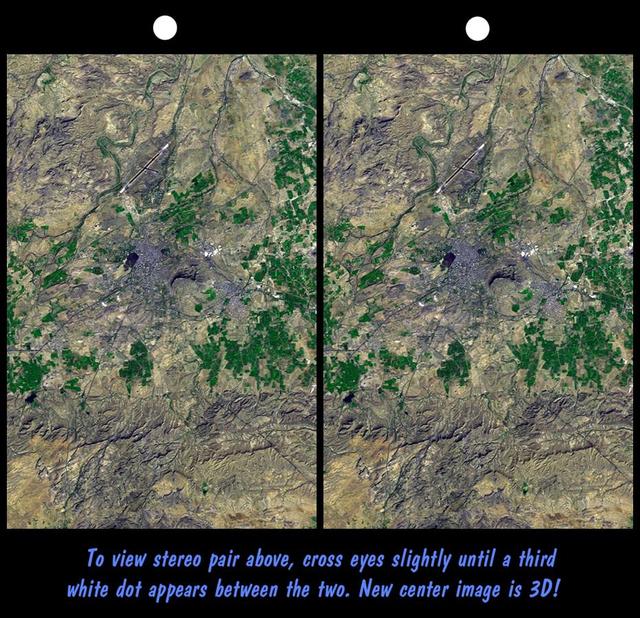
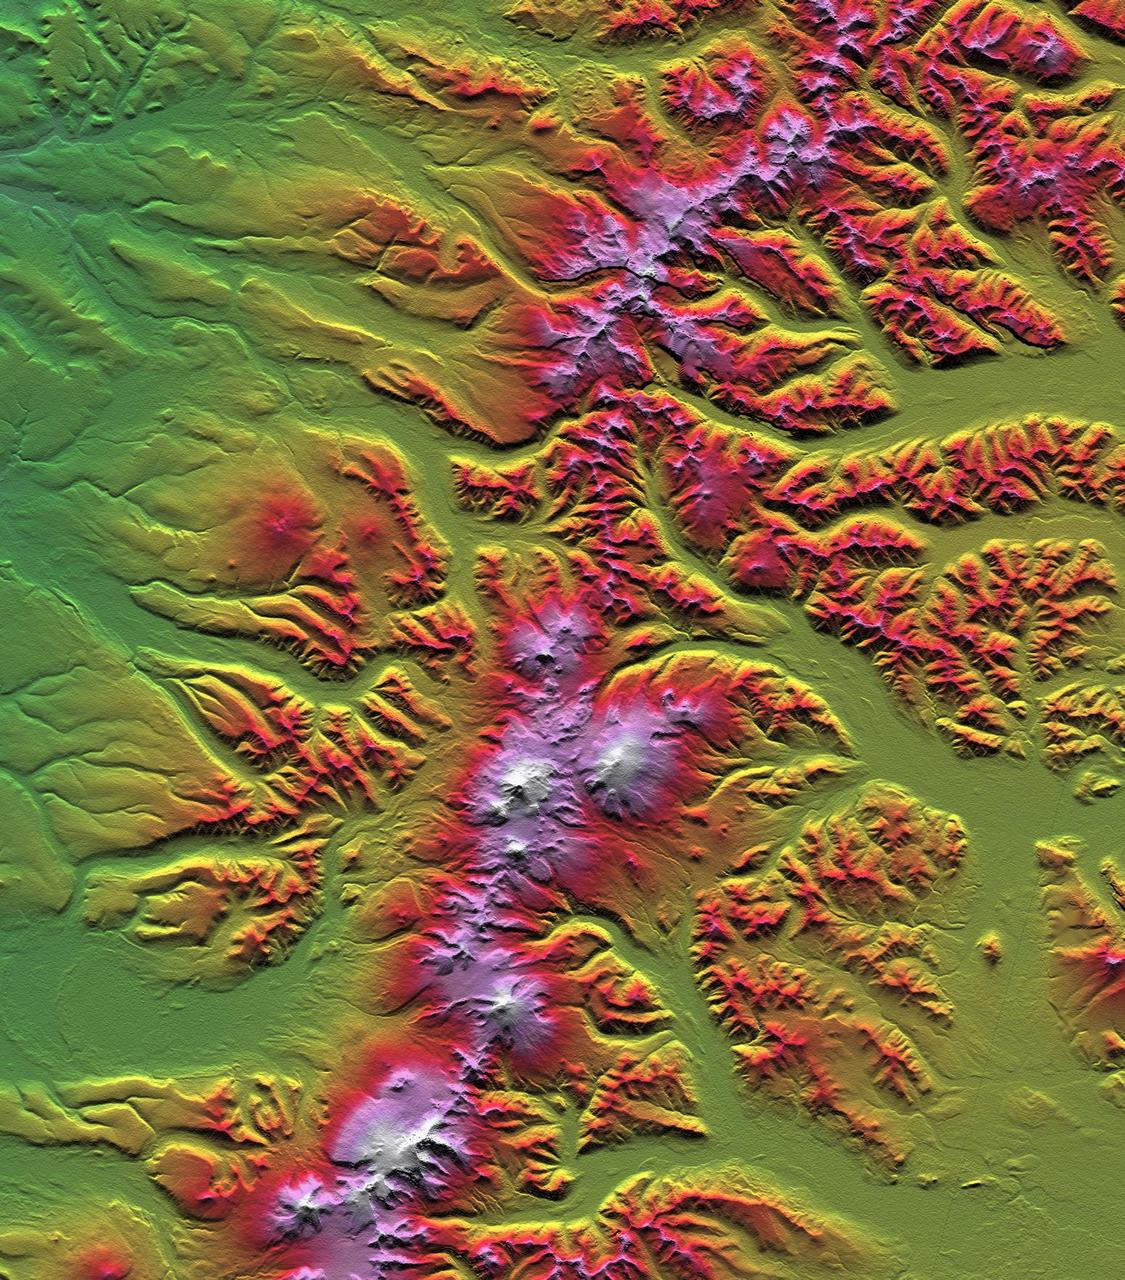
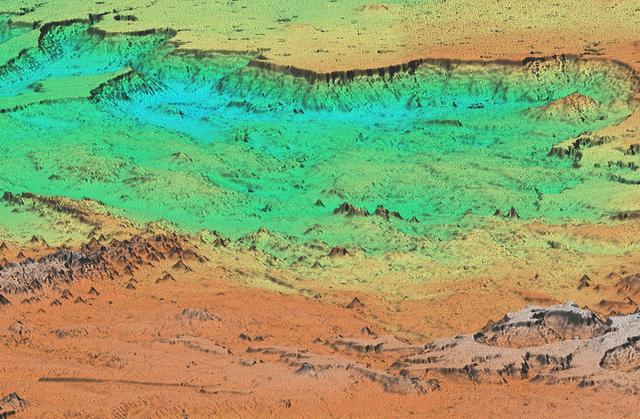
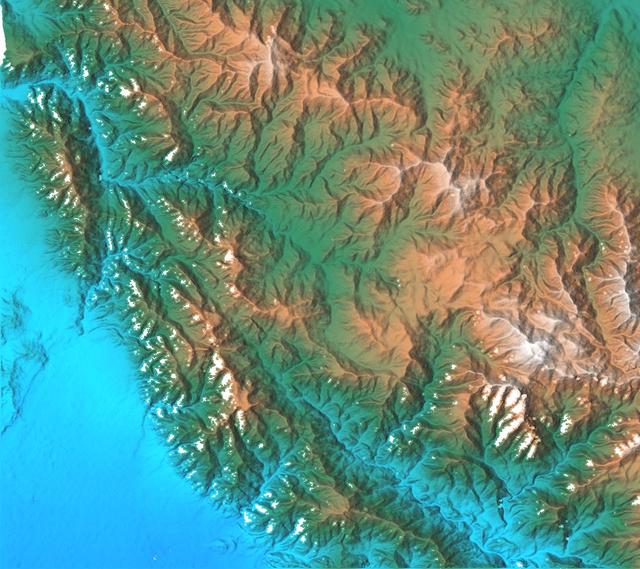
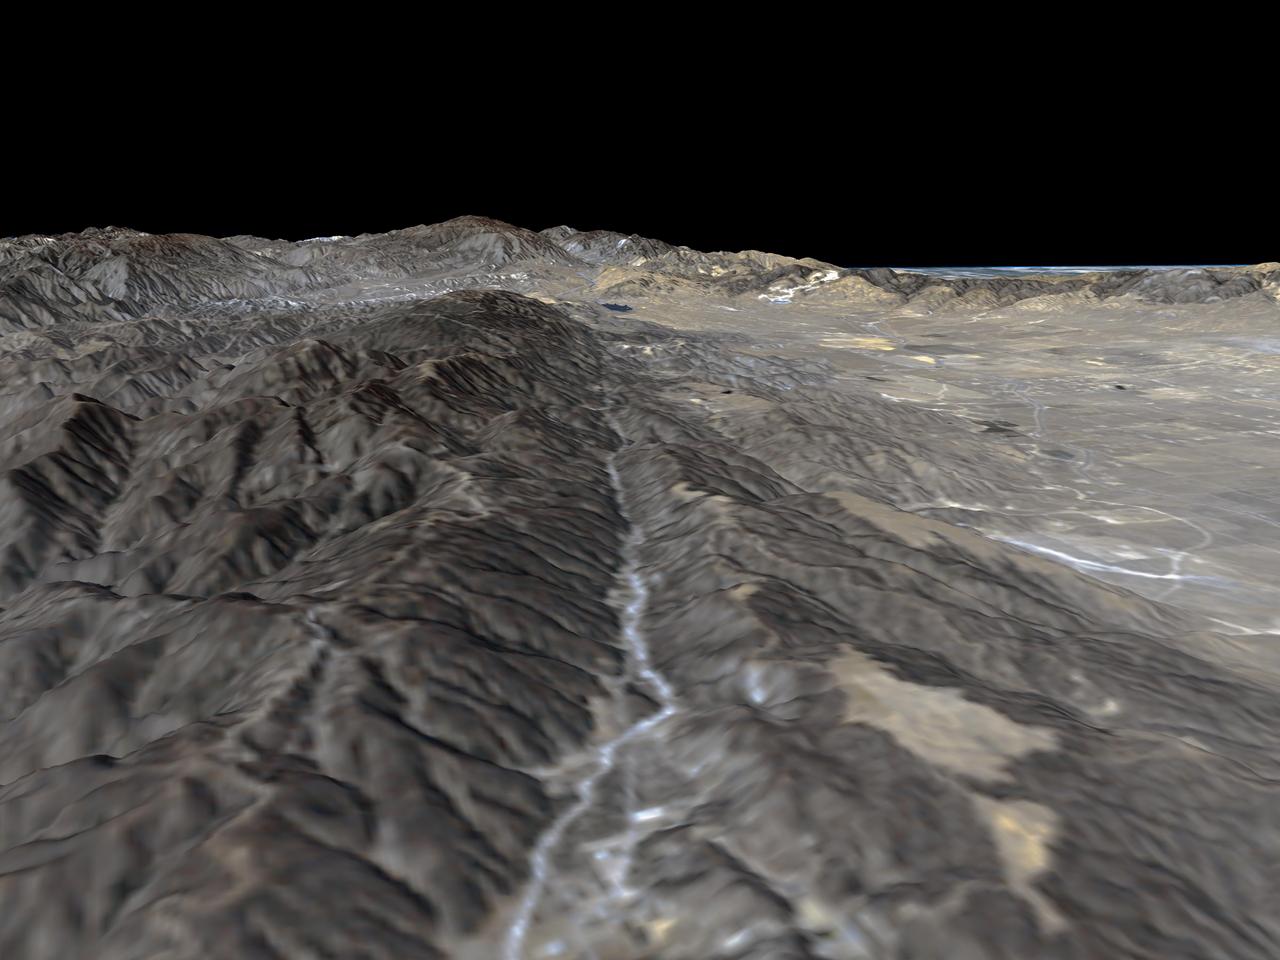
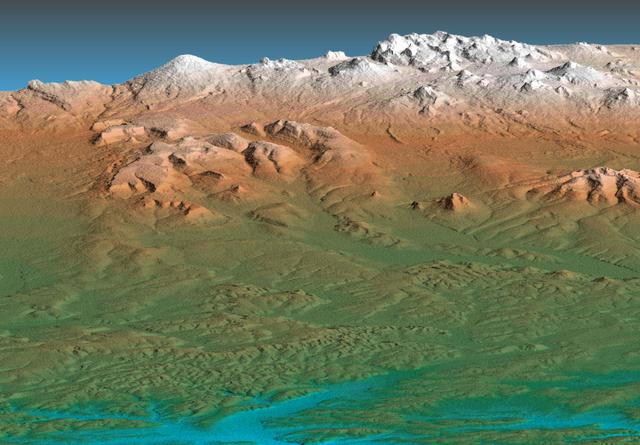
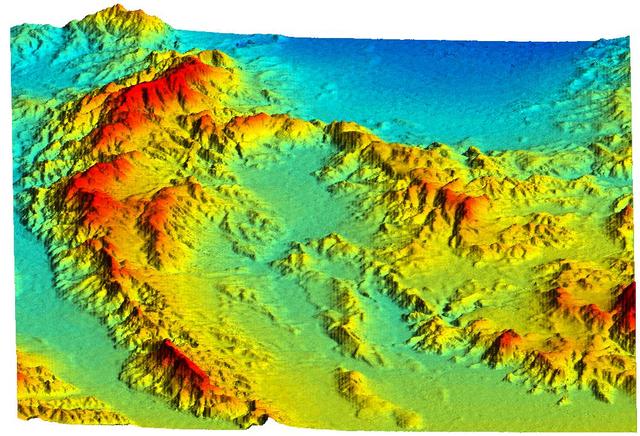
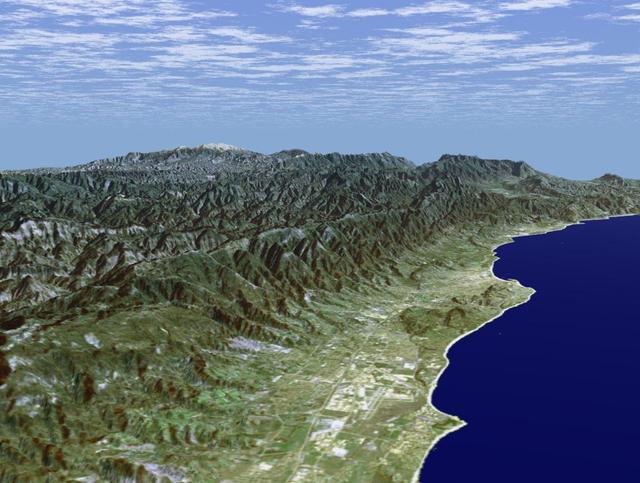
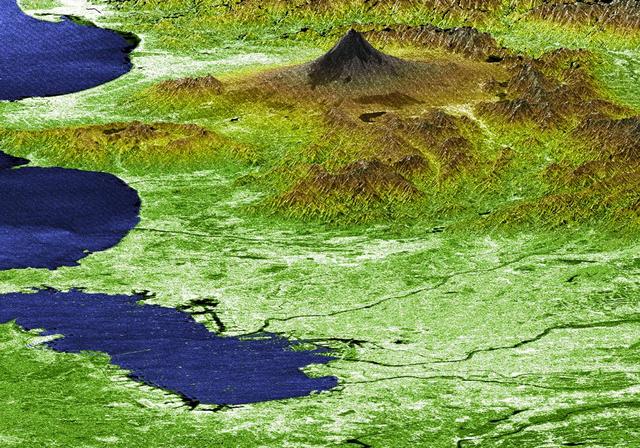
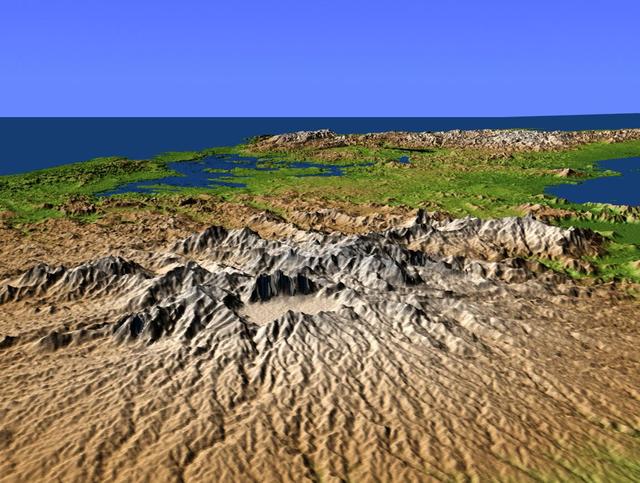
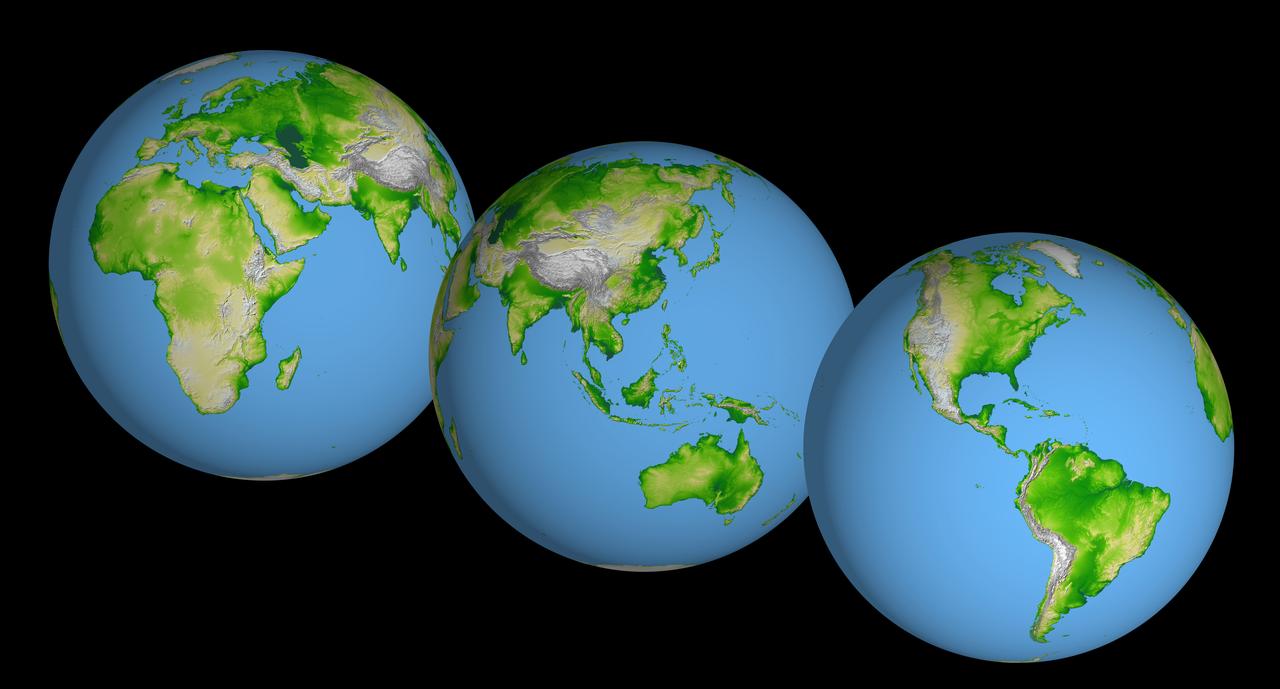
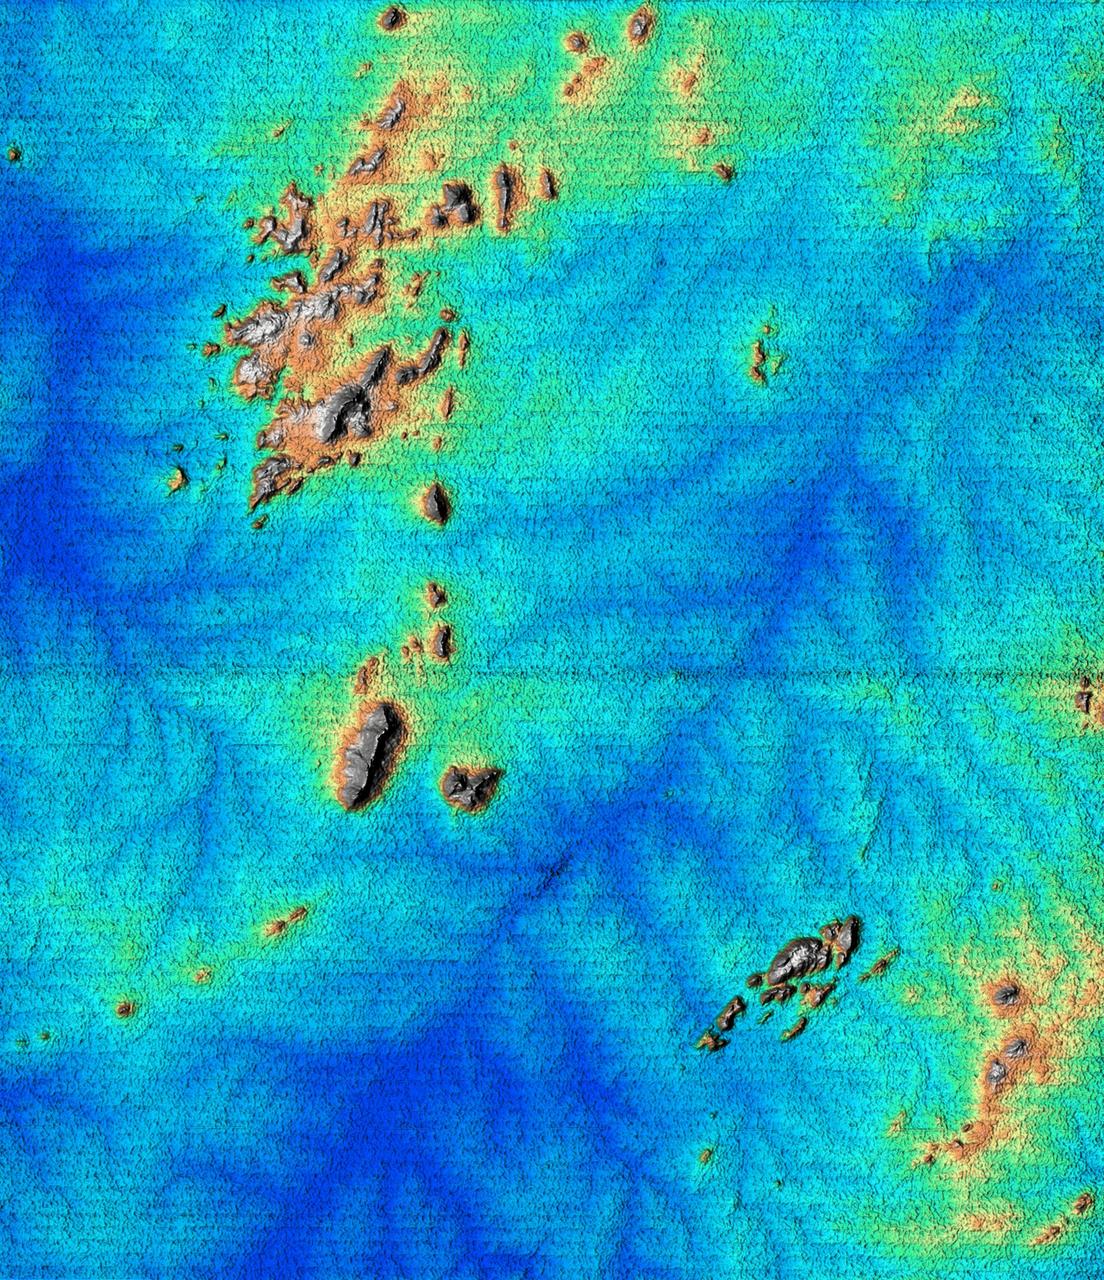
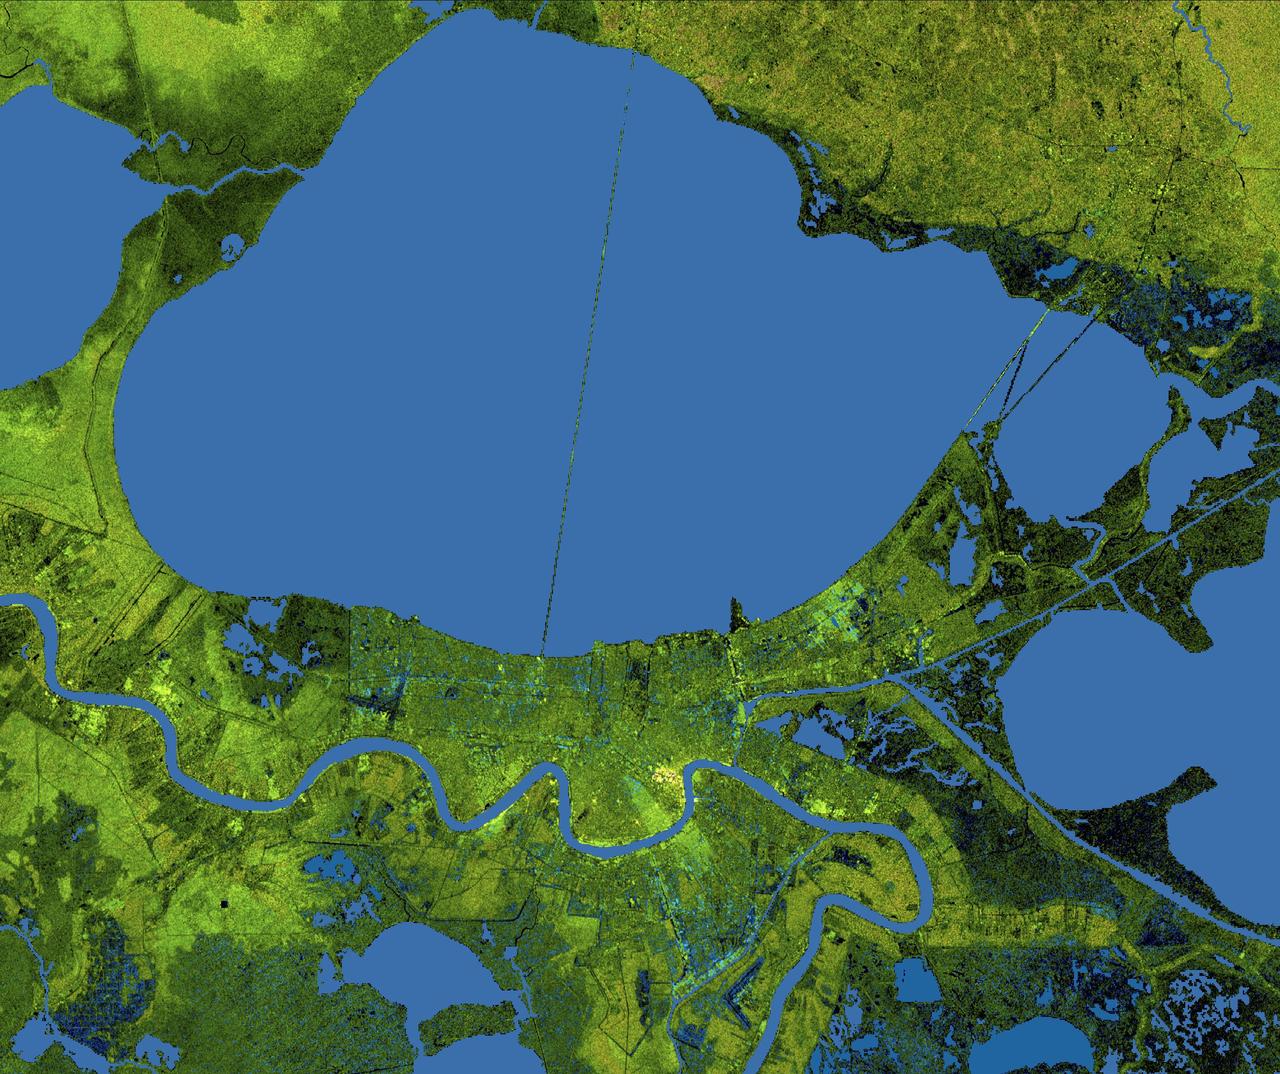
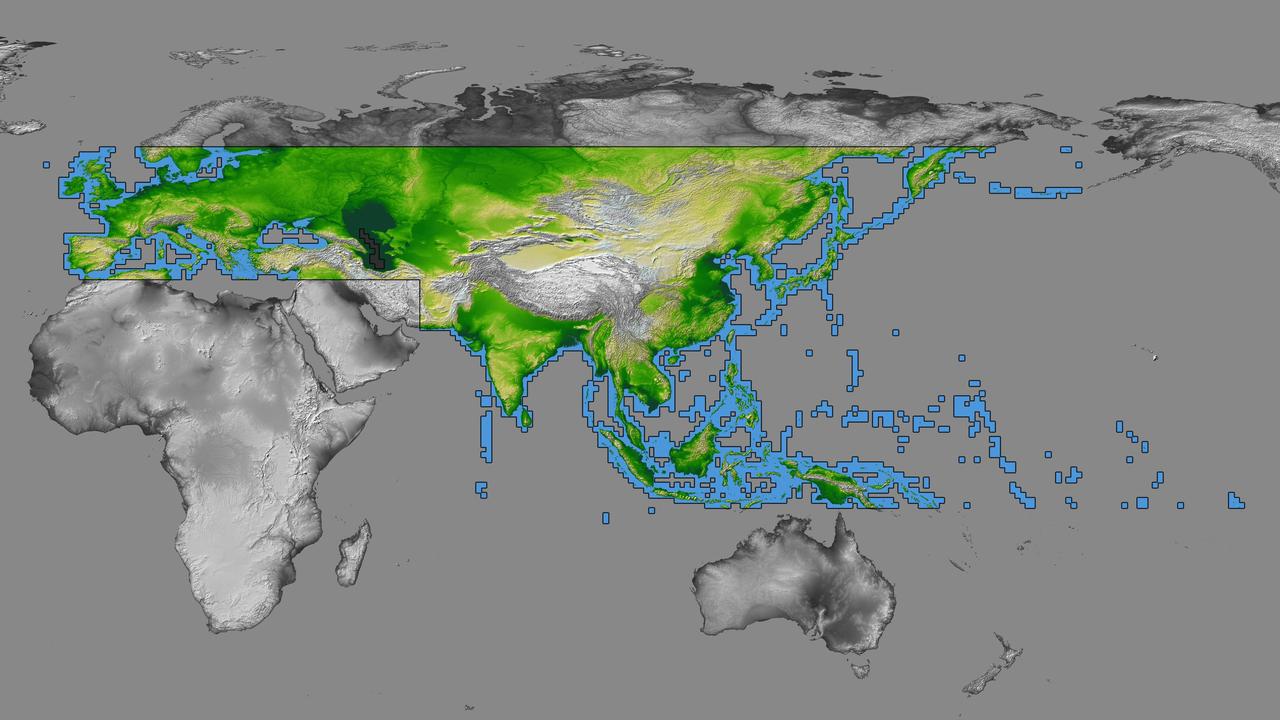
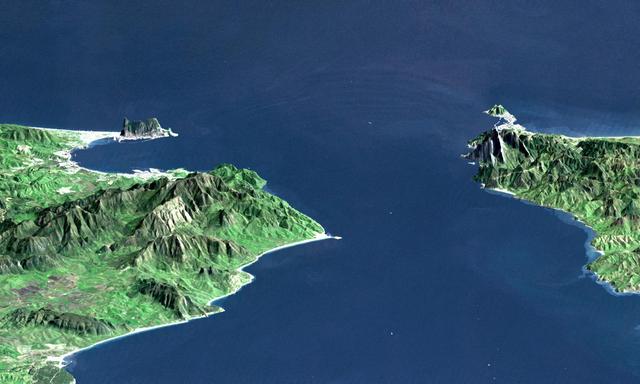
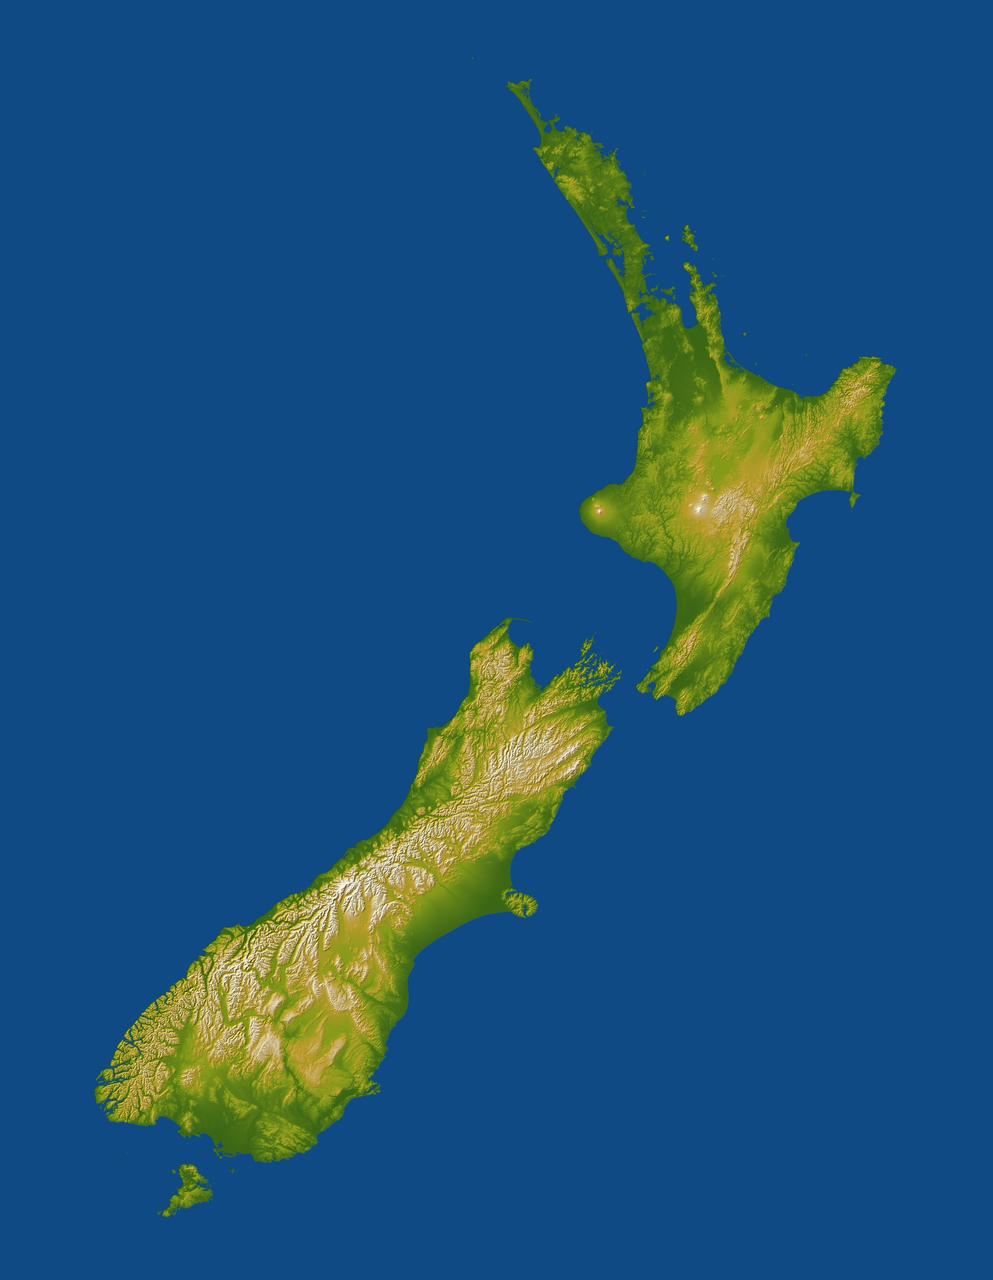
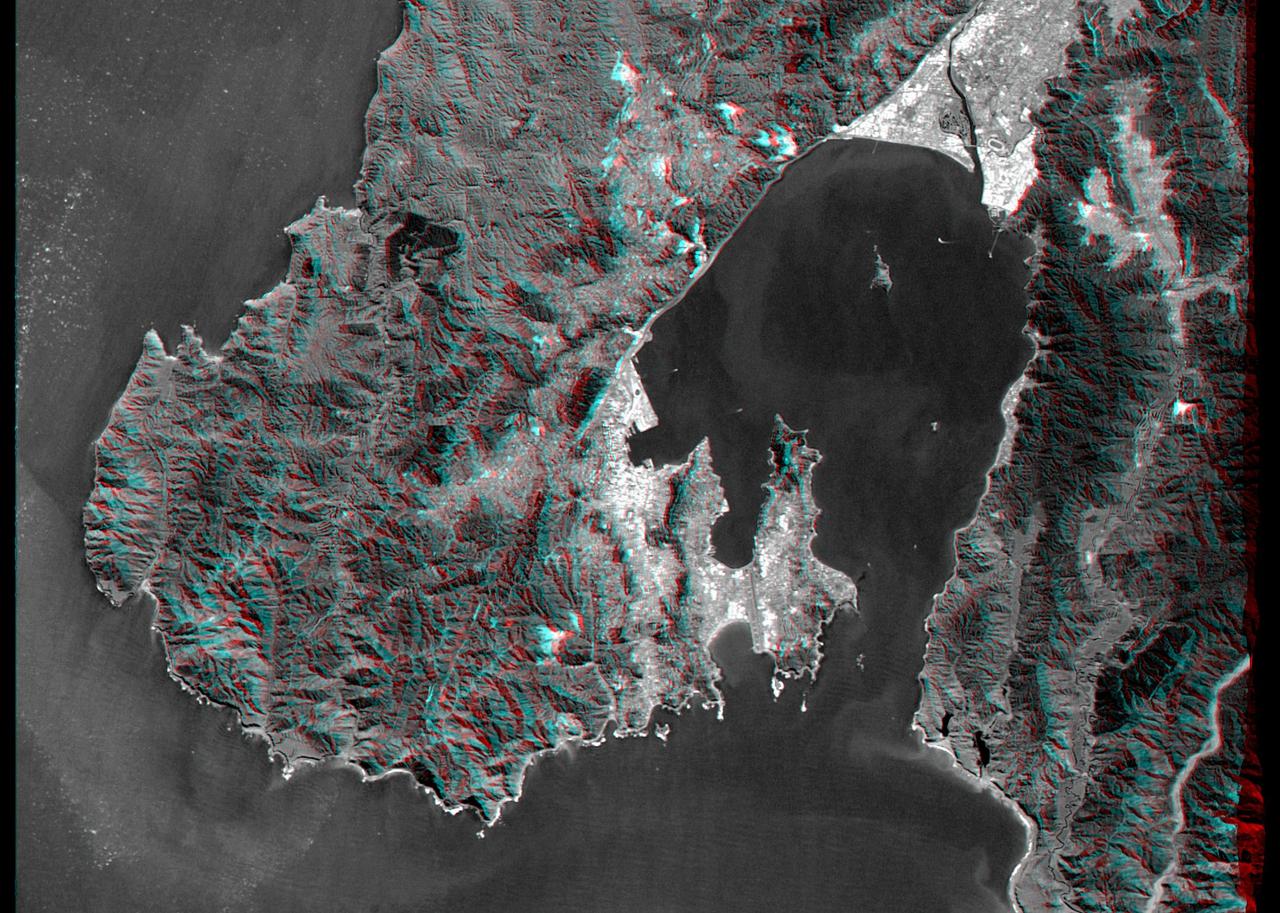
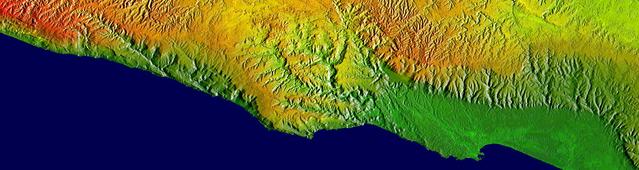
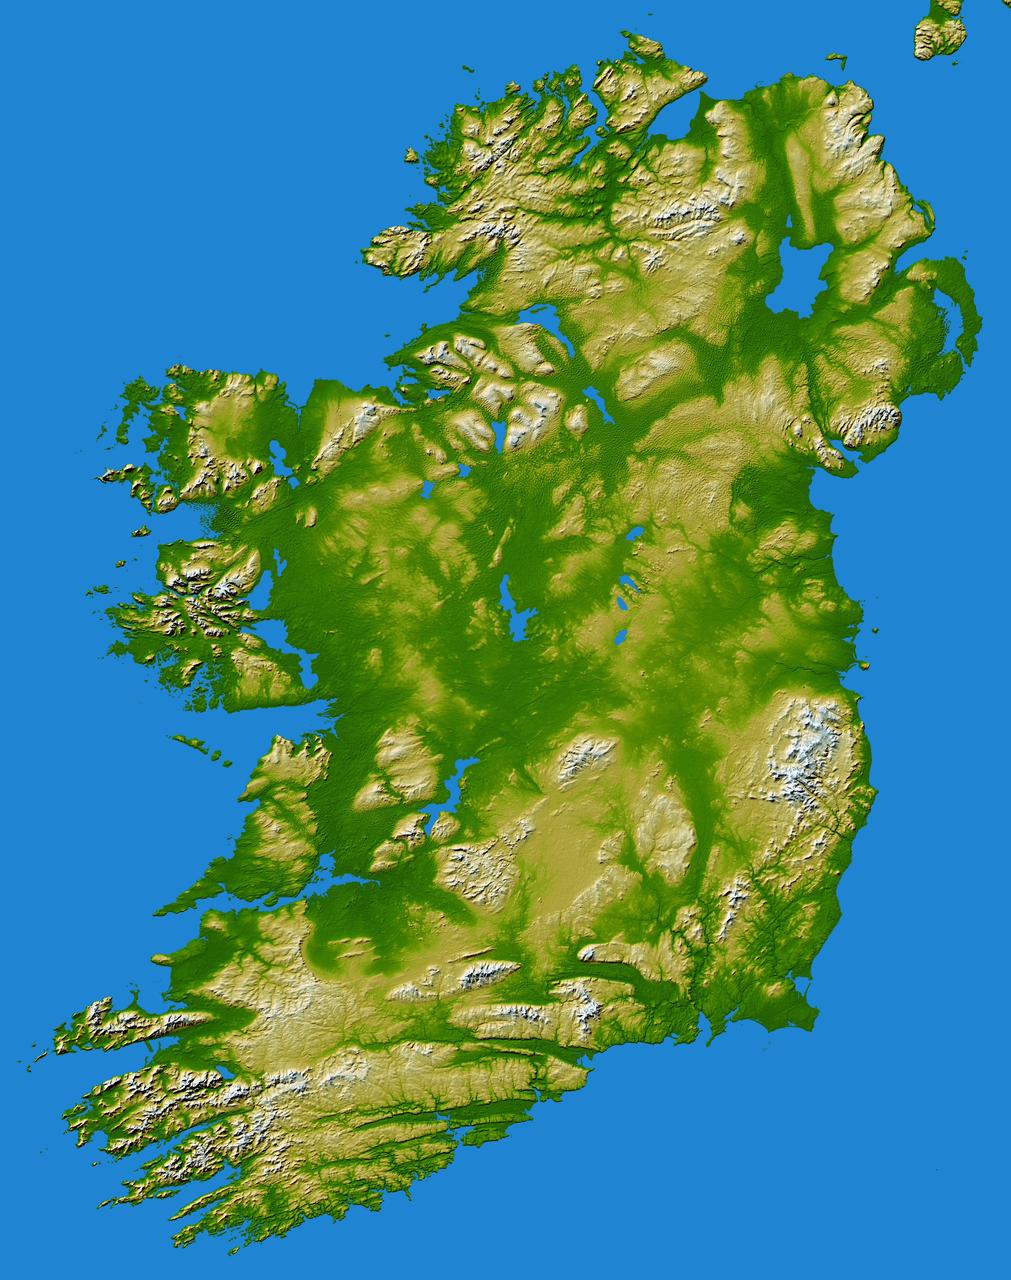
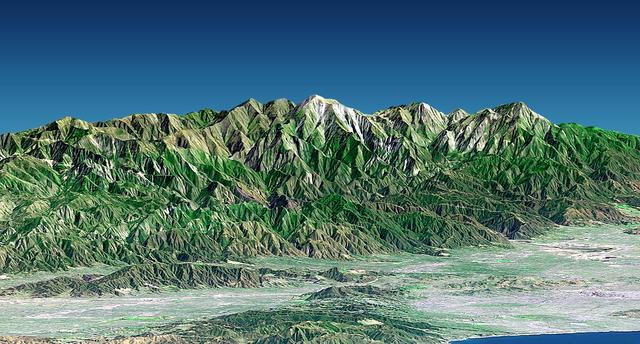
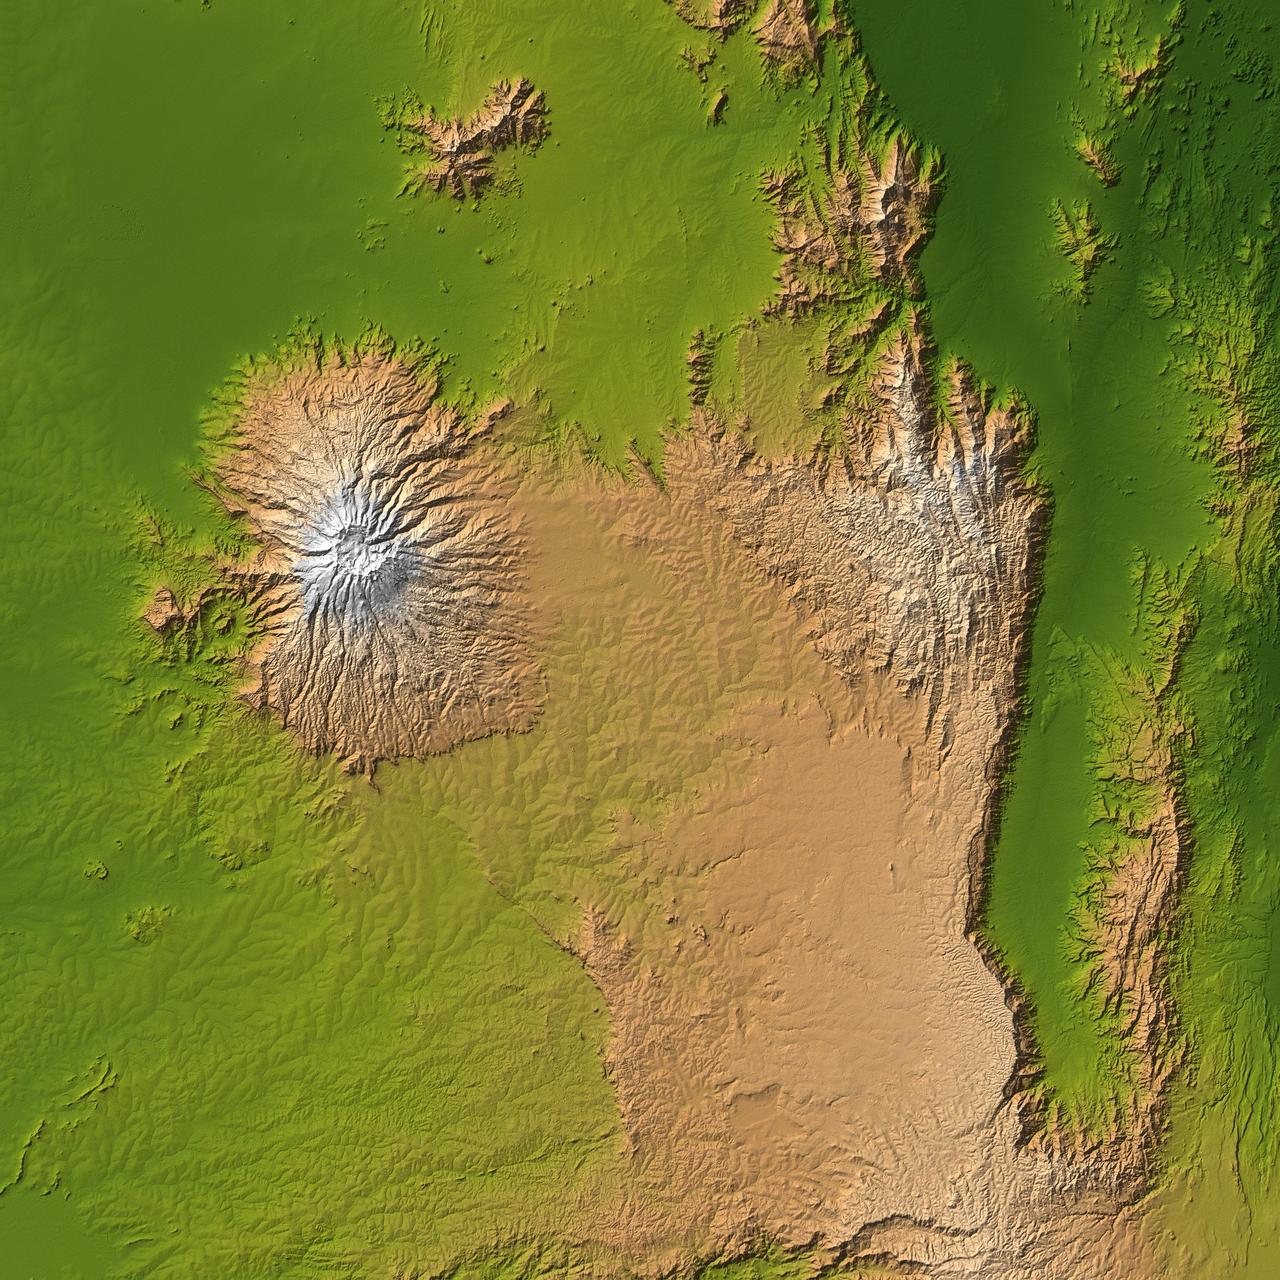
SRTM Data Release for Eurasia, Index Map and Colored Height
This perspective view shows the Strait of Gibraltar, which is the entrance to the Mediterranean Sea from the Atlantic Ocean. Europe (Spain) is on the left. Africa (Morocco) is on the right. The Rock of Gibraltar, administered by Great Britain, is the peninsula in the back left.  The Strait of Gibraltar is the only natural gap in the topographic barriers that separate the Mediterranean Sea from the world's oceans. The Sea is about 3700 kilometers (2300 miles) long and covers about 2.5 million square kilometers (one million square miles), while the Strait is only about 13 kilometers (8 miles) wide. Sediment samples from the bottom of the Mediterranean Sea that include evaporite minerals, soils, and fossil plants show that about five million years ago the Strait was topographically blocked and the Sea had evaporated into a deep basin far lower in elevation than the oceans. Consequent changes in the world's hydrologic cycle, including effects upon ocean salinity, likely led to more ice formation in polar regions and more reflection of sunlight back to space, resulting in a cooler global climate at that time. Today, topography plays a key role in our regional climate patterns. But through Earth history, topographic change, even perhaps over areas as small as 13 kilometers across, has also affected the global climate.  This image was generated from a Landsat satellite image draped over an elevation model produced by the Shuttle Radar Topography Mission (SRTM). The view is eastward with a 3-times vertical exaggeration to enhance topographic expression. Natural colors of the scene (green vegetation, blue water, brown soil, white beaches) are enhanced by image processing, inclusion of some infrared reflectance (as green) to highlight the vegetation pattern, and inclusion of shading of the elevation model to further highlight the topographic features.  Landsat has been providing visible and infrared views of the Earth since 1972. SRTM elevation data matches the 30-meter (99-feet) resolution of most Landsat images and will substantially help in analyses of the large Landsat image archive.  Elevation data used in this image was acquired by the Shuttle Radar Topography Mission (SRTM) aboard the Space Shuttle Endeavour, launched on February 11, 2000.   http://photojournal.jpl.nasa.gov/catalog/PIA03397
Strait of Gibraltar, Perspective with Landsat Image Overlay
Italy's Mount Etna and the Aeolian Islands are the focus of this perspective view made from an Advanced Spaceborne Thermal and Emission Radiometer (ASTER) image from NASA's Terra spacecraft overlaid on Shuttle Radar Topography Mission (SRTM) topography. The image is looking south with the islands of Lipari and Vulcano in the foreground and Etna with its dark lava flows on the skyline. Vulcano also hosts an active volcano, the cone of which is prominent. In late October 2002, Etna erupted again, sending lava flows down the north and south sides of the volcano. The north flows are near the center of this view, but the ASTER image is from before the eruption.  In addition to the terrestrial applications of these data for understanding active volcanoes and hazards associated with them such as lava flows and explosive eruptions, geologists studying Mars find these data useful as an analog to martian landforms and geologic processes. In late September 2002, a field conference with the theme of Terrestrial Analogs to Mars focused on Mount Etna allowing Mars geologists to see in person the types of features they can only sample remotely.  http://photojournal.jpl.nasa.gov/catalog/PIA03370
Perspective View, Mt. Etna, Italy & the Aeolian Islands
The topography of Tutuila, largest of the islands of American Samoa, is well shown in this color-coded perspective view generated with digital elevation data from the Shuttle Radar Topography Mission (SRTM.)  The total area of Tutuila is about 141.8 square kilometers (54.8 square miles), slightly larger than San Francisco. The large bay near the center in this view is Pago Pago Harbor, actually a submerged volcanic crater whose south wall collapsed millions of years ago. Adjacent to the harbor is Pago Pago, the capital of American Samoa, and to the left (west) of the harbor in this view is Matafao Peak, Tutuila’s highest point at 653 meters (2,142 feet).  On September 29, 2009, a tsunami generated by a major undersea earthquake located about 200 kilometers (120 miles) southwest of Tutuila inundated the more heavily populated southern coast of the island with an ocean surge more than 3 meters (10 feet) deep, causing scores of casualties. Digital topographic data such as those produced by SRTM aid researchers and planners in predicting which coastal regions are at the most risk from such waves, as well as from the more common storm surges caused by tropical storms and even sea level rise.  Two visualization methods were combined to produce the image: shading and color coding of topographic height. The shaded image was derived by computing topographic slope in the northeast-southwest direction, so that northeast slopes appear bright and southwest slopes appear dark. Color coding is directly related to topographic height, with green at the lower elevations, rising through yellow and tan, to white at the highest elevations. The image was then projected using the elevation data to produce this perspective view, with the topography exaggerated by a factor of two.  http://photojournal.jpl.nasa.gov/catalog/PIA11965
American Samoa, Shaded Relief and Colored Height
On January 26, 2001, the Kachchh region in western India suffered the most deadly earthquake in India's history. This shaded topography view of landforms northeast of the city of Bhuj depicts geologic structures that are of interest in the study the tectonic processes that may have led to that earthquake. However, preliminary field studies indicate that these structures are composed of Mesozoic rocks that are overlain by younger rocks showing little deformation. Thus these structures may be old, not actively growing, and not directly related to the recent earthquake.  The Haro Hills are on the left and the Kas Hills are on the right. The Haro Hills are an "anticline," which is an upwardly convex elongated fold of layered rocks. In this view, the anticline is distinctly ringed by an erosion resistant layer of sandstone. The east-west orientation of the anticline may relate to the crustal compression that has occurred during India's northward movement toward, and collision with, Asia. In contrast, the largest of the Kas Hills appears to be a tilted (to the south) and faulted (on the north) block of layered rocks. Also seen here, the linear feature trending toward the southwest from the image center is an erosion-resistant "dike," which is an igneous intrusion into older "host" rocks along a fault plane or other crack. These features are simple examples of how shaded topography can provide a direct input to geologic studies.  In this image, colors show the elevation as measured by the Shuttle Radar Topography Mission (SRTM). Colors range from green at the lowest elevations, through yellow and red, to purple at the highest elevations. Elevations here range from near sea level to about 300 meters (about 1000 feet). Shading has been added, with illumination from the north (image top).  http://photojournal.jpl.nasa.gov/catalog/PIA03300
SRTM Colored and Shaded Topography: Haro and Kas Hills, India
Italy's Mount Etna is the focus of this perspective view made from an Advanced Spaceborne Thermal and Emission Radiometer (ASTER) image from NASA's Terra spacecraft overlaid on Shuttle Radar Topography Mission (SRTM) topography. The image is looking south with dark lava flows from the 1600's (center) to 1981 (long flow at lower right) visible in the foreground and the summit of Etna above. The city of Catania is barely visible behind Etna on the bay at the upper left. In late October 2002, Etna erupted again, sending lava flows down the north and south sides of the volcano. The north flows are near the center of this view, but the ASTER image is from before the eruption.  In addition to the terrestrial applications of these data for understanding active volcanoes and hazards associated with them such as lava flows and explosive eruptions, geologists studying Mars find these data useful as an analog to martian landforms and geologic processes. In late September 2002, a field conference with the theme of Terrestrial Analogs to Mars focused on Mount Etna, allowing Mars geologists to see in person the types of features they can only sample remotely.  http://photojournal.jpl.nasa.gov/catalog/PIA03371
Perspective View, Mt. Etna, Italy
After draining the northern flank of the Alps Mountains in Germany and Austria, the Danube River flows east as it enters this west-looking scene (upper right) and forms the border between Slovakia and Hungary. The river then leaves the border as it enters Hungary and transects the Transdanubian Mountains, which trend southwest to northeast. Upon exiting the mountains, the river turns southward, flowing past Budapest (purplish blue area) and along the western margin of the Great Hungarian Plain.  South and west of the Danube, the Transdanubian Mountains have at most only about 400 meters (about 1300 feet) of relief but they exhibit varied landforms, which include volcanic, tectonic, fluvial (river), and eolian (wind) features. A thick deposit of loess (dust deposits likely blown from ancient glacial outwash) covers much of this area, and winds from the northwest, funneled between the Alps and the Carpathian Mountains, are apparently responsible for a radial pattern of erosional streaks across the entire region.  This image was generated from a Landsat satellite image draped over an elevation model produced by the Shuttle Radar Topography Mission (SRTM). The view uses a 3-times vertical exaggeration to enhance topographic expression. The false colors of the scene result from displaying Landsat bands 1, 4, and 7 in blue, green, and red, respectively. Band 1 is visible blue light, but bands 4 and 7 are reflected infrared light. This band combination maximizes color contrasts between the major land cover types, namely vegetation (green), bare ground (red), and water (blue). Shading of the elevation model was used to further highlight the topographic features.  http://photojournal.jpl.nasa.gov/catalog/PIA04952
Budapest, Hungary, Perspective View, SRTM Elevation Model with Landsat Overlay
Mount Oyama is a 820-meter-high (2,700 feet) volcano on the island of Miyake-Jima, Japan. In late June 2000, a series of earthquakes alerted scientists to possible volcanic activity. On June 27, authorities evacuated 2,600 people, and on July 8 the volcano began erupting and erupted five times over that week. The dark gray blanket covering green vegetation in the image is the ash deposited by prevailing northeasterly winds between July 8 and 17. This island is about 180 kilometers (110 miles) south of Tokyo and is part of the Izu chain of volcanic islands that runs south from the main Japanese island of Honshu. Miyake-Jima is home to 3,800 people. The previous major eruptions of Mount Oyama occurred in 1983 and 1962, when lava flows destroyed hundreds of houses. An earlier eruption in 1940 killed 11 people.  This image is a perspective view created by combining image data from the Advanced Spaceborne Thermal Emission and Reflection Radiometer (ASTER) aboard NASA's Terra satellite with an elevation model from the Shuttle Radar Topography Mission (SRTM). Vertical relief is exaggerated, and the image includes cosmetic adjustments to clouds and image color to enhance clarity of terrain features.  http://photojournal.jpl.nasa.gov/catalog/PIA02771
ASTER-SRTM Perspective of Mount Oyama Volcano, Miyake-Jima Island, Japan
This elevation map shows a part of the southern coast of the Arabian Peninsula including parts of the countries of Oman and Yemen. The narrow coastal plain on the right side of the image includes the city of Salahlah, the second largest city in Oman.
Shaded Relief, Color as Height, Salalah, Oman
Russia Kamchatka Peninsula, lying between the Sea of Okhotsk to the west and the Bering Sea and Pacific Ocean to the east, is one of the most active volcanic regions along the Pacific Ring of Fire.
Colored Height and Shaded Relief, Kamchatka Peninsula
The volcanic nature of Mount Shasta is clearly evident in this computer-generated perspective viewed from the northwest.
Perspective View with Landsat Overlay, Mount Shasta, Calif.
Most of the population of Utah lives just west of the Wasatch Mountains in the north central part of the state.
Perspective View with Landsat Overlay, Salt Lake City, Utah
This anaglyph, from NASA Shuttle Radar Topography Mission, shows the city of Bhuj, India. 3D glasses are necessary to view this image.
SRTM Anaglyph: Piñon Canyon region, Colorado
Los Angeles, Calif., is one of the world largest metropolitan areas with a population of about 15 million people. The urban areas mostly cover the coastal plains and lie within the inland valleys.
Perspective View, SRTM / Landsat, Los Angeles, Calif
Panama, Costa Rica, Nicaragua, El Salvador, Honduras, Guatemala, Belize, southern Mexico and parts of Cuba and Jamaica are all seen in this image from NASA Shuttle Radar Topography Mission.
Colored Height and Shaded Relief, Central America
This frame from an animation depicts ground subsidence resulting from the extraction of oil. The oil fields are located near the community of Lost Hills, California, approximately 100 km northwest of Bakersfield.
Lost Hills Subsidence Animation
Mount San Antonio more commonly known as Mount Baldy crowns the San Gabriel Mountains northeast of Los Angeles, Calif., in this anaglyph from NASA Shuttle Radar Topography Mission. 3D glasses are necessary to view this image.
Anaglyph, Metro Los Angeles, Calif.: Malibu to Mount Baldy
This 3-D anaglyph shows an area on the western side of the volcanically active Kamchatka Peninsula, Russia as seen by the instrument onboard NASA Shuttle Radar Topography Mission. 3D glasses are necessary to view this image.
Anaglyph with Landsat Overlay, Kamchatka Peninsula, Russia
The Sovereign Democratic Republic of the Fiji Islands, commonly known as Fiji, is an independent nation consisting of some 332 islands surrounding the Koro Sea in the South Pacific Ocean. This image shows Viti Levu, the largest island in the group.
Shaded relief, color as height, Fiji
Rectangular fields of the agriculturally rich Santa Clara River Valley are visible in this perspective view generated by using data from the Shuttle Radar Topography Mission and an enhanced Landsat image.
SRTM Perspective View with Landsat Overlay: Santa Paula, and Santa Clara River Valley, California
The 2002 Winter Olympics are hosted by Salt Lake City at several venues within the city, in nearby cities, and within the adjacent Wasatch Mountains.
Perspective View with Landsat Overlay, Salt Lake City Olympics Venues, Utah
The city of Palm Springs nestles at the base of Mount San Jacinto in this computer-generated perspective viewed from the east.
Perspective View with Landsat Overlay, Palm Springs, Calif.
This perspective view from NASA Shuttle Radar Topography Mission of coastal Chile indicates the epicenter red marker of the 8.8 earthquake on Feb. 27, 2010, just offshore of the Maule region in the Bahia de Chanco.
Coastal Chile Perspective View
This anaglyph, from NASA Shuttle Radar Topography Mission, is of Lake Palanskoye in northern Kamchatka. 3D glasses are necessary to view this image.
Anaglyph, Lake Palanskoye Landslide, Kamchatka Peninsula, Russia
Australia is the world smallest, flattest, and after Antarctica driest continent, but at 7.7 million square kilometers 3.0 million square miles it is also the sixth largest country.
Australia, Shaded Relief and Colored Height
This shaded relief image of Mexico Yucatan Peninsula show a subtle, but unmistakable, indication of the Chicxulub impact crater. Most scientists now agree that this impact was the cause of the Cretatious-Tertiary Extinction.
Shaded Relief with Height as Color, Yucatan Peninsula, Mexico
Cape Town and the Cape of Good Hope, South Africa, appear on the left west of this anaglyph from NASA Shuttle Radar Topography Mission. 3D glasses are necessary to view this image.
Cape Town, South Africa, Anaglyph, Landsat Image over SRTM Elevation
This anaglyph, from NASA Shuttle Radar Topography Mission, is of Mount St Helens, Washington. 3D glasses are necessary to view this image.
Anaglyph, Mount St Helens, Washington State
This image from NASA Terra spacecraft shows the Indian Ocean coastline north of Phuket, Thailand is a major tourist destination that was in the path of the tsunami produced by a giant offshore earthquake on December 26, 2004.
Tsunami Inundation, North of Phuket, Thailand<br />ASTER Images and SRTM Elevation Model
This anaglyph, from NASA Shuttle Radar Topography Mission, is of Mount Meru, an active volcano located just 70 kilometers 44 miles west of Mount Kilimanjaro. 3D glasses are necessary to view this image.
Anaglyph with Landsat Overlay, Mount Meru, Tanzania
These two images show exactly the same area, Lake Balbina near Manaus, Brazil. The image on the left was created using the best global topographic data set previously available, the U.S. Geological Survey GTOPO30.
Shaded Relief with Height as Color, Lake Balbina, near Manaus, Brazil
This anaglyph, from NASA Shuttle Radar Topography Mission, shows complexly eroded volcanic terrain in northern Patagonia, near El Cain, Argentina. 3D glasses are necessary to view this image.
Anaglyph: Patagonia, Argentina