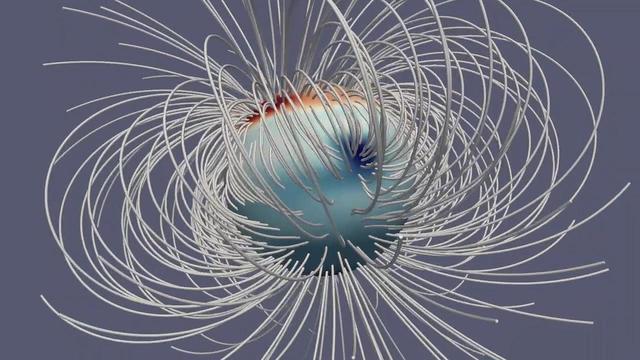
This animation illustrates Jupiter's magnetic field at a single moment in time. The Great Blue Spot, an-invisible-to-the-eye concentration of magnetic field near the equator, stands out as a particularly strong feature. The gray lines (called field lines) show the field's direction in space, and the deepness of the color corresponds to the strength of the magnetic field (with dark red and dark blue for regions with strongly positive and strongly negative fields, respectively). The animation first appeared in a Sept. 5, 2018, paper in the Journal Nature. Animation available at https://photojournal.jpl.nasa.gov/catalog/PIA23229.
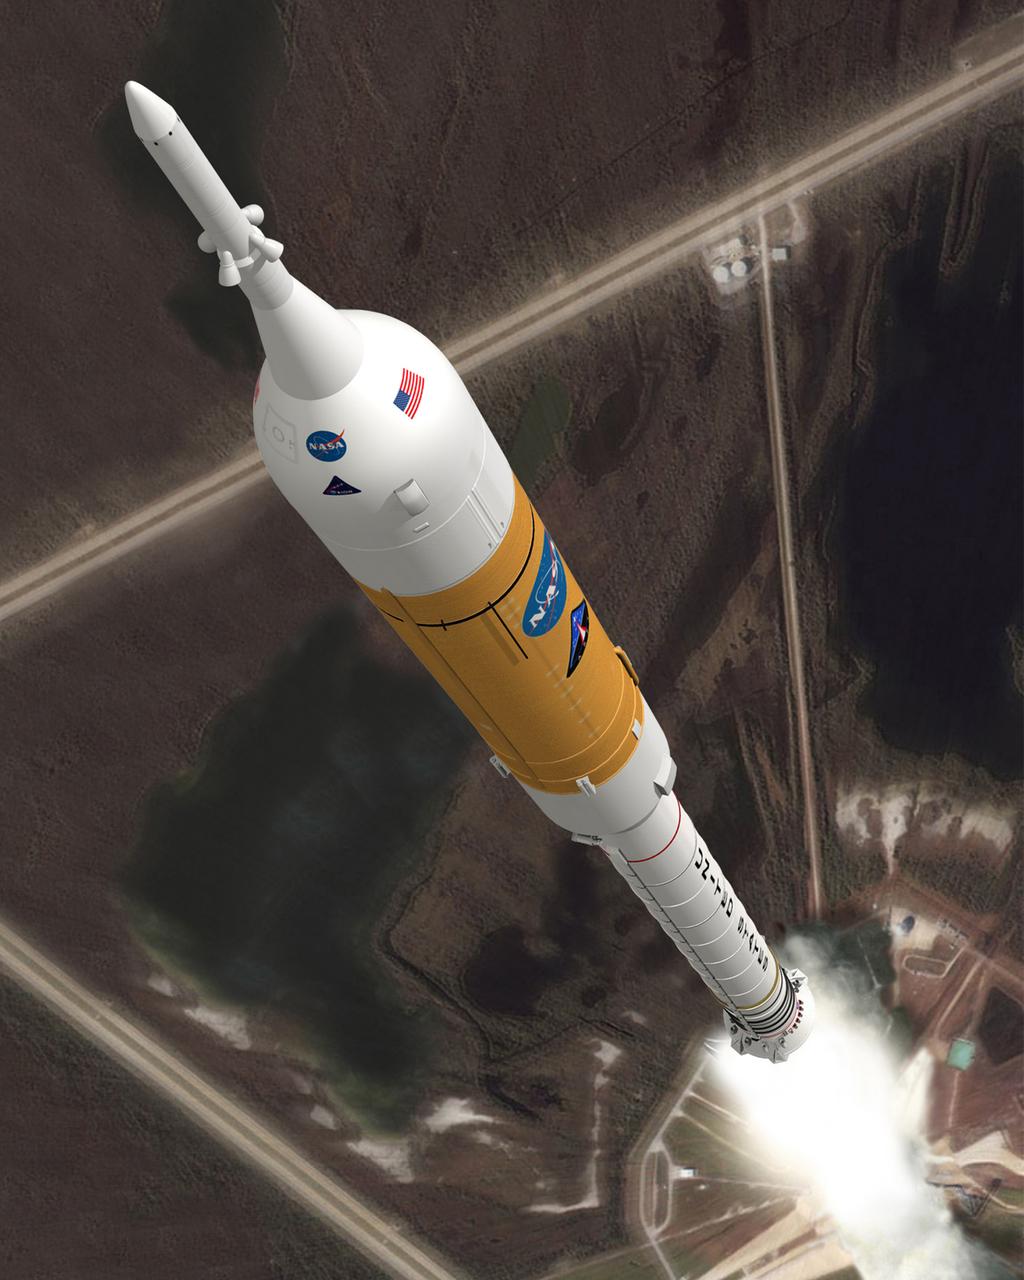
A CONCEPT IMAGE SHOWS THE ARES I CREW LAUNCH VEHICLE DURING ASCENT. ARES I IS AN IN-LINE, TWO-STAGE ROCKET CONFIGURATION TOPED BY THE ORION CREW EXPLORATION VEHICLE AND LAUNCH ABORT SYSTEM. THE ARES I FIRST STAGE IS A SINGLE, FIVE-SEGMENT REUSABLE SOLID ROCKET BOOSTER, DERIVED FROM THE SPACE SHUTTLE. ITS UPPER STAGE IS POWERED BY A J-2X ENGINE. ARES I WILL CARRY THE ORION WITH ITS CRW OF UP TO SIX ASTRONAUTS TO EARTH ORBIT.
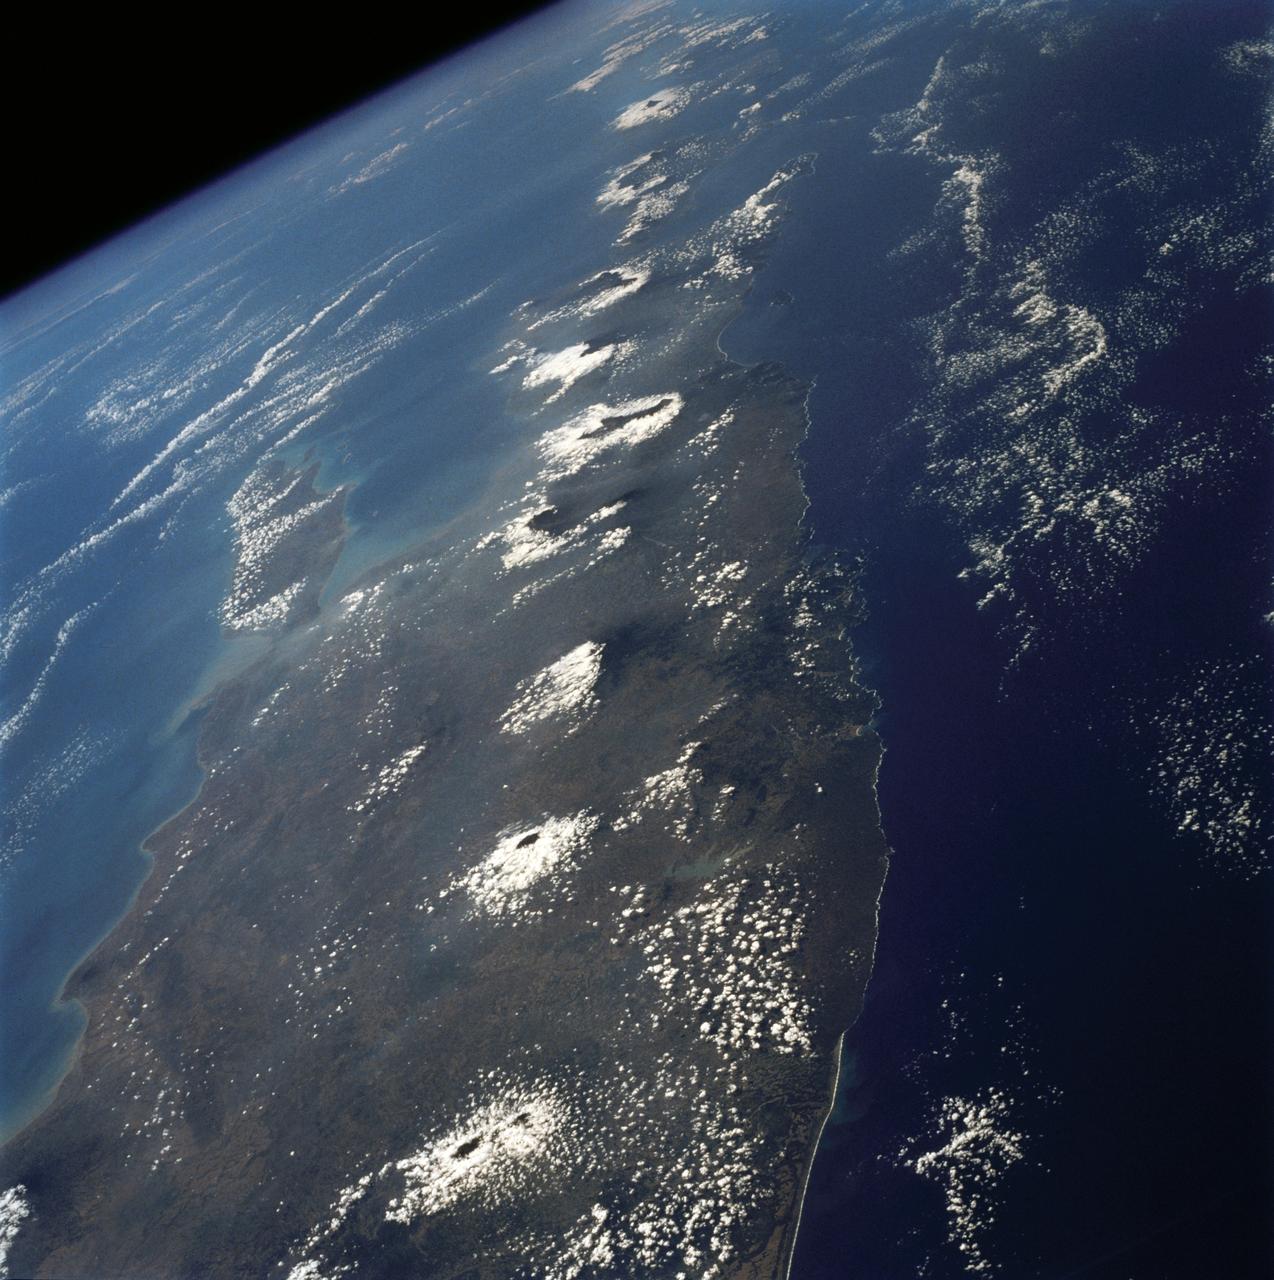
The island of Java (8.0S, 112.0E), perhaps better than any other, illustrates the volcanic origin of Pacific Island groups. Seen in this single view are at least a dozen once active volcano craters. Alignment of the craters even defines the linear fault line of Java as well as the other some 1500 islands of the Indonesian Archipelago. Deep blue water of the Indian Ocean to the south contrasts to the sediment laden waters of the Java Sea to the north.
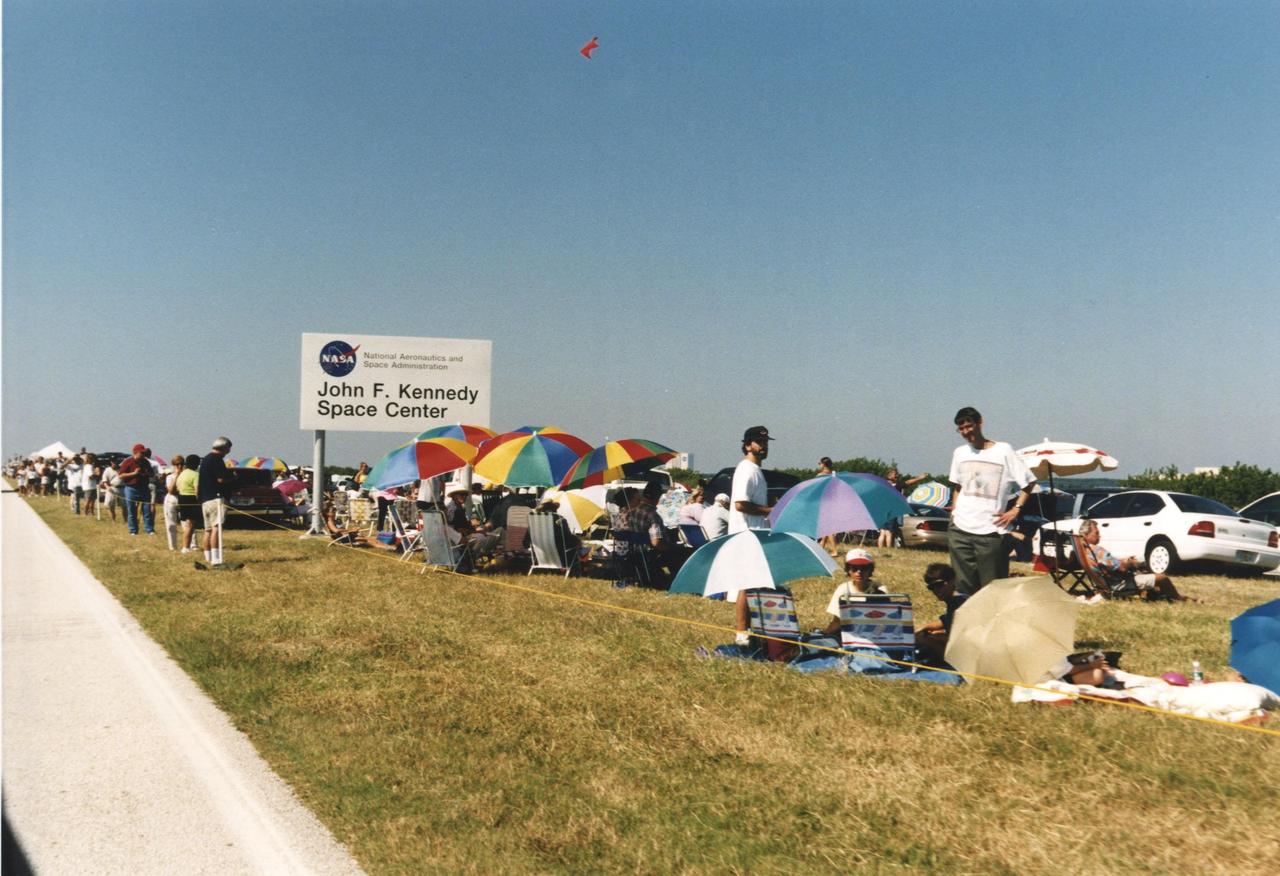
Crowds of thousands line the grassy shoulders of the parkways at Kennedy Space Center to view the launch of STS-95. Extra attention has been drawn to the mission due to the addition to the crew of John H. Glenn Jr., a senator from Ohio. STS-95 is Glenn's second flight into space after 36 years; he was one of the original Project Mercury astronauts and flew his first mission in February 1962. The STS-95 mission includes research payloads such as the Spartan solar-observing deployable spacecraft, the Hubble Space Telescope Orbital Systems Test Platform, the International Extreme Ultraviolet Hitchhiker, as well as a SPACEHAB single module with experiments on space flight and the aging process
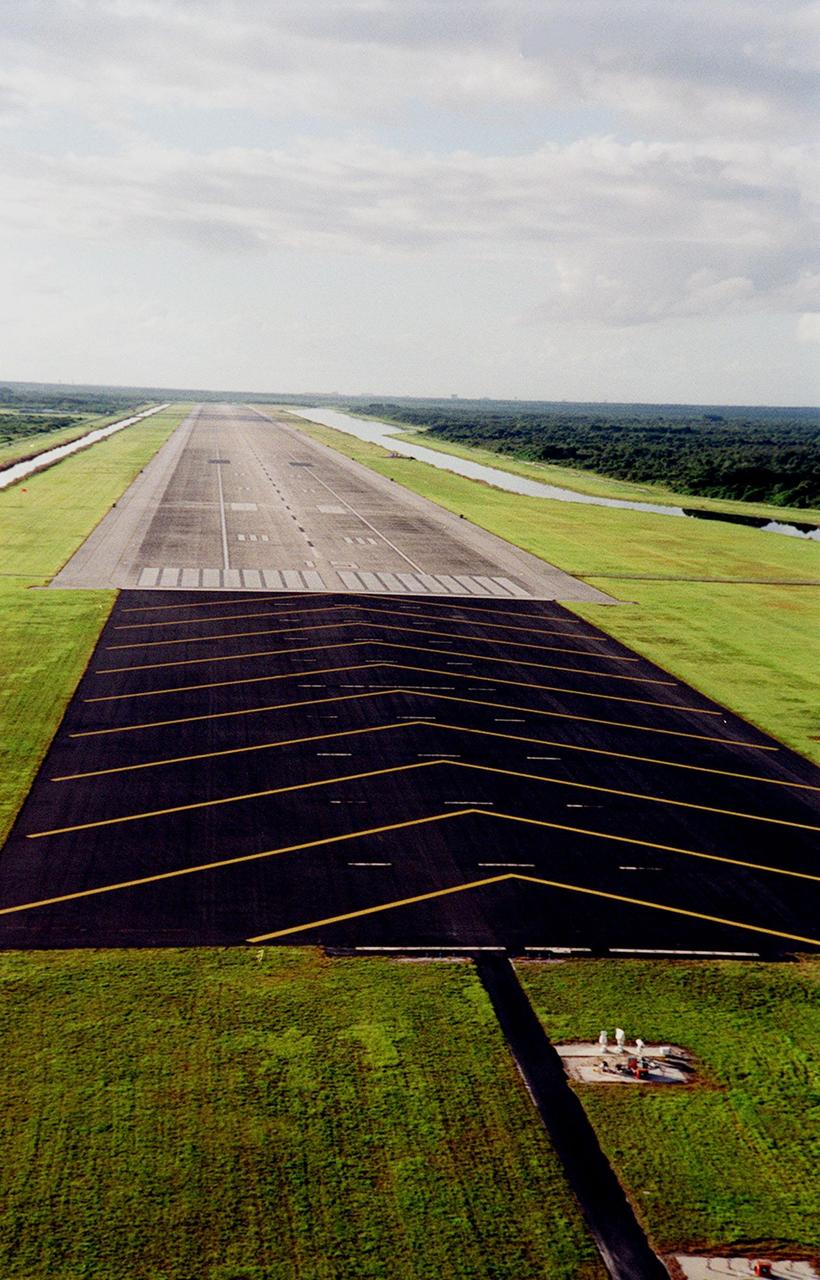
KENNEDY SPACE CENTER, FLA. -- This aerial view shows the approach on Runway 33 at the KSC Shuttle Landing Facility. The runway is 15,000 feet long, with 1,000-foot paved overruns at each end; 300 feet wide (about length of football field), with 50-foot asphalt shoulders each side; 16 inches thick in the center, and 15 inches thick on sides. It has a slope of 24 inches from the center line to the edge for drainage. The single landing strip is considered two runways, depending on approach Runway 15 from northwest, Runway 33 from southeast
KENNEDY SPACE CENTER, FLA. -- At Astrotech Space Operations in Titusville, Fla., a worker attaches a high pressure line on the THEMIS spacecraft in preparation for fueling, which is scheduled for Jan. 3-5. THEMIS consists of five identical probes, the largest number of scientific satellites ever launched into orbit aboard a single rocket. This unique constellation of satellites will resolve the tantalizing mystery of what causes the spectacular sudden brightening of the aurora borealis and aurora australis - the fiery skies over the Earth's northern and southern polar regions. THEMIS is scheduled to launch Feb. 15 from Cape Canaveral Air Force Station. Photo credit: NASA/George Shelton

KENNEDY SPACE CENTER, FLA. -- This aerial view shows the approach on Runway 33 at the KSC Shuttle Landing Facility. The runway is 15,000 feet long, with 1,000-foot paved overruns at each end; 300 feet wide (about length of football field), with 50-foot asphalt shoulders each side; 16 inches thick in the center, and 15 inches thick on sides. It has a slope of 24 inches from the center line to the edge for drainage. The single landing strip is considered two runways, depending on approach Runway 15 from northwest, Runway 33 from southeast

KENNEDY SPACE CENTER, FLA. -- At Astrotech Space Operations in Titusville, Fla., a worker attaches a high pressure line on the THEMIS spacecraft in preparation for fueling, which is scheduled for Jan. 3-5. THEMIS consists of five identical probes, the largest number of scientific satellites ever launched into orbit aboard a single rocket. This unique constellation of satellites will resolve the tantalizing mystery of what causes the spectacular sudden brightening of the aurora borealis and aurora australis - the fiery skies over the Earth's northern and southern polar regions. THEMIS is scheduled to launch Feb. 15 from Cape Canaveral Air Force Station. Photo credit: NASA/George Shelton
KENNEDY SPACE CENTER, FLA. -- At Astrotech Space Operations in Titusville, Fla., a worker attaches a high pressure line on the THEMIS spacecraft in preparation for fueling, which is scheduled for Jan. 3-5. THEMIS consists of five identical probes, the largest number of scientific satellites ever launched into orbit aboard a single rocket. This unique constellation of satellites will resolve the tantalizing mystery of what causes the spectacular sudden brightening of the aurora borealis and aurora australis - the fiery skies over the Earth's northern and southern polar regions. THEMIS is scheduled to launch Feb. 15 from Cape Canaveral Air Force Station. Photo credit: NASA/George Shelton
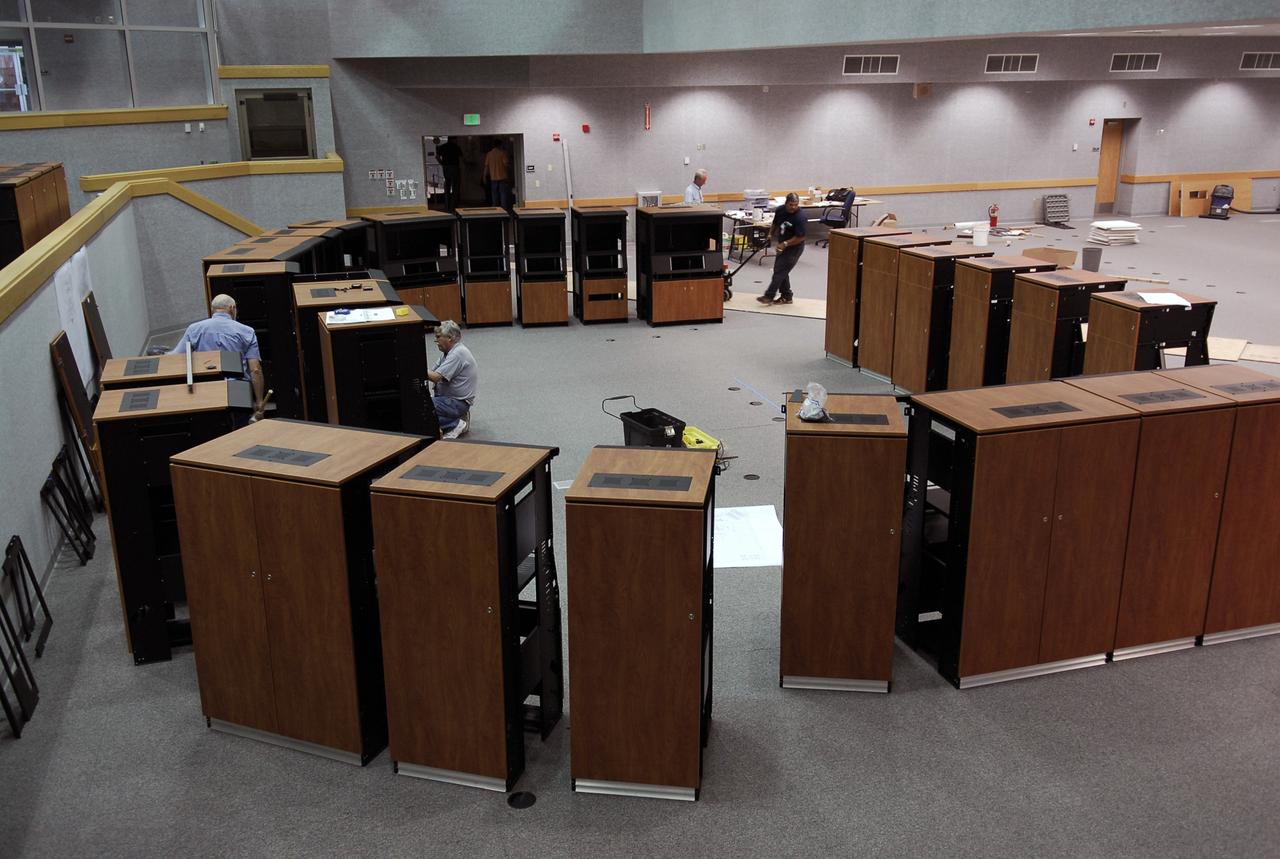
CAPE CANAVERAL, Fla. -- In Firing Room No. 1 in the Launch Control Center at NASA's Kennedy Space Center, workers line up the new equipment cabinets. The firing room will support the future Ares rocket launches as part of the Constellation Program. Future astronauts will ride to orbit on Ares I, which uses a single five-segment solid rocket booster, a derivative of the space shuttle's solid rocket booster, for the first stage. Ares will be launched from Pad 39B, which is being reconfigured from supporting space shuttle launches. The Launch Control Center firing rooms face the launch pads. Photo credit: NASA/Kim Shiflett
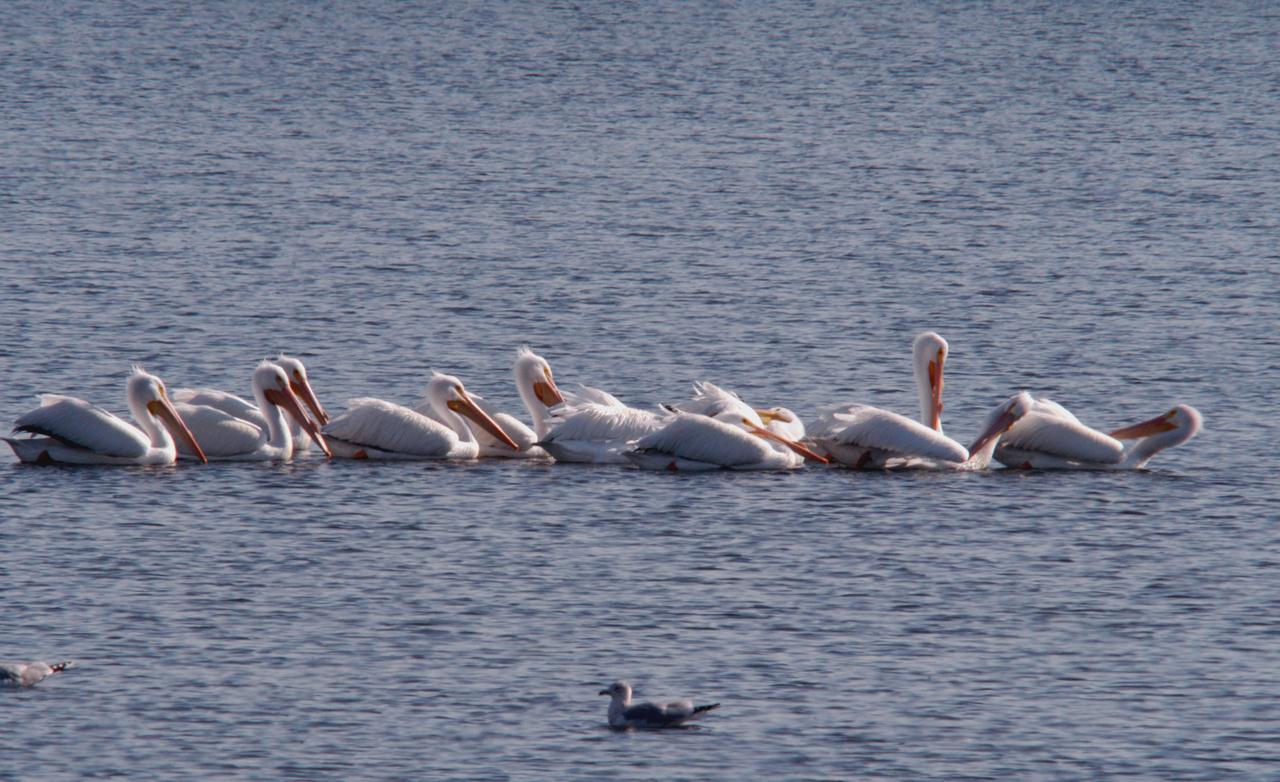
White pelicans form a line while swimming in the turn basin near the Vehicle Assembly Building of NASA's Kennedy Space Center. The turn basin was carved out of the Banana River when Kennedy Space Center was built. White pelicans winter from Florida and southern California to Panama, chiefly in coastal lagoons, and usually in colonies. KSC shares a boundary with the Merritt Island Wildlife Nature Refuge. The refuge is a habitat for more than 310 species of birds, 25 mammals, 117 fishes and 65 amphibians and reptiles. In addition, the Refuge supports 19 endangered or threatened wildlife species on Federal or State lists, more than any other single refuge in the U.S.
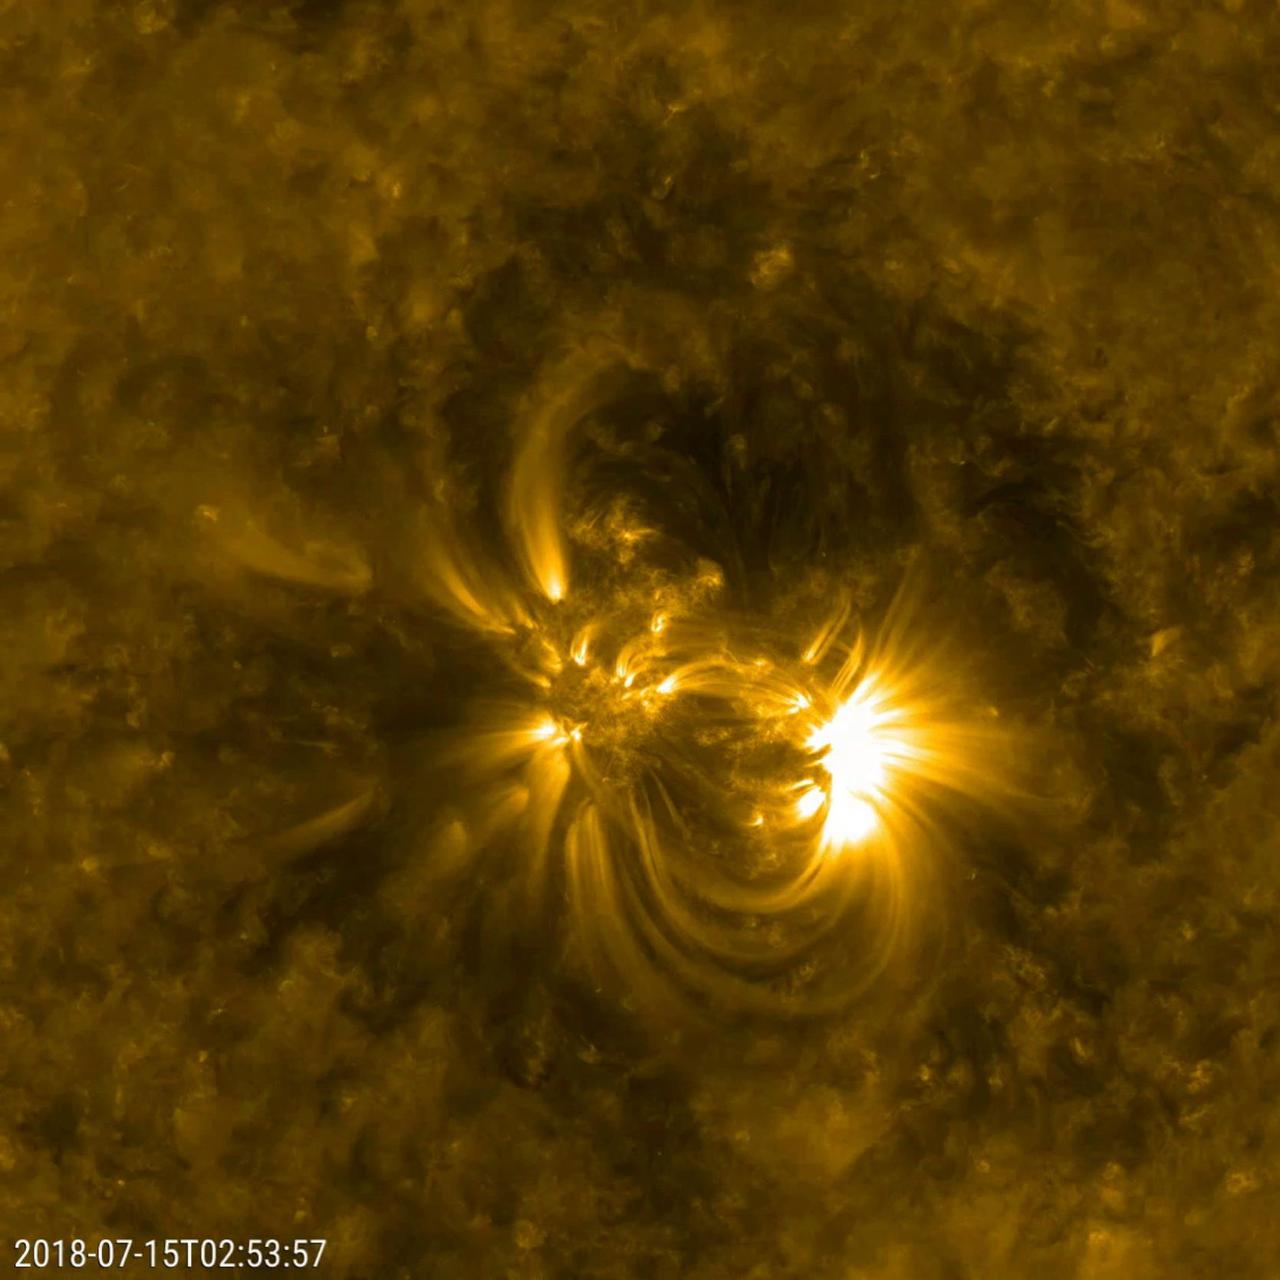
NASA's Solar Dynamics Observatory (SDO) zoomed in to watch close-up the dynamics of this single active region on the sun over a two-day period (July 14-16, 2018). The loops SDO observed in extreme ultraviolet light are illuminated by charged particles spinning along the magnetic field lines above an active region. Active regions are magnetically intense areas that are pushed up to the surface of the sun from below. These regions are often the sources of large eruptions that cause solar storms, though no large eruptions seem to have occurred during this period. To give a sense of scale, these loops are rising up many times the diameter of Earth. Movies are available at https://photojournal.jpl.nasa.gov/catalog/PIA22645
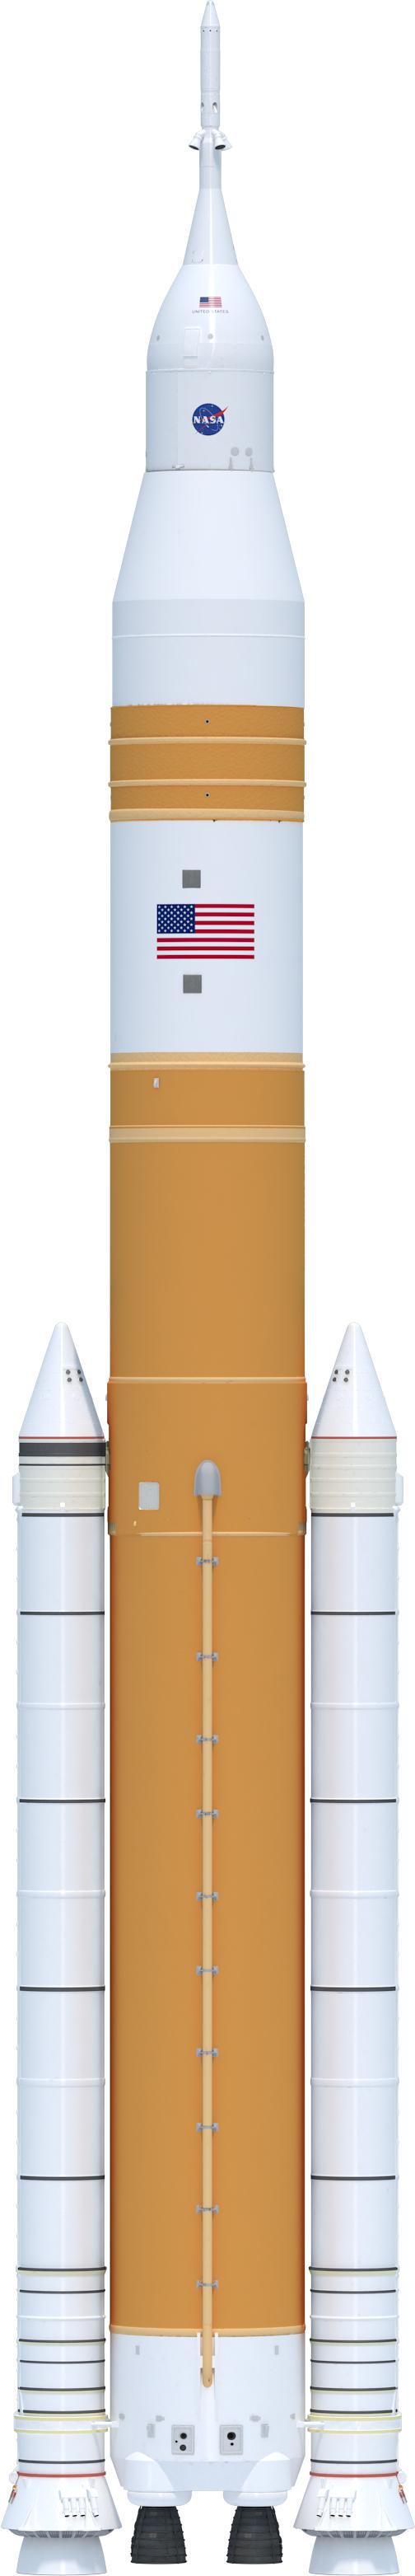
Illustration of the evolved SLS Block 1B Crew variant outer mold line. This configuration of the rocket, with the Exploration Upper Stage, will provide in-space propulsion to send astronauts in NASA’s Orion spacecraft and heavy cargo on a precise trajectory to the Moon. The evolution of the rocket to SLS Block 1B configuration with EUS enables SLS to launch 40% more cargo to the Moon along with the crew. Manufacturing both the core stage and Exploration Upper Stage is a collaborative effort between NASA and Boeing, the lead contractor for EUS and the SLS core stage. SLS is the only rocket that can send Orion, astronauts, and supplies to the Moon in a single mission. The SLS rocket, NASA’s Orion spacecraft, Gateway, and human landing system are part of NASA’s backbone for deep space exploration. Under the Artemis program, NASA is working to land the first woman and the next man on the Moon to pave the way for sustainable exploration at the Moon and future missions to Mars. (NASA)
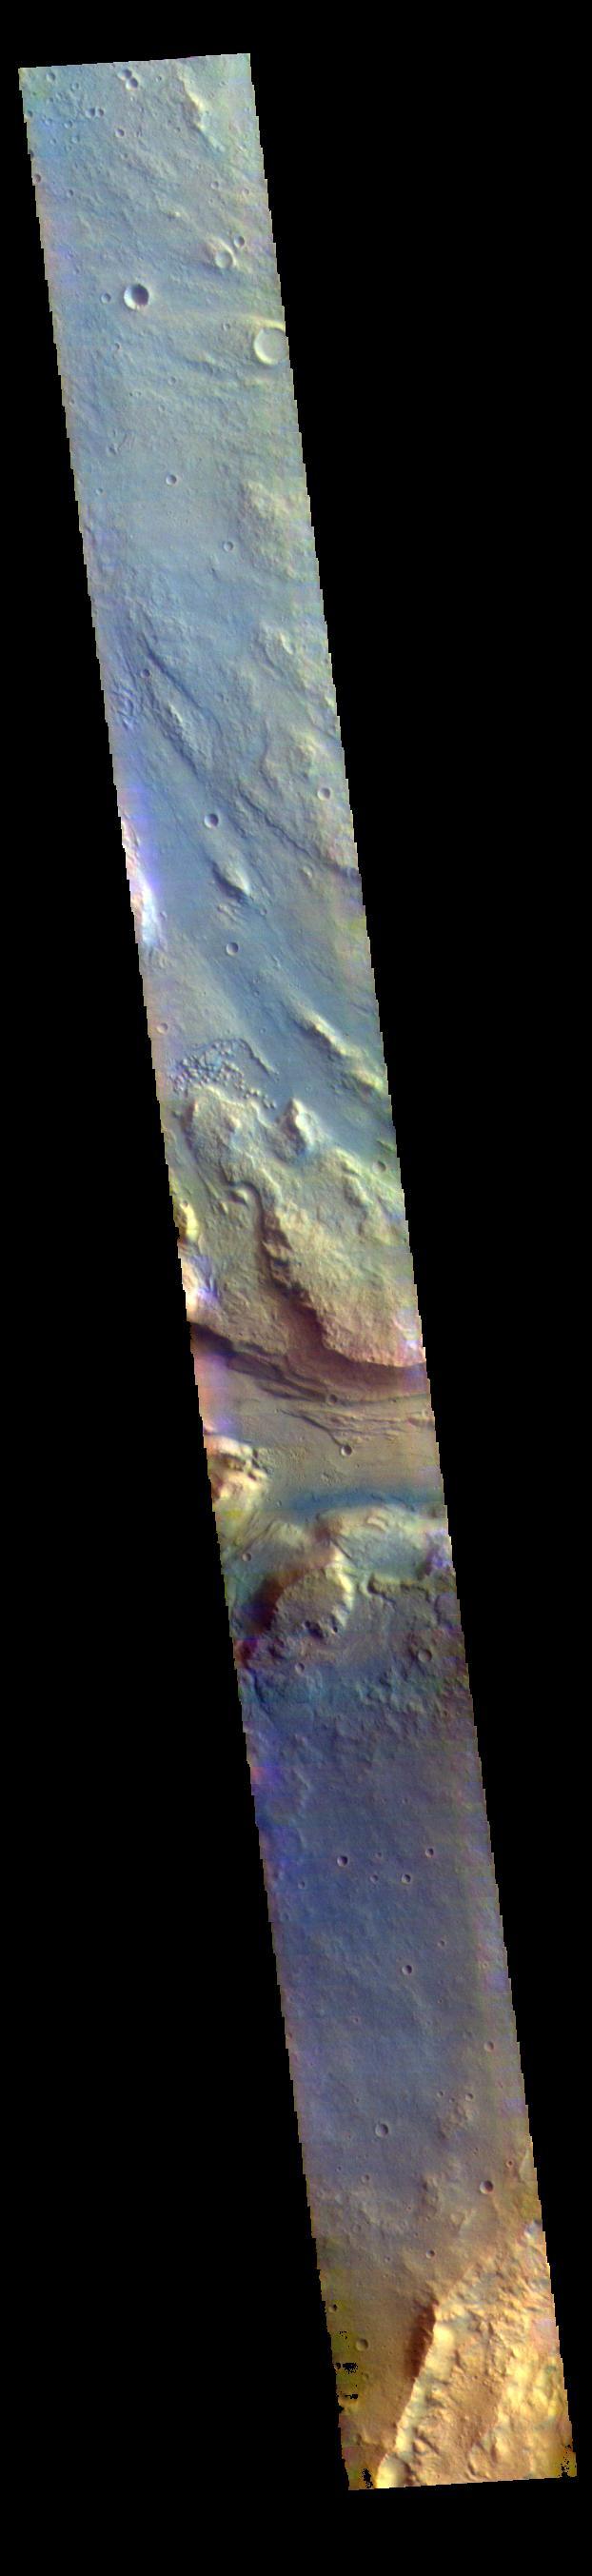
This false color image contains several channel features. Towards the top of the image are several stream-lined islands, created by liquid flow eroding preexisting rock. The islands have a tear-drop shape, with the pointy end down stream from the rounded end. In this case the fluid flowed from the bottom right of the frame towards the upper left. Just below the center of the image is a larger, deeper channel. All these channel features merge into Ares Vallis, a huge outflow channel that empties into Chryse Planitia. The THEMIS VIS camera contains 5 filters. The data from different filters can be combined in multiple ways to create a false color image. These false color images may reveal subtle variations of the surface not easily identified in a single band image. Orbit Number: 61501 Latitude: 4.31188 Longitude: 343.17 Instrument: VIS Captured: 2015-10-25 18:03 https://photojournal.jpl.nasa.gov/catalog/PIA23066

On Launch Pad 17-B at Cape Canaveral Air Force Station in Florida, workers check the lines attached to the lower end of the United Launch Alliance Delta II rocket before it is lifted into the mobile service tower. The rocket is the launch vehicle for the THEMIS spacecraft, consisting of five identical probes, the largest number of scientific satellites ever launched into orbit aboard a single rocket. This unique constellation of satellites will resolve the tantalizing mystery of what causes the spectacular sudden brightening of the aurora borealis and aurora australis - the fiery skies over the Earth's northern and southern polar regions. After the first stage is in the mobile service tower on the pad, nine solid rocket boosters will be placed around the base of the first stage and attached in sets of three. THEMIS is scheduled to launch aboard the Delta II at 6:07 p.m. EST on Feb. 15.
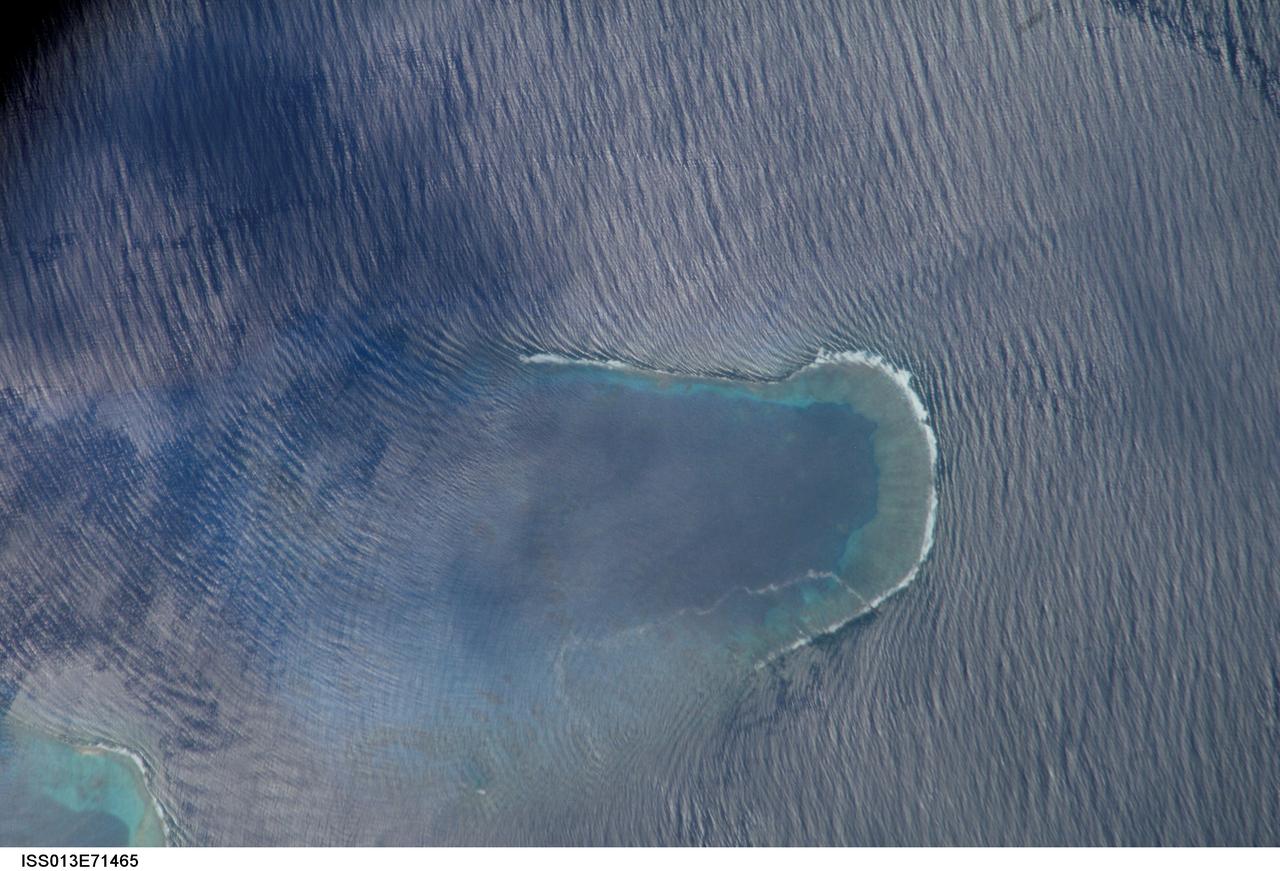
ISS013-E-71465 (27 Aug. 2006) --- Bajo Nuevo Reef in the western Caribbean Sea is featured in this image photographed by an Expedition 13 crewmember on the International Space Station. The Bajo Nuevo reef is approximately 26 kilometers long, comprising two separate U-shaped cays, with only tiny sandy islands associated with them. The eastern cay, shown in this image, encloses a lagoon. Protected from open-sea swells, the water surface is calmer and some back reef detail is visible within the lagoon. Cloud shadows darken the top left corner. The clearest feature is the broad pattern of swells which show two slightly different orientations, producing a tightly crossed pattern. These swells are oriented transverse to the wind direction and were probably set in motion by two different storms hundreds of kilometers east of the reef. A single irregular line of light color--also suggestive of surface oil--traces a path along the south side of the lagoon.
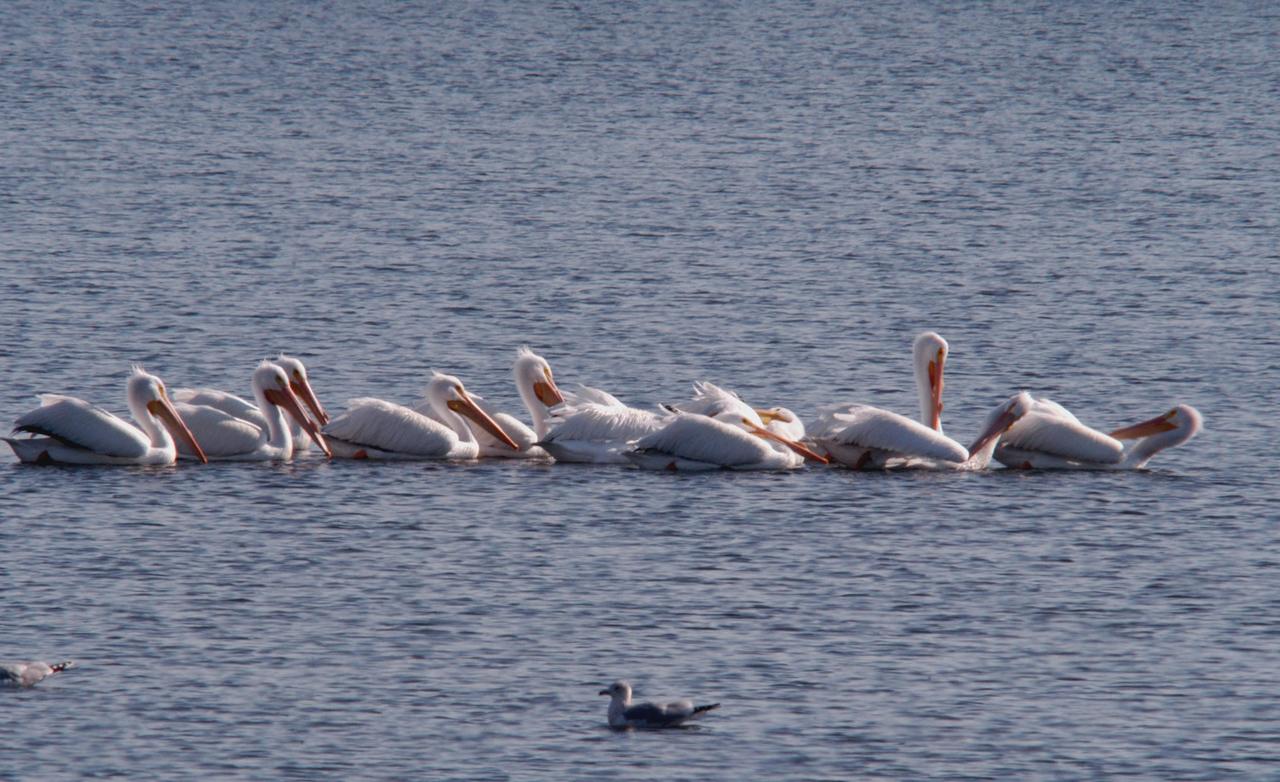
KENNEDY SPACE CENTER, FLA. -- White pelicans form a line while swimming in the turn basin near the Vehicle Assembly Building of NASA's Kennedy Space Center. The turn basin was carved out of the Banana River when Kennedy Space Center was built. White pelicans winter from Florida and southern California to Panama, chiefly in coastal lagoons, and usually in colonies. KSC shares a boundary with the Merritt Island Wildlife Nature Refuge. The refuge is a habitat for more than 310 species of birds, 25 mammals, 117 fishes and 65 amphibians and reptiles. In addition, the Refuge supports 19 endangered or threatened wildlife species on Federal or State lists, more than any other single refuge in the U.S. Photo credit: NASA/George Shelton
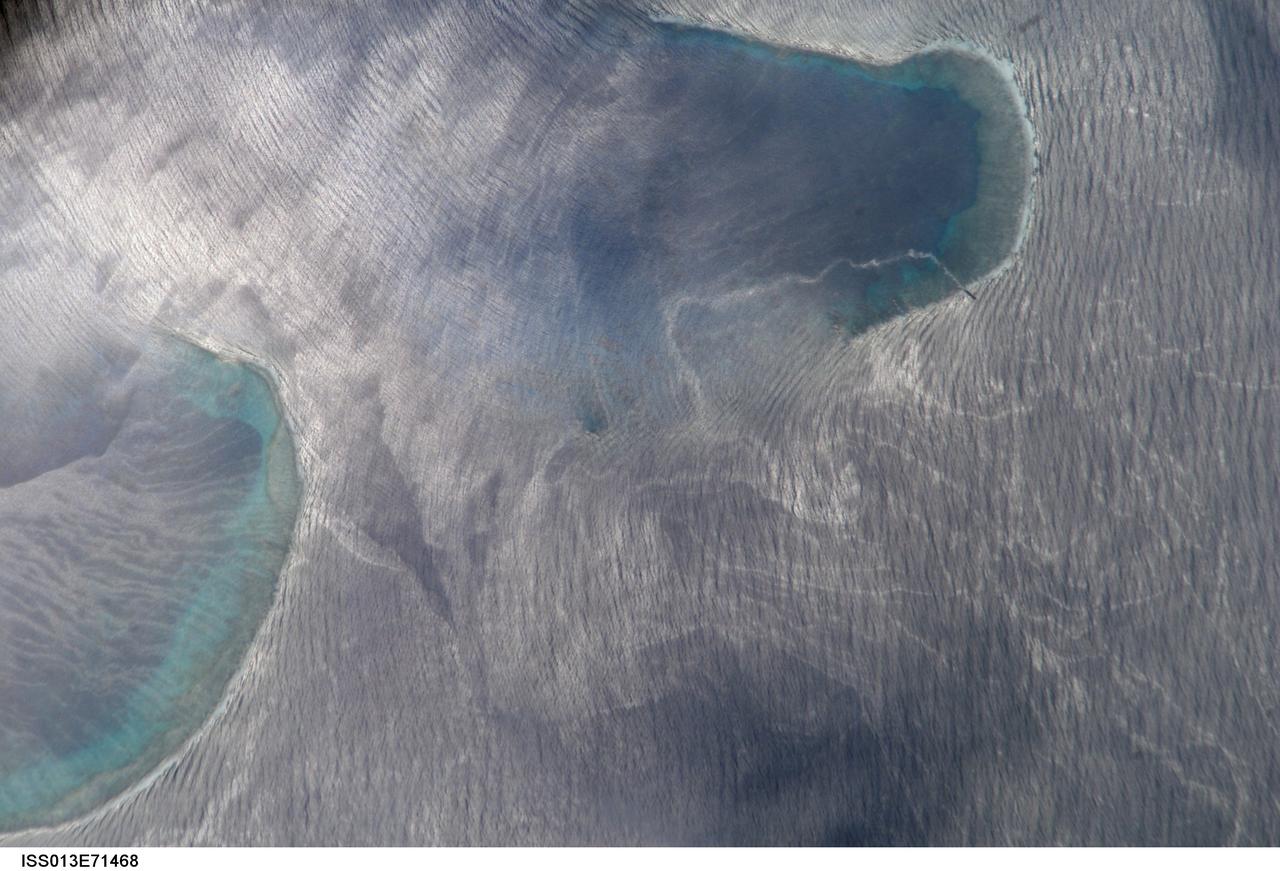
ISS013-E-71468 (27 Aug. 2006) --- Bajo Nuevo Reef in the western Caribbean Sea is featured in this image photographed by an Expedition 13 crewmember on the International Space Station. The Bajo Nuevo reef is approximately 26 kilometers long, comprising two separate U-shaped cays, with only tiny sandy islands associated with them. This detailed view reveals small, low islands that fringe the upwind side (image right) of the lagoon. These islands seem dwarfed by wave swells, which almost appear to wash over them. The clearest feature is the broad pattern of swells which show two slightly different orientations, producing a tightly crossed pattern. These swells are oriented transverse to the wind direction and were probably set in motion by two different storms hundreds of kilometers east of the reef. A single irregular line of light color--also suggestive of surface oil--traces a path along the south side of the lagoon.
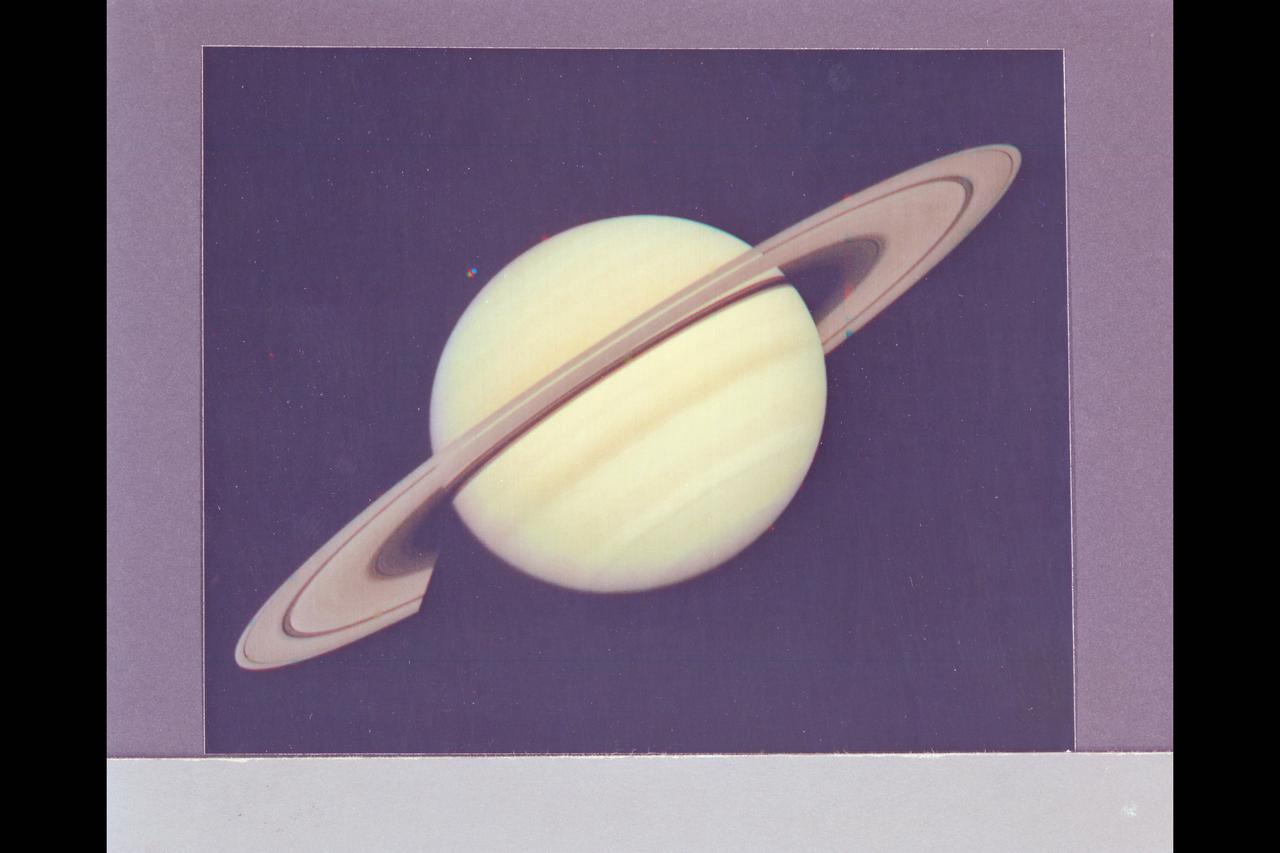
Range : 34 million km. ( 21.1 million miles) P-22993C This Voyager 1 photograph of Saturn was taken on the last day it could be captured within a single narrow angle camera frame as the spacecraft neared the planet for it's closest approach on Nov. 12, 1980. Dione, one of Saturn's innermost satellites, appears as three color spots just below the planet's south pole. An abundance of previously unseen detail is apparent in the rings. For example, a gap in the dark, innermst ring, C-ring or Crepe Ring, is clearly shown. Also, material is seen inside the relatively wide Cassini Division, seperating the middle, B-ring from the outermost ring, the A-ring. The Encke division is shown near the outer edge of A-ring. The detail in the ring's shadows cast on the planet is of particular interest. The broad dark band near the equator is the shadow of B-ring. The thinner, brighter line just to the south is the shadow of the less dense A-ring.
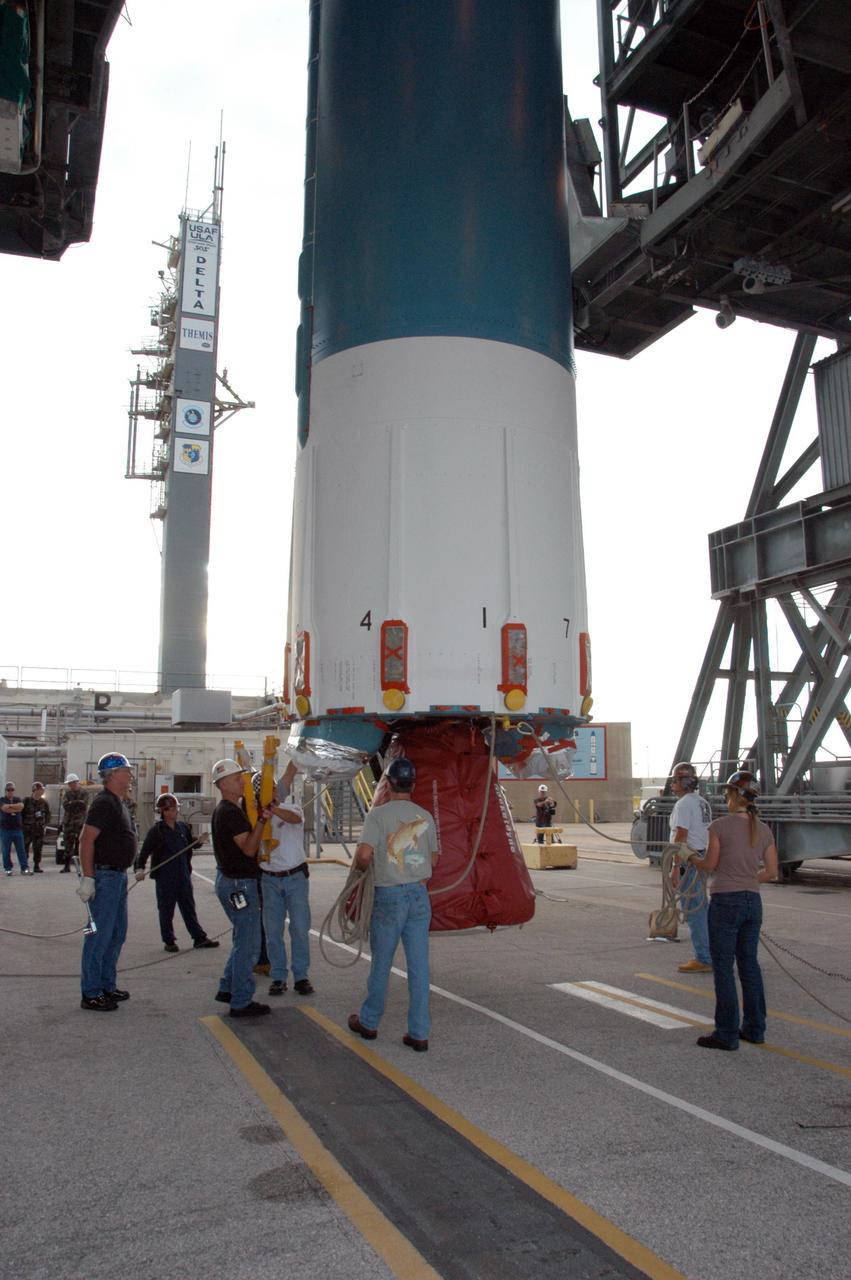
KENNEDY SPACE CENTER, FLA. -- On Launch Pad 17-B at Cape Canaveral Air Force Station in Florida, workers check the lines attached to the lower end of the United Launch Alliance Delta II rocket before it is lifted into the mobile service tower. The rocket is the launch vehicle for the THEMIS spacecraft, consisting of five identical probes, the largest number of scientific satellites ever launched into orbit aboard a single rocket. This unique constellation of satellites will resolve the tantalizing mystery of what causes the spectacular sudden brightening of the aurora borealis and aurora australis - the fiery skies over the Earth's northern and southern polar regions. After the first stage is in the mobile service tower on the pad, nine solid rocket boosters will be placed around the base of the first stage and attached in sets of three. THEMIS is scheduled to launch aboard the Delta II at 6:07 p.m. EST on Feb. 15. Photo credit: NASA/George Shelton
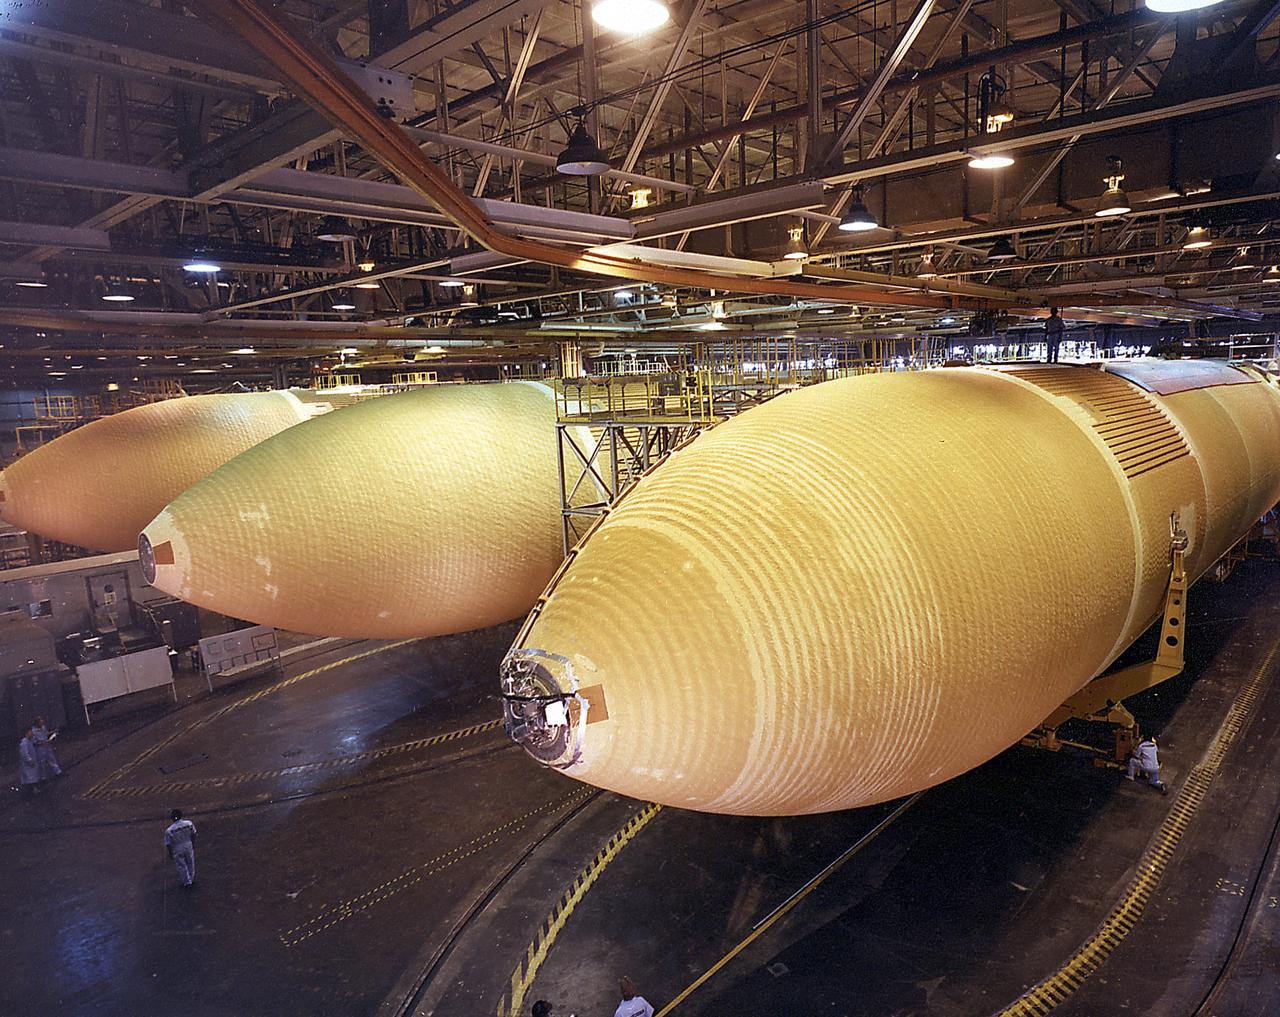
This photograph was taken during the final assembly phase of the Space Shuttle light weight external tanks (LWT) 5, 6, and 7 at the Michoud Assembly Facility in New Orleans, Louisiana. The giant cylinder, higher than a 15-story building, with a length of 154-feet (47-meters) and a diameter of 27.5-feet (8.4-meters), is the largest single piece of the Space Shuttle. During launch, the external tank (ET) acts as a backbone for the orbiter and solid rocket boosters. In separate, internal pressurized tank sections, the ET holds the liquid hydrogen fuel and liquid oxygen oxidizer for the Shuttle's three main engines. During launch, the ET feeds the fuel under pressure through 17-inch (43.2-centimeter) ducts which branch off into smaller lines that feed directly into the main engines. Some 64,000 gallons (242,260 liters) of fuel are consumed by the main engines each minute. Machined from aluminum alloys, the Space Shuttle's ET is the only part of the launch vehicle that currently is not reused. After its 526,000 gallons (1,991,071 liters) of propellants are consumed during the first 8.5 minutes of flight, it is jettisoned from the orbiter and breaks up in the upper atmosphere, its pieces falling into remote ocean waters. The Marshall Space Flight Center was responsible for developing the ET
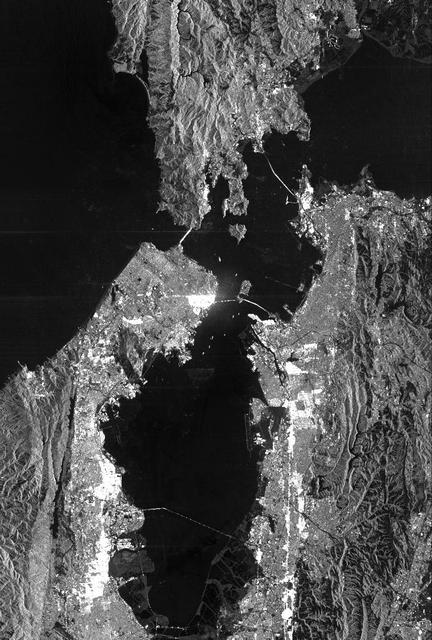
This is a radar image of San Francisco, California, taken on October 3,1994. The image is about 40 kilometers by 55 kilometers (25 miles by 34 miles) with north toward the upper right. Downtown San Francisco is visible in the center of the image with the city of Oakland east (to the right) across San Francisco Bay. Also visible in the image is the Golden Gate Bridge (left center) and the Bay Bridge connecting San Francisco and Oakland. North of the Bay Bridge is Treasure Island. Alcatraz Island appears as a small dot northwest of Treasure Island. This image was acquired by the Spaceborne Imaging Radar-C and X-band Synthetic Aperture Radar (SIR-C/X-SAR) aboard the space shuttle Endeavour on orbit 56. The image is centered at 37 degrees north latitude, 122degrees west longitude. This single-frequency SIR-C image was obtained by the L-band (24 cm) radar channel, horizontally transmitted and received. Portions of the Pacific Ocean visible in this image appear very dark as do other smooth surfaces such as airport runways. Suburban areas, with the low-density housing and tree-lined streets that are typical of San Francisco, appear as lighter gray. Areas with high-rise buildings, such as those seen in the downtown areas, appear in very bright white, showing a higher density of housing and streets which run parallel to the radar flight track. http://photojournal.jpl.nasa.gov/catalog/PIA01751
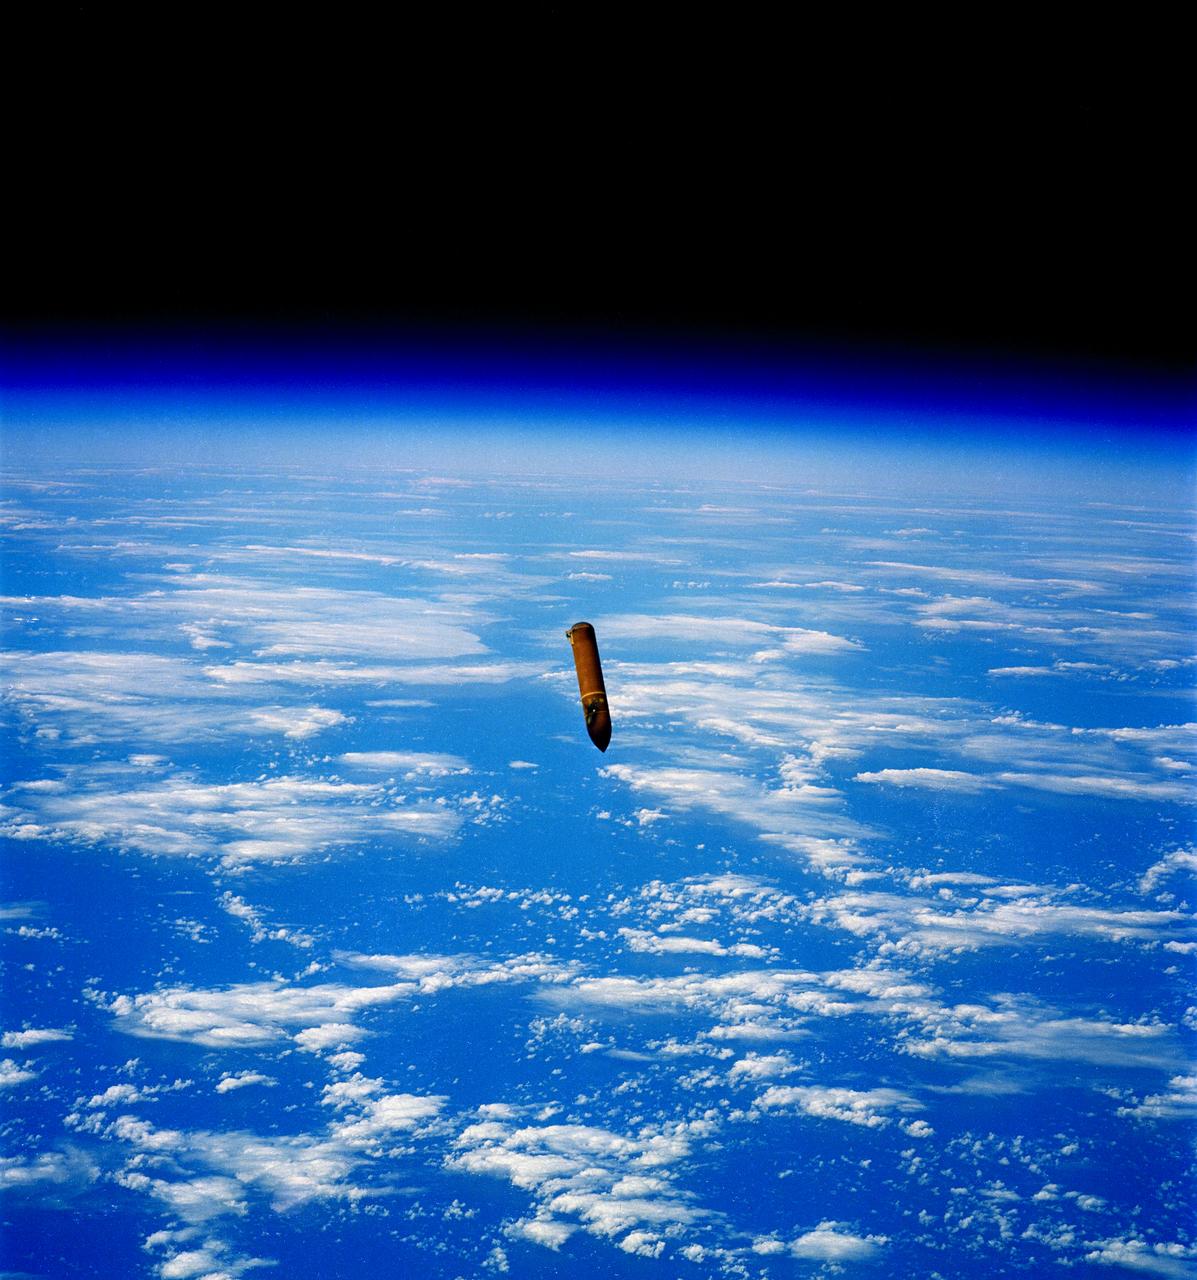
This STS-29 mission onboard photo depicts the External Tank (ET) falling toward the ocean after separation from the Shuttle orbiter Discovery. The giant cylinder, higher than a 15-story building, with a length of 154-feet (47-meters) and a diameter of 27,5-feet (8.4-meters), is the largest single piece of the Space Shuttle. During launch, the ET also acts as a backbone for the orbiter and solid rocket boosters. In separate, internal pressurized tank sections, the ET holds the liquid hydrogen fuel and liquid oxygen oxidizer for the Shuttle's three main engines. During launch, the ET feeds the fuel under pressure through 17-inch (43.2-centimeter) ducts which branch off into smaller lines that feed directly into the main engines. Some 64,000 gallons (242,260 liters) of fuel are consumed by the main engines each minute. Machined from aluminum alloys, the Space Shuttle's ET is the only part of the launch vehicle that currently is not reused. After its 526,000 gallons (1,991,071 liters) of propellants are consumed during the first 8.5 minutes of flight, it is jettisoned from the orbiter and breaks up in the upper atmosphere, its pieces falling into remote ocean waters. The Marshall Space Flight Center was responsible for developing the ET.

This is a cutaway illustration of the Space Shuttle external tank (ET) with callouts. The giant cylinder, higher than a 15-story building, with a length of 154-feet (47-meters) and a diameter of 27.5-feet (8.4-meters), is the largest single piece of the Space Shuttle. During launch, the ET also acts as a backbone for the orbiter and solid rocket boosters. Separate pressurized tank sections within the external tank hold the liquid hydrogen fuel and liquid oxygen oxidizer for the Shuttle's three main engines. During launch, the ET feeds the fuel under pressure through 17-inch (43.2-centimeter) ducts that branch off into smaller lines that feed directly into the main engines. The main engines consume 64,000 gallons (242,260 liters) of fuel each minute. Machined from aluminum alloys, the Space Shuttle's external tank is currently the only part of the launch vehicle that is not reused. After its 526,000-gallons (1,991,071 liters) of propellants are consumed during the first 8.5-minutes of flight, it is jettisoned from the orbiter and breaks up in the upper atmosphere, its pieces falling into remote ocean waters. The Marshall Space Flight Center was responsible for developing the ET.
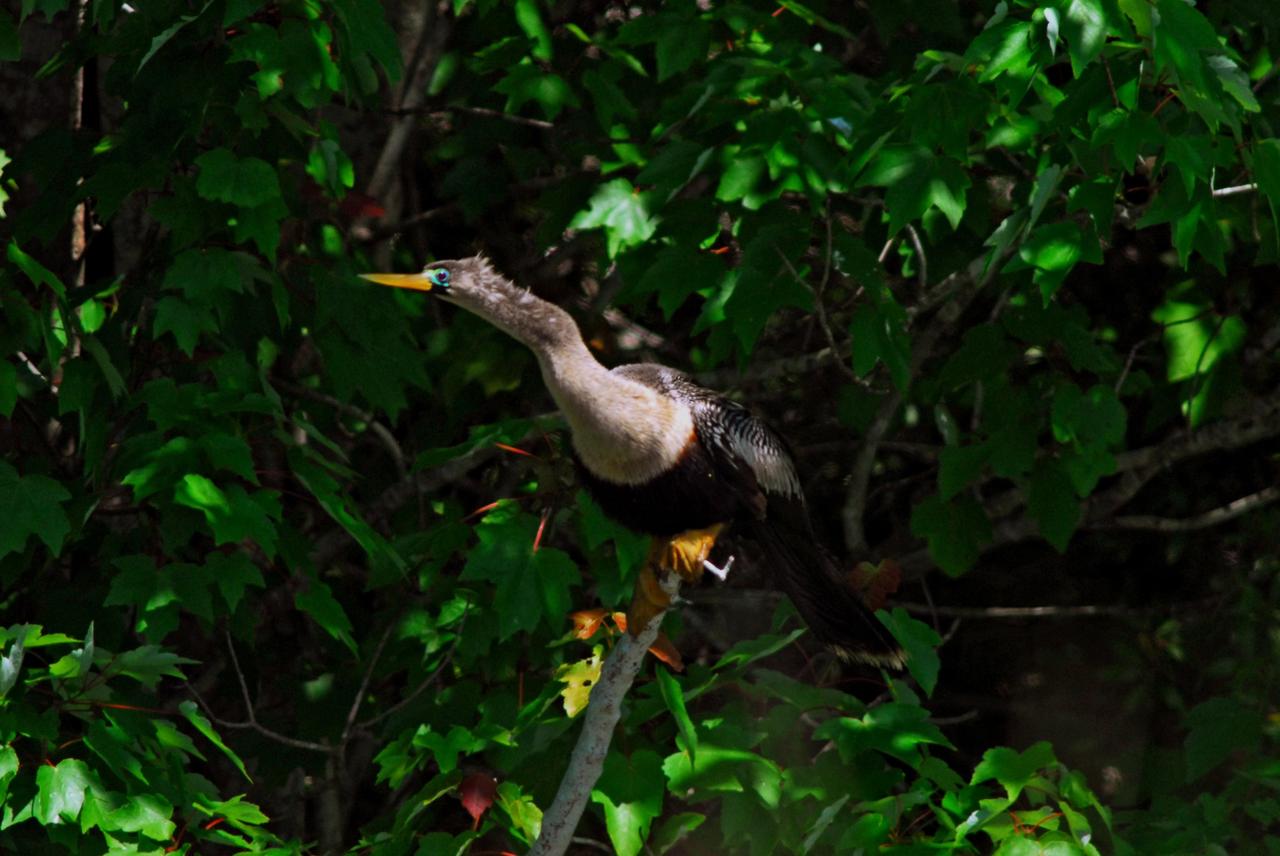
KENNEDY SPACE CENTER, FLA. -- A female anhinga roosts in branches near the water. Anhingas can be found in freshwater ponds and swamps where there is thick vegetation and tall trees. Male anhingas are black and gray; females are distinguished by a buff-colored neck and breast. When anhingas are in their breeding plumage they have a blue ring around their eyes, as seen here. The female lays three to five light blue eggs. The nest is in a tree and it is made of sticks and lined with leaves. The chicks hatch in about a month. Anhingas breed off the Gulf Coast and the Atlantic Coast from North Carolina to Texas and in the Mississippi Valley north to Kentucky and Missouri. They winter along the Gulf Coast north to North Carolina. The anhinga diet is primarily fish. Using their sharp bills, anhingas spear the fish, flip them in the air and swallow them head-first. KSC shares a boundary with the Merritt Island Wildlife Nature Refuge. The refuge is a habitat for more than 310 species of birds, 25 mammals, 117 fishes and 65 amphibians and reptiles. In addition, the Refuge supports 19 endangered or threatened wildlife species on Federal or State lists, more than any other single refuge in the U.S. Photo credit: NASA/Dimitri Gerondidakis

A transmission spectrum made from a single observation using Webb’s Near-Infrared Imager and Slitless Spectrograph (NIRISS) reveals atmospheric characteristics of the hot gas giant exoplanet WASP-96 b. A transmission spectrum is made by comparing starlight filtered through a planet’s atmosphere as it moves across the star, to the unfiltered starlight detected when the planet is beside the star. Each of the 141 data points (white circles) on this graph represents the amount of a specific wavelength of light that is blocked by the planet and absorbed by its atmosphere. In this observation, the wavelengths detected by NIRISS range from 0.6 microns (red) to 2.8 microns (in the near-infrared). The amount of starlight blocked ranges from about 13,600 parts per million (1.36 percent) to 14,700 parts per million (1.47 percent). Researchers are able to detect and measure the abundances of key gases in a planet’s atmosphere based on the absorption pattern – the locations and heights of peaks on the graph: each gas has a characteristic set of wavelengths that it absorbs. The temperature of the atmosphere can be calculated based in part on the height of the peaks: a hotter planet has taller peaks. Other characteristics, like the presence of haze and clouds, can be inferred based on the overall shape of different portions of the spectrum. The gray lines extending above and below each data point are error bars that show the uncertainty of each measurement, or the reasonable range of actual possible values. For a single observation, the error on these measurements is remarkably small. The blue line is a best-fit model that takes into account the data, the known properties of WASP-96 b and its star (e.g., size, mass, temperature), and assumed characteristics of the atmosphere. Researchers can vary the parameters in the model – changing unknown characteristics like cloud height in the atmosphere and abundances of various gases – to get a better fit and further understand what the atmosphere is really like. The difference between the best-fit model shown here and the data simply reflects the additional work to be done in analyzing and interpreting the data and the planet. Although full analysis of the spectrum will take additional time, it is possible to draw a number of preliminary conclusions. The labeled peaks in the spectrum indicate the presence of water vapor. The height of the water peaks, which is less than expected based on previous observations, is evidence for the presence of clouds that suppress the water vapor features. The gradual downward slope of the left side of the spectrum (shorter wavelengths) is indicative of possible haze. The height of the peaks along with other characteristics of the spectrum is used to calculate an atmospheric temperature of about 1350°F (725°C). This is the most detailed infrared exoplanet transmission spectrum ever collected, the first transmission spectrum that includes wavelengths longer than 1.6 microns with such high resolution and accuracy, and the first to cover the entire wavelength range from 0.6 microns (visible red light) to 2.8 microns (near-infrared) in a single shot. The speed with which researchers have been able to make confident interpretations of the spectrum is further testament to the quality of the data. The observation was made using NIRISS’s Single-Object Slitless Spectroscopy (SOSS) mode, which involves capturing the spectrum of a single bright object, like the star WASP-96, in a field of view. WASP-96 b is a hot gas giant exoplanet that orbits a Sun-like star roughly 1,150 light-years away, in the constellation Phoenix. The planet orbits extremely close to its star (less than 1/20th the distance between Earth and the Sun) and completes one orbit in less than 3½ Earth-days. The planet’s discovery, based on ground-based observations, was announced in 2014. The star, WASP-96, is somewhat older than the Sun, but is about the same size, mass, temperature, and color. The background illustration of WASP-96 b and its star is based on current understanding of the planet from both NIRISS spectroscopy and previous ground- and space-based observations. Webb has not captured a direct image of the planet or its atmosphere. NIRISS was contributed by the Canadian Space Agency. The instrument was designed and built by Honeywell in collaboration with the Université de Montréal and the National Research Council Canada.
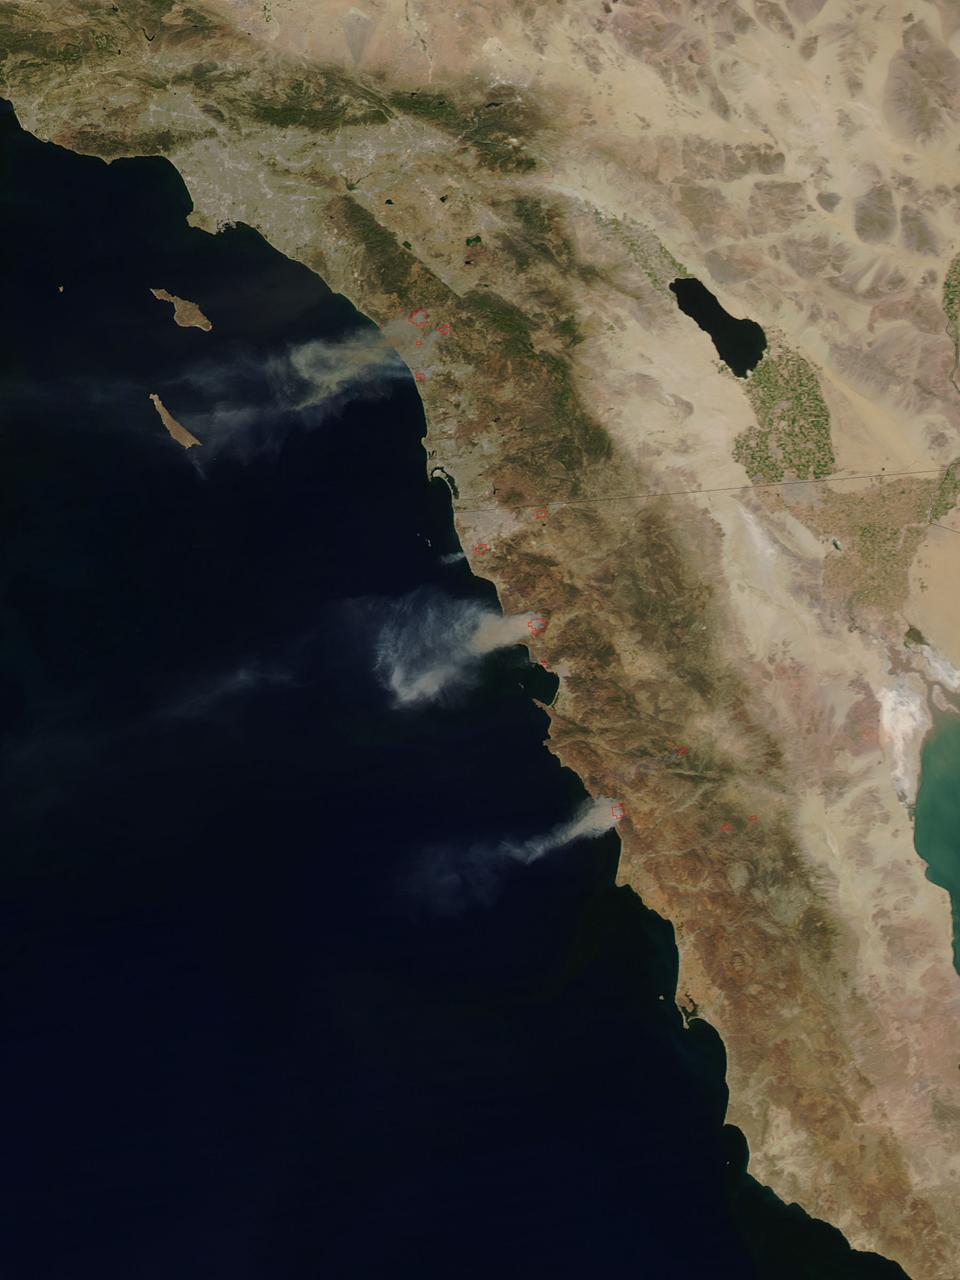
The single fire that ignited and split into nine separate fires still blazes in Southern California today. Firefighters are hoping for a break today (Thursday, May 15, 2014) but it doesn't look like luck may be on their side. Conditions continue to be bone dry with unseasonal heat (98-106 degrees) and the Santa Ana winds are kicking up and allowing these fires to easy jump fire lines. This particular fire started on Wednesday as a single fire and within a day is now nine separate fires which have burned close to 10,000 acres. These fires are threatening more than just landscape in San Diego county, they are also threatening homes, universities, a military base and a nuclear power plant. Day Two of the fires have seen them already destroying dozens of homes and forcing tens of thousands to evacuate. Camp Pendleton has also been partially evacuated due to the blazes as has the popular amusement park, Legoland. The Governor of California has declared a state of emergency. Thousands of firefighters are battling the flames both on the ground and in the air. Seven tankers and 20 military aircraft are also assisting the firefighters with their mission. Temperatures soaring over 100 degrees coupled with 30 mph wind gusts have severely hampered the efforts, however, and fire tornadoes have broken out. Fire tornadoes are caused by crosswinds that create a vortex and produce winds that twist and swirl just like a tornado but with flames that coil upwards in the center of the twister creating a terrifying specter. Although there is no chance of rain in the area for the next several days, the temperatures will start to subside on Friday and into the weekend. Winds are also expected to start to subside, giving firefighters that break that they so desperately need. This natural-color satellite image was collected by the Moderate Resolution Imaging Spectroradiometer (MODIS) aboard the Aqua satellite on May 14, 2014. Actively burning areas, detected by MODIS’s thermal bands, are outlined in red. Credit: NASA/GSFC/Jeff Schmaltz/MODIS Land Rapid Response Team <b><a href="http://www.nasa.gov/audience/formedia/features/MP_Photo_Guidelines.html" rel="nofollow">NASA image use policy.</a></b> <b><a href="http://www.nasa.gov/centers/goddard/home/index.html" rel="nofollow">NASA Goddard Space Flight Center</a></b> enables NASA’s mission through four scientific endeavors: Earth Science, Heliophysics, Solar System Exploration, and Astrophysics. Goddard plays a leading role in NASA’s accomplishments by contributing compelling scientific knowledge to advance the Agency’s mission. <b>Follow us on <a href="http://twitter.com/NASAGoddardPix" rel="nofollow">Twitter</a></b> <b>Like us on <a href="http://www.facebook.com/pages/Greenbelt-MD/NASA-Goddard/395013845897?ref=tsd" rel="nofollow">Facebook</a></b> <b>Find us on <a href="http://instagram.com/nasagoddard?vm=grid" rel="nofollow">Instagram</a></b>
ISS012-E-15918 (24 Jan. 2006) --- Belle Isle and a portion of Newfoundland, Canada are featured in this image photographed by an Expedition 12 crew member on the International Space Station. Belle Isle (center) is surrounded by sea ice in this recent winter view. Belle Isle lies in the strait between the Island of Newfoundland and Labrador (the mainland portion of Canada’s province of Newfoundland). Small islands along the coast of Labrador appear in the top left corner. In this key location Belle Isle lies on the shortest shipping lanes between the Great Lakes and Europe, and also on the main north-south shipping route to Hudson Bay and the Northwest Territories. Snow and ice in this recent winter view obliterate the dozens of glacier-scoured lakes that dot the surface of the island. The single community of Belle Isle Landing on the southeast tip is equally hard to see. Ice patterns also show that the island lies at the meeting point of two sea currents. The Labrador Current flows from the northwest (top left), and a smaller current, driven by dominant westerly winds, flows from the southwest (lower left) out of the narrow Belle Isle Strait (out of frame lower left). Flow lines in sea ice indicate the sense of movement of the ice. Ice floes embedded in the Labrador Current appear in the upper part of the image as a relatively open pattern. Sea ice with a denser pattern enters from the lower left corner, banking against the west side of Belle Isle. Tendrils flow around capes at either end of the island, with an ice-free “shadow” on the opposite, downstream side. Eddies (center) in the ice patterns show where the currents interact, north and west of the island.
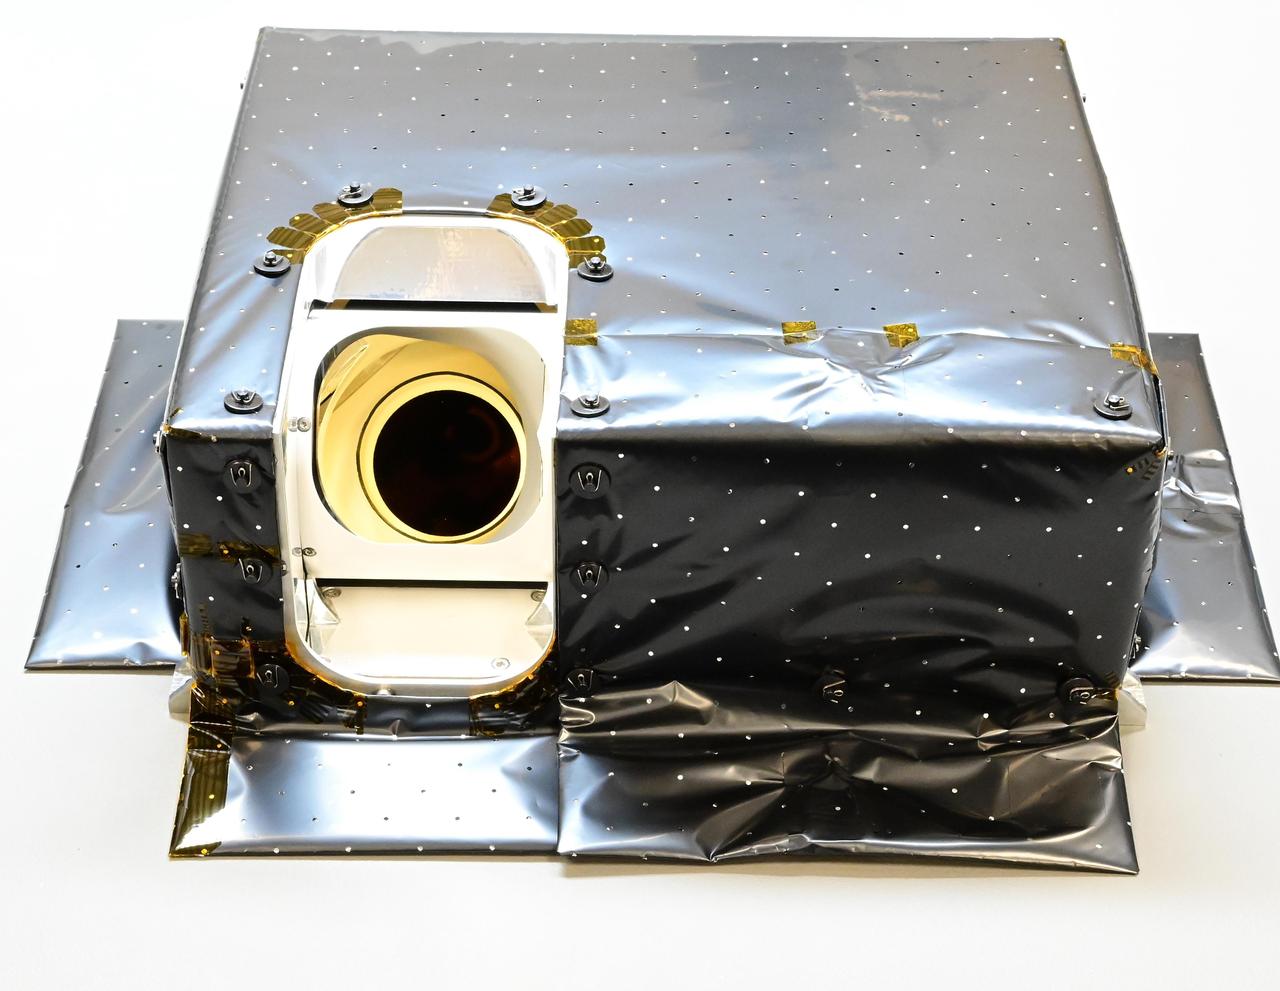
Seen here before being shipped from the U.K. to the U.S., the Lunar Thermal Mapper (LTM) is one of two instruments that will be carried by NASA's Lunar Trailblazer. Launching in 2023, the small spacecraft – measuring only about 11 feet (3.5 meters) wide with its solar panels fully deployed – will also carry the High-resolution Volatiles and Minerals Moon Mapper (HVM³). The two instruments will work together to help detect and map water on the Moon's surface to determine its abundance, location, form, and how and why it varies by location and time. In February 2023, LTM completed qualification for flight and calibration at the University of Oxford in England. The instrument will provide maps of lunar surface temperature from about minus 261 degrees Fahrenheit (minus 163 degrees Celsius) to 261 F (127 C) using four broad-band infrared channels covering wavelengths from 6.25 to 100 micrometers. The instrument also has 11 narrower infrared channels that are sensitive enough to detect and map small variations in the composition of silicate minerals that make up the rocks and soils of the Moon's surface. The instrument is shown here wrapped with a multilayer insulation blanket to assist with thermal control. Not covered by insulation is LTM's single "eye" – a scan mirror that can pivot down to look at the Moon's surface or outward into space for calibration purposes. The scan mirror collects a line of pixels at a time to form an image via the motion of the spacecraft. During vacuum testing the instrument viewed external targets that varied in temperature between minus 261 F (minus 163 C) and 243 F (117 C) so that it could be calibrated. The alignment, spectral, and radiometric (temperature) accuracy of LTM was checked both before and after the instrument was tested via vibration and cycling through thermal environments identical to what it will experience during launch and operation in lunar orbit. With these tests complete, the instrument was packed and shipped for integration with the Lunar Trailblazer spacecraft at Lockheed Martin Space in Colorado. https://photojournal.jpl.nasa.gov/catalog/PIA25831
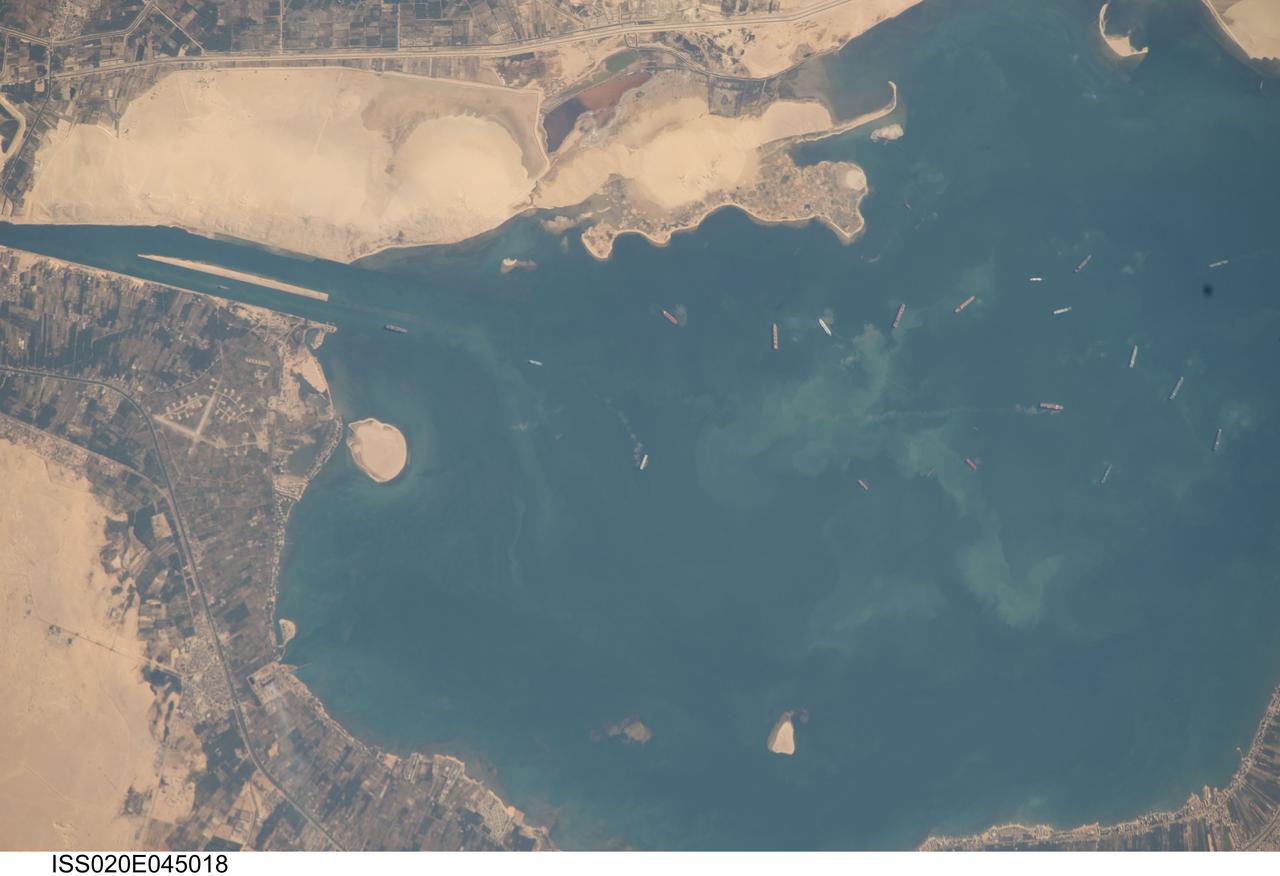
ISS020-E-045018 (2 Oct. 2009) --- Great Bitter Lake, Egypt is featured in this image photographed by an Expedition 20 crew member on the International Space Station. The Great Bitter Lake is one of several lakes located along the Suez Canal that connects the eastern Mediterranean and Red Seas. As the Canal is built only to allow ships to travel in a single lane, the Great Bitter Lake is a location where ships can change their position in line - much like a motor highway passing lane - before proceeding to either Port Said to the north, or the port of Suez to the south. The lake also provides an intermediate harborage for ships traversing the Canal ? a journey that typically takes 14 hours end-to-end. Several ships - some under power and some anchored ? are visible at right. Prior to the opening of the Suez Canal in 1869, Great Bitter Lake was a large salt flat, the typical geomorphic expression of basins in the arid Egyptian climate. Large expanses of white to tan sandy sediments at left and top attest to the desert conditions surrounding the Lake. Located at the approximate midpoint of the Suez Canal, Great Bitter Lake is now filled with water derived from both the Red and Mediterranean Seas and this steady influx of water balances the water lost to evaporation. The town of Fayid (also spelled as Fayed), visible along the western shore of the Lake (bottom) is a tourist destination frequented, particularly in the summer months, by residents of Cairo.
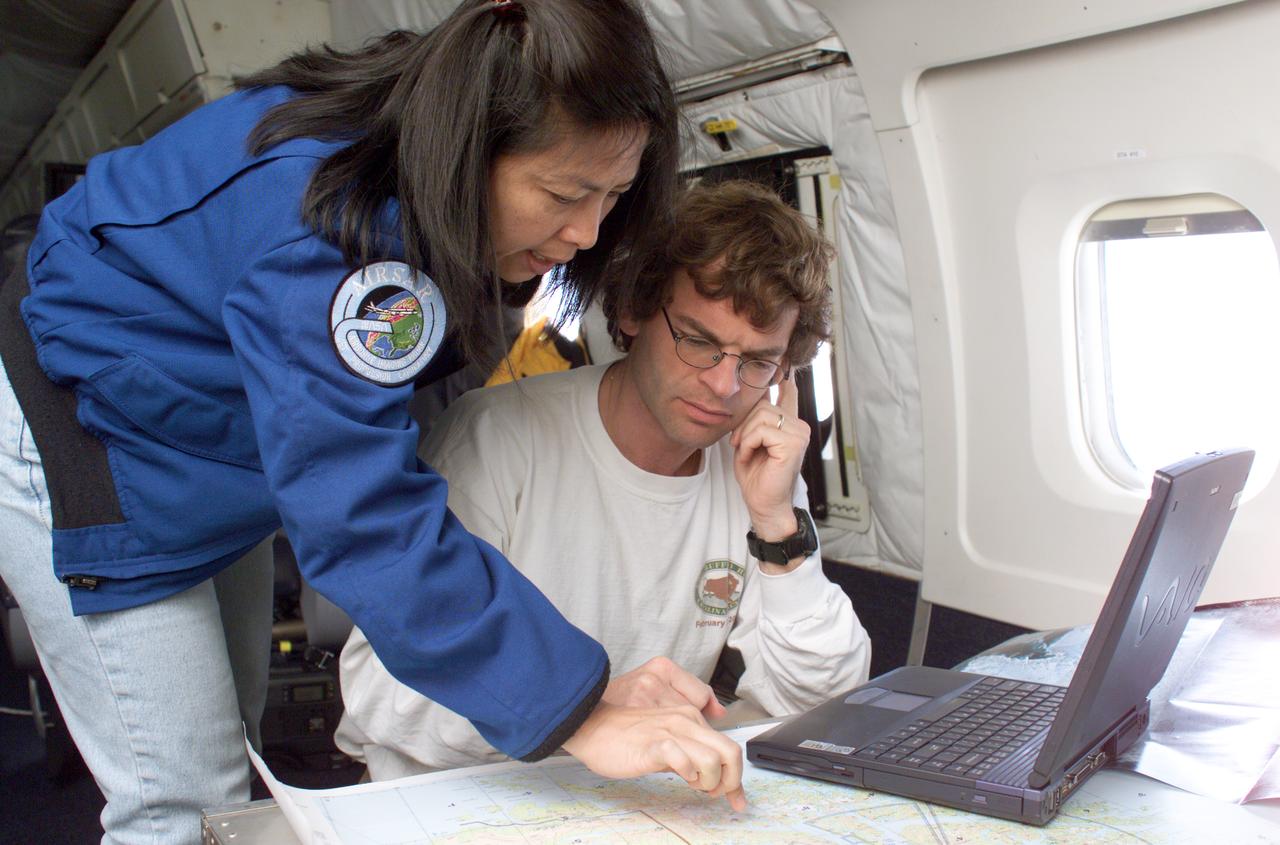
NASA JPL scientists Yunling Lou and Dr. Eric Rignot work on line selection while flying AirSAR missions over the Antarctic Peninsula. AirSAR 2004 is a three-week expedition in Central and South America by an international team of scientists that is using an all-weather imaging tool, called the Airborne Synthetic Aperture Radar (AirSAR), located onboard NASA's DC-8 airborne laboratory. Scientists from many parts of the world are combining ground research with NASA's AirSAR technology to improve and expand on the quality of research they are able to conduct. These photos are from the DC-8 aircraft while flying an AirSAR mission over Antarctica. The Antarctic Peninsula is more similar to Alaska and Patagonia than to the rest of the Antarctic continent. It is drained by fast glaciers, receives abundant precipitation, and melts significantly in the summer months. In recent decades, the Peninsula has experienced significant atmospheric warming (about 2 degrees C since 1950), which has triggered a vast and spectacular retreat of its floating ice shelves, glacier reduction, a decrease in permanent snow cover and a lengthening of the melt season. As a result, the contribution to sea level from this region could be rapid and substantial. With an area of 120,000 km, or ten times the Patagonia ice fields, the Peninsula could contribute as much as 0.4mm/yr sea level rise, which would be the largest single contribution to sea level from anywhere in the world. This region is being studied by NASA using a DC-8 equipped with the Airborne Synthetic Aperture Radar developed by scientists from NASA’s Jet Propulsion Laboratory. AirSAR will provide a baseline model and unprecedented mapping of the region. This data will make it possible to determine whether the warming trend is slowing, continuing or accelerating. AirSAR will also provide reliable information on ice shelf thickness to measure the contribution of the glaciers to sea level.
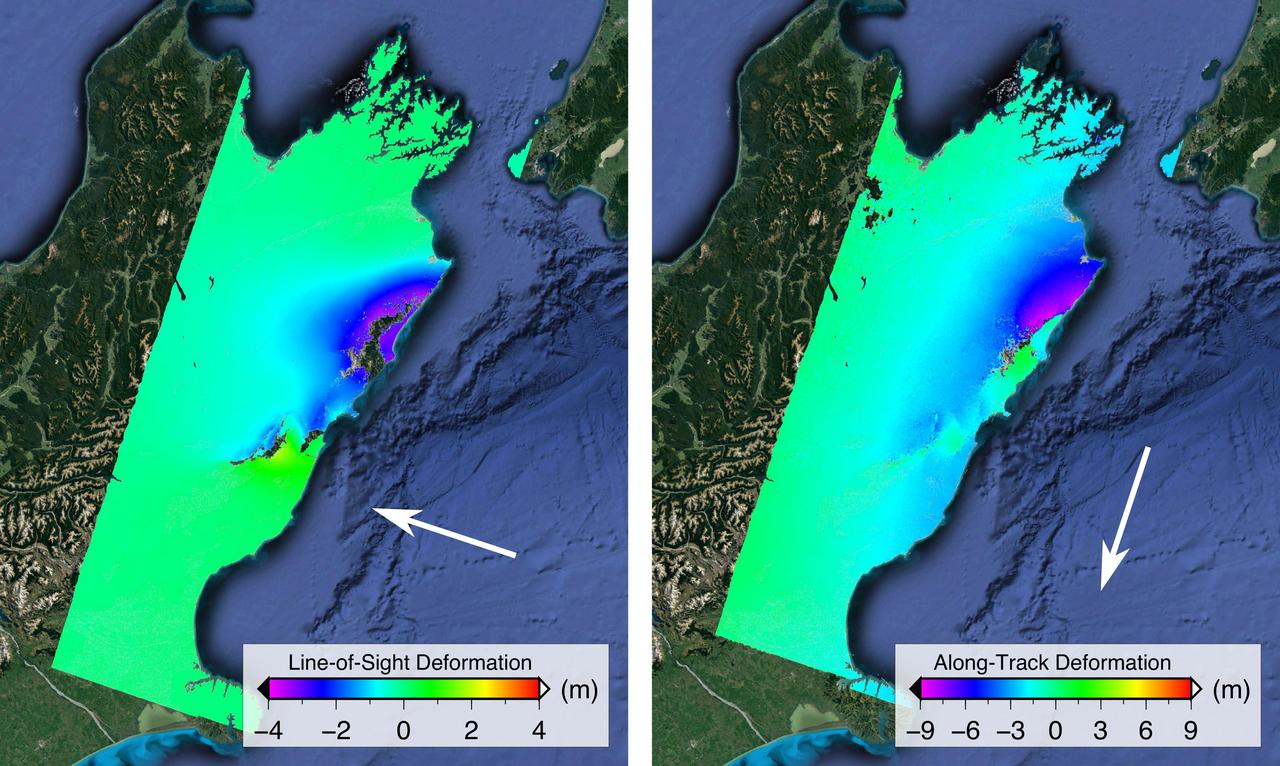
NASA and its partners are contributing important observations and expertise to the ongoing response to the Nov. 14, 2016, magnitude 7.8 Kaikoura earthquake in New Zealand. This shallow earthquake was so complex and unusual, it is likely to change how scientists think about earthquake hazards in plate boundary zones around the world. Scientists with the Advanced Rapid Imaging and Analysis project (ARIA), a collaboration between NASA's Jet Propulsion Laboratory, Pasadena, California, and Caltech in Pasadena, analyzed interferometric synthetic aperture radar images from the PALSAR-2 instrument on the ALOS-2 satellite operated by the Japan Aerospace Exploration Agency (JAXA) to calculate maps of the deformation of Earth's surface caused by the quake. Two maps show motion of the surface in two different directions. Each false-color map shows the amount of permanent surface movement caused almost entirely by the earthquake, as viewed by the satellite, during a 28-day interval between two ALOS-2 wide-swath images acquired on Oct. 18 and Nov. 15, 2016. In these two new maps made from the wide-swath images, the colors of the surface displacements are proportional to the surface motion. The wide-swath images cover the entire 106-mile (170-kilometer) length of the complex set of earthquake ruptures. The arrows show the direction of the radar motion measurement. In the left image, the blue and purple tones show the areas where the land around the Kaikoura peninsula in the Marlborough region of New Zealand's South Island has moved toward the satellite by up to 13.2 feet (4 meters), both eastward and upward. In the right image, the blue and purple tones show the areas that moved to the north by up to 30 feet (9 meters) and green tones show the area that moved to the south. The sharp line of color change is across the Kekerengu Fault, which had the largest amount of motion in the earthquake. Field studies found maximum rupture at the surface was measured at 39 feet (12 meters) of horizontal displacement. Several other faults have sharp color changes due to smaller amounts of motion, with a total of at least 12 faults rupturing in this single large earthquake. Areas without color have snow, heavy vegetation or open water that prevents the radar measurements from being coherent between satellite images – a required condition to measure ground displacement. Scientists use these maps to build detailed models of the fault slip at depth and associated land movements to better understand the impact on future earthquake activity. The PALSAR-2 data were provided by JAXA through the Committee on Earth Observation Satellites (CEOS) and through scientific research projects. The background image is from Google Earth. http://photojournal.jpl.nasa.gov/catalog/PIA21210
Aerial view cityscape from airplane at summer

(February 19, 2025) -- NASA astronaut Don Pettit demonstrates electrostatic forces using charged water droplets and a knitting needle made of Teflon. This series of overlapping frames displays the unique attraction-repulsion properties of Teflon and charged droplets, similar to how charged particles from the Sun behave when they come in contact with Earth’s magnetic field. Highly energetic particles from space that collide with atoms and molecules in the atmosphere create the aurora borealis.