
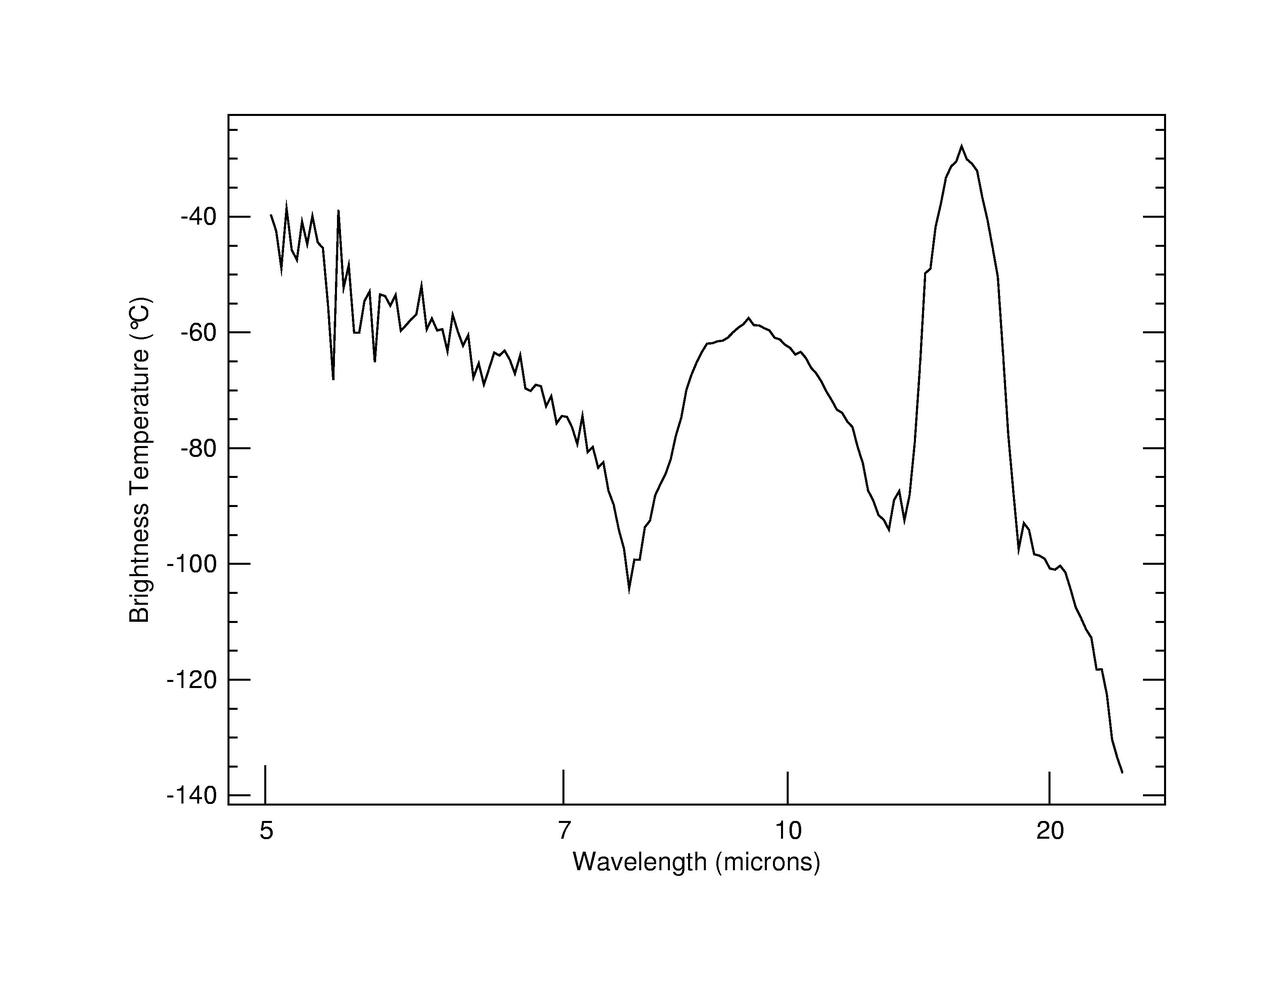
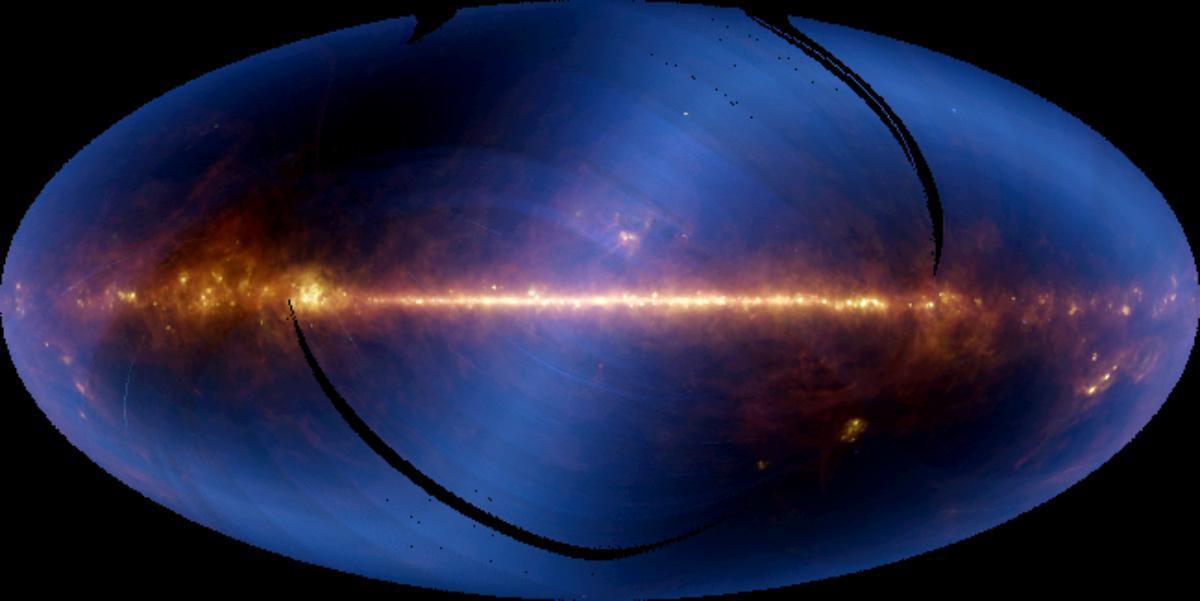
This panoramic view encompasses the entire sky as seen by Two Micron All-Sky Survey. The measured brightnesses of half a billion stars (points) have been combined into colors representing three distinct wavelengths of infrared light: blue at 1.2 microns, green at 1.6 microns, and red at 2.2 microns. This image is centered on the core of our own Milky Way galaxy, toward the constellation of Sagittarius. The reddish stars seemingly hovering in the middle of the Milky Way's disc -- many of them never observed before -- trace the densest dust clouds in our galaxy. The two faint smudges seen in the lower right quadrant are our neighboring galaxies, the Small and Large Magellanic Clouds. http://photojournal.jpl.nasa.gov/catalog/PIA04250

This video shows the SPHEREx observatory's field of view as it scans across a section of the sky, observing the universe in 102 colors, or wavelengths of light. Taken in April 2025, just weeks after the spacecraft's launch, the images show a region inside the Large Magellanic Cloud, a dwarf galaxy near the Milky Way. The wavelengths seen by NASA's SPHEREx (Spectro-Photometer for the History of the Universe, Epoch of Reionization and Ices Explorer) are in the infrared range, which is invisible to the human eye; the infrared wavelengths are represented here by visible light colors. While most telescopes use color filters that block one wavelength at a time, SPHEREx's filters gradually transition through a range of wavelengths, creating the rainbow gradients seen in this video. The telescope takes overlapping images so that every section of the sky is imaged 102 times, each time in a different wavelength. The color filters sit on top of two arrays, each with three detectors, that observe the sky simultaneously. In the video, one array's view moves from purple to green, followed by the second array's view (of the same section of sky), which changes from yellow to red. The images are looped four times. SPHEREx will repeat this scanning motion each day for two years, gradually compiling a map of the entire sky. Every day, it will take about 600 exposures, each of which is made up of six images, one from each of the six detectors. Combining those images, scientists can see the total emission from the observed section of the sky or look at an individual wavelength. Observing individual wavelengths of light from cosmic sources is called spectroscopy. This technique can be used to reveal the composition of objects, because chemical elements and molecules leave a unique signature in the colors they absorb and emit. This is made apparent in the images' lower right quadrant, where a collection of dust appears only in the red and orange wavelengths. This indicates the presence of a particular molecule that radiates in specific wavelengths and not others. Video available at https://photojournal.jpl.nasa.gov/catalog/PIA26351
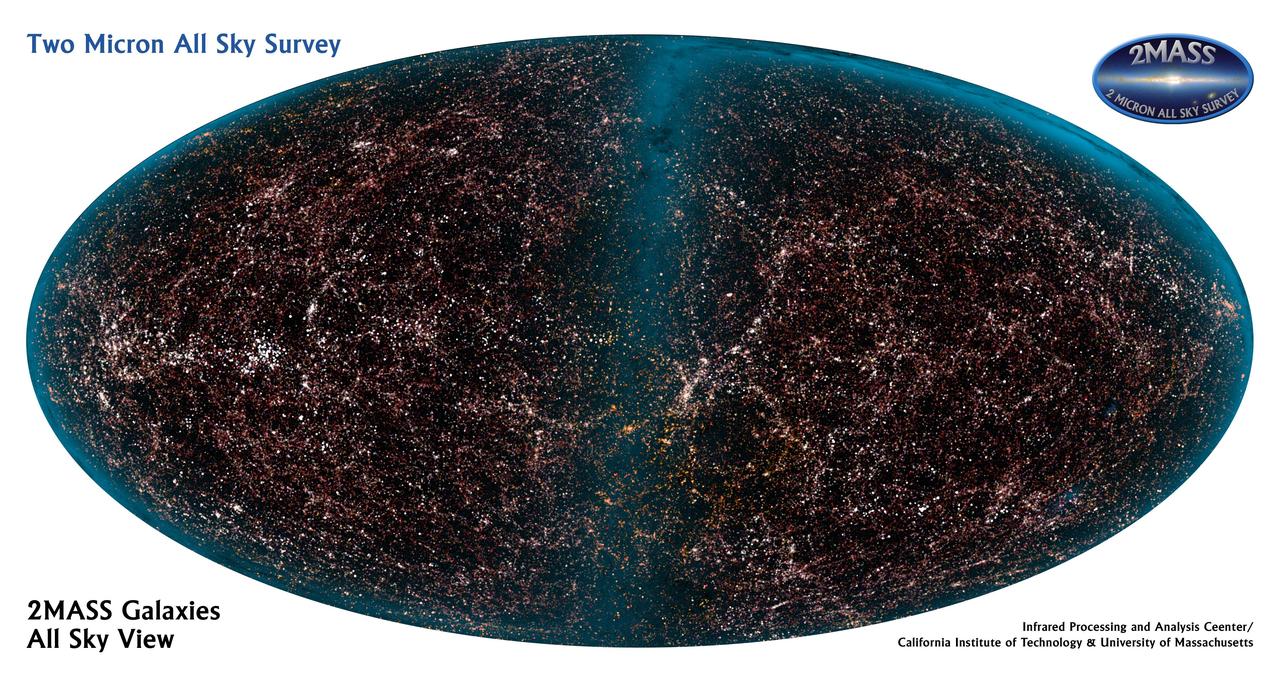
This panoramic view encompasses the entire sky and reveals the distribution of galaxies beyond the Milky Way galaxy, which astronomers call extended sources, as observed by Two Micron All-Sky Survey. The image is assembled from a database of over 1.6 million galaxies listed in the survey’s All-Sky Survey Extended Source Catalog; more than half of the galaxies have never before been catalogued. The colors represent how the many galaxies appear at three distinct wavelengths of infrared light (blue at 1.2 microns, green at 1.6 microns, and red at 2.2 microns). Quite evident are the many galactic clusters and superclusters, as well as some streamers composing the large-scale structure of the nearby universe. The blue overlay represents the very close and bright stars from our own Milky Way galaxy. In this projection, the bluish Milky Way lies predominantly toward the upper middle and edges of the image. http://photojournal.jpl.nasa.gov/catalog/PIA04251
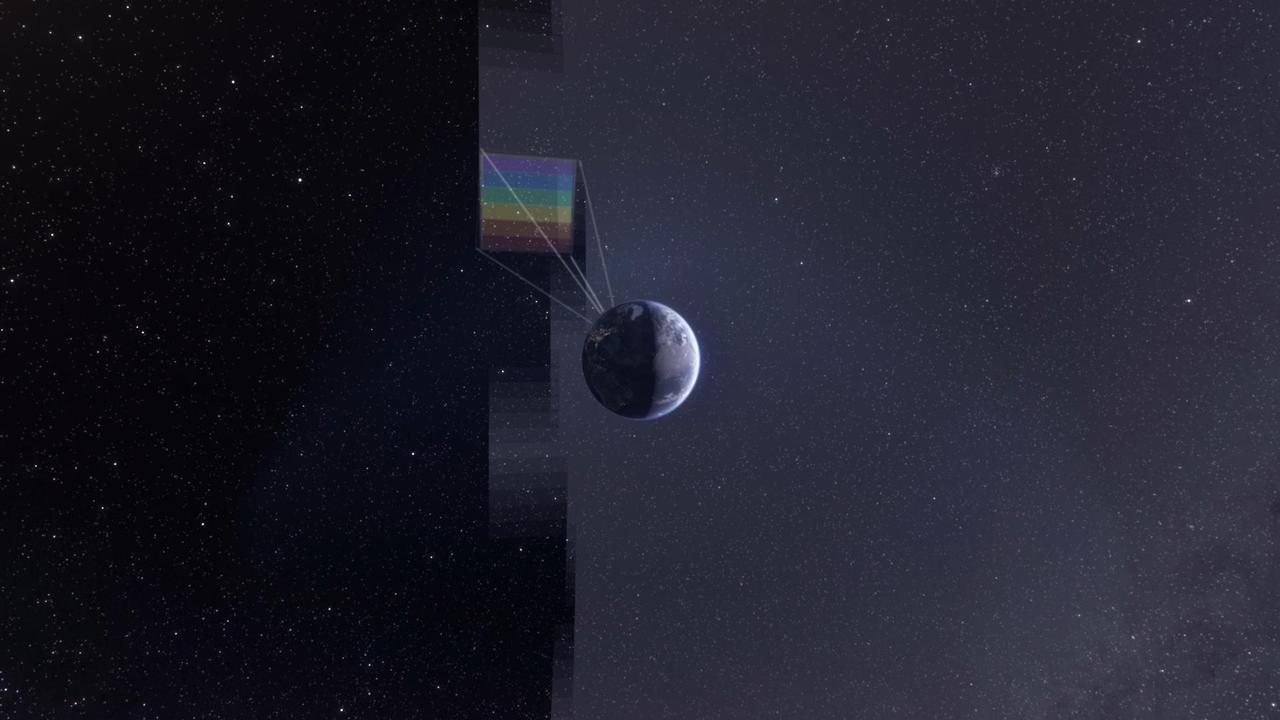
NASA's SPHEREx observatory will map the entire sky to help scientists answer big-picture questions about the origins of our universe, galaxies, and key ingredients for life in our galaxy, such as water. Operating from low Earth orbit, the telescope will sweep across the sky, taking about 600 exposures each day. Using a technique called spectroscopy, the observatory will image every section of the sky 102 times, each time using a different color filter that blocks all wavelengths except one. By combining those images, the mission will produce a map containing information about the composition of and distance to millions of stars and other objects in our galaxy and hundreds of millions of galaxies beyond. (See an animation of this process, depicted in a still artist's concept above, at spherex.caltech.edu/video/all-sky-survey.) Short for Spectro-Photometer for the History of the Universe, Epoch of Reionization and Ices Explorer, SPHEREx will help scientists study what happened in the first fraction of a second after the big bang, how galaxies formed and evolved, and the origins of water in planetary systems in our galaxy. https://photojournal.jpl.nasa.gov/catalog/PIA26533
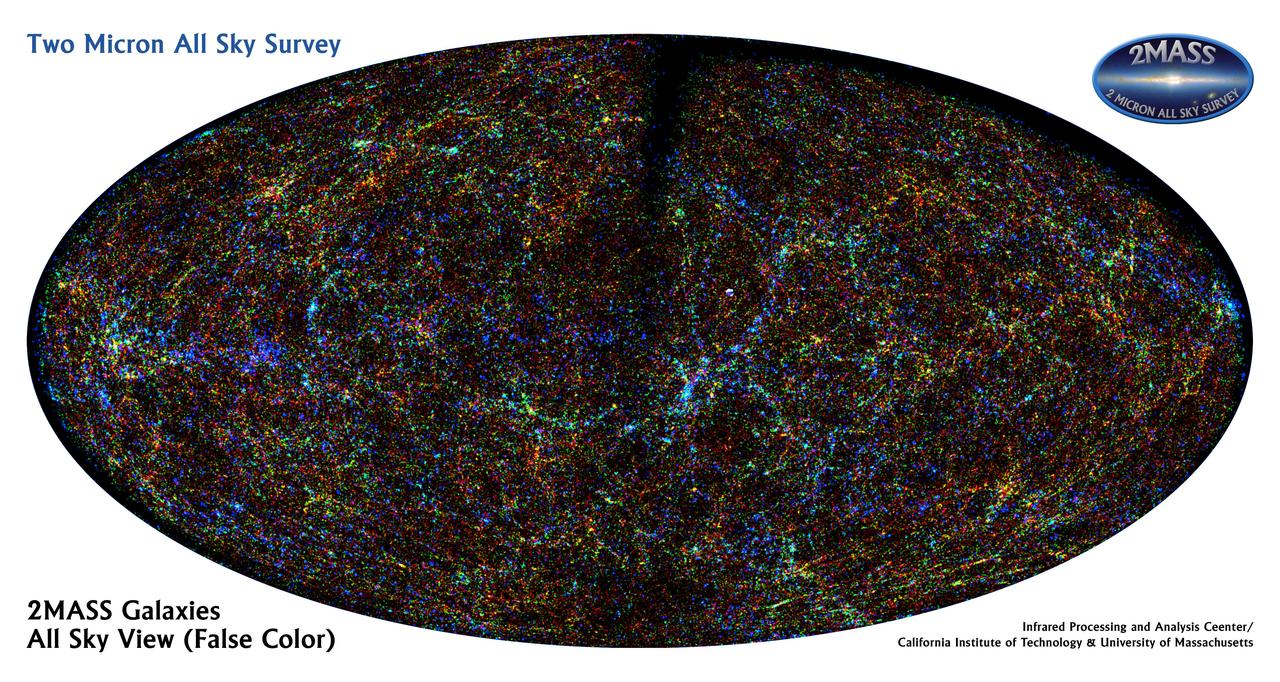
This panoramic view of the entire sky reveals the distribution of galaxies beyond our Milky Way galaxy, which astronomers call extended sources, as observed by Two Micron All-Sky Survey. The image is constructed from a database of over 1.6 million galaxies listed in the survey's Extended Source Catalog; more than half of the galaxies have never before been catalogued. The image is a representation of the relative brightnesses of these million-plus galaxies, all observed at a wavelength of 2.2 microns. The brightest and nearest galaxies are represented in blue, and the faintest, most distant ones are in red. This color scheme gives insights into the three dimensional large-scale structure of the nearby universe with the brightest, closest clusters and superclusters showing up as the blue and bluish-white features. The dark band in this image shows the area of the sky where our Milky Way galaxy blocks our view of distant objects, which, in this projection, lies predominantly along the edges of the image. http://photojournal.jpl.nasa.gov/catalog/PIA04252
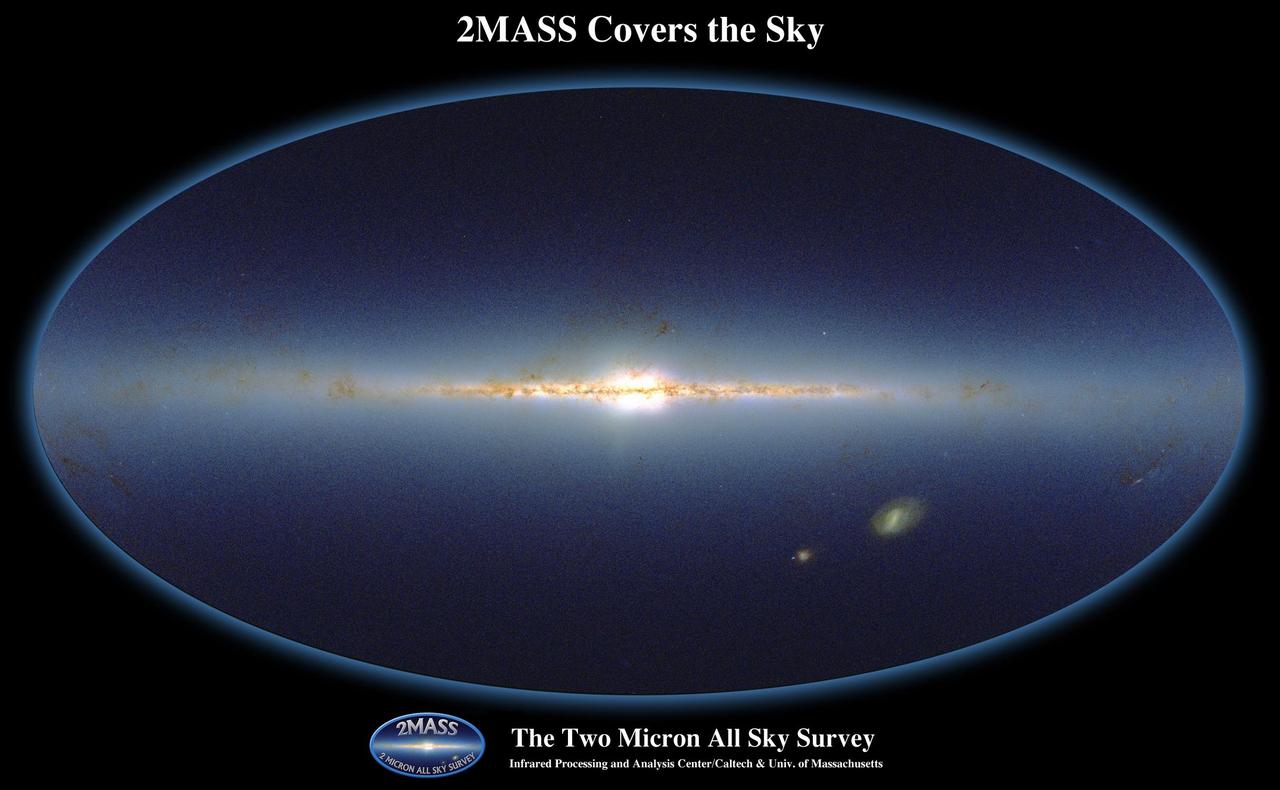
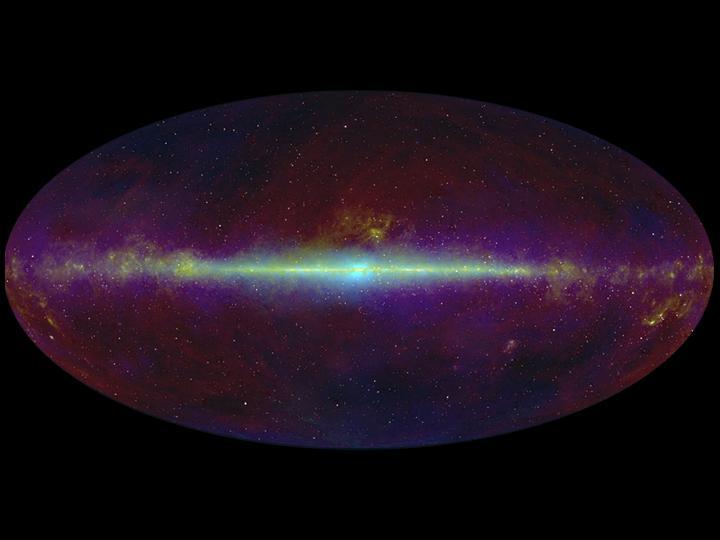
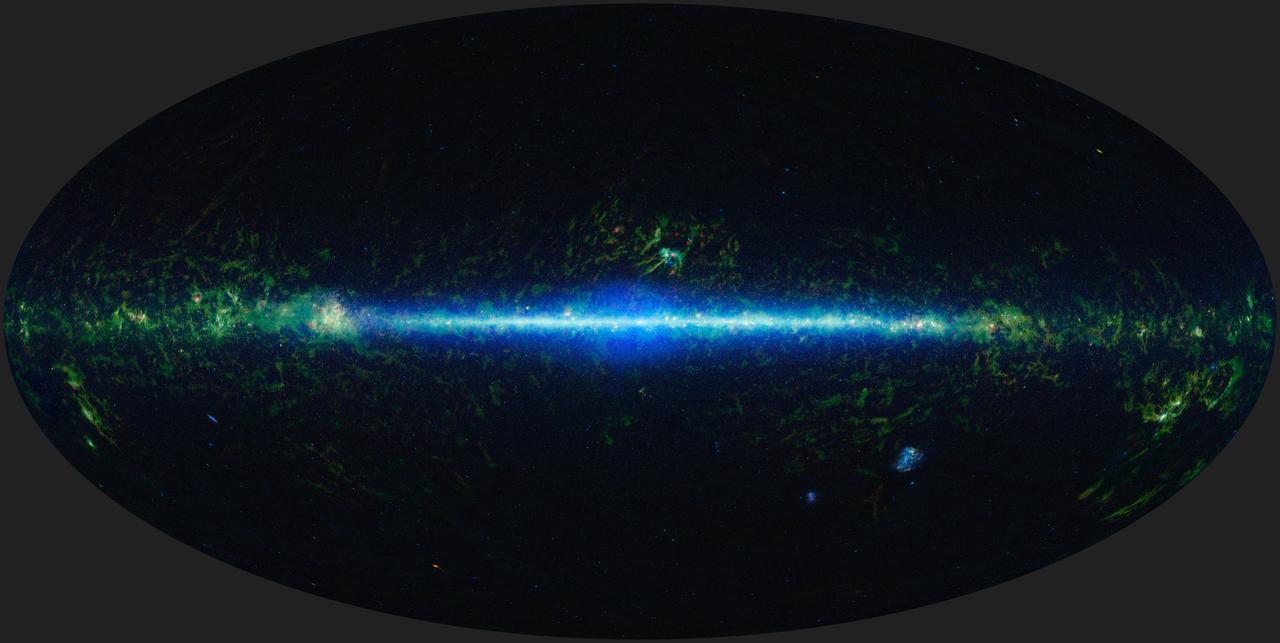
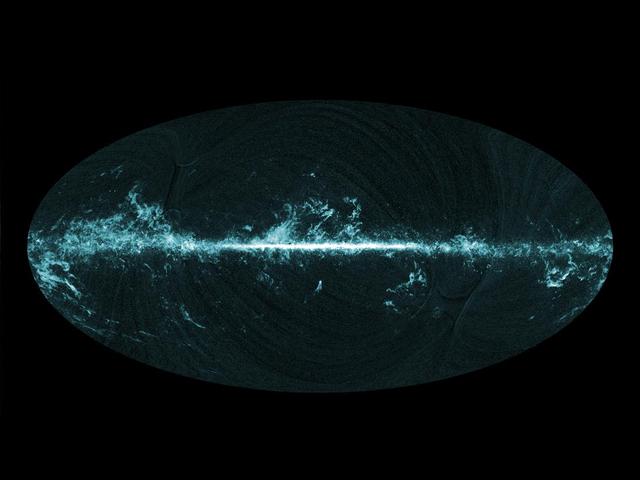
Aitoff projection of the three-color composite JHKs source count map of the entire sky, based on 95,851,173 stars with Ks 13.5. What appears most prominently are the Galactic plane and the Galactic bulge.
Crowded Sky
A Violet Martian Sky
Eyeing the Sky Water Vapor
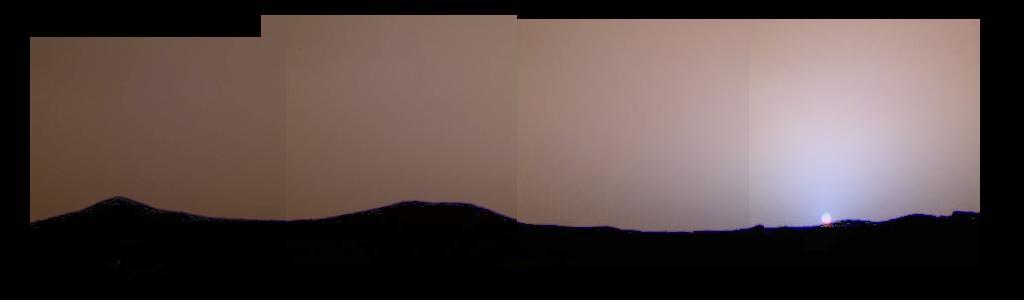
The Night Sky on Mars
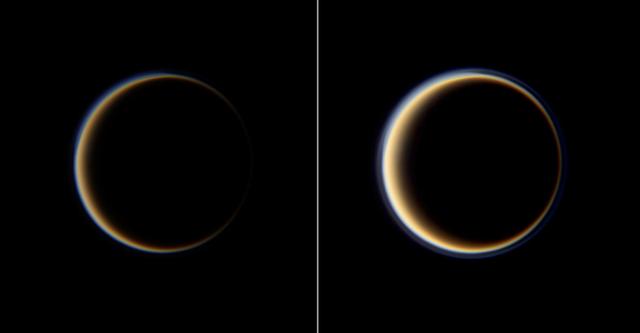
Hazy Ring of Titan Sky
Color Variations in the Sky at Sunset
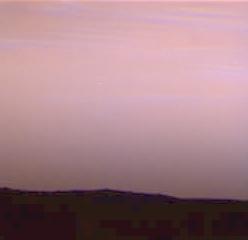
Pre-Dawn Martian Sky

This view of the gamma-ray sky constructed from one year of Fermi LAT observations is the best view of the extreme universe to date. The map shows the rate at which the LAT detects gamma rays with energies above 300 million electron volts -- about 120 million times the energy of visible light -- from different sky directions. Brighter colors equal higher rates. Credit: NASA/DOE/Fermi LAT Collaboration Full story: <a href="http://www.nasa.gov/mission_pages/GLAST/news/first_year.html" rel="nofollow">www.nasa.gov/mission_pages/GLAST/news/first_year.html</a>
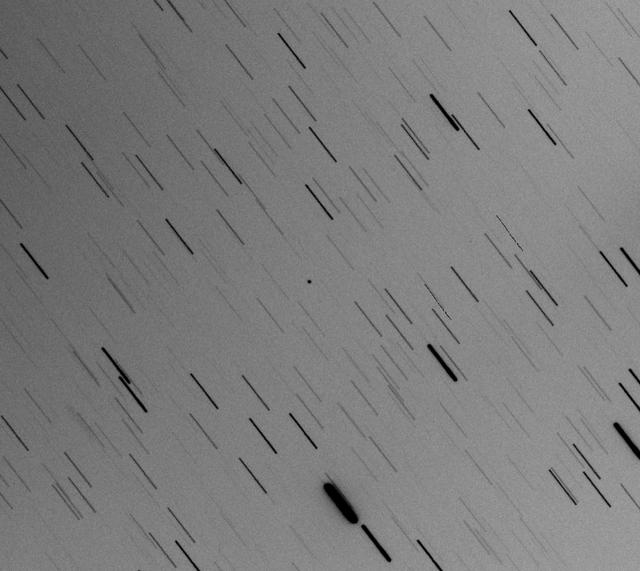
This frame from a sequence of four images taken during one night of observation by NASA's Catalina Sky Survey near Tucson, Arizona, shows the speck of light that moves relative to the background stars is a small asteroid that was, at the time, about as far away as the moon. This asteroid, named 2014 AA, was the second one ever detected on course to impact Earth. It was estimated to be about 6 to 10 feet (2 to 3 meters) in diameter, and it harmlessly hit Earth's atmosphere over the Atlantic Ocean about 20 hours after its discovery in these images. The images were taken Jan. 1, 2014. They provide an example of how asteroids are typically discovered by detection of their motion relative to background stars. An animation is available at https://photojournal.jpl.nasa.gov/catalog/PIA21712
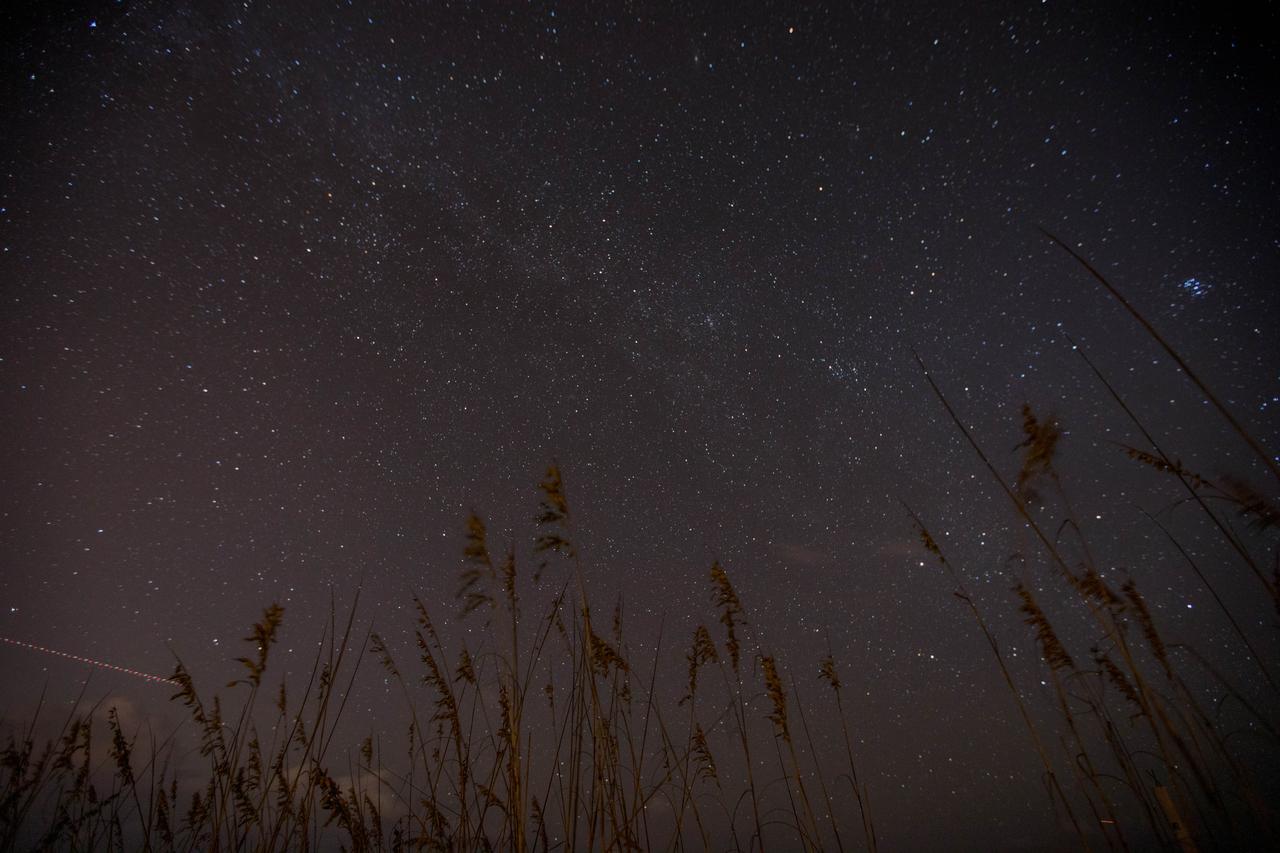
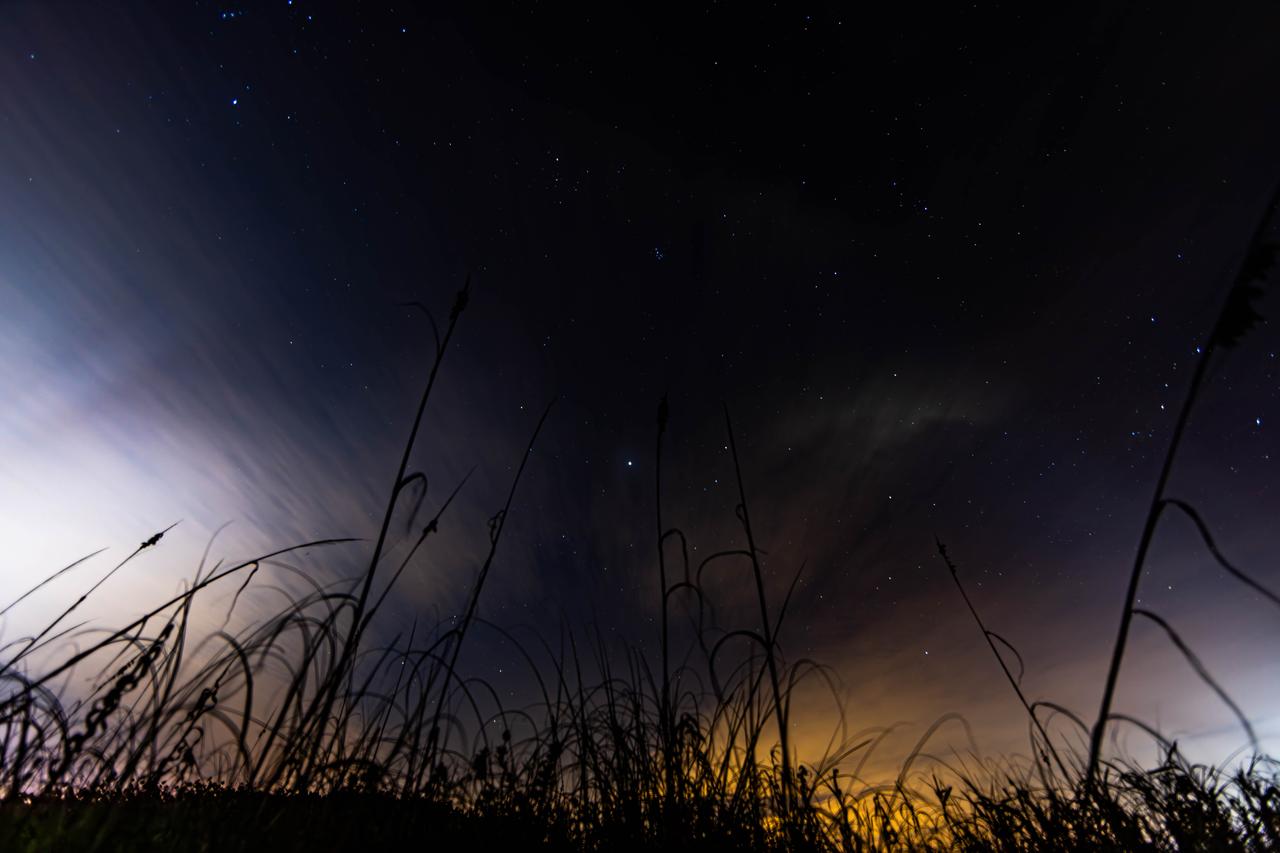
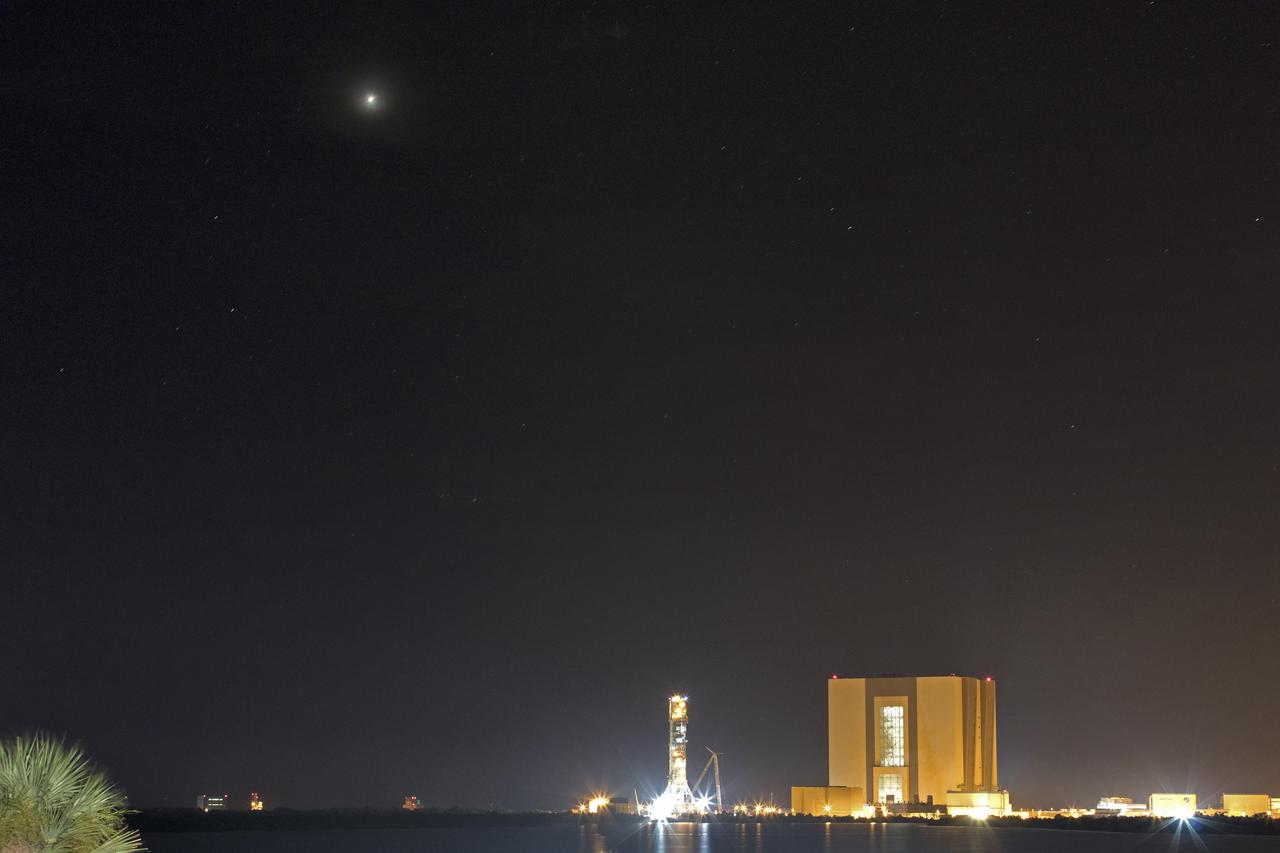
Sea oats frame the night sky, bisected by the Milky Way, in this view from the Atlantic shoreline at NASA’s Kennedy Space Center in Florida on Oct. 31, 2019. The lights of an aircraft create an illuminated streak in the lower left corner.
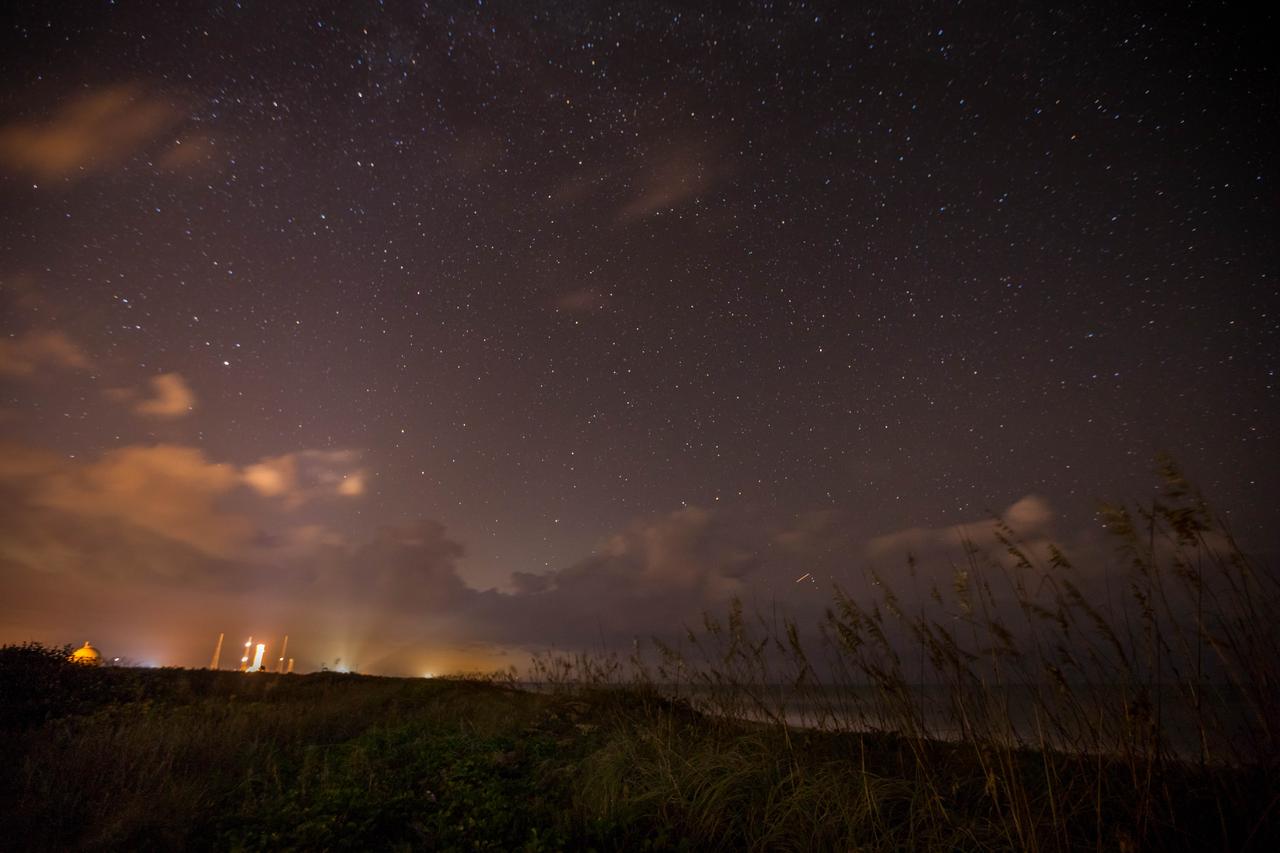
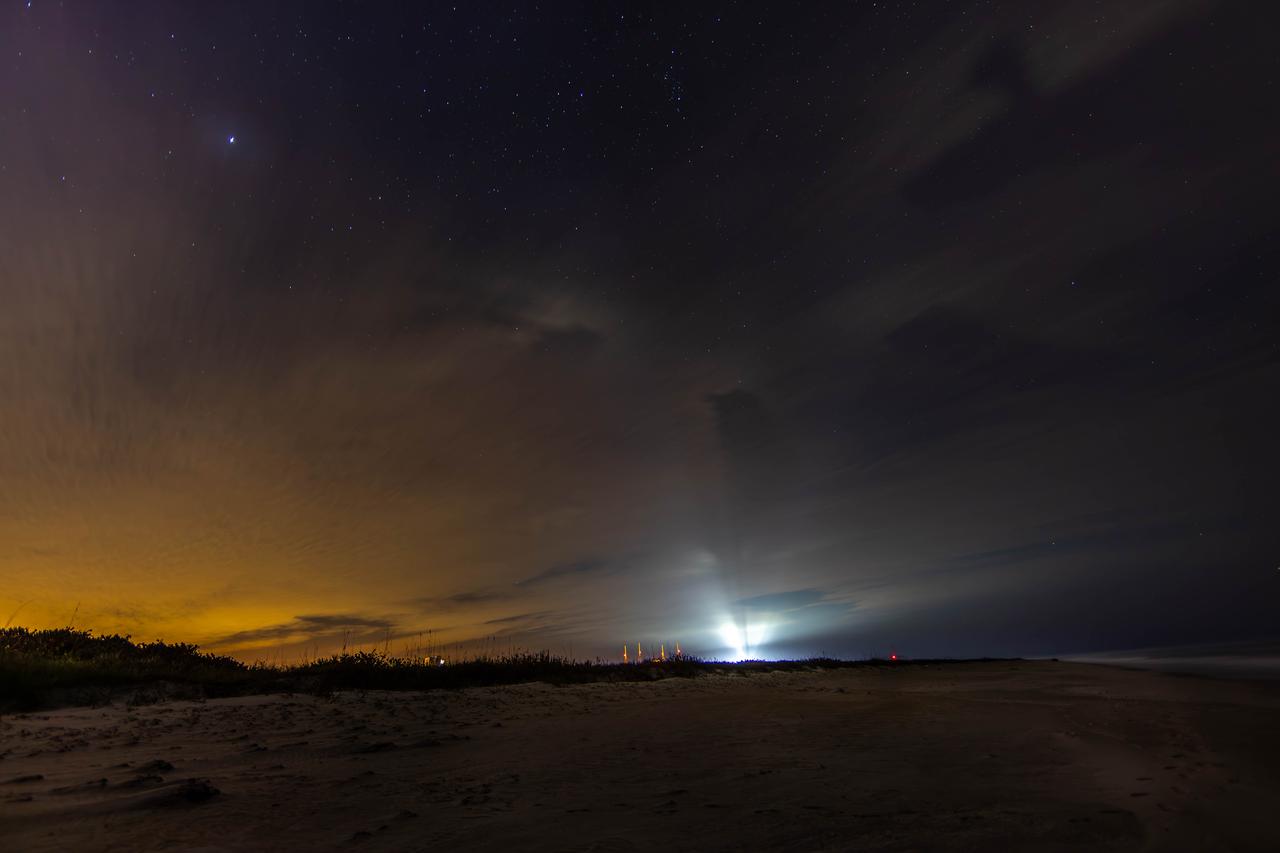
Lights from Launch Complexes 39A and B, left, glow against the night sky in this view from the Atlantic shoreline at NASA’s Kennedy Space Center in Florida on Oct. 31, 2019.
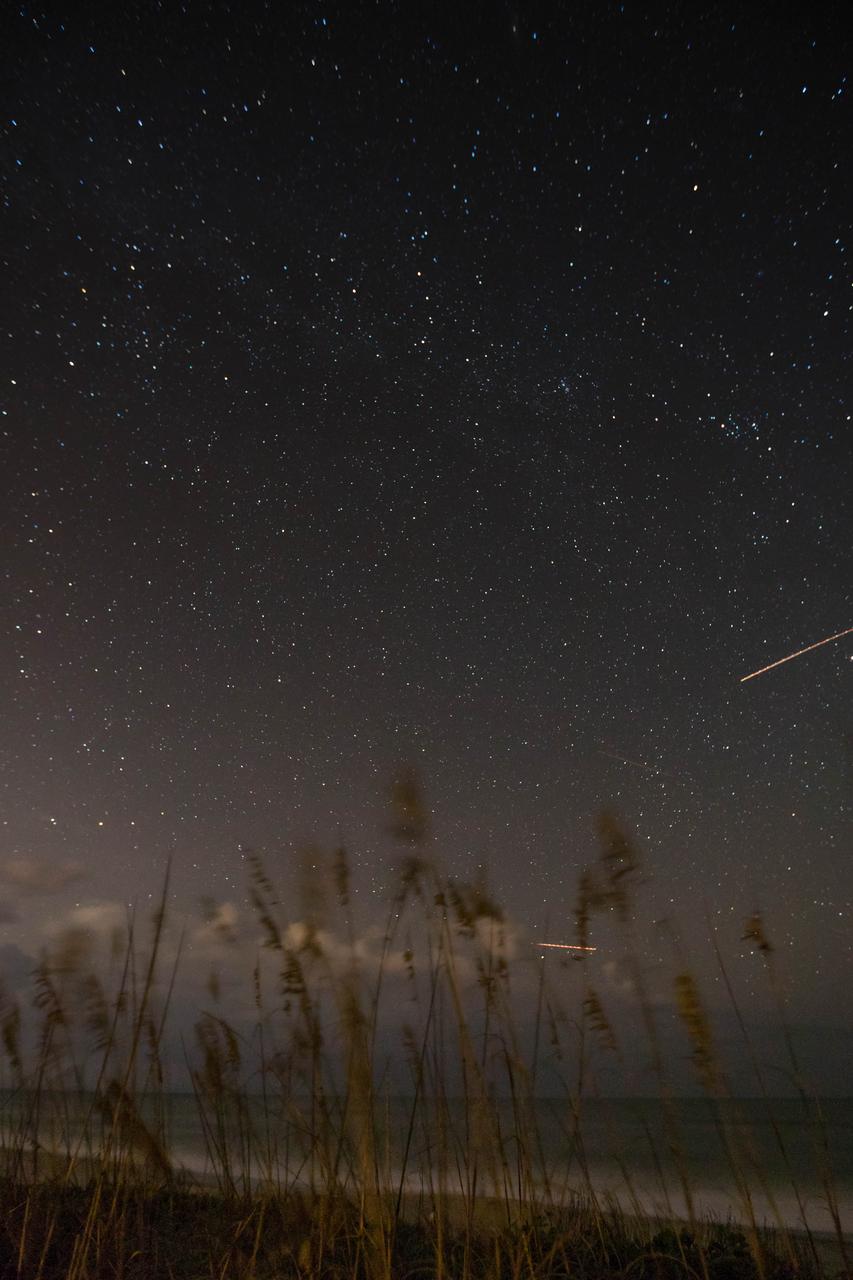
Sea oats are backdropped by the night sky and the Milky Way in this view from the Atlantic shoreline at NASA’s Kennedy Space Center in Florida on Oct. 31, 2019. Lights from aircraft create illuminated streaks above the horizon and at right.

Lights from Launch Complexes 39A and B, left, glow against the night sky in this view from the Atlantic shoreline at NASA’s Kennedy Space Center in Florida on Oct. 31, 2019.
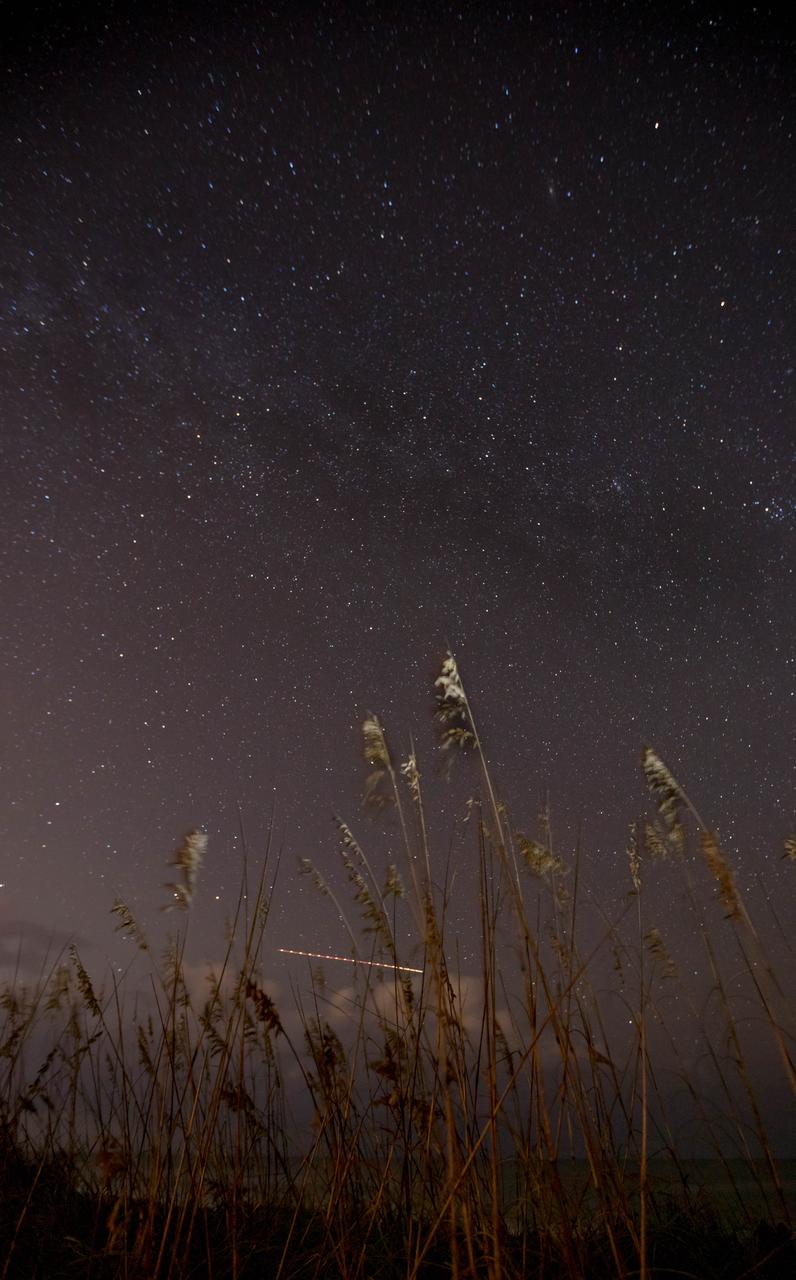
Sea oats are backdropped by the night sky and the Milky Way in this view from the Atlantic shoreline at NASA’s Kennedy Space Center in Florida on Oct. 31, 2019. The lights of an aircraft create an illuminated streak above the horizon.
What Makes Up a Martian Sky?
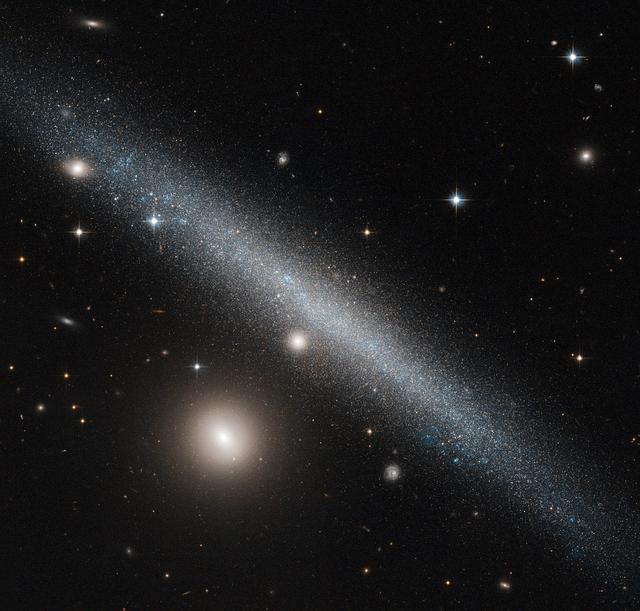
This stunning new image from the NASA/ESA Hubble Space Telescope shows part of the sky in the constellation of Canes Venatici (The Hunting Dogs). Although this region of the sky is not home to any stellar heavyweights, being mostly filled with stars of average brightness, it does contain five Messier objects and numerous intriguing galaxies — including NGC 5195, a small barred spiral galaxy considered to be one of the most beautiful galaxies visible, and its nearby interacting partner the Whirlpool Galaxy (heic0506a). The quirky Sunflower Galaxy is another notable galaxy in this constellation, and is one of the largest and brightest edge-on galaxies in our skies. Joining this host of characters is spiral galaxy NGC 4244, nicknamed the Silver Needle Galaxy, shown in this new image from Hubble. This galaxy spans some 65,000 light-years and lies around 13.5 million light-years away. It appears as a wafer-thin streak across the sky, with loosely wound spiral arms hidden from view as we observe the galaxy from the side. It is part of a group of galaxies known as the M94 Group. Numerous bright clumps of gas can be seen scattered across its length, along with dark dust lanes surrounding the galaxy’s core. NGC 4244 also has a bright star cluster at its center. Although we can make out the galaxy’s bright central region and star-spattered arms, we cannot see any more intricate structure due to the galaxy’s position; from Earth, we see it stretched out as a flattened streak across the sky. A number of different observations were pieced together to form this mosaic, and gaps in Hubble’s coverage have been filled in using ground-based data. The Hubble observations were taken as part of the Galaxy Halos, Outer disks, Substructure, Thick disks and Star clusters (GHOSTS) survey, which is scanning nearby galaxies to explore how they and their stars formed to get a more complete view of the history of the Universe. European Space Agency Credit: NASA & ESA, Acknowledgement: Roelof de Jong <b><a href="http://www.nasa.gov/audience/formedia/features/MP_Photo_Guidelines.html" rel="nofollow">NASA image use policy.</a></b> <b><a href="http://www.nasa.gov/centers/goddard/home/index.html" rel="nofollow">NASA Goddard Space Flight Center</a></b> enables NASA’s mission through four scientific endeavors: Earth Science, Heliophysics, Solar System Exploration, and Astrophysics. Goddard plays a leading role in NASA’s accomplishments by contributing compelling scientific knowledge to advance the Agency’s mission. <b>Follow us on <a href="http://twitter.com/NASAGoddardPix" rel="nofollow">Twitter</a></b> <b>Like us on <a href="http://www.facebook.com/pages/Greenbelt-MD/NASA-Goddard/395013845897?ref=tsd" rel="nofollow">Facebook</a></b> <b>Find us on <a href="http://instagram.com/nasagoddard?vm=grid" rel="nofollow">Instagram</a></b>
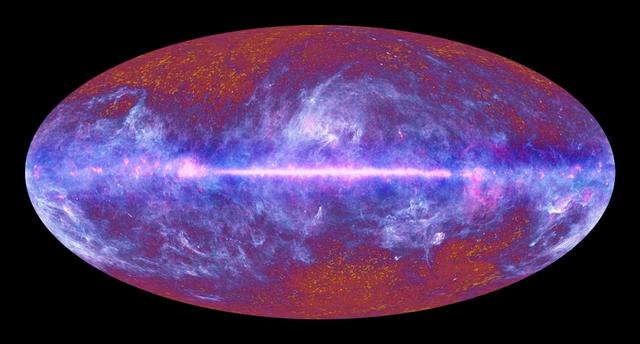
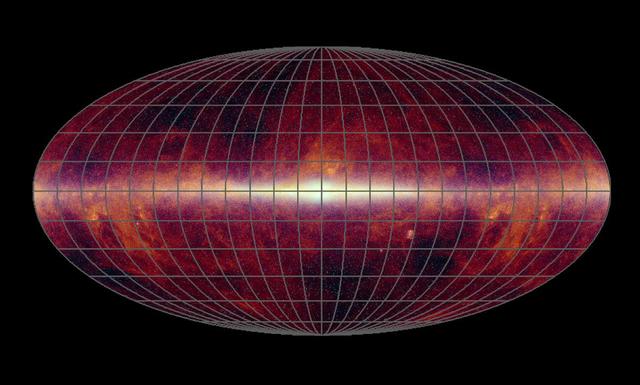
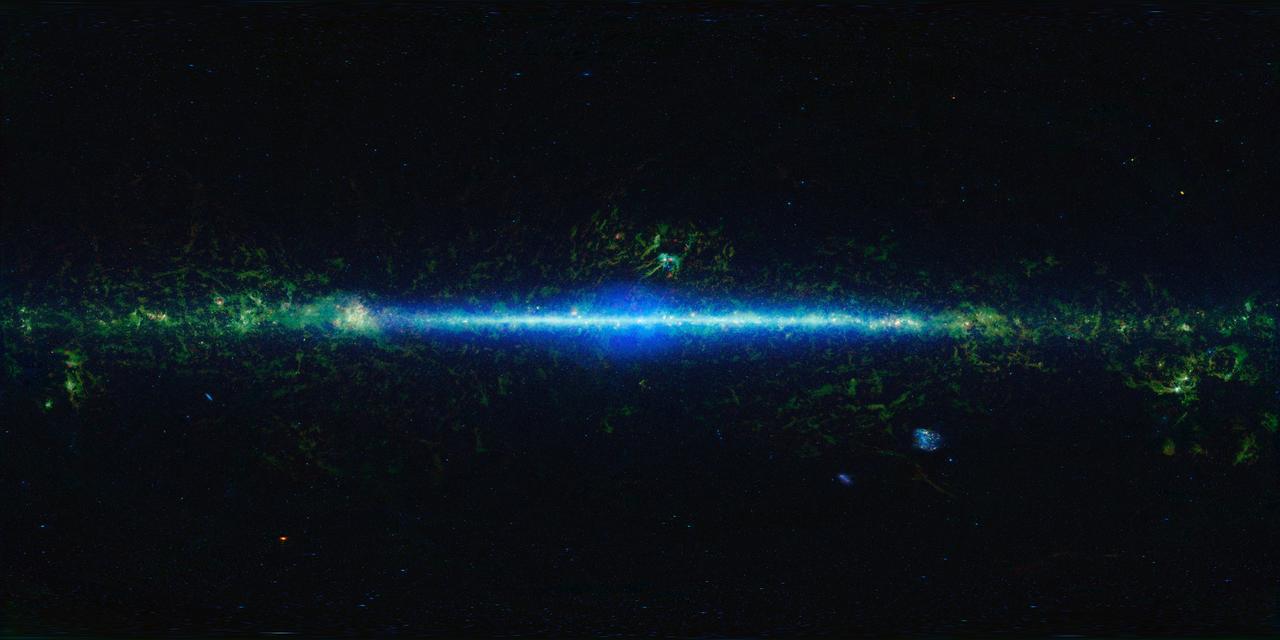
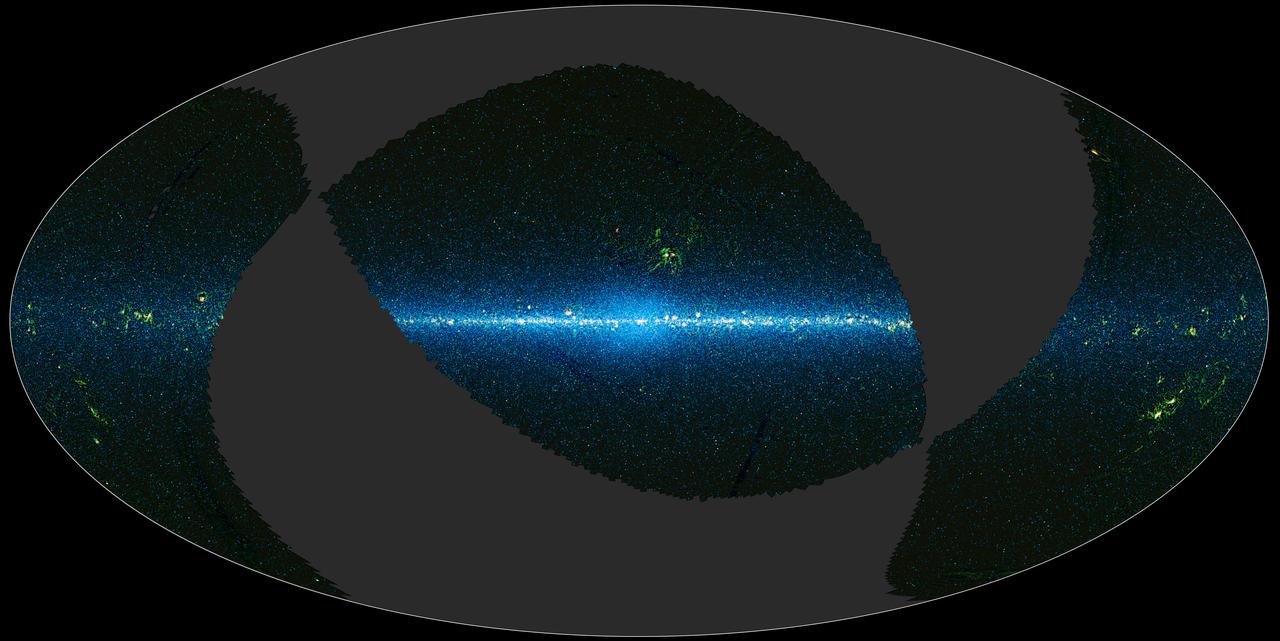
This image of the microwave sky was synthesized using data spanning the range of light frequencies detected by ESA Planck. A vast portion of the sky is dominated by the diffuse emission from gas and dust in our Milky Way galaxy.
This image is an all-sky infrared map consisting of data taken by previous missions: the Infrared Astronomical Satellite; NASA Cosmic Background Explorer; and the Two-Micron All-Sky Survey.
This infrared view of the whole sky highlights the flat plane of our Milky Way galaxy line across middle of image. NASA WISE, will take a similar infrared census of the whole sky, only with much improved resolution and sensitivity.
This mosaic of images covering the entire sky was observed by NASA WISE telescope and is part of its All-Sky Data Release. The projection used in this image of the sky is called an equirectangular.
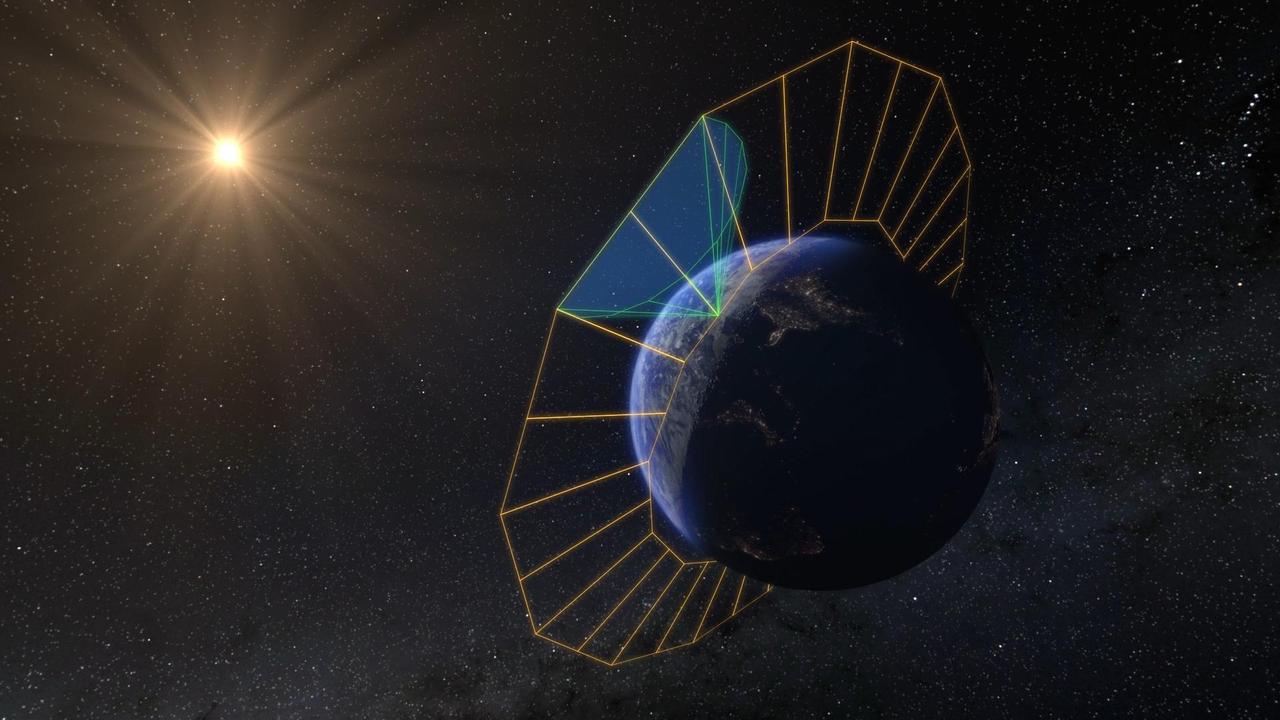
NASA's SPHEREx mission will create the first all-sky spectroscopic survey in the near-infrared, detecting hundreds of millions of stars and galaxies. To do this, the SPHEREx space telescope will look outward from low-Earth orbit, circling the planet along its day-night (or terminator) line. This artist's concept depicts the spacecraft's orbital plane in orange, and its field of view in green. Each of the telescope's orbits allows it to image a 360-degree strip of the celestial sky. As Earth's orbit around the Sun progresses, that strip slowly advances, enabling SPHEREx to complete four all-sky maps in two years. Short for Spectro-Photometer for the History of the Universe, Epoch of Reionization and Ices Explorer, SPHEREx will create a map of the cosmos like no other. Using a technique called spectroscopy to image the entire sky in 102 wavelengths of infrared light, SPHEREx will gather information about the composition of and distance to millions of galaxies and stars. With this map, scientists will study what happened in the first fraction of a second after the big bang, how galaxies formed and evolved, and the origins of water in planetary systems in our galaxy. https://photojournal.jpl.nasa.gov/catalog/PIA26532
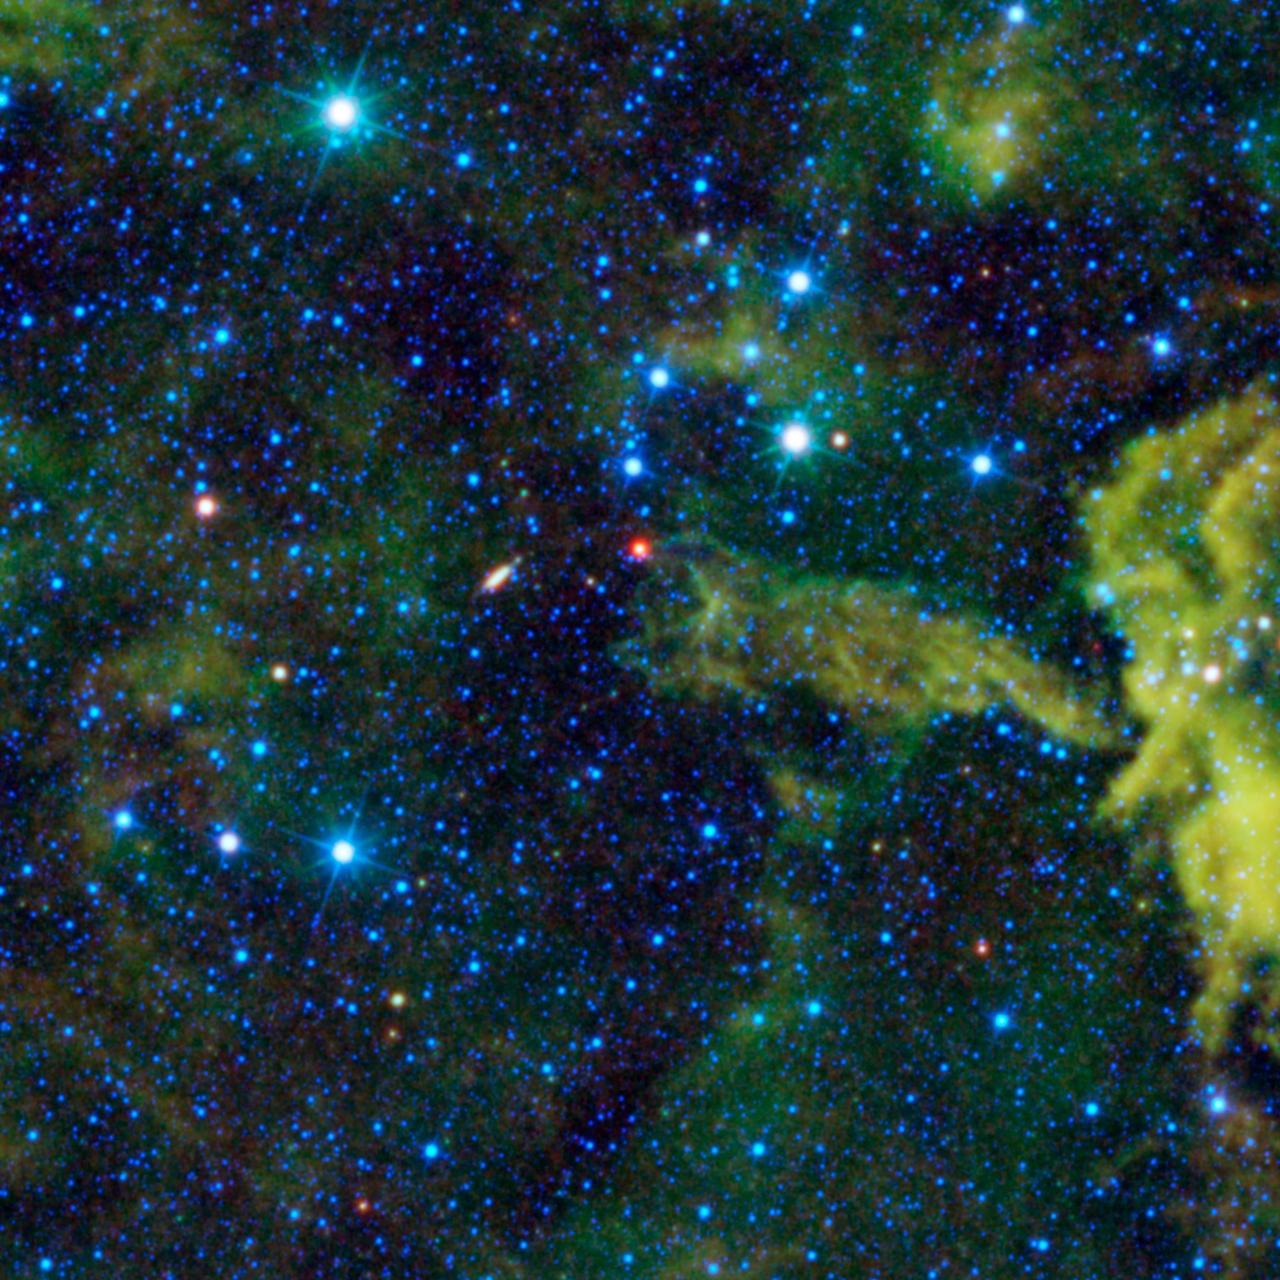
In April 2025, just weeks after its launch, NASA's SPHEREx mission revealed a cloud of dust in a patch of sky inside the Large Magellanic Cloud, a dwarf galaxy near the Milky Way, when making observations in a specific infrared wavelength (3.29 microns). The difference between the images illustrates the power of multiwavelength observations for revealing hidden features of the universe – a key feature of SPHEREx. Observing individual wavelengths of light from cosmic sources is called spectroscopy. This technique can be used to reveal the composition of objects, because chemical elements and molecules leave a unique signature in the colors they absorb and emit. Spectroscopy can also help scientists measure how far away galaxies are, making it essential for SPHEREx's goal of mapping the locations of hundreds of millions of galaxies in 3D. SPHEREx detects infrared light, which is invisible to the human eye, but is represented here in visible colors. The observatory will map the entire sky in 102 infrared colors (or wavelengths of light) to learn more about our universe. To do this, the mission images every object in the sky 102 times, each in a different wavelength. The spacecraft will map the entire sky four times over two years. https://photojournal.jpl.nasa.gov/catalog/PIA26352
This is a mosaic of the images covering the entire sky as observed by NASA Wide-field Infrared Survey Explorer WISE, part of its All-Sky Data Release. In this mosaic, the Milky Way Galaxy runs horizontally across the map.
Photographers at NASA capture the night sky Tuesday, Jan. 30, 2024, on a beach near the agency’s Kennedy Space Center in Florida.
Photographers at NASA capture the night sky Tuesday, Jan. 30, 2024, on a beach near the agency’s Kennedy Space Center in Florida.
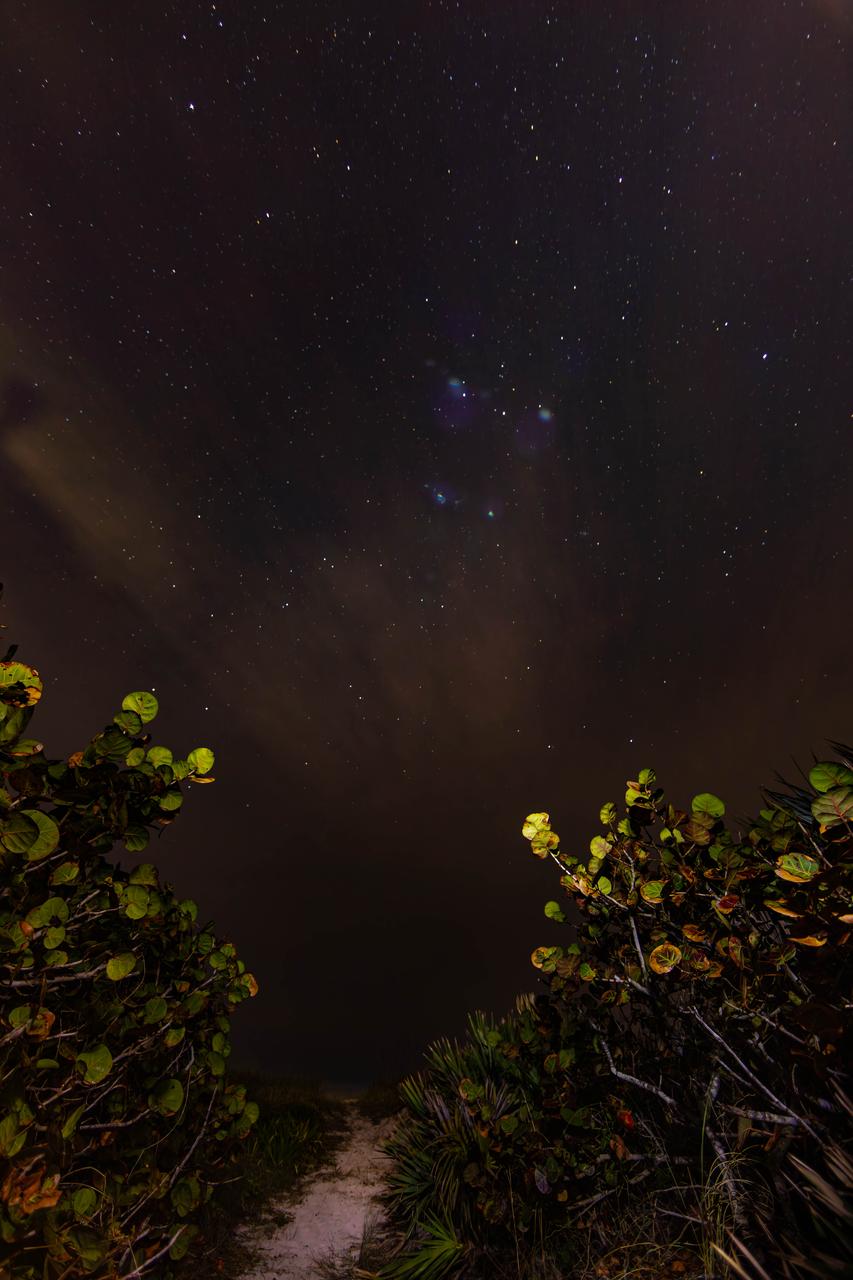
Photographers at NASA capture the night sky Tuesday, Jan. 30, 2024, on a beach near the agency’s Kennedy Space Center in Florida.
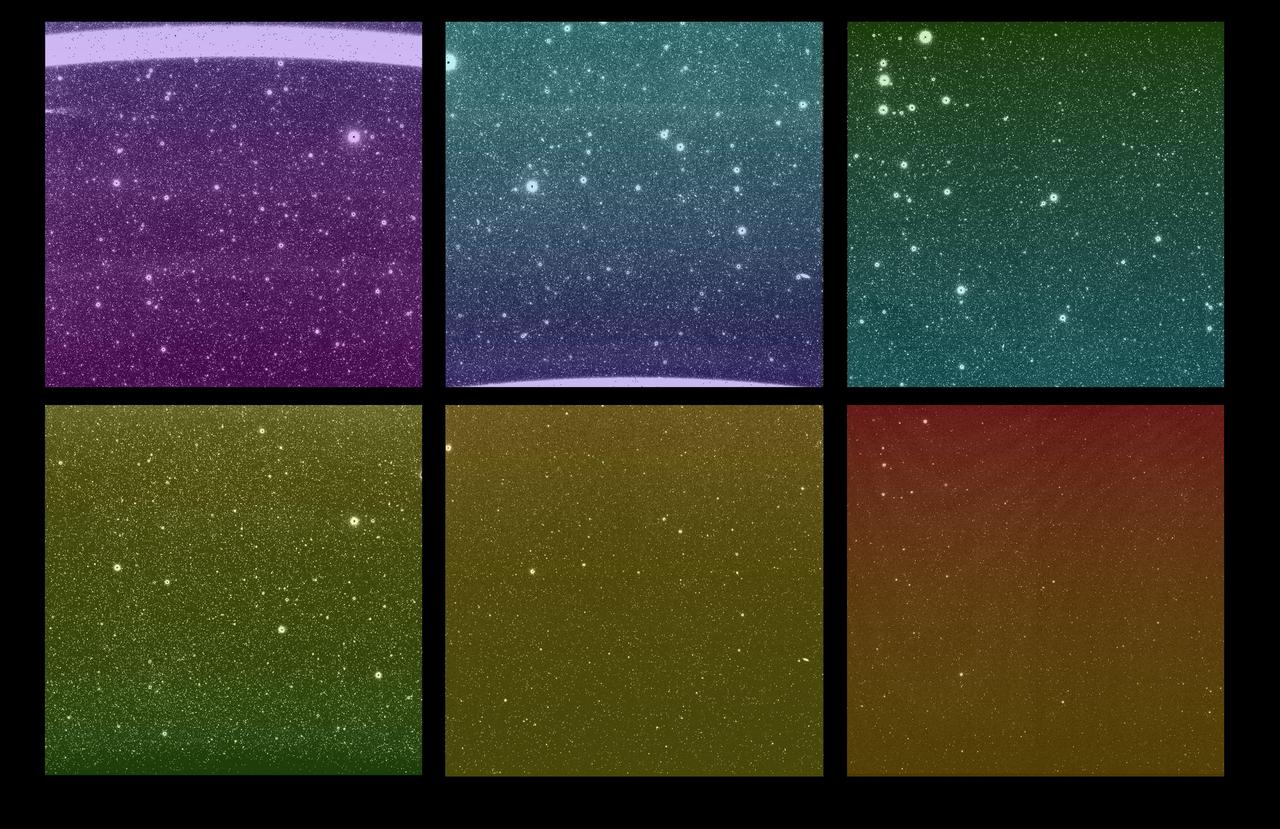
Some of the first images from NASA's SPHEREx (Spectro-Photometer for the History of the Universe, Epoch of Reionization and Ices Explorer) mission were captured March 27, 2025. Although the new images are uncalibrated and not yet ready to use for science, they give a tantalizing look at SPHEREx's wide view of the sky. Each bright spot is a source of light, like a star or galaxy, and each image is expected to contain more than 100,000 detected sources. There are six images in every SPHEREx exposure – one for each detector. The top three images show the same area of sky as the bottom three images; this is the observatory's full field of view, a rectangular area about 20 times wider than the full Moon. When the SPHEREx observatory begins routine science operations in April, it will take approximately 600 exposures every day. SPHEREx detects infrared light, which is invisible to the human eye. To make the images shown here, science team members assigned a visible color to each infrared wavelength captured by the observatory. With each detector capturing 17 unique infrared wavelength bands, there are 102 hues in this image. To detect so many infrared colors, SPHEREx uses color filters set on top of the detectors. (If the detectors are like SPHEREx's eyes, the filters are like color-tinted glasses). A standard color filter blocks all wavelengths but one, but the SPHEREx filters are more like rainbow-tinted glasses, in that the wavelengths they block change gradually from the top of the filter to the bottom. The legend at the top shows that the detectors are placed to observe infrared wavelengths from shortest to longest. Certain chemical elements are visible at specific wavelengths, as is the case with helium from Earth's atmosphere, which creates a bright line in the wavelength at the top of the top-left image. Breaking down color this way can reveal the composition of an object or the distance to a galaxy. With that data, scientists can study topics ranging from the physics that governed the universe less than a second after its birth to the origins of water in our galaxy. https://photojournal.jpl.nasa.gov/catalog/PIA26280

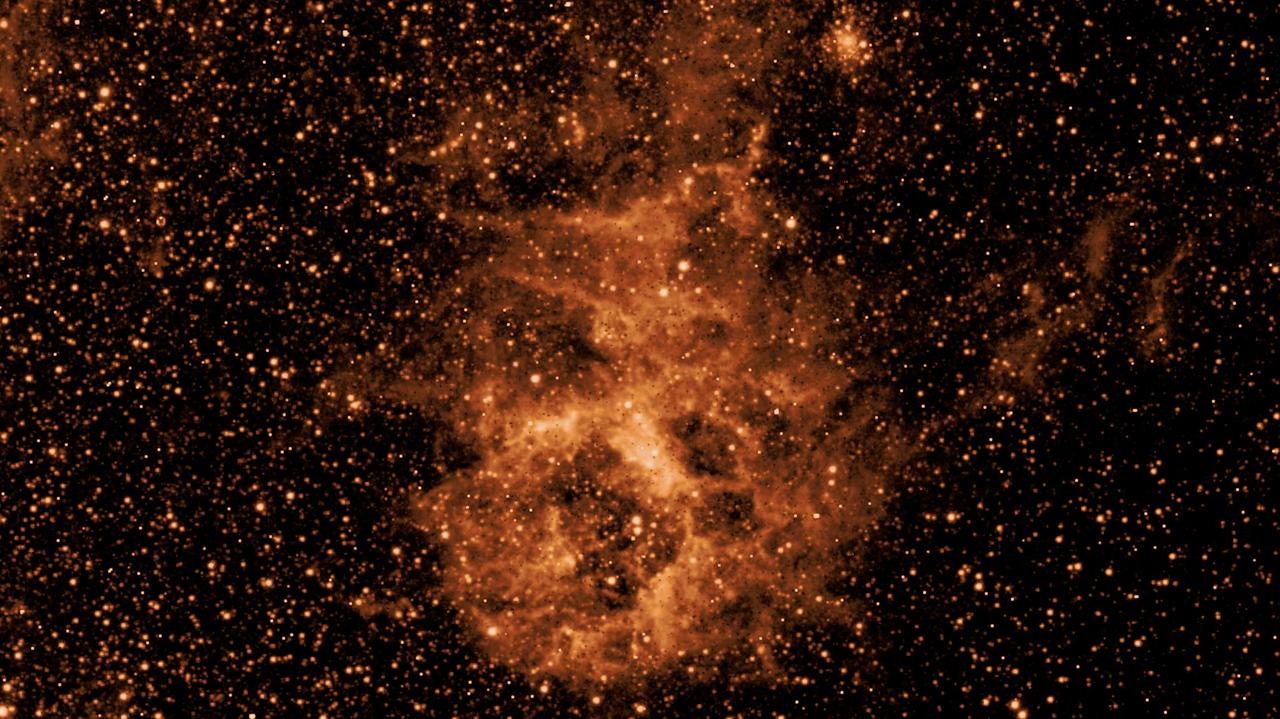
Atlas Image mosaic, covering 14.8 x 20.0 on the sky, of the Trifid Nebula, aka Messier 20 and NGC 6514. The Trifid is only about 1.5 degrees northwest on the sky of the larger Lagoon Nebula Messier 8 in the constellation Sagittarius

NASA's SPHEREx mission will operate in low Earth orbit, detecting hundreds of millions of stars and galaxies and creating the first all-sky spectroscopic survey in the near-infrared. This artist's concept shows the spacecraft and its distinctive conical photon shields, which protect SPHEREx's telescope from infrared light and heat from the Sun and Earth. Short for Spectro-Photometer for the History of the Universe, Epoch of Reionization and Ices Explorer, SPHEREx will create a map of the cosmos like no other. Using a technique called spectroscopy to image the entire sky in 102 wavelengths of infrared light, SPHEREx will gather information about the composition of and distance to millions of galaxies and stars. With this map, scientists will study what happened in the first fraction of a second after the big bang, how galaxies formed and evolved, and the origins of water in planetary systems in our galaxy. https://photojournal.jpl.nasa.gov/catalog/PIA26531
![On June 26, 2016, the Moderate Resolution Imaging Spectroradiometer (MODIS) on NASA’s Terra satellite acquired this natural-color image of cloud gravity waves off the coast of Angola and Namibia. “I [regularly] look at this area on Worldview because you quite often have these gravity waves,” said Bastiaan Van Diedenhoven, a researcher for Columbia University and NASA's Goddard Institute for Space Studies interested in cloud formations. “On this day, there was so much going on—so many different waves from different directions—that they really started interfering.” A distinctive criss-cross pattern formed in unbroken stretches hundreds of kilometers long. Similar to a boat’s wake, which forms as the water is pushed upward by the boat and pulled downward again by gravity, these clouds are formed by the rise and fall of colliding air columns. Off of west Africa, dry air coming off the Namib desert—after being cooled by the night—moves out under the balmy, moist air over the ocean and bumps it upwards. As the humid air rises to a higher altitude, the moisture condenses into droplets, forming clouds. Gravity rolls these newly formed clouds into a wave-like shape. When moist air goes up, it cools, and then gravity pushes it down again. As it plummets toward the earth, the moist air is pushed up again by the dry air. Repeated again and again, this process creates gravity waves. Clouds occur at the upward wave motions, while they evaporate at the downward motions. Such waves will often propagate in the morning and early afternoon, said Van Diedenhoven. During the course of the day, the clouds move out to sea and stretch out, as the dry air flowing off the land pushes the moist ocean air westward. NASA Earth Observatory image by Jesse Allen, using data from the Land Atmosphere Near real-time Capability for EOS (LANCE). via @NASAEarth <a href="http://go.nasa.gov/29Btxcy" rel="nofollow">go.nasa.gov/29Btxcy</a> <b><a href="http://go.nasa.gov/29BtHR6" rel="nofollow">NASA image use policy.</a></b> <b><a href="http://go.nasa.gov/29BtDku" rel="nofollow">NASA Goddard Space Flight Center</a></b> enables NASA’s mission through four scientific endeavors: Earth Science, Heliophysics, Solar System Exploration, and Astrophysics. Goddard plays a leading role in NASA’s accomplishments by contributing compelling scientific knowledge to advance the Agency’s mission. <b>Follow us on <a href="http://go.nasa.gov/29BtVrn" rel="nofollow">Twitter</a></b> <b>Like us on <a href="http://go.nasa.gov/29BtygK" rel="nofollow">Facebook</a></b> <b>Find us on <a href="http://go.nasa.gov/29Bu0vu" rel="nofollow">Instagram</a></b>](https://images-assets.nasa.gov/image/GSFC_20171208_Archive_e000269/GSFC_20171208_Archive_e000269~medium.jpg)
On June 26, 2016, the Moderate Resolution Imaging Spectroradiometer (MODIS) on NASA’s Terra satellite acquired this natural-color image of cloud gravity waves off the coast of Angola and Namibia. “I [regularly] look at this area on Worldview because you quite often have these gravity waves,” said Bastiaan Van Diedenhoven, a researcher for Columbia University and NASA's Goddard Institute for Space Studies interested in cloud formations. “On this day, there was so much going on—so many different waves from different directions—that they really started interfering.” A distinctive criss-cross pattern formed in unbroken stretches hundreds of kilometers long. Similar to a boat’s wake, which forms as the water is pushed upward by the boat and pulled downward again by gravity, these clouds are formed by the rise and fall of colliding air columns. Off of west Africa, dry air coming off the Namib desert—after being cooled by the night—moves out under the balmy, moist air over the ocean and bumps it upwards. As the humid air rises to a higher altitude, the moisture condenses into droplets, forming clouds. Gravity rolls these newly formed clouds into a wave-like shape. When moist air goes up, it cools, and then gravity pushes it down again. As it plummets toward the earth, the moist air is pushed up again by the dry air. Repeated again and again, this process creates gravity waves. Clouds occur at the upward wave motions, while they evaporate at the downward motions. Such waves will often propagate in the morning and early afternoon, said Van Diedenhoven. During the course of the day, the clouds move out to sea and stretch out, as the dry air flowing off the land pushes the moist ocean air westward. NASA Earth Observatory image by Jesse Allen, using data from the Land Atmosphere Near real-time Capability for EOS (LANCE). via @NASAEarth <a href="http://go.nasa.gov/29Btxcy" rel="nofollow">go.nasa.gov/29Btxcy</a> <b><a href="http://go.nasa.gov/29BtHR6" rel="nofollow">NASA image use policy.</a></b> <b><a href="http://go.nasa.gov/29BtDku" rel="nofollow">NASA Goddard Space Flight Center</a></b> enables NASA’s mission through four scientific endeavors: Earth Science, Heliophysics, Solar System Exploration, and Astrophysics. Goddard plays a leading role in NASA’s accomplishments by contributing compelling scientific knowledge to advance the Agency’s mission. <b>Follow us on <a href="http://go.nasa.gov/29BtVrn" rel="nofollow">Twitter</a></b> <b>Like us on <a href="http://go.nasa.gov/29BtygK" rel="nofollow">Facebook</a></b> <b>Find us on <a href="http://go.nasa.gov/29Bu0vu" rel="nofollow">Instagram</a></b>
This optical composite image shows asteroid 2017 YE5, taken on June 30, 2018, by the Cadi Ayyad University Morocco Oukaimeden Sky Survey, one of the first surveys to identify 2017 YE5 in December 2017. https://photojournal.jpl.nasa.gov/catalog/PIA22558
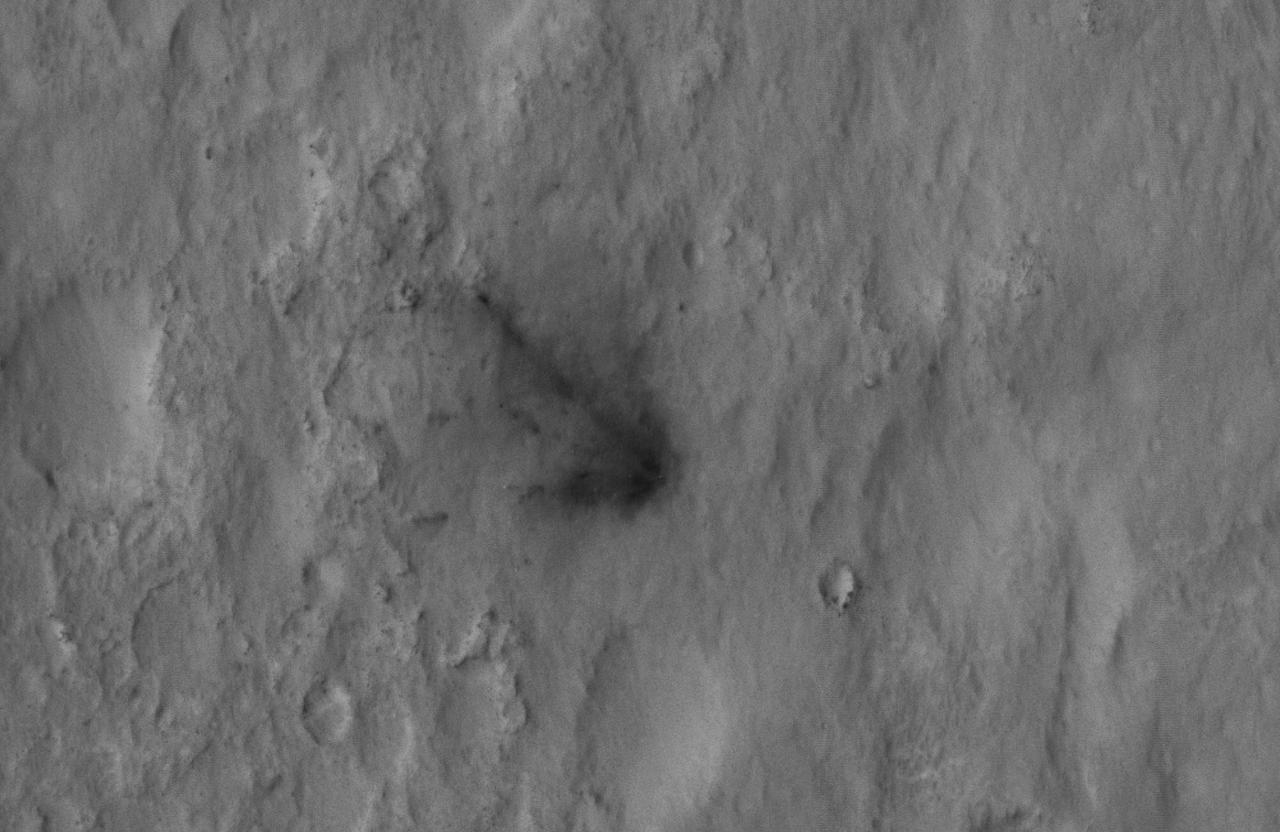
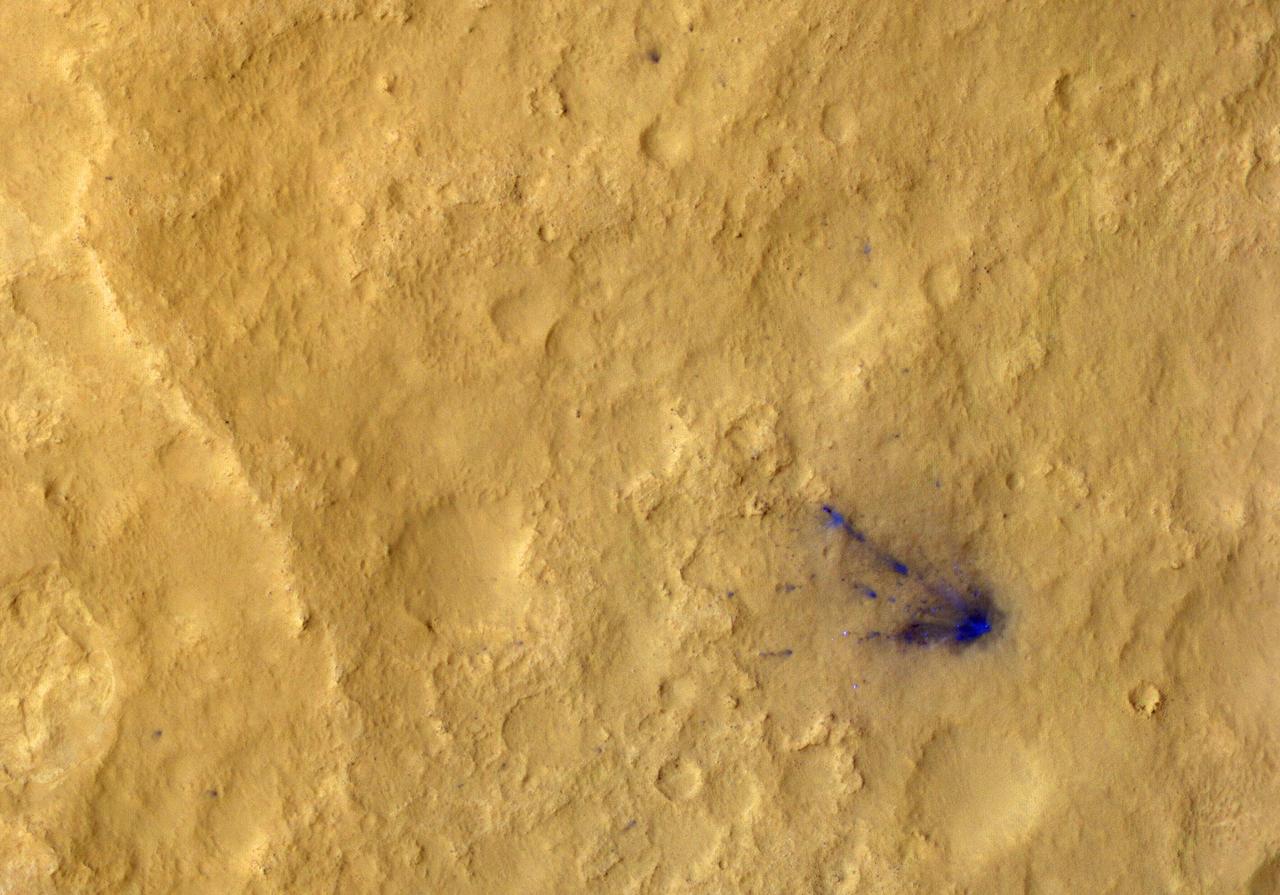
This close-up view captured by NASA Mars Reconnaissance Orbiter shows darkened radial jets caused by the impact of Curiosity sky crane, which helped deliver the rover to the surface of Mars.

NASA Wide-field Infrared Survey Explorer is a little like the Vincent van Gogh of the infrared sky, providing the world with picturesque images of the cosmos by representing infrared light through color. This image is the nebula NGC 2174.
The entire sky as mapped by NASA WISE at infrared wavelengths is shown here, with an artist concept of the WISE satellite superimposed.

NASA's Curiosity Mars rover examined both the "Greenhorn" and "Big Sky" targets with the rover's Alpha Particle X-ray Spectrometer (APXS) instrument. Greenhorn is located within an altered fracture zone and has an elevated concentration of silica (about 60 percent by weight). Big Sky is the unaltered counterpart for comparison. The bar plot on the left shows scaled concentrations as analyzed by Curiosity's APXS. The bar plot on the right shows what the Big Sky composition would look like if silica (SiO2) and calcium-sulfate (both abumdant in Greenhorn) were added. The similarity in the resulting composition suggests that much of the chemistry of Greenhorn could be explained by the addition of silica. Ongoing research aims to distinguish between that possible explanation for silicon enrichment and an alternative of silicon being left behind when some other elements were removed by acid weathering. http://photojournal.jpl.nasa.gov/catalog/PIA20275
This all-sky image shows the distribution of carbon monoxide CO, a molecule used by astronomers to trace molecular clouds across the sky, as seen by Planck.
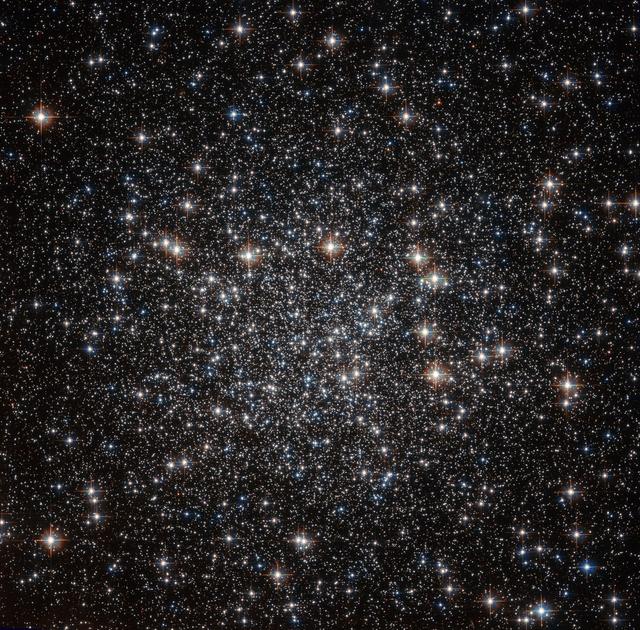
So Coldplay isn't the only one to see a sky full of stars, these are 22K light-years away Located approximately 22,000 light-years away in the constellation of Musca (The Fly), this tightly packed collection of stars — known as a globular cluster — goes by the name of NGC 4833. This NASA/ESA Hubble Space Telescope image shows the dazzling stellar group in all its glory. NGC 4833 is one of the over 150 globular clusters known to reside within the Milky Way. These objects are thought to contain some of the oldest stars in our galaxy. Studying these ancient cosmic clusters can help astronomers to unravel how a galaxy formed and evolved, and give an idea of the galaxy’s age. Globular clusters are responsible for some of the most striking sights in the cosmos, with hundreds of thousands of stars congregating in the same region of space. Hubble has observed many of these clusters during its time in orbit around our planet, each as breathtaking as the last. bit.ly/2b85p36 Image credit: ESA/Hubble and NASA <b><a href="http://www.nasa.gov/audience/formedia/features/MP_Photo_Guidelines.html" rel="nofollow">NASA image use policy.</a></b> <b><a href="http://www.nasa.gov/centers/goddard/home/index.html" rel="nofollow">NASA Goddard Space Flight Center</a></b> enables NASA’s mission through four scientific endeavors: Earth Science, Heliophysics, Solar System Exploration, and Astrophysics. Goddard plays a leading role in NASA’s accomplishments by contributing compelling scientific knowledge to advance the Agency’s mission. <b>Follow us on <a href="http://twitter.com/NASAGoddardPix" rel="nofollow">Twitter</a></b> <b>Like us on <a href="http://www.facebook.com/pages/Greenbelt-MD/NASA-Goddard/395013845897?ref=tsd" rel="nofollow">Facebook</a></b> <b>Find us on <a href="http://instagrid.me/nasagoddard/?vm=grid" rel="nofollow">Instagram</a></b>

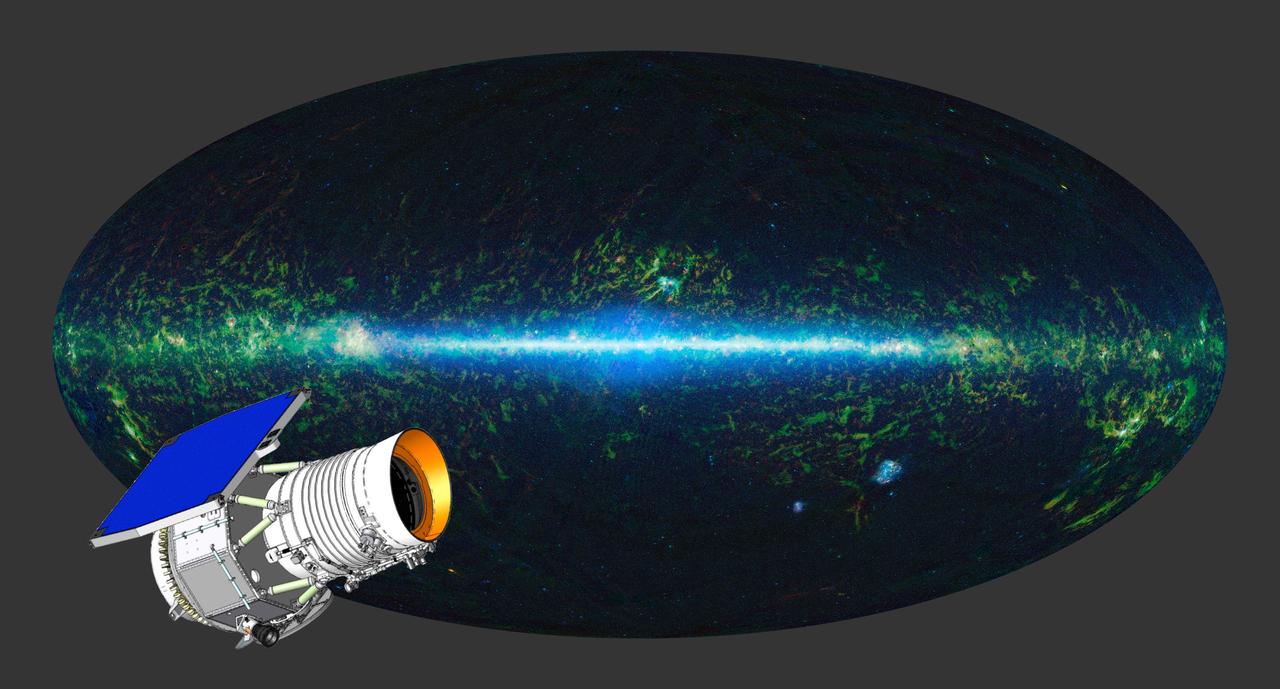
In this illustration, NASA's SPHEREx mission is highlighted among a line of other NASA space telescopes. The mission will survey the entire sky using spectroscopy, detecting hundreds of millions of stars and galaxies and generating a valuable data set that will complement the work of other NASA observatories such as those depicted here. Shown from left to right (and not to scale) are: Hubble Space Telescope, launched in April 1990 Spitzer Space Telescope, launch in August 2003 WISE (Wide-Field Infrared Survey Explorer), launched in December 2009 James Webb Space Telescope, launched in December 2021 SPHEREx (Spectro-Photometer for the History of the Universe, Epoch of Reionization and Ices Explorer), targeted for launch in February 2025 Nancy Grace Roman Space Telescope, targeted for launch by May 2027 The SPHEREx observatory will image the entire sky in 102 colors (each an individual wavelength of light) to help scientists answer big-picture questions about the origins of our universe, galaxies, and key ingredients for life in our galaxy, such as water. https://photojournal.jpl.nasa.gov/catalog/PIA26535

Wonders in the Antarctic Sea and Sky NASA aircraft and scientists have returned to the United States after a short ice-surveying mission to #Antarctica. Despite having only a week of flying time, the team returned with crucial scientific data and a trove of spectacular aerial photographs. The flights over Antarctica were part of Operation #IceBridge, a multi-year mission to monitor conditions in Antarctica and the Arctic until a new ice-monitoring satellite, ICESat-2, launches in 2016. ICESat-1 was decommissioned in 2009, and IceBridge aircraft have been flying ever since. Laser altimeter and radar data are the primary products of the mission, but IceBridge project scientist Michael Studinger almost always has his digital camera ready as well. On November 24, 2013, he took this photograph of a multi-layered lenticular cloud hovering near Mount Discovery, a volcano about 70 kilometers (44 miles) southwest of McMurdo. Lenticular #clouds are a type of wave cloud. They usually form when a layer of air near the surface encounters a topographic barrier, gets pushed upward, and flows over it as a series of atmospheric gravity waves. Lenticular clouds form at the crest of the waves, where the air is coolest and water vapor is most likely to condense into cloud droplets. The bulging sea ice in the foreground is a pressure ridge, which formed when separate ice floes collided and piled up on each other. Read more: <a href="http://1.usa.gov/18lXIQS" rel="nofollow">1.usa.gov/18lXIQS</a> Photograph courtesy of Michael Studinger. Caption by Adam Voiland of NASA's Earth Observatory. <b><a href="http://www.nasa.gov/audience/formedia/features/MP_Photo_Guidelines.html" rel="nofollow">NASA image use policy.</a></b> <b><a href="http://www.nasa.gov/centers/goddard/home/index.html" rel="nofollow">NASA Goddard Space Flight Center</a></b> enables NASA’s mission through four scientific endeavors: Earth Science, Heliophysics, Solar System Exploration, and Astrophysics. Goddard plays a leading role in NASA’s accomplishments by contributing compelling scientific knowledge to advance the Agency’s mission. <b>Follow us on <a href="http://twitter.com/NASA_GoddardPix" rel="nofollow">Twitter</a></b> <b>Like us on <a href="http://www.facebook.com/pages/Greenbelt-MD/NASA-Goddard/395013845897?ref=tsd" rel="nofollow">Facebook</a></b> <b>Find us on <a href="http://instagram.com/nasagoddard?vm=grid" rel="nofollow">Instagram</a></b>

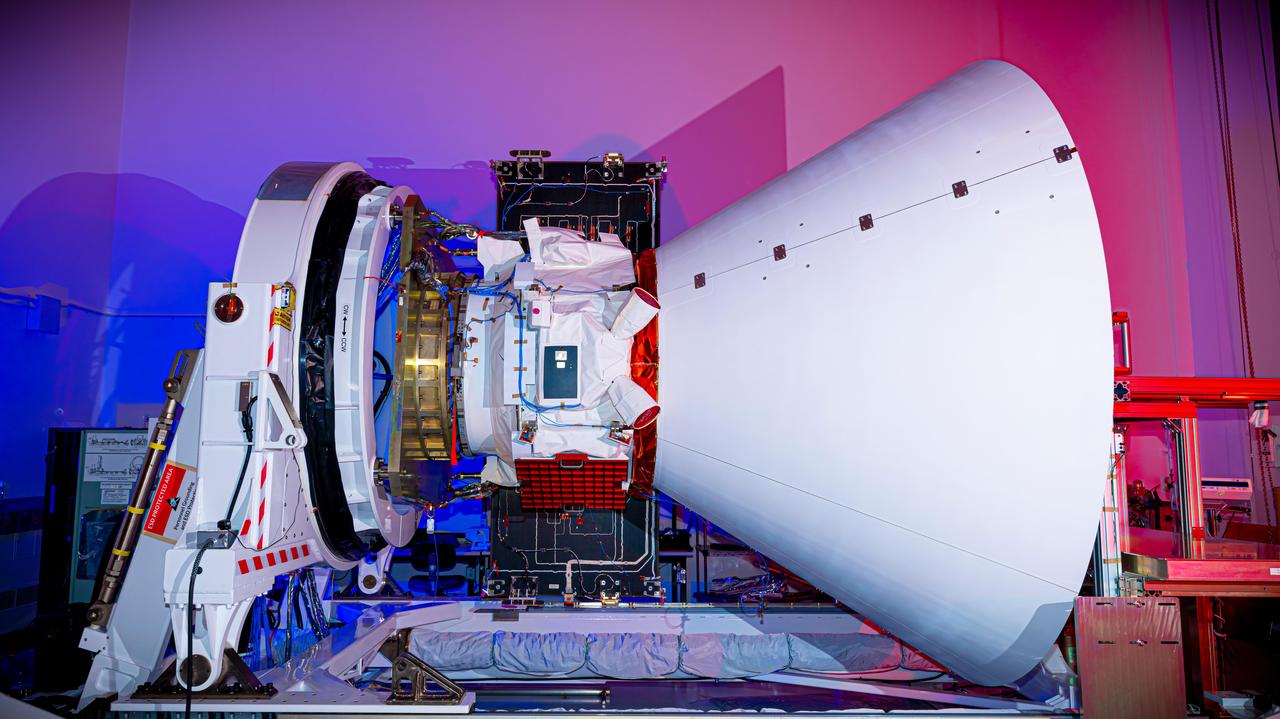
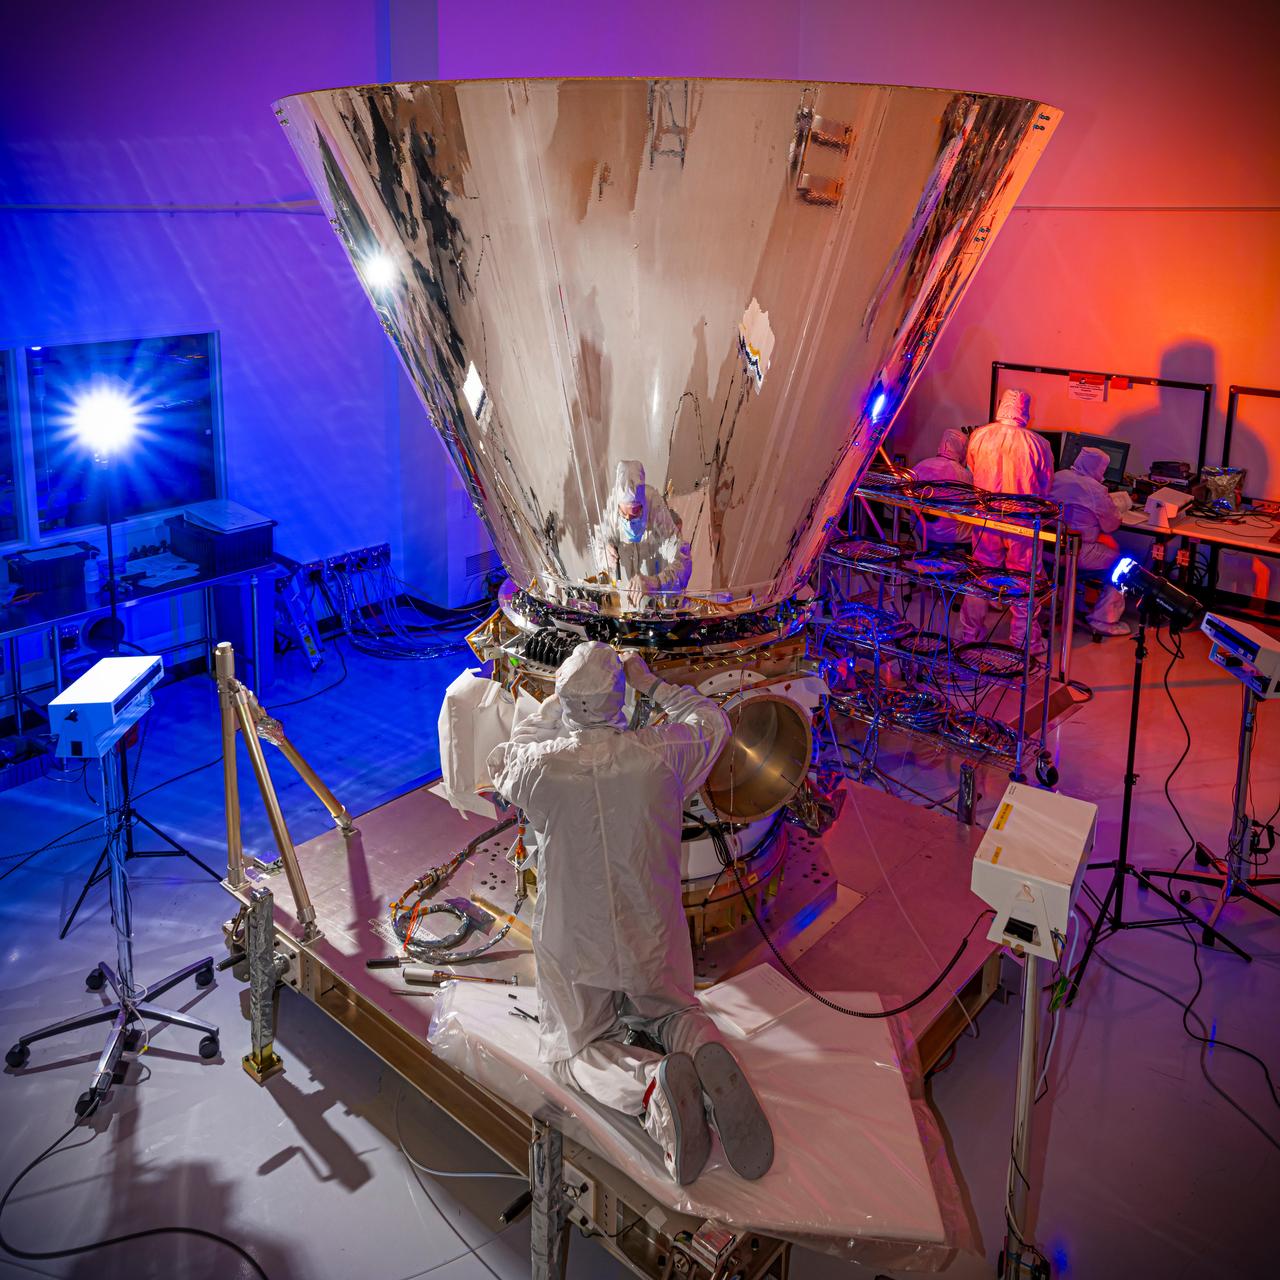
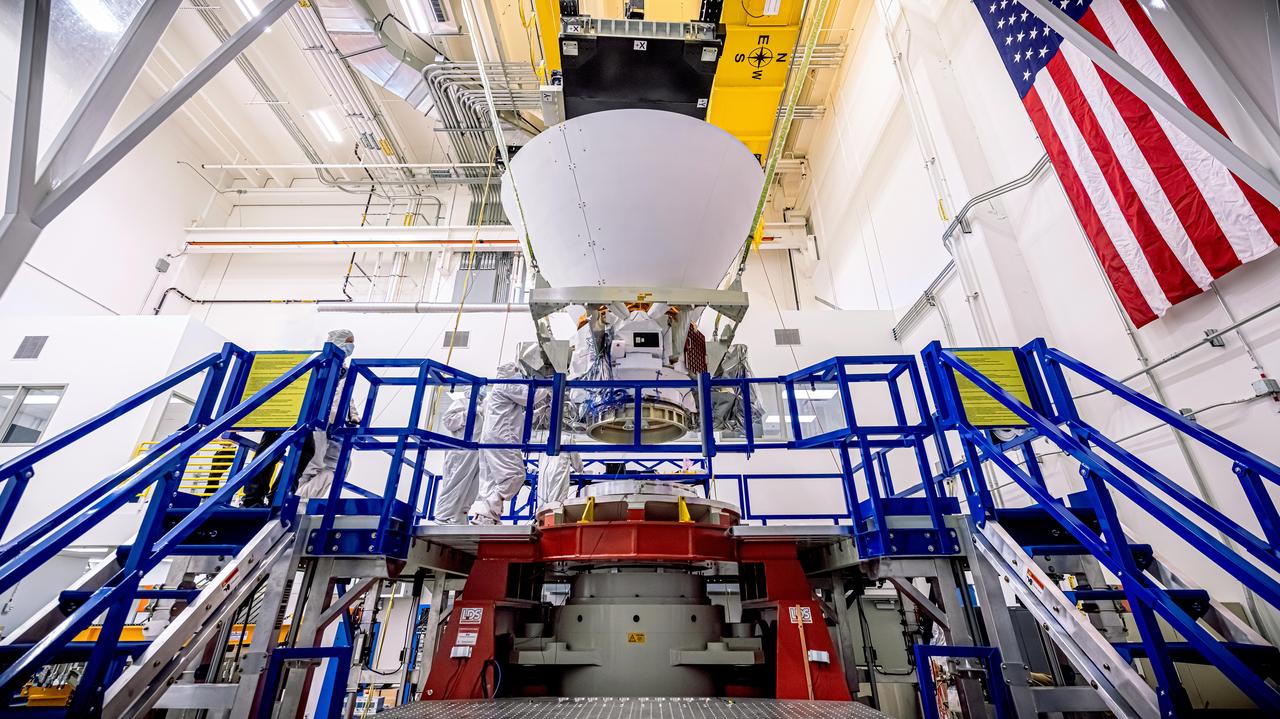
NASA's SPHEREx observatory is oriented in a horizontal position, revealing all three layers of photon shields as well as the telescope. This photo was taken at BAE Systems in Boulder, Colorado, in April 2024. Short for Spectro-Photometer for the History of the Universe, Epoch of Reionization and Ices Explorer, SPHEREx will create a map of the cosmos like no other. Using a technique called spectroscopy to image the entire sky in 102 wavelengths of infrared light, SPHEREx will gather information about the composition of and distance to millions of galaxies and stars. With this map, scientists will study what happened in the first fraction of a second after the big bang, how galaxies formed and evolved, and the origins of water in planetary systems in our galaxy. https://photojournal.jpl.nasa.gov/catalog/PIA26542
The SPHEREx observatory sits in a clean room after environmental testing at BAE Systems in Boulder, Colorado, in late 2024. Short for Spectro-Photometer for the History of the Universe, Epoch of Reionization and Ices Explorer, SPHEREx will create a map of the cosmos like no other. Using a technique called spectroscopy to image the entire sky in 102 wavelengths of infrared light, SPHEREx will gather information about the composition of and distance to millions of galaxies and stars. With this map, scientists will study what happened in the first fraction of a second after the big bang, how galaxies formed and evolved, and the origins of water in planetary systems in our galaxy. https://photojournal.jpl.nasa.gov/catalog/PIA26537
NASA's SPHEREx observatory undergoes integration and testing at BAE Systems in Boulder, Colorado, in April 2024. Short for Spectro-Photometer for the History of the Universe, Epoch of Reionization and Ices Explorer, SPHEREx will create a map of the cosmos like no other. Using a technique called spectroscopy to image the entire sky in 102 wavelengths of infrared light, SPHEREx will gather information about the composition of and distance to millions of galaxies and stars. With this map, scientists will study what happened in the first fraction of a second after the big bang, how galaxies formed and evolved, and the origins of water in planetary systems in our galaxy. https://photojournal.jpl.nasa.gov/catalog/PIA26538
Final assembly of NASA's SPHEREx spacecraft is shown at BAE Systems in Boulder, Colorado, in March 2024. Short for Spectro-Photometer for the History of the Universe, Epoch of Reionization and Ices Explorer, SPHEREx will create a map of the cosmos like no other. Using a technique called spectroscopy to image the entire sky in 102 wavelengths of infrared light, SPHEREx will gather information about the composition of and distance to millions of galaxies and stars. With this map, scientists will study what happened in the first fraction of a second after the big bang, how galaxies formed and evolved, and the origins of water in planetary systems in our galaxy. https://photojournal.jpl.nasa.gov/catalog/PIA26543

Members of the SPHEREx mission team pose for a photo on the campus of Caltech in Pasadena, California, in October 2023. Short for Spectro-Photometer for the History of the Universe, Epoch of Reionization and Ices Explorer, SPHEREx will create a map of the cosmos like no other. Using a technique called spectroscopy to image the entire sky in 102 wavelengths of infrared light, SPHEREx will gather information about the composition of and distance to millions of galaxies and stars. With this map, scientists will study what happened in the first fraction of a second after the big bang, how galaxies formed and evolved, and the origins of water in planetary systems in our galaxy. https://photojournal.jpl.nasa.gov/catalog/PIA26534
After a rocket-powered descent stage, also known as the sky crane, delivered NASA Curiosity rover to Mars on Aug. 5 PDT Aug. 6 EDT, 2012, it flew away and fell to the surface.
Nearly the entire sky, as seen in infrared wavelengths and projected at one-half degree resolution, is shown in this image, assembled from six months of data from the NASA Infrared Astronomical Satellite, or IRAS.

This artist conception shows NASA Wide-field Infrared Survey Explorer mapping the whole sky in infrared. The mission will unveil hundreds of thousands of asteroids, and hundreds of millions of stars and galaxies.
This photo mosaic shows the scour mark, dubbed Goulburn, left by the thrusters on the sky crane that helped lower NASA Curiosity rover to the Red Planet.

Clouds move inland from the Atlantic Ocean, backdropped by a nighttime vista of stars, in this view from the beach near Launch Complex 39 at NASA’s Kennedy Space Center in Florida on Oct. 31, 2019.
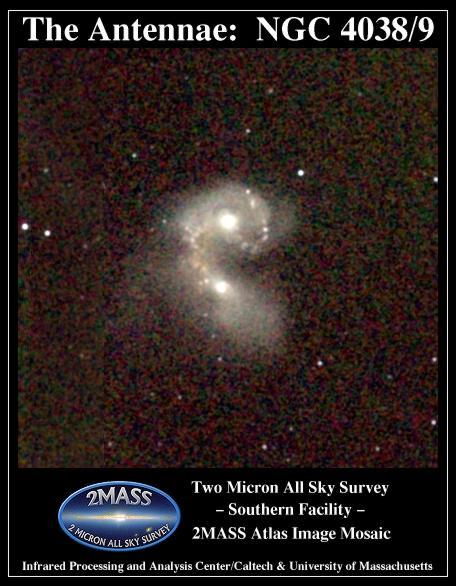
Atlas Image mosaic, covering 7 x 7 on the sky of the interacting galaxies NGC 4038 and NGC 4039, better known as the Antennae, or Ring Tail galaxies. The two galaxies are engaged in a tug-of-war as they collide.

NASA Terra spacecraft captures a clear sky image of the region of the recent Haiti earthquake.
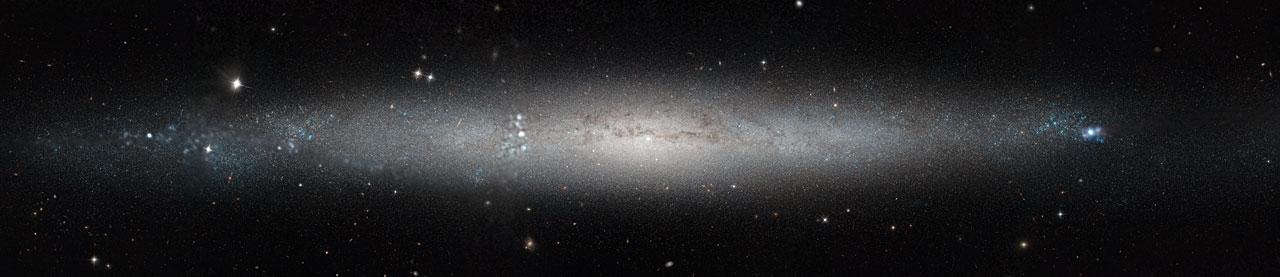
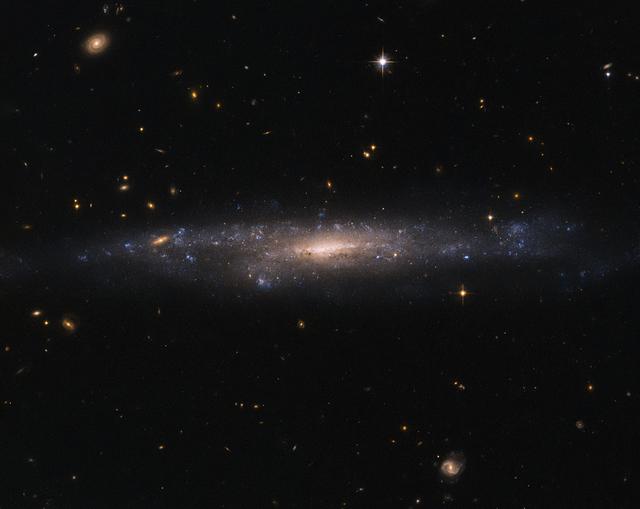
The galaxy cutting dramatically across the frame of this NASA/ESA Hubble Space Telescope image is a slightly warped dwarf galaxy known as UGC1281. Seen here from an edge-on perspective, this galaxy lies roughly 18 million light-years away in the constellation of Triangulum (The Triangle). The bright companion to the lower left of UGC 1281 is the small galaxy PGC 6700, officially known as 2MASX J01493473+3234464. Other prominent stars belonging to our own galaxy, the Milky Way, and more distant galaxies can be seen scattered throughout the sky. The side-on view we have of UGC 1281 makes it a perfect candidate for studies into how gas is distributed within galactic halos — the roughly spherical regions of diffuse gas extending outwards from a galaxy’s center. Astronomers have studied this galaxy to see how its gas vertically extends out from its central plane, and found it to be a quite typical dwarf galaxy. However, it does have a slightly warped shape to its outer edges, and is forming stars at a particularly low rate. European Space Agency Credit: ESA/NASA, Acknowledgement Luca Limatola
NASA's SPHEREx observatory is lifted and installed onto a vibration table in the Z-axis configuration at BAE Systems in Boulder, Colorado, in August 2024. In this test, the spacecraft is subjected to vibrations in all three axes separately. The test was successfully completed Aug. 16, 2024. Short for Spectro-Photometer for the History of the Universe, Epoch of Reionization and Ices Explorer, SPHEREx will create a map of the cosmos like no other. Using a technique called spectroscopy to image the entire sky in 102 wavelengths of infrared light, SPHEREx will gather information about the composition of and distance to millions of galaxies and stars. With this map, scientists will study what happened in the first fraction of a second after the big bang, how galaxies formed and evolved, and the origins of water in planetary systems in our galaxy. https://photojournal.jpl.nasa.gov/catalog/PIA26539
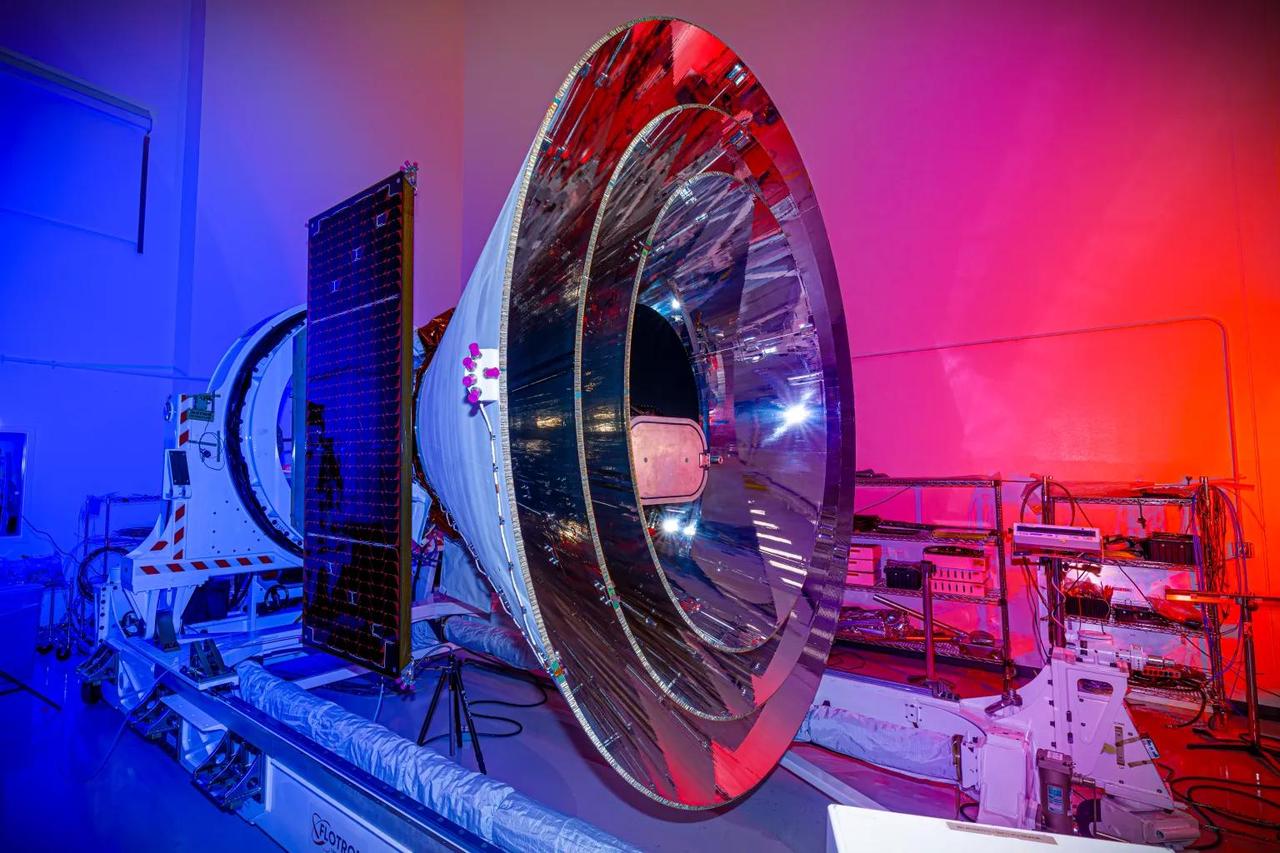
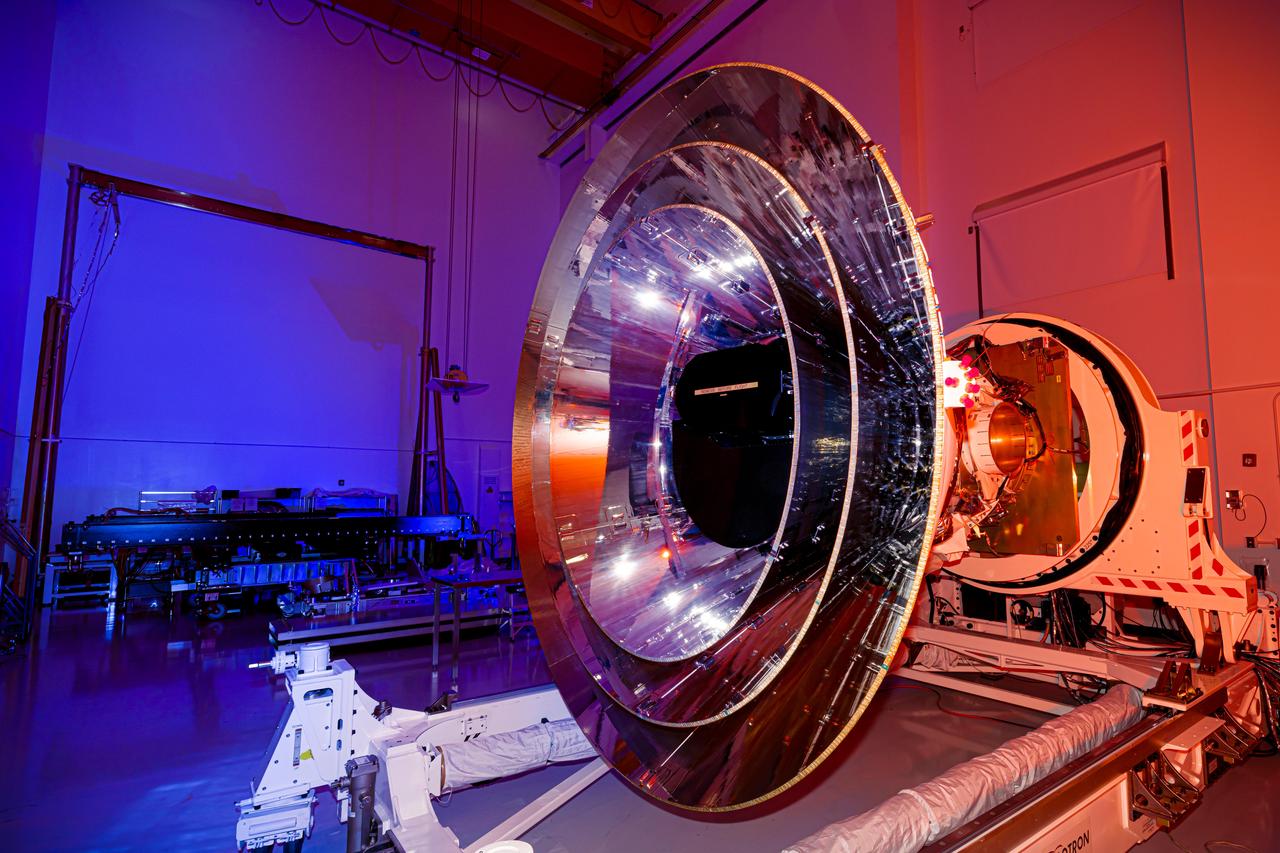
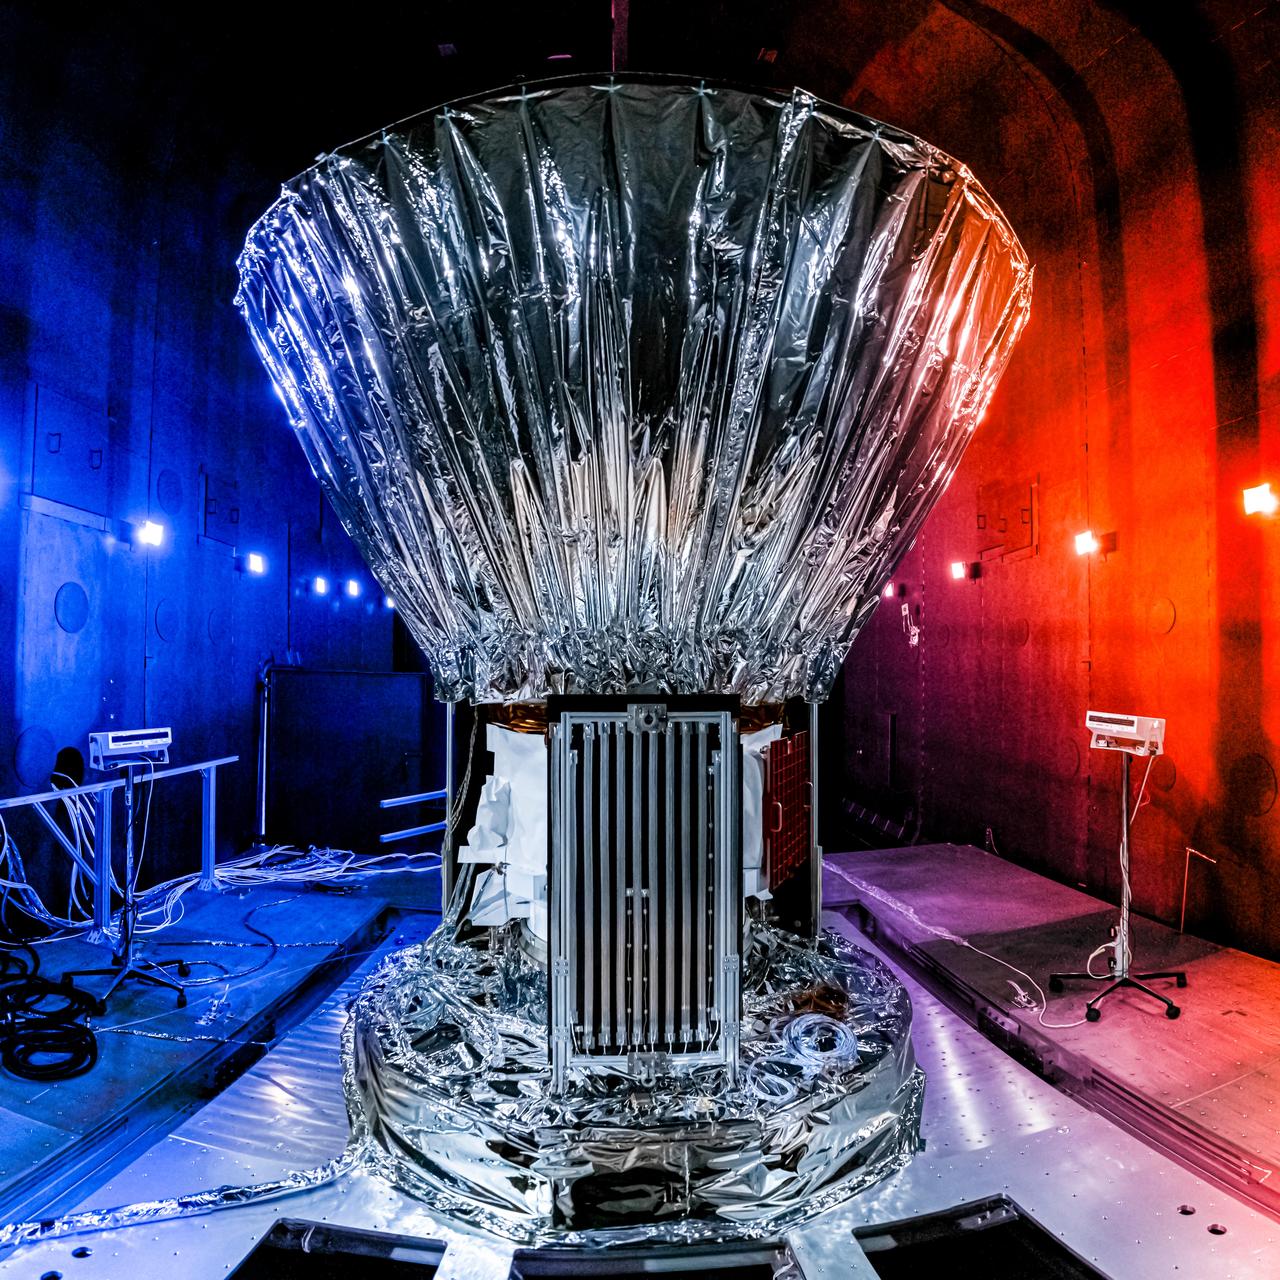
NASA's SPHEREx space observatory was photographed at BAE Systems in Boulder, Colorado, in November 2024 after completing environmental testing. The spacecraft's three concentric cones help direct heat and light away from the telescope and other components, keeping them cool. Short for Spectro-Photometer for the History of the Universe, Epoch of Reionization and Ices Explorer, SPHEREx will create a map of the cosmos like no other. Using a technique called spectroscopy to image the entire sky in 102 wavelengths of infrared light, SPHEREx will gather information about the composition of and distance to millions of galaxies and stars. With this map, scientists will study what happened in the first fraction of a second after the big bang, how galaxies formed and evolved, and the origins of water in planetary systems in our galaxy. https://photojournal.jpl.nasa.gov/catalog/PIA26536
NASA's SPHEREx observatory is installed in the Titan Thermal Vacuum (TVAC) test Chamber at BAE Systems in Boulder, Colorado, in June 2024. As part of the test setup, the spacecraft and photon shield are covered in multilayer insulation and blankets and surrounded by ground support equipment. Short for Spectro-Photometer for the History of the Universe, Epoch of Reionization and Ices Explorer, SPHEREx will create a map of the cosmos like no other. Using a technique called spectroscopy to image the entire sky in 102 wavelengths of infrared light, SPHEREx will gather information about the composition of and distance to millions of galaxies and stars. With this map, scientists will study what happened in the first fraction of a second after the big bang, how galaxies formed and evolved, and the origins of water in planetary systems in our galaxy. https://photojournal.jpl.nasa.gov/catalog/PIA26541

This mosaic of a star field was made from three images captured Dec. 4, 2024, by star tracker cameras aboard NASA's Europa Clipper spacecraft. The pair of star trackers (formally known as the stellar reference units) captured and transmitted Europa Clipper's first imagery of space. The picture, composed of three shots, shows tiny pinpricks of light from stars 150 to 300 light-years away. The starfield represents only about 0.1% of the full sky around the spacecraft, but by mapping the stars in just that small slice of sky, the orbiter is able to determine where it is pointed and orient itself correctly. The starfield includes the four brightest stars – Gienah, Algorab, Kraz, and Alchiba – of the constellation Corvus, which is Latin for "crow," a bird in Greek mythology that was associated with Apollo. Besides being interesting to stargazers, the photos signal the successful checkout of the star trackers. The spacecraft checkout phase has been going on since Europa Clipper launched on a SpaceX Falcon Heavy rocket on Oct. 14, 2024. Europa Clipper's three main science objectives are to determine the thickness of the moon's icy shell and its interactions with the ocean below, to investigate its composition, and to characterize its geology. The mission's detailed exploration of Europa will help scientists better understand the astrobiological potential for habitable worlds beyond our planet. https://photojournal.jpl.nasa.gov/catalog/PIA26561

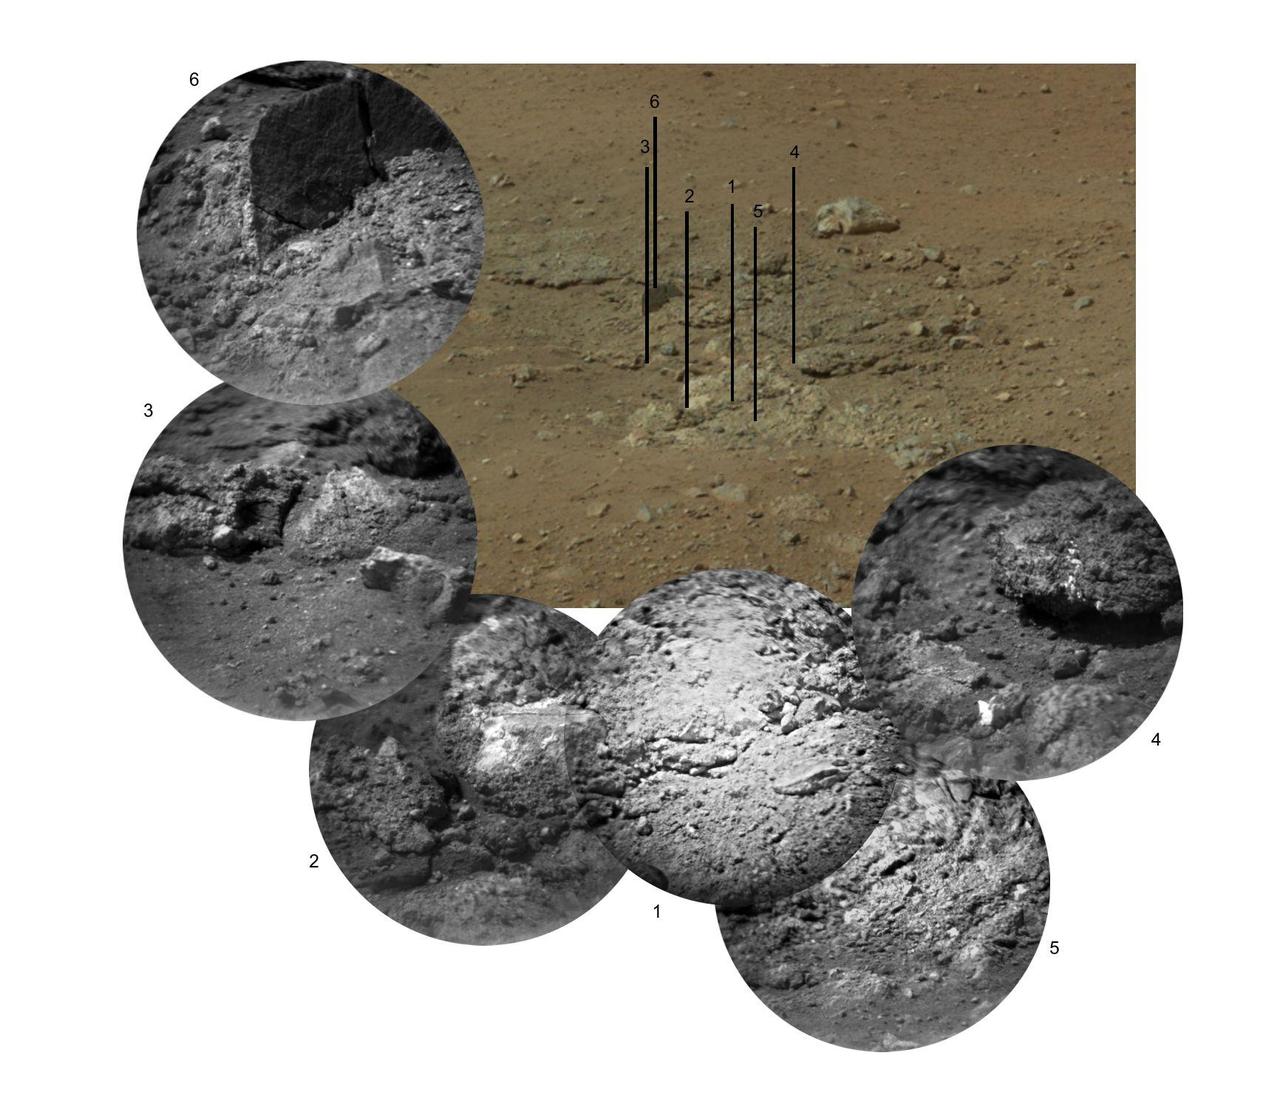
This view from the Mast Camera (Mastcam) on NASA's Curiosity Mars rover covers an area in "Bridger Basin" that includes the locations where the rover drilled a target called "Big Sky" on the mission's Sol 1119 (Sept. 29, 2015) and a target called "Greenhorn" on Sol 1137 (Oct. 18, 2015). The scene combines portions of several observations taken from sols 1112 to 1126 (Sept. 22 to Oct. 6, 2015) while Curiosity was stationed at Big Sky drilling site. The Big Sky drill hole is visible in the lower part of the scene. The Greenhorn target, in a pale fracture zone near the center of the image, had not yet been drilled when the component images were taken. Researchers selected this pair of drilling sites to investigate the nature of silica enrichment in the fracture zones of the area. http://photojournal.jpl.nasa.gov/catalog/PIA20270
This stellar object is called Spitzer 073425.3-465409, as seen by NASA Wide-field Infrared Survey Explorer; the cloud CG4 might be imagined as a cosmic alligator eating its way across the sky.
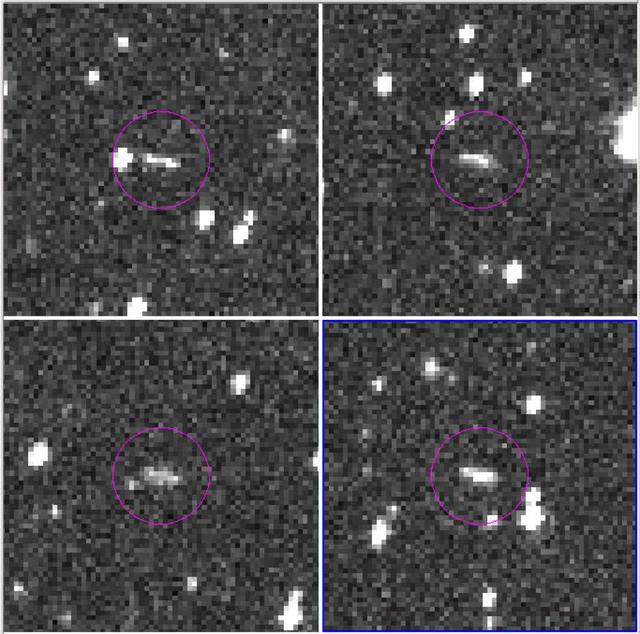
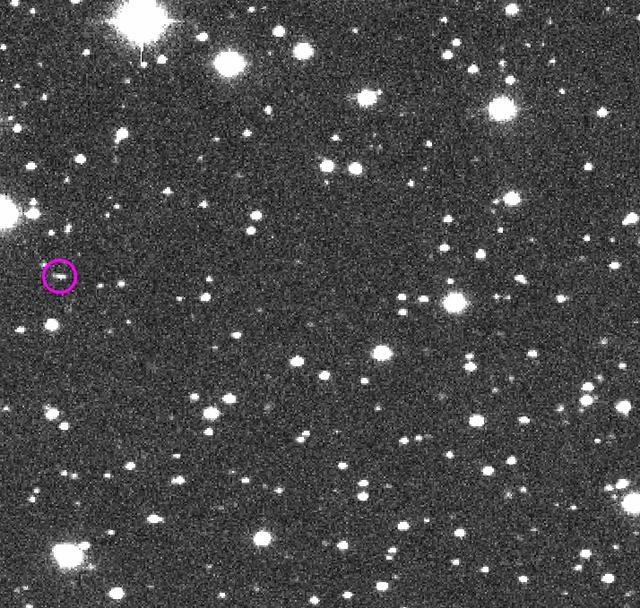
These are the discovery observations of asteroid 2018 LA from the Catalina Sky Survey, taken June 2, 2018. About eight hours after these images were taken, the asteroid entered Earth's atmosphere (about 9:44 a.m. PDT, 12:44 p.m. EDT, 16:44 UTC, 6:44 p.m. local Botswana time), and disintegrated in the upper atmosphere near Botswana, Africa. https://photojournal.jpl.nasa.gov/catalog/PIA22468

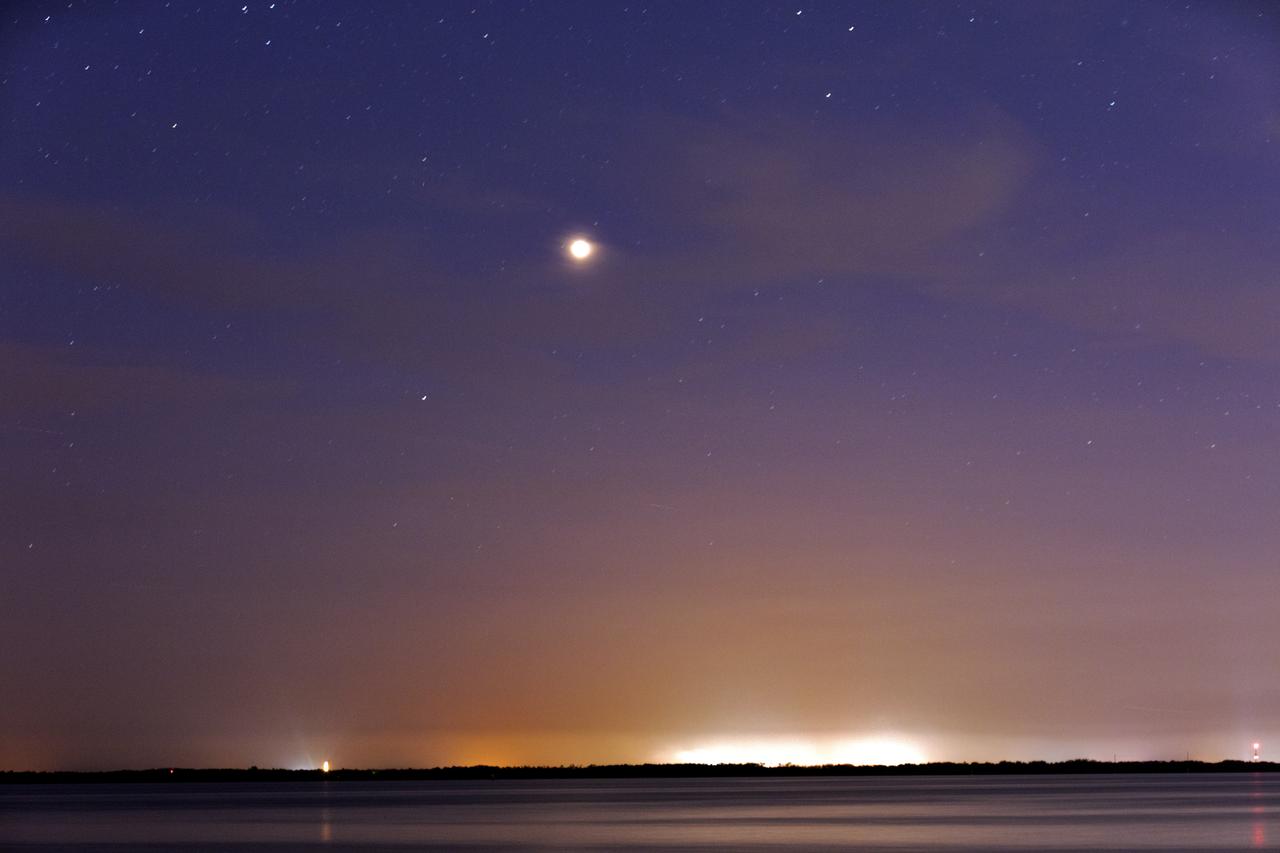
CAPE CANAVERAL, Fla. – Clouds over Launch Complex 39 at NASA’s Kennedy Space Center in Florida threaten to obscure the view of the “supermoon” forecast to light up the sky. The scientific term for the supermoon phenomenon is "perigee moon." Full moons vary in size because of the oval shape of the moon's orbit. The moon follows an elliptical path around Earth with one side about 50,000 kilometers closer than the other. Full moons that occur on the perigee side of the moon's orbit seem extra big and bright. For additional information, visit http://science.nasa.gov/science-news/science-at-nasa/2014/10jul_supermoons/. Photo credit: NASA/Ben Smegelsky

CAPE CANAVERAL, Fla. – The sky changes color as the sun sets over Launch Complex 39 at NASA’s Kennedy Space Center in Florida, bringing with it expectations of the appearance of a “supermoon.” The scientific term for the supermoon phenomenon is "perigee moon." Full moons vary in size because of the oval shape of the moon's orbit. The moon follows an elliptical path around Earth with one side about 50,000 kilometers closer than the other. Full moons that occur on the perigee side of the moon's orbit seem extra big and bright. For additional information, visit http://science.nasa.gov/science-news/science-at-nasa/2014/10jul_supermoons/. Photo credit: NASA/Ben Smegelsky

With its all-sky infrared survey, NASA Wide-field Infrared Survey Explorer, or WISE, has identified millions of quasar candidates. Quasars are supermassive black holes with masses millions to billions times greater than our sun.
Mars is visible above the horizon in the night sky above Kennedy Space Center in Florida on Monday, July 30, 2018. The Red Planet appeared the brightest from July 27 to July 30, making its closest approach to Earth on July 31. The next Mars close approach is Oct. 6, 2020. A close approach is when Mars and Earth come nearest to each other in their orbits around the Sun.
Mars shines brightly in the sky over Port Canaveral in Florida on Monday, July 30, 2018. The Red Planet appeared the brightest from July 27 to July 30, making its closest approach to Earth on July 31. The next Mars close approach is Oct. 6, 2020. A close approach is when Mars and Earth come nearest to each other in their orbits around the Sun.

Mars shines brightly in the sky over Port Canaveral in Florida on Monday, July 30, 2018. The Red Planet appeared the brightest from July 27 to July 30, making its closest approach to Earth on July 31. The next Mars close approach is Oct. 6, 2020. A close approach is when Mars and Earth come nearest to each other in their orbits around the Sun.
Mars is visible above the horizon in the night sky above Kennedy Space Center in Florida on Monday, July 30, 2018. The Red Planet appeared the brightest from July 27 to July 30, making its closest approach to Earth on July 31. The next Mars close approach is Oct. 6, 2020. A close approach is when Mars and Earth come nearest to each other in their orbits around the Sun.
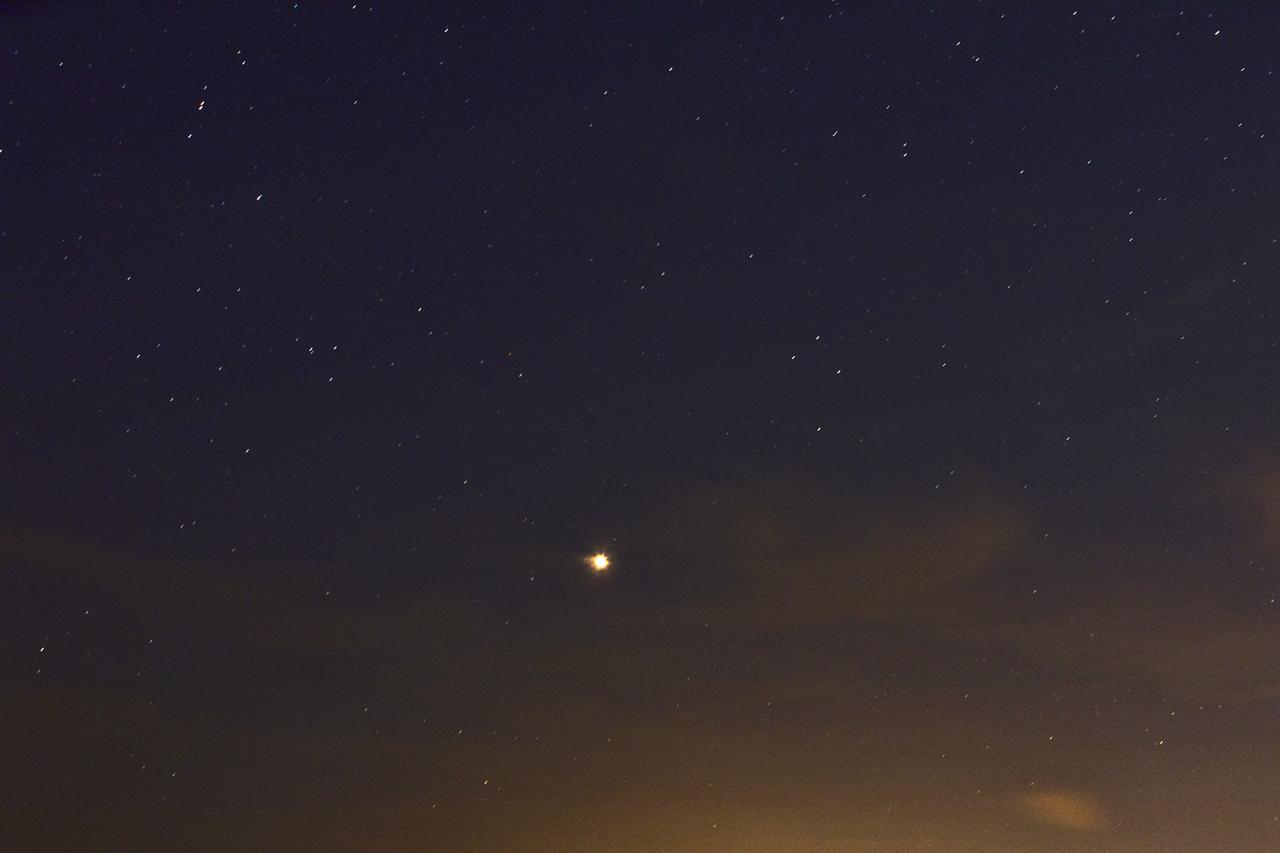
Mars shines brightly in the sky over Port Canaveral in Florida on Monday, July 30, 2018. The Red Planet appeared the brightest from July 27 to July 30, making its closest approach to Earth on July 31. The next Mars close approach is Oct. 6, 2020. A close approach is when Mars and Earth come nearest to each other in their orbits around the Sun.

Atlas Image mosaic, covering 34 x 34 on the sky, of the Coma cluster, aka Abell 1656. This is a particularly rich cluster of individual galaxies over 1000 members, most prominently the two giant ellipticals, NGC 4874 right and NGC 4889 left.

This striking NASA/ESA Hubble Space Telescope image captures the galaxy UGC 477, located just over 110 million light-years away in the constellation of Pisces (The Fish). UGC 477 is a low surface brightness (LSB) galaxy. First proposed in 1976 by Mike Disney, the existence of LSB galaxies was confirmed only in 1986 with the discovery of Malin 1. LSB galaxies like UGC 477 are more diffusely distributed than galaxies such as Andromeda and the Milky Way. With surface brightnesses up to 250 times fainter than the night sky, these galaxies can be incredibly difficult to detect. Most of the matter present in LSB galaxies is in the form of hydrogen gas, rather than stars. Unlike the bulges of normal spiral galaxies, the centers of LSB galaxies do not contain large numbers of stars. Astronomers suspect that this is because LSB galaxies are mainly found in regions devoid of other galaxies, and have therefore experienced fewer galactic interactions and mergers capable of triggering high rates of star formation. LSB galaxies such as UGC 477 instead appear to be dominated by dark matter, making them excellent objects to study to further our understanding of this elusive substance. However, due to an underrepresentation in galactic surveys — caused by their characteristic low brightness — their importance has only been realized relatively recently. Image credit: ESA/Hubble & NASA, Acknowledgement: Judy Schmidt <b><a href="http://www.nasa.gov/audience/formedia/features/MP_Photo_Guidelines.html" rel="nofollow">NASA image use policy.</a></b> <b><a href="http://www.nasa.gov/centers/goddard/home/index.html" rel="nofollow">NASA Goddard Space Flight Center</a></b> enables NASA’s mission through four scientific endeavors: Earth Science, Heliophysics, Solar System Exploration, and Astrophysics. Goddard plays a leading role in NASA’s accomplishments by contributing compelling scientific knowledge to advance the Agency’s mission. <b>Follow us on <a href="http://twitter.com/NASAGoddardPix" rel="nofollow">Twitter</a></b> <b>Like us on <a href="http://www.facebook.com/pages/Greenbelt-MD/NASA-Goddard/395013845897?ref=tsd" rel="nofollow">Facebook</a></b> <b>Find us on <a href="http://instagrid.me/nasagoddard/?vm=grid" rel="nofollow">Instagram</a></b>
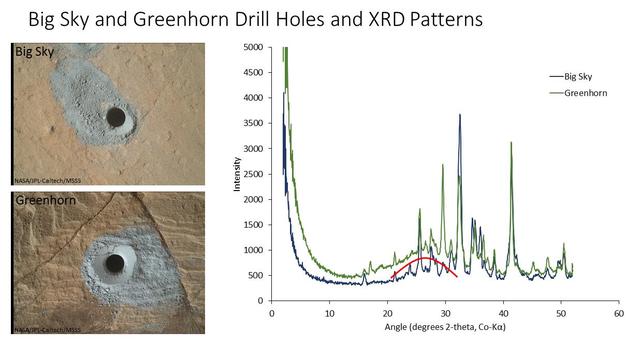
The graph at right presents information from the NASA Curiosity Mars rover's onboard analysis of rock powder drilled from the "Big Sky" and "Greenhorn" target locations, shown at left. X-ray diffraction analysis of the Greenhorn sample inside the rover's Chemistry and Mineralogy (CheMin) instrument revealed an abundance of silica in the form of noncrystalline opal. The broad hump in the background of the X-ray diffraction pattern for Greenhorn, compared to Big Sky, is diagnostic of opal. The image of Big Sky at upper left was taken by the rover's Mars Hand Lens Imager (MAHLI) camera the day the hole was drilled, Sept. 29, 2015, during the mission's 1,119th Martian day, or sol. The Greenhorn hole was drilled, and the MAHLI image at lower left was taken, on Oct. 18, 2015 (Sol 1137). http://photojournal.jpl.nasa.gov/catalog/PIA20272

This artist concept shows the sky crane maneuver during the descent of NASA Curiosity rover to the Martian surface. The sheer size of the rover over one ton, or 900 kilograms would preclude it from taking advantage of an airbag-assisted landing.
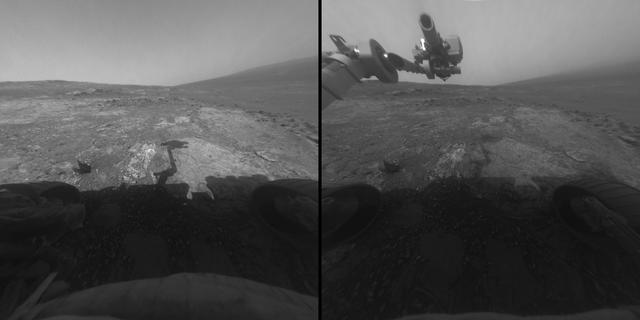
These two images, taken five Martian days sols apart by the front hazard-avoidance camera on NASA Mars Exploration Rover Opportunity, document the Martian sky above the rover Endeavour Crater location becoming dustier.

S134-E-010064 (27 May 2011) --- A portion of the International Space Station is visible in this view of a starry sky, photographed by NASA astronaut Greg Chamitoff, STS-134 mission specialist, while space shuttle Endeavour remains docked with the station. Photo credit: NASA

In archived NASA data, researchers have discovered "super spiral" galaxies that dwarf our own spiral galaxy, the Milky Way, and compete in size and brightness with the largest galaxies in the universe. The unprecedented galaxies have long hidden in plain sight by mimicking the appearance of typical spirals. Three examples of super spirals are presented here in images taken by the Sloan Digital Sky Survey. The super spiral on the left (Figure 1), catalogued as 2MASX J08542169+0449308, contains two galactic nuclei, instead of just the usual one, and thus looks like two eggs frying in a pan. The central image (Figure 2) shows a super spiral designated 2MASX J16014061+2718161, and it also contains the double nuclei. On the right (Figure 3), a huge galaxy with the moniker SDSS J094700.08+254045.7 stands as one of the biggest and brightest super spirals. The mega-galaxy's starry disk and spiral arms stretch about 320,000 light-years across, or more than three times the breadth of the Milky Way. These double nuclei, which are known to result from the recent merger of two galaxies, could offer a vital hint about the potential origin of super spirals. Researchers speculate that a special merger involving two, gas-rich spiral galaxies could see their pooled gases settle down into a new, larger stellar disk -- presto, a super spiral. The super spirals were discovered using the NASA/IPAC Extragalactic Database, or NED, an online repository containing information on over 100 million galaxies. NED brings together a wealth of data from many different projects, including ultraviolet light observations from the Galaxy Evolution Explorer, visible light from Sloan Digital Sky Survey, infrared light from the 2-Micron All-Sky Survey, and links to data from other missions such as NASA's Spitzer Space Telescope and Wide-Field Infrared Survey Explorer, or WISE. http://photojournal.jpl.nasa.gov/catalog/PIA20064
Observing the sky with the green filter of it panoramic camera, NASA Mars Exploration Rover Spirit came across a surprise: a streak across the sky, probably the brightest object in the sky at the time.

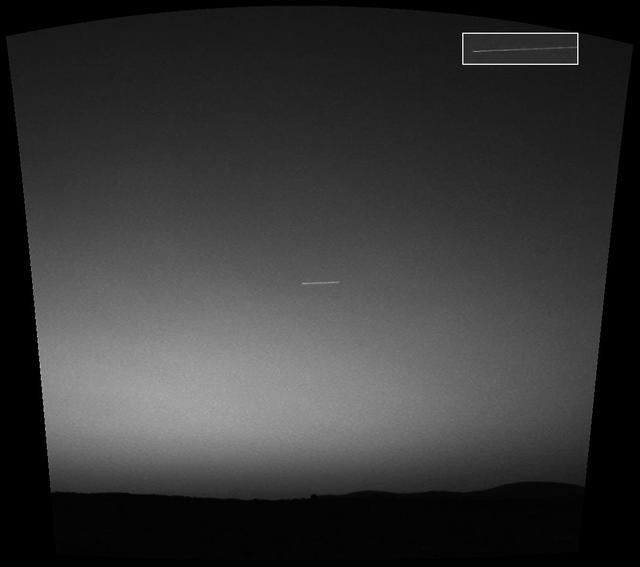
Two images of the night sky were combined to show Earth and Venus as seen by the Mast Camera aboard NASA's Curiosity Mars rover on June 5, 2020, the 2,784th Martian day, or sol, of the mission. Both planets appear as mere pinpoints of light owing to a combination of distance and dust in the air; they would normally look like bright stars. A feature called Tower Butte is just visible at the bottom of the image, part of the clay-bearing region that Curiosity has been exploring since early 2019. https://photojournal.jpl.nasa.gov/catalog/PIA23899

This composite image of southern Africa and the surrounding oceans was captured by six orbits of the NASA/NOAA Suomi National Polar-orbiting Partnership spacecraft on April 9, 2015, by the Visible Infrared Imaging Radiometer Suite (VIIRS) instrument. Tropical Cyclone Joalane can be seen over the Indian Ocean. Winds, tides and density differences constantly stir the oceans while phytoplankton continually grow and die. Orbiting radiometers such as VIIRS allows scientists to track this variability over time and contribute to better understanding of ocean processes that are beneficial to human survival on Earth. The image was created by the Ocean Biology Processing Group at NASA's Goddard Space Flight Center in Greenbelt, Maryland.
This all-sky image shows the spatial distribution over the whole sky of the galactic haze at 30 and 44 GHz, extracted from the Planck observations.
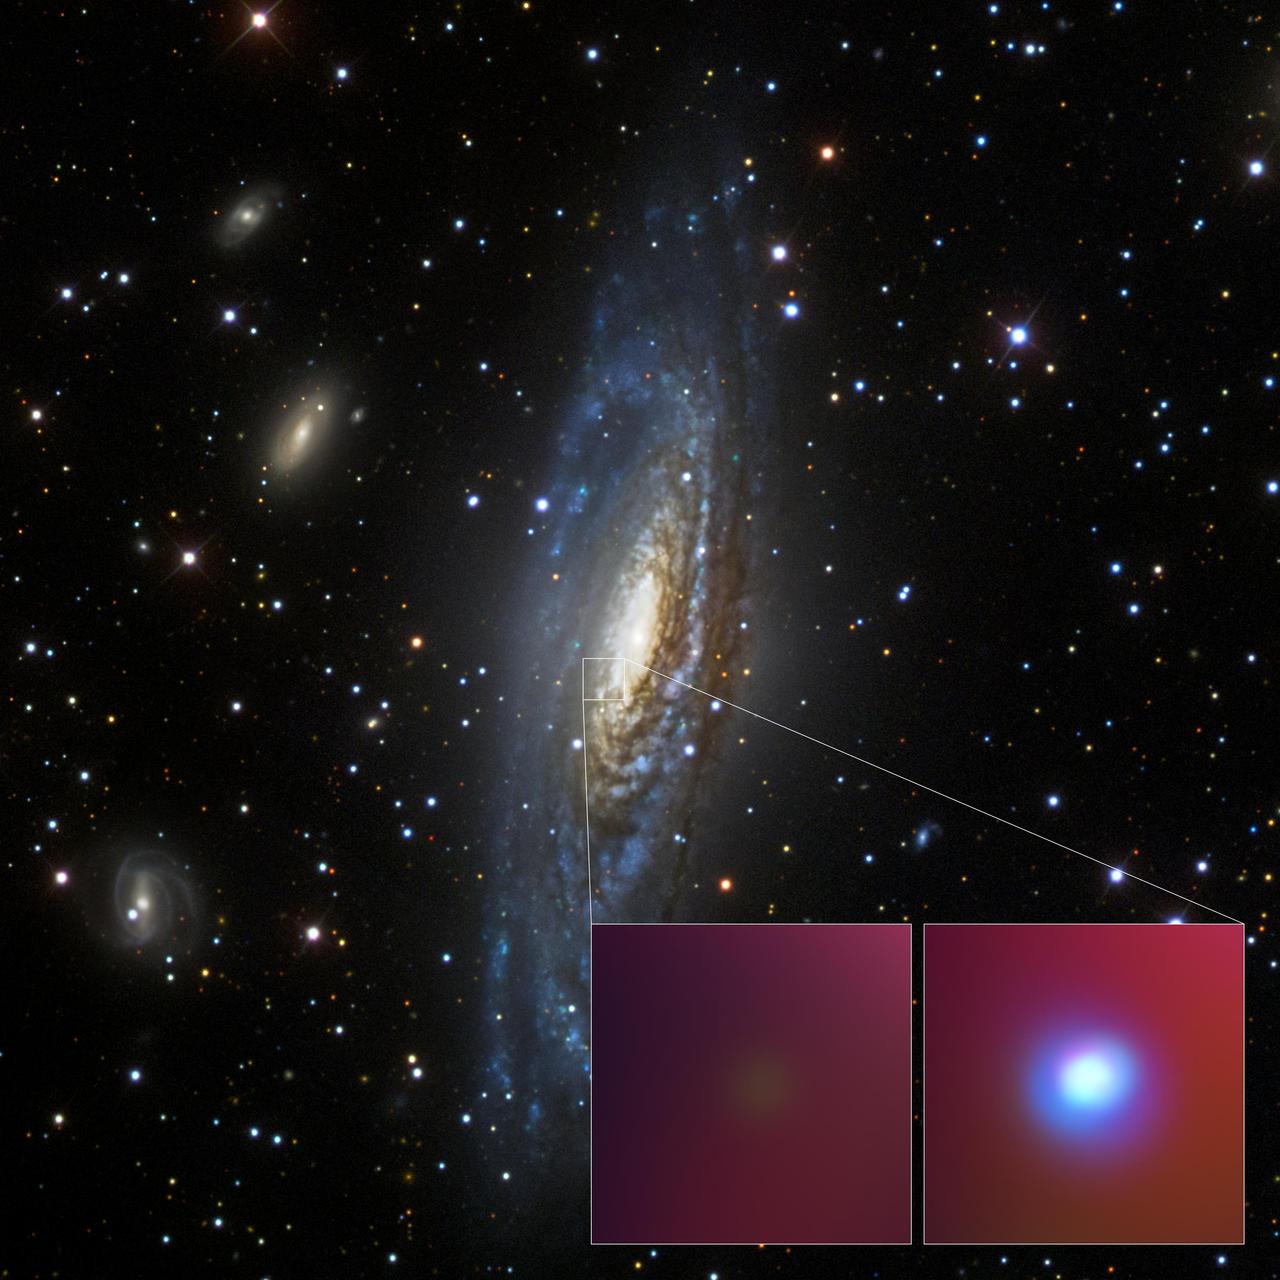
This visible-light image from the Sloan Digital Sky Survey shows spiral galaxy NGC 7331, center, where astronomers observed the unusual supernova SN 2014C . The inset images are from NASA's Chandra X-ray Observatory, showing a small region of the galaxy before the supernova explosion (left) and after it (right). Red, green and blue colors are used for low, medium and high-energy X-rays, respectively. http://photojournal.jpl.nasa.gov/catalog/PIA21088

This composite image of southern Africa and the surrounding oceans was captured by six orbits of the NASA/NOAA Suomi National Polar-orbiting Partnership spacecraft on April 9, 2015, by the Visible Infrared Imaging Radiometer Suite (VIIRS) instrument. Tropical Cyclone Joalane can be seen over the Indian Ocean. Winds, tides and density differences constantly stir the oceans while phytoplankton continually grow and die. Orbiting radiometers such as VIIRS allows scientists to track this variability over time and contribute to better understanding of ocean processes that are beneficial to human survival on Earth. The image was created by the Ocean Biology Processing Group at NASA's Goddard Space Flight Center in Greenbelt, Maryland. For more information, please visit: <a href="http://oceancolor.gsfc.nasa.gov/" rel="nofollow">oceancolor.gsfc.nasa.gov/</a> and <a href="http://www.nasa.gov/npp" rel="nofollow">www.nasa.gov/npp</a> Image Credit: Ocean Biology Processing Group at NASA's Goddard Space Flight Center <b><a href="http://www.nasa.gov/audience/formedia/features/MP_Photo_Guidelines.html" rel="nofollow">NASA image use policy.</a></b> <b><a href="http://www.nasa.gov/centers/goddard/home/index.html" rel="nofollow">NASA Goddard Space Flight Center</a></b> enables NASA’s mission through four scientific endeavors: Earth Science, Heliophysics, Solar System Exploration, and Astrophysics. Goddard plays a leading role in NASA’s accomplishments by contributing compelling scientific knowledge to advance the Agency’s mission. <b>Follow us on <a href="http://twitter.com/NASAGoddardPix" rel="nofollow">Twitter</a></b> <b>Like us on <a href="http://www.facebook.com/pages/Greenbelt-MD/NASA-Goddard/395013845897?ref=tsd" rel="nofollow">Facebook</a></b> <b>Find us on <a href="http://instagrid.me/nasagoddard/?vm=grid" rel="nofollow">Instagram</a></b>
This striking NASA/ESA Hubble Space Telescope image captures the galaxy UGC 477, located just over 110 million light-years away in the constellation of Pisces (The Fish). UGC 477 is a low surface brightness (LSB) galaxy. First proposed in 1976 by Mike Disney, the existence of LSB galaxies was confirmed only in 1986 with the discovery of Malin 1. LSB galaxies like UGC 477 are more diffusely distributed than galaxies such as Andromeda and the Milky Way. With surface brightnesses up to 250 times fainter than the night sky, these galaxies can be incredibly difficult to detect. Most of the matter present in LSB galaxies is in the form of hydrogen gas, rather than stars. Unlike the bulges of normal spiral galaxies, the centres of LSB galaxies do not contain large numbers of stars. Astronomers suspect that this is because LSB galaxies are mainly found in regions devoid of other galaxies, and have therefore experienced fewer galactic interactions and mergers capable of triggering high rates of star formation. LSB galaxies such as UGC 477 instead appear to be dominated by dark matter, making them excellent objects to study to further our understanding of this elusive substance. However, due to an underrepresentation in galactic surveys — caused by their characteristic low brightness — their importance has only been realised relatively recently.

Ground crewman at NASA’s Armstrong Flight Research Center in Palmdale, CA install a rail to support the Autonomous, Robotic Telescope Mount Instrument Subsystem, which is part of air-LUSI and has a camera that scans the sky to find the Moon.
This image is a map of the portion of the sky covered by the preliminary release of WISE data. WISE surveyed the entire sky in four infrared wavelengths in 2010. This map is centered on the Milky Way galaxy.

This view of the twilight sky and Martian horizon taken by NASA Curiosity Mars rover includes Earth as the brightest point of light in the night sky. Earth is a little left of center in the image, and our moon is just below Earth.
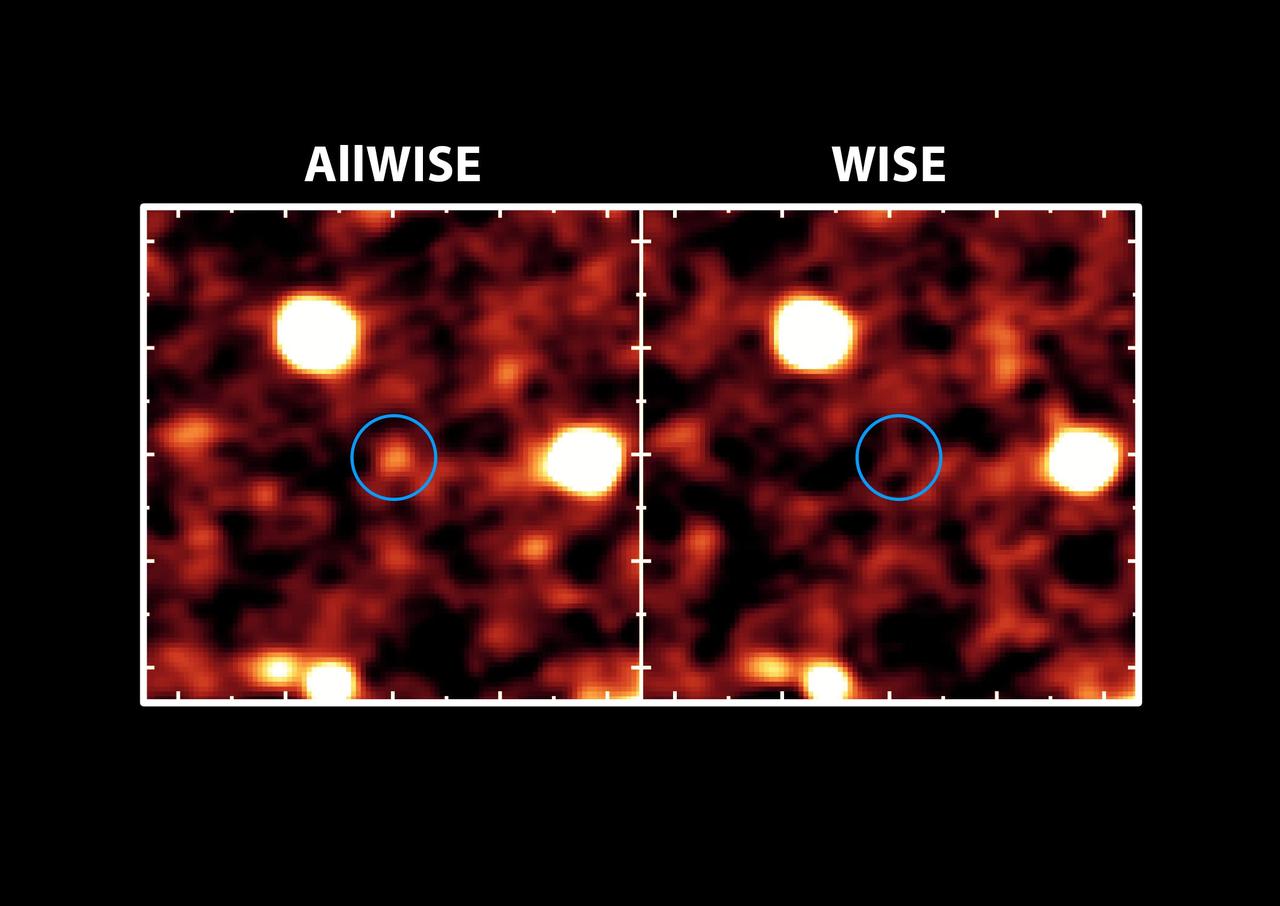
The new AllWISE catalog will bring distant galaxies that were once invisible out of hiding, as illustrated in this image. At right, a portion of the sky available before the AllWISE project; at left, the same part of the sky in a new AllWISE image.
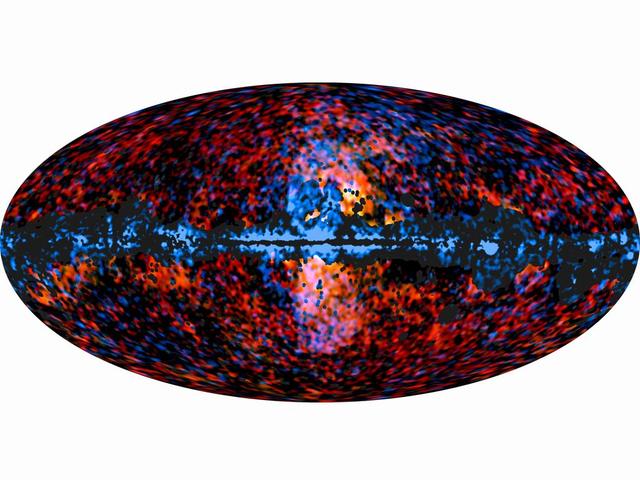
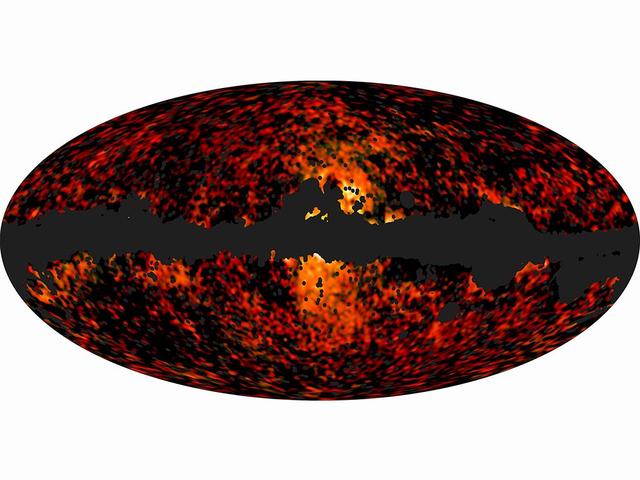
This all-sky image shows the distribution of the galactic haze seen by ESA Planck mission at microwave frequencies superimposed over the high-energy sky, as seen by NASA Fermi Gamma-ray Space Telescope.

NASA NEOWISE spacecraft opened its eyes after more than two years of slumber to see the starry sky with the same clarity achieved during its prime mission. This image shows a patch of sky in the constellation Pisces.
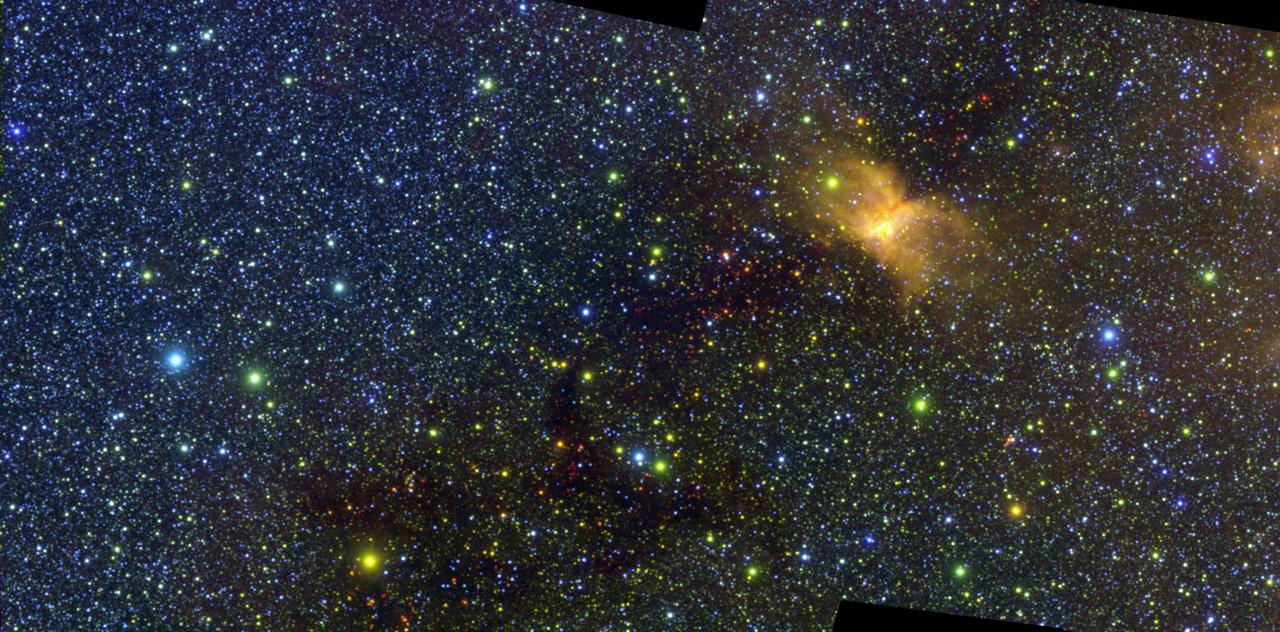
This image of the Vela Molecular Ridge was captured by NASA's SPHEREx (Spectro-Photometer for the History of the Universe, Epoch of Reionization and Ices Explorer) and was part of the mission's first public data release on July 2, 2025. The yellow patch at right is RCW 36, an emission nebula – a cloud of interstellar gas and dust that glows in some infrared colors due to radiation from nearby stars. SPHEREx detects 102 infrared wavelengths, or colors, that aren't visible to the human eye. https://photojournal.jpl.nasa.gov/catalog/PIA26354
CAPE CANAVERAL, Fla. – A “supermoon” breaks through the clouds over Launch Complex 39 at NASA’s Kennedy Space Center in Florida. The scientific term for the supermoon phenomenon is "perigee moon." Full moons vary in size because of the oval shape of the moon's orbit. The moon follows an elliptical path around Earth with one side about 50,000 kilometers closer than the other. Full moons that occur on the perigee side of the moon's orbit seem extra big and bright. For additional information, visit http://science.nasa.gov/science-news/science-at-nasa/2014/10jul_supermoons/. Photo credit: NASA/Ben Smegelsky
iss073e0982823 (Oct. 26, 2025) --- The Moon glares into a camera aboard the International Space Station as it orbited 259 miles above the Atlantic Ocean off the coast of Africa at approximately 10:49 p.m. local time. A bright airglow blankets Earth's horizon as the Milky Way illuminates the night sky.
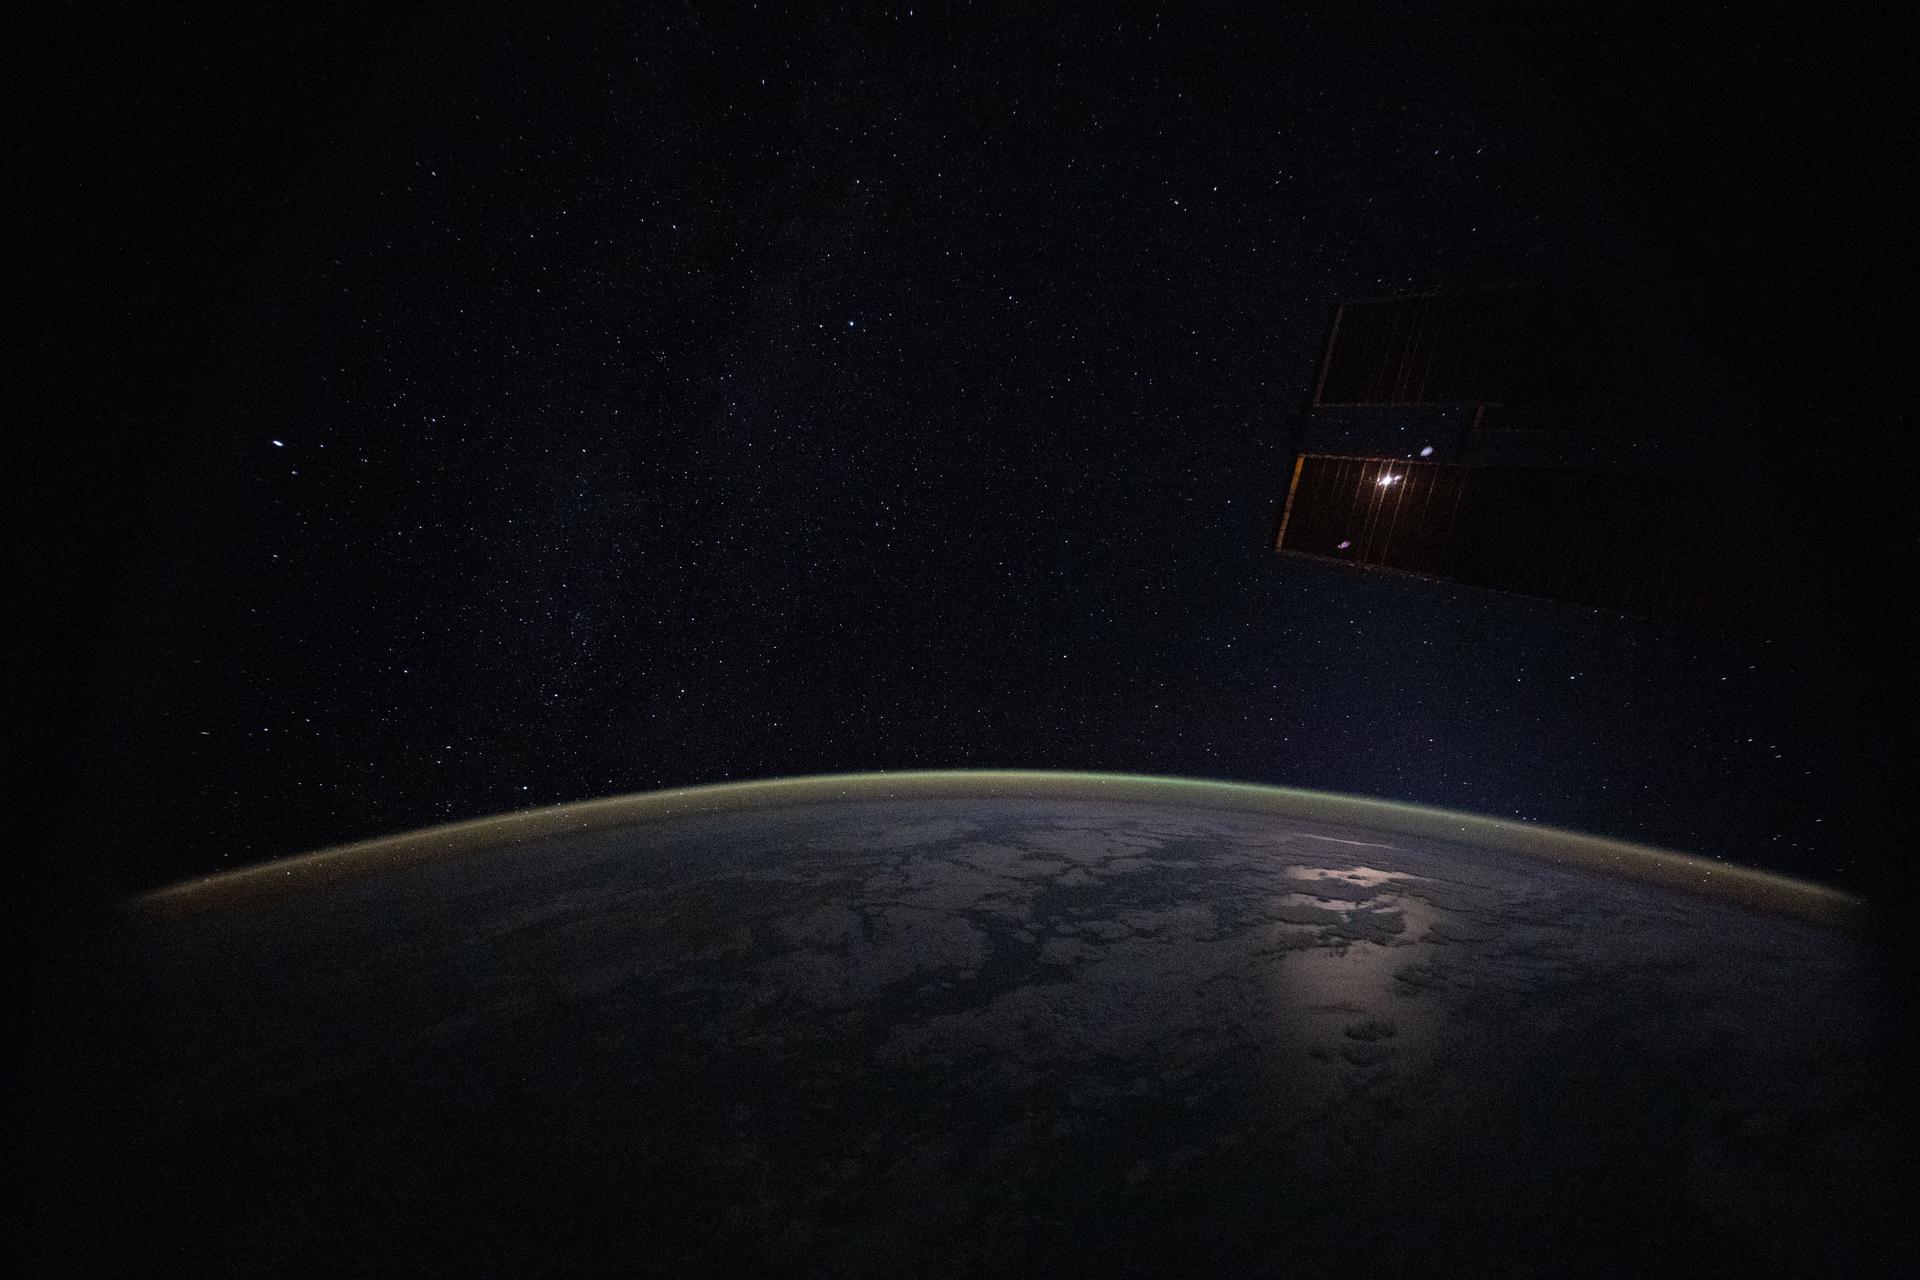
iss073e0982261 (Oct. 24, 2025) --- The Milky Way spans the night sky above a yellow-green airglow that blankets the Atlantic Ocean, midway between South America and Africa. This long-exposure photograph was taken from the International Space Station as it orbited 260 miles above Earth at approximately 11:19 p.m. local time.
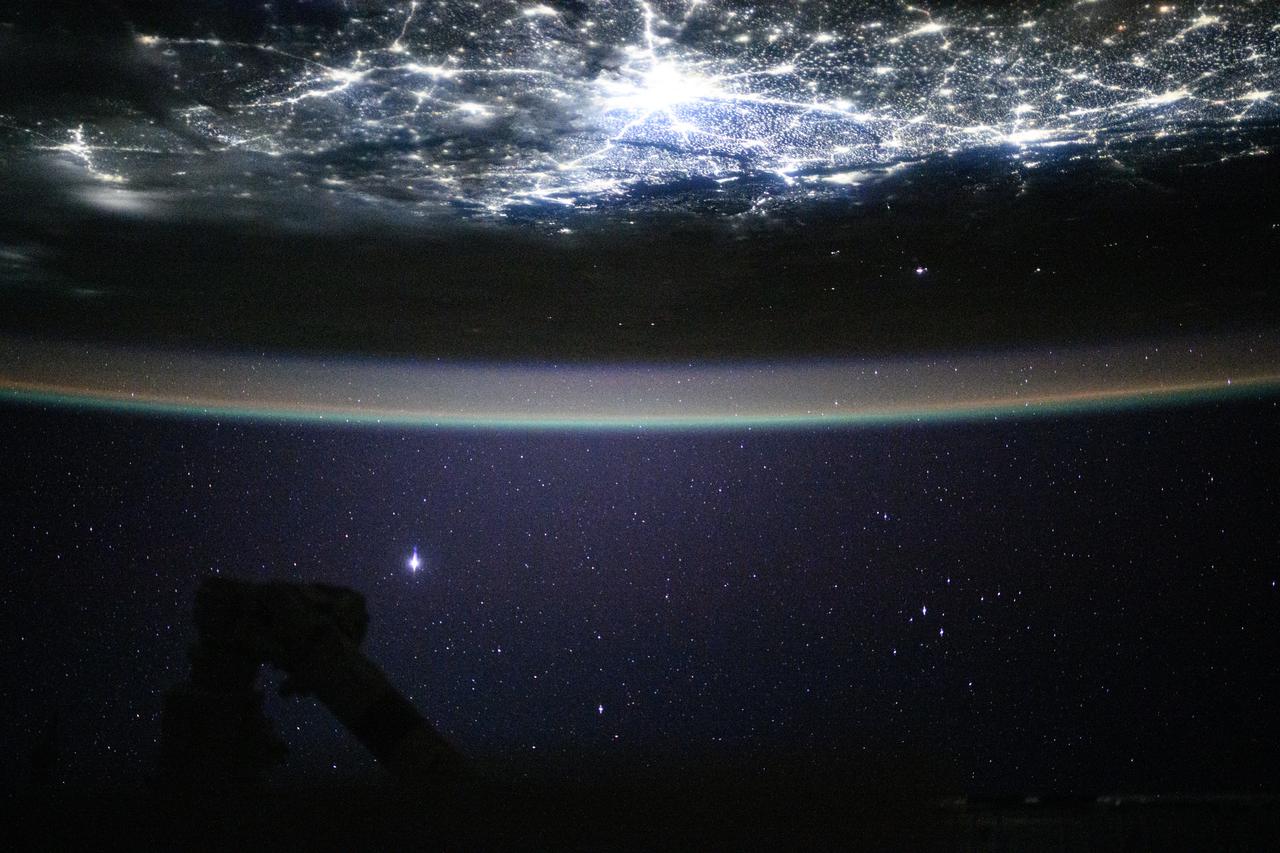
iss073e0685684 (Aug. 21, 2025) --- Underneath a starry night sky, the city lights of New Delhi, India, and its surrounding suburbs glitter below Earth's atmospheric glow and at the edge of the Himalayas. This photograph was taken at approximately 2:55 a.m. local time as the International Space Station orbited 260 miles above.

Sharon Christa McAuliffe, 51-L payload specialist representing the Teacher in Space project, jumps down onto a cushion during an emergency egress training session in JSC's mockup and integration laboratory. She had been descending from the mockup using a Sky-genie.
iss074e0472536 (April 12, 2026) --- This serene image, taken from the International Space Station as it orbited 265 miles above the Indian Ocean, highlights a yellow‑green airglow blanketing Earth’s atmosphere beneath a starry sky at approximately 2:37 a.m. local time. Credit: NASA/Chris Williams