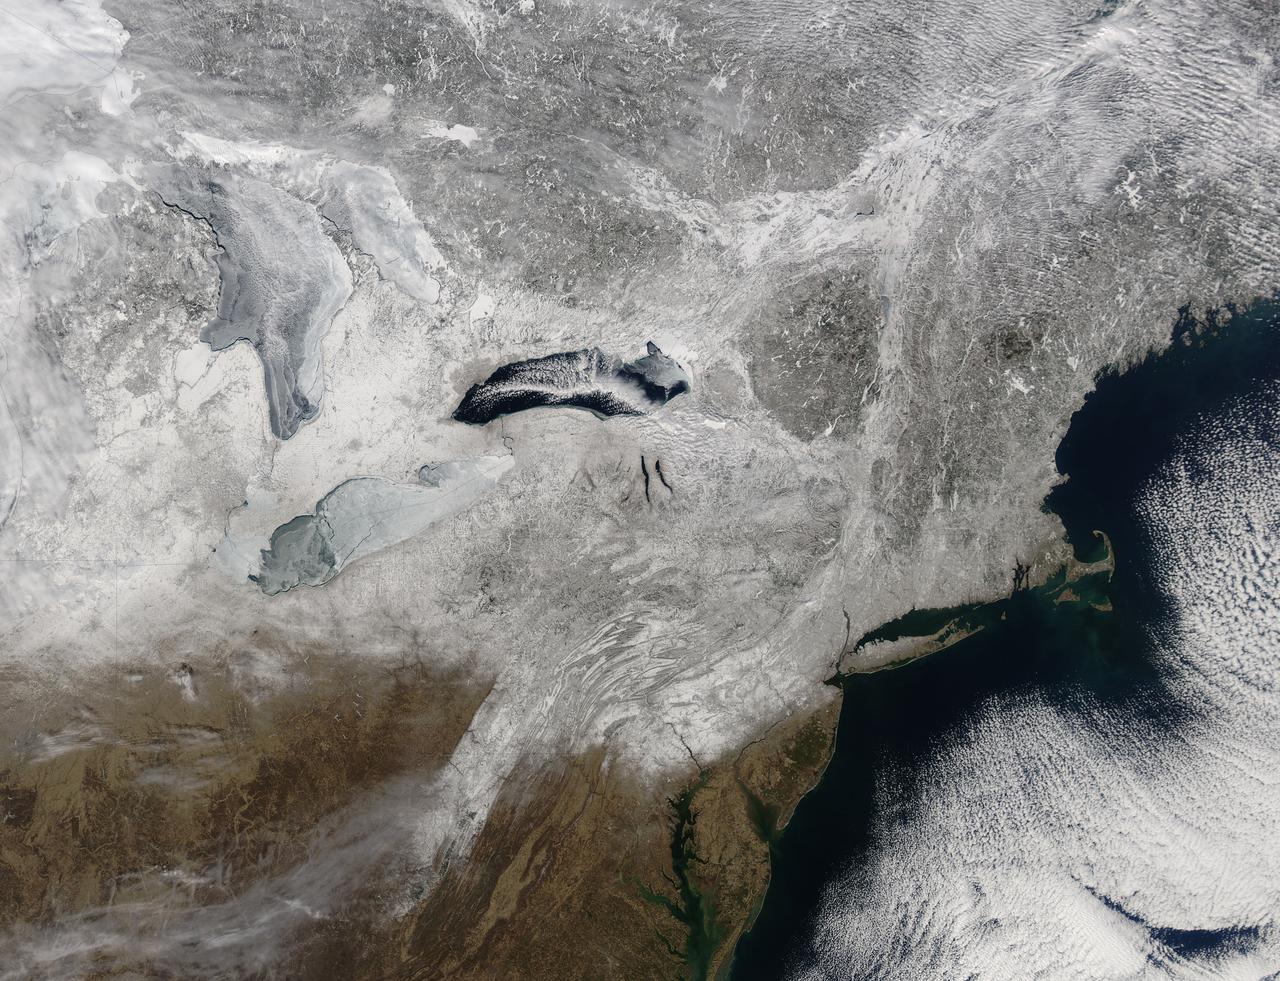
Snow covered the northeastern United States on last day of meteorological winter, 2014. Climatologists and meteorologists break seasons down into three-month groups, based on annual temperature and our calendar. This method is helpful for weather observing and forecasting, and for planning consistent agricultural dates, such as expected first frosts or best planting date. Meteorological winter – the season where temperatures are, on average, coldest and when snow is most likely to fall – runs from December 1 to February 28 in the United States and Canada. Winter can also be defined by the astronomical calendar, which is based on the rotation of the Earth around the sun. In this method, the seasons are defined by two solstices (times when the sun’s path is furthest from the Earth’s equator) and two equinoxes (the times when the sun passes directly above the equator). In the Northern Hemisphere, winter begins on the winter solstice, which falls on or around December 22 and ends on or around March 21, at the vernal (spring) equinox. On February 28, 2014, the Moderate Resolution Imaging Spectroradiometer aboard NASA’s Aqua satellite captured this true-color image of a sunny winter day in the northeastern United States. Snow stretches from Maine west to Indiana and south along the ridges of the Appalachian Mountains well into West Virginia. In Canada, the landscape appears greener, primarily because snow lies on conifers (evergreen) trees in the boreal forest regions. The Great Lakes, with the exception of Lake Ontario, are almost completely covered with ice. Credit: NASA/GSFC/Jeff Schmaltz/MODIS Land Rapid Response Team <b><a href="http://www.nasa.gov/audience/formedia/features/MP_Photo_Guidelines.html" rel="nofollow">NASA image use policy.</a></b> <b><a href="http://www.nasa.gov/centers/goddard/home/index.html" rel="nofollow">NASA Goddard Space Flight Center</a></b> enables NASA’s mission through four scientific endeavors: Earth Science, Heliophysics, Solar System Exploration, and Astrophysics. Goddard plays a leading role in NASA’s accomplishments by contributing compelling scientific knowledge to advance the Agency’s mission. <b>Follow us on <a href="http://twitter.com/NASAGoddardPix" rel="nofollow">Twitter</a></b> <b>Like us on <a href="http://www.facebook.com/pages/Greenbelt-MD/NASA-Goddard/395013845897?ref=tsd" rel="nofollow">Facebook</a></b> <b>Find us on <a href="http://instagram.com/nasagoddard?vm=grid" rel="nofollow">Instagram</a></b>
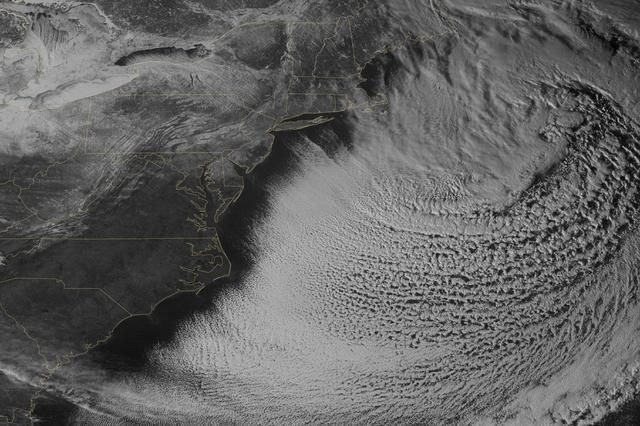
Yet another potent winter storm battered the northeastern United States on February 14-15, 2015. The nor'easter brought 12 to 20 inches (30 to 50 centimeters) of snow across much of eastern New England, along with tropical storm force winds over 60 miles (100 kilometers) per hour. The latest snowfall pushed Boston to its highest monthly total on record—58 inches and counting—and its third highest yearly snow total. This image was acquired by the GOES-East weather satellite at 3:45 p.m. Eastern Standard Time (20:45 Universal Time) on February 15, 2015, as the storm was mostly out to sea. Note the comma-like shape of the nor'easter, which spawned blizzard conditions at coastal locations. The official meteorological definition of a blizzard is three consecutive hours of falling or blowing snow with winds gusting above 35 miles (56 kilometers) per hour and visibility below one-fourth of a mile (0.4 kilometers). As of February 17, the snow depth near Boston was greater than in all but two reported locations in Alaska. It was significantly higher than the notoriously snowy states of Michigan, Wisconsin, and Minnesota. Only Buffalo, New York, had a higher snow pack. On February 16-17, more snow and ice fell across the eastern United States from northern Mississippi all the way to Maine. Read more: <a href="http://1.usa.gov/19wR4LI" rel="nofollow">1.usa.gov/19wR4LI</a> Via: <b><a href="http://www.earthobservatory.nasa.gov/" rel="nofollow"> NASA Earth Observatory</a></b> GOES image courtesy of the NASA/NOAA GOES Project Science team. Terra MODIS image by Jeff Schmaltz, LANCE/EOSDIS Rapid Response at NASA Goddard Space Flight Center. Caption by Mike Carlowicz. <b><a href="http://www.nasa.gov/audience/formedia/features/MP_Photo_Guidelines.html" rel="nofollow">NASA image use policy.</a></b> <b><a href="http://www.nasa.gov/centers/goddard/home/index.html" rel="nofollow">NASA Goddard Space Flight Center</a></b> enables NASA’s mission through four scientific endeavors: Earth Science, Heliophysics, Solar System Exploration, and Astrophysics. Goddard plays a leading role in NASA’s accomplishments by contributing compelling scientific knowledge to advance the Agency’s mission. <b>Follow us on <a href="http://twitter.com/NASAGoddardPix" rel="nofollow">Twitter</a></b> <b>Like us on <a href="http://www.facebook.com/pages/Greenbelt-MD/NASA-Goddard/395013845897?ref=tsd" rel="nofollow">Facebook</a></b> <b>Find us on <a href="http://instagram.com/nasagoddard?vm=grid" rel="nofollow">Instagram</a></b>
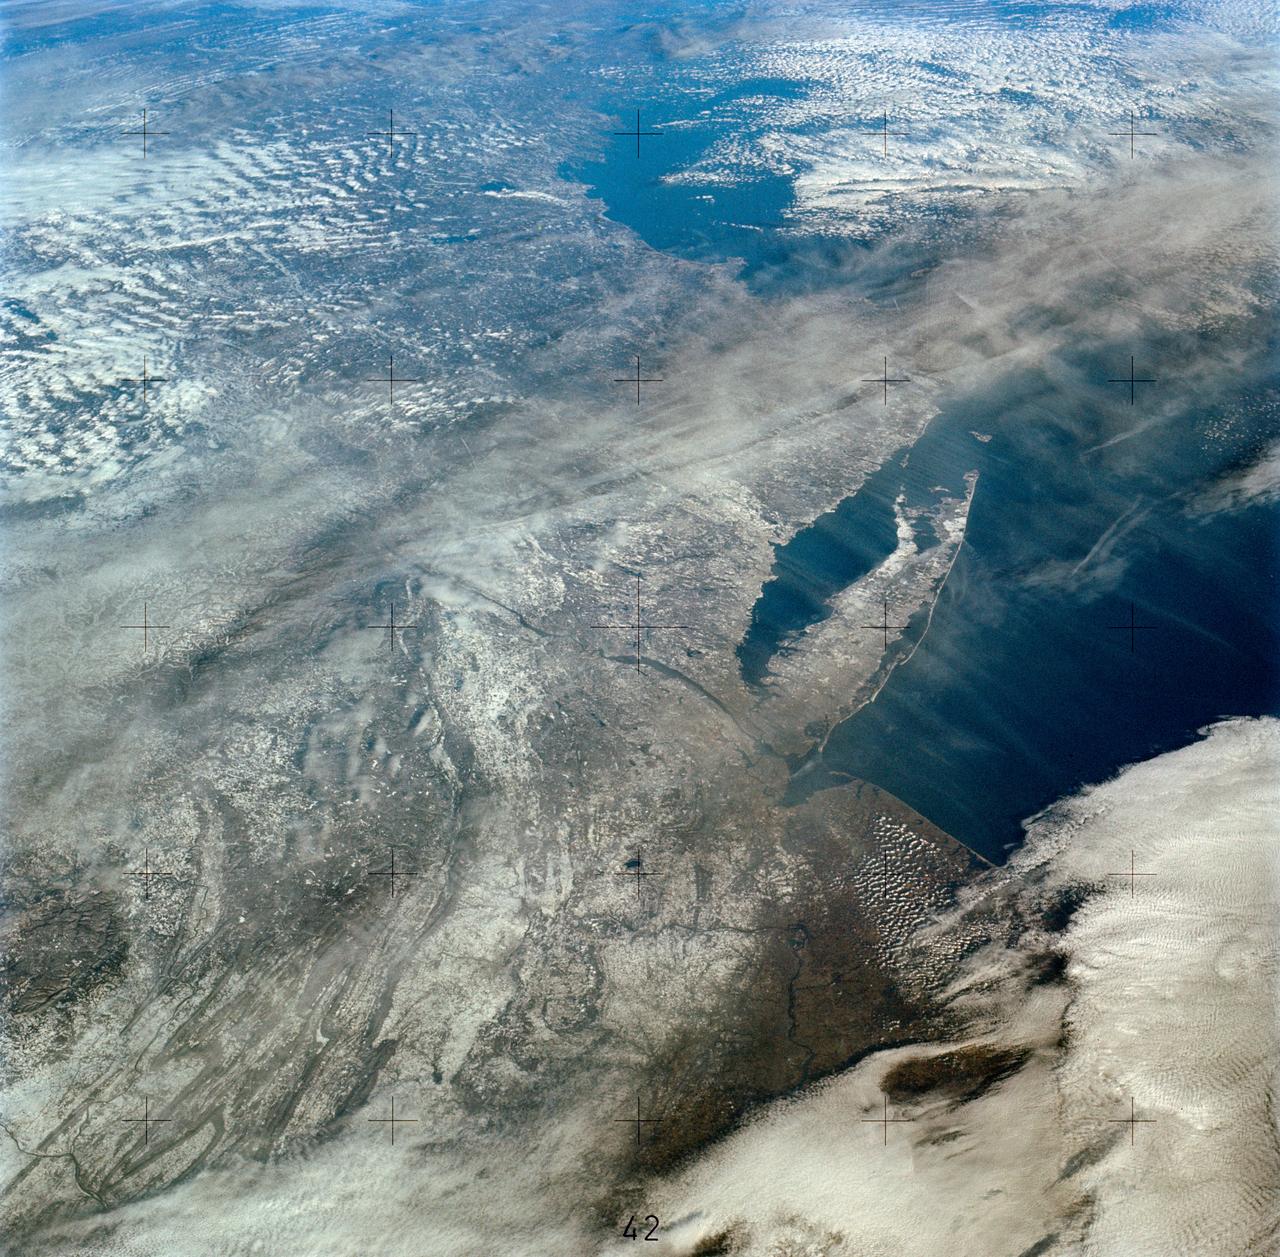
SL4-138-3894 (5 Jan. 1974) --- An oblique view of a portion of the northeastern part of the United States, as photographed from the Skylab space station in Earth orbit by one of the Skylab 4 crewmen. The camera used was a hand-held 70mm Hasselblad, and with SO-368 medium-speed Ektachrome film. This is an excellent example of the regional view which is available from space. The entire area of New Jersey, eastern Pennsylvania, southeastern New York, and southern New England can be examined in one view. Long Island, New York City and the lower Hudson River Valley are readily seen in their regional framework. The Boston area, although blurred by clouds, is also included. The spackling of the snow enhances the contrast, especially of terrain and cultural features. Different levels of clouds can be studies, especially the crossing layers of cirrus in the center of the photograph, with the lower cirrus trending north-south and the upper (probably associated with a jet stream) trending east-west. Photo credit: NASA
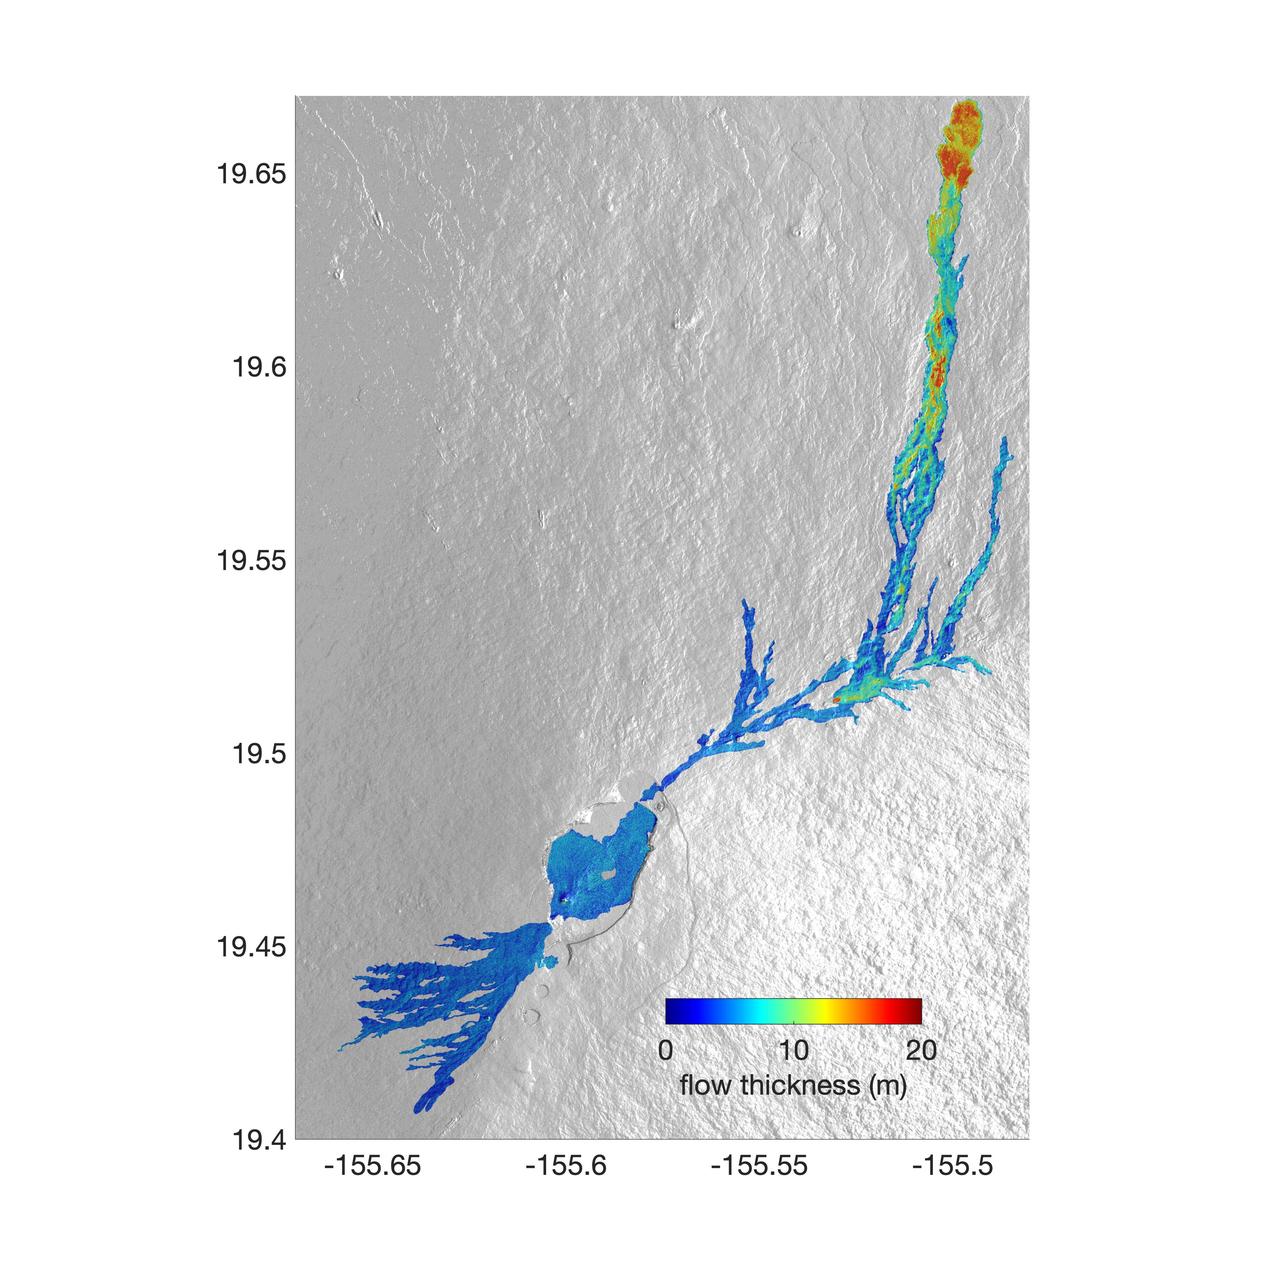
The world's largest active volcano – Hawaii's Mauna Loa – had been quiet for 38 years. But in 2022, the volcano began to stir, showing increased numbers of small earthquakes and subtle swelling of certain land surfaces in September. On November 27, fountains of lava began spurting from the mountain's Northeast Rift Zone and streams of molten rock flowed to the north. Ten days into the eruption, a NASA aircraft conducted its first flight over the erupting volcano. It carried NASA's Uninhabited Aerial Vehicle Synthetic Aperture Radar (UAVSAR) system, which was used to map the volcano's topography in fine detail with a Ka-band instrument called GLISTIN-A. Teams from NASA's Jet Propulsion Laboratory and the United States Geological Survey (USGS) used data from that sensor to map the thickness of those flows during a series of flights on December 7, 8, and 10. The map above shows the thickness of the lava flows during the flight on December 7, the day before USGS scientists noticed a significant decline in the pace of the eruption. A few days later, they declared the eruption had stopped. The map shows the thickness of the lava flows in the summit caldera, where the eruption began, and of lava flows on Mauna Loa's northeastern flank. The color variation from blue to orange indicates increasing lava flow thickness. A maximum thickness of roughly 25 meters (82 feet) is shown, though values exceeding 40 meters (131 feet) were observed in some areas. The thickening at the northern end of the flow is due to lava accumulating away from the vent, along with a flattening of the terrain at the saddle between the Mauna Loa and Mauna Kea volcanoes. By comparing to pre-eruption maps of this area's topography, including GLISTIN-A data collected in 2017, the USGS researchers were able to calculate the size and volume of the lava flow. Over the roughly 14-day eruption, Mauna Loa erupted more than 8.8 billion cubic feet (230 million cubic meters) along a lava flow that extended up to 16.5 miles (19.5 kilometers) from the vent, according to the USGS. The UAVSAR operates from a pod mounted beneath a crewed Gulfstream III jet from NASA's Armstrong Flight Research Center in California. Repeated topographic maps generated with each flight reveal the progression and thickening of lava with time – important information for scientific understanding of volcano processes and for emergency response. For the Mauna Loa science flights, the instrument suite featured an additional state-of-the-art imaging tool: the synthetic aperture radar-fusion optical short-wave infrared (SAR-Fusion Optical/SWIR) camera system. SAR-Fusion collects data over the same ground swath as GLISTIN-A to map land surface changes using optical/SWIR photogrammetry methods. GLISTIN-A was designed to provide all-weather, high-resolution surface topography not available through existing lidar or radar sensors. GLISTIN-A was originally demonstrated as a new radar technique for mapping ice surfaces. Science demonstration flights began in 2013 over alpine glaciers and sea ice in Alaska, and a floodplain in California. Its applications have since expanded to other areas, such as snow accumulation and volcano dynamics. The first time the instrument was deployed for volcano response was in 2018 during the three-month eruption of Kilauea. The success of that operation paved the way for deployment to Mauna Loa. https://photojournal.jpl.nasa.gov/catalog/PIA25526