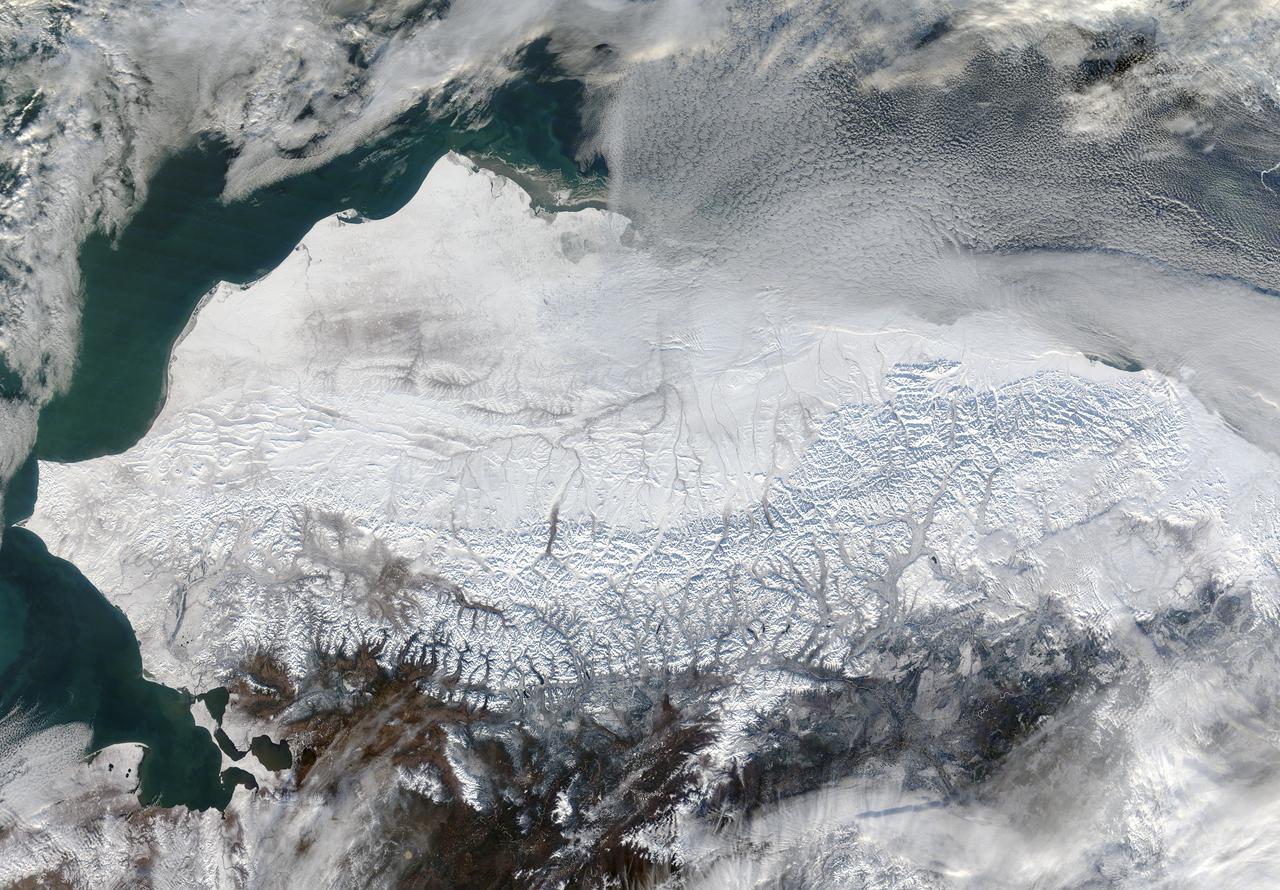
As autumn colors moved across much of the lower forty-eight states in mid-October 2015, winter weather had already arrived in Alaska. The Moderate Resolution Imaging Spectroradiometer (MODIS) aboard NASA’s Terra satellite captured this true-color image of the icy scene on October 16 as it passed over the region. Point Barrow, the northern-most location in the United States sits between the Chukchi Sea (west) and the Beaufort Sea on the east. The rugged peaks of the Brooks Range can be seen along the southern section of the image. North of the Brooks Range the land is almost entirely covered with snow; to the south the tan and browns visible between snow marks uncovered land. Sea ice lies over the waters near the coasts of much of Alaska’s North Slope, especially east of Point Barrow. White cloud banks are notable in the northeast and southeast sections of the image. Credit: NASA/GSFC/Jeff Schmaltz/MODIS Land Rapid Response Team <b><a href="http://www.nasa.gov/audience/formedia/features/MP_Photo_Guidelines.html" rel="nofollow">NASA image use policy.</a></b> <b><a href="http://www.nasa.gov/centers/goddard/home/index.html" rel="nofollow">NASA Goddard Space Flight Center</a></b> enables NASA’s mission through four scientific endeavors: Earth Science, Heliophysics, Solar System Exploration, and Astrophysics. Goddard plays a leading role in NASA’s accomplishments by contributing compelling scientific knowledge to advance the Agency’s mission. <b>Follow us on <a href="http://twitter.com/NASAGoddardPix" rel="nofollow">Twitter</a></b> <b>Like us on <a href="http://www.facebook.com/pages/Greenbelt-MD/NASA-Goddard/395013845897?ref=tsd" rel="nofollow">Facebook</a></b> <b>Find us on <a href="http://instagrid.me/nasagoddard/?vm=grid" rel="nofollow">Instagram</a></b>
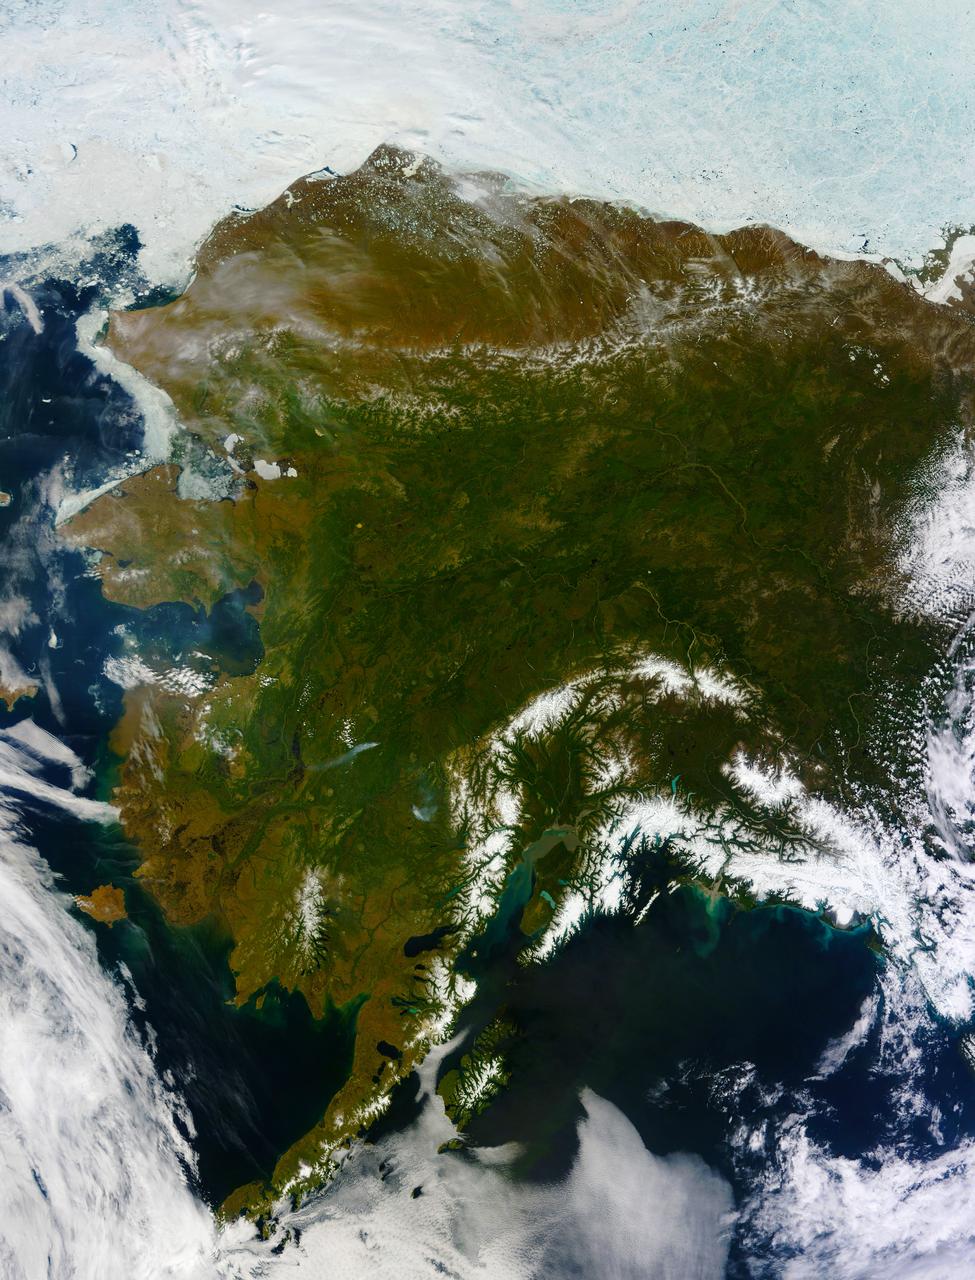
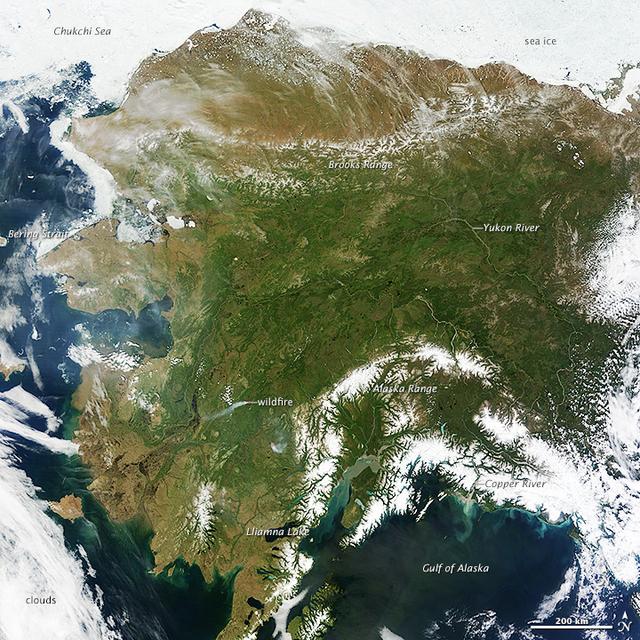
On most days, relentless rivers of clouds wash over Alaska, obscuring most of the state’s 6,640 miles (10,690 kilometers) of coastline and 586,000 square miles (1,518,000 square kilometers) of land. The south coast of Alaska even has the dubious distinction of being the cloudiest region of the United States, with some locations averaging more than 340 cloudy days per year. That was certainly not the case on June 17, 2013, the date that the Moderate Resolution Imaging Spectroradiometer (MODIS) on NASA’s Terra satellite acquired this rare, nearly cloud-free view of the state. The absence of clouds exposed a striking tapestry of water, ice, land, forests, and even wildfires. Snow-covered mountains such as the Alaska Range and Chugach Mountains were visible in southern Alaska, while the arc of mountains that make up the Brooks Range dominated the northern part of the state. The Yukon River—the longest in Alaska and the third longest in the United States—wound its way through the green boreal forests that inhabit the interior of the state. Plumes of sediment and glacial dust poured into the Gulf of Alaska from the Copper River. And Iliamna Lake, the largest in Alaska, was ice free. The same ridge of high pressure that cleared Alaska’s skies also brought stifling temperatures to many areas accustomed to chilly June days. Talkeetna, a town about 100 miles north of Anchorage, saw temperatures reach 96°F (36°C) on June 17. Other towns in southern Alaska set all-time record highs, including Cordova, Valez, and Seward. The high temperatures also helped fuel wildfires and hastened the breakup of sea ice in the Chukchi Sea. NASA image courtesy Jeff Schmaltz, LANCE MODIS Rapid Response Team at NASA GSFC. Caption by Adam Voiland. Instrument: Terra - MODIS More info: <a href="http://1.usa.gov/102MAEj" rel="nofollow">1.usa.gov/102MAEj</a> Credit: <b><a href="http://www.earthobservatory.nasa.gov/" rel="nofollow"> NASA Earth Observatory</a></b> <b><a href="http://www.nasa.gov/audience/formedia/features/MP_Photo_Guidelines.html" rel="nofollow">NASA image use policy.</a></b> <b><a href="http://www.nasa.gov/centers/goddard/home/index.html" rel="nofollow">NASA Goddard Space Flight Center</a></b> enables NASA’s mission through four scientific endeavors: Earth Science, Heliophysics, Solar System Exploration, and Astrophysics. Goddard plays a leading role in NASA’s accomplishments by contributing compelling scientific knowledge to advance the Agency’s mission. <b>Follow us on <a href="http://twitter.com/NASA_GoddardPix" rel="nofollow">Twitter</a></b> <b>Like us on <a href="http://www.facebook.com/pages/Greenbelt-MD/NASA-Goddard/395013845897?ref=tsd" rel="nofollow">Facebook</a></b> <b>Find us on <a href="http://instagram.com/nasagoddard?vm=grid" rel="nofollow">Instagram</a></b>
On most days, relentless rivers of clouds wash over Alaska, obscuring most of the state’s 6,640 miles (10,690 kilometers) of coastline and 586,000 square miles (1,518,000 square kilometers) of land. The south coast of Alaska even has the dubious distinction of being the cloudiest region of the United States, with some locations averaging more than 340 cloudy days per year. That was certainly not the case on June 17, 2013, the date that the Moderate Resolution Imaging Spectroradiometer (MODIS) on NASA’s Terra satellite acquired this rare, nearly cloud-free view of the state. The absence of clouds exposed a striking tapestry of water, ice, land, forests, and even wildfires. Snow-covered mountains such as the Alaska Range and Chugach Mountains were visible in southern Alaska, while the arc of mountains that make up the Brooks Range dominated the northern part of the state. The Yukon River—the longest in Alaska and the third longest in the United States—wound its way through the green boreal forests that inhabit the interior of the state. Plumes of sediment and glacial dust poured into the Gulf of Alaska from the Copper River. And Iliamna Lake, the largest in Alaska, was ice free. The same ridge of high pressure that cleared Alaska’s skies also brought stifling temperatures to many areas accustomed to chilly June days. Talkeetna, a town about 100 miles north of Anchorage, saw temperatures reach 96°F (36°C) on June 17. Other towns in southern Alaska set all-time record highs, including Cordova, Valez, and Seward. The high temperatures also helped fuel wildfires and hastened the breakup of sea ice in the Chukchi Sea. NASA image courtesy Jeff Schmaltz, LANCE MODIS Rapid Response Team at NASA GSFC. Caption by Adam Voiland. Instrument: Terra - MODIS More info: <a href="http://1.usa.gov/102MAEj" rel="nofollow">1.usa.gov/102MAEj</a> Credit: <b><a href="http://www.earthobservatory.nasa.gov/" rel="nofollow"> NASA Earth Observatory</a></b> <b><a href="http://www.nasa.gov/audience/formedia/features/MP_Photo_Guidelines.html" rel="nofollow">NASA image use policy.</a></b> <b><a href="http://www.nasa.gov/centers/goddard/home/index.html" rel="nofollow">NASA Goddard Space Flight Center</a></b> enables NASA’s mission through four scientific endeavors: Earth Science, Heliophysics, Solar System Exploration, and Astrophysics. Goddard plays a leading role in NASA’s accomplishments by contributing compelling scientific knowledge to advance the Agency’s mission. <b>Follow us on <a href="http://twitter.com/NASA_GoddardPix" rel="nofollow">Twitter</a></b> <b>Like us on <a href="http://www.facebook.com/pages/Greenbelt-MD/NASA-Goddard/395013845897?ref=tsd" rel="nofollow">Facebook</a></b> <b>Find us on <a href="http://instagram.com/nasagoddard?vm=grid" rel="nofollow">Instagram</a></b>
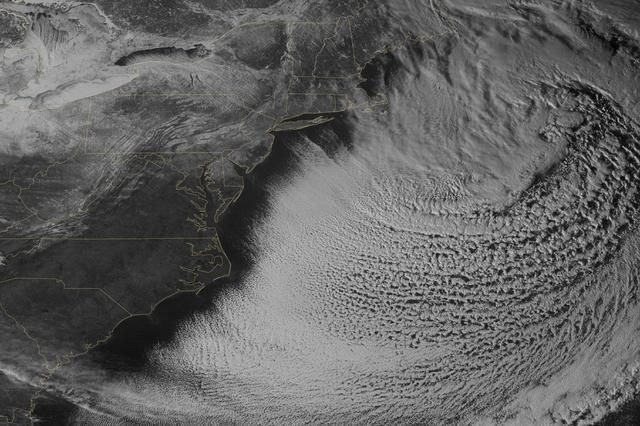
Yet another potent winter storm battered the northeastern United States on February 14-15, 2015. The nor'easter brought 12 to 20 inches (30 to 50 centimeters) of snow across much of eastern New England, along with tropical storm force winds over 60 miles (100 kilometers) per hour. The latest snowfall pushed Boston to its highest monthly total on record—58 inches and counting—and its third highest yearly snow total. This image was acquired by the GOES-East weather satellite at 3:45 p.m. Eastern Standard Time (20:45 Universal Time) on February 15, 2015, as the storm was mostly out to sea. Note the comma-like shape of the nor'easter, which spawned blizzard conditions at coastal locations. The official meteorological definition of a blizzard is three consecutive hours of falling or blowing snow with winds gusting above 35 miles (56 kilometers) per hour and visibility below one-fourth of a mile (0.4 kilometers). As of February 17, the snow depth near Boston was greater than in all but two reported locations in Alaska. It was significantly higher than the notoriously snowy states of Michigan, Wisconsin, and Minnesota. Only Buffalo, New York, had a higher snow pack. On February 16-17, more snow and ice fell across the eastern United States from northern Mississippi all the way to Maine. Read more: <a href="http://1.usa.gov/19wR4LI" rel="nofollow">1.usa.gov/19wR4LI</a> Via: <b><a href="http://www.earthobservatory.nasa.gov/" rel="nofollow"> NASA Earth Observatory</a></b> GOES image courtesy of the NASA/NOAA GOES Project Science team. Terra MODIS image by Jeff Schmaltz, LANCE/EOSDIS Rapid Response at NASA Goddard Space Flight Center. Caption by Mike Carlowicz. <b><a href="http://www.nasa.gov/audience/formedia/features/MP_Photo_Guidelines.html" rel="nofollow">NASA image use policy.</a></b> <b><a href="http://www.nasa.gov/centers/goddard/home/index.html" rel="nofollow">NASA Goddard Space Flight Center</a></b> enables NASA’s mission through four scientific endeavors: Earth Science, Heliophysics, Solar System Exploration, and Astrophysics. Goddard plays a leading role in NASA’s accomplishments by contributing compelling scientific knowledge to advance the Agency’s mission. <b>Follow us on <a href="http://twitter.com/NASAGoddardPix" rel="nofollow">Twitter</a></b> <b>Like us on <a href="http://www.facebook.com/pages/Greenbelt-MD/NASA-Goddard/395013845897?ref=tsd" rel="nofollow">Facebook</a></b> <b>Find us on <a href="http://instagram.com/nasagoddard?vm=grid" rel="nofollow">Instagram</a></b>
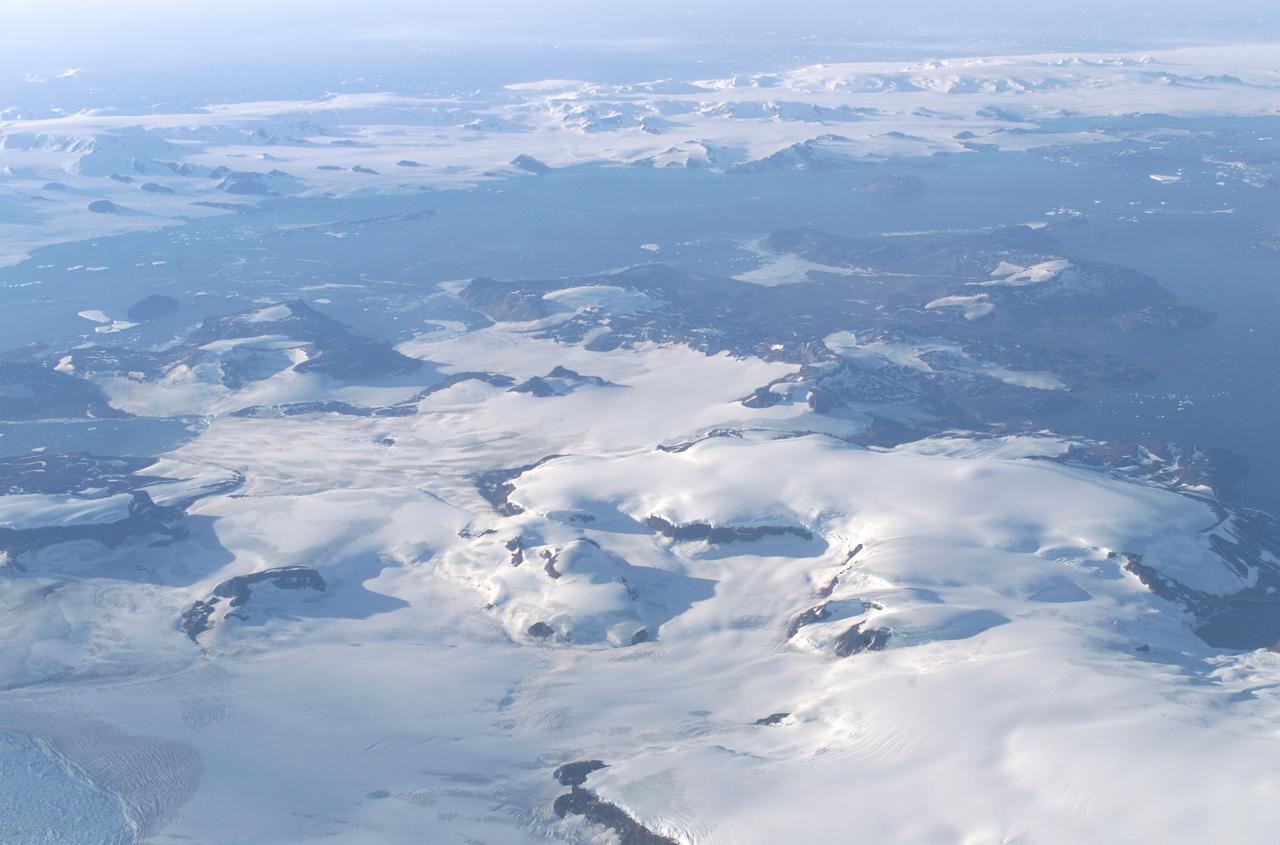
James Ross Island captured by NASA photographer James Ross(no relation), from NASA's DC-8 aircraft during an AirSAR 2004 mission over the Antarctic Peninsula. James Ross Island, named for 19th century British polar explorer Sir James Clark Ross, is located at the northern tip of the Antarctic Peninsula. The island is about 1500 m high and 40-60 km wide. In recent decades, the area has experienced significant atmospheric warming (about 2 degrees C since 1950), which has triggered a vast and spectacular retreat of its floating ice shelves, glacier reduction, a decrease in permanent snow cover and a lengthening of the melt season. AirSAR 2004 is a three-week expedition in Central and South America by an international team of scientists that is using an all-weather imaging tool, called the Airborne Synthetic Aperture Radar (AirSAR), located onboard NASA's DC-8 airborne laboratory. Scientists from many parts of the world are combining ground research with NASA's AirSAR technology to improve and expand on the quality of research they are able to conduct. These photos are from the DC-8 aircraft while flying an AirSAR mission over Antarctica. The Antarctic Peninsula is more similar to Alaska and Patagonia than to the rest of the Antarctic continent. It is drained by fast glaciers, receives abundant precipitation, and melts significantly in the summer months. This region is being studied by NASA using a DC-8 equipped with the Airborne Synthetic Aperture Radar developed by scientists from NASA’s Jet Propulsion Laboratory. AirSAR will provide a baseline model and unprecedented mapping of the region. This data will make it possible to determine whether the warming trend is slowing, continuing or accelerating. AirSAR will also provide reliable information on ice shelf thickness to measure the contribution of the glaciers to sea level.

The Visible Infrared Imaging Radiometer Suite (VIIRS) on the Suomi NPP satellite captured this view of extensive sea-ice fracturing off the northern coast of Alaska. The event began in late-January and spread west toward Banks Island throughout February and March 2013. Visualizations of the Arctic often give the impression that the ice cap is a continuous sheet of stationary, floating ice. In fact, it is a collection of smaller pieces that constantly shift, crack, and grind against one another as they are jostled by winds and ocean currents. Especially during the summer—but even during the height of winter—cracks—or leads—open up between pieces of ice. That was what was happening on the left side of the animation (seen here: <a href="http://bit.ly/10kE7sh" rel="nofollow">bit.ly/10kE7sh</a>) in late January. A high-pressure weather system was parked over the region, producing warmer temperatures and winds that flowed in a southwesterly direction. That fueled the Beaufort Gyre, a wind-driven ocean current that flows clockwise. The gyre was the key force pulling pieces of ice west past Point Barrow, the northern nub of Alaska that protrudes into the Beaufort Sea. “A fracturing event in this area is not unusual because the Beaufort Gyre tends to push ice away from Banks Island and the Canadian Archipelago,” explained Walt Meier of the National Snow & Ice Data Center (NSIDC). “Point Barrow can act like a ‘pin point’ where the ice catches and fractures to the north and east.” In February, however, a series of storms passing over central Alaska exacerbated the fracturing. Strong westerly winds prompted several large pieces of ice to break away in an arc-shaped wave that moved progressively east. By the end of February, large pieces of ice had fractured all the way to the western coast of Banks Island, a distance of about 1,000 kilometers (600 miles). The data used to create the animation came from the longwave infrared (thermal) portion of the electromagnetic spectrum, so the animation illustrates how much heat the surface was emitting as VIIRS surveyed the area. Cooler areas (sea ice) appear white, while warmer areas (open water) are dark. The light gray plume near the cracks is warmer, moister air escaping from the ocean and blowing downwind. Clouds do not show up well in the VIIRS thermal band, so the storms that fueled the fracturing are not readily visible. While fracturing events are common, few events sprawl across such a large area or produce cracks as long and wide as those seen here. The age of the sea ice in this area was one of the key reasons this event became so widespread. “The region is covered almost completely by seasonal or first-year ice—ice that has formed since last September,” said Meier. “This ice is thinner and weaker than the older, multi-year ice, so it responds more readily to winds and is more easily broken up.” NASA Earth Observatory images by Jesse Allen using VIIRS day-night band data from the Suomi National Polar-orbiting Partnership. Suomi NPP is the result of a partnership between NASA, the National Oceanic and Atmospheric Administration, and the Department of Defense. Caption by Adam Voiland. Instrument: Suomi NPP - VIIRS For more info go to: <a href="http://earthobservatory.nasa.gov/IOTD/view.php?id=80752" rel="nofollow">earthobservatory.nasa.gov/IOTD/view.php?id=80752</a> Credit: <b><a href="http://www.earthobservatory.nasa.gov/" rel="nofollow"> NASA Earth Observatory</a></b> <b><a href="http://www.nasa.gov/audience/formedia/features/MP_Photo_Guidelines.html" rel="nofollow">NASA image use policy.</a></b> <b><a href="http://www.nasa.gov/centers/goddard/home/index.html" rel="nofollow">NASA Goddard Space Flight Center</a></b> enables NASA’s mission through four scientific endeavors: Earth Science, Heliophysics, Solar System Exploration, and Astrophysics. Goddard plays a leading role in NASA’s accomplishments by contributing compelling scientific knowledge to advance the Agency’s mission. <b>Follow us on <a href="http://twitter.com/NASA_GoddardPix" rel="nofollow">Twitter</a></b> <b>Like us on <a href="http://www.facebook.com/pages/Greenbelt-MD/NASA-Goddard/395013845897?ref=tsd" rel="nofollow">Facebook</a></b> <b>Find us on <a href="http://instagram.com/nasagoddard?vm=grid" rel="nofollow">Instagram</a></b>

The Visible Infrared Imaging Radiometer Suite (VIIRS) on the Suomi NPP satellite captured this view of extensive sea-ice fracturing off the northern coast of Alaska. The event began in late-January and spread west toward Banks Island throughout February and March 2013. Visualizations of the Arctic often give the impression that the ice cap is a continuous sheet of stationary, floating ice. In fact, it is a collection of smaller pieces that constantly shift, crack, and grind against one another as they are jostled by winds and ocean currents. Especially during the summer—but even during the height of winter—cracks—or leads—open up between pieces of ice. That was what was happening on the left side of the animation (seen here: <a href="http://bit.ly/10kE7sh" rel="nofollow">bit.ly/10kE7sh</a>) in late January. A high-pressure weather system was parked over the region, producing warmer temperatures and winds that flowed in a southwesterly direction. That fueled the Beaufort Gyre, a wind-driven ocean current that flows clockwise. The gyre was the key force pulling pieces of ice west past Point Barrow, the northern nub of Alaska that protrudes into the Beaufort Sea. “A fracturing event in this area is not unusual because the Beaufort Gyre tends to push ice away from Banks Island and the Canadian Archipelago,” explained Walt Meier of the National Snow & Ice Data Center (NSIDC). “Point Barrow can act like a ‘pin point’ where the ice catches and fractures to the north and east.” In February, however, a series of storms passing over central Alaska exacerbated the fracturing. Strong westerly winds prompted several large pieces of ice to break away in an arc-shaped wave that moved progressively east. By the end of February, large pieces of ice had fractured all the way to the western coast of Banks Island, a distance of about 1,000 kilometers (600 miles). The data used to create the animation came from the longwave infrared (thermal) portion of the electromagnetic spectrum, so the animation illustrates how much heat the surface was emitting as VIIRS surveyed the area. Cooler areas (sea ice) appear white, while warmer areas (open water) are dark. The light gray plume near the cracks is warmer, moister air escaping from the ocean and blowing downwind. Clouds do not show up well in the VIIRS thermal band, so the storms that fueled the fracturing are not readily visible. While fracturing events are common, few events sprawl across such a large area or produce cracks as long and wide as those seen here. The age of the sea ice in this area was one of the key reasons this event became so widespread. “The region is covered almost completely by seasonal or first-year ice—ice that has formed since last September,” said Meier. “This ice is thinner and weaker than the older, multi-year ice, so it responds more readily to winds and is more easily broken up.” NASA Earth Observatory images by Jesse Allen using VIIRS day-night band data from the Suomi National Polar-orbiting Partnership. Suomi NPP is the result of a partnership between NASA, the National Oceanic and Atmospheric Administration, and the Department of Defense. Caption by Adam Voiland. Instrument: Suomi NPP - VIIRS For more info go to: <a href="http://earthobservatory.nasa.gov/IOTD/view.php?id=80752" rel="nofollow">earthobservatory.nasa.gov/IOTD/view.php?id=80752</a> Credit: <b><a href="http://www.earthobservatory.nasa.gov/" rel="nofollow"> NASA Earth Observatory</a></b> <b><a href="http://www.nasa.gov/audience/formedia/features/MP_Photo_Guidelines.html" rel="nofollow">NASA image use policy.</a></b> <b><a href="http://www.nasa.gov/centers/goddard/home/index.html" rel="nofollow">NASA Goddard Space Flight Center</a></b> enables NASA’s mission through four scientific endeavors: Earth Science, Heliophysics, Solar System Exploration, and Astrophysics. Goddard plays a leading role in NASA’s accomplishments by contributing compelling scientific knowledge to advance the Agency’s mission. <b>Follow us on <a href="http://twitter.com/NASA_GoddardPix" rel="nofollow">Twitter</a></b> <b>Like us on <a href="http://www.facebook.com/pages/Greenbelt-MD/NASA-Goddard/395013845897?ref=tsd" rel="nofollow">Facebook</a></b> <b>Find us on <a href="http://instagram.com/nasagoddard?vm=grid" rel="nofollow">Instagram</a></b>

The Visible Infrared Imaging Radiometer Suite (VIIRS) on the Suomi NPP satellite captured this view of extensive sea-ice fracturing off the northern coast of Alaska. The event began in late-January and spread west toward Banks Island throughout February and March 2013. Visualizations of the Arctic often give the impression that the ice cap is a continuous sheet of stationary, floating ice. In fact, it is a collection of smaller pieces that constantly shift, crack, and grind against one another as they are jostled by winds and ocean currents. Especially during the summer—but even during the height of winter—cracks—or leads—open up between pieces of ice. That was what was happening on the left side of the animation (seen here: <a href="http://bit.ly/10kE7sh" rel="nofollow">bit.ly/10kE7sh</a>) in late January. A high-pressure weather system was parked over the region, producing warmer temperatures and winds that flowed in a southwesterly direction. That fueled the Beaufort Gyre, a wind-driven ocean current that flows clockwise. The gyre was the key force pulling pieces of ice west past Point Barrow, the northern nub of Alaska that protrudes into the Beaufort Sea. “A fracturing event in this area is not unusual because the Beaufort Gyre tends to push ice away from Banks Island and the Canadian Archipelago,” explained Walt Meier of the National Snow & Ice Data Center (NSIDC). “Point Barrow can act like a ‘pin point’ where the ice catches and fractures to the north and east.” In February, however, a series of storms passing over central Alaska exacerbated the fracturing. Strong westerly winds prompted several large pieces of ice to break away in an arc-shaped wave that moved progressively east. By the end of February, large pieces of ice had fractured all the way to the western coast of Banks Island, a distance of about 1,000 kilometers (600 miles). The data used to create the animation came from the longwave infrared (thermal) portion of the electromagnetic spectrum, so the animation illustrates how much heat the surface was emitting as VIIRS surveyed the area. Cooler areas (sea ice) appear white, while warmer areas (open water) are dark. The light gray plume near the cracks is warmer, moister air escaping from the ocean and blowing downwind. Clouds do not show up well in the VIIRS thermal band, so the storms that fueled the fracturing are not readily visible. While fracturing events are common, few events sprawl across such a large area or produce cracks as long and wide as those seen here. The age of the sea ice in this area was one of the key reasons this event became so widespread. “The region is covered almost completely by seasonal or first-year ice—ice that has formed since last September,” said Meier. “This ice is thinner and weaker than the older, multi-year ice, so it responds more readily to winds and is more easily broken up.” NASA Earth Observatory images by Jesse Allen using VIIRS day-night band data from the Suomi National Polar-orbiting Partnership. Suomi NPP is the result of a partnership between NASA, the National Oceanic and Atmospheric Administration, and the Department of Defense. Caption by Adam Voiland. Instrument: Suomi NPP - VIIRS For more info go to: <a href="http://earthobservatory.nasa.gov/IOTD/view.php?id=80752" rel="nofollow">earthobservatory.nasa.gov/IOTD/view.php?id=80752</a> Credit: <b><a href="http://www.earthobservatory.nasa.gov/" rel="nofollow"> NASA Earth Observatory</a></b> <b><a href="http://www.nasa.gov/audience/formedia/features/MP_Photo_Guidelines.html" rel="nofollow">NASA image use policy.</a></b> <b><a href="http://www.nasa.gov/centers/goddard/home/index.html" rel="nofollow">NASA Goddard Space Flight Center</a></b> enables NASA’s mission through four scientific endeavors: Earth Science, Heliophysics, Solar System Exploration, and Astrophysics. Goddard plays a leading role in NASA’s accomplishments by contributing compelling scientific knowledge to advance the Agency’s mission. <b>Follow us on <a href="http://twitter.com/NASA_GoddardPix" rel="nofollow">Twitter</a></b> <b>Like us on <a href="http://www.facebook.com/pages/Greenbelt-MD/NASA-Goddard/395013845897?ref=tsd" rel="nofollow">Facebook</a></b> <b>Find us on <a href="http://instagram.com/nasagoddard?vm=grid" rel="nofollow">Instagram</a></b>
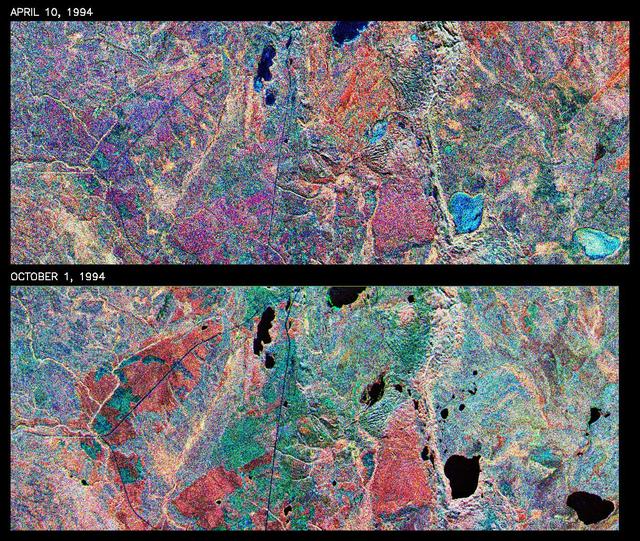
This is a comparison of images over Prince Albert, produced by NASA Spaceborne Imaging Radar-C and X-band Synthetic Aperture Radar aboard the space shuttle Endeavour on its 20th orbit on April 10, 1994. The area is centered at 53.91 degrees north latitude and 104.69 degrees west longitude and is located 40 kilometers (25 miles) north and 30 kilometers (18.5 miles) east of the town of Prince Albert in the Saskatchewan province of Canada. The image covers the area east of Candle Lake, between the gravel highway of 120 and west of highway 106. The area imaged is near the southern limit of the boreal forest. The boreal forest of North America is a continuous vegetation belt at high latitudes stretching across the continent from the Atlantic shoreline of central Labrador and then westward across Canada to the interior mountains and central coastal plains of Alaska. The forest is also part of a larger northern hemisphere circumpolar boreal forest belt. Coniferous trees dominate the entire forest but deciduous trees are also present. During the month of April, the forest experiences seasonal changes from a frozen condition to a thawed condition. The trees are completely frozen over the winter season and the forest floor is covered by snow. As the average temperature rises in the spring, the trees are thawed and the snow melts. This transition has an impact on the rate of moisture evaporation and release of carbon dioxide into the atmosphere. In late September and early October, the boreal forest experiences a relatively different seasonal change. At this time, the leaves on deciduous trees start changing color and dropping off. The soil and trees are quite often moist due to frequent rainfall and cloud cover. The evaporation of moisture and carbon dioxide into the atmosphere also diminishes at this time. SIR-C/X-SAR is sensitive to the moisture of soil and vegetation and can sense this freeze-thaw cycle and the summer-fall seasonal transition over forested areas in particular. Optical sensors, by contrast, are blind to these regions, which are perpetually obscured by thick cloud cover. These changes were detected by comparing the April and October color composite images of L-band data in red, C-band data in green and X-band (vertically received and transmitted) in blue. The changes in intensity of each color over lakes, various forest stands and clear cuts in the two images is striking. Lakes such as Lake Heiberg, Crabtree Lake and Williams Lake, in the right middle part of the image, are frozen in April (appearing in bright blue) and melted (appearing in black) in October. The higher intensity of blue over lakes in April is due to low penetration of the X-band (vertically received and transmitted) and the radar's high sensitivity to surface features. Forest stands also exhibit major changes between the two images. The red areas in the October image are old jack pine canopies that cause higher return at L-band because of their moist condition in late summer compared to their partially frozen condition in April (in purple). Similarly, in the areas near the middle of the image, where black spruce and mixed aspen and jack pine trees dominate, the contrast between blue in October and red and green in April is an indication that the top of the canopy (needles and branches) were frozen in April and moist in October. The changes due to deforestation by logging companies or natural fires can also be detected by comparing the images. For example, the small blue area near the intersection of Harding Road and Highway 120 is the result of logging which occurred after the April data was acquired. The surface area of clear cut is approximately 4 hectares, which is calculated from the high-resolution capability of the radar images and verified by scientists participating in field work during the mission. http://photojournal.jpl.nasa.gov/catalog/PIA01732
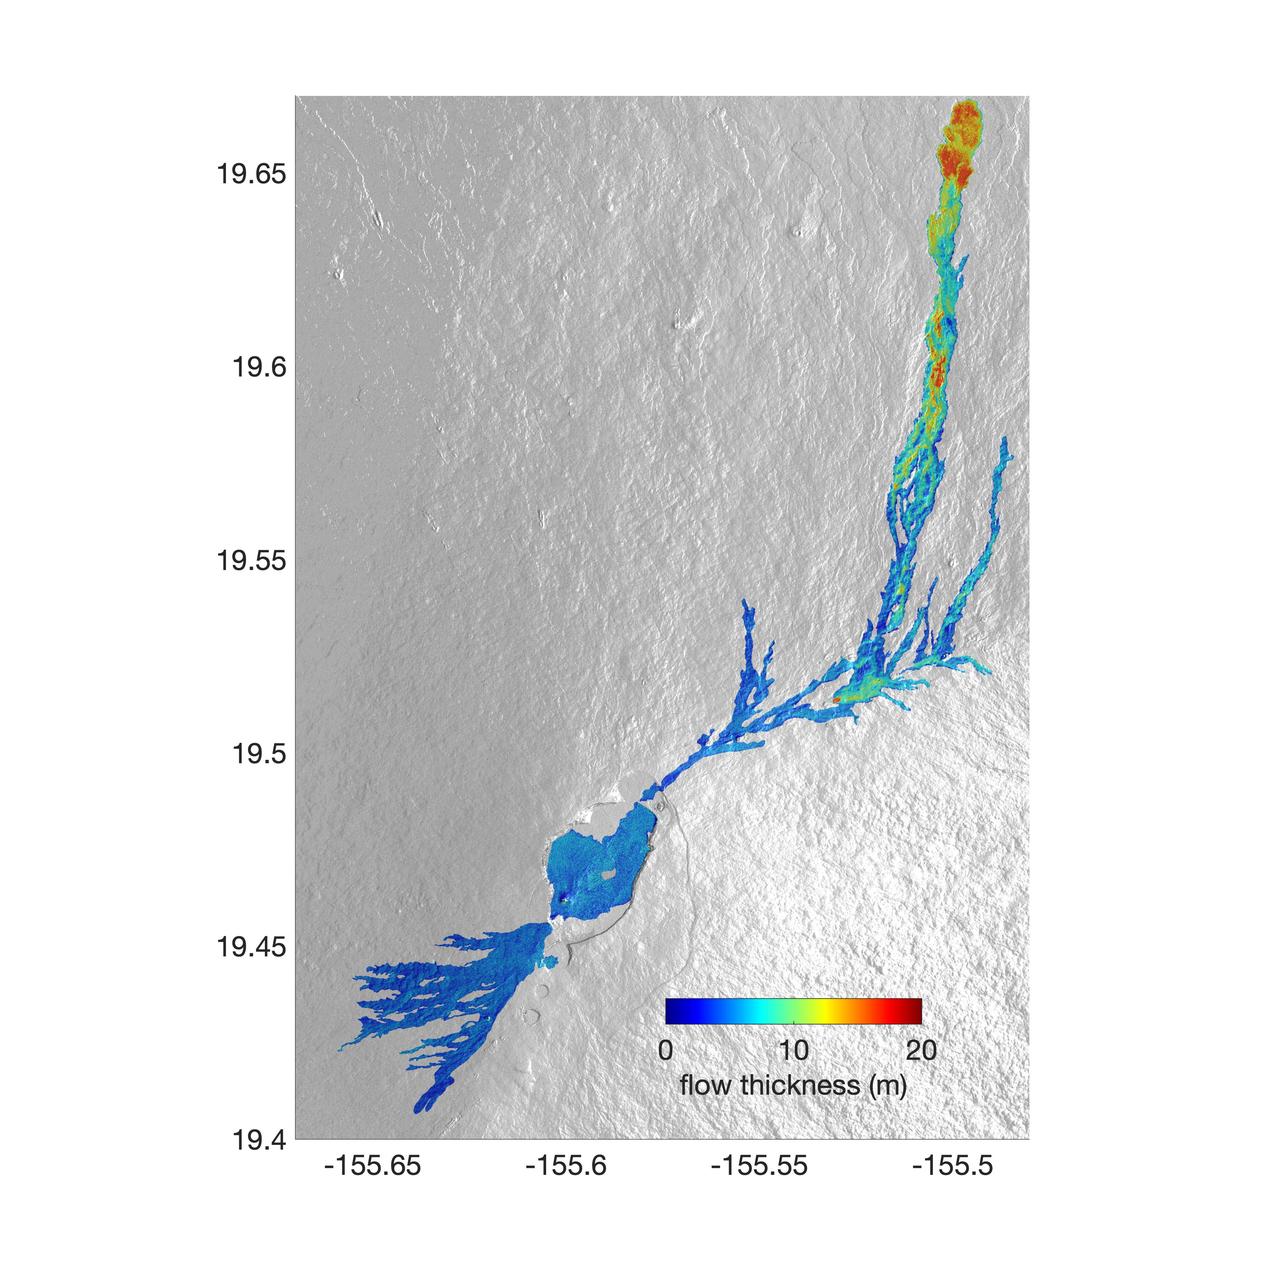
The world's largest active volcano – Hawaii's Mauna Loa – had been quiet for 38 years. But in 2022, the volcano began to stir, showing increased numbers of small earthquakes and subtle swelling of certain land surfaces in September. On November 27, fountains of lava began spurting from the mountain's Northeast Rift Zone and streams of molten rock flowed to the north. Ten days into the eruption, a NASA aircraft conducted its first flight over the erupting volcano. It carried NASA's Uninhabited Aerial Vehicle Synthetic Aperture Radar (UAVSAR) system, which was used to map the volcano's topography in fine detail with a Ka-band instrument called GLISTIN-A. Teams from NASA's Jet Propulsion Laboratory and the United States Geological Survey (USGS) used data from that sensor to map the thickness of those flows during a series of flights on December 7, 8, and 10. The map above shows the thickness of the lava flows during the flight on December 7, the day before USGS scientists noticed a significant decline in the pace of the eruption. A few days later, they declared the eruption had stopped. The map shows the thickness of the lava flows in the summit caldera, where the eruption began, and of lava flows on Mauna Loa's northeastern flank. The color variation from blue to orange indicates increasing lava flow thickness. A maximum thickness of roughly 25 meters (82 feet) is shown, though values exceeding 40 meters (131 feet) were observed in some areas. The thickening at the northern end of the flow is due to lava accumulating away from the vent, along with a flattening of the terrain at the saddle between the Mauna Loa and Mauna Kea volcanoes. By comparing to pre-eruption maps of this area's topography, including GLISTIN-A data collected in 2017, the USGS researchers were able to calculate the size and volume of the lava flow. Over the roughly 14-day eruption, Mauna Loa erupted more than 8.8 billion cubic feet (230 million cubic meters) along a lava flow that extended up to 16.5 miles (19.5 kilometers) from the vent, according to the USGS. The UAVSAR operates from a pod mounted beneath a crewed Gulfstream III jet from NASA's Armstrong Flight Research Center in California. Repeated topographic maps generated with each flight reveal the progression and thickening of lava with time – important information for scientific understanding of volcano processes and for emergency response. For the Mauna Loa science flights, the instrument suite featured an additional state-of-the-art imaging tool: the synthetic aperture radar-fusion optical short-wave infrared (SAR-Fusion Optical/SWIR) camera system. SAR-Fusion collects data over the same ground swath as GLISTIN-A to map land surface changes using optical/SWIR photogrammetry methods. GLISTIN-A was designed to provide all-weather, high-resolution surface topography not available through existing lidar or radar sensors. GLISTIN-A was originally demonstrated as a new radar technique for mapping ice surfaces. Science demonstration flights began in 2013 over alpine glaciers and sea ice in Alaska, and a floodplain in California. Its applications have since expanded to other areas, such as snow accumulation and volcano dynamics. The first time the instrument was deployed for volcano response was in 2018 during the three-month eruption of Kilauea. The success of that operation paved the way for deployment to Mauna Loa. https://photojournal.jpl.nasa.gov/catalog/PIA25526