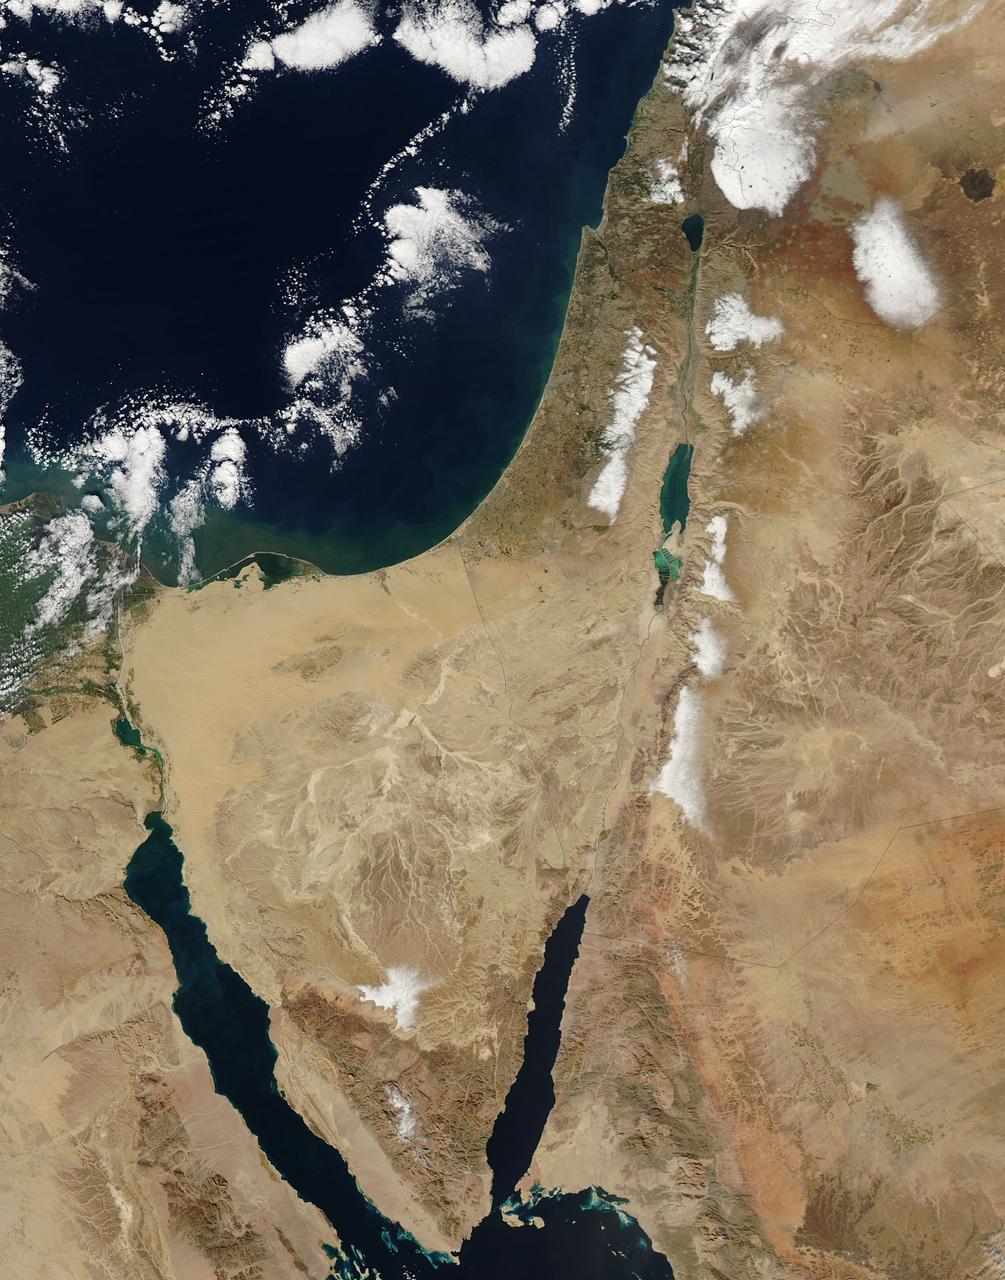
This image from the Aqua satellite's MODIS instrument taken at 11:10 UTC on December 16, 2013 shows areas of snow in Syria, Jordan, Israel and the Palestinian Territory. Snow storms in the Middle East are not frequent but not uncommon either. However, this one was unusually early in the winter and more intense than normal. The storm paralyzed Jerusalem with 30 to 50 centimeters (12 to 20 inches) of snow, knocking out power for roughly 15,000 households. The snow closed mountain roads leading into the city, effectively cutting Jerusalem off. Amman, Jordan, received about 45 cm (18 inches) of snow, and Lebanon and Syria also were unusually cold and snowy. Lower elevations near the coast received torrential rain during the storm, resulting in flooding. Some 40,000 people were forced to evacuate flooded areas in Gaza, according to the Associated Press. The floods are not visible at this scale, but tan and green plumes of sediment are visible along the Mediterranean Sea coast. Such plumes can be caused by floods and run off, though stormy, turbid waters may also bring sediment to the surface. <b><a href="http://www.nasa.gov/audience/formedia/features/MP_Photo_Guidelines.html" rel="nofollow">NASA image use policy.</a></b> <b><a href="http://www.nasa.gov/centers/goddard/home/index.html" rel="nofollow">NASA Goddard Space Flight Center</a></b> enables NASA’s mission through four scientific endeavors: Earth Science, Heliophysics, Solar System Exploration, and Astrophysics. Goddard plays a leading role in NASA’s accomplishments by contributing compelling scientific knowledge to advance the Agency’s mission. <b>Follow us on <a href="http://twitter.com/NASA_GoddardPix" rel="nofollow">Twitter</a></b> <b>Like us on <a href="http://www.facebook.com/pages/Greenbelt-MD/NASA-Goddard/395013845897?ref=tsd" rel="nofollow">Facebook</a></b> <b>Find us on <a href="http://instagram.com/nasagoddard?vm=grid" rel="nofollow">Instagram</a></b>
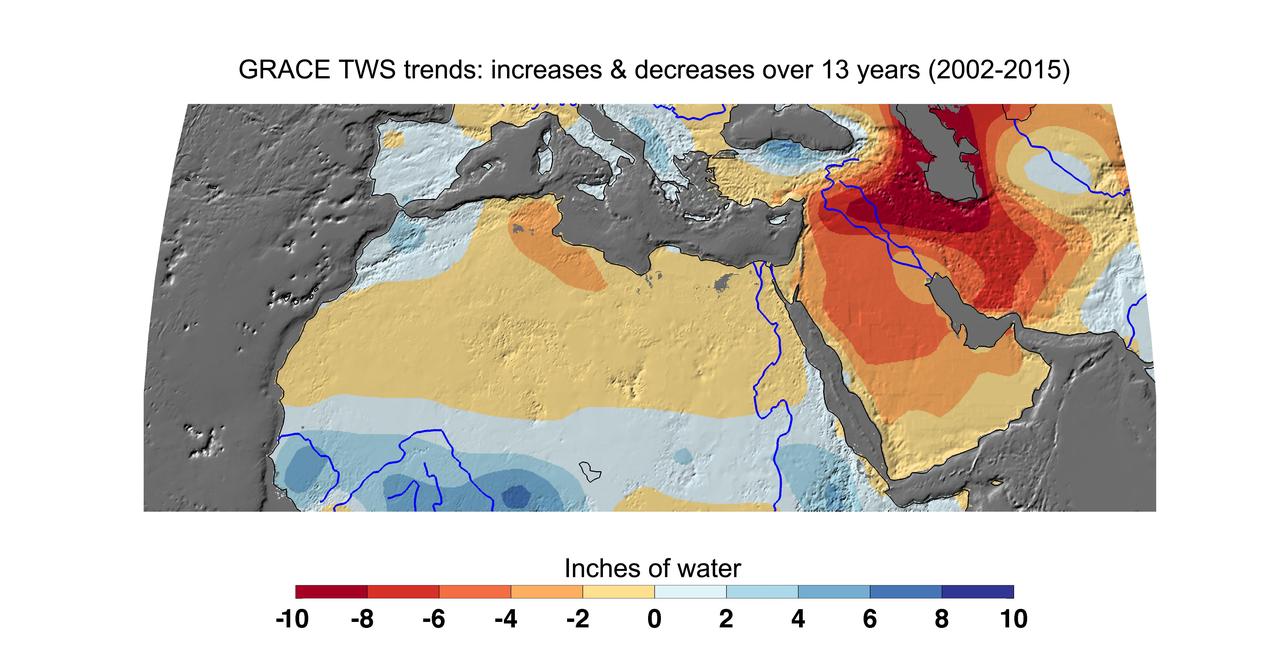
Cumulative total freshwater losses in North Africa and the Middle East from 2002 to 2015 (in inches) observed by NASA's Gravity Recovery and Climate Experiment (GRACE) mission. Total water refers to all of the snow, surface water, soil water and groundwater combined. Groundwater depletion in Turkey, Syria, Iraq and Iran, and along the Arabian Peninsula, are leading to large changes in total water storage in the region. Likewise, drought and groundwater pumping is contributing to the drying of the Caspian Sea Region. The Northwest Sahara Aquifer System, which underlies Tunisia and Libya, is also experiencing increasing water stress as shown in the map. Image updated from Voss et al., 2013. Citation of Record: Voss, K. A., J. S. Famiglietti, M. Lo, C. R. de Linage, M. Rodell and S. C. Swenson, Groundwater depletion in the Middle East from GRACE with Implications for Transboundary Water Management in the Tigris-Euphrates-Western Iran Region, Wat. Resour. Res., 49(2), 904-914, DOI: 10.1002/wrcr.20078. http://photojournal.jpl.nasa.gov/catalog/PIA20207
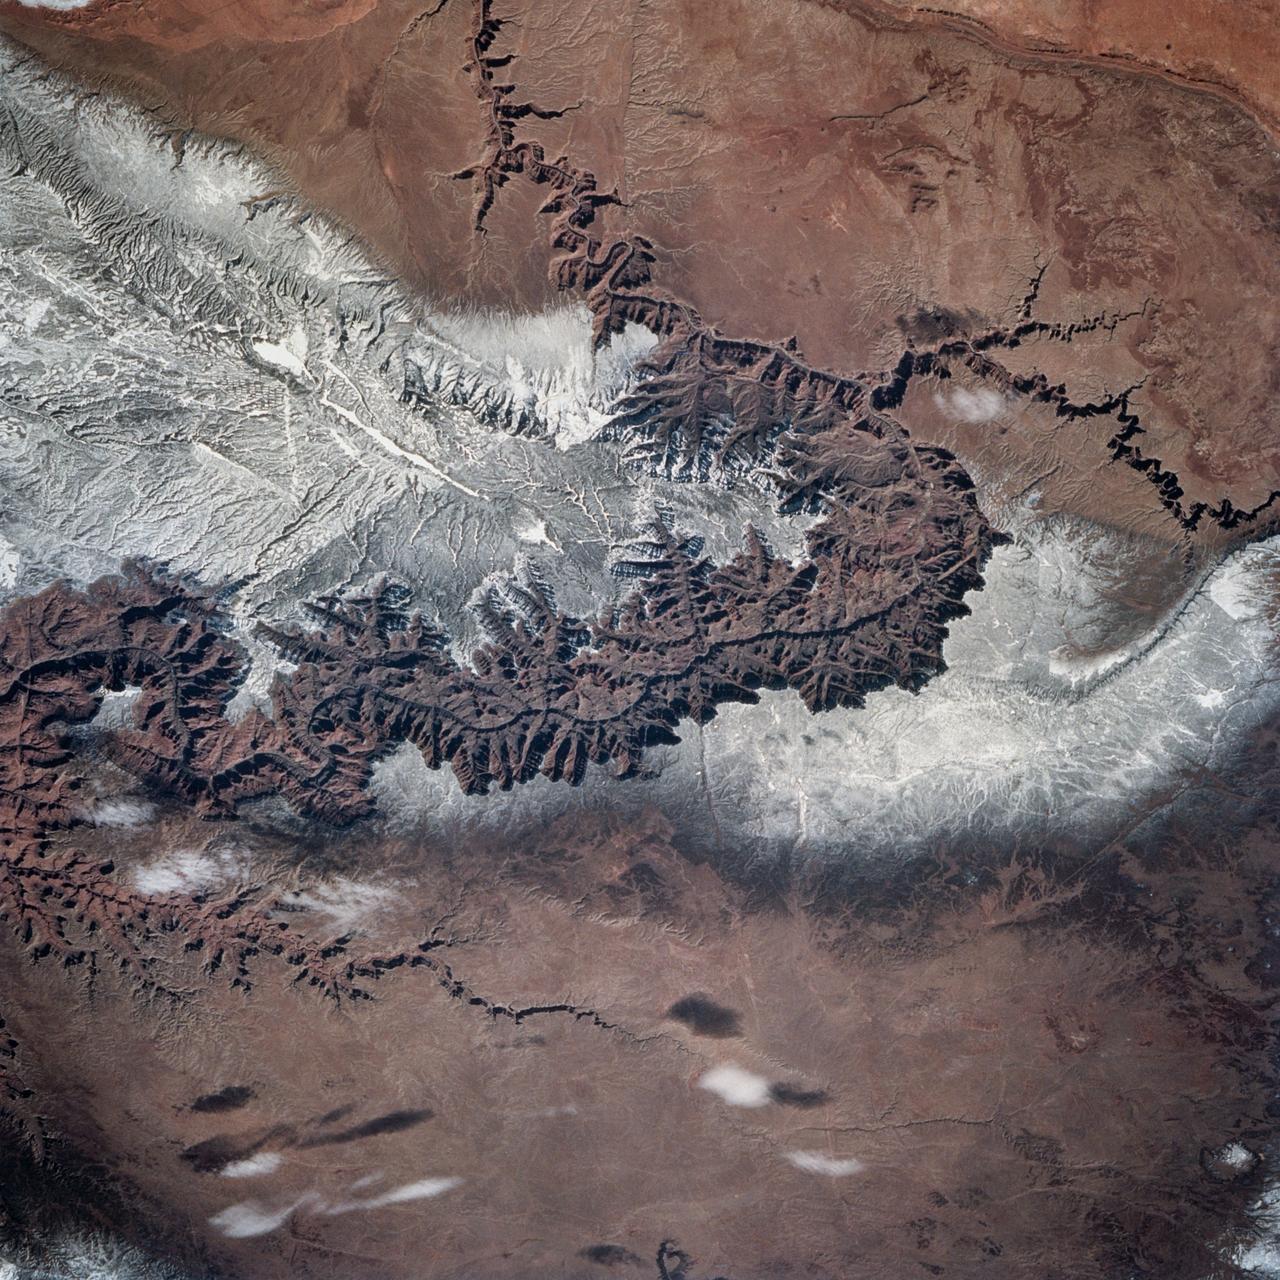
STS060-83-004 (3-11 Feb 1994) --- In this winter scene of the Grand Canyon of Arizona, the canyon is particularly well revealed because snow lies on the rims of the canyon, and exits mid-right; the Little Colorado River enters from the left, joining the Colorado just upstream of its big bend. Visitors to the South Rim can view the canyon in both the east-west and north-south reaches. The South Rim is closer to centers of transportation so that tourists mostly see the canyon from this area, that is from about 7,000 feet. The canyon floor lies at 2,000 feet in this sector. The most heavily snow covered area is the highest, reaching more than 9,000 feet (bottom right). Visitors see this protected area by hiking and mule and helicopter rides. The ecology of this part of the Colorado has been changed since the building of a lake upstream: river water is now derived from snow melt water from the bottom of the lake. This water is much colder than the water which used to flow through the canyon. According to NASA scientists, the view is unusual because the snow also reveals so well the higher country around the canyon, a swath stretching from bottom right to middle left of the view. This higher swath is an arch of uplifted rocks known as the Kaibab Plateau, raised vertically by tectonic forces in the recent geologic past. Despite this up parching, the Colorado River managed to maintain its course to the sea by cutting an ever deeper canyon into the Plateau. The white snow cover hides the fact that the Kaibab Plateau is thickly forested and thus appears dark green in summer, except in areas of clear-cutting. Since the Plateau reaches altitudes of 6 to 9,000 feet, it is both cooler and moister than the surrounding lower desert floor (top and bottom in this view) - where sparse vegetation and rocky country appear as brown colors. The zone of dark color running parallel to the snow line is all that can be seen of the pine forest on the south flanks of the Plateau.
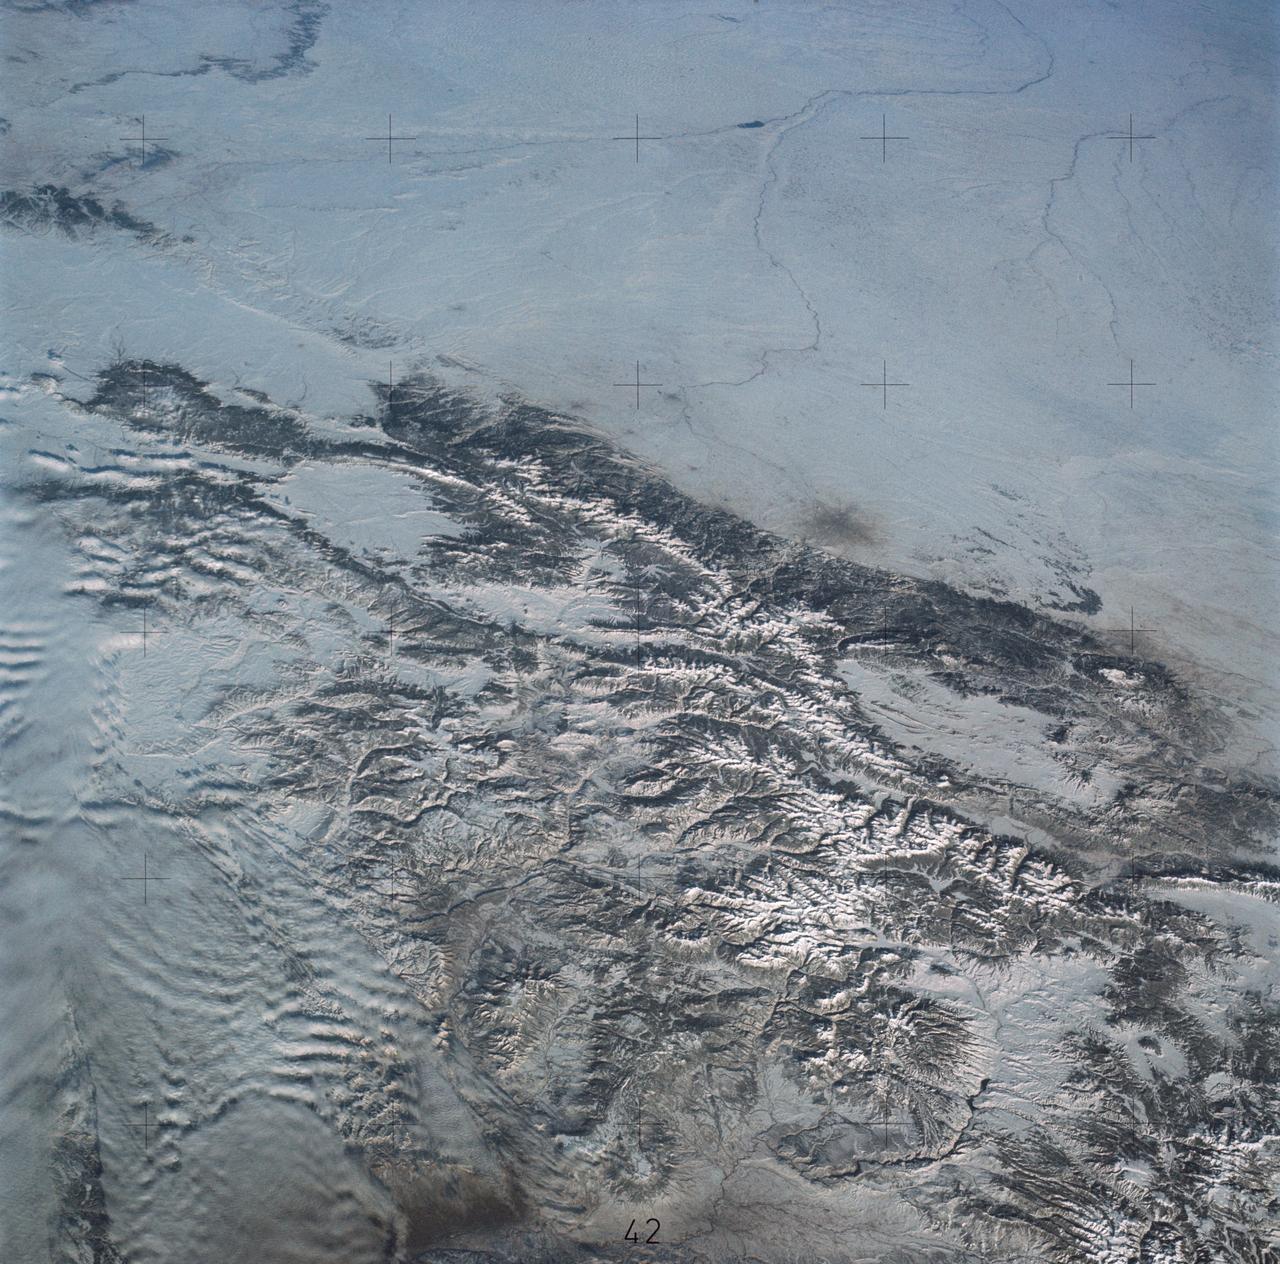
SL4-138-3875 (February 1974) --- A color oblique photograph looking east over the Rocky Mountains and Great Plains. This view covers a portion of the States of Colorado, Wyoming, and Nebraska. A Skylab 4 crewmen took this picture with a hand-held 70mm Hasselblad camera. This entire region, covered with a blanket of snow, depicts much of the structural and topographic features of the Rocky Mountain chain. Man's only apparent change to the snow pattern seen here is the (right center) metropolitan areas of Denver and Colorado Springs, Colorado, which can be observed along the eastern edge of the mountain front. Grand Junction, Colorado on the western slope of the Rocky Mountains is just off the photograph at left center bottom. The major inter-montane valleys of South Park (right center), Middle Park (center), and North Park (left center) are clearly visible and separate the Colorado Rockies Front Range from the high rugged mountains can be discovered such as Pikes Peak near right border (center), Mt. Cunnison region, circular feature accentuated by the Cunnison River (dark) in the right center (bottom) of the photograph. The snow covered peaks of Mts. Harvard, Princeton and Yale form the high region of the Collegiate Range which is the pronounced mountain area in the right center. Snow cover not only enhances mountain features but also the drainage patterns. East of Denver (right corner) the sinuous trace of the South Platte River (center) and its junction with the North Platte River near North Platte, Nebraska. Lake McConaughy in Nebraska is the body of water (black) near the river intersection. The trace of the Republic River in southern Nebraska is visible near the right corner of the photography. Geologic and hydro logic studies using this photograph will be conducted by Dr. Roger Morrison, U.S. Geological Survey. Photo credit: NASA
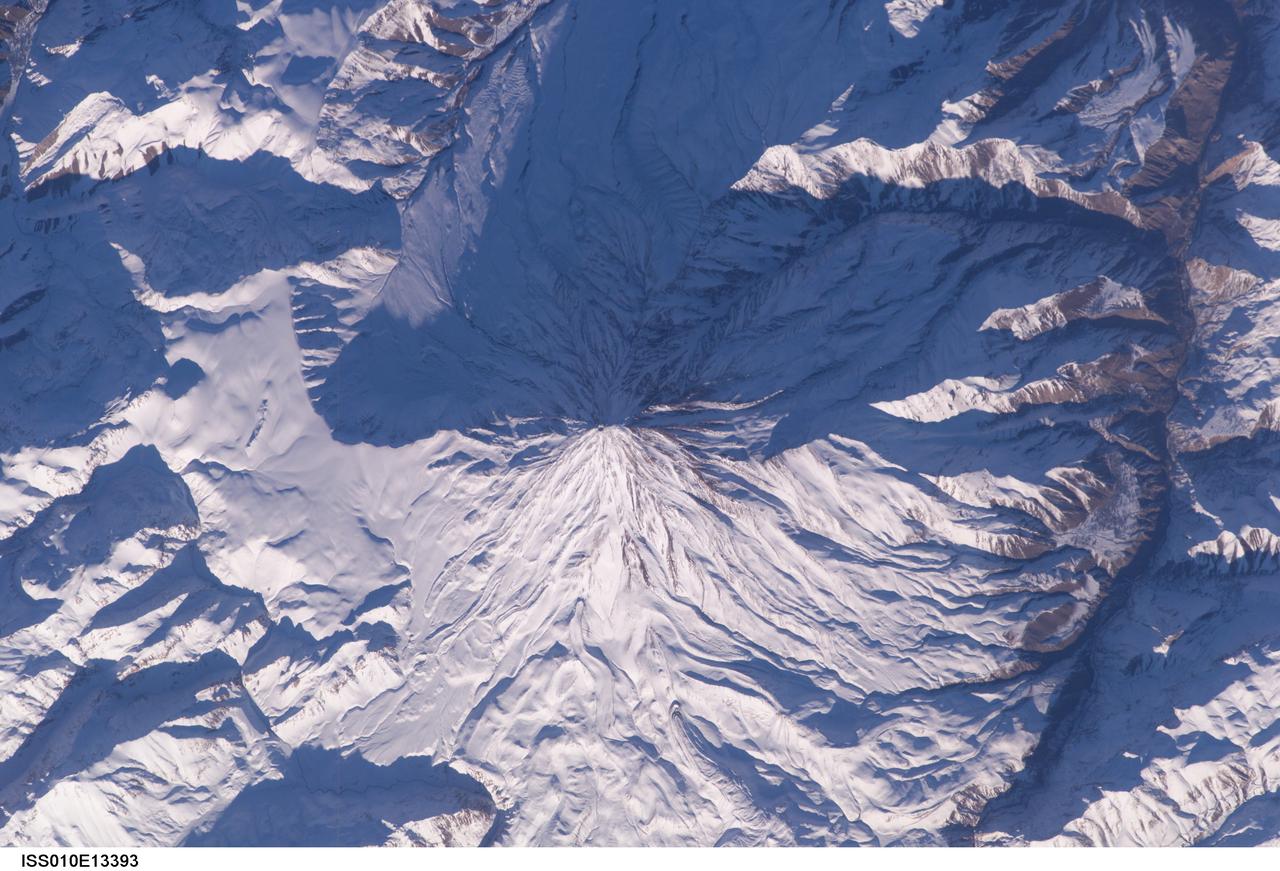
ISS010-E-13393 (15 January 2005) --- Mt. Damavand, Iran is featured in this image photographed by an Expedition 10 crewmember on the International Space Station (ISS). Located approximately 50 kilometers to the northeast of Tehran, Mt. Damavand is an impressive stratovolcano that reaches 5,670 meters (18,598 feet) in elevation. Damavand, which is part of the Alborz mountain range that borders the Caspian Sea to the north, is believed by scientists to be a young volcano that has mostly formed during the Holocene Epoch (over approximately the last 10,000 years). The western flank of the volcano includes solidified lava flows with flow levees – “walls” formed as the side edges of flowing lava cooled rapidly, forming a chute that channeled the hotter interior lava. Two such flows with well-defined levees are highlighted by snow on the mountainside (center). Damavand is the highest peak in Iran and the highest volcano in the Middle East.
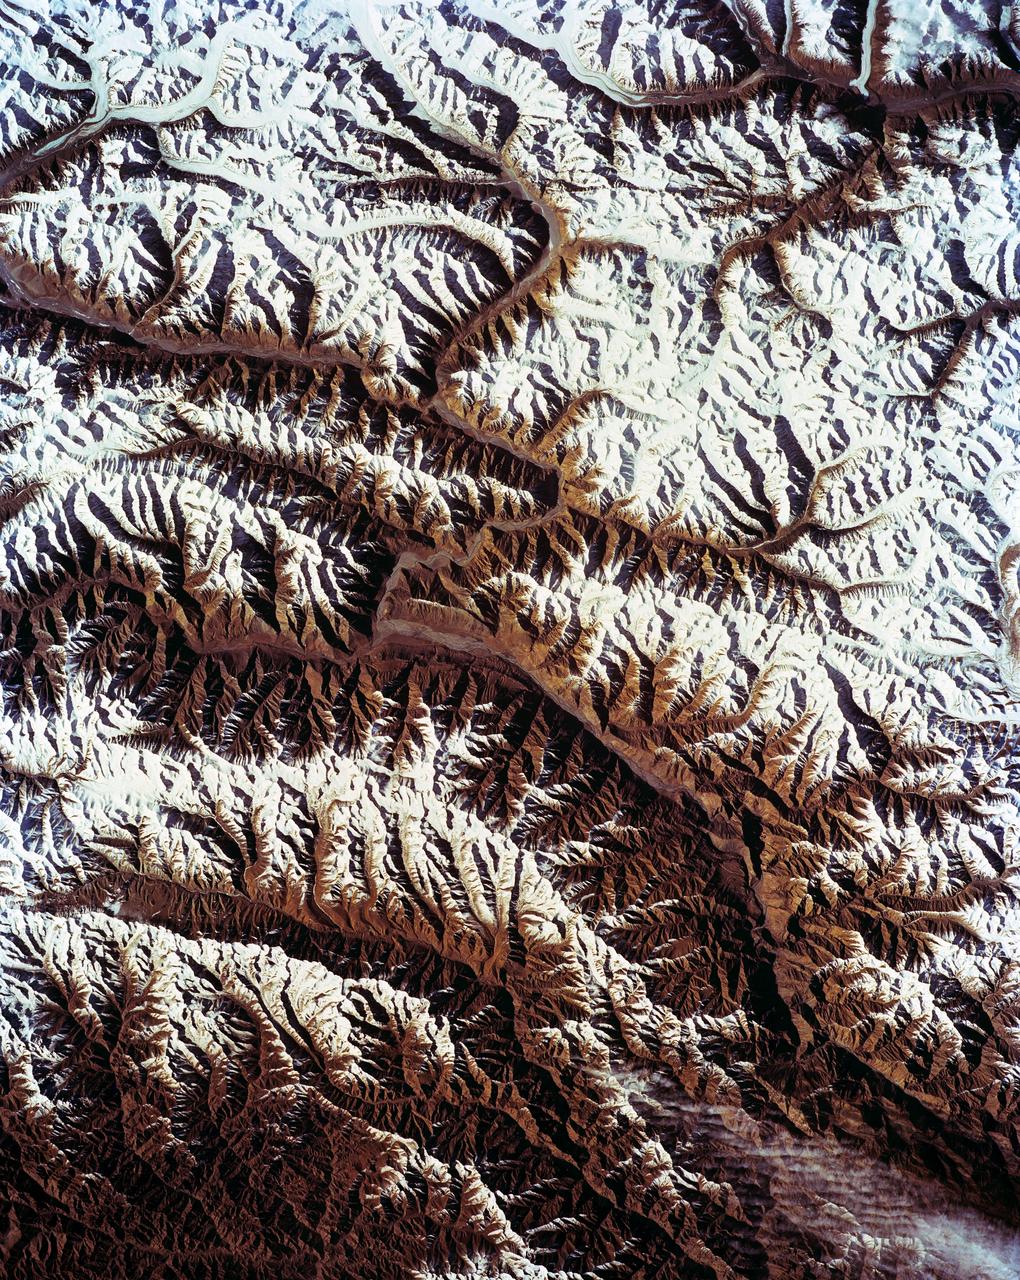
STS-56 Earth observation shows of some of the highest mountain peaks in the world taken from Discovery, Orbiter Vehicle (OV) 103, as it passed over India and China. The top of the view shows one of the snow and ice-covered massifs in the great Karakorum Range of north India. A star-shaped peak at top left reaches 23,850 feet. Glaciers can be seen in valleys at these high elevations. The international border between India to the south (top) and China (bottom) snakes left to right along a river near the top of the scene, then veers into the muntains at top left. Larger valleys, despite their elevation (all in excess of 14,000 feet), are occupied by transport routes joining points in India, China and the southern republics of the CIS. The ancient Silk Route between China and the Middle East lies not far to the north (outside the bottom of the frame).
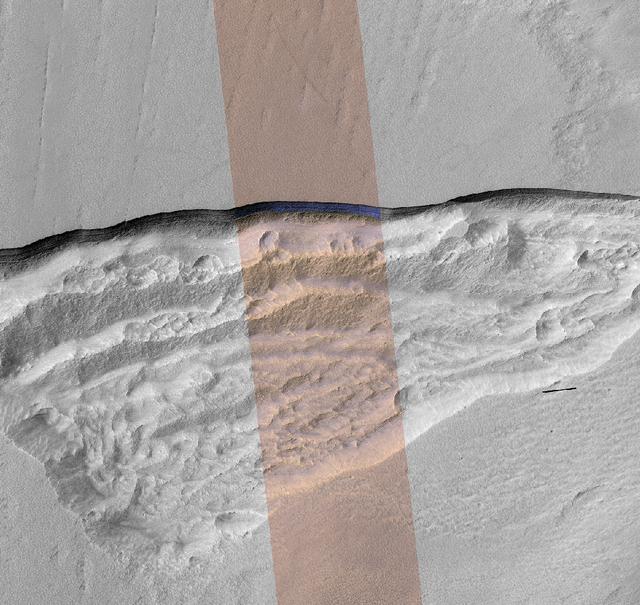
At this wedge-shaped pit on Mars, the steep slope (or scarp) at the northern edge (toward the top of the image) exposes a cross-section of a thick sheet of underground water ice. The image is from the High Resolution Imaging Stereo Experiment (HiRISE) camera on NASA's Mars Reconnaissance Orbiter. The gray-scale portions on left and right are from a single waveband in the red-light portion of the visible spectrum. The middle section, in enhanced color, combines data from red, near-infrared and blue-green wavebands. The scene covers an area about three miles (five kilometers) wide. Figure 1 includes a one-kilometer scale bar. One kilometer is about six-tenths of a mile. The ice-exposing scarp at the northern edge of the pit has a steepness of about 45 to 55 degrees, plunging from the relatively level ground outside the pit. The HiRISE observation ESP_022389_1230 was made on May 7, 2011, at 56.6 degrees south latitude, 114.1 degrees east longitude. In January 2018, in the journal Science, researchers reported finding and studying eight such ice-exposing scarps in the middle latitudes of Mars. The presence of vast underground ice deposits in Mars' middle latitudes was known previously. The report of unusual sites where they are exposed provides new information about their depth and layering. It also identifies potential water resources for future Mars missions and possibilities for studying Martian climate history by examining the ice layers holding a record of past climate cycles. The ice may have been deposited as snow when the tilt of Mars' rotation axis was greater than it is now. https://photojournal.jpl.nasa.gov/catalog/PIA22078
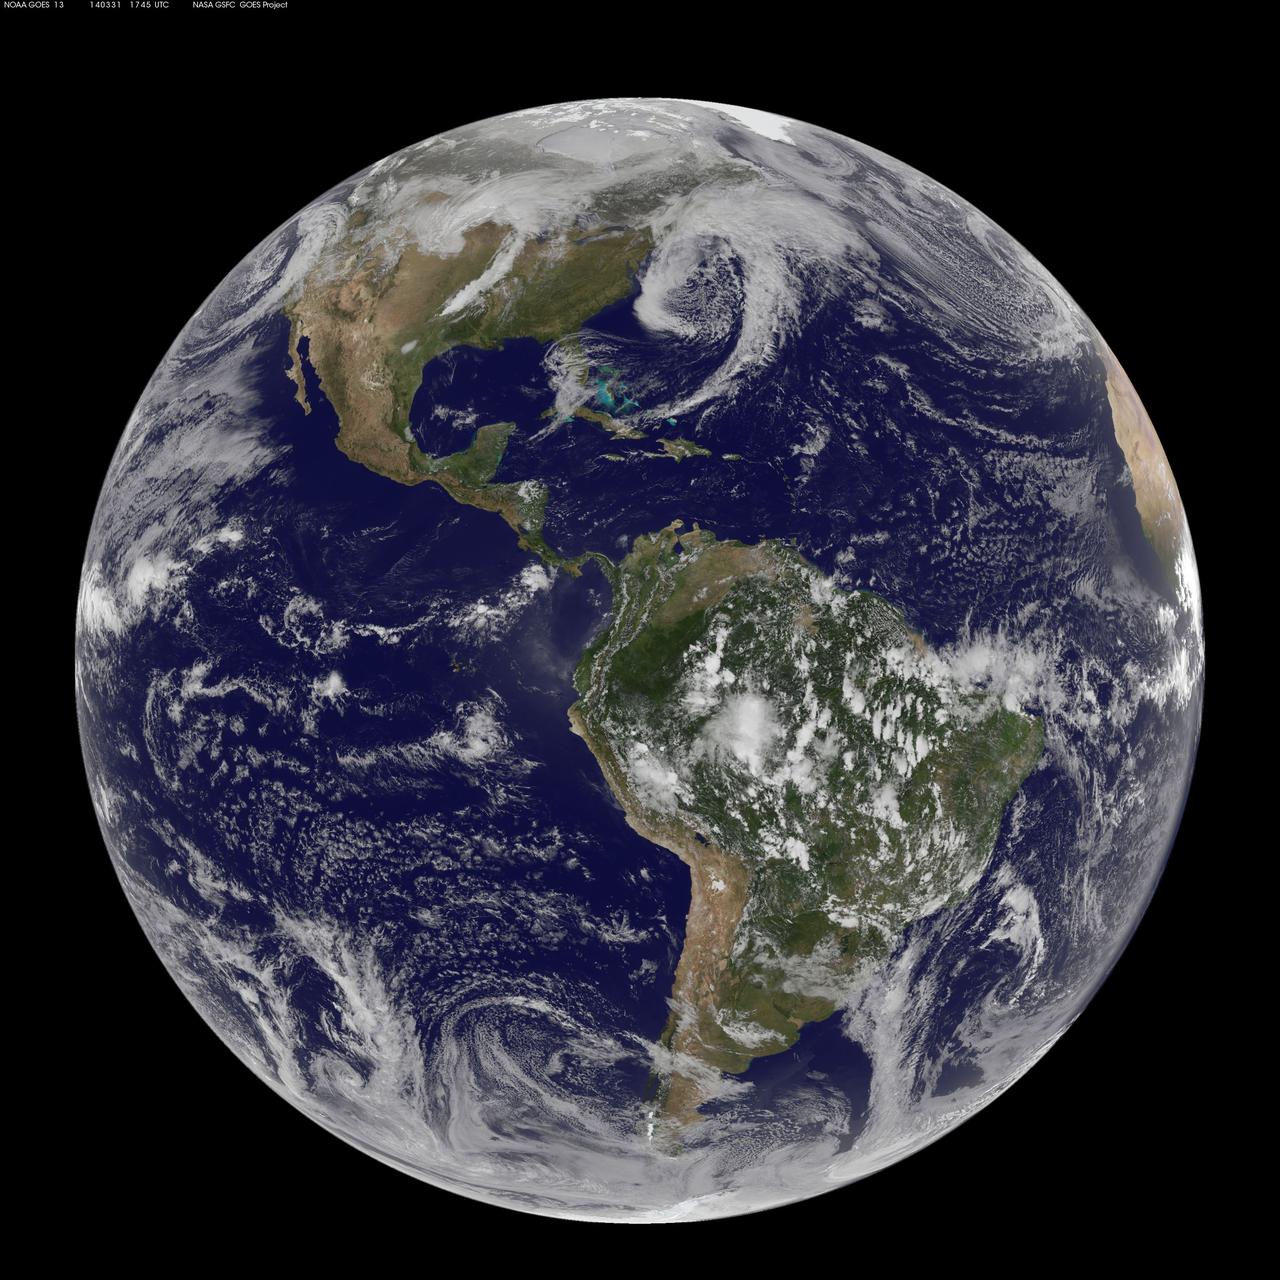
There are three low pressure systems around the U.S. and they resemble dragons on satellite imagery. NOAA's GOES-13 and GOES-15 satellite image from March 31 shows the low pressure systems in the eastern Pacific Ocean, over the nation's Heartland, and in the eastern Atlantic Ocean. All three lows have the signature comma shape that make them appear to be curled up dragons. According to the National Weather Service, the low pressure area approaching the northwestern U.S. is expected to bring rainfall to the coast and areas of snow that stretch from western Washington state south toward the four corners region. The low in the middle of the country is located over Nebraska and dropping snow to the north and west of it. That same low is bringing rain from southern Minnesota south to eastern Texas. Meanwhile, the third low pressure system is bringing rain and snow to parts of New England. NOAA's GOES-East satellite sits in a fixed orbit in space capturing visible and infrared imagery of all weather over the eastern U.S. and Atlantic Ocean. The data to create this image was taken on March 31 at 17:45 UTC/1:45 p.m. EDT by NOAA's GOES-East or GOES-13 satellite and made into an image by NASA/NOAA's GOES Project at NASA's Goddard Space Flight Center in Greenbelt, Md. To create the image NASA/NOAA's GOES Project takes the cloud data from NOAA's GOES-East satellite and overlays it on a true-color image of land and ocean created by data from the Moderate Resolution Imaging Spectroradiometer, or MODIS, instrument that flies aboard NASA's Aqua and Terra satellites. Together, those data created the entire picture of the storm and show its movement. After the storm system passes, the snow on the ground becomes visible. GOES satellites provide the kind of continuous monitoring necessary for intensive data analysis. Geostationary describes an orbit in which a satellite is always in the same position with respect to the rotating Earth. This allows GOES to hover continuously over one position on Earth's surface, appearing stationary. As a result, GOES provide a constant vigil for the atmospheric "triggers" for severe weather conditions such as tornadoes, flash floods, hail storms and hurricanes. For updated information about the storm system, visit NOAA's NWS website: <a href="http://www.weather.gov" rel="nofollow">www.weather.gov</a> For more information about GOES satellites, visit: <a href="http://www.goes.noaa.gov/" rel="nofollow">www.goes.noaa.gov/</a> or goes.gsfc.nasa.gov/ Rob Gutro NASA's Goddard Space Flight Center, Greenbelt, Md. <b><a href="http://www.nasa.gov/audience/formedia/features/MP_Photo_Guidelines.html" rel="nofollow">NASA image use policy.</a></b> <b><a href="http://www.nasa.gov/centers/goddard/home/index.html" rel="nofollow">NASA Goddard Space Flight Center</a></b> enables NASA’s mission through four scientific endeavors: Earth Science, Heliophysics, Solar System Exploration, and Astrophysics. Goddard plays a leading role in NASA’s accomplishments by contributing compelling scientific knowledge to advance the Agency’s mission. <b>Follow us on <a href="http://twitter.com/NASAGoddardPix" rel="nofollow">Twitter</a></b> <b>Like us on <a href="http://www.facebook.com/pages/Greenbelt-MD/NASA-Goddard/395013845897?ref=tsd" rel="nofollow">Facebook</a></b> <b>Find us on <a href="http://instagram.com/nasagoddard?vm=grid" rel="nofollow">Instagram</a></b>
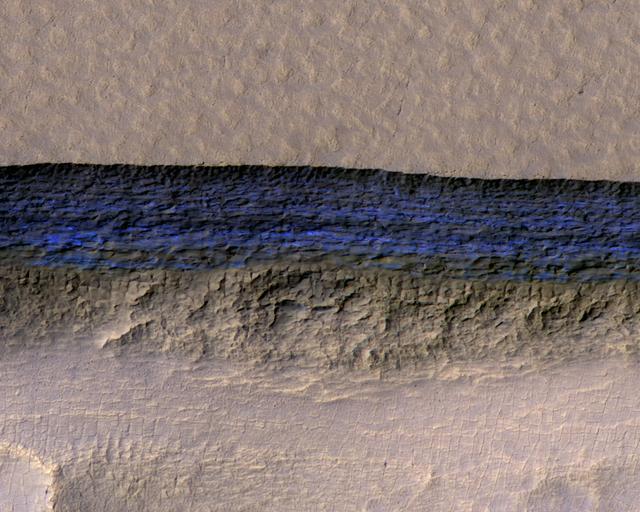
Click on the image for larger version A cross-section of a thick sheet of underground ice is exposed at the steep slope (or scarp) that appears bright blue in this enhanced-color view from the High Resolution Imaging Science Experiment (HiRISE) camera on NASA's Mars Reconnaissance Orbiter. The view covers an area about 550 yards (500 meters) wide. Figure 1 includes a 100-meter (109-yard) scale bar. North is toward the top. The upper third of the image shows level ground that is about 140 yards (130 meters) higher in elevation than the ground in the bottom third. In between, the scarp descends sharply, exposing about 260 vertical feet (80 vertical meters) of water ice. Color is exaggerated to make differences in surface materials easier to see. The presence of exposed water ice at this site was confirmed by observation with the same orbiter's Compact Reconnaissance Imaging Spectrometer for Mars (CRISM). In January 2018, in the journal Science, researchers reported finding and studying eight such ice-exposing scarps in the middle latitudes of Mars. The presence of vast underground ice deposits in Mars' middle latitudes was known previously. The report of unusual sites where they are exposed provides new information about their depth and layering. It also identifies potential water resources for future Mars missions and possibilities for studying Martian climate history by examining the ice layers holding a record of past climate cycles. The ice may have been deposited as snow when the tilt of Mars' rotation axis was greater than it is now. HiRISE observation ESP_022389_1230 was made on May 7, 2011, at 56.6 degrees south latitude, 114.1 degrees east longitude. https://photojournal.jpl.nasa.gov/catalog/PIA22077
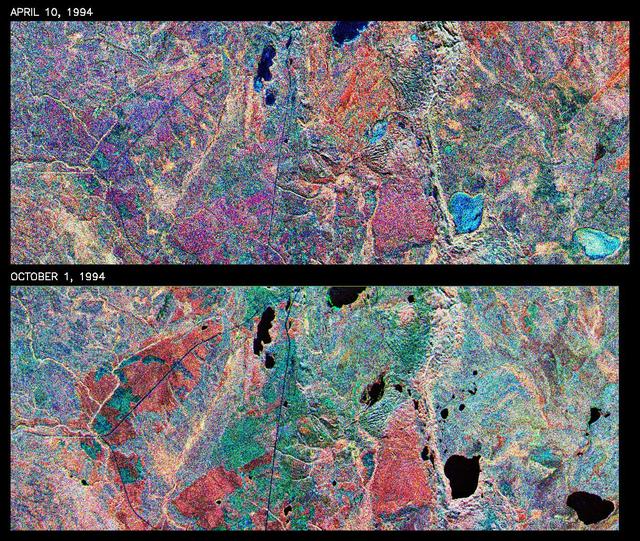
This is a comparison of images over Prince Albert, produced by NASA Spaceborne Imaging Radar-C and X-band Synthetic Aperture Radar aboard the space shuttle Endeavour on its 20th orbit on April 10, 1994. The area is centered at 53.91 degrees north latitude and 104.69 degrees west longitude and is located 40 kilometers (25 miles) north and 30 kilometers (18.5 miles) east of the town of Prince Albert in the Saskatchewan province of Canada. The image covers the area east of Candle Lake, between the gravel highway of 120 and west of highway 106. The area imaged is near the southern limit of the boreal forest. The boreal forest of North America is a continuous vegetation belt at high latitudes stretching across the continent from the Atlantic shoreline of central Labrador and then westward across Canada to the interior mountains and central coastal plains of Alaska. The forest is also part of a larger northern hemisphere circumpolar boreal forest belt. Coniferous trees dominate the entire forest but deciduous trees are also present. During the month of April, the forest experiences seasonal changes from a frozen condition to a thawed condition. The trees are completely frozen over the winter season and the forest floor is covered by snow. As the average temperature rises in the spring, the trees are thawed and the snow melts. This transition has an impact on the rate of moisture evaporation and release of carbon dioxide into the atmosphere. In late September and early October, the boreal forest experiences a relatively different seasonal change. At this time, the leaves on deciduous trees start changing color and dropping off. The soil and trees are quite often moist due to frequent rainfall and cloud cover. The evaporation of moisture and carbon dioxide into the atmosphere also diminishes at this time. SIR-C/X-SAR is sensitive to the moisture of soil and vegetation and can sense this freeze-thaw cycle and the summer-fall seasonal transition over forested areas in particular. Optical sensors, by contrast, are blind to these regions, which are perpetually obscured by thick cloud cover. These changes were detected by comparing the April and October color composite images of L-band data in red, C-band data in green and X-band (vertically received and transmitted) in blue. The changes in intensity of each color over lakes, various forest stands and clear cuts in the two images is striking. Lakes such as Lake Heiberg, Crabtree Lake and Williams Lake, in the right middle part of the image, are frozen in April (appearing in bright blue) and melted (appearing in black) in October. The higher intensity of blue over lakes in April is due to low penetration of the X-band (vertically received and transmitted) and the radar's high sensitivity to surface features. Forest stands also exhibit major changes between the two images. The red areas in the October image are old jack pine canopies that cause higher return at L-band because of their moist condition in late summer compared to their partially frozen condition in April (in purple). Similarly, in the areas near the middle of the image, where black spruce and mixed aspen and jack pine trees dominate, the contrast between blue in October and red and green in April is an indication that the top of the canopy (needles and branches) were frozen in April and moist in October. The changes due to deforestation by logging companies or natural fires can also be detected by comparing the images. For example, the small blue area near the intersection of Harding Road and Highway 120 is the result of logging which occurred after the April data was acquired. The surface area of clear cut is approximately 4 hectares, which is calculated from the high-resolution capability of the radar images and verified by scientists participating in field work during the mission. http://photojournal.jpl.nasa.gov/catalog/PIA01732
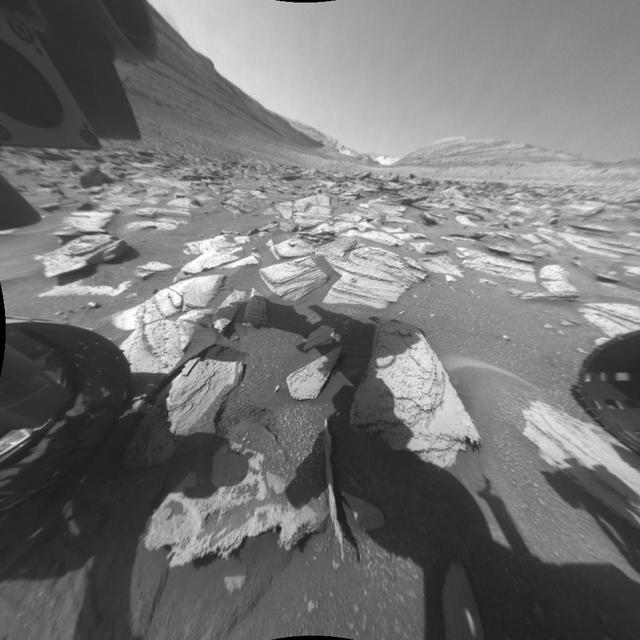
NASA's Curiosity Mars rover recorded two 25-frame videos showing the passage of 12 hours on Nov. 8, 2023, the 4,002nd Martian day, or sol, of the mission. The commands to capture the images that make up these videos were among the last that engineers beamed up to the rover before the start of Mars solar conjunction – a period of several weeks when the Sun is between Earth and Mars. Because the Sun's plasma can interfere with radio communications, NASA's Mars missions stand down from sending commands to their spacecraft during conjunction, bringing the missions to a temporary standstill. (The spacecraft still radio back their health status during this period.) The images were captured with Curiosity's front and rear Hazard-Avoidance Cameras, or Hazcams. Rover drivers use these black-and-white cameras to plan safe drive routes. A long series of images can be put together to create a video so that scientists can look for passing clouds or dust devils, which teach them more about the Martian environment. The perfect time for doing this type of work is when Curiosity is less active for long stretches, as it was during Mars solar conjunction. The lack of robotic arm motion and driving during conjunction allowed the Hazcams to image for 12 hours of a day – from 5:30 a.m. to 5:30 p.m. local Mars time – for the first time. While these Hazcam videos didn't reveal any clouds or dust activity, they did capture the passage of time as the Sun rose and set. The main video shows the front Hazcam's view looking southeast along Gediz Vallis, a valley found on Mount Sharp, the base of which Curiosity has been ascending since 2014. The sky brightens during sunrise in the east (left of image), and the shadow of the rover's stationary 7-foot (2-meter) robotic arm moves across the ground like that of a sundial. The rover's two front wheels are visible on each side of the frame; at upper left is a circular calibration target mounted on the shoulder of the robotic arm. Engineers use the target to test the accuracy of the Alpha Particle X-ray Spectrometer, an instrument that detects chemical elements on the Martian surface. In the middle of the day, the camera's autoexposure algorithm settles on exposure times of around one-third of a second; as evening turns to night, that exposure time grows to more than a minute, causing typical sensor noise known as "hot pixels" that appear as snow across the final image. Video available at https://photojournal.jpl.nasa.gov/catalog/PIA26209

The Polar Vortex is a whirling and persistent large area of low pressure, found typically over both north and south poles. The northern Polar Vortex is pushing southward over western Wisconsin/eastern Minnesota today, Monday, January 6, 2014 and is bringing frigid temperatures to half of the continental United States. It is expected to move northward back over Canada toward the end of the week. This image was captured by NOAA's GOES-East satellite on January 6, 2014 at 1601 UTC/11:01 a.m. EST. A frontal system that brought rain to the coast is draped from north to south along the U.S. East Coast. Behind the front lies the clearer skies bitter cold air associated with the Polar Vortex. The GOES image also revealed snow on the ground in Minnesota, Wisconsin, Illinois, Indiana, Ohio, Michigan, Iowa and Missouri, stretching into the Great Plains. Cloudiness over Texas is associated with a low pressure system centered over western Oklahoma that is part of the cold front connected to the movement of the Polar Vortex. The GOES image was created at NASA's GOES Project, located at NASA's Goddard Space Flight Center in Greenbelt, Md. Both the northern and southern polar vortices are located in the middle and upper troposphere (lowest level of the atmosphere) and the stratosphere (next level up in the atmosphere). The polar vortex is a winter phenomenon. It develops and strengthens in its respective hemisphere's winter as the sun sets over the polar region and temperatures cool. They weaken in the summer. In the northern hemisphere, they circulate in a counter-clockwise direction, so the vortex sitting over western Wisconsin is sweeping in cold Arctic air around it. The Arctic Polar Vortex peaks in the Northern Hemisphere's wintertime and has already moved southward several times this winter. In the past, it has also moved southward over Europe.On January 21, 1985, the National Oceanic and Atmospheric Administration Daily Weather Map series showed a strong polar vortex centered over Maine. The Polar Vortex also affects ozone. For more information on the Polar Vortex and how it affects ozone, visit NASA's Ozone Watch page: <a href="http://ozonewatch.gsfc.nasa.gov/facts/vortex_NH.html" rel="nofollow">ozonewatch.gsfc.nasa.gov/facts/vortex_NH.html</a> Rob Gutro NASA's Goddard Space Flight Center <b><a href="http://goes.gsfc.nasa.gov/" rel="nofollow">Credit: NOAA/NASA GOES Project</a></b> <b><a href="http://www.nasa.gov/audience/formedia/features/MP_Photo_Guidelines.html" rel="nofollow">NASA image use policy.</a></b> <b><a href="http://www.nasa.gov/centers/goddard/home/index.html" rel="nofollow">NASA Goddard Space Flight Center</a></b> enables NASA’s mission through four scientific endeavors: Earth Science, Heliophysics, Solar System Exploration, and Astrophysics. Goddard plays a leading role in NASA’s accomplishments by contributing compelling scientific knowledge to advance the Agency’s mission. <b>Follow us on <a href="http://twitter.com/NASA_GoddardPix" rel="nofollow">Twitter</a></b> <b>Like us on <a href="http://www.facebook.com/pages/Greenbelt-MD/NASA-Goddard/395013845897?ref=tsd" rel="nofollow">Facebook</a></b> <b>Find us on <a href="http://instagram.com/nasagoddard?vm=grid" rel="nofollow">Instagram</a></b>