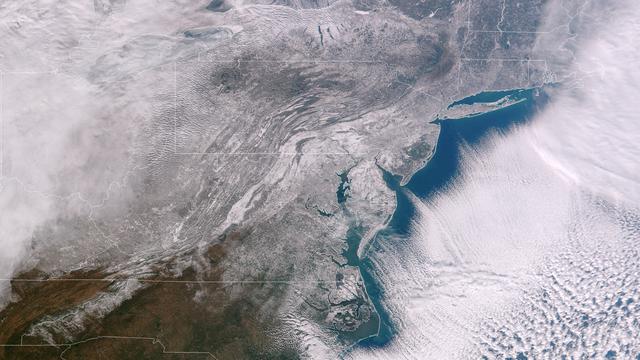
Clear, cold air following behind the winter storm of January 21, 2014 highlights the extent of snowfall in the Mid-Atlantic states. The frigid temperatures that remain entrenched over the central and eastern U.S. will begin to affect the southern states through the rest of the week. Winter Weather Advisories are posted for a portions of Texas for snow and freezing rain, while Hard Freeze Warnings extend from the Southeast states into northern Florida. This image was taken around 1840Z on January 22, 2014. Image credit: NOAA/NASA/Suomi NPP Credit: NASA/NOAA via <b><a href="www.nnvl.noaa.gov/" rel="nofollow"> NOAA Environmental Visualization Laboratory</a></b> <b><a href="http://www.nasa.gov/audience/formedia/features/MP_Photo_Guidelines.html" rel="nofollow">NASA image use policy.</a></b> <b><a href="http://www.nasa.gov/centers/goddard/home/index.html" rel="nofollow">NASA Goddard Space Flight Center</a></b> enables NASA’s mission through four scientific endeavors: Earth Science, Heliophysics, Solar System Exploration, and Astrophysics. Goddard plays a leading role in NASA’s accomplishments by contributing compelling scientific knowledge to advance the Agency’s mission. <b>Follow us on <a href="http://twitter.com/NASAGoddardPix" rel="nofollow">Twitter</a></b> <b>Like us on <a href="http://www.facebook.com/pages/Greenbelt-MD/NASA-Goddard/395013845897?ref=tsd" rel="nofollow">Facebook</a></b> <b>Find us on <a href="http://instagram.com/nasagoddard?vm=grid" rel="nofollow">Instagram</a></b>
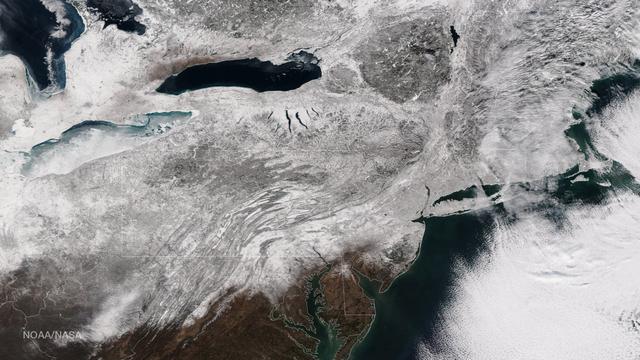
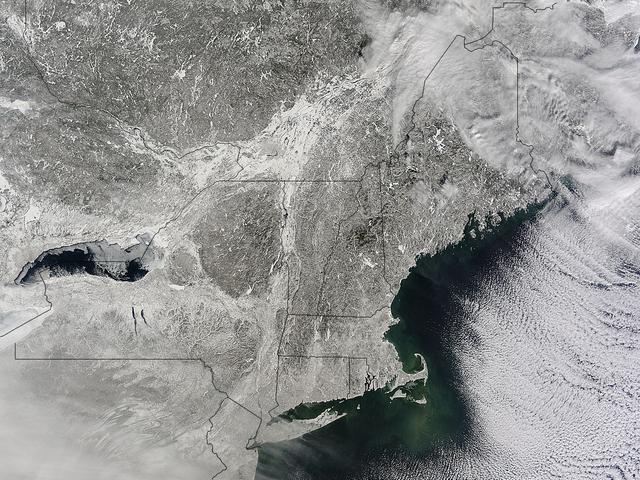
As the storm moves offshore and the skies clear over the Northeast United States, the extent of snowfall from the blizzard is shown in this image from the Suomi NPP satellite imagery, taken on January 28, 2015 at 1:50 EST. Portions of Suffolk County, New York and parts of eastern and southern New England, including areas in and around Portland, Maine, Boston, Massachusetts, and Providence, Rhode Island, received more than 20 inches of snowfall. Up to 36 inches of snow were reported in Auburn, Hudson and Lunenburg, Massachusetts. Credit: NASA/NOAA/NPP/VIIRS Via: <b><a href="www.nnvl.noaa.gov/" rel="nofollow"> NOAA Environmental Visualization Laboratory</a></b> <b><a href="http://www.nasa.gov/audience/formedia/features/MP_Photo_Guidelines.html" rel="nofollow">NASA image use policy.</a></b> <b><a href="http://www.nasa.gov/centers/goddard/home/index.html" rel="nofollow">NASA Goddard Space Flight Center</a></b> enables NASA’s mission through four scientific endeavors: Earth Science, Heliophysics, Solar System Exploration, and Astrophysics. Goddard plays a leading role in NASA’s accomplishments by contributing compelling scientific knowledge to advance the Agency’s mission. <b>Follow us on <a href="http://twitter.com/NASAGoddardPix" rel="nofollow">Twitter</a></b> <b>Like us on <a href="http://www.facebook.com/pages/Greenbelt-MD/NASA-Goddard/395013845897?ref=tsd" rel="nofollow">Facebook</a></b> <b>Find us on <a href="http://instagram.com/nasagoddard?vm=grid" rel="nofollow">Instagram</a></b>
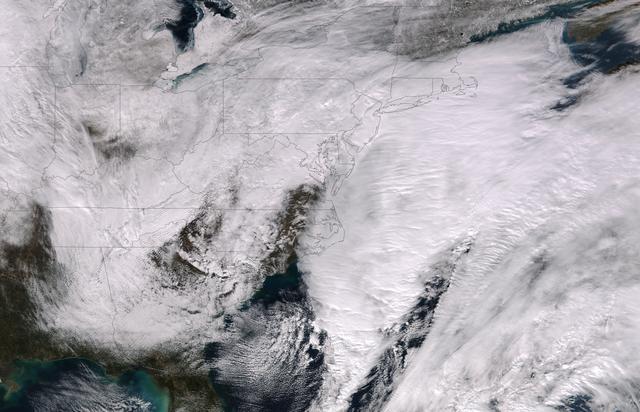
This image was taken by the Suomi NPP satellite's VIIRS instrument at 1825Z on January 26, 2015. A low pressure system currently forming off the mid-Atlantic coast will rapidly strengthen into a major nor'easter today and affect parts of the Northeast U.S. through early Wednesday. This system will be responsible for heavy to intense snowfall and strong winds, with blizzard conditions expected from eastern New Jersey to eastern Massachusetts where Blizzard Warnings are in effect. Accumulations will likely exceed one foot from eastern New Jersey through eastern Maine by late Tuesday. The heaviest snow accumulations, perhaps exceeding two feet, are forecast across portions of Connecticut, Rhode Island and Massachusetts, including the Boston area. Currently, New York City is forecast to receive 18-24 inches of snow, and Boston is forecast to receive 24-36 inches of snow. Wind gusts of 45 to 60 mph will be common from eastern New Jersey to eastern Massachusetts, leading to widespread blizzard conditions. Wind gusts up to 70 mph are possible in far eastern Massachusetts, including Cape Cod and Nantucket. Credit: NASA/NOAA/NPP/VIIRS Via: NASA/NOAA via <b><a href="www.nnvl.noaa.gov/" rel="nofollow"> NOAA Environmental Visualization Laboratory</a></b> <b><a href="http://www.nasa.gov/audience/formedia/features/MP_Photo_Guidelines.html" rel="nofollow">NASA image use policy.</a></b> <b><a href="http://www.nasa.gov/centers/goddard/home/index.html" rel="nofollow">NASA Goddard Space Flight Center</a></b> enables NASA’s mission through four scientific endeavors: Earth Science, Heliophysics, Solar System Exploration, and Astrophysics. Goddard plays a leading role in NASA’s accomplishments by contributing compelling scientific knowledge to advance the Agency’s mission. <b>Follow us on <a href="http://twitter.com/NASAGoddardPix" rel="nofollow">Twitter</a></b> <b>Like us on <a href="http://www.facebook.com/pages/Greenbelt-MD/NASA-Goddard/395013845897?ref=tsd" rel="nofollow">Facebook</a></b> <b>Find us on <a href="http://instagram.com/nasagoddard?vm=grid" rel="nofollow">Instagram</a></b>
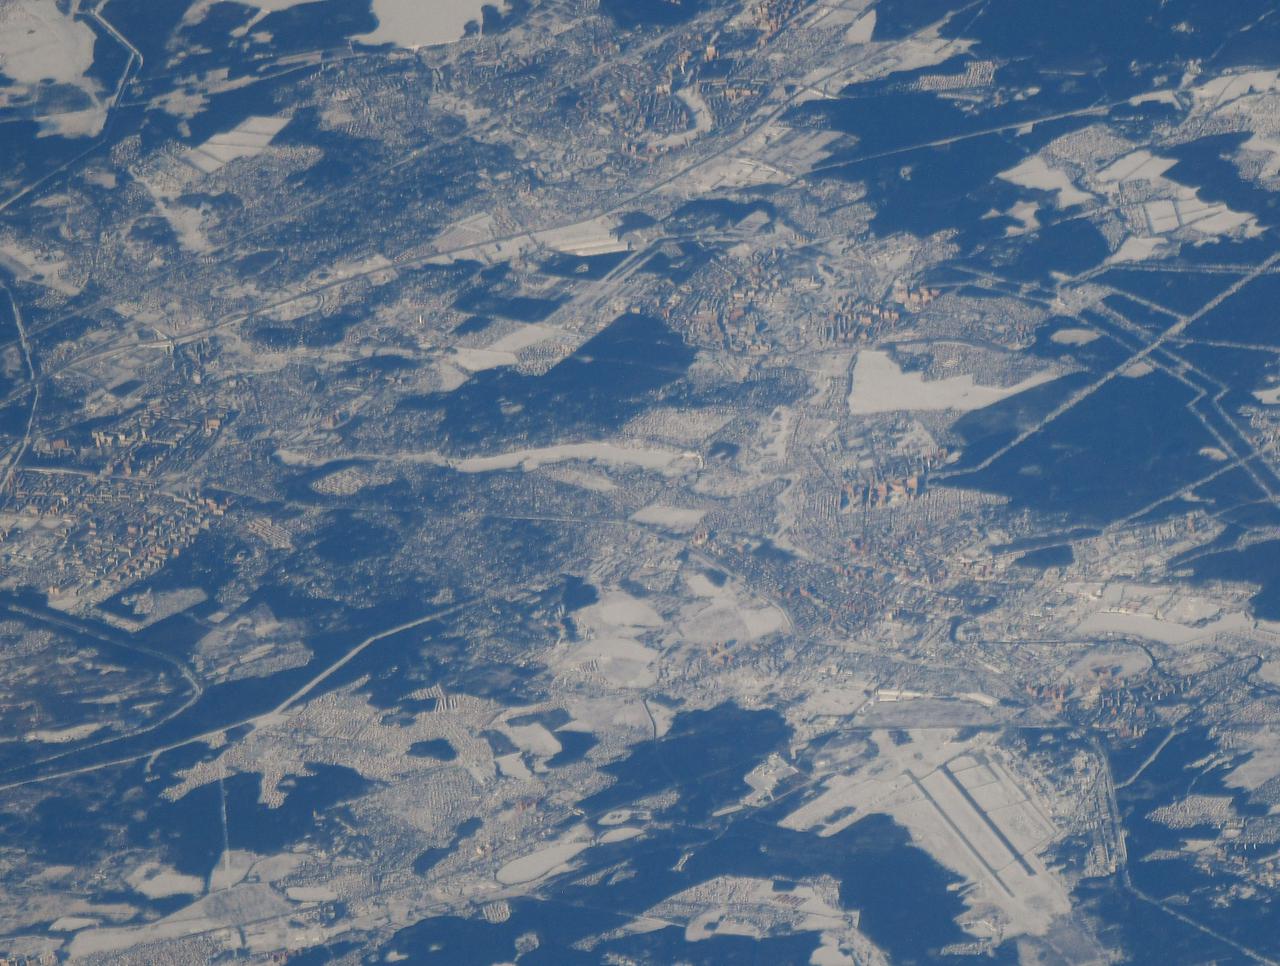
iss064e029481 (Feb. 8, 2021) --- An icy, snow-covered northeast Moscow is pictured from the International Space Station as it orbited 264 miles above Russia. Credit: Roscosmos
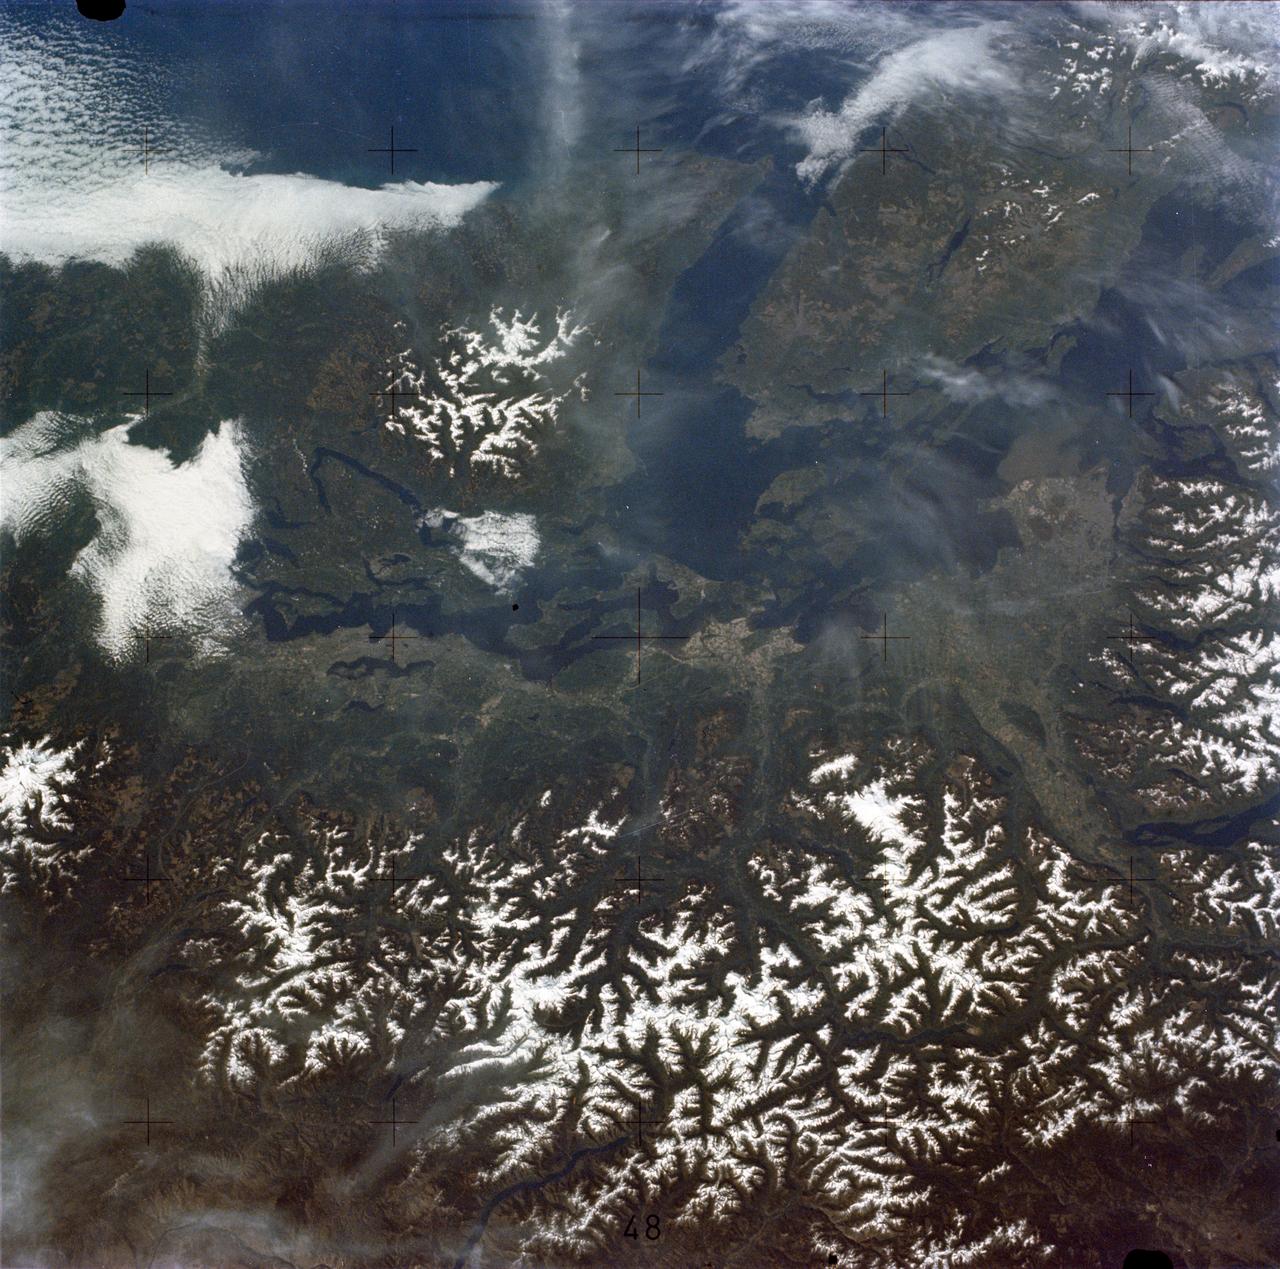
SL2-05-458 (22 June 1973) --- Portions of northwest Washington State (48.0N, 122.5) can be seen in this view as well as portions of British Columbia, Canada. The snow covered Cascade Mountains are on the eastern side of the scene. Vancouver Island is visible in the northeast corner of the photo. The strait of Juan de Fuca separates Vancouver Island from the northwest corner of Washington. Seattle is near the center and the snow covered Olympic Mountains are to the east. Photo credit: NASA

Remember this? Since its first observation in 2009, the volcanic vent complex to the northeast of Rachmaninoff basin has rewarded us with remarkable views of its explosive history. Portions of the vent are blanketed in a layer of very fine-grained material thought to be composed of pyroclastic particles, and when we last saw this landform at very high resolution we could appreciate just how fine that texture is. Now, with a resolution almost four times greater than that last image, we can see how the pyroclastic deposit softens the form of adjacent impact craters - almost like snow. Fiery, hot, angry snow. http://photojournal.jpl.nasa.gov/catalog/PIA19230
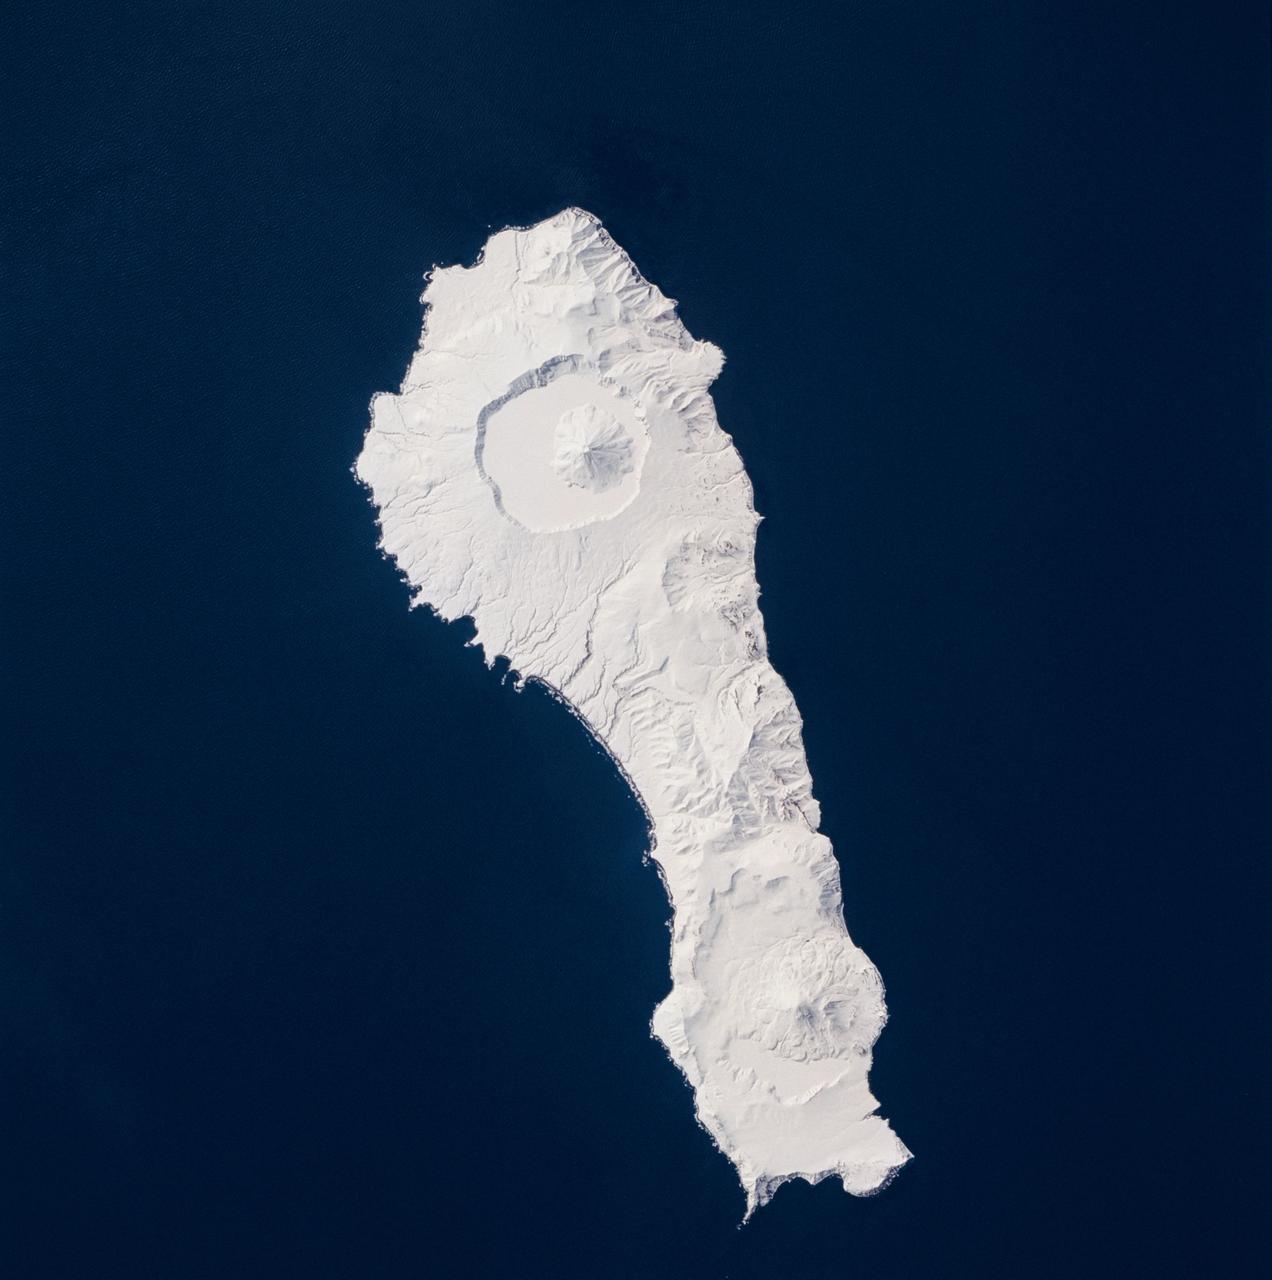
STS059-219-065 (9-20 April 1994) --- The narrow end of the island is to the north by northeast. This is one of several volcanic islands extending south by southwest between the southern tip of Kamchatka and Japan. The exposure was stopped down to provide extremely fine detail in the totally snow-covered landscape, at the same time making the dark sea look completely black. Compare to STS047-90-087, taken in September, which shows a green ground cover. Hasselblad photograph.
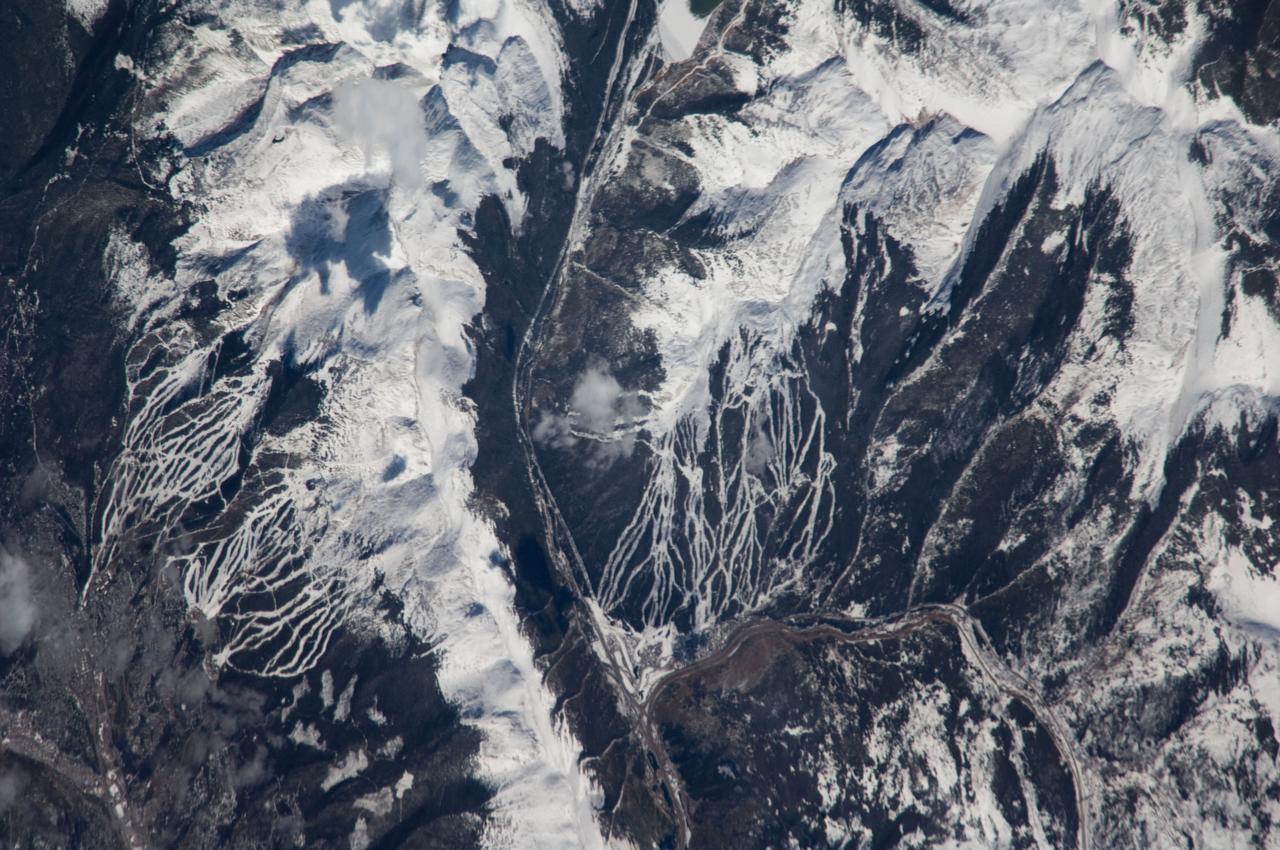
ISS018-E-005353 (24 Oct. 2008) --- Breckenridge and Copper Mountain ski slopes, Colorado are featured in this image photographed by an Expedition 18 crewmember on the International Space Station. Located in a section of the Rocky Mountains which extend through central Colorado, Tenmile Range and Copper Mountain provide the ideal location and landscape for popular winter sports. In this view, the Breckenridge and Copper Mountain ski areas are clearly visible as the snow covered ski runs stand out among the surrounding darker forest. Tenmile Range has mountain peaks that are named Peaks 1 through Peaks 10. The Breckenridge ski area use Peaks 7 through Peaks 10 which range from 12,631 feet (3,850 meters) to 13,615 feet (4,150 meters) high. Tenmile Canyon is a north northeast-trending fault-controlled valley running nearly 3,000 feet (914.4 meters) deep that serves as the boundaries for Tenmile Creek running through the center of the photo. The snow-covered peaks clearly delineate the tree line at an elevation of around 11,000 feet (3,350 meters). In the winter, this area's annual average snowfall ranges between 284 inches (7.21 meters) at Copper Mountain to 300 inches (7.62 meters) a year at Breckenridge. Before recreation became the main industry, miners were attracted to the area in the mid-1800's following discoveries of gold, silver, lead, and zinc. The towns of Breckenridge and Wheeler Junction (at the base of Copper Mountain ski area) were born out of the surge to settle the West during the Pike's Peak Gold Rush. While this image records snow on the peaks of Tenmile Range, the months of October and November 2008 saw little accumulation of snow pack in the area of Breckenridge. The situation changed in early December 2008 however, when more snow fell in eight days than in the preceding two months. The late, but significant, snowfall boosted the snow pack back to expected levels for this time of year.

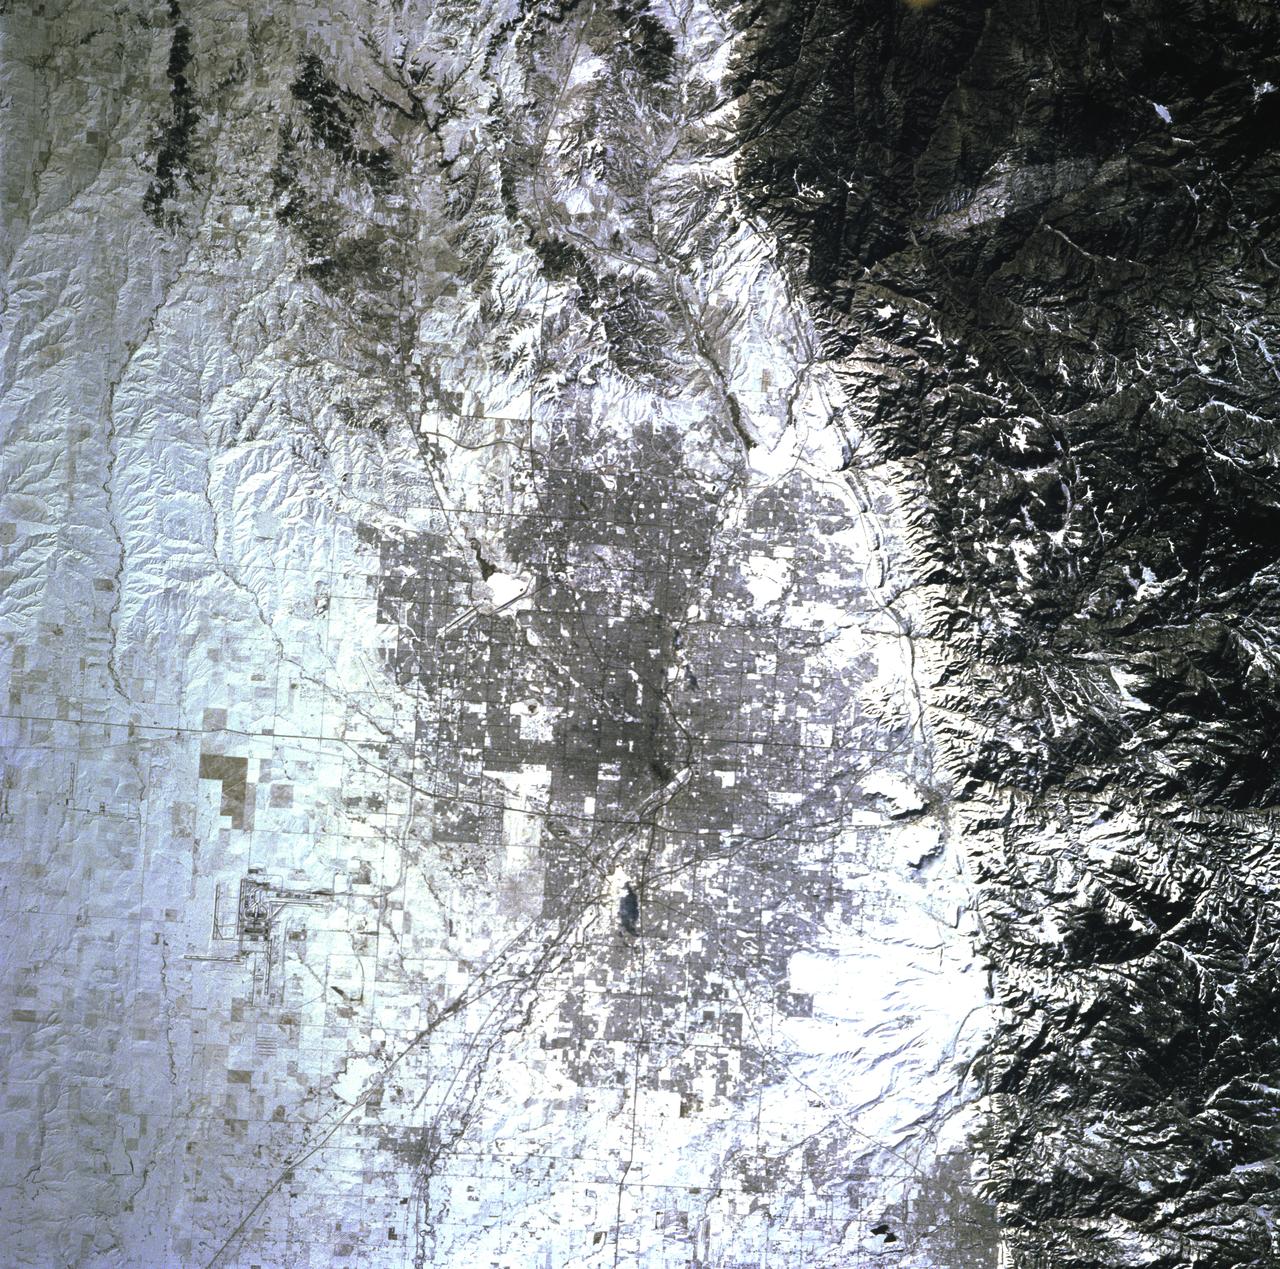
STS098-714A-020 (7-20 February 2001) ---One of the STS-98 astronauts aboard the Earth-orbiting Space Shuttle Atlantis used a 70mm handheld camera to record this image of Southern California. Snow blanketing the higher elevations in the Los Padres National Forest (center of the image) and that covering the Angeles National Forest (right middle) help to accentuate and separate three major landform regions in southern California. The northern Los Angeles Basin that includes the San Fernando Valley and the Santa Monica Mountains is visible in the lower right quadrant of the image. The western end of the Mojave Desert (upper right) shows the two distinctive mountain boundaries along the southwest and northwest edge of the desert. The San Andreas Fault and the Garlock Fault converge (snow covered in this scene) at the western end of the desert. The intensively irrigated and cultivated southern end of the San Joaquin Valley that includes Bakersfield is visible (upper left) north of the snow-covered, northeast-southwest trending Tehachapi Mountains. The island off of the California coast (bottom left) is Santa Cruz Island.
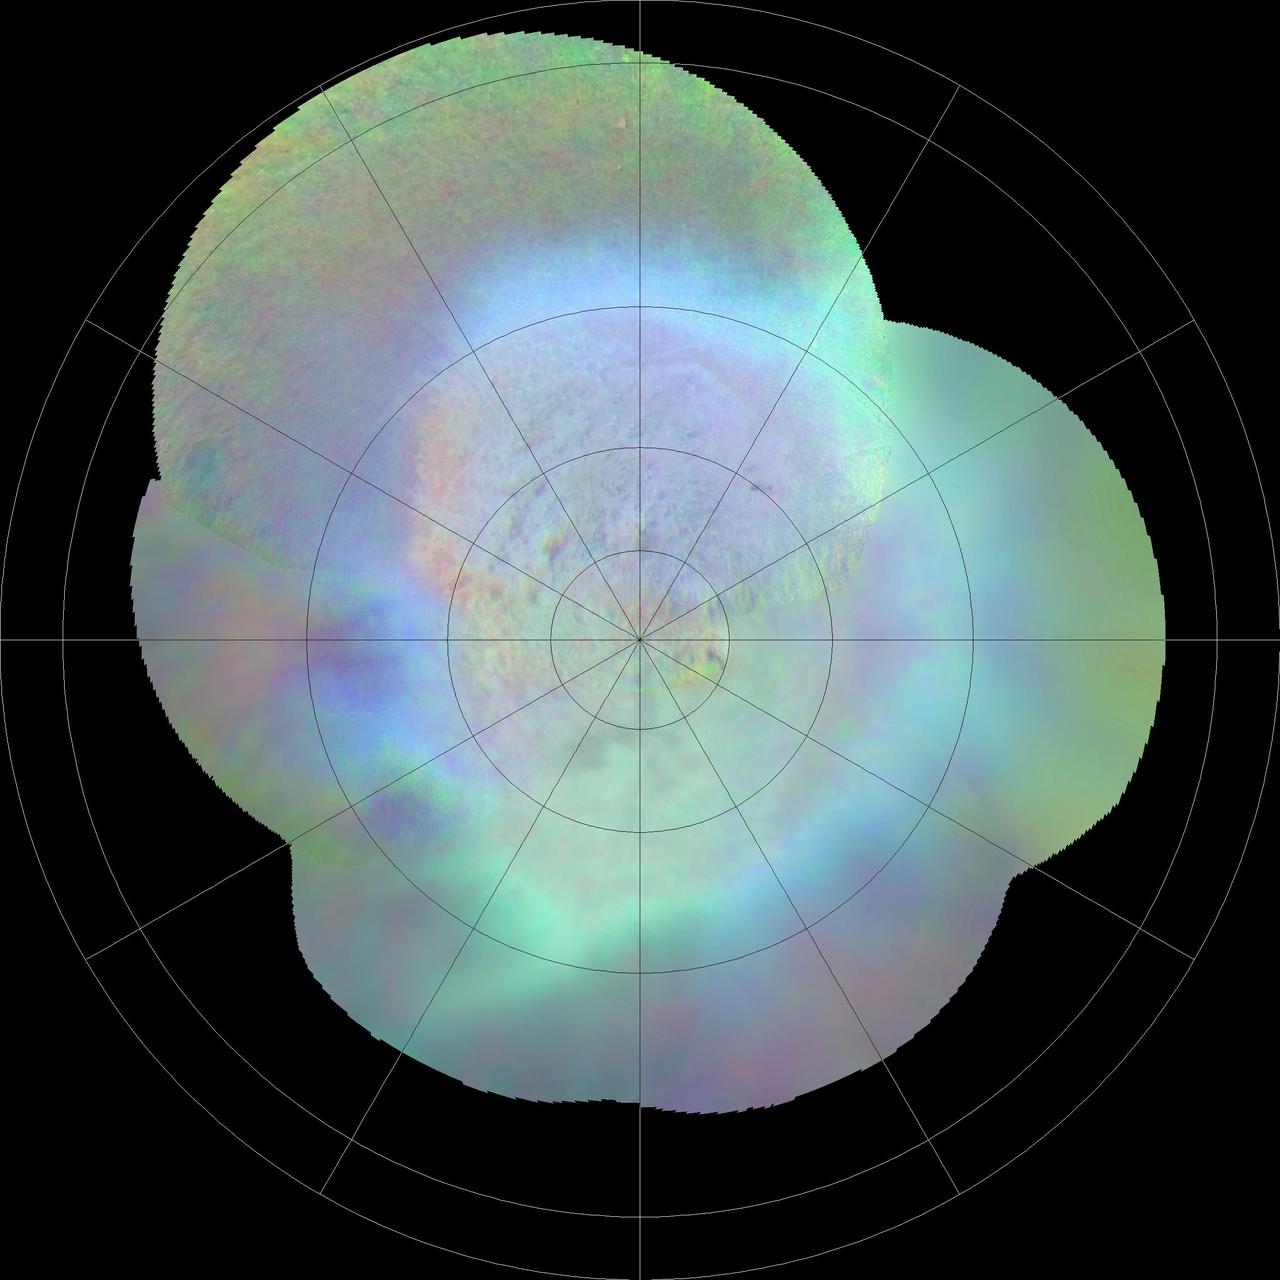
This polar projection from NASA Voyager 2 of Triton southern hemisphere provides a view of the southern polar cap and bright equatorial fringe. The margin of the cap is scalloped and ranges in latitude from +10 degrees to -30 degrees. The bright fringe is closely associated with the cap's margin; from it, diffuse bright rays extend north-northeast for hundreds of kilometers. The bright fringe probably consists of very fresh nitrogen frost or snow, and the rays consist of bright-fringe materials that were redistributed by north-moving Coriolis-deflected winds. http://photojournal.jpl.nasa.gov/catalog/PIA00423

STS100-713-064 (19 April-1 May 2001) --- This southerly-looking view, captured with a 70mm camera onboard the Space Shuttle Endeavour, shows the triangular-shaped island of Sicily. With only very limited coastal plains the island's topography consists of rugged hills and low mountains. Snow-capped Mt. Etna, one of the world's most instrumented volcanoes, is visible near the northeast point of the island. Two other distinctive features in this image are the lighter-colored zone of suspended sediment in the water along the southern coast and, in the distance, the smaller islands of Malta.
STS081-719-084 (12-22 Jan. 1997) --- The capital of the state of Colorado is featured prominently in this winter scene. Located at the foothills of the Rocky Mountains, Denver's elevation is 5,280 feet and is known as the "Mile High City". The new Denver International Airport (DIA) opened in 1995 and is one of the countries largest airports, can be seen towards the right corner of the photograph. Above and to the right of DIA is the closed Stapleton Airport with its snow covered runways. Other prominent cities featured are Golden, due east of Denver and against the Rockies, and Boulder, to the northeast of the city and also against the Rockies. Brighton is northwest of Denver, near the South Platte River.
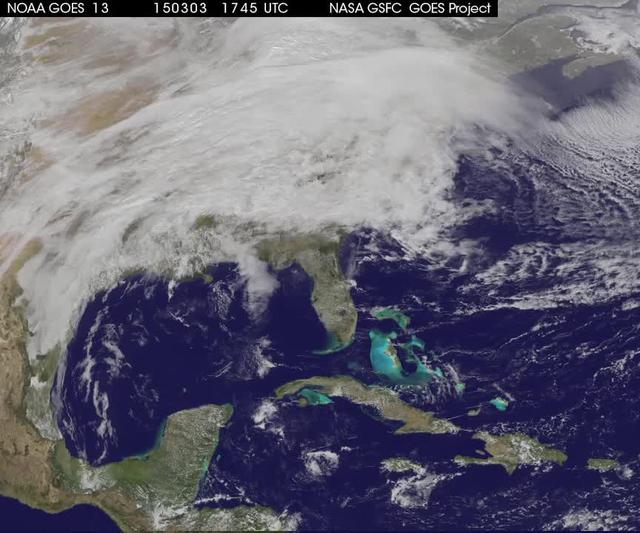
Image acquired December 19, 2011 A strong low pressure area in the southwestern U.S. today is bringing snowfall there as NOAA's GOES-13 satellite captured its associated clouds. Blizzard warnings are already posted for some areas. The image was created on Dec. 19 at 19:10 UTC (2:10 p.m. EST) from the Geostationary Operational Environmental Satellite called GOES-13. GOES-13 is operated by the National Oceanic and Atmospheric Administration. Images and animations are created by NASA's GOES Project, located at NASA's Goddard Space Flight Center, Greenbelt, Md. The low is forecast to move northeast across southeastern New Mexico today and reach southwest the Texas panhandle by early evening. The plains states including portions of Kansas, New Mexico and the Texas and Oklahoma panhandles could all have blizzard warnings later in the day on Dec. 19. Wind gusts to 60mph were recorded in northeastern New Mexico during the afternoon hours today. Kansas City may have a mix of rain, sleet and snow as the front moves past and temperatures fall. At 3 p.m. EST, the National Weather Service forecast indicated that moderate to heavy snow and strong north winds to impact the Texas and Oklahoma panhandles today into Tuesday morning. The low and associated cold front are expected to bring heavy snow to the Oklahoma panhandle and all but the far southeast Texas Panhandle. Behind the cold front, the strong winds will blow snow and lead to poor visibilities and blizzard conditions. The GOES image shows the large bank of clouds along the front stretching from the four corners states east-northeast through the Ohio Valley and into upstate New York. The rounded comma shape of clouds over Texas and stretching into Colorado indicate where the low pressure center is located. Image: NASA/NOAA GOES Project Text: NASA, Rob Gutro <b><a href="http://www.nasa.gov/audience/formedia/features/MP_Photo_Guidelines.html" rel="nofollow">NASA image use policy.</a></b> <b><a href="http://www.nasa.gov/centers/goddard/home/index.html" rel="nofollow">NASA Goddard Space Flight Center</a></b> enables NASA’s mission through four scientific endeavors: Earth Science, Heliophysics, Solar System Exploration, and Astrophysics. Goddard plays a leading role in NASA’s accomplishments by contributing compelling scientific knowledge to advance the Agency’s mission. <b>Follow us on <a href="http://twitter.com/NASA_GoddardPix" rel="nofollow">Twitter</a></b> <b>Like us on <a href="http://www.facebook.com/pages/Greenbelt-MD/NASA-Goddard/395013845897?ref=tsd" rel="nofollow">Facebook</a></b> <b>Find us on <a href="http://instagrid.me/nasagoddard/?vm=grid" rel="nofollow">Instagram</a></b>
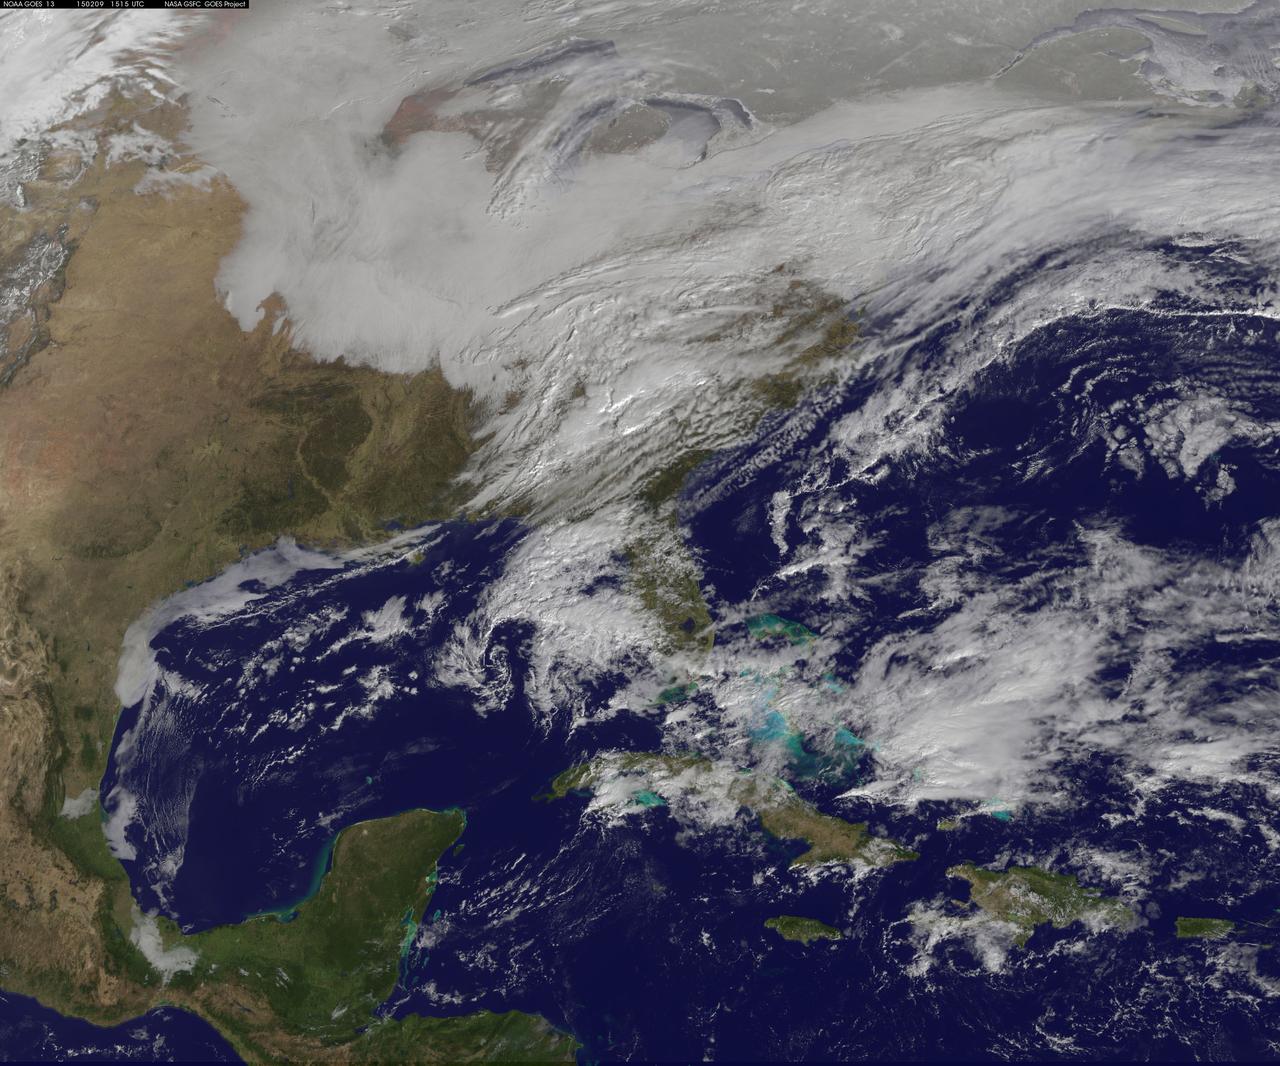
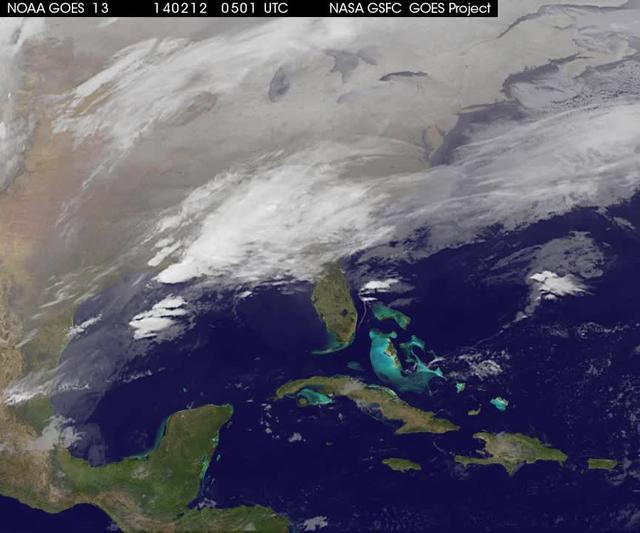
![The monster winter storm that brought icing to the U.S. southeast moved northward along the Eastern Seaboard and brought snow, sleet and rain from the Mid-Atlantic to New England on February 13. A new image from NOAA's GOES satellite showed clouds associated with the massive winter storm stretch from the U.S. southeast to the northeast. Data from NOAA's GOES-East satellite taken on Feb. 13 at 1455 UTC/9:45 a.m. EST were made into an image by NASA/NOAA's GOES Project at NASA's Goddard Space Flight Center in Greenbelt, Md. The clouds and fallen snow data from NOAA's GOES-East satellite were overlaid on a true-color image of land and ocean created by data from the Moderate Resolution Imaging Spectroradiometer or MODIS instrument that flies aboard NASA's Aqua and Terra satellites.The image showed that the clouds associated with the storm were blanketing much of the U.S. East Coast. At 3:11 a.m. EST, a surface map issued by the National Weather Service or NWS showed the storm's low pressure area was centered over eastern North Carolina. Since then, the low has continued to track north along the eastern seaboard. By 11 a.m. EST, precipitation from the storm was falling from South Carolina to Maine, according to National Weather Service radar. By 11 a.m. EST, the Washington, D.C. region snow and sleet totals ranged from 3" in far eastern Maryland to over 18" in the northern and western suburbs in Maryland and Virginia. NWS reported that snow, sleet and rain were still falling and more snow is expected as the back side of the low moves into the region. The New York City region remained under an NWS Winter Storm Warning until 6 a.m. on Friday, February 14 and the National Weather Service expects minor coastal impacts Thursday into Friday afternoon. New England was also being battered by the storm. At 10:56 a.m. EST, Barnstable, Mass. on Cape Cod was experiencing rain and winds gusting to 28 mph. An NWS wind advisory is in effect for Cape Cod until 7 p.m. EST. Further north, Portland, Maine was experiencing heavy snow with winds from the northeast at 6 mph. The National Weather Service in Gray, Maine noted "Significant snowfall is likely for much of western Maine and New Hampshire as this storm passes by. There will be a mix or changeover to sleet and freezing rain over southern and coastal sections tonight...before all areas end as a period of snow Friday (Feb. 14) morning." On February 13 at 10 a.m. EST, NOAA's National Weather Service noted "An abundance of Atlantic moisture getting wrapped into the storm will continue to fuel widespread precipitation...which should lift through the Mid-Atlantic States and Northeast Thursday into Friday. A wide swath of heavy snow accumulations are expected with this storm...but air [moving] off the warmer ocean water should change snow over to rain along the coastal areas. Also...a narrow axis of sleet and freezing rain will be possible within the transition zone...which is expected to set up near the I-95 corridor." For updates on local forecasts, watches and warnings, visit NOAA's <a href="http://www.weather.gov" rel="nofollow">www.weather.gov</a> webpage. GOES satellites provide the kind of continuous monitoring necessary for intensive data analysis. Geostationary describes an orbit in which a satellite is always in the same position with respect to the rotating Earth. This allows GOES to hover continuously over one position on Earth's surface, appearing stationary. As a result, GOES provide a constant vigil for the atmospheric "triggers" for severe weather conditions such as tornadoes, flash floods, hail storms and hurricanes. For updated information about the storm system, visit NOAA's WPC website: <a href="http://www.hpc.ncep.noaa.gov/" rel="nofollow">www.hpc.ncep.noaa.gov/</a> For more information about GOES satellites, visit: <a href="http://www.goes.noaa.gov/" rel="nofollow">www.goes.noaa.gov/</a> or <a href="http://goes.gsfc.nasa.gov/" rel="nofollow">goes.gsfc.nasa.gov/</a> Credit: NASA/GSFC/Jeff Schmaltz/MODIS Land Rapid Response Team <b><a href="http://www.nasa.gov/audience/formedia/features/MP_Photo_Guidelines.html" rel="nofollow">NASA image use policy.</a></b> <b><a href="http://www.nasa.gov/centers/goddard/home/index.html" rel="nofollow">NASA Goddard Space Flight Center</a></b> enables NASA’s mission through four scientific endeavors: Earth Science, Heliophysics, Solar System Exploration, and Astrophysics. Goddard plays a leading role in NASA’s accomplishments by contributing compelling scientific knowledge to advance the Agency’s mission. <b>Follow us on <a href="http://twitter.com/NASAGoddardPix" rel="nofollow">Twitter</a></b> <b>Like us on <a href="http://www.facebook.com/pages/Greenbelt-MD/NASA-Goddard/395013845897?ref=tsd" rel="nofollow">Facebook</a></b> <b>Find us on <a href="http://instagram.com/nasagoddard?vm=grid" rel="nofollow">Instagram</a></b>](https://images-assets.nasa.gov/image/GSFC_20171208_Archive_e001229/GSFC_20171208_Archive_e001229~medium.jpg)
The monster winter storm that brought icing to the U.S. southeast moved northward along the Eastern Seaboard and brought snow, sleet and rain from the Mid-Atlantic to New England on February 13. A new image from NOAA's GOES satellite showed clouds associated with the massive winter storm stretch from the U.S. southeast to the northeast. Data from NOAA's GOES-East satellite taken on Feb. 13 at 1455 UTC/9:45 a.m. EST were made into an image by NASA/NOAA's GOES Project at NASA's Goddard Space Flight Center in Greenbelt, Md. The clouds and fallen snow data from NOAA's GOES-East satellite were overlaid on a true-color image of land and ocean created by data from the Moderate Resolution Imaging Spectroradiometer or MODIS instrument that flies aboard NASA's Aqua and Terra satellites.The image showed that the clouds associated with the storm were blanketing much of the U.S. East Coast. At 3:11 a.m. EST, a surface map issued by the National Weather Service or NWS showed the storm's low pressure area was centered over eastern North Carolina. Since then, the low has continued to track north along the eastern seaboard. By 11 a.m. EST, precipitation from the storm was falling from South Carolina to Maine, according to National Weather Service radar. By 11 a.m. EST, the Washington, D.C. region snow and sleet totals ranged from 3" in far eastern Maryland to over 18" in the northern and western suburbs in Maryland and Virginia. NWS reported that snow, sleet and rain were still falling and more snow is expected as the back side of the low moves into the region. The New York City region remained under an NWS Winter Storm Warning until 6 a.m. on Friday, February 14 and the National Weather Service expects minor coastal impacts Thursday into Friday afternoon. New England was also being battered by the storm. At 10:56 a.m. EST, Barnstable, Mass. on Cape Cod was experiencing rain and winds gusting to 28 mph. An NWS wind advisory is in effect for Cape Cod until 7 p.m. EST. Further north, Portland, Maine was experiencing heavy snow with winds from the northeast at 6 mph. The National Weather Service in Gray, Maine noted "Significant snowfall is likely for much of western Maine and New Hampshire as this storm passes by. There will be a mix or changeover to sleet and freezing rain over southern and coastal sections tonight...before all areas end as a period of snow Friday (Feb. 14) morning." On February 13 at 10 a.m. EST, NOAA's National Weather Service noted "An abundance of Atlantic moisture getting wrapped into the storm will continue to fuel widespread precipitation...which should lift through the Mid-Atlantic States and Northeast Thursday into Friday. A wide swath of heavy snow accumulations are expected with this storm...but air [moving] off the warmer ocean water should change snow over to rain along the coastal areas. Also...a narrow axis of sleet and freezing rain will be possible within the transition zone...which is expected to set up near the I-95 corridor." For updates on local forecasts, watches and warnings, visit NOAA's <a href="http://www.weather.gov" rel="nofollow">www.weather.gov</a> webpage. GOES satellites provide the kind of continuous monitoring necessary for intensive data analysis. Geostationary describes an orbit in which a satellite is always in the same position with respect to the rotating Earth. This allows GOES to hover continuously over one position on Earth's surface, appearing stationary. As a result, GOES provide a constant vigil for the atmospheric "triggers" for severe weather conditions such as tornadoes, flash floods, hail storms and hurricanes. For updated information about the storm system, visit NOAA's WPC website: <a href="http://www.hpc.ncep.noaa.gov/" rel="nofollow">www.hpc.ncep.noaa.gov/</a> For more information about GOES satellites, visit: <a href="http://www.goes.noaa.gov/" rel="nofollow">www.goes.noaa.gov/</a> or <a href="http://goes.gsfc.nasa.gov/" rel="nofollow">goes.gsfc.nasa.gov/</a> Credit: NASA/GSFC/Jeff Schmaltz/MODIS Land Rapid Response Team <b><a href="http://www.nasa.gov/audience/formedia/features/MP_Photo_Guidelines.html" rel="nofollow">NASA image use policy.</a></b> <b><a href="http://www.nasa.gov/centers/goddard/home/index.html" rel="nofollow">NASA Goddard Space Flight Center</a></b> enables NASA’s mission through four scientific endeavors: Earth Science, Heliophysics, Solar System Exploration, and Astrophysics. Goddard plays a leading role in NASA’s accomplishments by contributing compelling scientific knowledge to advance the Agency’s mission. <b>Follow us on <a href="http://twitter.com/NASAGoddardPix" rel="nofollow">Twitter</a></b> <b>Like us on <a href="http://www.facebook.com/pages/Greenbelt-MD/NASA-Goddard/395013845897?ref=tsd" rel="nofollow">Facebook</a></b> <b>Find us on <a href="http://instagram.com/nasagoddard?vm=grid" rel="nofollow">Instagram</a></b>
![The monster winter storm that brought icing to the U.S. southeast moved northward along the Eastern Seaboard and brought snow, sleet and rain from the Mid-Atlantic to New England on February 13. A new image from NOAA's GOES satellite showed clouds associated with the massive winter storm stretch from the U.S. southeast to the northeast. Data from NOAA's GOES-East satellite taken on Feb. 13 at 1455 UTC/9:45 a.m. EST were made into an image by NASA/NOAA's GOES Project at NASA's Goddard Space Flight Center in Greenbelt, Md. The clouds and fallen snow data from NOAA's GOES-East satellite were overlaid on a true-color image of land and ocean created by data from the Moderate Resolution Imaging Spectroradiometer or MODIS instrument that flies aboard NASA's Aqua and Terra satellites.The image showed that the clouds associated with the storm were blanketing much of the U.S. East Coast. At 3:11 a.m. EST, a surface map issued by the National Weather Service or NWS showed the storm's low pressure area was centered over eastern North Carolina. Since then, the low has continued to track north along the eastern seaboard. By 11 a.m. EST, precipitation from the storm was falling from South Carolina to Maine, according to National Weather Service radar. By 11 a.m. EST, the Washington, D.C. region snow and sleet totals ranged from 3" in far eastern Maryland to over 18" in the northern and western suburbs in Maryland and Virginia. NWS reported that snow, sleet and rain were still falling and more snow is expected as the back side of the low moves into the region. The New York City region remained under an NWS Winter Storm Warning until 6 a.m. on Friday, February 14 and the National Weather Service expects minor coastal impacts Thursday into Friday afternoon. New England was also being battered by the storm. At 10:56 a.m. EST, Barnstable, Mass. on Cape Cod was experiencing rain and winds gusting to 28 mph. An NWS wind advisory is in effect for Cape Cod until 7 p.m. EST. Further north, Portland, Maine was experiencing heavy snow with winds from the northeast at 6 mph. The National Weather Service in Gray, Maine noted "Significant snowfall is likely for much of western Maine and New Hampshire as this storm passes by. There will be a mix or changeover to sleet and freezing rain over southern and coastal sections tonight...before all areas end as a period of snow Friday (Feb. 14) morning." On February 13 at 10 a.m. EST, NOAA's National Weather Service noted "An abundance of Atlantic moisture getting wrapped into the storm will continue to fuel widespread precipitation...which should lift through the Mid-Atlantic States and Northeast Thursday into Friday. A wide swath of heavy snow accumulations are expected with this storm...but air [moving] off the warmer ocean water should change snow over to rain along the coastal areas. Also...a narrow axis of sleet and freezing rain will be possible within the transition zone...which is expected to set up near the I-95 corridor." For updates on local forecasts, watches and warnings, visit NOAA's <a href="http://www.weather.gov" rel="nofollow">www.weather.gov</a> webpage. GOES satellites provide the kind of continuous monitoring necessary for intensive data analysis. Geostationary describes an orbit in which a satellite is always in the same position with respect to the rotating Earth. This allows GOES to hover continuously over one position on Earth's surface, appearing stationary. As a result, GOES provide a constant vigil for the atmospheric "triggers" for severe weather conditions such as tornadoes, flash floods, hail storms and hurricanes. For updated information about the storm system, visit NOAA's WPC website: <a href="http://www.hpc.ncep.noaa.gov/" rel="nofollow">www.hpc.ncep.noaa.gov/</a> For more information about GOES satellites, visit: <a href="http://www.goes.noaa.gov/" rel="nofollow">www.goes.noaa.gov/</a> or <a href="http://goes.gsfc.nasa.gov/" rel="nofollow">goes.gsfc.nasa.gov/</a> Credit: NASA/GSFC/Jeff Schmaltz/MODIS Land Rapid Response Team <b><a href="http://www.nasa.gov/audience/formedia/features/MP_Photo_Guidelines.html" rel="nofollow">NASA image use policy.</a></b> <b><a href="http://www.nasa.gov/centers/goddard/home/index.html" rel="nofollow">NASA Goddard Space Flight Center</a></b> enables NASA’s mission through four scientific endeavors: Earth Science, Heliophysics, Solar System Exploration, and Astrophysics. Goddard plays a leading role in NASA’s accomplishments by contributing compelling scientific knowledge to advance the Agency’s mission. <b>Follow us on <a href="http://twitter.com/NASAGoddardPix" rel="nofollow">Twitter</a></b> <b>Like us on <a href="http://www.facebook.com/pages/Greenbelt-MD/NASA-Goddard/395013845897?ref=tsd" rel="nofollow">Facebook</a></b> <b>Find us on <a href="http://instagram.com/nasagoddard?vm=grid" rel="nofollow">Instagram</a></b>](https://images-assets.nasa.gov/image/GSFC_20171208_Archive_e001228/GSFC_20171208_Archive_e001228~medium.jpg)
The monster winter storm that brought icing to the U.S. southeast moved northward along the Eastern Seaboard and brought snow, sleet and rain from the Mid-Atlantic to New England on February 13. A new image from NOAA's GOES satellite showed clouds associated with the massive winter storm stretch from the U.S. southeast to the northeast. Data from NOAA's GOES-East satellite taken on Feb. 13 at 1455 UTC/9:45 a.m. EST were made into an image by NASA/NOAA's GOES Project at NASA's Goddard Space Flight Center in Greenbelt, Md. The clouds and fallen snow data from NOAA's GOES-East satellite were overlaid on a true-color image of land and ocean created by data from the Moderate Resolution Imaging Spectroradiometer or MODIS instrument that flies aboard NASA's Aqua and Terra satellites.The image showed that the clouds associated with the storm were blanketing much of the U.S. East Coast. At 3:11 a.m. EST, a surface map issued by the National Weather Service or NWS showed the storm's low pressure area was centered over eastern North Carolina. Since then, the low has continued to track north along the eastern seaboard. By 11 a.m. EST, precipitation from the storm was falling from South Carolina to Maine, according to National Weather Service radar. By 11 a.m. EST, the Washington, D.C. region snow and sleet totals ranged from 3" in far eastern Maryland to over 18" in the northern and western suburbs in Maryland and Virginia. NWS reported that snow, sleet and rain were still falling and more snow is expected as the back side of the low moves into the region. The New York City region remained under an NWS Winter Storm Warning until 6 a.m. on Friday, February 14 and the National Weather Service expects minor coastal impacts Thursday into Friday afternoon. New England was also being battered by the storm. At 10:56 a.m. EST, Barnstable, Mass. on Cape Cod was experiencing rain and winds gusting to 28 mph. An NWS wind advisory is in effect for Cape Cod until 7 p.m. EST. Further north, Portland, Maine was experiencing heavy snow with winds from the northeast at 6 mph. The National Weather Service in Gray, Maine noted "Significant snowfall is likely for much of western Maine and New Hampshire as this storm passes by. There will be a mix or changeover to sleet and freezing rain over southern and coastal sections tonight...before all areas end as a period of snow Friday (Feb. 14) morning." On February 13 at 10 a.m. EST, NOAA's National Weather Service noted "An abundance of Atlantic moisture getting wrapped into the storm will continue to fuel widespread precipitation...which should lift through the Mid-Atlantic States and Northeast Thursday into Friday. A wide swath of heavy snow accumulations are expected with this storm...but air [moving] off the warmer ocean water should change snow over to rain along the coastal areas. Also...a narrow axis of sleet and freezing rain will be possible within the transition zone...which is expected to set up near the I-95 corridor." For updates on local forecasts, watches and warnings, visit NOAA's <a href="http://www.weather.gov" rel="nofollow">www.weather.gov</a> webpage. GOES satellites provide the kind of continuous monitoring necessary for intensive data analysis. Geostationary describes an orbit in which a satellite is always in the same position with respect to the rotating Earth. This allows GOES to hover continuously over one position on Earth's surface, appearing stationary. As a result, GOES provide a constant vigil for the atmospheric "triggers" for severe weather conditions such as tornadoes, flash floods, hail storms and hurricanes. For updated information about the storm system, visit NOAA's WPC website: <a href="http://www.hpc.ncep.noaa.gov/" rel="nofollow">www.hpc.ncep.noaa.gov/</a> For more information about GOES satellites, visit: <a href="http://www.goes.noaa.gov/" rel="nofollow">www.goes.noaa.gov/</a> or <a href="http://goes.gsfc.nasa.gov/" rel="nofollow">goes.gsfc.nasa.gov/</a> Credit: NASA/GSFC/Jeff Schmaltz/MODIS Land Rapid Response Team <b><a href="http://www.nasa.gov/audience/formedia/features/MP_Photo_Guidelines.html" rel="nofollow">NASA image use policy.</a></b> <b><a href="http://www.nasa.gov/centers/goddard/home/index.html" rel="nofollow">NASA Goddard Space Flight Center</a></b> enables NASA’s mission through four scientific endeavors: Earth Science, Heliophysics, Solar System Exploration, and Astrophysics. Goddard plays a leading role in NASA’s accomplishments by contributing compelling scientific knowledge to advance the Agency’s mission. <b>Follow us on <a href="http://twitter.com/NASAGoddardPix" rel="nofollow">Twitter</a></b> <b>Like us on <a href="http://www.facebook.com/pages/Greenbelt-MD/NASA-Goddard/395013845897?ref=tsd" rel="nofollow">Facebook</a></b> <b>Find us on <a href="http://instagram.com/nasagoddard?vm=grid" rel="nofollow">Instagram</a></b>
A winter storm that moved through the Mid-Atlantic on Feb. 16 and 17, 2015 extended the northeastern U.S. snowcover farther south. Until this storm hit, southern New Jersey and southeastern Pennsylvania appeared snow-free on satellite imagery from the previous week. The overnight storm blanketed the entire states of New Jersey and Pennsylvania, as seen on this Feb. 16 image. The image was taken from the MODIS or Moderate Resolution Imaging Spectroradiometer instrument that flies aboard NASA's Terra satellite. The snow cover from the storm actually extended even farther south than the image. Snowfall also blanketed West Virginia, Kentucky, Maryland, Delaware and Virginia, while freezing rain and icy conditions affected the Carolinas, Tennessee and Georgia. On Feb. 17, 2015, NOAA's National Weather Service noted "The winter storm that brought widespread snow, sleet and freezing rain to parts of the south-central U.S. and Mid-Atlantic will wind down as it moves offshore Tuesday. Lingering snow and freezing rain is possible early Tuesday for parts of the Northeast and mid-Atlantic, with rain across parts of the Southeast." Credit: NASA/GSFC/Jeff Schmaltz/MODIS Land Rapid Response Team <b><a href="http://www.nasa.gov/audience/formedia/features/MP_Photo_Guidelines.html" rel="nofollow">NASA image use policy.</a></b> <b><a href="http://www.nasa.gov/centers/goddard/home/index.html" rel="nofollow">NASA Goddard Space Flight Center</a></b> enables NASA’s mission through four scientific endeavors: Earth Science, Heliophysics, Solar System Exploration, and Astrophysics. Goddard plays a leading role in NASA’s accomplishments by contributing compelling scientific knowledge to advance the Agency’s mission. <b>Follow us on <a href="http://twitter.com/NASAGoddardPix" rel="nofollow">Twitter</a></b> <b>Like us on <a href="http://www.facebook.com/pages/Greenbelt-MD/NASA-Goddard/395013845897?ref=tsd" rel="nofollow">Facebook</a></b> <b>Find us on <a href="http://instagram.com/nasagoddard?vm=grid" rel="nofollow">Instagram</a></b>

ISS034-E-057550 (28 Feb. 2013) --- One of the Expedition 34 crew members aboard the Earth-orbiting International Space Station photographed this image featuring the Southern High Plains of northwestern Texas, directly south of the city of Amarillo (off the image to the north). At first glance the picture appears more like a map than an actual photo. The winter of 2012-2013 has been marked by powerful snowstorms with record-setting snowfall throughout much of the Midwestern United States The snowstorm that passed through this area left a record snowfall of approximately 43 centimeters (17 inches). Snow blankets the city of Canyon, Texas. Urban street grids and stream channels appear etched into the landscape by the snow, a result of both melting and street clearing in the urban regions and of the incised nature of stream channels in the surrounding plains. Agricultural fields are easily identified due to the even snow cover broken only by roadways between the fields. Palo Duro Canyon is largely free of snow along the Prairie Dog Town Fork of the Red River channel and at lower elevations, allowing the red sedimentary rocks of the canyon walls to be visible. Lake Tanglewood, a reservoir to the northeast of Canyon, appears dark due to a lack of ice cover. Another dark region to the northwest of Canyon is a feed yard for cattle; any snowfall in this area has been removed by the actions of the livestock. The image was recorded with a digital camera using a 400 millimeter lens,
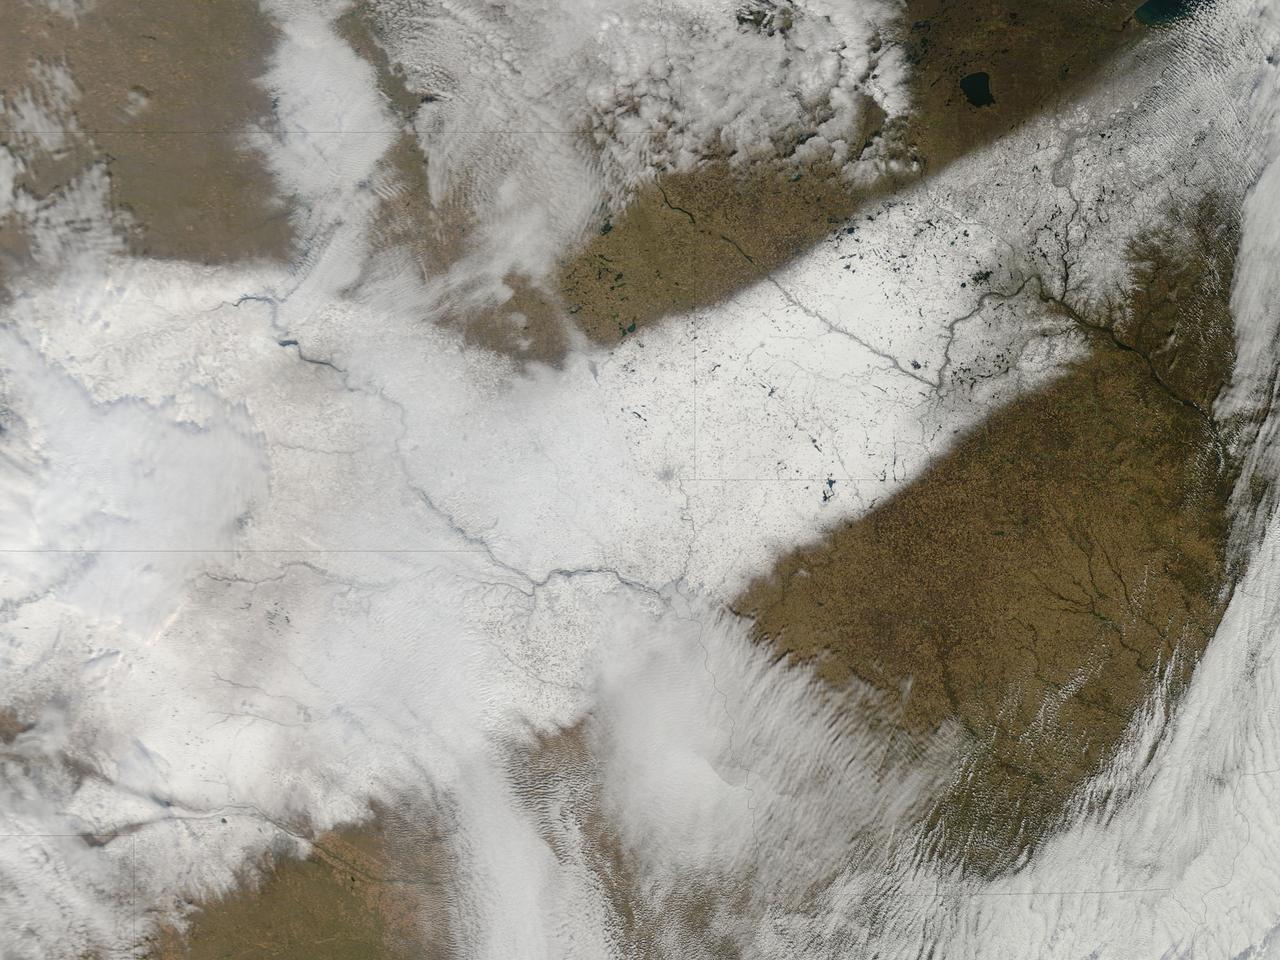
An autumn storm brought the first snow of the season to the Upper Mississippi River Valley and the Midwestern United States in early November, 2013. The Moderate Resolution Imaging Spectroradiometer (MODIS) aboard NASA’s Terra satellite captured this true color image on November 6 just as the storm was clearing. A long band of snow stretching from Colorado in the southwest to Wisconsin in the northeast marked the path of the blowing storm. According to WeatherBug, up to 10 inches blanketed Gordon, Nebraska and Pipestone, Minnesota. Most snow totals in the Central and Northern Plains and Upper Mississippi Valley ranged from 2-5 inches, while Minneapolis-St. Paul metro area picked up 1-2 inches of new snow from the event. Credit: NASA/GSFC/Jeff Schmaltz/MODIS Land Rapid Response Team <b><a href="http://www.nasa.gov/audience/formedia/features/MP_Photo_Guidelines.html" rel="nofollow">NASA image use policy.</a></b> <b><a href="http://www.nasa.gov/centers/goddard/home/index.html" rel="nofollow">NASA Goddard Space Flight Center</a></b> enables NASA’s mission through four scientific endeavors: Earth Science, Heliophysics, Solar System Exploration, and Astrophysics. Goddard plays a leading role in NASA’s accomplishments by contributing compelling scientific knowledge to advance the Agency’s mission. <b>Follow us on <a href="http://twitter.com/NASA_GoddardPix" rel="nofollow">Twitter</a></b> <b>Like us on <a href="http://www.facebook.com/pages/Greenbelt-MD/NASA-Goddard/395013845897?ref=tsd" rel="nofollow">Facebook</a></b> <b>Find us on <a href="http://instagram.com/nasagoddard?vm=grid" rel="nofollow">Instagram</a></b>
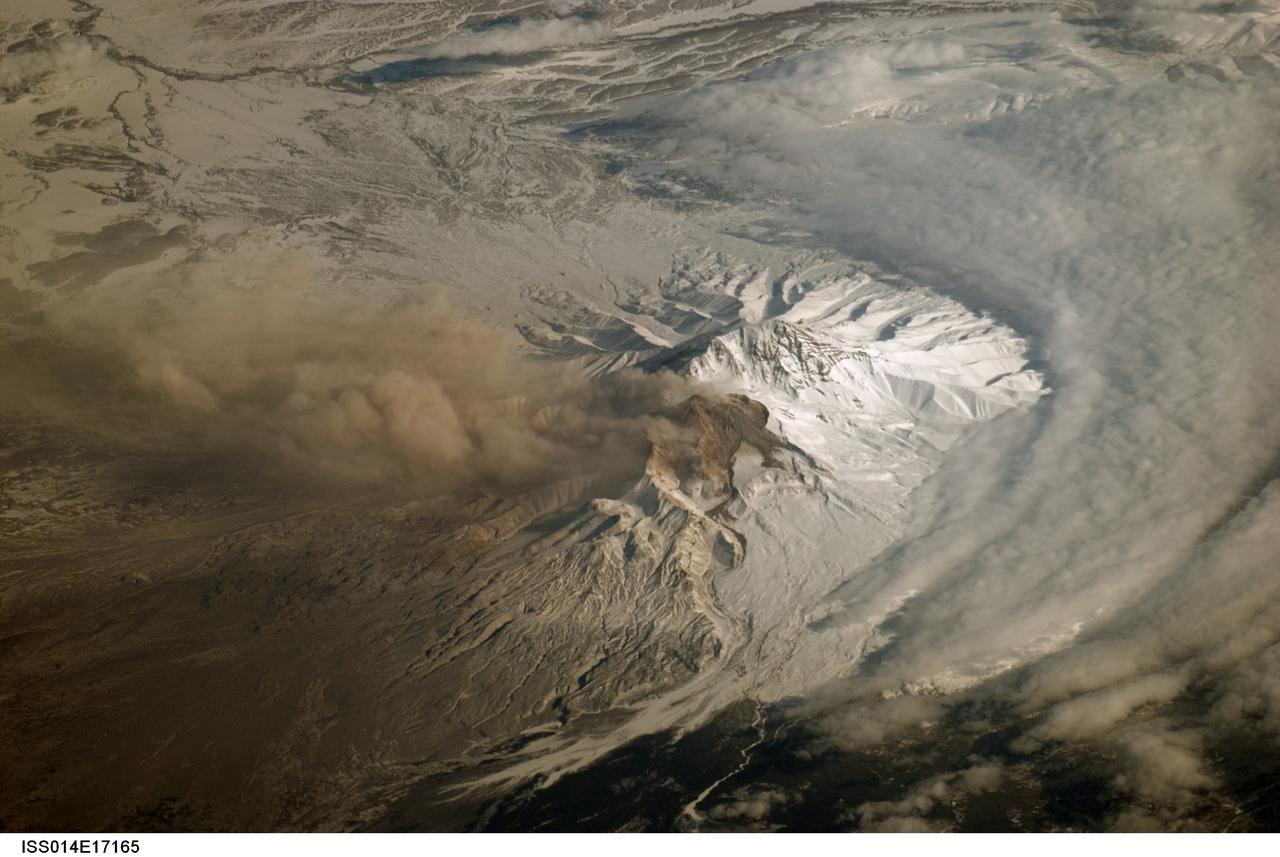
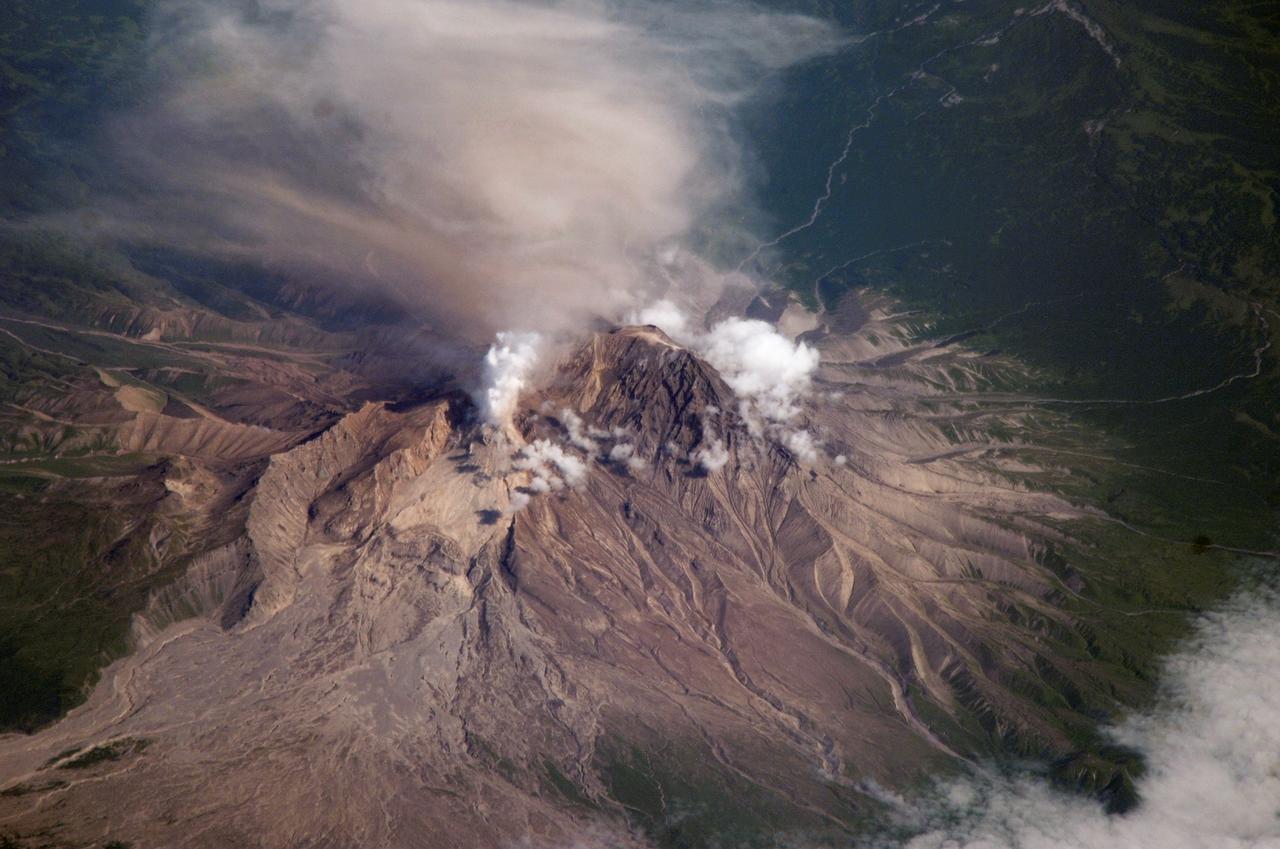
ISS014-E-17165 (21 March 2007) --- A plume at Shiveluch Volcano, Kamchatka Peninsula, Russia is featured in this image photographed by an Expedition 14 crewmember on the International Space Station. Shiveluch, one of Kamchatka's most active volcanoes, began its latest activity with gas and steam emissions in mid-late March 2007. This image was captured around mid-morning on or around March 21 2007, and shows a steam plume, probably containing minor amounts of ash, blowing westward from the summit of the volcano. The crewmembers were transiting the southern tip of Russia's Kamchatka Peninsula; with a clear view of the volcano about 5 degrees north of the ground track of the station. Subsequent eruptions on March 29 and 30 have been recorded by the Kamchatka Volcano Observatory and NASA. The volcano's southern flank, clearly visible in this northeast-looking oblique view, comprises a horseshoe-shaped caldera from a late Pleistocene eruption, subsequently blanketed by additional ash deposits, and highlighted by the snow cover. The peak of Shiveluch is a distinctive brown color due to the removal of snow, exposure of rock forming the summit, and deposits of new ash. The relatively smooth landscape of the south contrasts with the large, steep valleys on the northern slope of the volcano. Low clouds wrap around the eastern part of the mountain, obscuring the lower elevations.
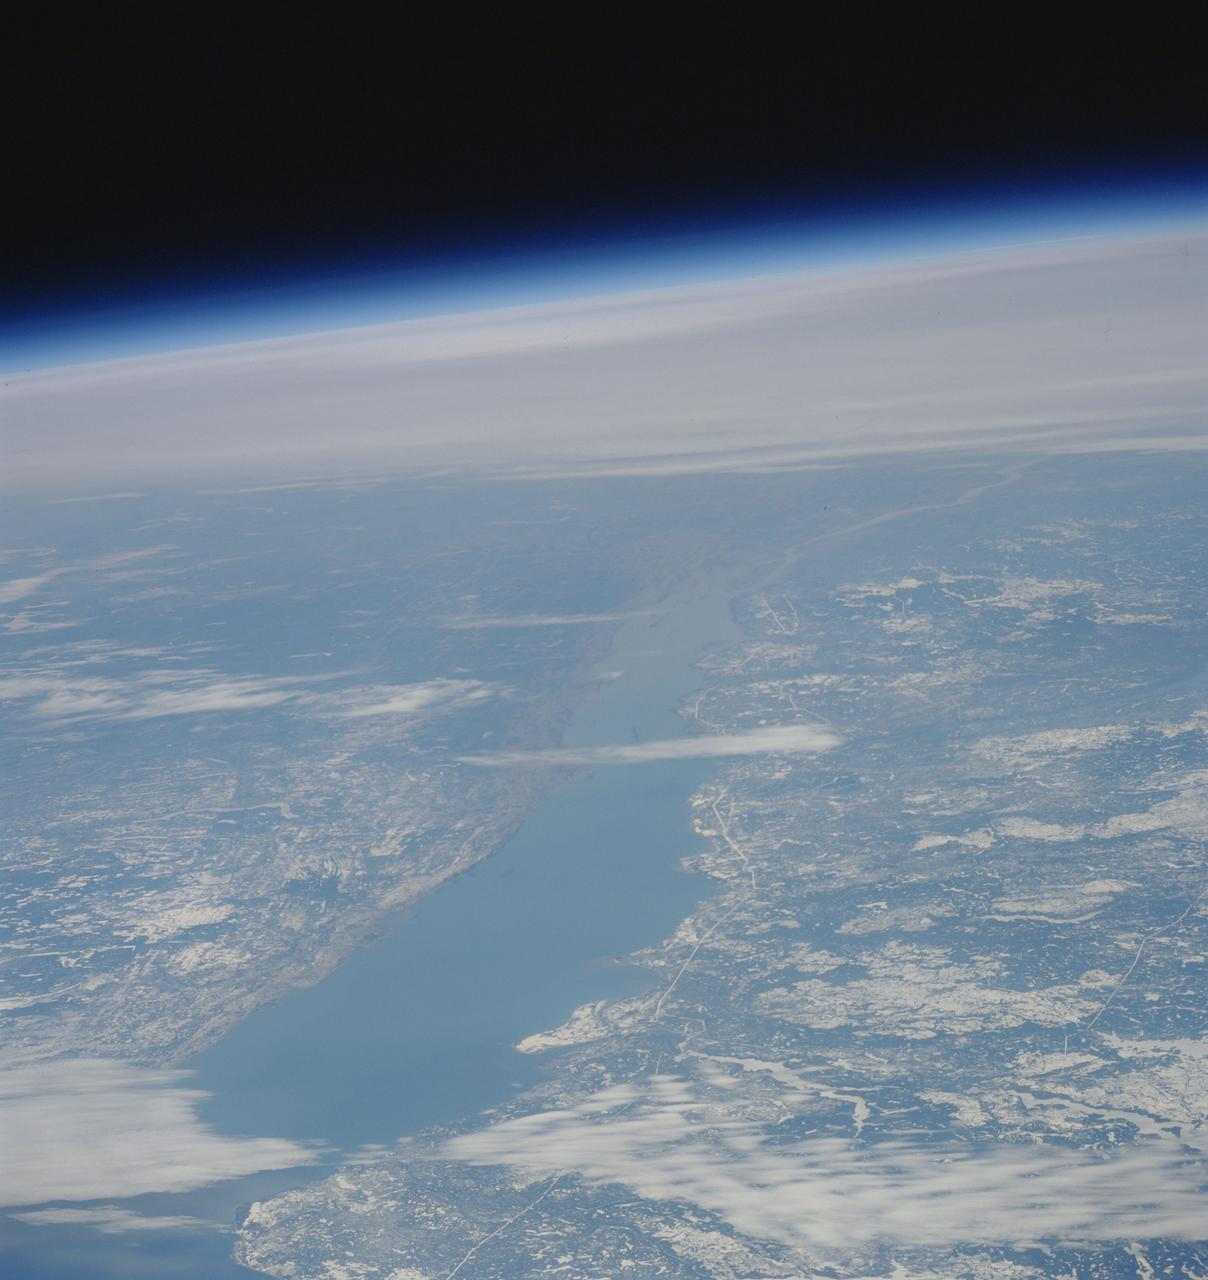
STS039-83-059 (28 April-6 May 1991) --- This high oblique view taken from over southeastern Quebec, looking to the southwest down the estuary of the St. Lawrence River (Fleuve Saint-Laurent). The primary road on the north side of the river (right) runs from Quebec, at the end of the estuary behind Ile D'Orleans, northeast to its terminus at Sept-Iles (near nadir, and not visible in this scene). The St. Lawrence disappears underneath the cloud bank over western New York and Ontario just to the west of Montreal. The light snow cover enhances the area of forests (dark) and non-forest (white). In this view, most of the irregular areas of white on the right side of the St. Lawrence River are previously forested areas that were burned over during the extraordinary Canadian forest fires of 1989.
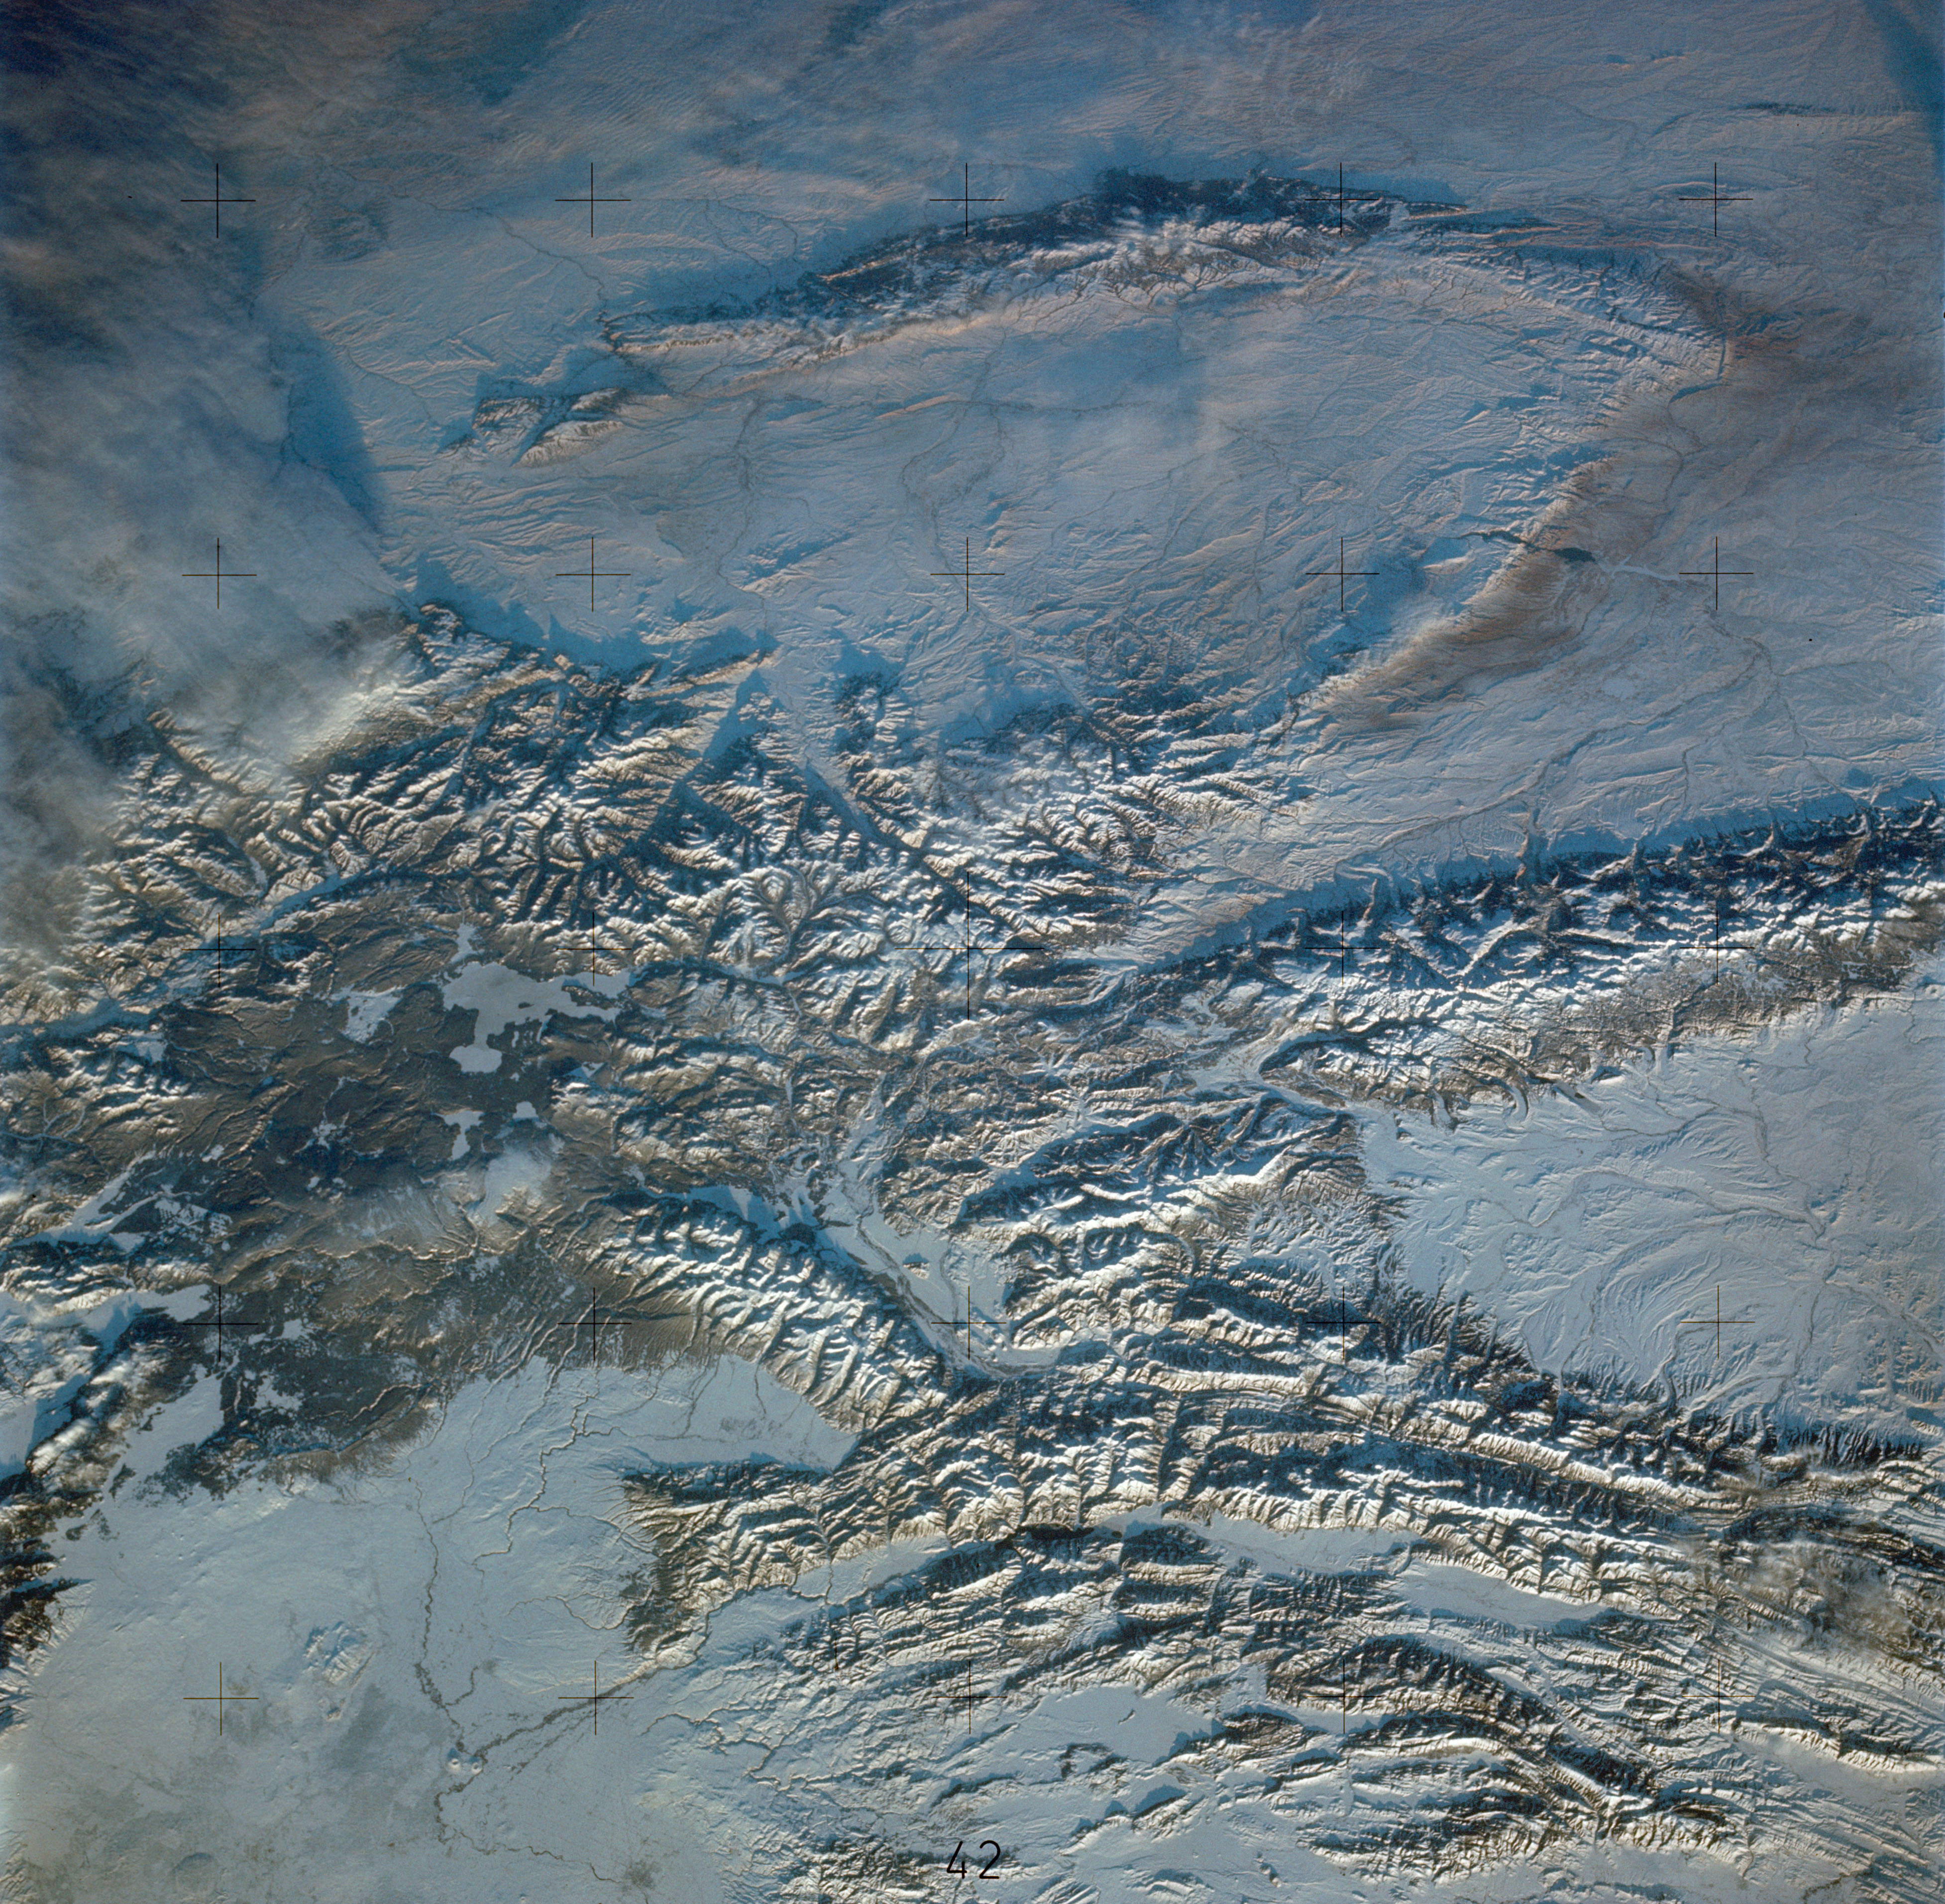
SL4-138-3846 (February 1974) --- A near vertical view of the snow-covered northwest corner of Wyoming as seen from the Skylab space station in Earth orbit. A Skylab 4 crewman used a hand-held 70mm Hasselblad camera to take this picture. A small portion of Montana and Idaho is seen in this photograph also. The dark area is Yellowstone National Park. The largest body of water is Yellowstone Lake. The Absaroka Range is immediately east and northeast of Yellowstone Lake. The elongated range in the eastern part of the picture is the Big Horn Mountain range. The Wind River Range is at bottom center. The Grand Teton National Park area is almost straight south of Yellowstone Lake. Approximately 30 per cent of the state of Wyoming can be seen in this photograph. Photo credit: NASA
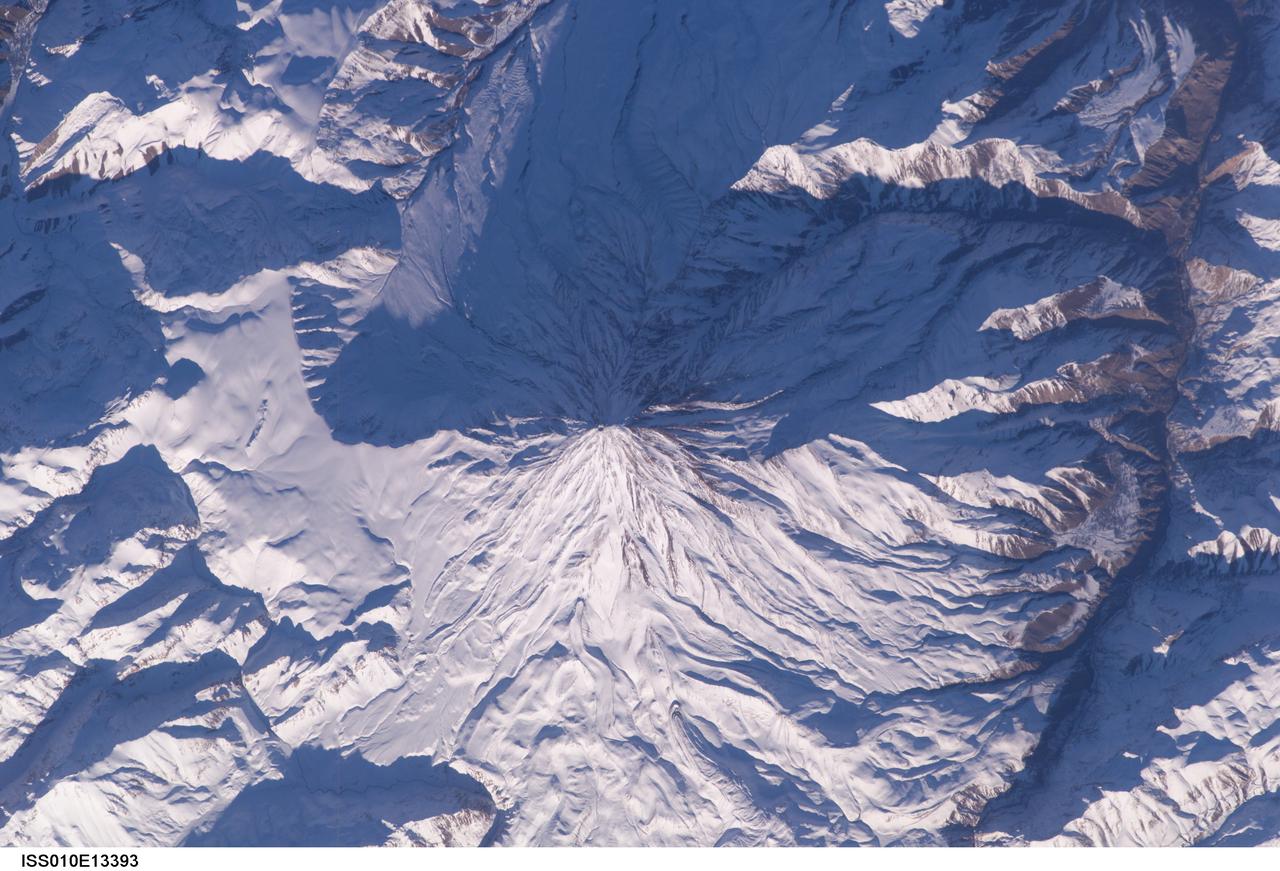
ISS010-E-13393 (15 January 2005) --- Mt. Damavand, Iran is featured in this image photographed by an Expedition 10 crewmember on the International Space Station (ISS). Located approximately 50 kilometers to the northeast of Tehran, Mt. Damavand is an impressive stratovolcano that reaches 5,670 meters (18,598 feet) in elevation. Damavand, which is part of the Alborz mountain range that borders the Caspian Sea to the north, is believed by scientists to be a young volcano that has mostly formed during the Holocene Epoch (over approximately the last 10,000 years). The western flank of the volcano includes solidified lava flows with flow levees – “walls” formed as the side edges of flowing lava cooled rapidly, forming a chute that channeled the hotter interior lava. Two such flows with well-defined levees are highlighted by snow on the mountainside (center). Damavand is the highest peak in Iran and the highest volcano in the Middle East.
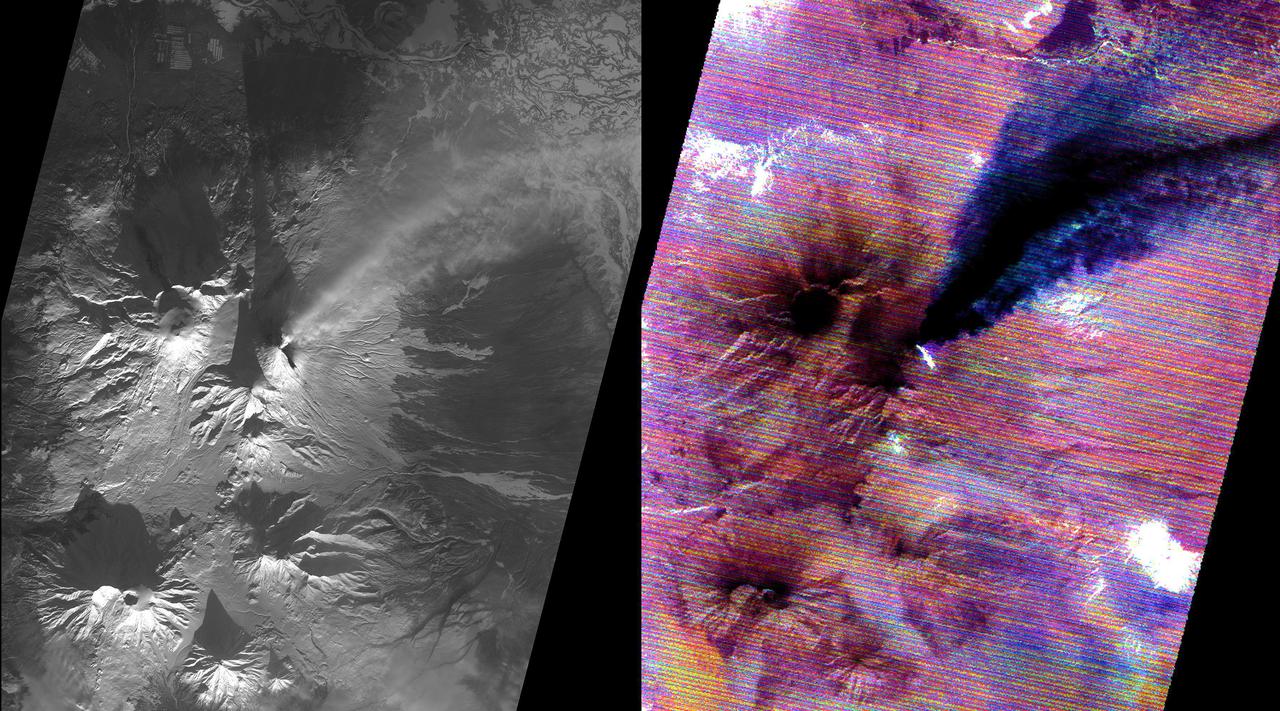
Kamchatka, Russia hosts some of the most active volcanoes on earth. Among those is Kliuchevskoi stratovolcano, erupting almost constantly, and the tallest volcano in Kamchatka. In this snow-covered winter image (left), an eruption plume rising to 7.5 km, is streaming from the summit in a northeast direction. The thermal infrared image (right) reveals additional information: the bright material on the east side of the summit is a hot, recent lava flow; the eruption plume is displayed in blue, revealing its composition as dominated by ice mixed with ash. The thermal data are noisy because of the very low signal from the cold scene. The data were acquired December 2, 2020, cover an area of 27 by 30 km, and are located at 56.1 degrees north, 160.7 degrees east. https://photojournal.jpl.nasa.gov/catalog/PIA24282

NASA Image acquired March 24, 2010 To learn more and to download a high res version of this image go here: <a href="http://earthobservatory.nasa.gov/IOTD/view.php?id=43252" rel="nofollow">earthobservatory.nasa.gov/IOTD/view.php?id=43252</a> Iceland’s Eyjafjallajökull Volcano burst into life for the first time in 190 years on March 20, 2010. A 500-meter- (2,000-foot) long fissure opened in the Fimmvörduháls pass to the west of the ice-covered summit of Eyjafjallajökull. Lava fountains erupted fluid magma, which quickly built several hills of bubble-filled lava rocks (scoria) along the vent. A lava flow spread northeast, spilling into Hrunagil Gully. This natural-color satellite image shows lava fountains, lava flows, a volcanic plume, and steam from vaporized snow. The image was acquired on March 24, 2010, by the Advanced Land Imager (ALI) aboard NASA’s Earth Observing-1 (EO-1) satellite. The lava fountains are orange-red, barely visible at the 10-meter (33-foot) resolution of the satellite. The scoria cones surrounding the fissure are black, as is the lava flow extending to the northeast. White volcanic gases escape from the vent and erupting lava, while a steam plume rises where the hot lava meets snow. (The bright green color along the edge of the lava flow is an artifact of the sensor.) The eruption of Eyjafjallajökull was presaged by a series of earthquakes starting in early March. Over time, the earthquakes rose towards the surface, and land near the volcano rose at least 40 millimeters (2 inches)—both indications that magma was moving underneath the volcano. The eruption continued through at least March 26th, and may continue for several more months. Previous eruptions in the area have caused flooding due to the melting of glacial ice (a Jökulhlaup), but the current eruption is in an area covered by winter snow, not permanent ice. Although some past eruptions of Eyjafjallajökull were followed by larger, explosive eruptions at nearby Katla Volcano, there is currently no sign of activity at Katla. NASA image by Robert Simmon, using ALI data from the EO-1 team. Caption by Robert Simmon. Instrument: EO-1 - ALI <b><a href="http://www.nasa.gov/centers/goddard/home/index.html" rel="nofollow">NASA Goddard Space Flight Center</a></b> is home to the nation's largest organization of combined scientists, engineers and technologists that build spacecraft, instruments and new technology to study the Earth, the sun, our solar system, and the universe.
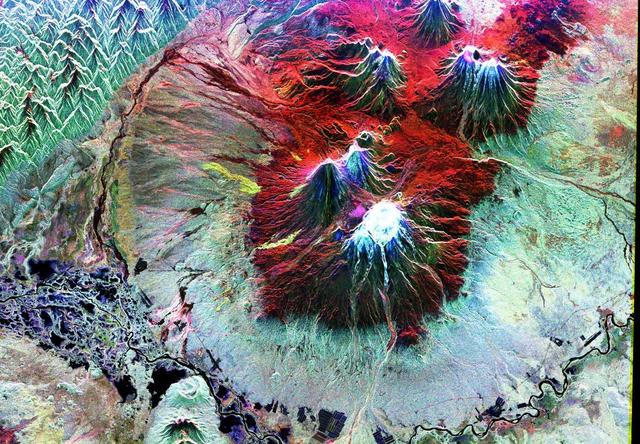
This is an image of the area of Kliuchevskoi volcano, Kamchatka, Russia, which began to erupt on September 30, 1994. Kliuchevskoi is the blue triangular peak in the center of the image, towards the left edge of the bright red area that delineates bare snow cover. The image was acquired by the Spaceborne Imaging Radar-C/X-band Synthetic Aperture Radar (SIR-C/X-SAR) aboard the space shuttle Endeavour on its 88th orbit on October 5, 1994. The image shows an area approximately 75 kilometers by 100 kilometers (46 miles by 62 miles) that is centered at 56.07 degrees north latitude and 160.84 degrees east longitude. North is toward the bottom of the image. The radar illumination is from the top of the image. The Kamchatka volcanoes are among the most active volcanoes in the world. The volcanic zone sits above a tectonic plate boundary, where the Pacific plate is sinking beneath the northeast edge of the Eurasian plate. The Endeavour crew obtained dramatic video and photographic images of this region during the eruption, which will assist scientists in analyzing the dynamics of the recent activity. The colors in this image were obtained using the following radar channels: red represents the L-band (horizontally transmitted and received); green represents the L-band (horizontally transmitted and vertically received); blue represents the C-band (horizontally transmitted and vertically received). In addition to Kliuchevskoi, two other active volcanoes are visible in the image. Bezymianny, the circular crater above and to the right of Kliuchevskoi, contains a slowly growing lava dome. Tolbachik is the large volcano with a dark summit crater near the upper right edge of the red snow covered area. The Kamchatka River runs from right to left across the bottom of the image. The current eruption of Kliuchevskoi included massive ejections of gas, vapor and ash, which reached altitudes of 15,000 meters (50,000 feet). Melting snow mixed with volcanic ash triggered mud flows on the flanks of the volcano. Paths of these flows can be seen as thin lines in various shades of blue and green on the north flank in the center of the image. http://photojournal.jpl.nasa.gov/catalog/PIA01765

NOAA's GOES-East satellite provided a look at the frigid eastern two-thirds of the U.S. on Jan. 7, 2015, that shows a blanket of northern snow, lake-effect snow from the Great Lakes and clouds behind the Arctic cold front. A visible picture captured at 1600 UTC (11 a.m. EST) showed the effects of the latest Arctic outbreak. The cold front that brought the Arctic air has moved as far south as Florida, and stretches back over the Gulf of Mexico and just west of Texas today. The image shows clouds behind the frontal boundary stretching from the Carolinas west over the Heartland. Farther north, a wide band of fallen snow covers the ground from New England west to Montana, with rivers appearing like veins. The GOES-East satellite image also shows wind-whipped lake-effect snows off the Great Lakes, blowing to the southeast. Meanwhile, Florida, the nation's warm spot appeared almost cloud-free. To create the image, NASA/NOAA's GOES Project used cloud data from NOAA's GOES-East satellite and overlaid it on a true-color image of land and ocean created by data from the Moderate Resolution Imaging Spectroradiometer, or MODIS, instrument that flies aboard NASA's Aqua and Terra satellites. Together, those data created the entire picture of the Arctic outbreak. The forecast from NOAA's National Weather Service Weather Prediction Center (WPC) calls for more snow along the Appalachian Mountains from Tennessee north to upstate New York. Snow is also expected to fall from New England west to Montana, and in eastern New Mexico and the Colorado Rockies. The WPC summary for Jan. 7 noted: Bitter cold will be felt from the western High Plains to the Mid-Atlantic and Northeast U.S. for the next few days. Widespread subzero overnight lows are forecast for the Dakotas, Upper Midwest, Great Lakes, and interior New England. Wind Chill Advisories and Warnings are in effect for many of these areas. GOES-East provides visible and infrared images over the eastern U.S. and the Atlantic Ocean from its fixed orbit in space. NOAA's GOES satellites provide the kind of continuous monitoring necessary for intensive data analysis. Geostationary describes an orbit in which a satellite is always in the same position with respect to the rotating Earth. This allows GOES to hover continuously over one position on Earth's surface, appearing stationary. As a result, GOES provide a constant vigil for the atmospheric triggers for severe weather conditions such as tornadoes, flash floods, hail storms and hurricanes. For updated information about the storm system, visit NOAA's NWS website: <a href="http://www.weather.gov" rel="nofollow">www.weather.gov</a> For more information about GOES satellites, visit: <a href="http://www.goes.noaa.gov/" rel="nofollow">www.goes.noaa.gov/</a> or goes.gsfc.nasa.gov/ Rob Gutro NASA's Goddard Space Flight Center, Greenbelt, Md. <b><a href="http://www.nasa.gov/audience/formedia/features/MP_Photo_Guidelines.html" rel="nofollow">NASA image use policy.</a></b> <b><a href="http://www.nasa.gov/centers/goddard/home/index.html" rel="nofollow">NASA Goddard Space Flight Center</a></b> enables NASA’s mission through four scientific endeavors: Earth Science, Heliophysics, Solar System Exploration, and Astrophysics. Goddard plays a leading role in NASA’s accomplishments by contributing compelling scientific knowledge to advance the Agency’s mission. <b>Follow us on <a href="http://twitter.com/NASAGoddardPix" rel="nofollow">Twitter</a></b> <b>Like us on <a href="http://www.facebook.com/pages/Greenbelt-MD/NASA-Goddard/395013845897?ref=tsd" rel="nofollow">Facebook</a></b> <b>Find us on <a href="http://instagram.com/nasagoddard?vm=grid" rel="nofollow">Instagram</a></b>
Another large snowstorm affecting New England was dropping more snow on the region and breaking records on February 9, as NOAA's GOES-East satellite captured an image of the clouds associated with the storm system. On Feb. 9, NOAA's National Weather Service in Boston, Massachusetts noted that "The 30-day snowfall total at Boston ending 7 a.m. this morning is 61.6 inches. This exceeds the previous maximum 30 day snowfall total on record at Boston, which was 58.8 inches ending Feb 7 1978." The GOES-East image was created by NASA/NOAA's GOES Project at NASA's Goddard Space Flight Center in Greenbelt, Maryland. It showed a blanket of clouds over the U.S. northeast that stretched down to the Mid-Atlantic where there was no snow on the ground in Washington, D.C. NOAA's National Weather Service Weather Prediction Center provided a look at the extent of the storm system and noted "Heavy snow will impact portions of New York State and New England as the new week begins. Freezing rain will spread from western Pennsylvania to Long Island, with rain for the mid-Atlantic states." The low pressure area bringing the snow to the northeast was located in central Pennsylvania. A cold front extended southward from the low across the Tennessee Valley while a stationary boundary extended eastward from the low across the central mid-Atlantic. To create the image, NASA/NOAA's GOES Project takes the cloud data from NOAA's GOES-East satellite and overlays it on a true-color image of land and ocean created by data from the Moderate Resolution Imaging Spectroradiometer, or MODIS, instrument that flies aboard NASA's Aqua and Terra satellites. Together, those data created the entire picture of the storm. NOAA's GOES satellites provide the kind of continuous monitoring necessary for intensive data analysis. Geostationary describes an orbit in which a satellite is always in the same position with respect to the rotating Earth. This allows GOES to hover continuously over one position on Earth's surface, appearing stationary. As a result, GOES provide a constant vigil for the atmospheric triggers for severe weather conditions such as tornadoes, flash floods, hail storms and hurricanes. For updated information about the storm system, visit NOAA's NWS website: <a href="http://www.weather.gov" rel="nofollow">www.weather.gov</a> For more information about GOES satellites, visit: <a href="http://www.goes.noaa.gov/" rel="nofollow">www.goes.noaa.gov/</a> or goes.gsfc.nasa.gov/ Rob Gutro NASA's Goddard Space Flight Center <b><a href="http://goes.gsfc.nasa.gov/" rel="nofollow">Credit: NOAA/NASA GOES Project</a></b> <b><a href="http://www.nasa.gov/audience/formedia/features/MP_Photo_Guidelines.html" rel="nofollow">NASA image use policy.</a></b> <b><a href="http://www.nasa.gov/centers/goddard/home/index.html" rel="nofollow">NASA Goddard Space Flight Center</a></b> enables NASA’s mission through four scientific endeavors: Earth Science, Heliophysics, Solar System Exploration, and Astrophysics. Goddard plays a leading role in NASA’s accomplishments by contributing compelling scientific knowledge to advance the Agency’s mission. <b>Follow us on <a href="http://twitter.com/NASAGoddardPix" rel="nofollow">Twitter</a></b> <b>Like us on <a href="http://www.facebook.com/pages/Greenbelt-MD/NASA-Goddard/395013845897?ref=tsd" rel="nofollow">Facebook</a></b> <b>Find us on <a href="http://instagram.com/nasagoddard?vm=grid" rel="nofollow">Instagram</a></b>
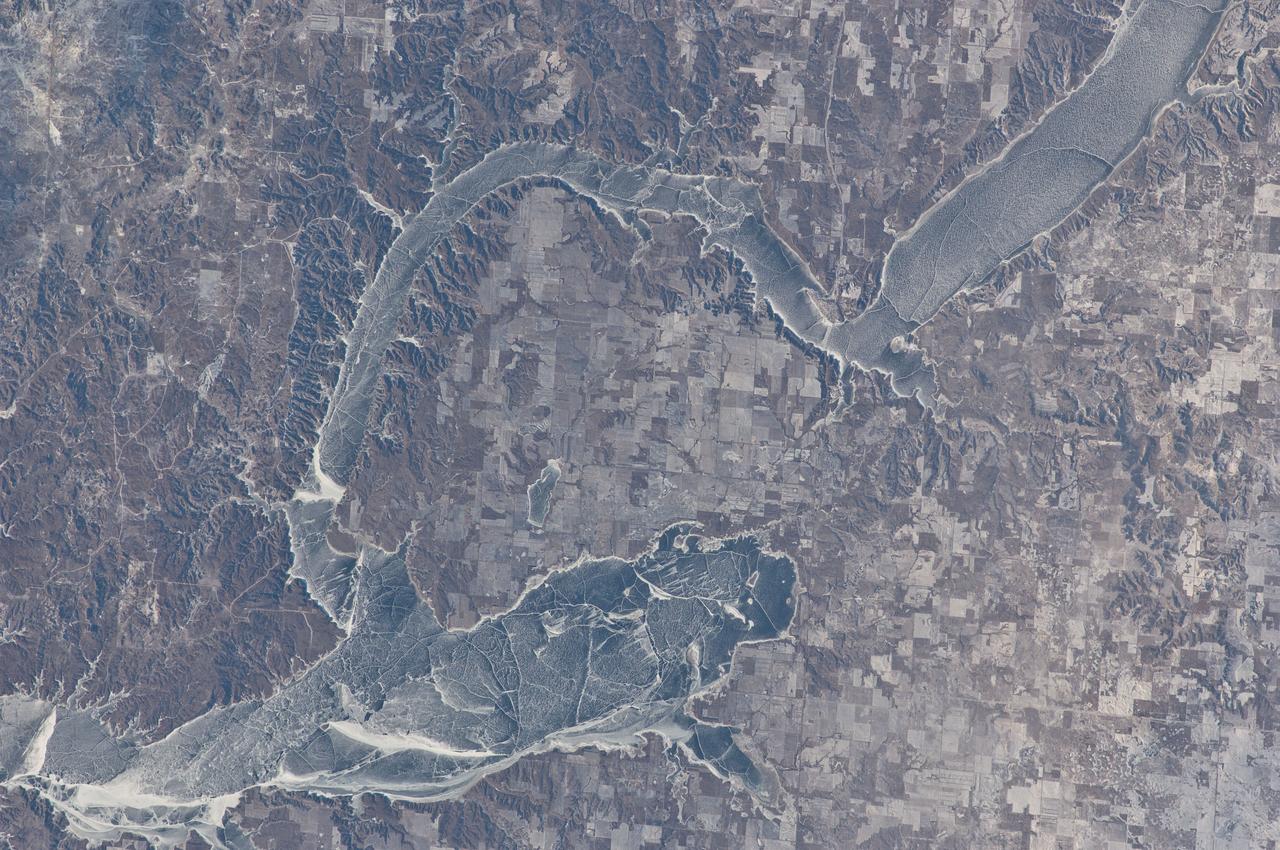
ISS030-E-059433 (19 Jan. 2012) --- Ice cover on Lake Sakakawea in North Dakota is featured in this image photographed by an Expedition 30 crew member on the International Space Station. This striking photograph illustrates the harsh winter conditions frequently experienced in North Dakota. Ice covers the surface of northwestern Lake Sakakawea, a reservoir on the Missouri River in west-central North Dakota. A local weather station near New Town, ND reported an air temperature of approximately -24 °C (-11 °F), with a wind chill of approximately -32 °C (-25 °F) at 10:36 local time – six minutes before the image was taken. In addition to the grey ice on the lake, a dusting of white snow highlights agricultural fields to the north and northeast, as well as fissures and irregularities in the ice surfaces. For a sense of scale, the arms of the lake to either side of New Town are approximately 10 kilometers (6 miles) apart. Lake Sakakawea is named—in the Hidatsa language—for the Shoshone woman generally known as Sacagawea, or “Bird Woman”. She accompanied the Lewis and Clark Expedition in 1805–1806 as an interpreter and guide. The lake was created following the completion of Garrison Dam (not shown) on the Missouri River in 1954. With a surface area of approximately 148,924 hectares (368,000 acres) and length of 286 kilometers (178 miles), Lake Sakakawea is one of the largest artificial reservoirs in the USA.
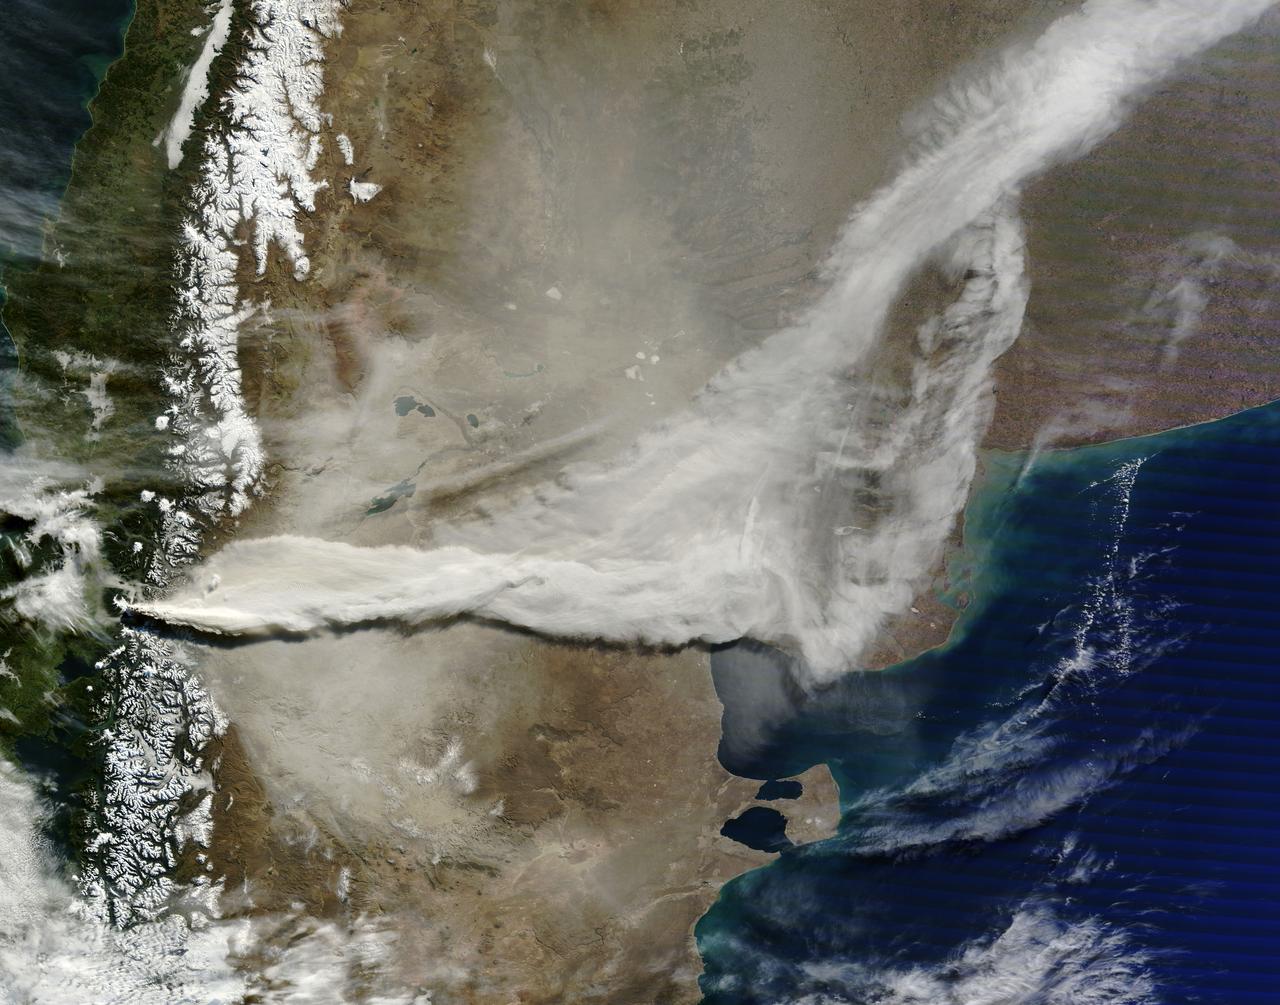
June 13, 2011 The MODIS instrument on NASA's Terra satellite captured this visible image of the ash plume from the eruption of the Puyehue-Cordón Caulle volcano, Chile on June 13 at 14:35 UTC (10:35 a.m. EDT). The wind shifted from the day before and was now blowing from the west and southwest, pushing the plume east and northeast. Note the snow on the Andes Mountain rage. Image Credit: NASA Goddard/MODIS Rapid Response, Jeff Schmaltz/Text: NASA/Rob Gutro <b><a href="http://www.nasa.gov/centers/goddard/home/index.html" rel="nofollow">NASA Goddard Space Flight Center</a></b> enables NASA’s mission through four scientific endeavors: Earth Science, Heliophysics, Solar System Exploration, and Astrophysics. Goddard plays a leading role in NASA’s accomplishments by contributing compelling scientific knowledge to advance the Agency’s mission. <b>Follow us on <a href="http://twitter.com/NASA_GoddardPix" rel="nofollow">Twitter</a></b> <b>Join us on <a href="http://www.facebook.com/pages/Greenbelt-MD/NASA-Goddard/395013845897?ref=tsd" rel="nofollow">Facebook</a></b> <b>Find us on <a href="http://web.stagram.com/n/nasagoddard/?vm=grid" rel="nofollow">Instagram</a></b>
The strong coastal storm currently off the coast of New England will continue to bring strong winds and heavy snow to coastal portions of the Northeast on Wednesday. The storm will move into the Canadian Maritimes by Thursday. This image was taken by GOES East at 17:31 UTC on March 26, 2014. <b><a href="http://goes.gsfc.nasa.gov/" rel="nofollow">Credit: NOAA/NASA GOES Project</a></b> <b><a href="http://www.nasa.gov/audience/formedia/features/MP_Photo_Guidelines.html" rel="nofollow">NASA image use policy.</a></b> <b><a href="http://www.nasa.gov/centers/goddard/home/index.html" rel="nofollow">NASA Goddard Space Flight Center</a></b> enables NASA’s mission through four scientific endeavors: Earth Science, Heliophysics, Solar System Exploration, and Astrophysics. Goddard plays a leading role in NASA’s accomplishments by contributing compelling scientific knowledge to advance the Agency’s mission. <b>Follow us on <a href="http://twitter.com/NASAGoddardPix" rel="nofollow">Twitter</a></b> <b>Like us on <a href="http://www.facebook.com/pages/Greenbelt-MD/NASA-Goddard/395013845897?ref=tsd" rel="nofollow">Facebook</a></b> <b>Find us on <a href="http://instagram.com/nasagoddard?vm=grid" rel="nofollow">Instagram</a></b>
ISS015-E-16913 (10 July 2007) --- Shiveluch Volcano, Kamchatka, Russian Far East is featured in this image photographed by an Expedition 15 crewmember on the International Space Station. Shiveluch is one of the biggest and most active of a line of volcanoes along the spine of the Kamchatka peninsula in easternmost Russia. In turn the volcanoes and peninsula are part of the tectonically active "Ring of Fire" that almost surrounds the Pacific Ocean, denoted by active volcanoes and frequent earthquakes. Shiveluch occupies the point where the northeast-trending Kamchatka volcanic line intersects the northwest-trending Aleutian volcanic line. Junctions such as this are typically points of intense volcanic activity. According to scientists, the summit rocks of Shiveluch have been dated at approximately 65,000 years old. Lava layers on the sides of the volcano reveal at least 60 major eruptions in the last 10,000 years, making it the most active volcano in the 2,200 kilometer distance that includes the Kamchatka peninsula and the Kuril island chain. Shiveluch rises from almost sea level to well above 3,200 miles (summit altitude 3,283 miles) and is often capped with snow. In this summer image however, the full volcano is visible, actively erupting ash and steam in late June or early July, 2007. The dull brown plume extending from the north of the volcano summit is most likely a combination of ash and steam (top). The two larger white plumes near the summit are dominantly steam, a common adjunct to eruptions, as rain and melted snow percolate down to the hot interior of the volcano. The sides of the volcano show many eroded stream channels. The south slope also reveals a long sloping apron of collapsed material, or pyroclastic flows. Such debris flows have repeatedly slid down and covered the south side of the volcano during major eruptions when the summit lava domes explode and collapse (this occurred during major eruptions in 1854 and 1964). Regrowth of the forest on the south slope (note the contrast with the eastern slope) has been foiled by the combined effects of continued volcanic activity, instability of the debris flows and the short growing season.
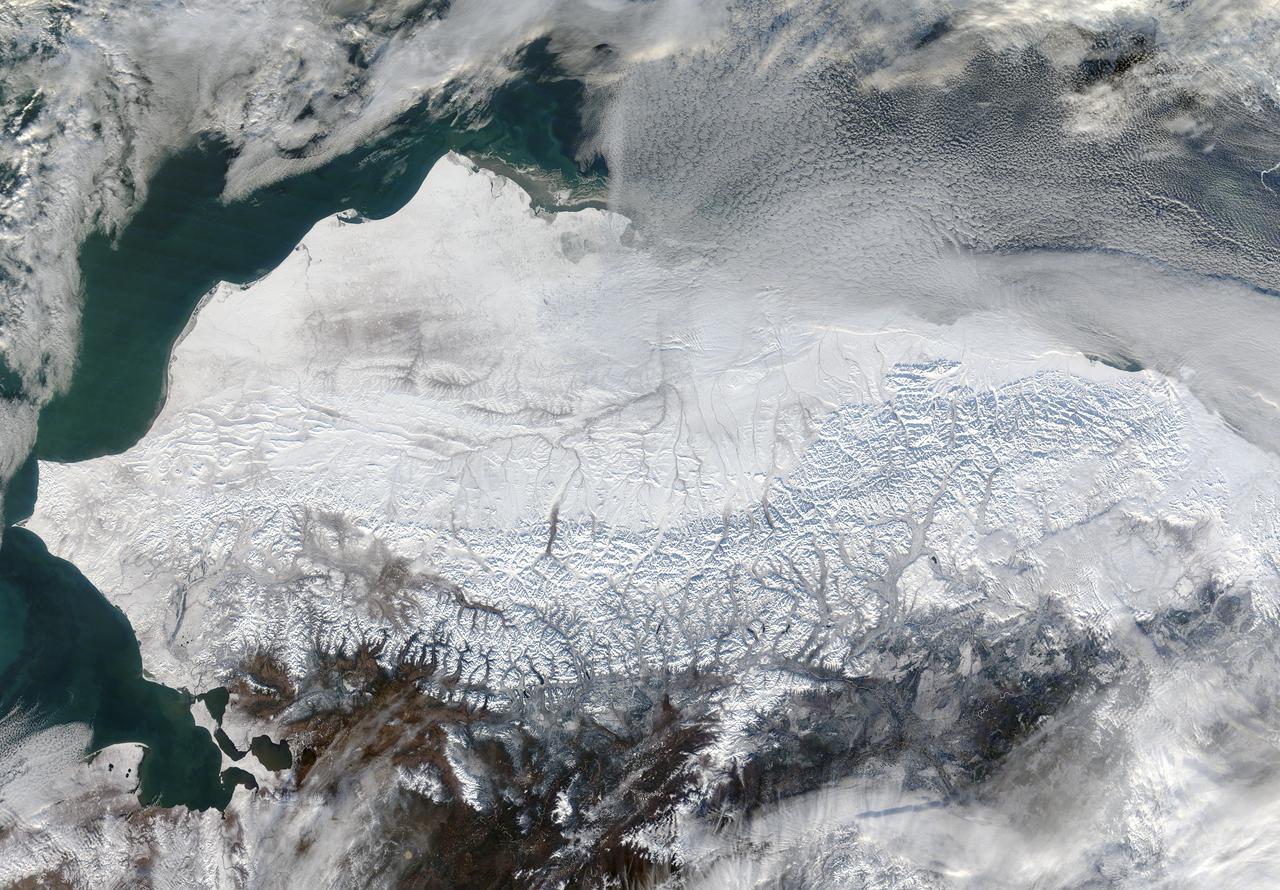
As autumn colors moved across much of the lower forty-eight states in mid-October 2015, winter weather had already arrived in Alaska. The Moderate Resolution Imaging Spectroradiometer (MODIS) aboard NASA’s Terra satellite captured this true-color image of the icy scene on October 16 as it passed over the region. Point Barrow, the northern-most location in the United States sits between the Chukchi Sea (west) and the Beaufort Sea on the east. The rugged peaks of the Brooks Range can be seen along the southern section of the image. North of the Brooks Range the land is almost entirely covered with snow; to the south the tan and browns visible between snow marks uncovered land. Sea ice lies over the waters near the coasts of much of Alaska’s North Slope, especially east of Point Barrow. White cloud banks are notable in the northeast and southeast sections of the image. Credit: NASA/GSFC/Jeff Schmaltz/MODIS Land Rapid Response Team <b><a href="http://www.nasa.gov/audience/formedia/features/MP_Photo_Guidelines.html" rel="nofollow">NASA image use policy.</a></b> <b><a href="http://www.nasa.gov/centers/goddard/home/index.html" rel="nofollow">NASA Goddard Space Flight Center</a></b> enables NASA’s mission through four scientific endeavors: Earth Science, Heliophysics, Solar System Exploration, and Astrophysics. Goddard plays a leading role in NASA’s accomplishments by contributing compelling scientific knowledge to advance the Agency’s mission. <b>Follow us on <a href="http://twitter.com/NASAGoddardPix" rel="nofollow">Twitter</a></b> <b>Like us on <a href="http://www.facebook.com/pages/Greenbelt-MD/NASA-Goddard/395013845897?ref=tsd" rel="nofollow">Facebook</a></b> <b>Find us on <a href="http://instagrid.me/nasagoddard/?vm=grid" rel="nofollow">Instagram</a></b>
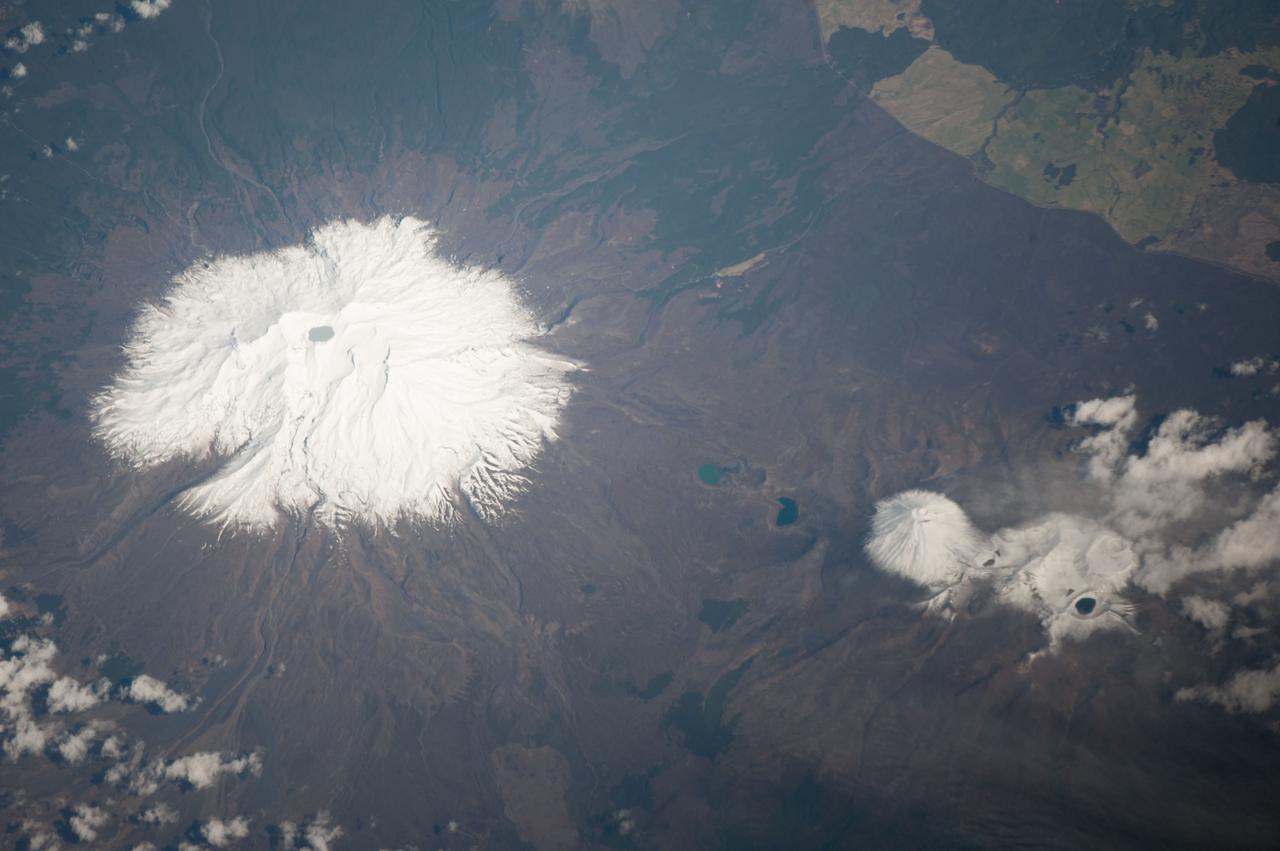
ISS037-E-005089 (30 Sept. 2013) --- Ruapehu volcano and Tongariro volcanic complex in New Zealand are featured in this image photographed by an Expedition 37 crew member on the International Space Station. Mount Ruapehu is one of several volcanic centers on the North Island of New Zealand, but is the largest and historically most active. The 2,797-meter elevation volcano is also the highest mountain on North Island and is covered with snow on its upper slopes. Scientists believe while there are three summit craters that have been active during the last 10,000 years, South Crater is the only historically active one. This vent is currently filled with a lake (Crater Lake), visible at left; eruptions from the vent, mixed with water from the lake can lead to the formation of lahars – destructive gravity flows of mixed fluid and volcanic debris that form a hazard to ski areas on the upper slopes and lower river valleys. The most recent significant eruption of Ruapehu took place in 2007 and formed both an eruption plume and lahars. The volcano is surrounded by a 100-cubic-kilometer ring plain of volcaniclastic debris that appears dark grey in the image, whereas vegetated areas appear light to dark green. Located to the northeast of the Ruapehu volcanic structure, the Tongariro volcanic complex (lower right) is currently in an active eruptive phase – the previous eruptive phase ended in 1897. Explosive eruptions occurred in 2012, which have been followed by steam and gas plumes observed almost daily. According to scientists, the volcanic complex contains multiple cones constructed over the past 275,000 years. The most prominent of these, Mount Ngauruhoe, last erupted in 1975. Like Ruapehu, the upper slopes of both Ngauruhoe and the upper peaks of Tongariro are snow-covered. Scattered cloud cover is also visible near Tongariro at lower right.
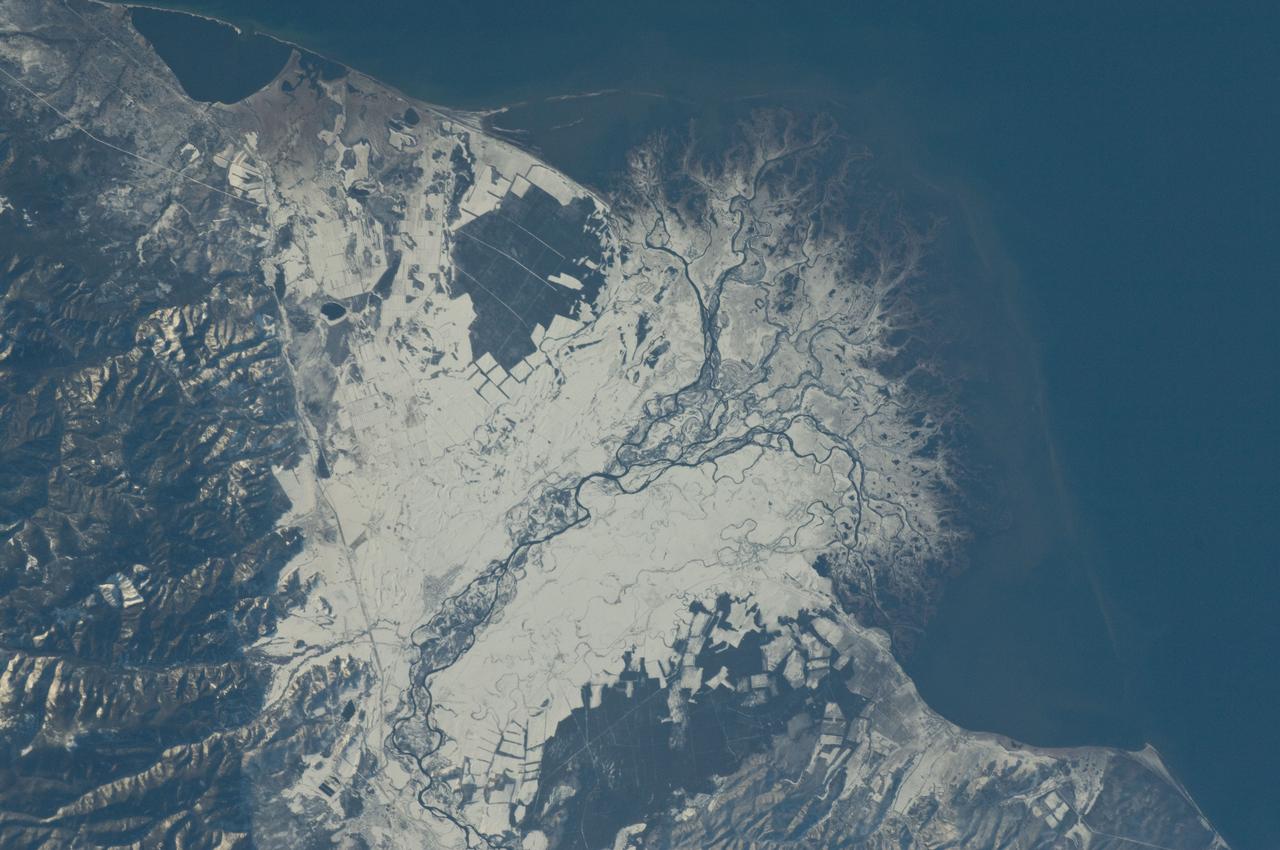
ISS029-E-037915 (3 Nov. 2011) --- Snowfall on the Selenga River Delta, Russian Federation is featured in this image photographed by an Expedition 29 crew member on the International Space Station. This photograph illustrates the Selenga River Delta built out into Lake Baikal in Russia. The Selenga River delta (center) is lobate in form, with an intricate network of distributary channels and levees surrounded by marshlands building out into Lake Baikal. This suggests that development of the delta is governed by the sediment load carried by the river, and any modifications of form due to lake tides or waves are relatively minor. Further out, dark brown depositional bars are visible forming a rough arc marking the edge of the delta. Snow cover on the river floodplain highlights numerous secondary channels, as well as channels previously occupied by the river but now abandoned. The regular outlines of agricultural fields to the southwest and northeast of the river are also highlighted by the snow cover. Lake Baikal is a World Heritage Site. The Selenga River is the major contributor of water to Lake Baikal; it occupies approximately 82 per cent of the watershed area for the lake. The wetlands of the Selenga River delta are designated as a RAMSAR site and provide valuable habitat for more than 170 species of birds, including many that are migrating. Like Baikal, the Selenga Delta is home to unique ecosystems, including more than 70 rare or endangered species of plants and animals. Waters of the Selenga River serve many (and differing) uses in both Mongolia and Russia, including support of agriculture, provision of drinking water, light industry, mining, recreation, and tourism. These uses also contribute to degradation of the river water quality, downstream availability of water, and ecological impacts. For example, a pulp and paper plant in the city of Selenginsk (lower left) has been tied to high levels of pollution in the river. International efforts to integrate management of the Selenga River basin for both ecological and economic sustainability are ongoing.
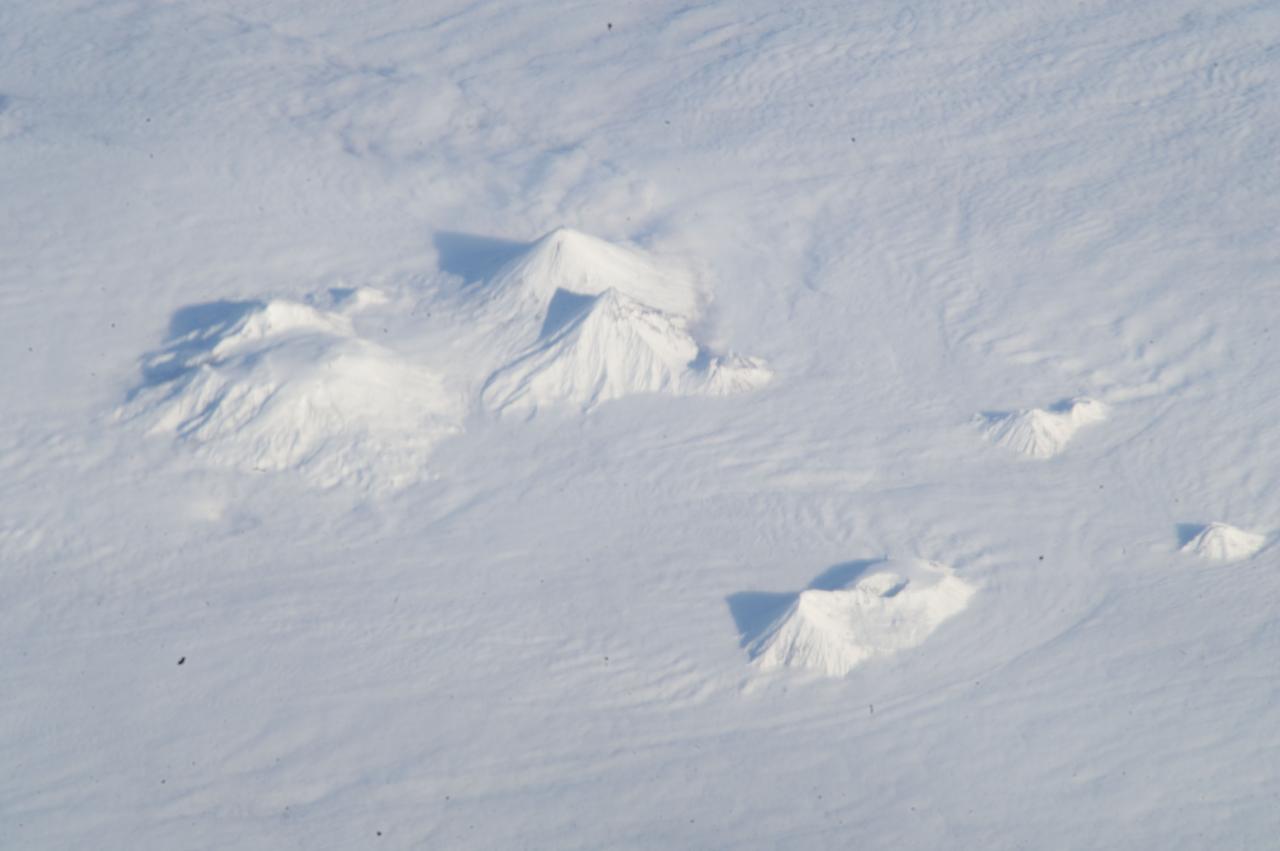
ISS033-E-018010 (3 Nov. 2012) --- Volcanoes in central Kamchatka are featured in this image photographed by an Expedition 33 crew member on the International Space Station. The snow-covered peaks of several volcanoes of the central Kamchatka Peninsula are visible standing above a fairly uniform cloud deck that obscures the surrounding lowlands. In addition to the rippled cloud patterns caused by interactions of air currents and the volcanoes, a steam and ash plume is visible at center extending north-northeast from the relatively low summit (2,882 meters above sea level) of Bezymianny volcano. Volcanic activity in this part of Russia is relatively frequent, and well monitored by Russia’s Kamchatka Volcanic Eruption Response Team (KVERT). The KVERT website provides updated information about the activity levels on the peninsula, including aviation alerts and webcams. Directly to the north and northeast of Bezymianny, the much larger and taller stratovolcanoes Kamen (4,585 meters above sea level) and Kliuchevskoi (4,835 meters above sea level) are visible. Kliuchevskoi, Kamchatka’s most active volcano, last erupted in 2011 whereas neighboring Kamen has not erupted during the recorded history of the region. An explosive eruption from the summit of the large volcanic massif of Ushkovsky (3,943 meters above sea level; left) northwest of Bezymianny occurred in 1890; this is the most recent activity at this volcano. To the south of Bezymianny, the peaks of Zimina (3,081 meters above sea level) and Udina (2,923 meters above sea level) volcanoes are just visible above the cloud deck; no historical eruptions are known from either volcanic center. While the large Tobalchik volcano to the southwest (bottom center) is largely formed from a basaltic shield volcano, its highest peak (3,682 meters above sea level) is formed from an older stratovolcano. Tobalchik last erupted in 1976. While this image may look like it was taken from the normal altitude of a passenger jet, the space station was located approximately 417 kilometers above the southeastern Sea of Okhotsk; projected downwards to Earth’s surface, the space station was located over 700 kilometers to the southwest of the volcanoes in the image. The combination of low viewing angle from the orbital outpost, shadows, and height and distance from the volcanoes contributes to the appearance of topographic relief visible in the image.
A winter storm was bringing snow, sleet and freezing rain from lower Mississippi Valley to Northeastern U.S. on Thursday, March 5, 2015. A new NASA animation of NOAA's GOES-East satellite imagery showed the progression of the clouds associated with the storm system that triggered winter storm warnings and winter weather advisories from the southern Plains eastward through the Mid-Atlantic and southern New England coast. The system also triggered flood warnings along and to the west of the central Appalachians. An animation of GOES satellite visible and infrared imagery from March 3 through March 5 showed clouds associated with a cold front push over U.S. East coast. Behind the front, Arctic air is expected to drop low temperatures into the single numbers from Washington, D.C. to Minnesota overnight. Temperatures in the Carolinas and Tennessee are expected to drop to the low 20s. NOAA's National Weather Service Weather Prediction Center (NWS NPC) in College Park, Maryland noted "a strong cold front moving across the eastern U.S. will bring heavy snow from parts of the Ohio Valley to the Northeast today (March 5) with rain, freezing rain and sleet possible from parts of the lower Mississippi Valley across the Southeast to the southern Mid-Atlantic. Snowfall totals of 5 to 10 inches are possible for some areas. Winter Storm Warnings remain in effect from Texas to Nantucket." The animation ends at 17:45 UTC (12:45 p.m. EST). Before the end of the animation, the low pressure center along an arctic frontal boundary was nearly stationary over western North Carolina at 9 a.m. EST on March 5, according to the NWS NPC. NWS radar and surface observations indicated an extended swath of precipitation from near the Texas Gulf Coast through the interior eastern U.S. into southern New England. NPC's storm summary noted at that time "rain was changing to sleet/freezing rain and to all snow along a band within this swath as colder air continues to filter in from the north. Some areas in Tennessee, the northern mid-Atlantic and southern New England were reporting moderate to heavy snow." To create the video and imagery, NASA/NOAA's GOES Project takes the cloud data from NOAA's GOES-East satellite and overlays it on a true-color image of land and ocean created by data from the Moderate Resolution Imaging Spectroradiometer, or MODIS, instrument that flies aboard NASA's Aqua and Terra satellites. Together, those data created the entire picture of the storm and show its movement. After the storm system passes, the snow on the ground becomes visible. GOES satellites provide the kind of continuous monitoring necessary for intensive data analysis. Geostationary describes an orbit in which a satellite is always in the same position with respect to the rotating Earth. This allows GOES to hover continuously over one position on Earth's surface, appearing stationary. For updated information about the storm system, visit NOAA's NWS website: <a href="http://www.weather.gov" rel="nofollow">www.weather.gov</a> For more information about GOES satellites, visit: <a href="http://www.goes.noaa.gov/" rel="nofollow">www.goes.noaa.gov/</a> or goes.gsfc.nasa.gov/ Rob Gutro NASA's Goddard Space Flight Center <b><a href="http://www.nasa.gov/audience/formedia/features/MP_Photo_Guidelines.html" rel="nofollow">NASA image use policy.</a></b> <b><a href="http://www.nasa.gov/centers/goddard/home/index.html" rel="nofollow">NASA Goddard Space Flight Center</a></b> enables NASA’s mission through four scientific endeavors: Earth Science, Heliophysics, Solar System Exploration, and Astrophysics. Goddard plays a leading role in NASA’s accomplishments by contributing compelling scientific knowledge to advance the Agency’s mission. <b>Follow us on <a href="http://twitter.com/NASAGoddardPix" rel="nofollow">Twitter</a></b> <b>Like us on <a href="http://www.facebook.com/pages/Greenbelt-MD/NASA-Goddard/395013845897?ref=tsd" rel="nofollow">Facebook</a></b> <b>Find us on <a href="http://instagrid.me/nasagoddard/?vm=grid" rel="nofollow">Instagram</a></b>
A new NASA video of NOAA's GOES satellite imagery shows three days of movement of the massive winter storm that stretches from the southern U.S. to the northeast. Visible and infrared imagery from NOAA's GOES-East or GOES-13 satellite from Feb. 10 at 1815 UTC/1:15 p.m. EST to Feb. 12 to 1845 UTC/1:45 p.m. EST were compiled into a video made by NASA/NOAA's GOES Project at NASA's Goddard Space Flight Center in Greenbelt, Md. In the video, viewers can see the development and movement of the clouds associated with the progression of the frontal system and related low pressure areas that make up the massive storm. The video also shows the snow covered ground over the Great Lakes region and Ohio Valley that stretches to northern New England. The clouds and fallen snow data from NOAA's GOES-East satellite were overlaid on a true-color image of land and ocean created by data from the Moderate Resolution Imaging Spectroradiometer or MODIS instrument that flies aboard NASA's Aqua and Terra satellites. On February 12 at 10 a.m. EST, NOAA's National Weather Service or NWS continued to issue watches and warnings from Texas to New England. Specifically, NWS cited Winter Storm Warnings and Winter Weather Advisories were in effect from eastern Texas eastward across the interior section of southeastern U.S. states and across much of the eastern seaboard including the Appalachians. Winter storm watches are in effect for portions of northern New England as well as along the western slopes of northern and central Appalachians. For updates on local forecasts, watches and warnings, visit NOAA's <a href="http://www.weather.gov" rel="nofollow">www.weather.gov</a> webpage. NOAA's Weather Prediction Center or WPC noted the storm is expected to bring "freezing rain spreading into the Carolinas, significant snow accumulations are expected in the interior Mid-Atlantic states tonight into Thursday and ice storm warnings and freezing rain advisories are in effect across much of central Georgia. GOES satellites provide the kind of continuous monitoring necessary for intensive data analysis. Geostationary describes an orbit in which a satellite is always in the same position with respect to the rotating Earth. This allows GOES to hover continuously over one position on Earth's surface, appearing stationary. As a result, GOES provide a constant vigil for the atmospheric "triggers" for severe weather conditions such as tornadoes, flash floods, hail storms and hurricanes. For updated information about the storm system, visit NOAA's WPC website; <a href="http://www.hpc.ncep.noaa.gov/" rel="nofollow">www.hpc.ncep.noaa.gov/</a> For more information about GOES satellites, visit: <a href="http://www.goes.noaa.gov/" rel="nofollow">www.goes.noaa.gov/</a> or <a href="http://goes.gsfc.nasa.gov/" rel="nofollow">goes.gsfc.nasa.gov/</a> Rob Gutro NASA's Goddard Space Flight Center <b><a href="http://goes.gsfc.nasa.gov/" rel="nofollow">Credit: NOAA/NASA GOES Project</a></b> <b><a href="http://www.nasa.gov/audience/formedia/features/MP_Photo_Guidelines.html" rel="nofollow">NASA image use policy.</a></b> <b><a href="http://www.nasa.gov/centers/goddard/home/index.html" rel="nofollow">NASA Goddard Space Flight Center</a></b> enables NASA’s mission through four scientific endeavors: Earth Science, Heliophysics, Solar System Exploration, and Astrophysics. Goddard plays a leading role in NASA’s accomplishments by contributing compelling scientific knowledge to advance the Agency’s mission. <b>Follow us on <a href="http://twitter.com/NASAGoddardPix" rel="nofollow">Twitter</a></b> <b>Like us on <a href="http://www.facebook.com/pages/Greenbelt-MD/NASA-Goddard/395013845897?ref=tsd" rel="nofollow">Facebook</a></b> <b>Find us on <a href="http://instagrid.me/nasagoddard/?vm=grid" rel="nofollow">Instagram</a></b>
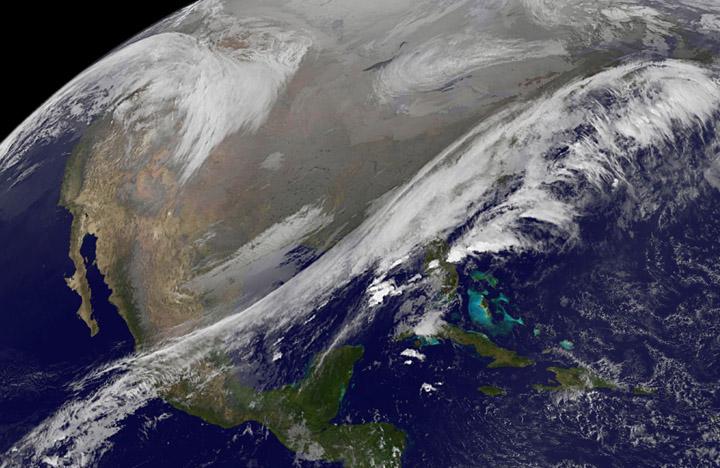
This NOAA's GOES satellite infrared image taken on Nov. 25 at 11:45 UTC (6:45 a.m. EST) shows two main weather systems over the U.S. Credit: NASA/NOAA GOES Project As the U.S. Thanksgiving holiday approaches this Thursday, November 27, NOAA's GOES-East and GOES-West satellites are keeping a weather eye out for storms that may affect early travelers. In an image from Nov. 25, the satellites show an active weather pattern is in place for travelers across the central and eastern U.S. NOAA's GOES-East satellite provides visible and infrared images over the eastern U.S. and the Atlantic Ocean, while NOAA's GOES-West satellite covers the western U.S. and Pacific Ocean from its fixed orbit in space. Data from both satellites were combined at NASA's GOES Project to create a full view of the U.S. on Nov. 25 at 11:45 UTC (6:45 a.m. EST). The image shows clouds associated with cold front stretching from the Gulf of Mexico over northern Florida and along the U.S. East coast to eastern Canada. Clouds associated with another area of low pressure are in the northern Rockies and northwestern U.S. To create the image, NASA/NOAA's GOES Project takes the cloud data from NOAA's GOES-East satellite and overlays it on a true-color image of land and ocean created by data from the Moderate Resolution Imaging Spectroradiometer, or MODIS, instrument that flies aboard NASA's Aqua and Terra satellites. Together, those data created the entire picture of the storm and show its movement. After the storm system passes, the snow on the ground becomes visible. NOAA's National Weather Service Weather Prediction Center said "a storm system will develop off the coast of the Carolinas early Wednesday (Nov. 25) and strengthen as it moves rapidly up the East Coast Wednesday into early Thursday (Nov. 26). Heavy snow is likely to begin in the central Appalachians early Wednesday morning, spreading northeast through the interior Mid-Atlantic into New England by Wednesday night. Winter Storm Watches are in effect for these areas." For travelers in the western U.S., the Northern Rocky Mountains are expected to receive more snow from the north side of a stationary frontal boundary. South of the boundary rain showers will affect the lower valley. The National Weather Service calls for cold weather to continue in the northern Plains and Upper Midwest as a Canadian surface high pressure rules the weather. The U.S. Southwest will experience nice weather for mid-week. In the Pacific Northwest, the National Weather Service noted that a warm front will bring rain, heavy at times, to the Cascades today and tonight. There will be a break in the heavier rains on Wednesday, then another period of heavy rain for the Cascades Wednesday night through Friday morning as a cold front slowly drags through the area. NOAA's GOES satellites provide the kind of continuous monitoring necessary for intensive data analysis. Geostationary describes an orbit in which a satellite is always in the same position with respect to the rotating Earth. This allows GOES to hover continuously over one position on Earth's surface, appearing stationary. As a result, GOES provide a constant vigil for the atmospheric triggers for severe weather conditions such as tornadoes, flash floods, hail storms and hurricanes.
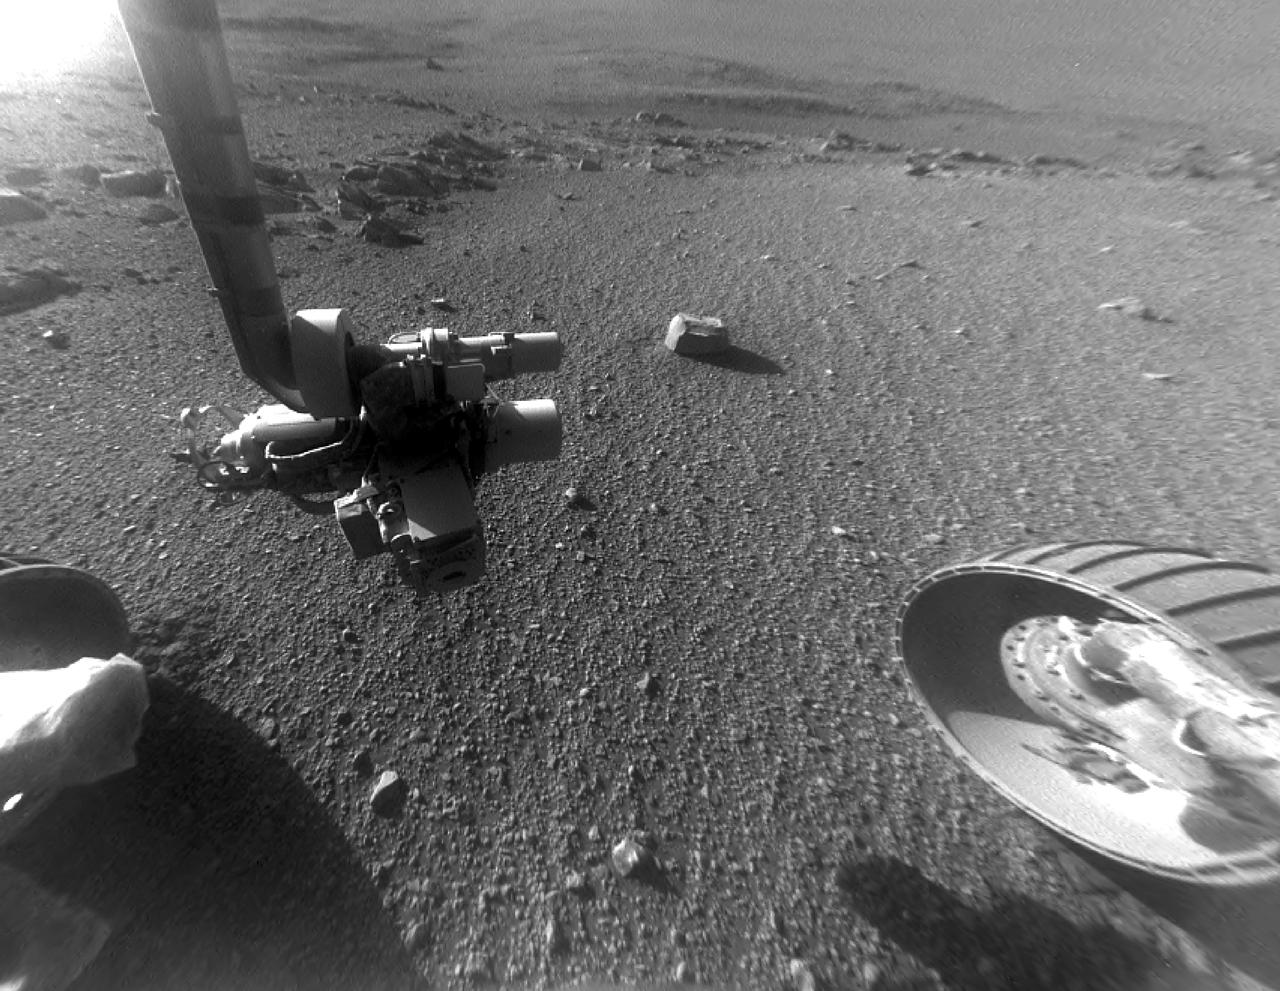
This late-afternoon view from the front Hazard Avoidance Camera on NASA's Mars Exploration Rover Opportunity shows a pattern of rock stripes on the ground, a surprise to scientists on the rover team. Approaching the 5,000th Martian day or sol, of what was planned as a 90-sol mission, Opportunity is still providing new discoveries. This image was taken inside "Perseverance Valley," on the inboard slope of the western rim of Endeavour Crater, on Sol 4958 (Jan. 4, 2018). Both this view and one taken the same sol by the rover's Navigation Camera look downhill toward the northeast from about one-third of the way down the valley, which extends about the length of two football fields from the crest of the rim toward the crater floor. The lighting, with the Sun at a low angle, emphasizes the ground texture, shaped into stripes defined by rock fragments. The stripes are aligned with the downhill direction. The rock to the upper right of the rover's robotic arm is about 2 inches (5 centimeters) wide and about 3 feet (1 meter) from the centerline of the rover's two front wheels. This striped pattern resembles features seen on Earth, including on Hawaii's Mauna Kea, that are formed by cycles of freezing and thawing of ground moistened by melting ice or snow. There, fine-grained fraction of the soil expands as it freezes, and this lifts the rock fragments up and to the sides. If such a process formed this pattern in Perseverance Valley, those conditions might have been present locally during a period within the past few million years when Mars' spin axis was at a greater tilt than it is now, and some of the water ice now at the poles was redistributed to lower latitudes. Other hypotheses for how these features formed are also under consideration, including high-velocity slope winds. https://photojournal.jpl.nasa.gov/catalog/PIA22218
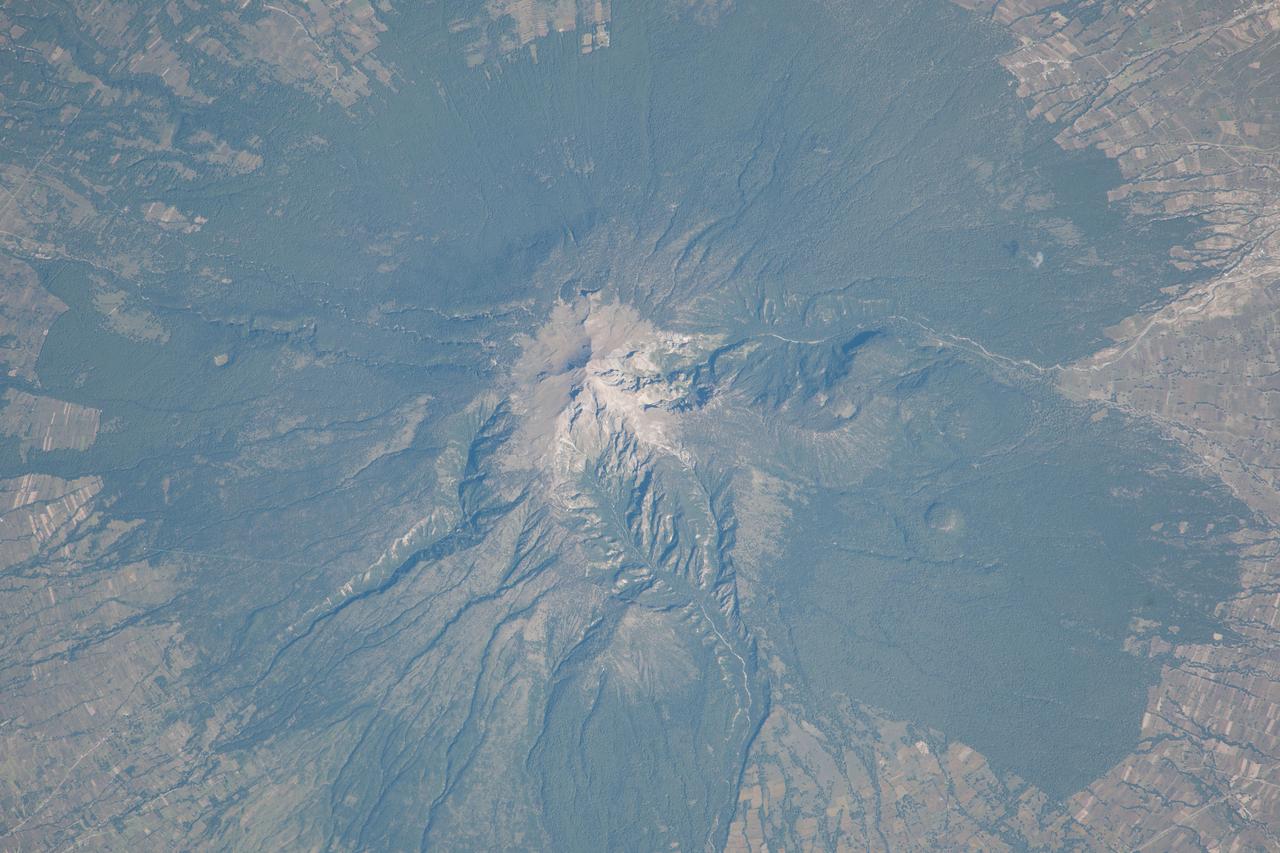
ISS037-E-022473 (29 Oct. 2013) --- La Malinche Volcano, Mexico is featured in this image photo graphed by an Expedition 37 crew member on the International Space Station. Located approximately 30 kilometers to the northeast of the city of Puebla, the summit of Volcan la Malinche rises to an elevation of 4,461 meters above sea level. This detailed photograph highlights the snow-dusted summit, and the deep canyons that cut into the flanks of this eroded stratovolcano. La Malinche has not been historically active, but radiometric dating of volcanic rocks and deposits associated with the structure indicate a most recent eruption near the end of the 12th century. NASA scientists cite evidence that lahars, or mudflows, associated with an eruption about 3,100 years ago, affected Pre-Columbian settlements in the nearby Puebla basin. The volcano is enclosed within La Malinche National Park situated within parts of the states of Puebla and Tlaxcala; extensive green forest cover is visible on the lower flanks of the volcano. Access to the volcano is available through roadways, and it is frequently used as a training peak by climbers prior to attempting higher summits. The rectangular outlines of agricultural fields are visible forming an outer ring around the forested area. While the volcano appears to be quiescent, its relatively recent (in geological terms) eruptive activity, and location within the Trans-Mexican Volcanic Belt– a tectonically active region with several current and historically active volcanoes including Popocatepetl to the west and Pico de Orizaba to the east - suggests that future activity is still possible and could potentially pose a threat to the nearby city of Puebla.
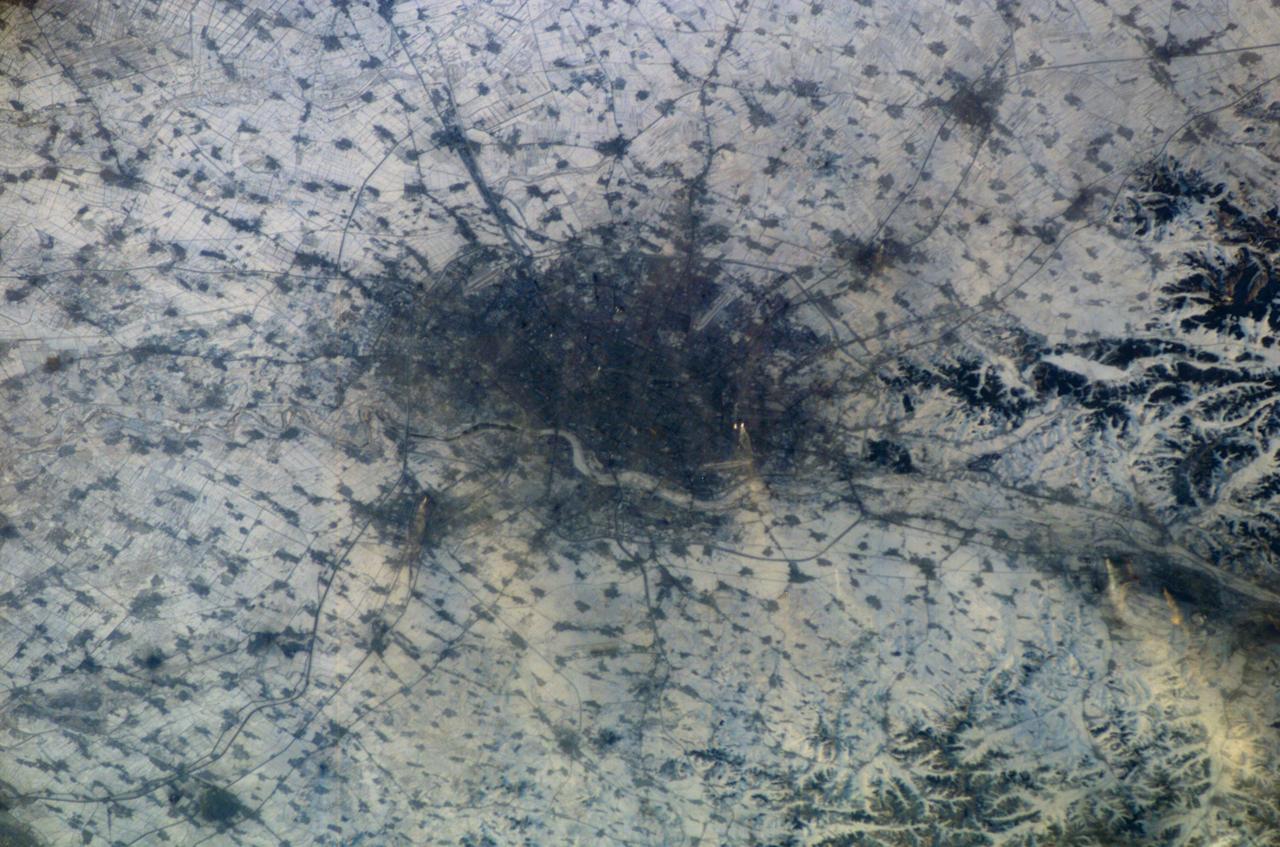
ISS010-E-13807 (18 January 2005) --- Shenyang, China is featured in this image photographed by an Expedition 10 crewmember on the International Space Station (ISS). The city of Shenyang is China’s sixth largest city with a population of over 4 million residents in the urban core. The city is the major industrial, commercial, and cultural center of northeast China (the region historically known as Manchuria). Its geographic location on the floodplains of the Hun and Liao Rivers ensured an early agrarian economy that was later replaced by industrialization and natural resource extraction. Shenyang was first settled as a Mongol trading center in the 10th century, and served as the capitol of the Manchu government from the 17th through 20th centuries. Currently the city serves as the capital of Liaoning Province. Snow cover provides a clear contrast between urbanized (dark grey, center of image) and rural regions (white to light grey). The major portion of the local economy is devoted to industries such as metal smelting, coal mining, and petrochemical processing. Several southeast-trending plumes from industrial facilities are visible in the image. According to NASA scientists studying the Expedition 10 imagery, the high density of industrial land use in the Shenyang metropolitan area has lead to significant air, water, and soil pollution in the region. Recently, several initiatives to reduce pollution levels and establish environmentally-sound development guidelines have begun with support from local government and the United Nations.
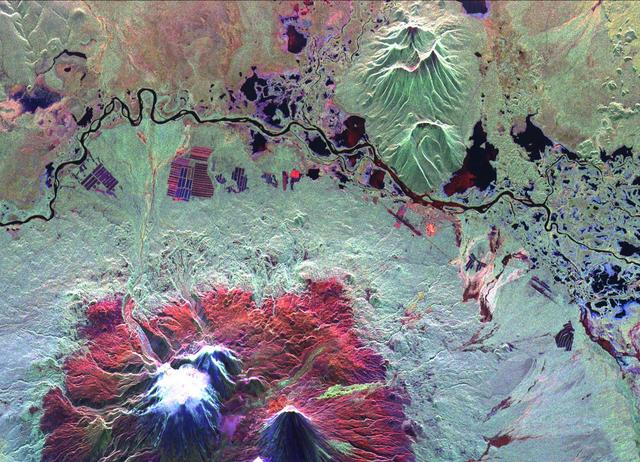
This is an image of the Kliuchevskoi volcano, Kamchatka, Russia, which began to erupt on September 30, 1994. Kliuchevskoi is the bright white peak surrounded by red slopes in the lower left portion of the image. The image was acquired by the Spaceborne Imaging Radar-C and X-band Synthetic Aperture Radar aboard the space shuttle Endeavour on its 25th orbit on October 1, 1994. The image shows an area approximately 30 kilometers by 60 kilometers (18.5 miles by 37 miles) that is centered at 56.18 degrees north latitude and 160.78 degrees east longitude. North is toward the top of the image. The Kamchatka volcanoes are among the most active volcanoes in the world. The volcanic zone sits above a tectonic plate boundary, where the Pacific plate is sinking beneath the northeast edge of the Eurasian plate. The Endeavour crew obtained dramatic video and photographic images of this region during the eruption, which will assist scientists in analyzing the dynamics of the current activity. The colors in this image were obtained using the following radar channels: red represents the L-band (horizontally transmitted and received); green represents the L-band (horizontally transmitted and vertically received); blue represents the C-band (horizontally transmitted and vertically received). The Kamchatka River runs from left to right across the image. An older, dormant volcanic region appears in green on the north side of the river. The current eruption included massive ejections of gas, vapor and ash, which reached altitudes of 20,000 meters (65,000 feet). New lava flows are visible on the flanks of Kliuchevskoi, appearing yellow/green in the image, superimposed on the red surfaces in the lower center. Melting snow triggered mudflows on the north flank of the volcano, which may threaten agricultural zones and other settlements in the valley to the north. http://photojournal.jpl.nasa.gov/catalog/PIA01731
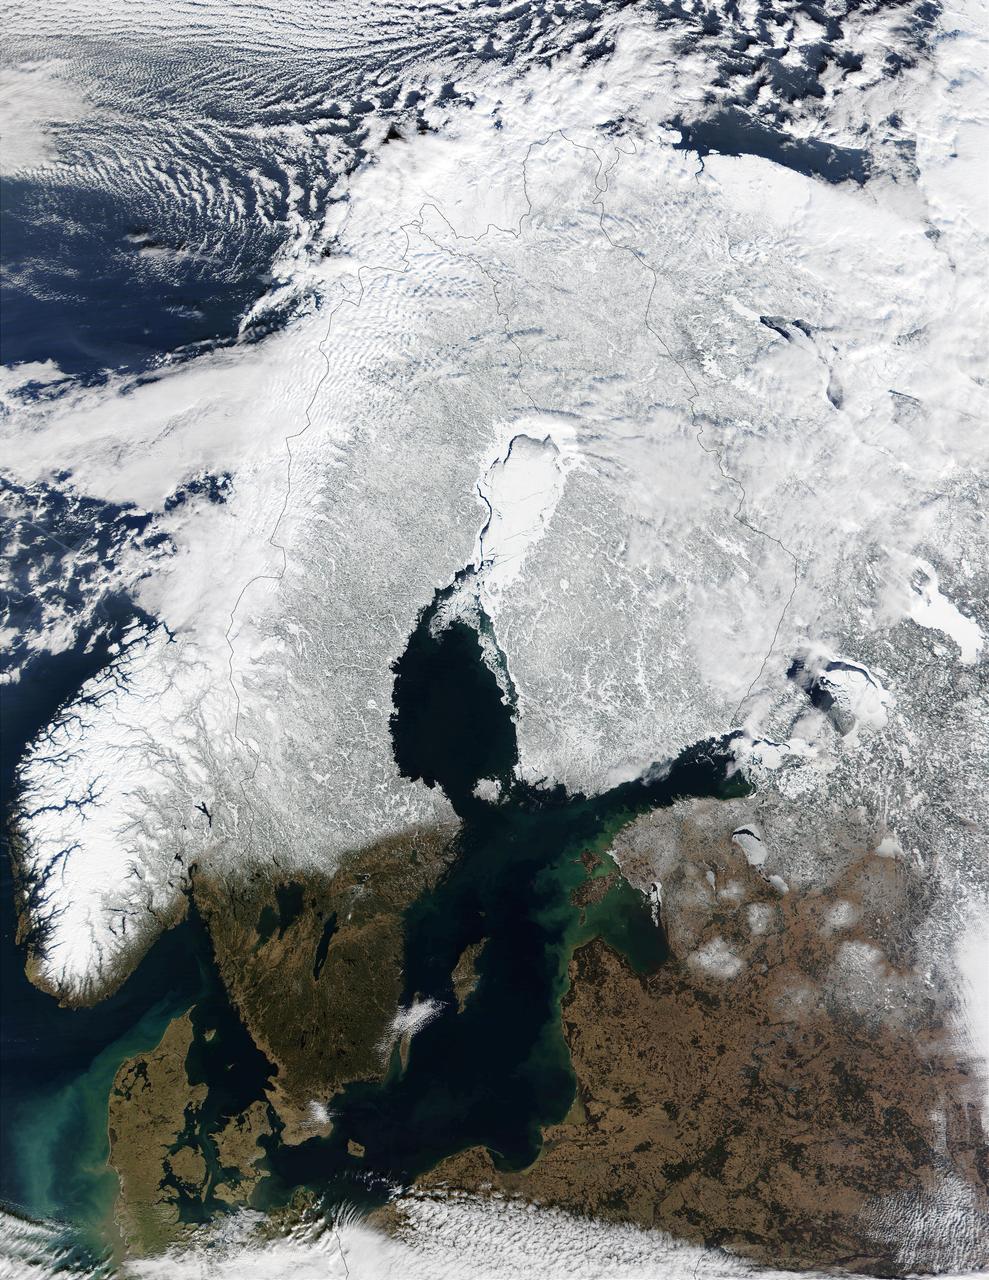
In this mostly cloud-free true-color scene, much of Scandinavia can be seen to be still covered by snow. From left to right across the top of this image are the countries of Norway, Sweden, Finland, and northwestern Russia. The Baltic Sea is located in the bottom center of this scene, with the Gulf of Bothnia to the north (in the center of this scene) and the Gulf of Finland to the northeast. This image was acquired on March 15, 2002, by the Moderate-resolution Imaging Spectroradiometer (MODIS), flying aboard NASA's Terra satellite. Image courtesy Jacques Descloitres, rapidfire.sci.gsfc.nasa.gov/ MODIS Land Rapid Response Team at NASA GSFC Credit: <b><a href="http://www.earthobservatory.nasa.gov/" rel="nofollow"> NASA Earth Observatory</a></b> <b><a href="http://www.nasa.gov/audience/formedia/features/MP_Photo_Guidelines.html" rel="nofollow">NASA image use policy.</a></b> <b><a href="http://www.nasa.gov/centers/goddard/home/index.html" rel="nofollow">NASA Goddard Space Flight Center</a></b> enables NASA’s mission through four scientific endeavors: Earth Science, Heliophysics, Solar System Exploration, and Astrophysics. Goddard plays a leading role in NASA’s accomplishments by contributing compelling scientific knowledge to advance the Agency’s mission. <b>Follow us on <a href="http://twitter.com/NASAGoddardPix" rel="nofollow">Twitter</a></b> <b>Like us on <a href="http://www.facebook.com/pages/Greenbelt-MD/NASA-Goddard/395013845897?ref=tsd" rel="nofollow">Facebook</a></b> <b>Find us on <a href="http://instagram.com/nasagoddard?vm=grid" rel="nofollow">Instagram</a></b>
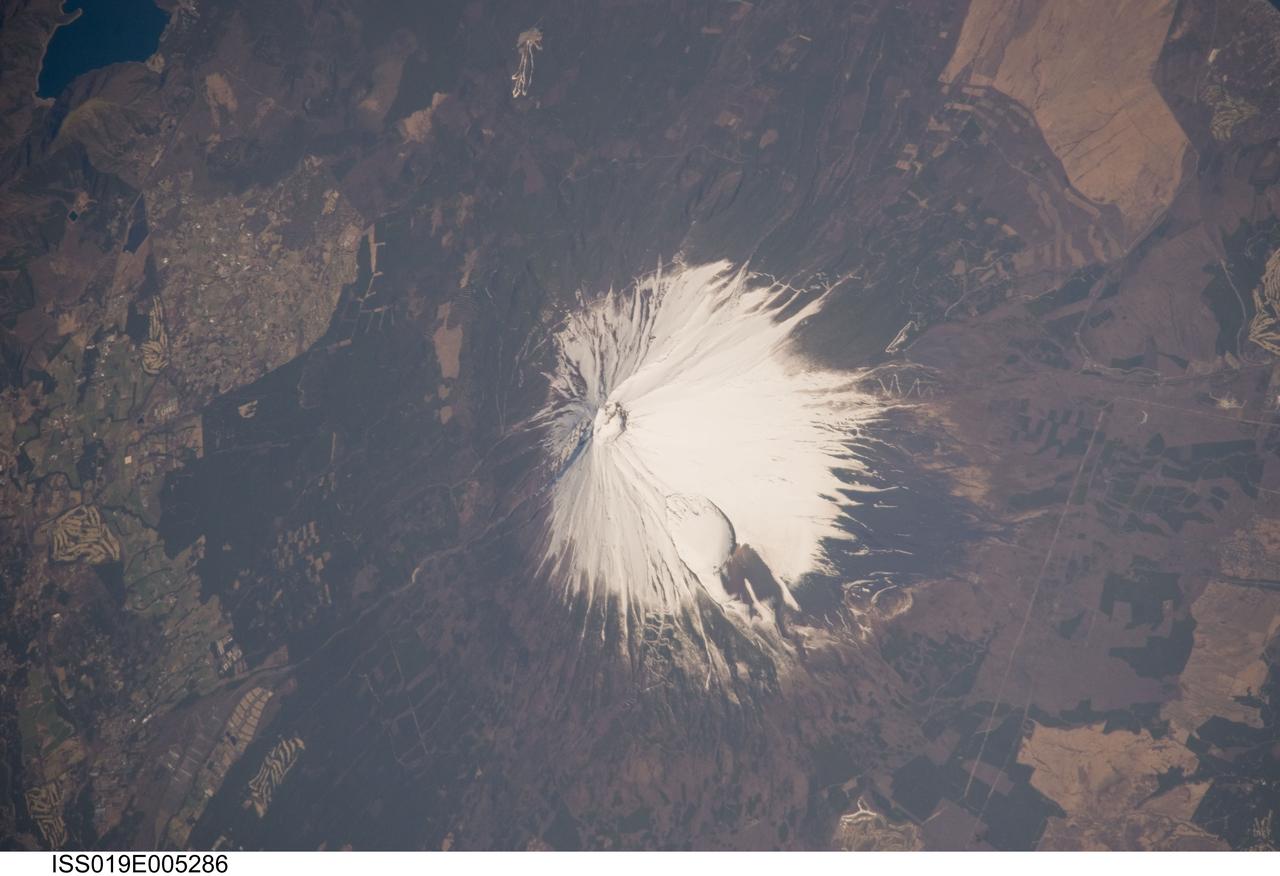
ISS019-E-005286 (8 April 2009) --- Mount Fuji, Japan is featured in this image photographed by an Expedition 19 crew member on the International Space Station. The 3,776 meters high Mount Fuji volcano, located on the island of Honshu in Japan, is one of the world?s classic examples of a stratovolcano. The volcano?s steep, conical profile is the result of numerous interlayered lava flows and explosive eruption products ? such as ash, cinders, and volcanic bombs ? building up the volcano over time. The steep profile is possible because of the relatively high viscosity of the volcanic rocks typically associated with stratovolcanoes. This leads to thick sequences of lava flows near the eruptive vent that build the cone structure, rather than low viscosity flows that spread out over the landscape and build lower-profile shield volcanoes. According to scientists, Mount Fuji, or Fuji-san in Japan, is actually comprised of several overlapping volcanoes that began erupting in the Pleistocene Epoch (1.8 million to approximately 10,000 years ago). Scientists believe that the currently active volcano, known as Younger Fuji, began forming approximately 11,000 to 8,000 years ago. The most recent explosive activity occurred in 1707, creating Hoei Crater on the southeastern flank of the volcano (center). This eruption deposited ash on Edo (present-day Tokyo) located 95 kilometers to the northeast. While there have been no further eruptions of Mount Fuji, steam was observed at the summit during 1780?1820, and the volcano is considered active. This oblique photograph illustrates the snow-covered southeastern flank of the volcano; the northeastern flank can be seen here. A representation of the topography of Mt. Fuji and its surroundings can be viewed here.
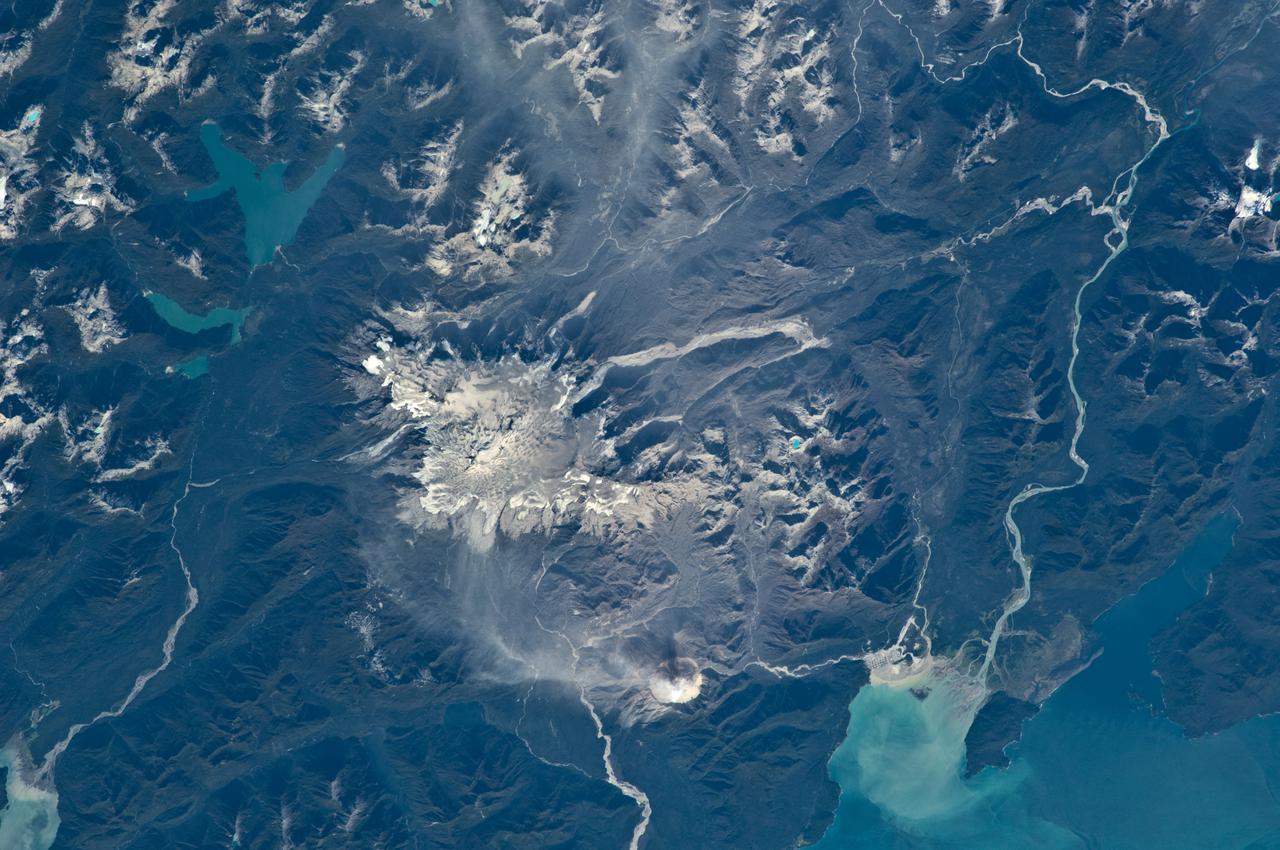
ISS018-E-035716 (24 Feb. 2009) --- Minchinmavida and Chaiten Volcanoes in Chile are featured in this image photographed by an Expedition 18 crewmember on the International Space Station. The Andes mountain chain along the western coastline of South America includes numerous active stratovolcanoes. The majority of these volcanoes are formed, and fed, by magma generated as the oceanic Nazca tectonic plate moves northeastward and plunges beneath the less dense South American continental tectonic plate (a process known as subduction). The line of Andean volcanoes marks the approximate location of the subduction zone. This astronaut photograph highlights two volcanoes located near the southern boundary of the Nazca ? South America subduction zone in southern Chile. Dominating the scene is the massive Minchinmavida stratovolcano at center. An eruption of this glaciated volcano was observed by Charles Darwin during his Galapagos Island voyage in 1834; the last recorded eruption took place the following year. The white, snow covered summit of Minchinmavida is blanketed by gray ash erupted from its much smaller but now active neighbor to the west, Volcan (volcano) Chaiten. The historically inactive Chaiten volcano, characterized by a large lava dome within a caldera (an emptied and collapsed magma chamber beneath a volcano) roared back to life unexpectedly on May 2, 2008, generating dense ash plumes and forcing the evacuation of the nearby town of Chaiten. Volcanic activity continues at Chaiten, including partial collapse of a new lava dome and generation of a pyroclastic flow several days before this photograph was taken. A steam and ash plume is visible extending to the northeast from the eruptive center of the volcano.
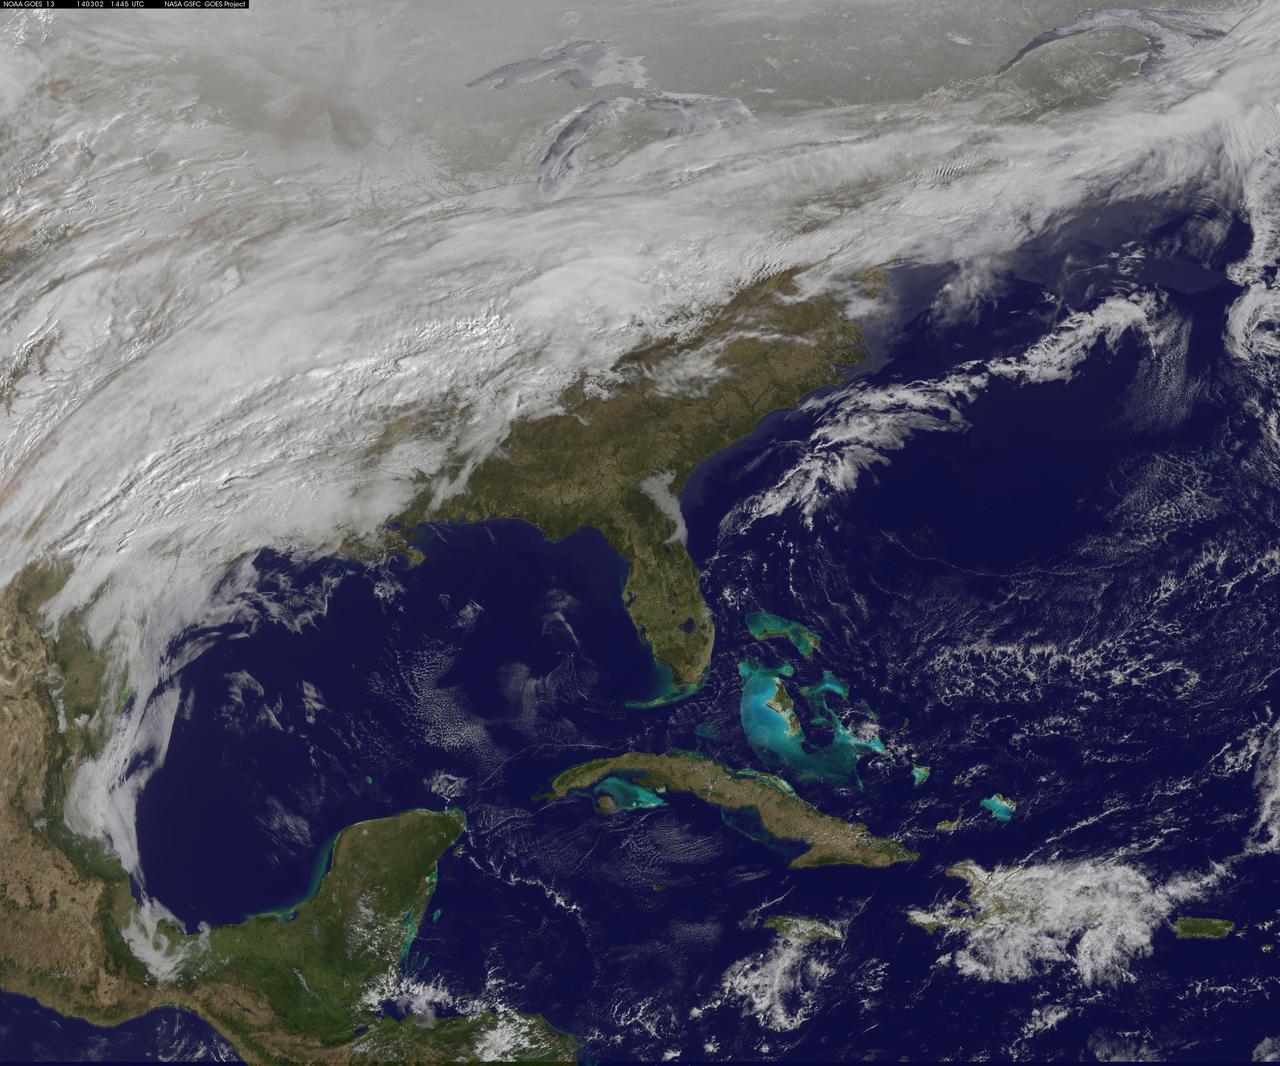
A major winter storm is poised to wallop the Mid-Atlantic and bring large amounts of snow to cities including Baltimore, Md., Washington, D.C. area on March 2 and 3, according to NOAA's National Weather Service. NOAA's GOES-East satellite captured this image of the clouds associated with the winter storm as it continued moving east toward those cities. On March 2, the National Weather Prediction Center in College Park, Md. noted that there is a slight risk for severe thunderstorms over parts of the western Gulf Coast and the Lower Mississippi Valley as a result of the southern portion of the system. The update at 7 a.m. EST noted that freezing rain/sleet is possible over parts of the lower Mississippi Valley and parts of the central Appalachians, while eastern Texas and the lower Mississippi Valley into the Ohio Valley are expected to experience heavy rain. The NWS Short Range Forecast Discussion stated "A strong storm over the Southern Plains/Lower Mississippi Valley will advance northeastward along a quasi-stationary front to off the Southern Mid-Atlantic Coast by Monday evening. Moisture from the Gulf of Mexico will overrun and pool along the associated front producing an area of snow extending from the Central Plains into the Northeast." The clouds are associated with a cold from that stretches from eastern Maine through Maryland and west into the Tennessee Valley. The low pressure center associated with the front was located over Arkansas. At NASA/NOAA's GOES Project at NASA's Goddard Space Flight Center in Greenbelt, Md. the cloud data from NOAA's GOES-East satellite were overlaid on a true-color image of land and ocean created by data from the Moderate Resolution Imaging Spectroradiometer or MODIS instrument that flies aboard NASA's Aqua and Terra satellites. Together, those data created the entire picture of the position of this major winter storm. GOES satellites provide the kind of continuous monitoring necessary for intensive data analysis. Geostationary describes an orbit in which a satellite is always in the same position with respect to the rotating Earth. This allows GOES to hover continuously over one position on Earth's surface, appearing stationary. As a result, GOES provide a constant vigil for the atmospheric "triggers" for severe weather conditions such as tornadoes, flash floods, hail storms and hurricanes. For updated information about the storm system, visit NOAA's NWS website: <a href="http://www.weather.gov" rel="nofollow">www.weather.gov</a> For more information about GOES satellites, visit: <a href="http://www.goes.noaa.gov/" rel="nofollow">www.goes.noaa.gov/</a> or <a href="http://goes.gsfc.nasa.gov/" rel="nofollow">goes.gsfc.nasa.gov/</a> Rob Gutro NASA Goddard Space Flight Center, Greenbelt, Md. <b><a href="http://www.nasa.gov/audience/formedia/features/MP_Photo_Guidelines.html" rel="nofollow">NASA image use policy.</a></b> <b><a href="http://www.nasa.gov/centers/goddard/home/index.html" rel="nofollow">NASA Goddard Space Flight Center</a></b> enables NASA’s mission through four scientific endeavors: Earth Science, Heliophysics, Solar System Exploration, and Astrophysics. Goddard plays a leading role in NASA’s accomplishments by contributing compelling scientific knowledge to advance the Agency’s mission. <b>Follow us on <a href="http://twitter.com/NASAGoddardPix" rel="nofollow">Twitter</a></b> <b>Like us on <a href="http://www.facebook.com/pages/Greenbelt-MD/NASA-Goddard/395013845897?ref=tsd" rel="nofollow">Facebook</a></b> <b>Find us on <a href="http://instagram.com/nasagoddard?vm=grid" rel="nofollow">Instagram</a></b>
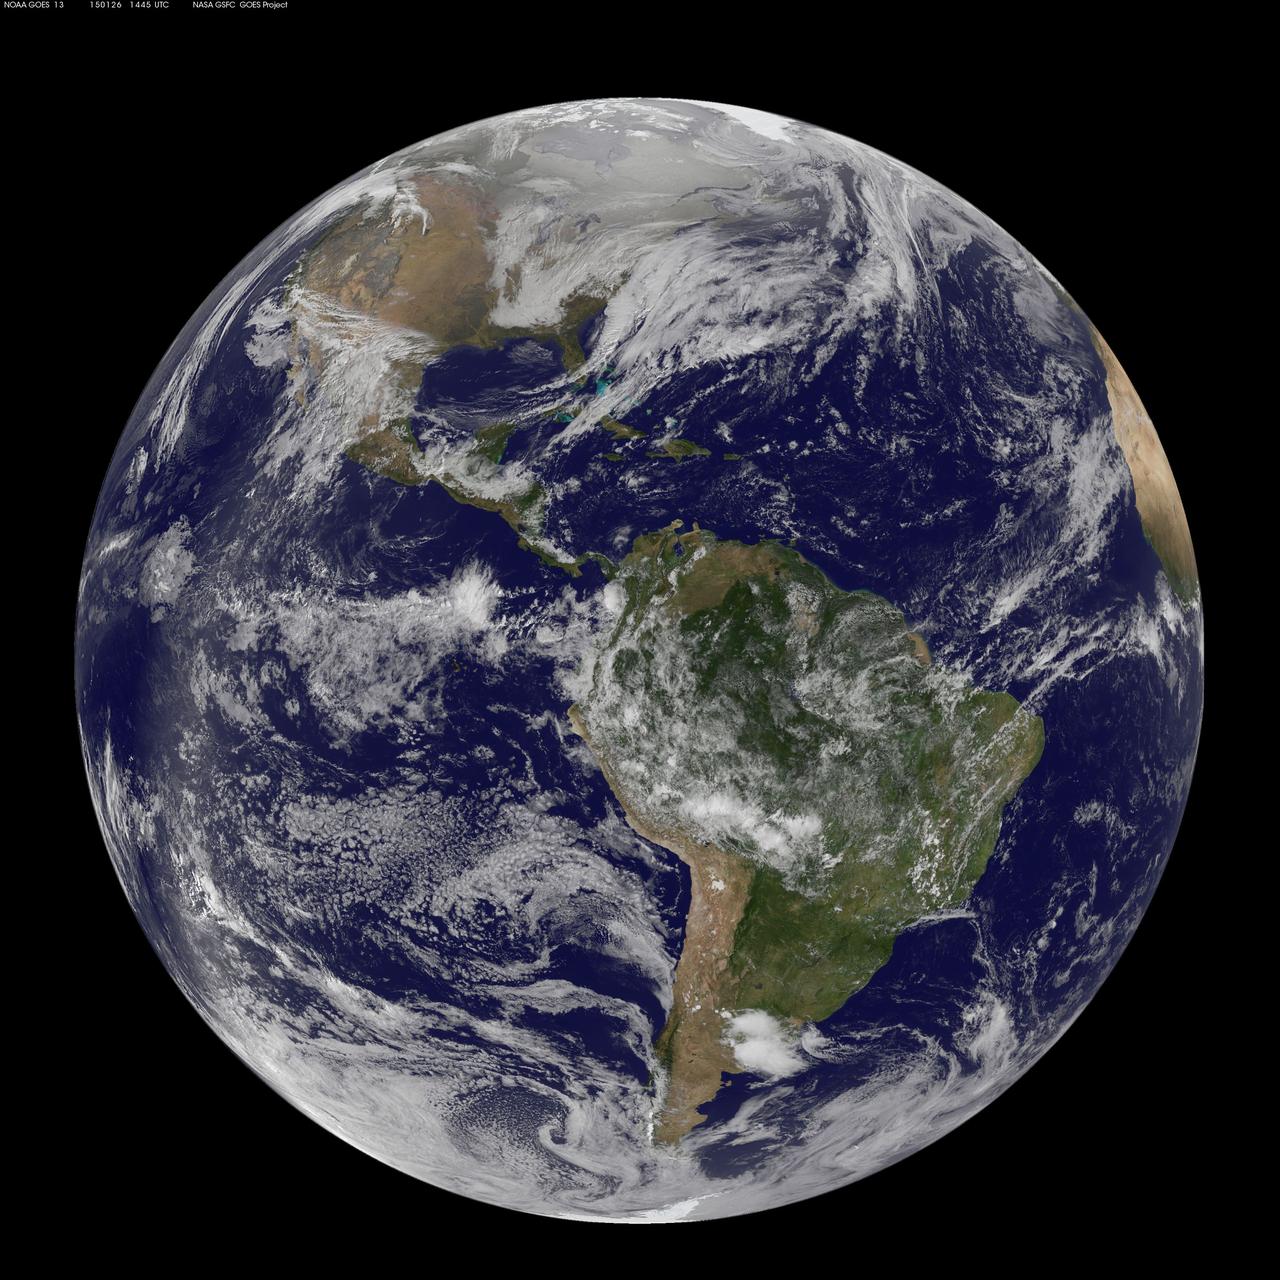
National Weather Service forecasters have been tracking a low pressure area that moved from the Midwest into the Atlantic Ocean today, and is expected to become a strong nor'easter that will bring blizzard conditions to the northeastern U.S. The path of the system was captured in a NASA movie of NOAA's GOES-East satellite imagery. (This GOES 13 image was captured on January 26, 2015 at 1445 UTC.) On Monday, January 26, 2015, the National Weather Service noted: A storm system off the East Coast will continue to strengthen as it develops into a major nor'easter on Monday. As the storm moves up the coast, it is expected to bring snowfall of 1-3 feet or more to many parts of the Northeast through Tuesday evening, including New York City and Boston. Strong, gusty winds will combine with the snow to create blizzard conditions along and near the coast. Winter storm warnings are in effect for the panhandles of West Virginia and Maryland, much of interior New England down to the northern Mid-Atlantic as well as for Nantucket Island, Massachusetts. Winter weather advisories are in effect for portions of the Ohio Valley, Mid-Atlantic and the southern Appalachians as well as a narrow area across interior New England. To create the video and imagery, NASA/NOAA's GOES Project located at NASA's Goddard Space Flight Center in Greenbelt, Maryland overlays the cloud data from NOAA's GOES-East satellite on a true-color image of land and ocean created by data from the Moderate Resolution Imaging Spectroradiometer, or MODIS, instrument that flies aboard NASA's Aqua and Terra satellites. Together, these data create the entire animation of the storm and show its movement. GOES satellites provide the kind of continuous monitoring necessary for intensive data analysis. Geostationary describes an orbit in which a satellite is always in the same position with respect to the rotating Earth. This allows GOES to hover continuously over one position on Earth's surface, appearing stationary. As a result, GOES provide a constant vigil for the atmospheric "triggers" for severe weather conditions such as tornadoes, flash floods, hail storms and hurricanes. For updated information about the storm system, visit NOAA's NWS website: <a href="http://www.weather.gov" rel="nofollow">www.weather.gov</a> For more information about GOES satellites, visit: <a href="http://www.goes.noaa.gov/" rel="nofollow">www.goes.noaa.gov/</a> or goes.gsfc.nasa.gov/ Rob Gutro NASA's Goddard Space Flight Center
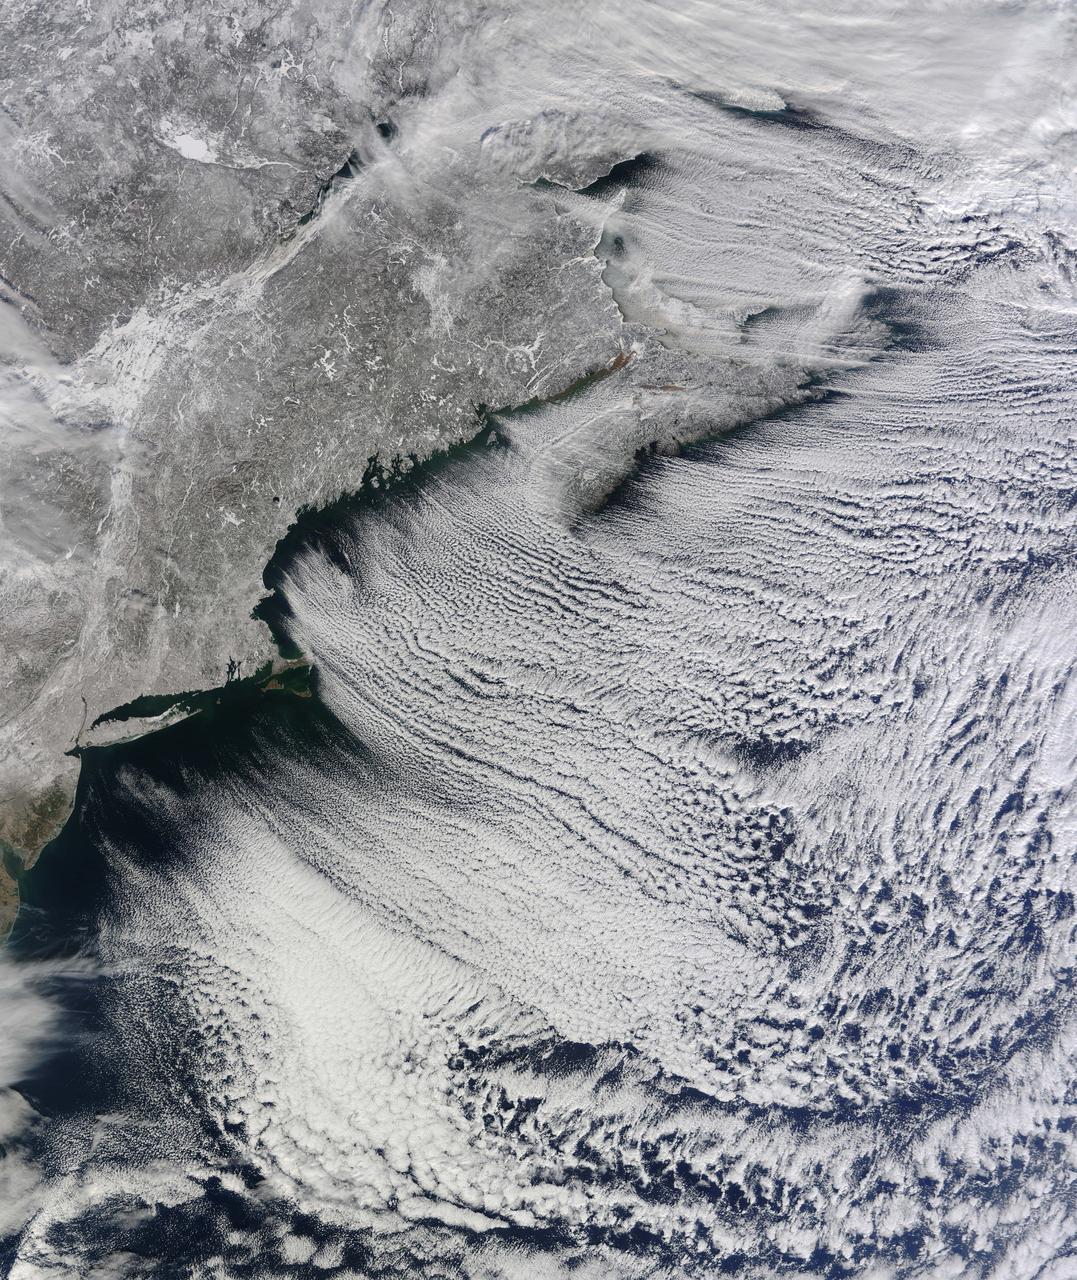
NASA image acquired January 24, 2011 What do you get when you mix below-freezing air temperatures, frigid northwest winds from Canada, and ocean temperatures hovering around 39 to 40 degrees Fahrenheit (4 to 5 degrees Celsius)? Paved highways of clouds across the skies of the North Atlantic. The Moderate Resolution Imaging Spectroradiometer (MODIS) on NASA’s Terra satellite collected this natural-color view of New England, the Canadian Maritimes, and coastal waters at 10:25 a.m. U.S. Eastern Standard Time on January 24, 2011. Lines of clouds stretch from northwest to southeast over the North Atlantic, while the relatively cloudless skies over land afford a peek at the snow that blanketed the Northeast just a few days earlier. Cloud streets form when cold air blows over warmer waters, while a warmer air layer—or temperature inversion—rests over top of both. The comparatively warm water of the ocean gives up heat and moisture to the cold air mass above, and columns of heated air—thermals—naturally rise through the atmosphere. As they hit the temperature inversion like a lid, the air rolls over like the circulation in a pot of boiling water. The water in the warm air cools and condenses into flat-bottomed, fluffy-topped cumulus clouds that line up parallel to the wind. Though they are easy to explain in a broad sense, cloud streets have a lot of mysteries on the micro scale. A NASA-funded researcher from the University of Wisconsin recently observed an unusual pattern in cloud streets over the Great Lakes. Cloud droplets that should have picked up moisture from the atmosphere and grown in size were instead shrinking as they moved over Lake Superior. Read more in an interview at What on Earth? NASA image by Jeff Schmaltz, MODIS Rapid Response Team, Goddard Space Flight Center. Caption by Michael Carlowicz. Instrument: Terra - MODIS Credit: <b><a href="http://www.earthobservatory.nasa.gov/" rel="nofollow"> NASA Earth Observatory</a></b> <b><a href="http://www.nasa.gov/centers/goddard/home/index.html" rel="nofollow">NASA Goddard Space Flight Center</a></b> enables NASA’s mission through four scientific endeavors: Earth Science, Heliophysics, Solar System Exploration, and Astrophysics. Goddard plays a leading role in NASA’s accomplishments by contributing compelling scientific knowledge to advance the Agency’s mission. <b>Follow us on <a href="http://twitter.com/NASA_GoddardPix" rel="nofollow">Twitter</a></b> <b>Join us on <a href="http://www.facebook.com/pages/Greenbelt-MD/NASA-Goddard/395013845897?ref=tsd" rel="nofollow">Facebook</a></b>
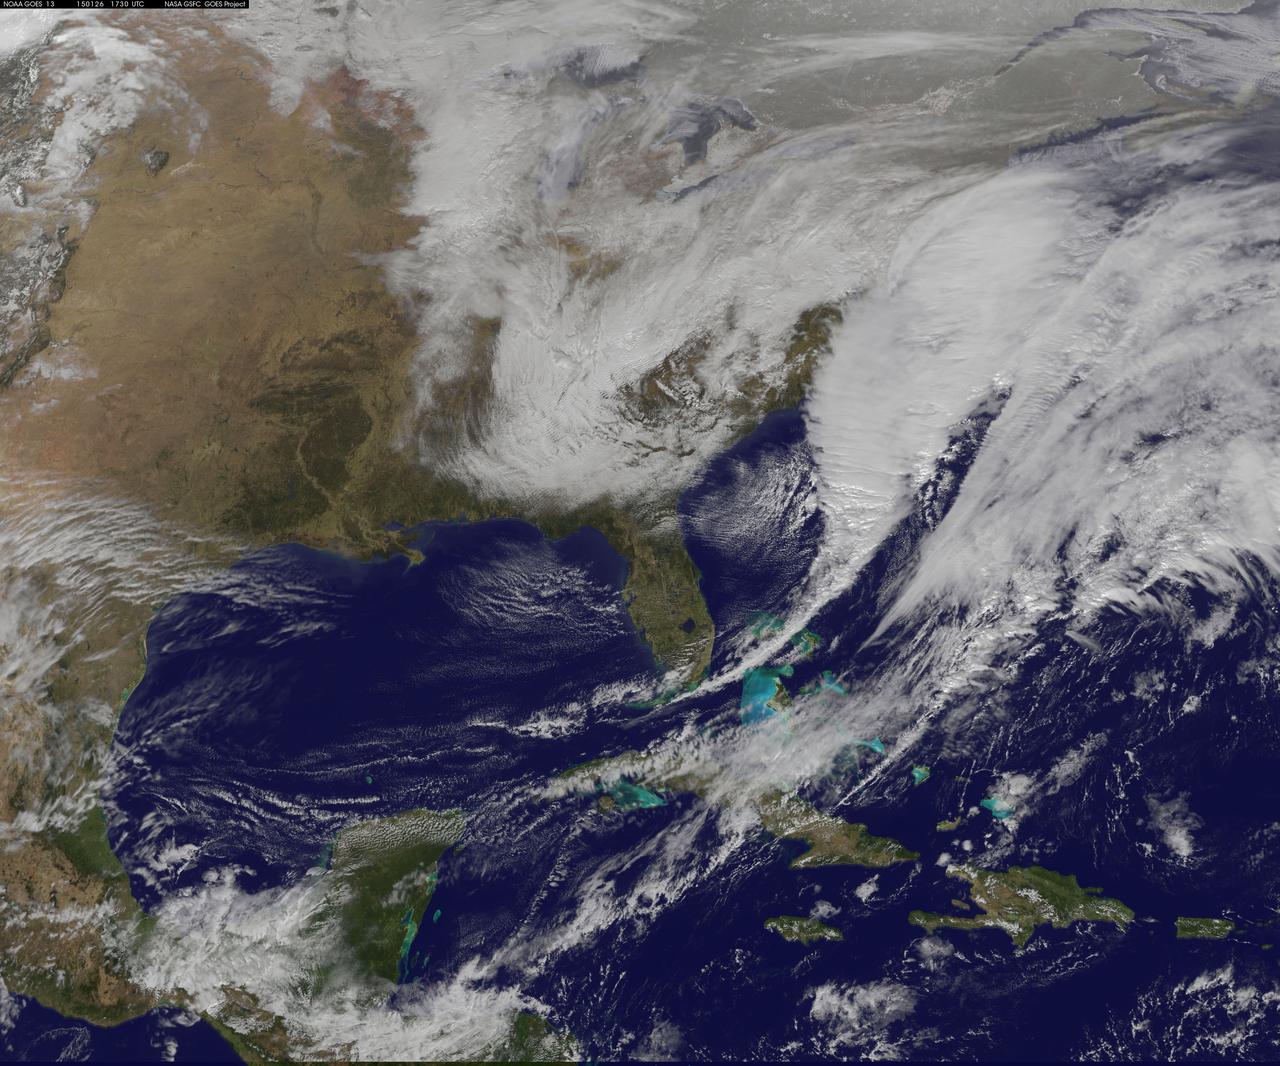
National Weather Service forecasters have been tracking a low pressure area that moved from the Midwest into the Atlantic Ocean today, and is expected to become a strong nor'easter that will bring blizzard conditions to the northeastern U.S. The path of the system was captured in a NASA movie of NOAA's GOES-East satellite imagery. On Monday, January 26, 2015, the National Weather Service noted: A storm system off the East Coast will continue to strengthen as it develops into a major nor'easter on Monday. As the storm moves up the coast, it is expected to bring snowfall of 1-3 feet or more to many parts of the Northeast through Tuesday evening, including New York City and Boston. Strong, gusty winds will combine with the snow to create blizzard conditions along and near the coast. Winter storm warnings are in effect for the panhandles of West Virginia and Maryland, much of interior New England down to the northern Mid-Atlantic as well as for Nantucket Island, Massachusetts. Winter weather advisories are in effect for portions of the Ohio Valley, Mid-Atlantic and the southern Appalachians as well as a narrow area across interior New England. To create the video and imagery, NASA/NOAA's GOES Project located at NASA's Goddard Space Flight Center in Greenbelt, Maryland overlays the cloud data from NOAA's GOES-East satellite on a true-color image of land and ocean created by data from the Moderate Resolution Imaging Spectroradiometer, or MODIS, instrument that flies aboard NASA's Aqua and Terra satellites. Together, these data create the entire animation of the storm and show its movement. GOES satellites provide the kind of continuous monitoring necessary for intensive data analysis. Geostationary describes an orbit in which a satellite is always in the same position with respect to the rotating Earth. This allows GOES to hover continuously over one position on Earth's surface, appearing stationary. As a result, GOES provide a constant vigil for the atmospheric "triggers" for severe weather conditions such as tornadoes, flash floods, hail storms and hurricanes. For updated information about the storm system, visit NOAA's NWS website: <a href="http://www.weather.gov" rel="nofollow">www.weather.gov</a> For more information about GOES satellites, visit: <a href="http://www.goes.noaa.gov/" rel="nofollow">www.goes.noaa.gov/</a> or goes.gsfc.nasa.gov/ Rob Gutro NASA's Goddard Space Flight Center
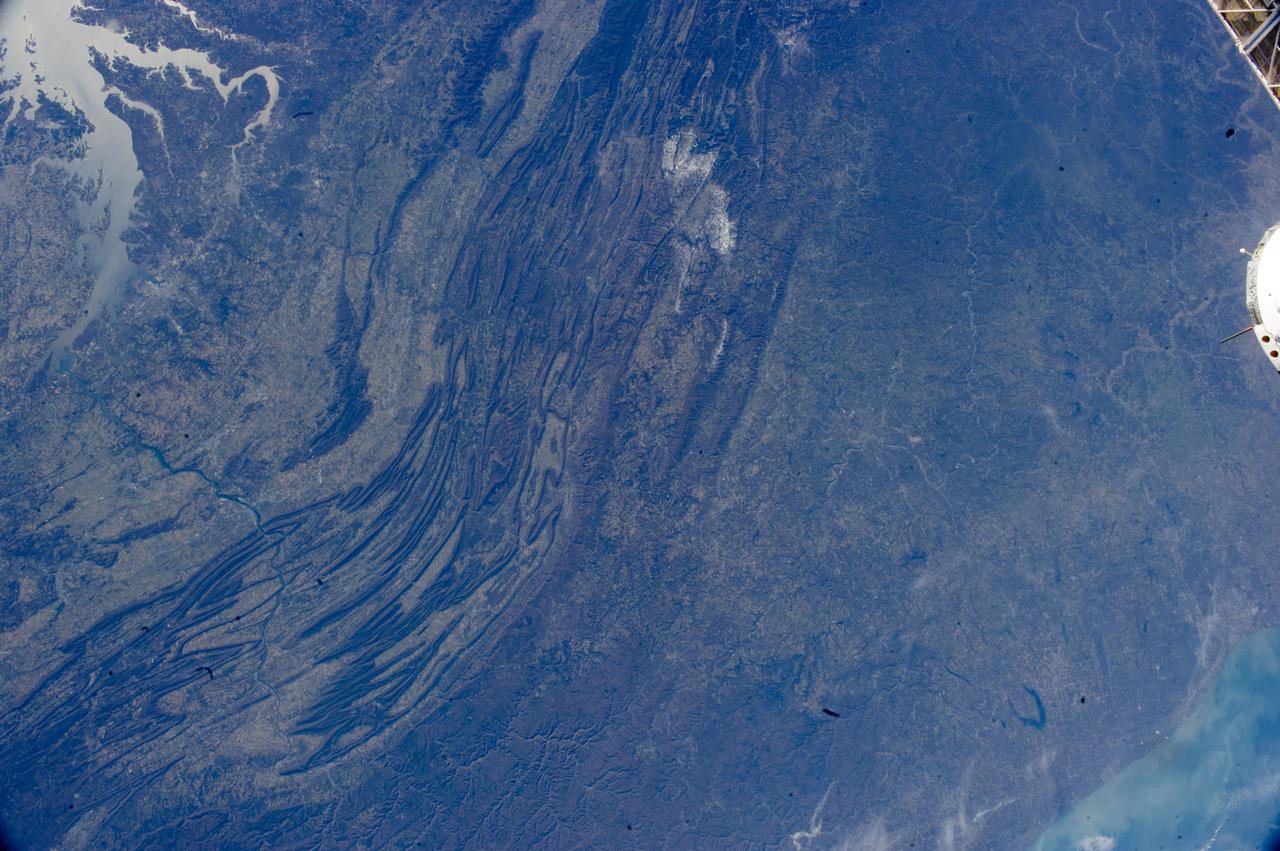
ISS033-E-022378 (17 Nov. 2012) --- The Appalachian Mountains in the eastern Unites States are featured in this image photographed by an Expedition 33 crew member on the International Space Station. This regional view shows the striking visual effect of the valley-and-ridge topography of the Appalachian Mountains as viewed from orbit. The view shows more than 300 miles (500 kilometers) of this low mountain chain, from northeast Pennsylvania (lower left) to southern West Virginia, where a dusting of snow can be seen (top center). Sunglint reflections reveal detail of Chesapeake Bay and the great bend of the Potomac River. Cities are difficult to detect from space during daylight hours, so the sickle-shaped bend of the river is a good visual guide for station crew members trying to photograph the nation?s capital, Washington D.C. (upper left). The farm-dominated Piedmont Plateau is the light-toned area between the mountains and the bay. The Appalachian Mountains appear striped because the ridges are forested; providing a dense and dark canopy cover, while the valleys are farmed with crops that generally appear as lighter-toned areas. Geologically the valleys are the softer, more erodible rock layers, much the preferred places for human settlement. Not only do the larger rivers occupy the valley floors, but all the larger rivers flow in them, soils are thicker, slopes are gentle, and valleys are better protected from winter winds. According to scientists, rocks that form the valley-and-ridge province, as it is known, are relatively old (540-300 million years old), and were laid down in horizontal layers when North America was attached to Europe as the ancient supercontinent of Laurasia. During this time Gondwanaland ? an ancient supercontinent that included present-day Africa, India, South America, Australia and Antarctica - was approaching Laurasia under the influence of plate tectonics. The northwest coastline of modern Africa was the section of Gondwanaland that ?bumped up? against modern North America over a long period (320 ? 260 million years ago), according to scientists. The net result of the tectonic collision was the building of a major mountain chain, much higher than the present Appalachian range?in the process of which the flat-lying rock layers were crumpled up into a series of tight folds, at right angles to the advance of Gondwanaland. The collision also formed the singular supercontinent of Pangaea. The scientists say that, over the following 200 million years, Pangaea broke apart; the modern Atlantic Ocean formed; and erosion wore down the high mountains. What is left to see are the coastline of North America, and the eroded stumps of the mountain chain as the relatively low, but visually striking present-day Appalachian Mountains.
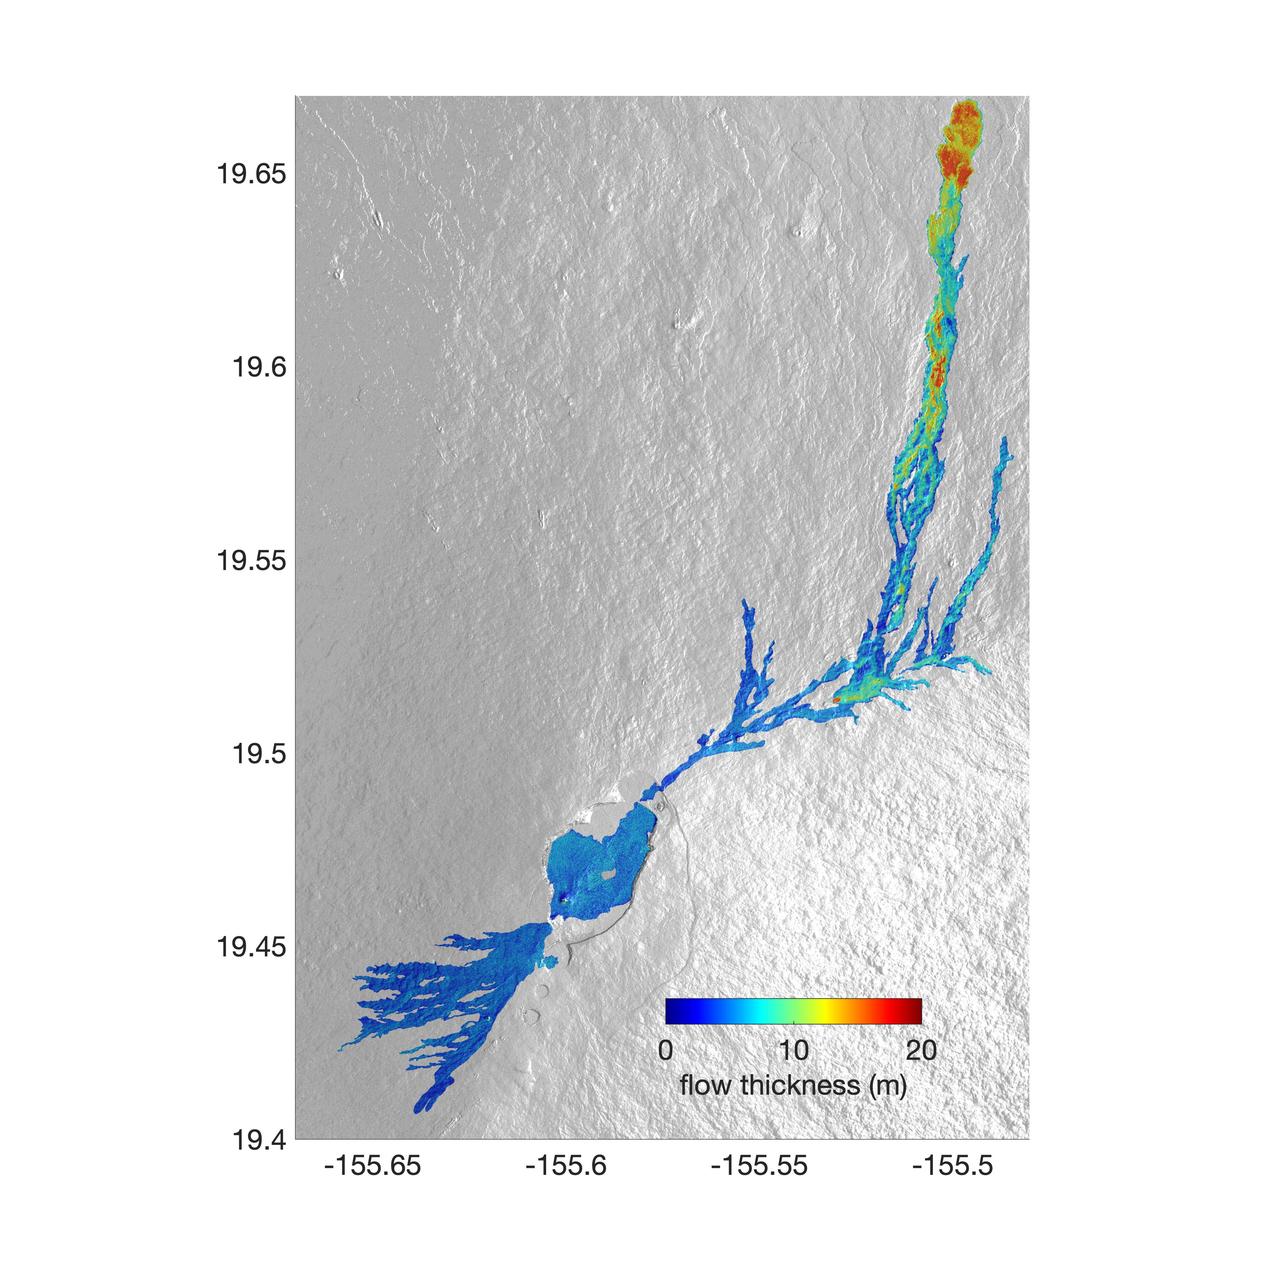
The world's largest active volcano – Hawaii's Mauna Loa – had been quiet for 38 years. But in 2022, the volcano began to stir, showing increased numbers of small earthquakes and subtle swelling of certain land surfaces in September. On November 27, fountains of lava began spurting from the mountain's Northeast Rift Zone and streams of molten rock flowed to the north. Ten days into the eruption, a NASA aircraft conducted its first flight over the erupting volcano. It carried NASA's Uninhabited Aerial Vehicle Synthetic Aperture Radar (UAVSAR) system, which was used to map the volcano's topography in fine detail with a Ka-band instrument called GLISTIN-A. Teams from NASA's Jet Propulsion Laboratory and the United States Geological Survey (USGS) used data from that sensor to map the thickness of those flows during a series of flights on December 7, 8, and 10. The map above shows the thickness of the lava flows during the flight on December 7, the day before USGS scientists noticed a significant decline in the pace of the eruption. A few days later, they declared the eruption had stopped. The map shows the thickness of the lava flows in the summit caldera, where the eruption began, and of lava flows on Mauna Loa's northeastern flank. The color variation from blue to orange indicates increasing lava flow thickness. A maximum thickness of roughly 25 meters (82 feet) is shown, though values exceeding 40 meters (131 feet) were observed in some areas. The thickening at the northern end of the flow is due to lava accumulating away from the vent, along with a flattening of the terrain at the saddle between the Mauna Loa and Mauna Kea volcanoes. By comparing to pre-eruption maps of this area's topography, including GLISTIN-A data collected in 2017, the USGS researchers were able to calculate the size and volume of the lava flow. Over the roughly 14-day eruption, Mauna Loa erupted more than 8.8 billion cubic feet (230 million cubic meters) along a lava flow that extended up to 16.5 miles (19.5 kilometers) from the vent, according to the USGS. The UAVSAR operates from a pod mounted beneath a crewed Gulfstream III jet from NASA's Armstrong Flight Research Center in California. Repeated topographic maps generated with each flight reveal the progression and thickening of lava with time – important information for scientific understanding of volcano processes and for emergency response. For the Mauna Loa science flights, the instrument suite featured an additional state-of-the-art imaging tool: the synthetic aperture radar-fusion optical short-wave infrared (SAR-Fusion Optical/SWIR) camera system. SAR-Fusion collects data over the same ground swath as GLISTIN-A to map land surface changes using optical/SWIR photogrammetry methods. GLISTIN-A was designed to provide all-weather, high-resolution surface topography not available through existing lidar or radar sensors. GLISTIN-A was originally demonstrated as a new radar technique for mapping ice surfaces. Science demonstration flights began in 2013 over alpine glaciers and sea ice in Alaska, and a floodplain in California. Its applications have since expanded to other areas, such as snow accumulation and volcano dynamics. The first time the instrument was deployed for volcano response was in 2018 during the three-month eruption of Kilauea. The success of that operation paved the way for deployment to Mauna Loa. https://photojournal.jpl.nasa.gov/catalog/PIA25526
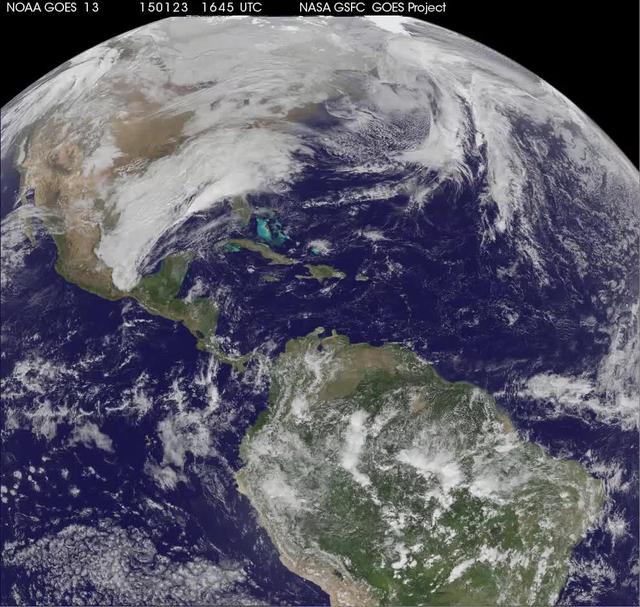
National Weather Service forecasters have been tracking a low pressure area that moved from the Midwest into the Atlantic Ocean today, and is expected to become a strong nor'easter that will bring blizzard conditions to the northeastern U.S. The path of the system was captured in a NASA movie of NOAA's GOES-East satellite imagery. An animation of visible and infrared imagery from NOAA's Geostationary Operational Environmental or GOES satellite captured over the period of January 24 through 26 showed the progression of the developing nor'easter. The satellite animation began on Jan. 24 when clouds associated with a cold front preceding the low, pushed off the U.S. East coast. The front was followed by a low pressure area that moved from the Midwest to the southeast. That low moved over the Carolinas and exited into the Atlantic Ocean on Jan. 26. NOAA's National Weather Service forecast calls for the low to intensify along the Eastern Seaboard and bring blizzard conditions to the northeastern U.S. on Monday night, January 26 and Tuesday, January 27. On Monday, January 26, 2015, the National Weather Service noted: A storm system off the East Coast will continue to strengthen as it develops into a major nor'easter on Monday. As the storm moves up the coast, it is expected to bring snowfall of 1-3 feet or more to many parts of the Northeast through Tuesday evening, including New York City and Boston. Strong, gusty winds will combine with the snow to create blizzard conditions along and near the coast. Winter storm warnings are in effect for the panhandles of West Virginia and Maryland, much of interior New England down to the northern Mid-Atlantic as well as for Nantucket Island, Massachusetts. Winter weather advisories are in effect for portions of the Ohio Valley, Mid-Atlantic and the southern Appalachians as well as a narrow area across interior New England. To create the video and imagery, NASA/NOAA's GOES Project located at NASA's Goddard Space Flight Center in Greenbelt, Maryland overlays the cloud data from NOAA's GOES-East satellite on a true-color image of land and ocean created by data from the Moderate Resolution Imaging Spectroradiometer, or MODIS, instrument that flies aboard NASA's Aqua and Terra satellites. Together, these data create the entire animation of the storm and show its movement. GOES satellites provide the kind of continuous monitoring necessary for intensive data analysis. Geostationary describes an orbit in which a satellite is always in the same position with respect to the rotating Earth. This allows GOES to hover continuously over one position on Earth's surface, appearing stationary. As a result, GOES provide a constant vigil for the atmospheric "triggers" for severe weather conditions such as tornadoes, flash floods, hail storms and hurricanes. For updated information about the storm system, visit NOAA's NWS website: <a href="http://www.weather.gov" rel="nofollow">www.weather.gov</a> For more information about GOES satellites, visit: <a href="http://www.goes.noaa.gov/" rel="nofollow">www.goes.noaa.gov/</a> or goes.gsfc.nasa.gov/ Rob Gutro NASA's Goddard Space Flight Center
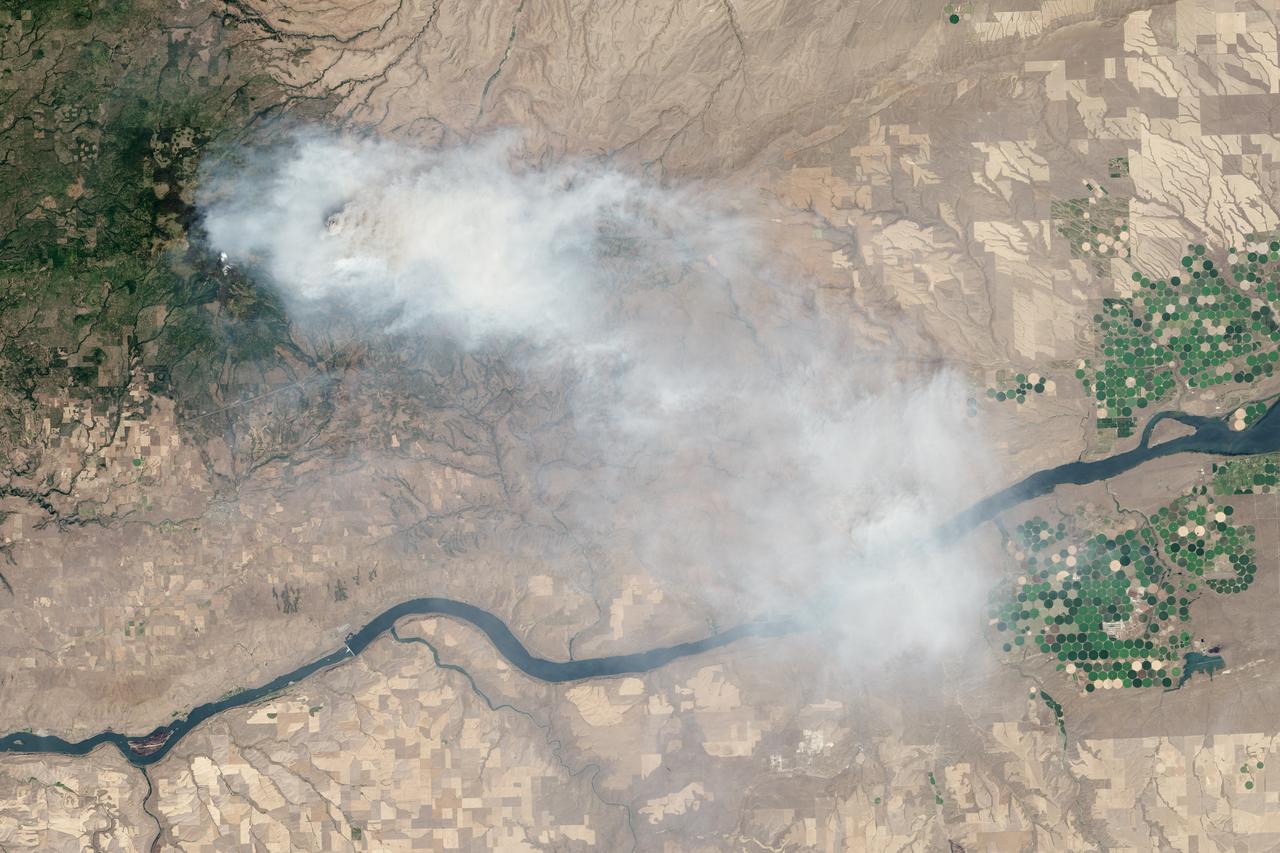
Eight major wildfires burned through forests and grasslands in the Pacific Northwest in late-July 2013, threatening homes and forcing road closings and evacuations. Many parts of Washington and Oregon faced extreme fire threats, as strong thunderstorms lined up to hit parched forests and grasslands with lightning. On July 28, 2013, the Operational Land Imager (OLI) on Landsat 8 captured these images of the Mile Marker 28 fire in the Simcoe Mountains northeast of Goldendale, Washington. Smoke blew east toward Kennewick, Pasco, and Richland. The lower image shows a closer view of smoke billowing up from the most active part of the fire. Ignited on July 24, 2013, the fire charred more than 22,000 acres (8,900 hectares) by July 30, when more than 1,000 firefighters achieved 40 percent containment. The blaze forced the evacuation of dozens of homes and the closure of US Highway 97. Through July 25, 450 wildfires had burned 10,220 acres (4,136 hectares) in Washington, while Oregon saw 603 fires that burned 63,135 acres (25,549 hectares). In all, 2.3 million acres burned across the United States by late-July, below the national average. Over the past ten years, an average of 4.2 million acres had burned in the United States by the end of each July. While coastal and western Washington receive heavy rain throughout the year, the rain shadow caused by the Cascades leaves central Washington quite dry. The mountains force moist air from the Pacific to rise, causing it to cool and condense into rain or snow on the windward side of the Cascades. So little moisture is left by the time air passes over the Cascades, that the area around Mile Marker 28 typically receives just 8 inches (20 centimeters) of precipitation per year. NASA Earth Observatory image by Jesse Allen and Robert Simmon, using Landsat data from the U.S. Geological Survey. Caption by Adam Voiland Instrument: Landsat 8 - OLI More info: <a href="http://earthobservatory.nasa.gov/IOTD/view.php?id=81738" rel="nofollow">earthobservatory.nasa.gov/IOTD/view.php?id=81738</a> Credit: <b><a href="http://www.earthobservatory.nasa.gov/" rel="nofollow"> NASA Earth Observatory</a></b> <b><a href="http://www.nasa.gov/audience/formedia/features/MP_Photo_Guidelines.html" rel="nofollow">NASA image use policy.</a></b> <b><a href="http://www.nasa.gov/centers/goddard/home/index.html" rel="nofollow">NASA Goddard Space Flight Center</a></b> enables NASA’s mission through four scientific endeavors: Earth Science, Heliophysics, Solar System Exploration, and Astrophysics. Goddard plays a leading role in NASA’s accomplishments by contributing compelling scientific knowledge to advance the Agency’s mission. <b>Follow us on <a href="http://twitter.com/NASA_GoddardPix" rel="nofollow">Twitter</a></b> <b>Like us on <a href="http://www.facebook.com/pages/Greenbelt-MD/NASA-Goddard/395013845897?ref=tsd" rel="nofollow">Facebook</a></b> <b>Find us on <a href="http://instagram.com/nasagoddard?vm=grid" rel="nofollow">Instagram</a></b>
![A swirling Eastern Pacific Ocean storm system headed for California was spotted by NOAA's GOES-West satellite on February 28. According to the National Weather Service, this storm system has the potential to bring heavy rainfall to the drought-stricken state. The storm was captured using visible data from NOAA's GOES-West or GOES-15 satellite on Feb. 28 at 1915 UTC/11:15 a.m. PST was made into an image by NASA/NOAA's GOES Project at NASA's Goddard Space Flight Center in Greenbelt, Md. The storm's center appeared as a tight swirl, with bands of clouds and showers already sweeping over the state extending from northern California to Baja California, Mexico. At 11:30 a.m. PST on February 28, Bill Patzert, climatologist at NASA's Jet Propulsion Laboratory in Pasadena, Calif. said, "Right now from northern to southern California we are being battered by very heavy rain, strong winds and our coastal communities are being battered by high surf. Through the weekend we are bracing for mud and rock slides in areas that recently burned [from wildfires]. Flooding is looming up and down the state." The National Weather Service (NWS) serving Los Angeles posted a Flood Watch for the region on Friday, February 28. The Flood Watch notes the "potential for flash flooding and debris flows for some 2013 and 2014 burn areas in Los Angeles County from this morning through Saturday evening (March 1).” The NWS Flood Watch also noted "a very strong and dynamic storm will bring a significant amount of rain to much of southwestern California through Saturday evening. A flash flood watch has been issued for several recent burn areas in Los Angeles County due to the abundant rainfall expected. Rain rates at times are expected to range from a half inch to one inch per hour which could cause significant mud and debris flows. There will be a chance of thunderstorms with locally higher rainfall rates." "Californians haven't seen rain and wind this powerful in 3 years," Patzert said. "By early next week, as this system moves east, this powerful system will wreak havoc causing snow and ice storms through the Midwest into the Northeast." GOES satellites provide the kind of continuous monitoring necessary for intensive data analysis. Geostationary describes an orbit in which a satellite is always in the same position with respect to the rotating Earth. This allows GOES to hover continuously over one position on Earth's surface, appearing stationary. As a result, GOES provide a constant vigil for the atmospheric "triggers" for severe weather conditions such as tornadoes, flash floods, hail storms and hurricanes. On a positive note, Patzert noted, "This is a nice down payment on drought recovery in the parched Western U.S." For updated information about the storm system, visit NOAA's National Weather Service website: <a href="http://www.weather.gov" rel="nofollow">www.weather.gov</a> For more information about GOES satellites, visit: <a href="http://www.goes.noaa.gov/" rel="nofollow">www.goes.noaa.gov/</a> or <a href="http://goes.gsfc.nasa.gov/" rel="nofollow">goes.gsfc.nasa.gov/</a> Rob Gutro NASA's Goddard Space Flight Center <b><a href="http://www.nasa.gov/audience/formedia/features/MP_Photo_Guidelines.html" rel="nofollow">NASA image use policy.</a></b> <b><a href="http://www.nasa.gov/centers/goddard/home/index.html" rel="nofollow">NASA Goddard Space Flight Center</a></b> enables NASA’s mission through four scientific endeavors: Earth Science, Heliophysics, Solar System Exploration, and Astrophysics. Goddard plays a leading role in NASA’s accomplishments by contributing compelling scientific knowledge to advance the Agency’s mission. <b>Follow us on <a href="http://twitter.com/NASAGoddardPix" rel="nofollow">Twitter</a></b> <b>Like us on <a href="http://www.facebook.com/pages/Greenbelt-MD/NASA-Goddard/395013845897?ref=tsd" rel="nofollow">Facebook</a></b> <b>Find us on <a href="http://instagram.com/nasagoddard?vm=grid" rel="nofollow">Instagram</a></b>](https://images-assets.nasa.gov/image/GSFC_20171208_Archive_e001192/GSFC_20171208_Archive_e001192~medium.jpg)
A swirling Eastern Pacific Ocean storm system headed for California was spotted by NOAA's GOES-West satellite on February 28. According to the National Weather Service, this storm system has the potential to bring heavy rainfall to the drought-stricken state. The storm was captured using visible data from NOAA's GOES-West or GOES-15 satellite on Feb. 28 at 1915 UTC/11:15 a.m. PST was made into an image by NASA/NOAA's GOES Project at NASA's Goddard Space Flight Center in Greenbelt, Md. The storm's center appeared as a tight swirl, with bands of clouds and showers already sweeping over the state extending from northern California to Baja California, Mexico. At 11:30 a.m. PST on February 28, Bill Patzert, climatologist at NASA's Jet Propulsion Laboratory in Pasadena, Calif. said, "Right now from northern to southern California we are being battered by very heavy rain, strong winds and our coastal communities are being battered by high surf. Through the weekend we are bracing for mud and rock slides in areas that recently burned [from wildfires]. Flooding is looming up and down the state." The National Weather Service (NWS) serving Los Angeles posted a Flood Watch for the region on Friday, February 28. The Flood Watch notes the "potential for flash flooding and debris flows for some 2013 and 2014 burn areas in Los Angeles County from this morning through Saturday evening (March 1).” The NWS Flood Watch also noted "a very strong and dynamic storm will bring a significant amount of rain to much of southwestern California through Saturday evening. A flash flood watch has been issued for several recent burn areas in Los Angeles County due to the abundant rainfall expected. Rain rates at times are expected to range from a half inch to one inch per hour which could cause significant mud and debris flows. There will be a chance of thunderstorms with locally higher rainfall rates." "Californians haven't seen rain and wind this powerful in 3 years," Patzert said. "By early next week, as this system moves east, this powerful system will wreak havoc causing snow and ice storms through the Midwest into the Northeast." GOES satellites provide the kind of continuous monitoring necessary for intensive data analysis. Geostationary describes an orbit in which a satellite is always in the same position with respect to the rotating Earth. This allows GOES to hover continuously over one position on Earth's surface, appearing stationary. As a result, GOES provide a constant vigil for the atmospheric "triggers" for severe weather conditions such as tornadoes, flash floods, hail storms and hurricanes. On a positive note, Patzert noted, "This is a nice down payment on drought recovery in the parched Western U.S." For updated information about the storm system, visit NOAA's National Weather Service website: <a href="http://www.weather.gov" rel="nofollow">www.weather.gov</a> For more information about GOES satellites, visit: <a href="http://www.goes.noaa.gov/" rel="nofollow">www.goes.noaa.gov/</a> or <a href="http://goes.gsfc.nasa.gov/" rel="nofollow">goes.gsfc.nasa.gov/</a> Rob Gutro NASA's Goddard Space Flight Center <b><a href="http://www.nasa.gov/audience/formedia/features/MP_Photo_Guidelines.html" rel="nofollow">NASA image use policy.</a></b> <b><a href="http://www.nasa.gov/centers/goddard/home/index.html" rel="nofollow">NASA Goddard Space Flight Center</a></b> enables NASA’s mission through four scientific endeavors: Earth Science, Heliophysics, Solar System Exploration, and Astrophysics. Goddard plays a leading role in NASA’s accomplishments by contributing compelling scientific knowledge to advance the Agency’s mission. <b>Follow us on <a href="http://twitter.com/NASAGoddardPix" rel="nofollow">Twitter</a></b> <b>Like us on <a href="http://www.facebook.com/pages/Greenbelt-MD/NASA-Goddard/395013845897?ref=tsd" rel="nofollow">Facebook</a></b> <b>Find us on <a href="http://instagram.com/nasagoddard?vm=grid" rel="nofollow">Instagram</a></b>