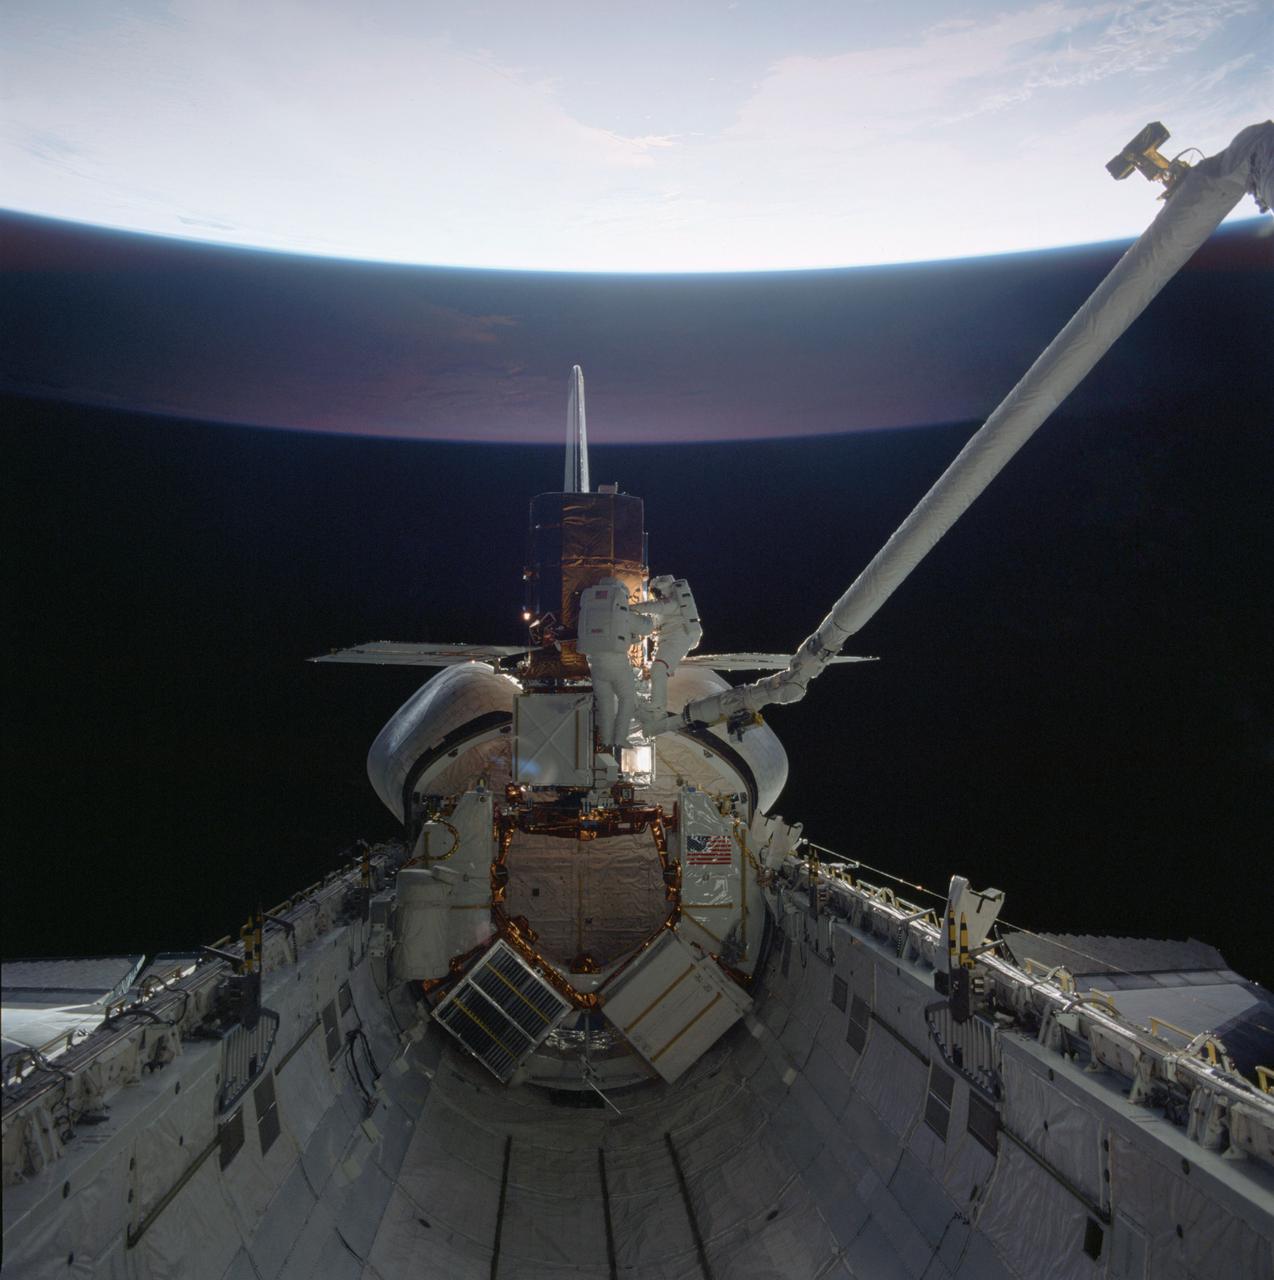
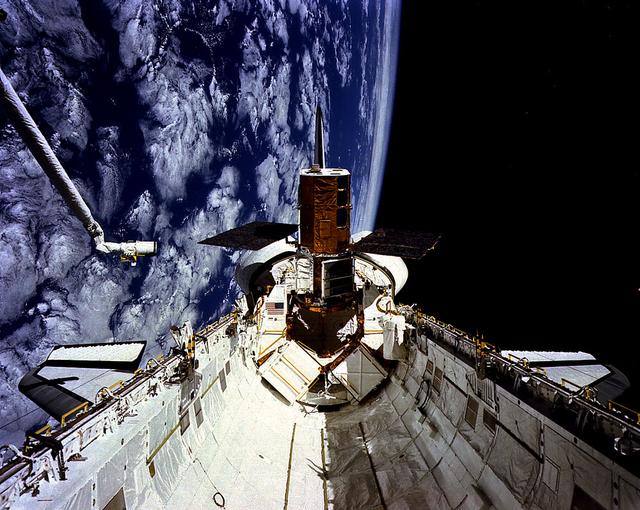
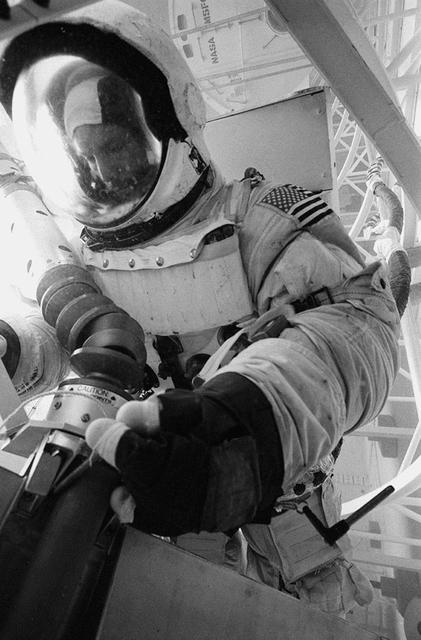
41C-37-1711 (11 April 1984) --- The two mission specialist-EVA participants of Flight 41-C share a repair task at the "captured" Solar Maximum Mission Satellite (SMMS) in the aft end of the Challenger's cargo bay. Astronauts George D. Nelson, right, and James D. van Hoften uses the mobile foot restraint and the Remote Manipulator System (RMS) as a "cherry picker" device for moving about. Later, the RMS lifted the SMMS into space once more.
41C-34-1380 (10-11 April 1984) --- Astronaut George D. Nelson, using the manned maneuvering unit (MMU), arrives at the ailing Solar Maximum Mission Satellite (SMMS). After the STS-41C crewmembers captured the errant satellite and temporarily cradled it in Challenger?s payload bay, astronauts Nelson and James D. van Hoften repaired it and later re-released it.
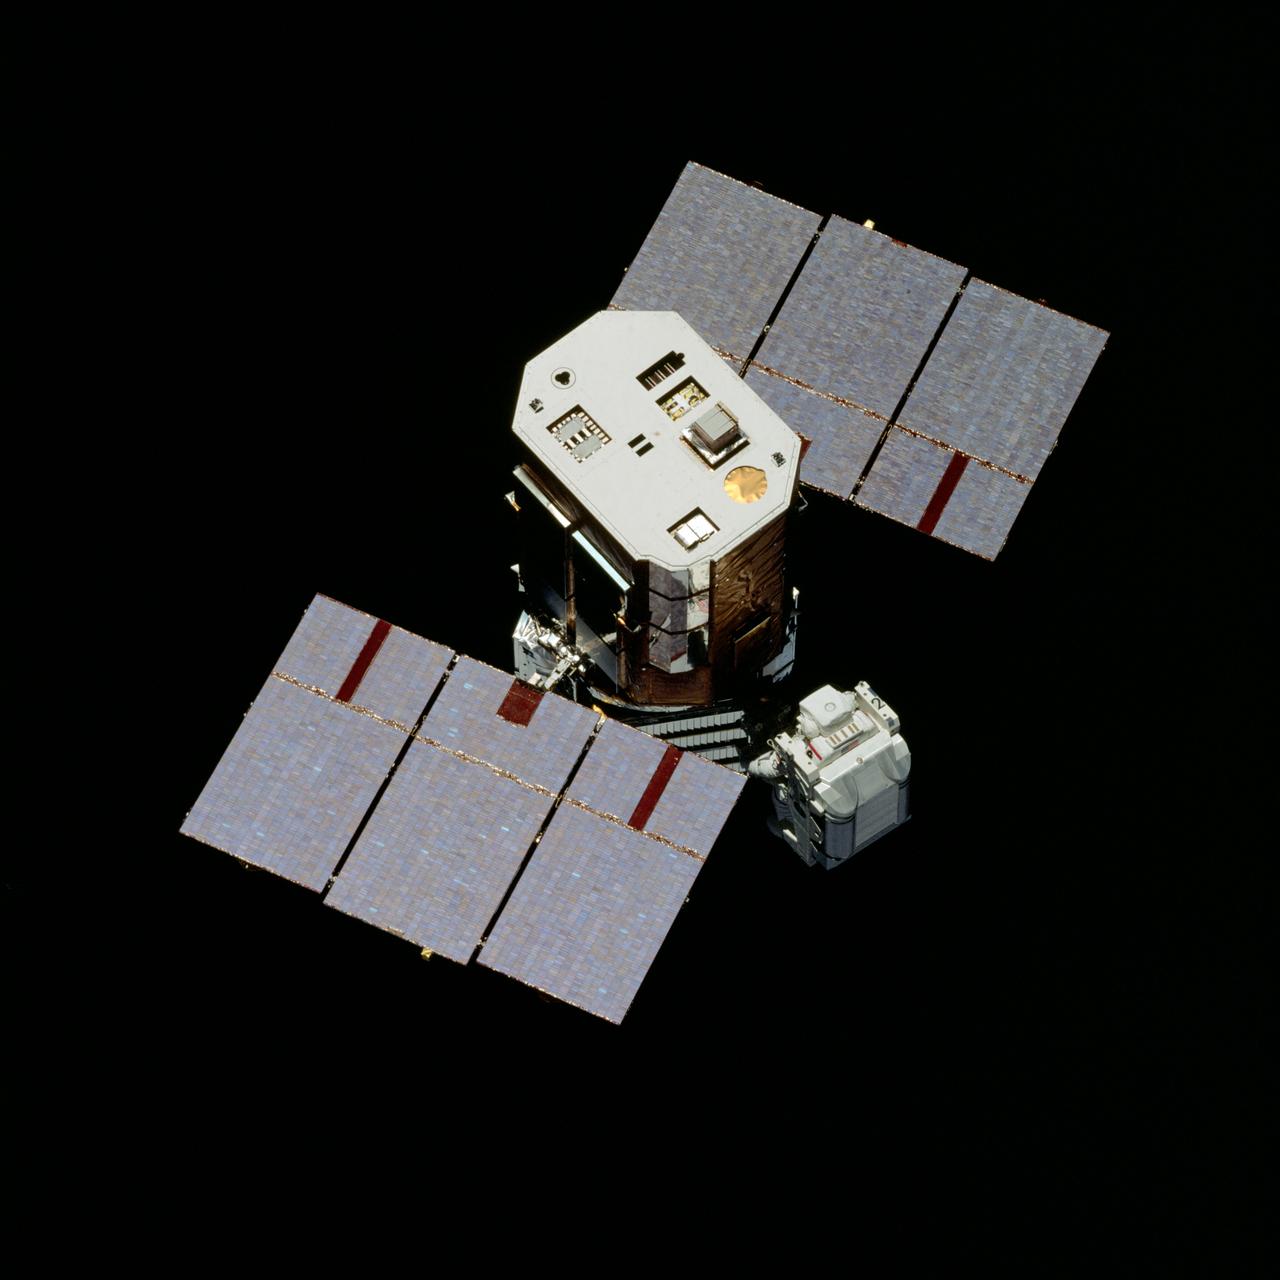
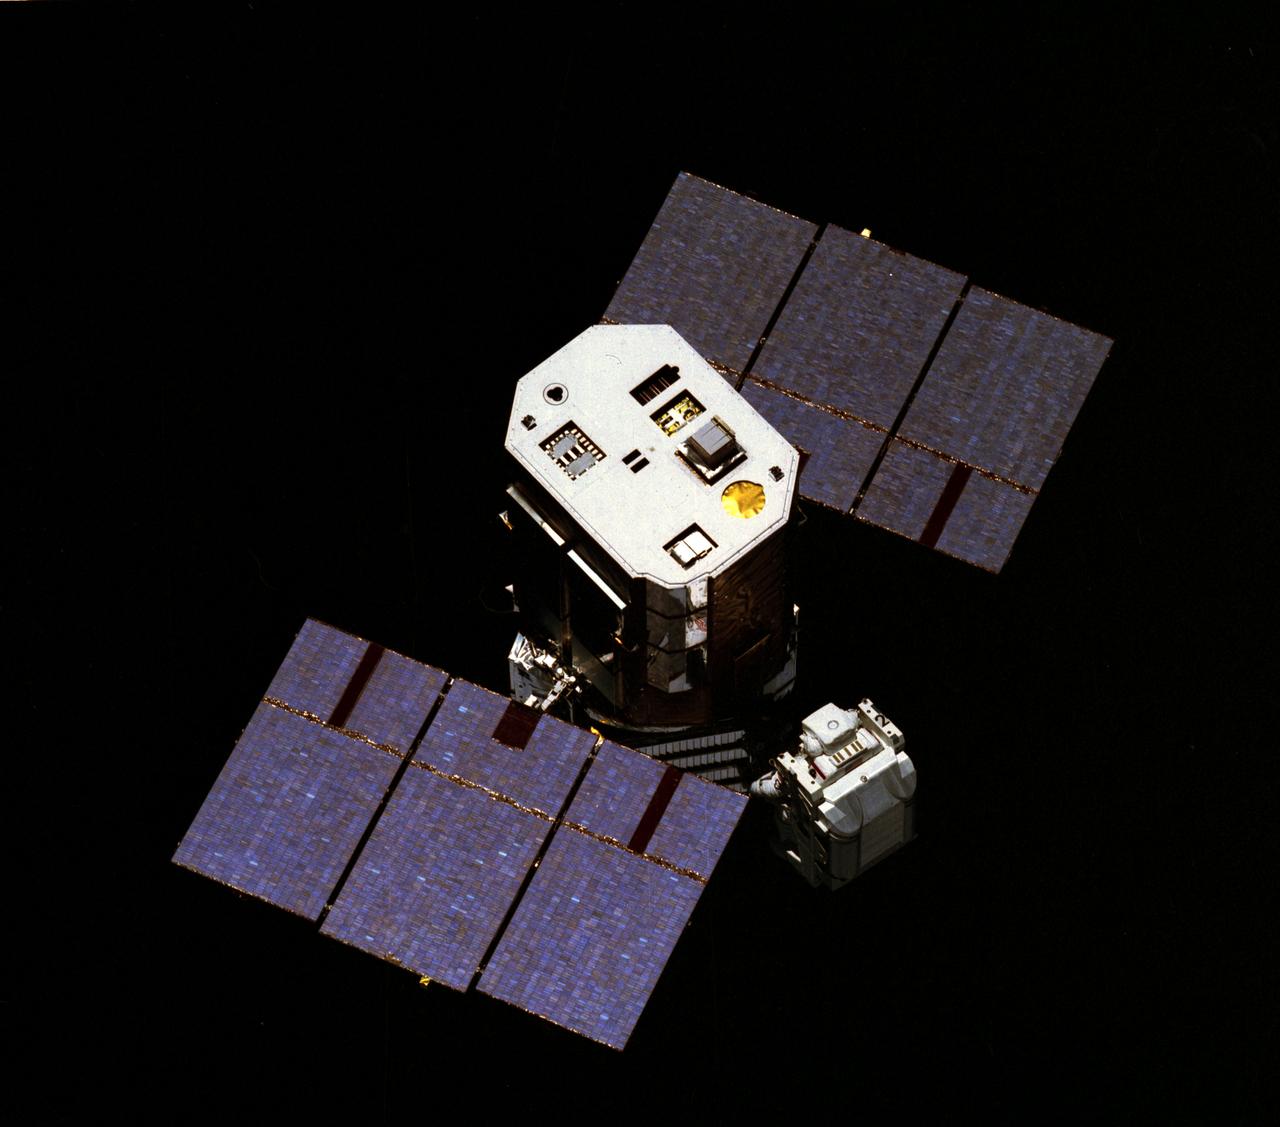
Space Shuttle mission STS-41C onboard view of the revived Solar Maximum Mission Satellite (SMMS). As part of the mission the crew demonstrated the capability of the shuttle to rendezvous, service, check-out and deploy an on-orbit satellite. Also as part of the redeployment, the SMMS was fitted with a Long Duration Exposure Facility (LDEF), which provides accommodations for experiments requiring long-term exposure to the space environment. the STS-41C mission was launched aboard the Space Shuttle Orbitor Challenger on April 6, 1984.
Launched April 6, 1984, one of the goals of the STS-41C mission was to repair the damaged free-flying Solar Maximum Mission Satellite (SMMS), or Solar Max. The original plan was to make an excursion out to the SMMS and capture it for necessary repairs. Pictured is Mission Specialist George Nelson approaching the damaged satellite in a capture attempt. This attempted feat was unsuccessful. It was necessary to capture the satellite via the orbiter's Remote Manipulator System (RMS) and secure it into the cargo bay in order to perform the repairs, which included replacing the altitude control system and the coronograph/polarimeter electronics box. The SMMS was originally launched into space via the Delta Rocket in February 1980, with the purpose to provide a means of studying solar flares during the most active part of the current sunspot cycle. Dr. Einar Tandberg-Hanssen of Marshall Space Flight Center's Space Sciences Lab was principal investigator for the Ultraviolet Spectrometer and Polarimeter, one of the seven experiments of the Solar Max.
41C-22-885 (8 April 1984) --- The 35mm camera was used to photograph this scene of Astronaut George D. Nelson, STS-41C mission specialist, as he uses the manned maneuvering unit (MMU) to make an excursion to the plagued Solar Maximum, Mission Satellite (SMMS)._Astronaut James D. van Hoften remained in the Challenger's cargo bay during the April 8 extravehicular activity (EVA).
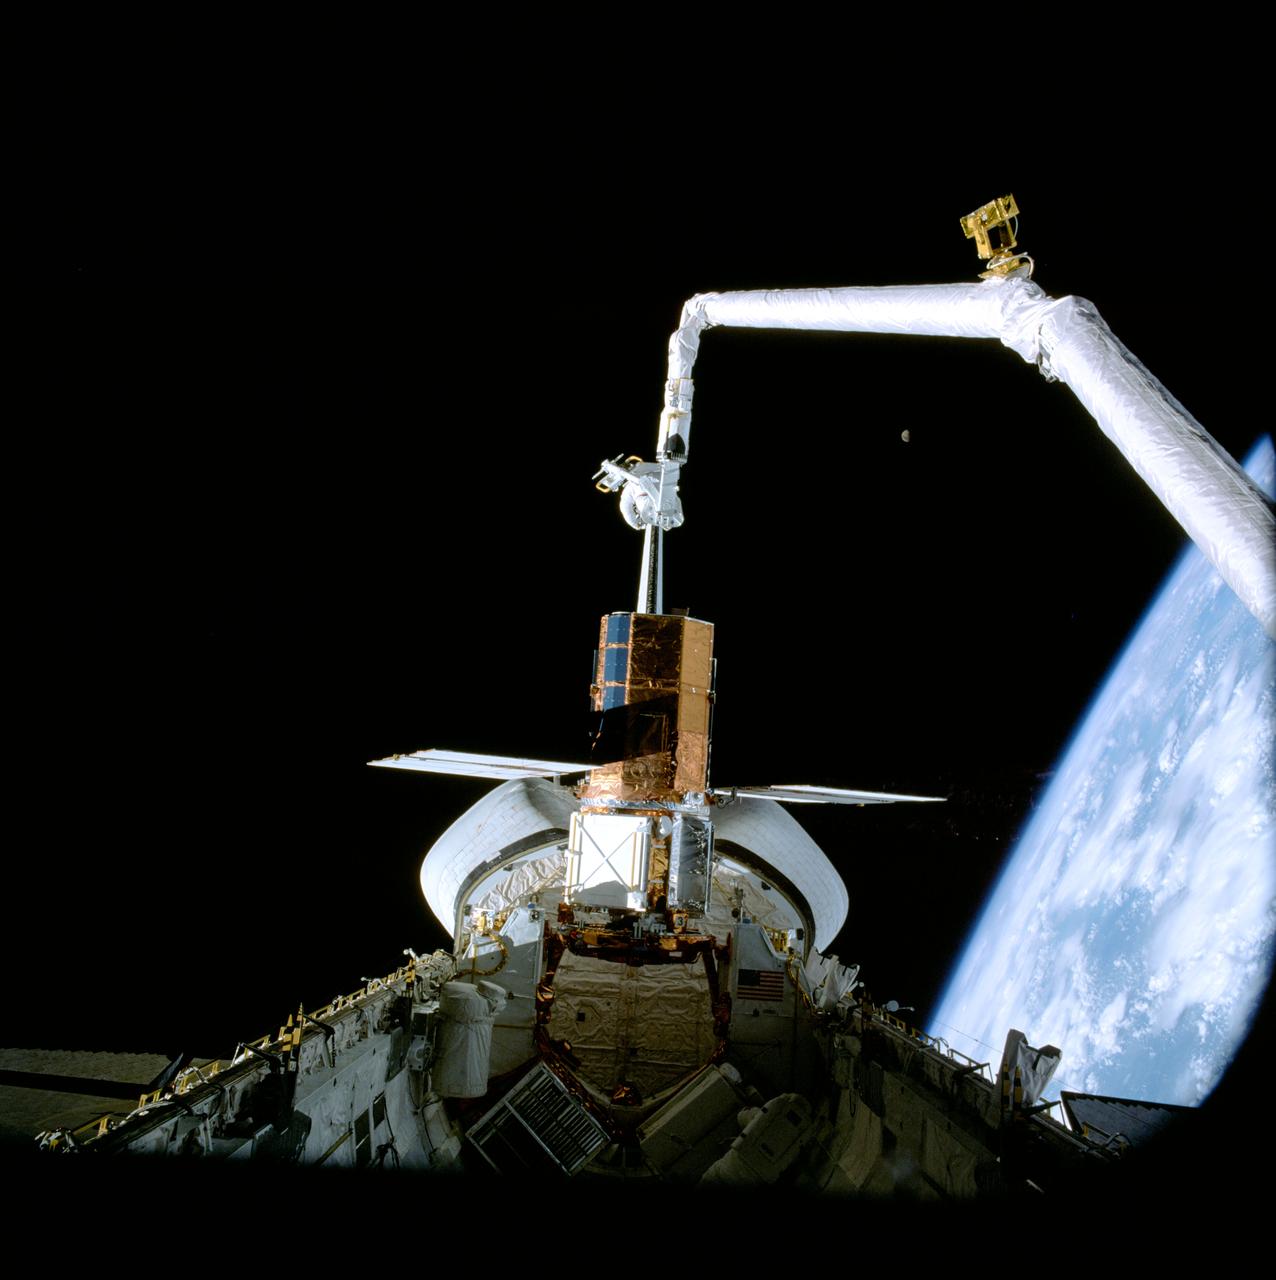
41C-37-1715 (11 April 1984) --- A scenic panorama is captured by an onboard 70mm handheld camera during the April 11, 1984, Solar Maximum Mission Satellite (SMMS) repair job aboard the Earth-orbiting Space Shuttle Challenger. The SMMS is temporarily docked at the Challenger's Flight Support System (FSS) so that astronauts George D. Nelson and James D. van Hoften could perform a series of repair tasks. The Remote Manipulator System (RMS) arm was used to move the astronauts into position for their series of chores. Note the gibbous Moon to the right of center and the horizon of the blue and white Earth in the lower right quadrant.
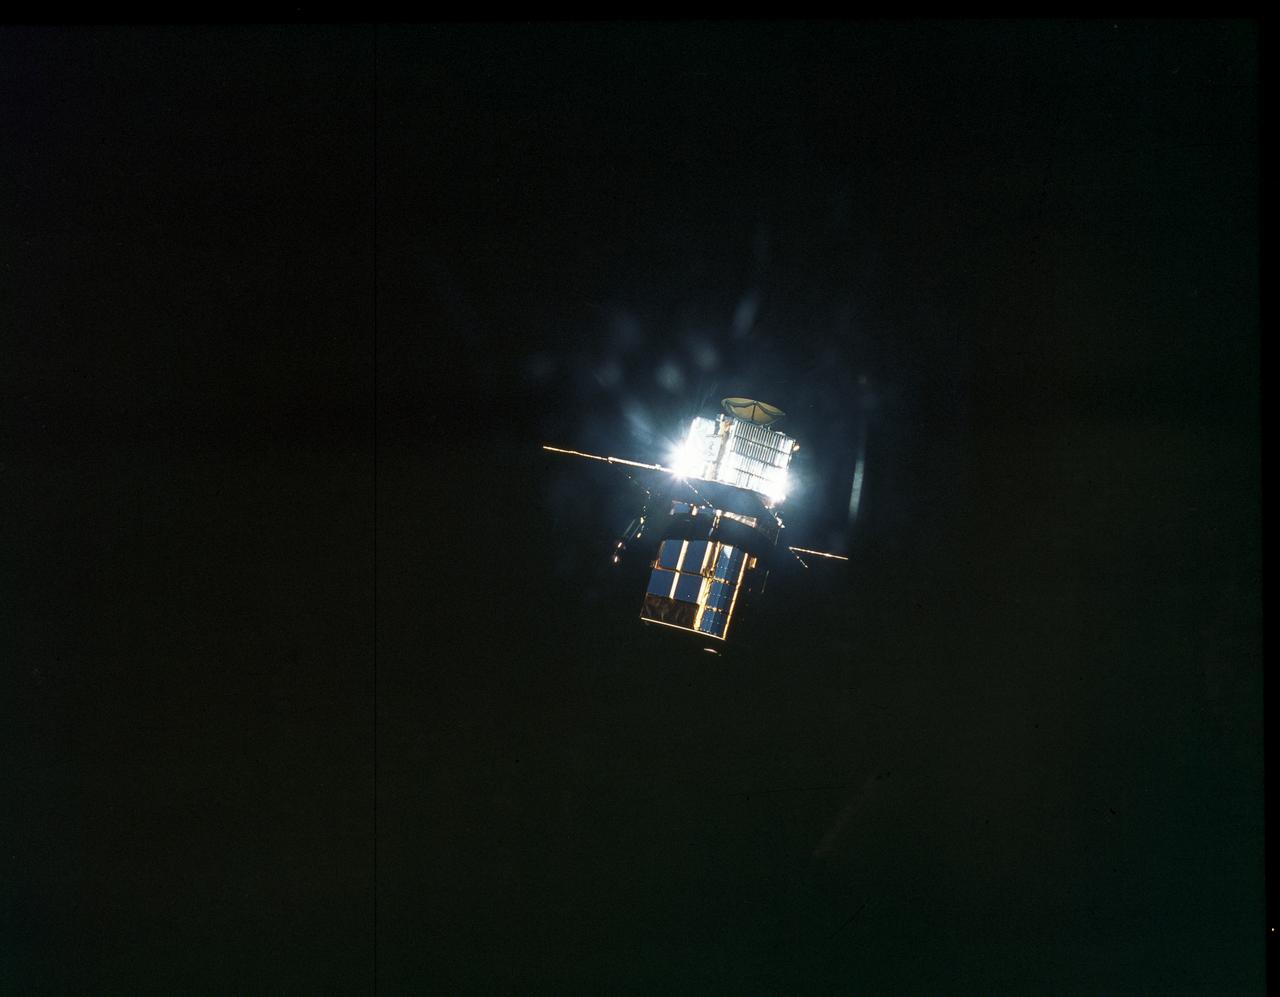
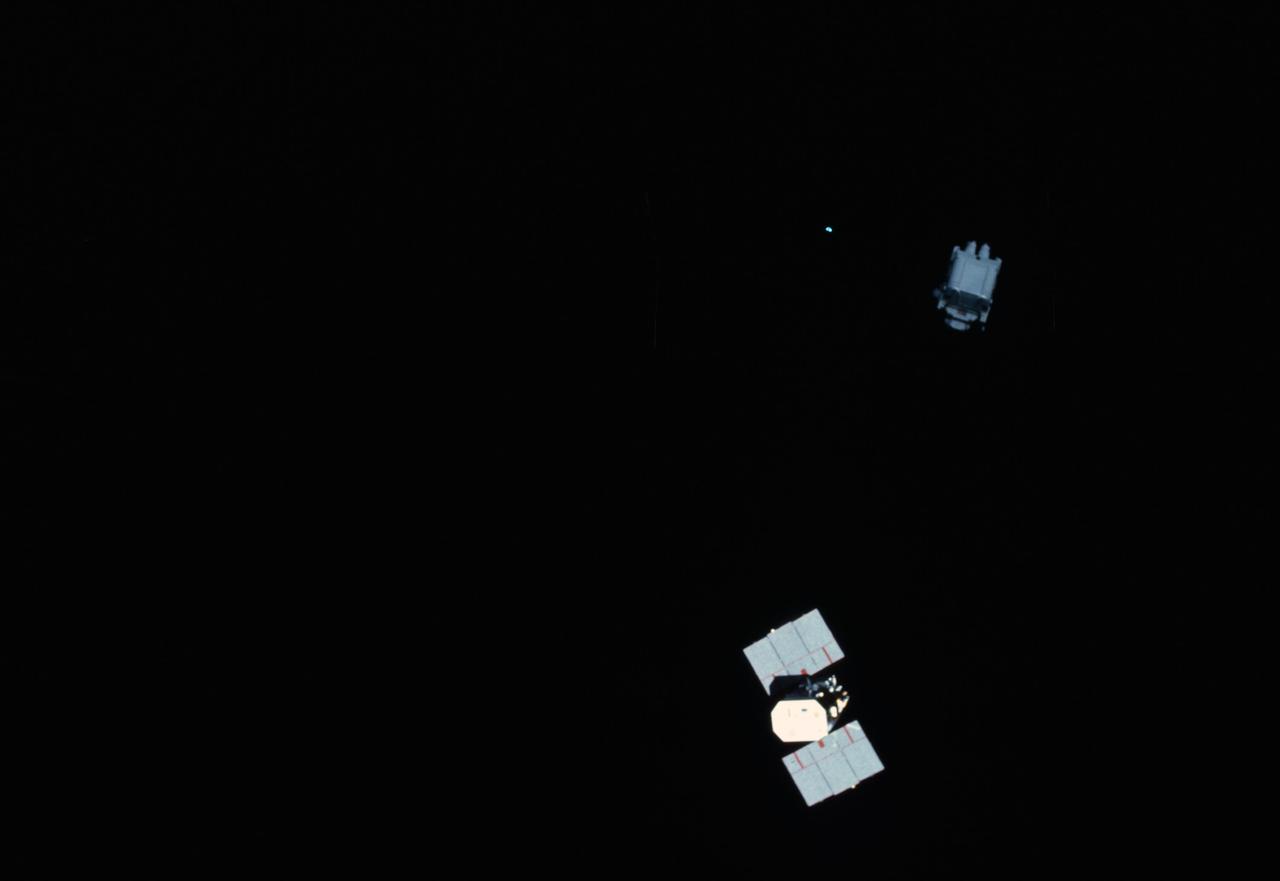
This is a photograph of the free-flying Solar Maximum Mission Satellite (SMMS), or Solar Max, as seen by the approaching Space Shuttle Orbiter Challenger STS-41C mission. Launched April 6, 1984, one of the goals of the STS-41C mission was to repair the damaged Solar Max. The original plan was to make an excursion out to the SMMS for capture to make necessary repairs, however, this attempted feat was unsuccessful. It was necessary to capture the satellite via the orbiter's Remote Manipulator System (RMS) and secure it into the cargo bay in order to perform the repairs, which included replacing the altitude control system and the coronograph/polarimeter electronics box. The SMMS was originally launched into space via the Delta Rocket in February 1980, with the purpose to provide a means of studying solar flares during the most active part of the current sunspot cycle. Dr. Einar Tandberg-Hanssen of Marshall Space Flight Center's Space Sciences Lab was principal investigator for the Ultraviolet Spectrometer and Polarimeter, one of the seven experiments on the Solar Max.
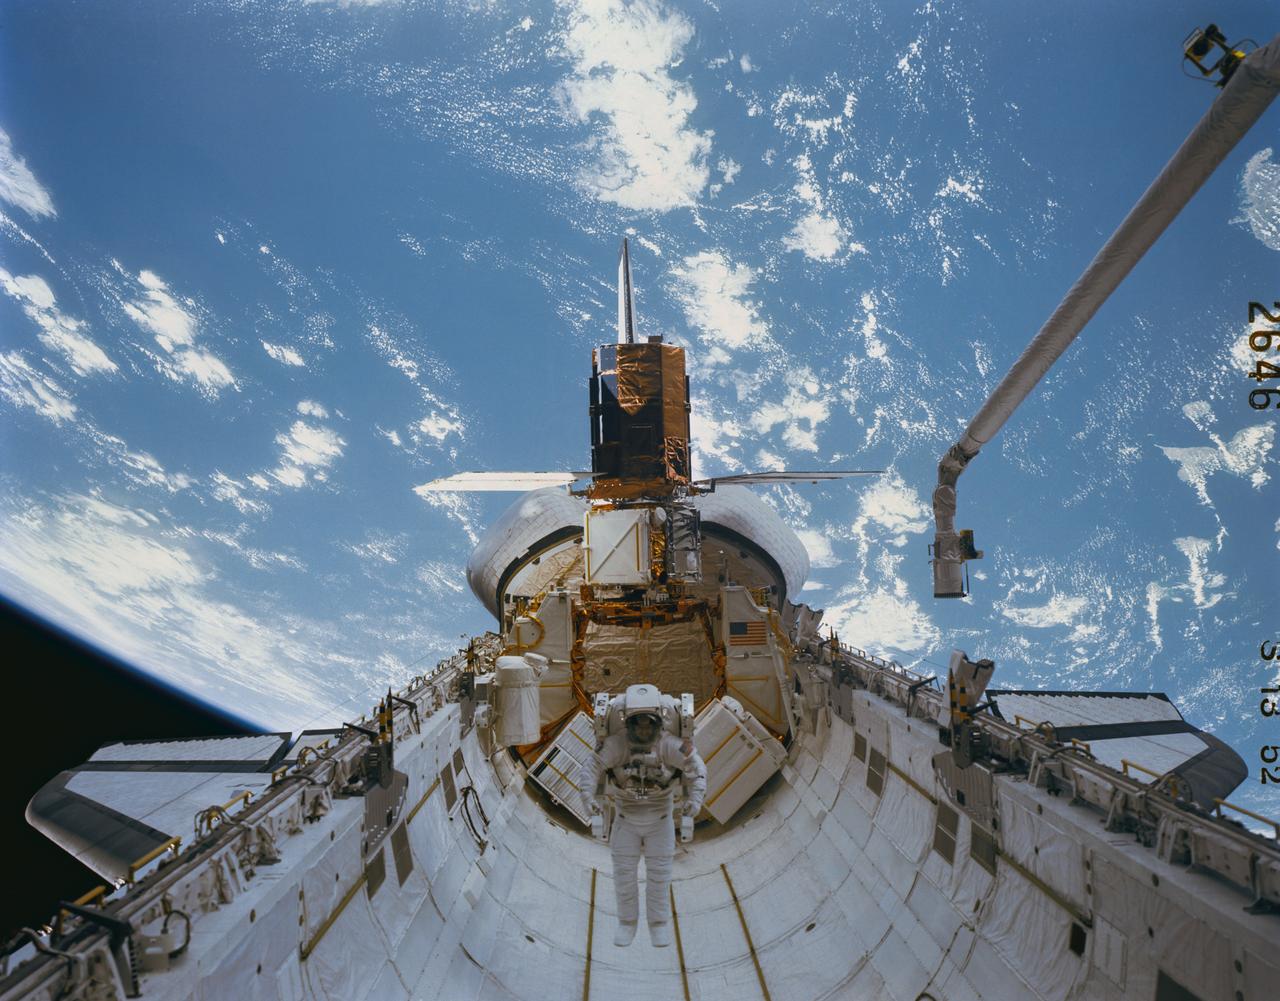
41C-52-2646 (11 April 1984) --- Astronaut James D. van Hoften and a repaired satellite are in a wide panorama recorded on film with a Linhof camera, making its initial flight aboard the Space Shuttle Challenger. Dr. van Hoften is getting in his first "field" test of the Manned Maneuvering Unit (MMU) after months of training in an underwater facility and in a simulator on Earth. The Solar Maximum Mission Satellite (SMMS), revived and almost ready for release into space once more, is docked at the Flight Support System (FSS). The Remote Manipulator System (RMS) is backdropped against the blue and white Earth at frame's edge. Outside of pictures made of the Earth from astronauts on the way to the Moon, this frame showing the planet from 285 nautical miles represents the highest orbital photography in the manned space program.

41C-37-1718 (11 April 1984) --- Astronaut James D. van Hoften and a repaired satellite are captured by a Hasselblad camera aimed through Challenger's aft cabin windows toward the cargo bay of the Earth orbiting Challenger. Dr. van Hoften is getting in his first "field" test of the manned maneuvering unit (MMU) after months of training in an underwater facility and in a simulator on Earth. The Solar Maximum Mission Satellite (SMMS), revived and almost ready for release into space once more, is docked at the flight support system (FSS).

In February 1980, a satellite called Solar Maximum Mission Spacecraft, or Solar Max, was launched into Earth's orbit. Its primary objective was to provide a detailed study of solar flares, active regions on the Sun's surface, sunspots, and other solar activities. Additionally, it was to measure the total output of radiation from the Sun. Not much was known about solar activity at that time except for a slight knowledge of solar flares. After its launch, Solar Max fulfilled everyone's expectations. However, after a year in orbit, Solar Max's Altitude Control System malfunctioned, preventing the precise pointing of instruments at the Sun. NASA scientists were disappointed at the lost data, but not altogether dismayed because Solar Max had been designed for Space Shuttle retrievability enabling repair of the satellite. On April 6, 1984, Space Shuttle Challenger (STS-41C), Commanded by astronaut Robert L. Crippen and piloted by Francis R. Scobee, launched on a historic voyage. This voyage initiated a series of firsts for NASA; the first satellite retrieval, the first service use of a new space system called the Marned Maneuvering Unit (MMU), the first in-orbit repair, the first use of the Remote Manipulator System (RMS), and the Space Shuttle Challenger's first space flight. The mission was successful in retrieving Solar Max. Mission Specialist Dr. George D. Nelson, using the MMU, left the orbiter's cargo bay and rendezvoused with Solar Max. After attaching himself to the satellite, he awaited the orbiter to maneuver itself nearby. Using the RMS, Solar Max was captured and docked in the cargo bay while Dr. Nelson replaced the altitude control system and the coronagraph/polarimeter electronics box. After the repairs were completed, Solar Max was redeposited in orbit with the assistance of the RMS. Prior to the April 1984 launch, countless man-hours were spent preparing for this mission. The crew of Challenger spent months at Marshall Space Flight Center's (MSFC) Neutral Buoyancy Simulator (NBS) practicing retrieval maneuvers, piloting the MMU, and training on equipment so they could make the needed repairs to Solar Max. Pictured is Dr. Nelson performing a replacement task on the Solar Max mock-up in the NBS.

In February 1980, a satellite called Solar Maximum Mission Spacecraft, or Solar Max, was launched into Earth's orbit. Its primary objective was to provide a detailed study of solar flares,active regions on the Sun's surface, sunspots, and other solar activities. Additionally, it was to measure the total output of radiation from the Sun. Not much was known about solar activity at that time except for a slight knowledge of solar flares. After its launch, Solar Max fulfilled everyone's expectations. However, after a year in orbit, Solar Max's Altitude Control System malfunctioned, preventing the precise pointing of instruments at the Sun. NASA scientists were disappointed at the lost data, but not altogether dismayed because Solar Max had been designed for Space Shuttle retrievability enabling the repair of the satellite. On April 6, 1984, Space Shuttle Challenger (STS-41C), Commanded by astronaut Robert L. Crippen and piloted by Francis R. Scobee, launched on a historic voyage. This voyage initiated a series of firsts for NASA; the first satellite retrieval, the first service use of a new space system called the Marned Maneuvering Unit (MMU), the first in-orbit repair, the first use of the Remote Manipulator System (RMS), and the Space Shuttle Challenger's first space flight. The mission was successful in retrieving Solar Max. Mission Specialist Dr. George D. Nelson, using the MMU, left the orbiter's cargo bay and rendezvoused with Solar Max. After attaching himself to the satellite, he awaited the orbiter to maneuver itself nearby. Using the RMS, Solar Max was captured and docked in the cargo bay while Dr. Nelson replaced the altitude control system and the coronagraph/polarimeter electronics box. After the repairs were completed, Solar Max was redeposited in orbit with the assistance of the RMS. Prior to the April 1984 launch, countless man-hours were spent preparing for this mission. The crew of Challenger spent months at Marshall Space Flight Center's (MSFC) Neutral Buoyancy Simulator (NBS) practicing retrieval maneuvers, piloting the MMU, and training on equipment so they could make the needed repairs to Solar Max. Pictured is Dr. Nelson performing a replacement task on the Solar Max mock-up in the NBS.

In February 1980, a satellite called Solar Maximum Mission Spacecraft, or Solar Max, was launched into Earth's orbit. Its primary objective was to provide a detailed study of solar flares, active regions on the Sun's surface, sunspots, and other solar activities. Additionally, it was to measure the total output of radiation from the Sun. Not much was known about solar activity at that time except for a slight knowledge of solar flares. After its launch, Solar Max fulfilled everyone's expectations. However, after a year in orbit, Solar Max's Altitude Control System malfunctioned, preventing the precise pointing of instruments at the Sun. NASA scientists were disappointed at the lost data, but not altogether dismayed because Solar Max had been designed for Space Shuttle retrievability enabling the repair of the satellite. On April 6, 1984, Space Shuttle Challenger (STS-41C), Commanded by astronaut Robert L. Crippen and piloted by Francis R. Scobee, launched on a historic voyage. This voyage initiated a series of firsts for NASA; the first satellite retrieval, the first service use of a new space system called the Marned Maneuvering Unit (MMU), the first in-orbit repair, the first use of the Remote Manipulator System (RMS), and the Space Shuttle Challenger's first space flight. The mission was successful in retrieving Solar Max. Mission Specialist Dr. George D. Nelson, using the MMU, left the orbiter's cargo bay and rendezvoused with Solar Max. After attaching himself to the satellite, he awaited the orbiter to maneuver itself nearby. Using the RMS, Solar Max was captured and docked in the cargo bay while Dr. Nelson replaced the altitude control system and the coronagraph/polarimeter electronics box. After the repairs were completed, Solar Max was redeposited in orbit with the assistance of the RMS. Prior to the April 1984 launch, countless man-hours were spent preparing for this mission. The crew of Challenger spent months at Marshall Space Flight Center's (MSFC) Neutral Buoyancy Simulator (NBS) practicing retrieval maneuvers, piloting the MMU, and training on equipment so they could make the needed repairs to Solar Max. Pictured is Dr. Nelson performing a replacement task on the Solar Max mock-up in the NBS.
In February 1980, a satellite called Solar Maximum Mission Spacecraft, or Solar Max, was launched into Earth's orbit. Its primary objective was to provide a detailed study of solar flares,active regions on the Sun's surface, sunspots, and other solar activities. Additionally, it was to measure the total output of radiation from the Sun. Not much was known about solar activity at that time except for a slight knowledge of solar flares. After its launch, Solar Max fulfilled everyone's expectations. However, after a year in orbit, Solar Max's Altitude Control System malfunctioned, preventing the precise pointing of instruments at the Sun. NASA scientists were disappointed at the lost data, but not altogether dismayed because Solar Max had been designed for Space Shuttle retrievability, enabling repair to the satellite. On April 6, 1984, Space Shuttle Challenger (STS-41C), Commanded by astronaut Robert L. Crippen and piloted by Francis R. Scobee, launched on a historic voyage. This voyage initiated a series of firsts for NASA; the first satellite retrieval, the first service use of a new space system called the Marned Maneuvering Unit (MMU), the first in-orbit repair, the first use of the Remote Manipulator System (RMS), and the Space Shuttle Challenger's first space flight. The mission was successful in retrieving Solar Max. Mission Specialist Dr. George D. Nelson, using the MMU, left the orbiter's cargo bay and rendezvoused with Solar Max. After attaching himself to the satellite, he awaited the orbiter to maneuver itself nearby. Using the RMS, Solar Max was captured and docked in the cargo bay while Dr. Nelson replaced the altitude control system and the coronagraph/polarimeter electronics box. After the repairs were completed, Solar Max was redeposited in orbit with the assistance of the RMS. Prior to the April 1984 launch, countless man-hours were spent preparing for this mission. The crew of Challenger spent months at Marshall Space Flight Center's (MSFC) Neutral Buoyancy Simulator (NBS) practicing retrieval maneuvers, piloting the MMU, and training on equipment so they could make the needed repairs to Solar Max. Pictured is Dr. Nelson performing a replacement task on the Solar Max mock-up in the NBS.

S83-40555 (15 October 1983) --- These five astronauts are in training for the STS-41B mission, scheduled early next year. On the front row are Vance D. Brand, commander; and Robert L. Gibson, pilot. Mission specialists (back row, left to right) are Robert L. Stewart, Dr. Ronald E. McNair and Bruce McCandless II. Stewart and McCandless are wearing Extravehicular Mobility Units (EMU) space suits. The STS program's second extravehicular activity (EVA) is to be performed on this flight, largely as a rehearsal for a scheduled repair visit to the Solar Maximum Satellite (SMS), on a later mission. The Manned Maneuvering Unit (MMU) will make its space debut on STS-41B.
In February 1980, a satellite called Solar Maximum Mission Spacecraft, or Solar Max, was launched into Earth's orbit. Its primary objective was to provide a detailed study of solar flares, active regions on the Sun's surface, sunspots, and other solar activities. Additionally, it was to measure the total output of radiation from the Sun. Not much was known about solar activity at that time except for a slight knowledge of solar flares. After its launch, Solar Max fulfilled everyone's expectations. However, after a year in orbit, Solar Max's Altitude Control System malfunctioned, preventing the precise pointing of instruments at the Sun. NASA scientists were disappointed at the lost data, but not altogether dismayed because Solar Max had been designed for Space Shuttle retrievability enabling the repair of the satellite. On April 6, 1984, Space Shuttle Challenger (STS-41C), Commanded by astronaut Robert L. Crippen and piloted by Francis R. Scobee, launched on a historic voyage. This voyage initiated a series of firsts for NASA; the first satellite retrieval, the first service use of a new space system called the Marned Maneuvering Unit (MMU), the first in-orbit repair, the first use of the Remote Manipulator System (RMS), and the Space Shuttle Challenger's first space flight. The mission was successful in retrieving Solar Max. Mission Specialist Dr. George D. Nelson, using the MMU, left the orbiter's cargo bay and rendezvoused with Solar Max. After attaching himself to the satellite, he awaited the orbiter to maneuver itself nearby. Using the RMS, Solar Max was captured and docked in the cargo bay while Dr. Nelson replaced the altitude control system and the coronagraph/polarimeter electronics box. After the repairs were completed, Solar Max was redeposited in orbit with the assistance of the RMS. Prior to the April 1984 launch, countless man-hours were spent preparing for this mission. The crew of Challenger spent months at Marshall Space Flight Center's (MSFC) Neutral Buoyancy Simulator (NBS) practicing retrieval maneuvers, piloting the MMU, and training on equipment so they could make the needed repairs to Solar Max. Pictured are crew members training on repair tasks.

In February 1980, a satellite called Solar Maximum Mission Spacecraft, or Solar Max, was launched into Earth's orbit. Its primary objective was to provide a detailed study of solar flares, active regions on the Sun's surface, sunspots, and other solar activities. Additionally, it was to measure the total output of radiation from the Sun. Not much was known about solar activity at that time except for a slight knowledge of solar flares. After its launch, Solar Max fulfilled everyone's expectations. However, after a year in orbit, Solar Max's Altitude Control System malfunctioned, preventing the precise pointing of instruments at the Sun. NASA scientists were disappointed at the lost data, but not altogether dismayed because Solar Max had been designed for Space Shuttle retrievability enabling the repair of the satellite. On April 6, 1984, Space Shuttle Challenger (STS-41C), Commanded by astronaut Robert L. Crippen and piloted by Francis R. Scobee, launched on a historic voyage. This voyage initiated a series of firsts for NASA; the first satellite retrieval, the first service use of a new space system called the Marned Maneuvering Unit (MMU), the first in-orbit repair, the first use of the Remote Manipulator System (RMS), and the Space Shuttle Challenger's first space flight. The mission was successful in retrieving Solar Max. Mission Specialist Dr. George D. Nelson, using the MMU, left the orbiter's cargo bay and rendezvoused with Solar Max. After attaching himself to the satellite, he awaited the orbiter to maneuver itself nearby. Using the RMS, Solar Max was captured and docked in the cargo bay while Dr. Nelson replaced the altitude control system and the coronagraph/polarimeter electronics box. After the repairs were completed, Solar Max was redeposited in orbit with the assistance of the RMS. Prior to the April 1984 launch, countless man-hours were spent preparing for this mission. The crew of Challenger spent months at Marshall Space Flight Center's (MSFC) Neutral Buoyancy Simulator (NBS) practicing retrieval maneuvers, piloting the MMU, and training on equipment so they could make the needed repairs to Solar Max. Pictured are crew members training for repair tasks.

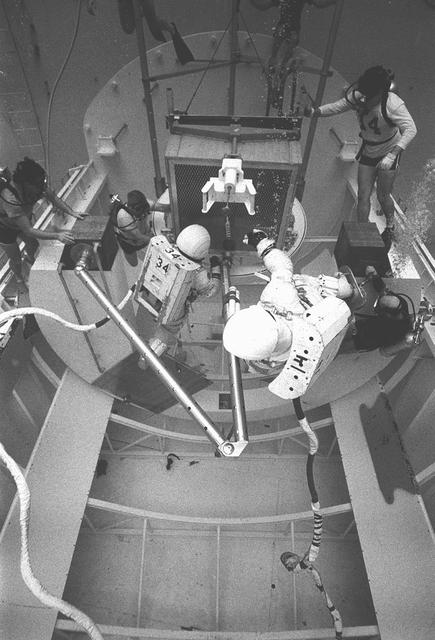
S83-42893 (19 Oct 1983) ---- Astronauts George D. Nelson and James D. van Hoften, two of three STS-41C mission specialists, share an extravehicular activity (EVA) task in this simulation of a Solar Maximum Satellite (SMS) repair visit. The two are making use of the Johnson Space Center's (JSC) weightless environment training facility (WET-F). Dr. Nelson is equipped with the manned maneuvering unit (MMU) trainer and he handles the trunion pin attachment device (TPAD), a major tool to be used on the mission. The photograph was taken by Otis Imboden.
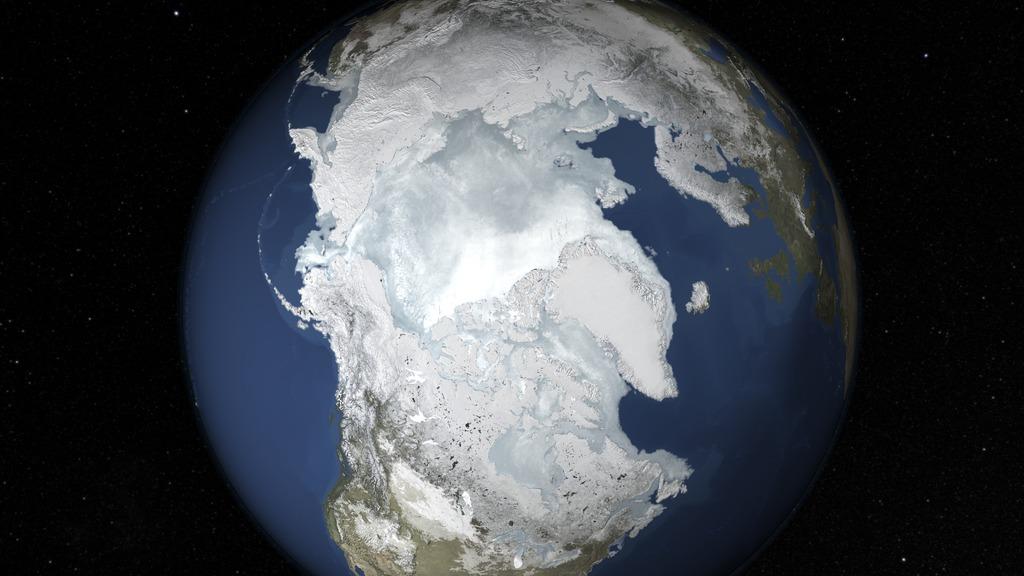
The sea ice cap of the Arctic appeared to reach its annual maximum winter extent on Feb. 25, according to data from the NASA-supported National Snow and Ice Data Center (NSIDC) at the University of Colorado, Boulder. At 5.61 million square miles (14.54 million square kilometers), this year’s maximum extent was the smallest on the satellite record and also one of the earliest. Read more: <a href="http://1.usa.gov/1Eyvelz" rel="nofollow">1.usa.gov/1Eyvelz</a> Credit: NASA's Goddard Space Flight Center <b><a href="http://www.nasa.gov/audience/formedia/features/MP_Photo_Guidelines.html" rel="nofollow">NASA image use policy.</a></b> <b><a href="http://www.nasa.gov/centers/goddard/home/index.html" rel="nofollow">NASA Goddard Space Flight Center</a></b> enables NASA’s mission through four scientific endeavors: Earth Science, Heliophysics, Solar System Exploration, and Astrophysics. Goddard plays a leading role in NASA’s accomplishments by contributing compelling scientific knowledge to advance the Agency’s mission. <b>Follow us on <a href="http://twitter.com/NASAGoddardPix" rel="nofollow">Twitter</a></b> <b>Like us on <a href="http://www.facebook.com/pages/Greenbelt-MD/NASA-Goddard/395013845897?ref=tsd" rel="nofollow">Facebook</a></b> <b>Find us on <a href="http://instagrid.me/nasagoddard/?vm=grid" rel="nofollow">Instagram</a></b>

The sea ice cap of the Arctic appeared to reach its annual maximum winter extent on February 25, according to data from the NASA-supported National Snow and Ice Data Center (NSIDC) at the University of Colorado, Boulder. At 5.61 million square miles (14.54 million square kilometers), this year’s maximum extent was the smallest on the satellite record and also one of the earliest. Credit: NASA Goddard Space Flight Center <b><a href="http://www.nasa.gov/audience/formedia/features/MP_Photo_Guidelines.html" rel="nofollow">NASA image use policy.</a></b> <b><a href="http://www.nasa.gov/centers/goddard/home/index.html" rel="nofollow">NASA Goddard Space Flight Center</a></b> enables NASA’s mission through four scientific endeavors: Earth Science, Heliophysics, Solar System Exploration, and Astrophysics. Goddard plays a leading role in NASA’s accomplishments by contributing compelling scientific knowledge to advance the Agency’s mission. <b>Follow us on <a href="http://twitter.com/NASAGoddardPix" rel="nofollow">Twitter</a></b> <b>Like us on <a href="http://www.facebook.com/pages/Greenbelt-MD/NASA-Goddard/395013845897?ref=tsd" rel="nofollow">Facebook</a></b> <b>Find us on <a href="http://instagrid.me/nasagoddard/?vm=grid" rel="nofollow">Instagram</a></b>

S83-42895 (19 Oct 1983) --- Astronauts George D. Nelson and James D. van Hoften, NASA Flight STS-41C mission specialists, offer an underwater version of a preview of their mission's extravehicular activity (EVA). The April 1984 flight includes as one of its primary objectives a two-person EVA and a visit to the damaged Solar Maximum Satellite (SMS). Van Hoften, left, and Nelson work here with the mobile foot restraint (MFR), which attaches to the remote manipulator system (RMS) arm to form a "cherry-picker" device. Van Hoften is standing on the MFR. The two are making use of the Johnson Space Center's (JSC) weightless environment training facility (WET-F). This photograph was taken by Otis Imboden.

This is a cutaway illustration of the Neutral Buoyancy Simulator (NBS) at the Marshall Space Flight Center (MSFC ). The MSFC NBS provided an excellent environment for testing hardware to examine how it would operate in space and for evaluating techniques for space construction and spacecraft servicing. Here, engineers, designers, and astronauts performed various tests to develop basic concepts, preliminary designs, final designs, and crew procedures. The NBS was constructed of welded steel with polyester-resin coating. The water tank was 75-feet (22.9- meters) in diameter, 40-feet (12.2-meters) deep, and held 1.32 million gallons of water. Since it opened for operation in 1968, the NBS had supported a number of successful space missions, such as the Skylab, Solar Maximum Mission Satellite, Marned Maneuvering Unit, Experimental Assembly of Structures in Extravehicular Activity/Assembly Concept for Construction of Erectable Space Structures (EASE/ACCESS), the Hubble Space Telescope, and the Space Station. The function of the MSFC NBS was moved to the larger simulator at the Johnson Space Center and is no longer operational.

With maximum sustained wind speeds of 140 mph, Super Typhoon Utor made landfall in the Philippines on August 11, 2013 around 18:00z. The storm crossed over the island of Luzon and into the South China Sea. The Joint Typhoon Warning Center predicts Utor will head for the Chinese mainland and make landfall again around 12:00z on the 14th about 200 miles southwest of Hong Kong. This colorized infrared image from the Suomi NPP satellite shows the storm on August 11th at 4:30z. NASA/NOAA <b><a href="http://www.nasa.gov/audience/formedia/features/MP_Photo_Guidelines.html" rel="nofollow">NASA image use policy.</a></b> <b><a href="http://www.nasa.gov/centers/goddard/home/index.html" rel="nofollow">NASA Goddard Space Flight Center</a></b> enables NASA’s mission through four scientific endeavors: Earth Science, Heliophysics, Solar System Exploration, and Astrophysics. Goddard plays a leading role in NASA’s accomplishments by contributing compelling scientific knowledge to advance the Agency’s mission. <b>Follow us on <a href="http://twitter.com/NASA_GoddardPix" rel="nofollow">Twitter</a></b> <b>Like us on <a href="http://www.facebook.com/pages/Greenbelt-MD/NASA-Goddard/395013845897?ref=tsd" rel="nofollow">Facebook</a></b> <b>Find us on <a href="http://instagram.com/nasagoddard?vm=grid" rel="nofollow">Instagram</a></b>
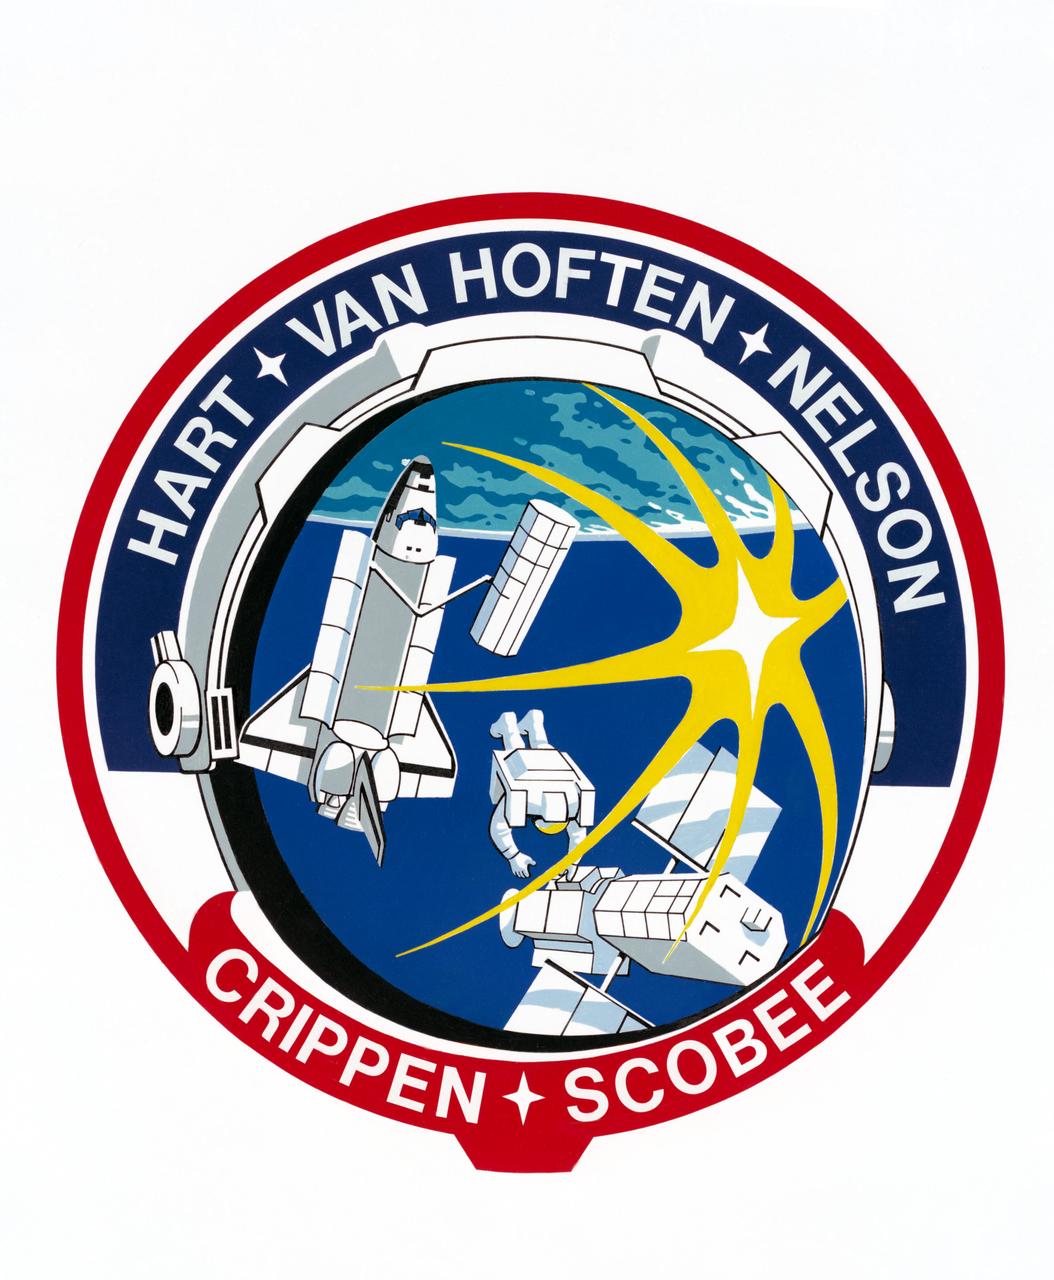
S84-25522 (15 Jan. 1984) --- The patch to be worn by the five members of NASA's STS-41C space mission tells the story of that flight. It features a helmet visor of an astronaut performing an extravehicular activity (EVA). In the visor are reflected the sun's rays, the space shuttle Challenger and its Remote Manipulator System (RMS) deploying the Long Duration Exposure Facility (LDEF), Earth and blue sky, and another astronaut working at the damaged Solar Maximum Satellite (SMS). The scene is encircled by the surnames of the crew members. They are astronauts Robert L. Crippen, commander; Francis R. (Dick) Scobee, pilot; and Terry J. Hart, James D. van Hoften and George D. Nelson, all mission specialists. The NASA insignia design for space shuttle flights is reserved for use by the astronauts and for other official use as the NASA Administrator may authorize. Public availability has been approved only in the forms of illustrations by the various news media. When and if there is any change in this policy, which is not anticipated, the change will be publicly announced. Photo credit: NASA
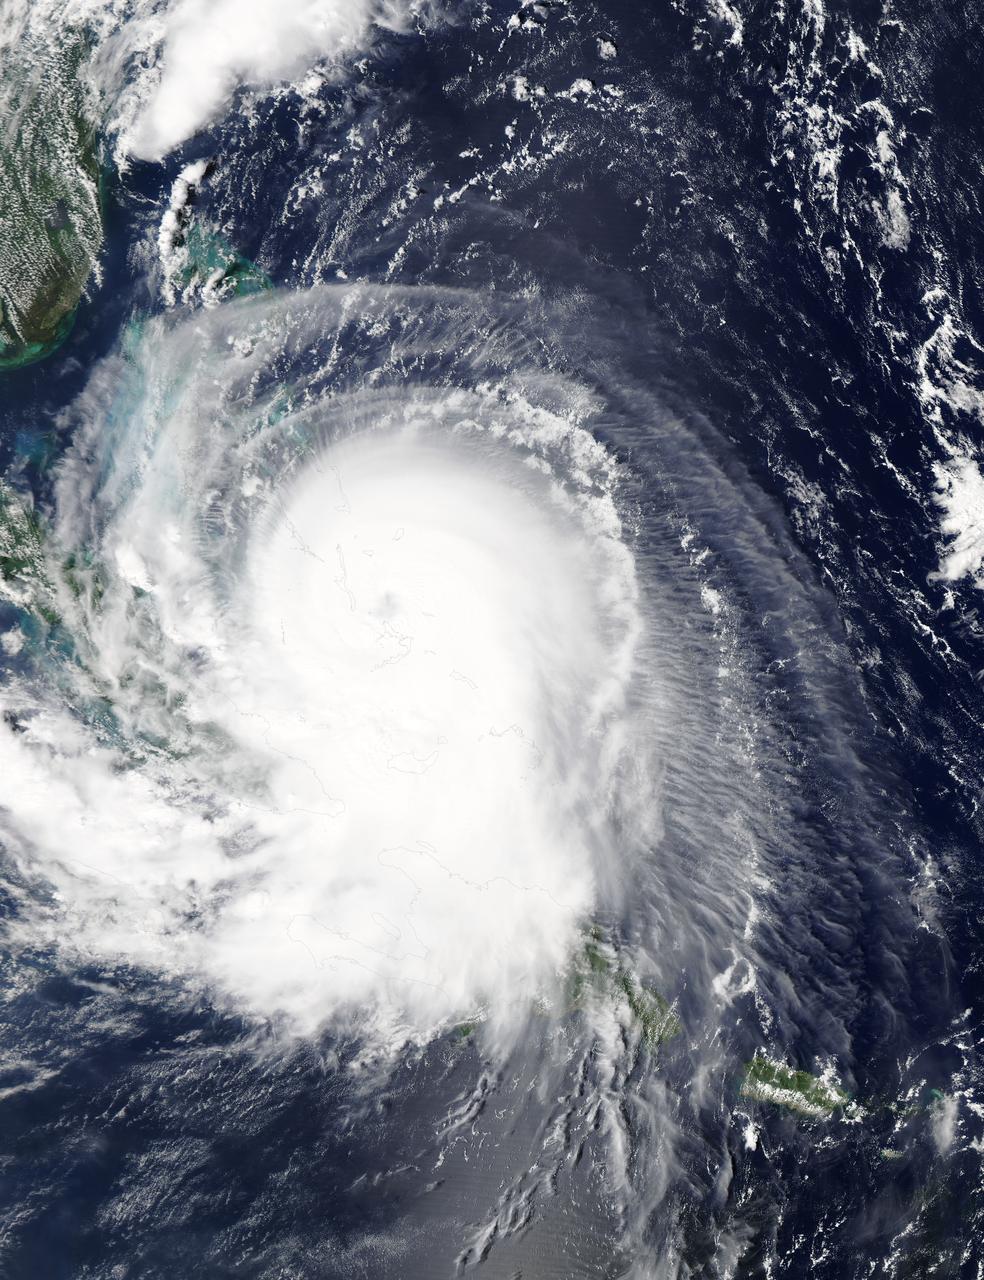
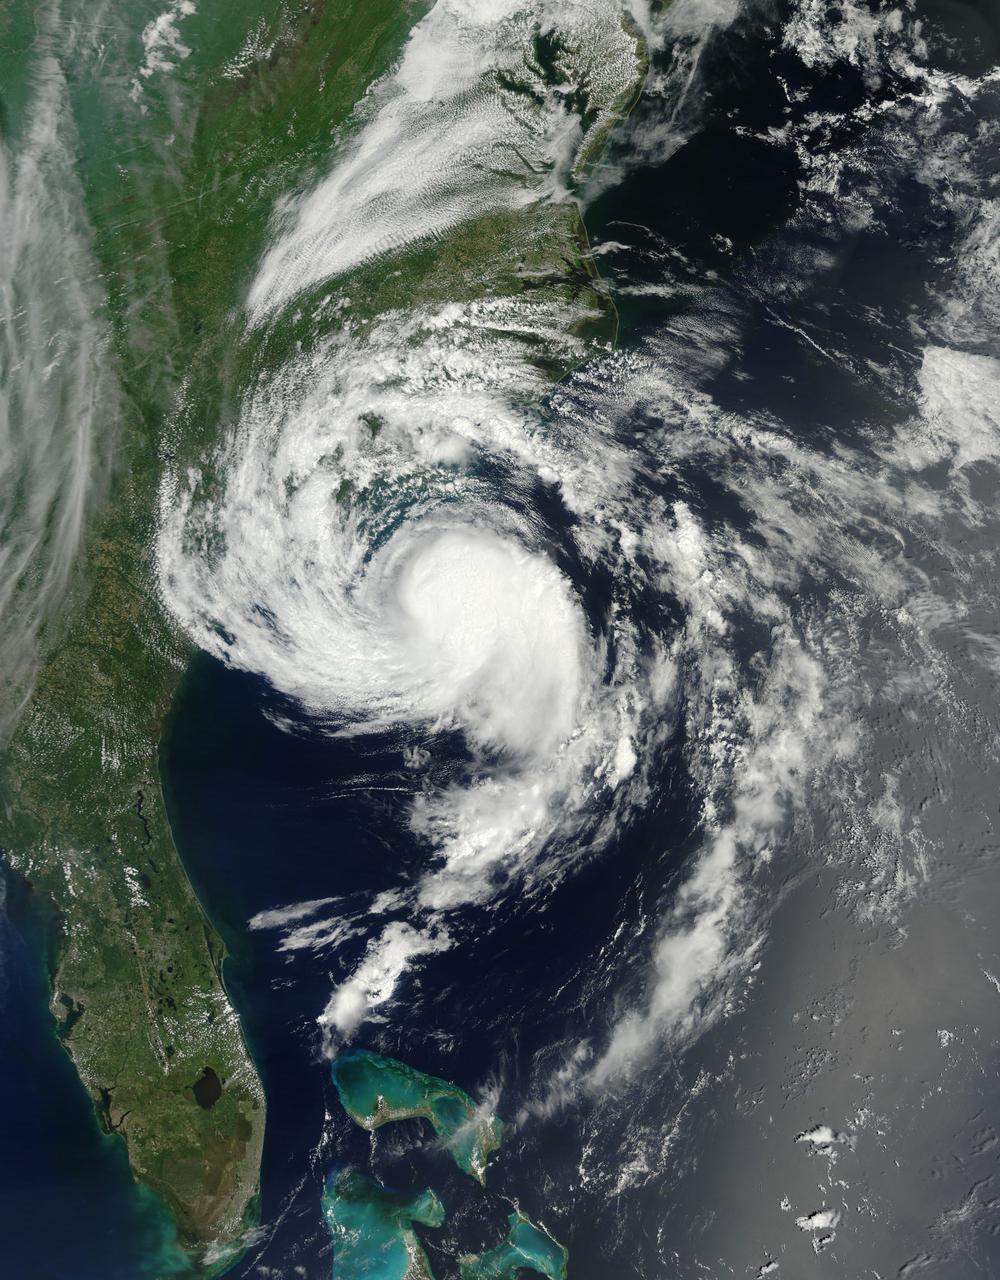
NASA's Aqua satellite captured this image of Hurricane Joaquin over the Bahamas on Oct. 1 at 17:55 UTC (1:55 p.m. EDT). Recently upgraded to Category 4, Hurricane Joaquin has maximum sustained winds of 130 mph which may grow stronger. Credit: NASA Goddard MODIS Rapid Response Team <b><a href="http://www.nasa.gov/audience/formedia/features/MP_Photo_Guidelines.html" rel="nofollow">NASA image use policy.</a></b> <b><a href="http://www.nasa.gov/centers/goddard/home/index.html" rel="nofollow">NASA Goddard Space Flight Center</a></b> enables NASA’s mission through four scientific endeavors: Earth Science, Heliophysics, Solar System Exploration, and Astrophysics. Goddard plays a leading role in NASA’s accomplishments by contributing compelling scientific knowledge to advance the Agency’s mission. <b>Follow us on <a href="http://twitter.com/NASAGoddardPix" rel="nofollow">Twitter</a></b> <b>Like us on <a href="http://www.facebook.com/pages/Greenbelt-MD/NASA-Goddard/395013845897?ref=tsd" rel="nofollow">Facebook</a></b> <b>Find us on <a href="http://instagrid.me/nasagoddard/?vm=grid" rel="nofollow">Instagram</a></b>
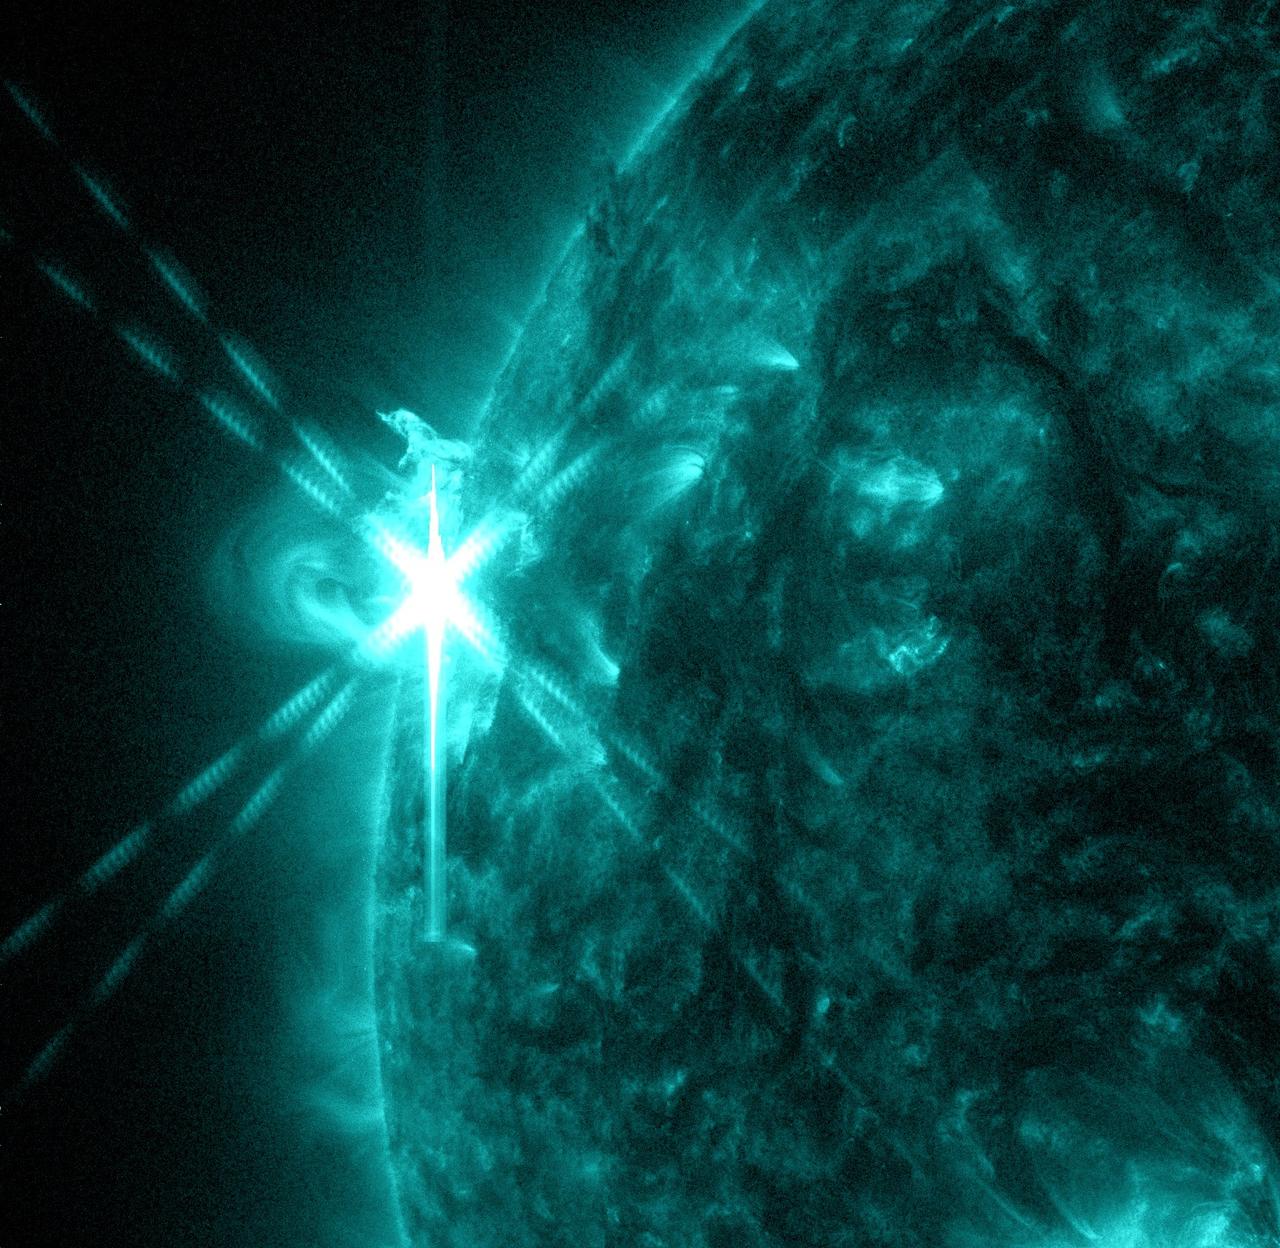
Caption: NASA’s Solar Dynamics Observatory (SDO) captured this image of an M5.7 class flare on May 3, 2013 at 1:30 p.m. EDT. This image shows light in the 131 Angstrom wavelength, a wavelength of light that can show material at the very hot temperatures of a solar flare and that is typically colorized in teal. Caption: NASA’s Solar Dynamics Observatory (SDO) captured this image of an M5.7 class flare on May 3, 2013 at 1:30 p.m. EDT. This image shows light in the 131 Angstrom wavelength, a wavelength of light that can show material at the very hot temperatures of a solar flare and that is typically colorized in teal. Credit: NASA/Goddard/SDO --- The sun emitted a mid-level solar flare, peaking at 1:32 pm EDT on May 3, 2013. Solar flares are powerful bursts of radiation. Harmful radiation from a flare cannot pass through Earth's atmosphere to physically affect humans on the ground, however -- when intense enough -- they can disturb the atmosphere in the layer where GPS and communications signals travel. This disrupts the radio signals for as long as the flare is ongoing, and the radio blackout for this flare has already subsided. This flare is classified as an M5.7 class flare. M-class flares are the weakest flares that can still cause some space weather effects near Earth. Increased numbers of flares are quite common at the moment, since the sun's normal 11-year activity cycle is ramping up toward solar maximum, which is expected in late 2013. Updates will be provided as they are available on the flare and whether there was an associated coronal mass ejection (CME), another solar phenomenon that can send solar particles into space and affect electronic systems in satellites and on Earth. <b><a href="http://www.nasa.gov/audience/formedia/features/MP_Photo_Guidelines.html" rel="nofollow">NASA image use policy.</a></b> <b><a href="http://www.nasa.gov/centers/goddard/home/index.html" rel="nofollow">NASA Goddard Space Flight Center</a></b> enables NASA’s mission through four scientific endeavors: Earth Science, Heliophysics, Solar System Exploration, and Astrophysics. Goddard plays a leading role in NASA’s accomplishments by contributing compelling scientific knowledge to advance the Agency’s mission. <b>Follow us on <a href="http://twitter.com/NASA_GoddardPix" rel="nofollow">Twitter</a></b> <b>Like us on <a href="http://www.facebook.com/pages/Greenbelt-MD/NASA-Goddard/395013845897?ref=tsd" rel="nofollow">Facebook</a></b> <b>Find us on <a href="http://instagram.com/nasagoddard?vm=grid" rel="nofollow">Instagram</a></b>
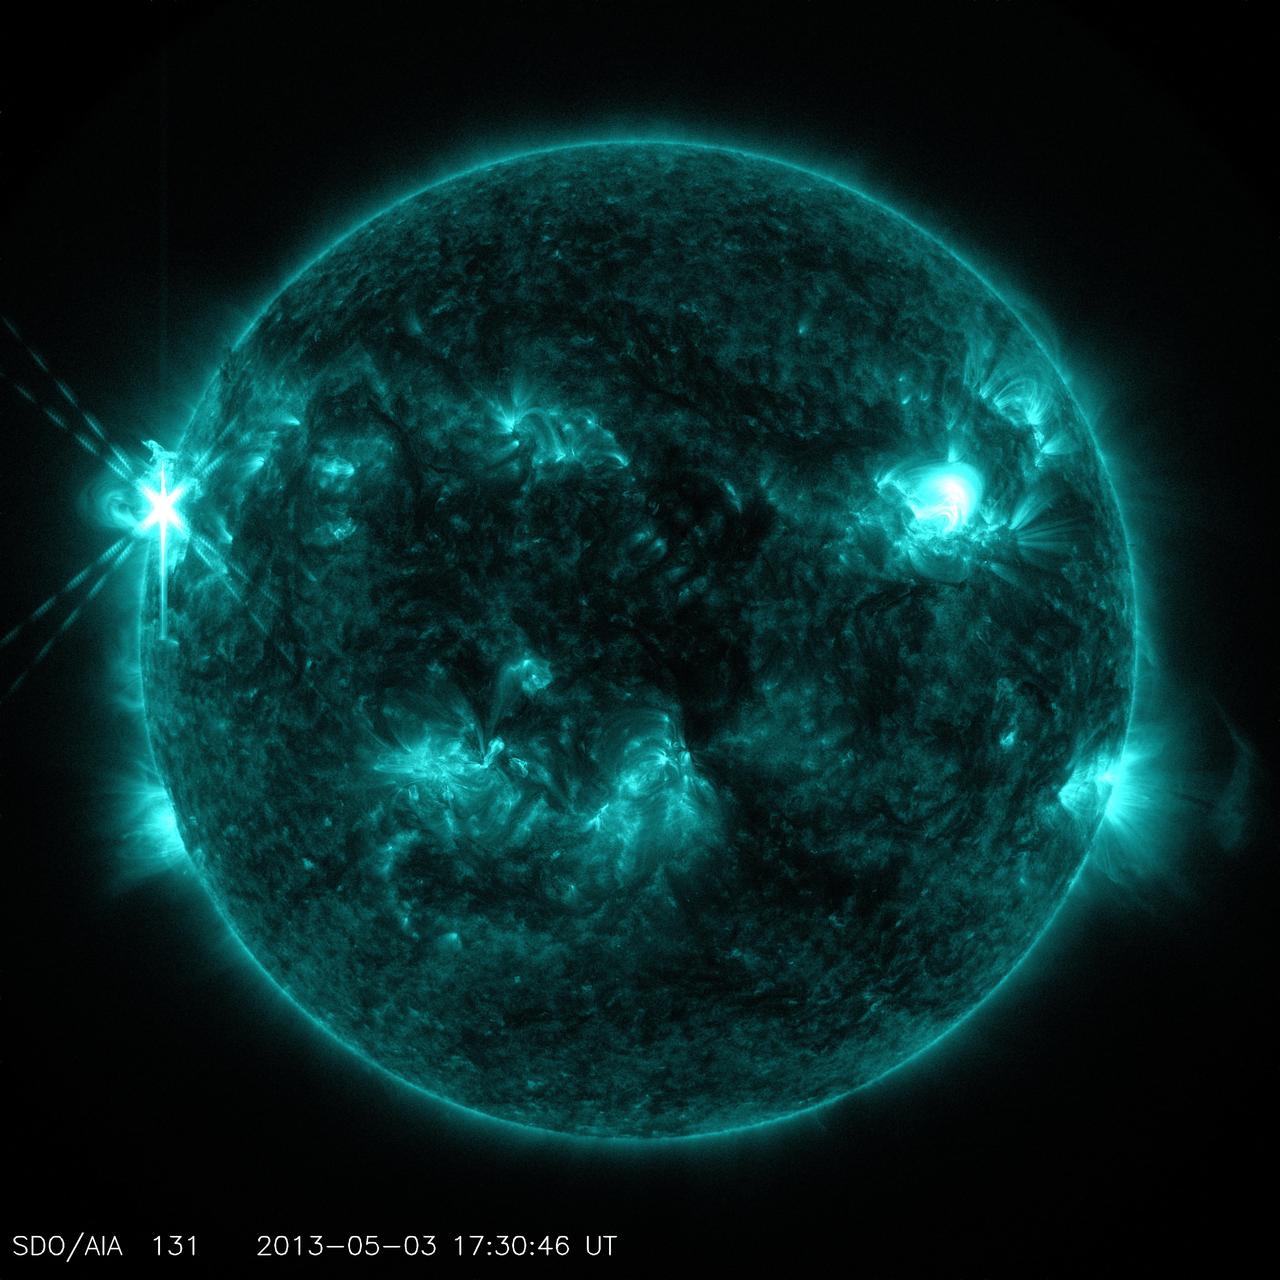
Caption: NASA’s Solar Dynamics Observatory (SDO) captured this image of an M5.7 class flare on May 3, 2013 at 1:30 p.m. EDT. This image shows light in the 131 Angstrom wavelength, a wavelength of light that can show material at the very hot temperatures of a solar flare and that is typically colorized in teal. Caption: NASA’s Solar Dynamics Observatory (SDO) captured this image of an M5.7 class flare on May 3, 2013 at 1:30 p.m. EDT. This image shows light in the 131 Angstrom wavelength, a wavelength of light that can show material at the very hot temperatures of a solar flare and that is typically colorized in teal. Credit: NASA/Goddard/SDO --- The sun emitted a mid-level solar flare, peaking at 1:32 pm EDT on May 3, 2013. Solar flares are powerful bursts of radiation. Harmful radiation from a flare cannot pass through Earth's atmosphere to physically affect humans on the ground, however -- when intense enough -- they can disturb the atmosphere in the layer where GPS and communications signals travel. This disrupts the radio signals for as long as the flare is ongoing, and the radio blackout for this flare has already subsided. This flare is classified as an M5.7 class flare. M-class flares are the weakest flares that can still cause some space weather effects near Earth. Increased numbers of flares are quite common at the moment, since the sun's normal 11-year activity cycle is ramping up toward solar maximum, which is expected in late 2013. Updates will be provided as they are available on the flare and whether there was an associated coronal mass ejection (CME), another solar phenomenon that can send solar particles into space and affect electronic systems in satellites and on Earth. <b><a href="http://www.nasa.gov/audience/formedia/features/MP_Photo_Guidelines.html" rel="nofollow">NASA image use policy.</a></b> <b><a href="http://www.nasa.gov/centers/goddard/home/index.html" rel="nofollow">NASA Goddard Space Flight Center</a></b> enables NASA’s mission through four scientific endeavors: Earth Science, Heliophysics, Solar System Exploration, and Astrophysics. Goddard plays a leading role in NASA’s accomplishments by contributing compelling scientific knowledge to advance the Agency’s mission. <b>Follow us on <a href="http://twitter.com/NASA_GoddardPix" rel="nofollow">Twitter</a></b> <b>Like us on <a href="http://www.facebook.com/pages/Greenbelt-MD/NASA-Goddard/395013845897?ref=tsd" rel="nofollow">Facebook</a></b> <b>Find us on <a href="http://instagram.com/nasagoddard?vm=grid" rel="nofollow">Instagram</a></b>

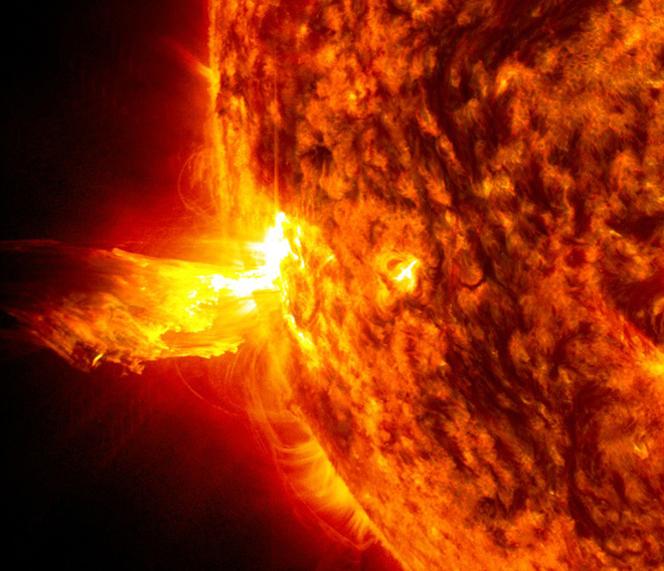
Caption: A burst of solar material leaps off the left side of the sun in what’s known as a prominence eruption. This image combines three images from NASA’s Solar Dynamics Observatory captured on May 3, 2013, at 1:45 pm EDT, just as an M-class solar flare from the same region was subsiding. The images include light from the 131, 171 and 304 Angstrom wavelengths. Credit: NASA/Goddard/SDO --- The sun emitted a mid-level solar flare, peaking at 1:32 pm EDT on May 3, 2013. Solar flares are powerful bursts of radiation. Harmful radiation from a flare cannot pass through Earth's atmosphere to physically affect humans on the ground, however -- when intense enough -- they can disturb the atmosphere in the layer where GPS and communications signals travel. This disrupts the radio signals for as long as the flare is ongoing, and the radio blackout for this flare has already subsided. This flare is classified as an M5.7 class flare. M-class flares are the weakest flares that can still cause some space weather effects near Earth. Increased numbers of flares are quite common at the moment, since the sun's normal 11-year activity cycle is ramping up toward solar maximum, which is expected in late 2013. Updates will be provided as they are available on the flare and whether there was an associated coronal mass ejection (CME), another solar phenomenon that can send solar particles into space and affect electronic systems in satellites and on Earth. <b><a href="http://www.nasa.gov/audience/formedia/features/MP_Photo_Guidelines.html" rel="nofollow">NASA image use policy.</a></b> <b><a href="http://www.nasa.gov/centers/goddard/home/index.html" rel="nofollow">NASA Goddard Space Flight Center</a></b> enables NASA’s mission through four scientific endeavors: Earth Science, Heliophysics, Solar System Exploration, and Astrophysics. Goddard plays a leading role in NASA’s accomplishments by contributing compelling scientific knowledge to advance the Agency’s mission. <b>Follow us on <a href="http://twitter.com/NASA_GoddardPix" rel="nofollow">Twitter</a></b> <b>Like us on <a href="http://www.facebook.com/pages/Greenbelt-MD/NASA-Goddard/395013845897?ref=tsd" rel="nofollow">Facebook</a></b> <b>Find us on <a href="http://instagram.com/nasagoddard?vm=grid" rel="nofollow">Instagram</a></b>
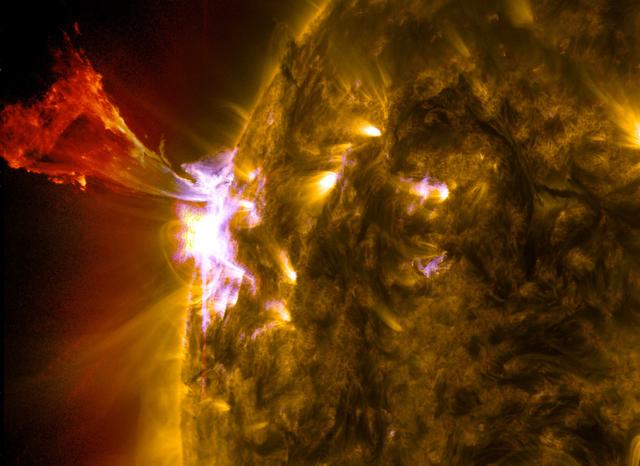
Caption: A burst of solar material leaps off the left side of the sun in what’s known as a prominence eruption. This image combines three images from NASA’s Solar Dynamics Observatory captured on May 3, 2013, at 1:45 pm EDT, just as an M-class solar flare from the same region was subsiding. The images include light from the 131, 171 and 304 Angstrom wavelengths. Credit: NASA/Goddard/SDO --- The sun emitted a mid-level solar flare, peaking at 1:32 pm EDT on May 3, 2013. Solar flares are powerful bursts of radiation. Harmful radiation from a flare cannot pass through Earth's atmosphere to physically affect humans on the ground, however -- when intense enough -- they can disturb the atmosphere in the layer where GPS and communications signals travel. This disrupts the radio signals for as long as the flare is ongoing, and the radio blackout for this flare has already subsided. This flare is classified as an M5.7 class flare. M-class flares are the weakest flares that can still cause some space weather effects near Earth. Increased numbers of flares are quite common at the moment, since the sun's normal 11-year activity cycle is ramping up toward solar maximum, which is expected in late 2013. Updates will be provided as they are available on the flare and whether there was an associated coronal mass ejection (CME), another solar phenomenon that can send solar particles into space and affect electronic systems in satellites and on Earth. <b><a href="http://www.nasa.gov/audience/formedia/features/MP_Photo_Guidelines.html" rel="nofollow">NASA image use policy.</a></b> <b><a href="http://www.nasa.gov/centers/goddard/home/index.html" rel="nofollow">NASA Goddard Space Flight Center</a></b> enables NASA’s mission through four scientific endeavors: Earth Science, Heliophysics, Solar System Exploration, and Astrophysics. Goddard plays a leading role in NASA’s accomplishments by contributing compelling scientific knowledge to advance the Agency’s mission. <b>Follow us on <a href="http://twitter.com/NASA_GoddardPix" rel="nofollow">Twitter</a></b> <b>Like us on <a href="http://www.facebook.com/pages/Greenbelt-MD/NASA-Goddard/395013845897?ref=tsd" rel="nofollow">Facebook</a></b> <b>Find us on <a href="http://instagram.com/nasagoddard?vm=grid" rel="nofollow">Instagram</a></b>
Caption: This image from June 20, 2013, at 11:15 p.m. EDT shows the bright light of a solar flare on the left side of the sun and an eruption of solar material shooting through the sun’s atmosphere, called a prominence eruption. Shortly thereafter, this same region of the sun sent a coronal mass ejection out into space. --- On June 20, 2013, at 11:24 p.m., the sun erupted with an Earth-directed coronal mass ejection or CME, a solar phenomenon that can send billions of tons of particles into space that can reach Earth one to three days later. These particles cannot travel through the atmosphere to harm humans on Earth, but they can affect electronic systems in satellites and on the ground. Experimental NASA research models, based on observations from NASA’s Solar Terrestrial Relations Observatory and ESA/NASA’s Solar and Heliospheric Observatory show that the CME left the sun at speeds of around 1350 miles per second, which is a fast speed for CMEs. Earth-directed CMEs can cause a space weather phenomenon called a geomagnetic storm, which occurs when they funnel energy into Earth's magnetic envelope, the magnetosphere, for an extended period of time. The CME’s magnetic fields peel back the outermost layers of Earth's fields changing their very shape. Magnetic storms can degrade communication signals and cause unexpected electrical surges in power grids. They also can cause aurora. Storms are rare during solar minimum, but as the sun’s activity ramps up every 11 years toward solar maximum – currently expected in late 2013 -- large storms occur several times per year. In the past, geomagnetic storms caused by CMEs of this strength and direction have usually been mild. Credit: NASA/Goddard/SDO <b><a href="http://www.nasa.gov/audience/formedia/features/MP_Photo_Guidelines.html" rel="nofollow">NASA image use policy.</a></b> <b><a href="http://www.nasa.gov/centers/goddard/home/index.html" rel="nofollow">NASA Goddard Space Flight Center</a></b> enables NASA’s mission through four scientific endeavors: Earth Science, Heliophysics, Solar System Exploration, and Astrophysics. Goddard plays a leading role in NASA’s accomplishments by contributing compelling scientific knowledge to advance the Agency’s mission. <b>Follow us on <a href="http://twitter.com/NASA_GoddardPix" rel="nofollow">Twitter</a></b> <b>Like us on <a href="http://www.facebook.com/pages/Greenbelt-MD/NASA-Goddard/395013845897?ref=tsd" rel="nofollow">Facebook</a></b> <b>Find us on <a href="http://instagram.com/nasagoddard?vm=grid" rel="nofollow">Instagram</a></b>

Caption: This image from June 20, 2013, at 11:15 p.m. EDT shows the bright light of a solar flare on the left side of the sun and an eruption of solar material shooting through the sun’s atmosphere, called a prominence eruption. Shortly thereafter, this same region of the sun sent a coronal mass ejection out into space. --- On June 20, 2013, at 11:24 p.m., the sun erupted with an Earth-directed coronal mass ejection or CME, a solar phenomenon that can send billions of tons of particles into space that can reach Earth one to three days later. These particles cannot travel through the atmosphere to harm humans on Earth, but they can affect electronic systems in satellites and on the ground. Experimental NASA research models, based on observations from NASA’s Solar Terrestrial Relations Observatory and ESA/NASA’s Solar and Heliospheric Observatory show that the CME left the sun at speeds of around 1350 miles per second, which is a fast speed for CMEs. Earth-directed CMEs can cause a space weather phenomenon called a geomagnetic storm, which occurs when they funnel energy into Earth's magnetic envelope, the magnetosphere, for an extended period of time. The CME’s magnetic fields peel back the outermost layers of Earth's fields changing their very shape. Magnetic storms can degrade communication signals and cause unexpected electrical surges in power grids. They also can cause aurora. Storms are rare during solar minimum, but as the sun’s activity ramps up every 11 years toward solar maximum – currently expected in late 2013 -- large storms occur several times per year. In the past, geomagnetic storms caused by CMEs of this strength and direction have usually been mild. Read more: <a href="http://1.usa.gov/14OxuEe" rel="nofollow">1.usa.gov/14OxuEe</a> Credit: NASA/Goddard/SDO <b><a href="http://www.nasa.gov/audience/formedia/features/MP_Photo_Guidelines.html" rel="nofollow">NASA image use policy.</a></b> <b><a href="http://www.nasa.gov/centers/goddard/home/index.html" rel="nofollow">NASA Goddard Space Flight Center</a></b> enables NASA’s mission through four scientific endeavors: Earth Science, Heliophysics, Solar System Exploration, and Astrophysics. Goddard plays a leading role in NASA’s accomplishments by contributing compelling scientific knowledge to advance the Agency’s mission. <b>Follow us on <a href="http://twitter.com/NASA_GoddardPix" rel="nofollow">Twitter</a></b> <b>Like us on <a href="http://www.facebook.com/pages/Greenbelt-MD/NASA-Goddard/395013845897?ref=tsd" rel="nofollow">Facebook</a></b> <b>Find us on <a href="http://instagram.com/nasagoddard?vm=grid" rel="nofollow">Instagram</a></b>
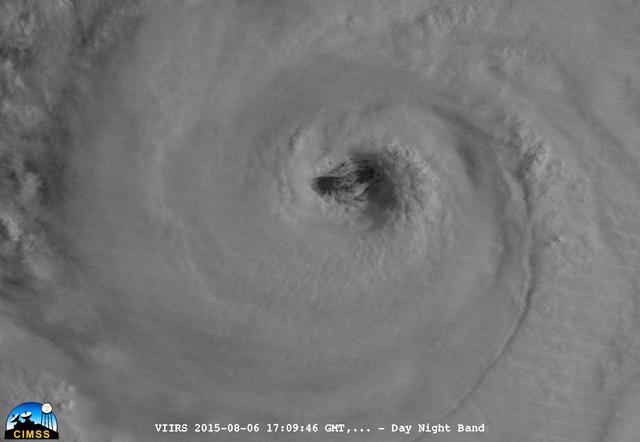
On August 6, 2015, NASA-NOAA's Suomi NPP satellite passed over powerful Typhoon Soudelor when it was headed toward Taiwan. The Visible Infrared Imaging Radiometer Suite (VIIRS) instrument aboard NASA-NOAA's Suomi satellite captured this night-time infrared close-up image of Soudelor's eye. At 1500 UTC (11 a.m. EDT) on August 6, 2015, Typhoon Soudelor had maximum sustained winds near 90 knots (103.6 mph/166.7 kph). It was centered near 21.3 North latitude and 127.5 East longitude, about 324 nautical miles (372.9 miles/600 km) south of Kadena Air Base, Okinawa, Japan. It was moving to the west at 10 knots (11.5 mph/18.5 kph). Credit: UWM/CIMSS/SSEC, William Straka III <b><a href="http://www.nasa.gov/audience/formedia/features/MP_Photo_Guidelines.html" rel="nofollow">NASA image use policy.</a></b> <b><a href="http://www.nasa.gov/centers/goddard/home/index.html" rel="nofollow">NASA Goddard Space Flight Center</a></b> enables NASA’s mission through four scientific endeavors: Earth Science, Heliophysics, Solar System Exploration, and Astrophysics. Goddard plays a leading role in NASA’s accomplishments by contributing compelling scientific knowledge to advance the Agency’s mission. <b>Follow us on <a href="http://twitter.com/NASAGoddardPix" rel="nofollow">Twitter</a></b> <b>Like us on <a href="http://www.facebook.com/pages/Greenbelt-MD/NASA-Goddard/395013845897?ref=tsd" rel="nofollow">Facebook</a></b> <b>Find us on <a href="http://instagrid.me/nasagoddard/?vm=grid" rel="nofollow">Instagram</a></b>
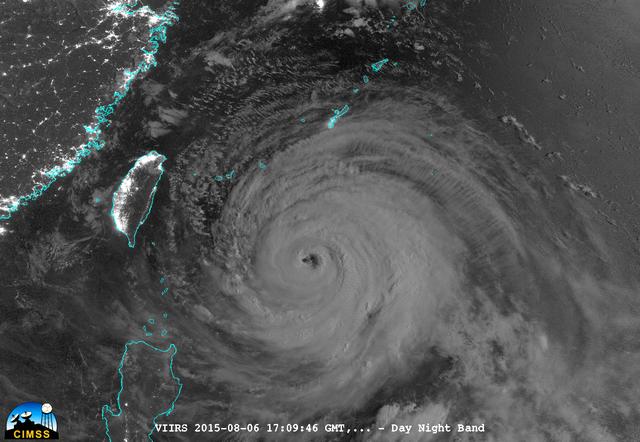
On August 6, 2015, NASA-NOAA's Suomi NPP satellite passed over powerful Typhoon Soudelor at night when it was headed toward Taiwan. The Visible Infrared Imaging Radiometer Suite (VIIRS) instrument aboard NASA-NOAA's Suomi satellite captured this night-time infrared image of the storm. At 1500 UTC (11 a.m. EDT) on August 6, 2015, Typhoon Soudelor had maximum sustained winds near 90 knots (103.6 mph/166.7 kph). It was centered near 21.3 North latitude and 127.5 East longitude, about 324 nautical miles (372.9 miles/600 km) south of Kadena Air Base, Okinawa, Japan. It was moving to the west at 10 knots (11.5 mph/18.5 kph). Taiwan is located west (left) of the powerful typhoon in this image. Credit: UWM/CIMSS/SSEC, William Straka III <b><a href="http://www.nasa.gov/audience/formedia/features/MP_Photo_Guidelines.html" rel="nofollow">NASA image use policy.</a></b> <b><a href="http://www.nasa.gov/centers/goddard/home/index.html" rel="nofollow">NASA Goddard Space Flight Center</a></b> enables NASA’s mission through four scientific endeavors: Earth Science, Heliophysics, Solar System Exploration, and Astrophysics. Goddard plays a leading role in NASA’s accomplishments by contributing compelling scientific knowledge to advance the Agency’s mission. <b>Follow us on <a href="http://twitter.com/NASAGoddardPix" rel="nofollow">Twitter</a></b> <b>Like us on <a href="http://www.facebook.com/pages/Greenbelt-MD/NASA-Goddard/395013845897?ref=tsd" rel="nofollow">Facebook</a></b> <b>Find us on <a href="http://instagrid.me/nasagoddard/?vm=grid" rel="nofollow">Instagram</a></b>
On August 6, 2015, NASA-NOAA's Suomi NPP satellite passed over powerful Typhoon Soudelor when it was headed toward Taiwan. The Visible Infrared Imaging Radiometer Suite (VIIRS) instrument aboard NASA-NOAA's Suomi satellite captured this night-time infrared close-up image of Soudelor's eye. The infrared image that showed there were some thunderstorms within the typhoon with very cold cloud top temperatures, colder than -63F/-53C. Temperatures that cold stretch high into the troposphere and are capable of generating heavy rain. At 1500 UTC (11 a.m. EDT) on August 6, 2015, Typhoon Soudelor had maximum sustained winds near 90 knots (103.6 mph/166.7 kph). It was centered near 21.3 North latitude and 127.5 East longitude, about 324 nautical miles (372.9 miles/600 km) south of Kadena Air Base, Okinawa, Japan. It was moving to the west at 10 knots (11.5 mph/18.5 kph). Credit: UWM/CIMSS/SSEC, William Straka III <b><a href="http://www.nasa.gov/audience/formedia/features/MP_Photo_Guidelines.html" rel="nofollow">NASA image use policy.</a></b> <b><a href="http://www.nasa.gov/centers/goddard/home/index.html" rel="nofollow">NASA Goddard Space Flight Center</a></b> enables NASA’s mission through four scientific endeavors: Earth Science, Heliophysics, Solar System Exploration, and Astrophysics. Goddard plays a leading role in NASA’s accomplishments by contributing compelling scientific knowledge to advance the Agency’s mission. <b>Follow us on <a href="http://twitter.com/NASAGoddardPix" rel="nofollow">Twitter</a></b> <b>Like us on <a href="http://www.facebook.com/pages/Greenbelt-MD/NASA-Goddard/395013845897?ref=tsd" rel="nofollow">Facebook</a></b> <b>Find us on <a href="http://instagrid.me/nasagoddard/?vm=grid" rel="nofollow">Instagram</a></b>
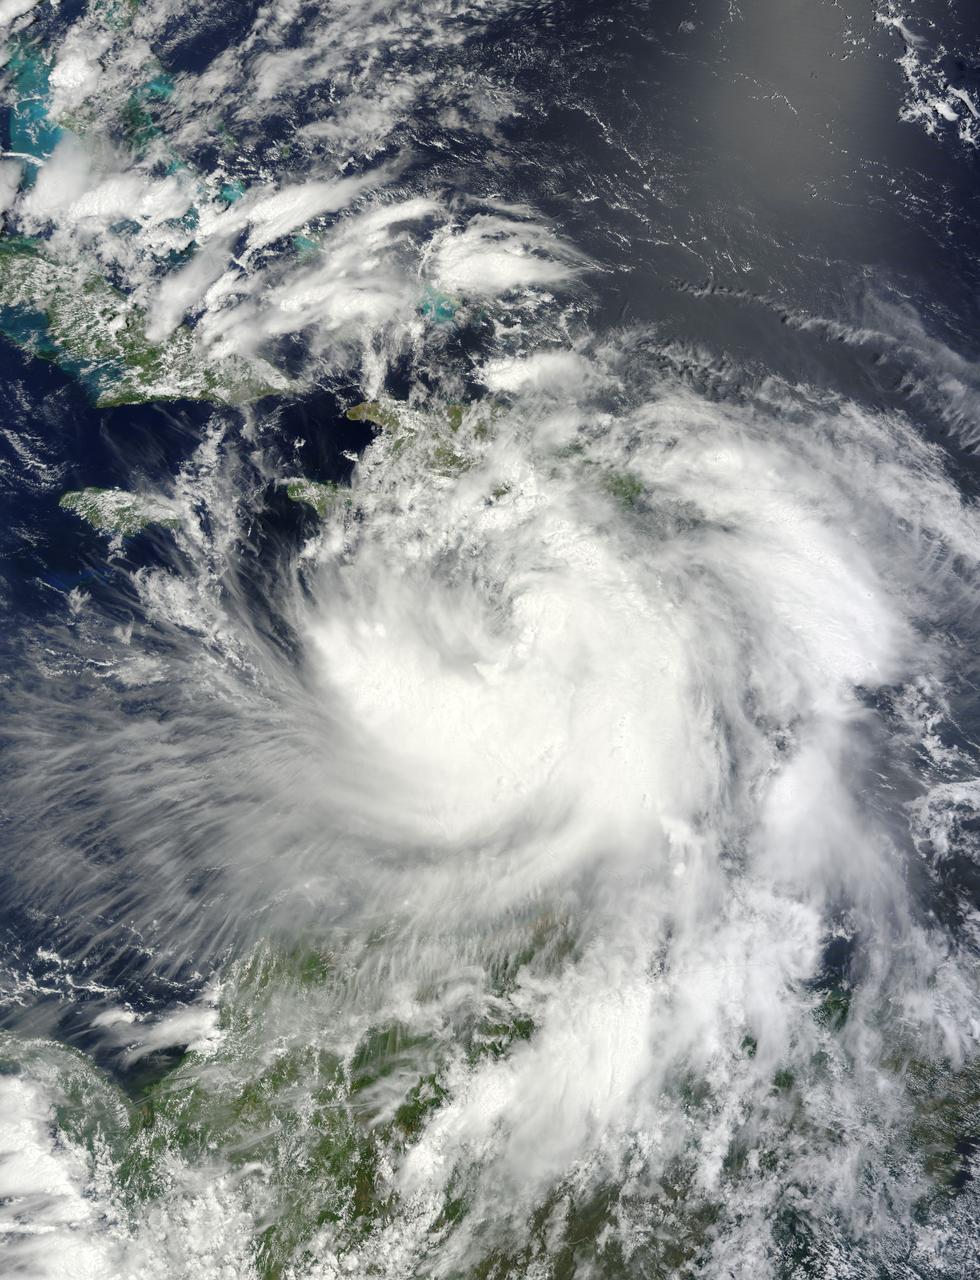
NASA's Terra satellite passed over Tropical Storm Isaac on Aug. 24 at 15:20 UTC (11:20 a.m. EDT) as it continued moving through the eastern Caribbean Sea. The MODIS instrument onboard Aqua captured this visible image. At 2 p.m. EDT on Aug. 24, Isaac's maximum sustained winds were near 60 mph (95 kmh). The National Hurricane Center noted that Isaac could strengthen later before reaching the coast of Hispaniola tonight, Aug. 24. Hispaniola is an island that contains the Dominican Republic and Haiti. Isaac is located about 135 miles (215 km) south-southeast of Port au Prince, Haiti, near latitude 16.8 north and longitude 71.4 west. Isaac is now moving toward the northwest near 14 mph (22 kmh). Isaac is expected to reach hurricane status over the weekend of Aug. 25-26 and NASA satellites will continue providing valuable temperature, rainfall, visible and infrared data. Text Credit: Rob Gutro NASA's Goddard Space Flight Center, Greenbelt, Md. <b>To read more go to: <a href="http://www.nasa.gov/mission_pages/hurricanes/archives/2012/h2012_Isaac.html" rel="nofollow">www.nasa.gov/mission_pages/hurricanes/archives/2012/h2012...</a></b> Credit: NASA Goddard MODIS Rapid Response Team <b><a href="http://www.nasa.gov/audience/formedia/features/MP_Photo_Guidelines.html" rel="nofollow">NASA image use policy.</a></b> <b><a href="http://www.nasa.gov/centers/goddard/home/index.html" rel="nofollow">NASA Goddard Space Flight Center</a></b> enables NASA’s mission through four scientific endeavors: Earth Science, Heliophysics, Solar System Exploration, and Astrophysics. Goddard plays a leading role in NASA’s accomplishments by contributing compelling scientific knowledge to advance the Agency’s mission. <b>Follow us on <a href="http://twitter.com/NASA_GoddardPix" rel="nofollow">Twitter</a></b> <b>Like us on <a href="http://www.facebook.com/pages/Greenbelt-MD/NASA-Goddard/395013845897?ref=tsd" rel="nofollow">Facebook</a></b> <b>Find us on <a href="http://instagrid.me/nasagoddard/?vm=grid" rel="nofollow">Instagram</a></b>
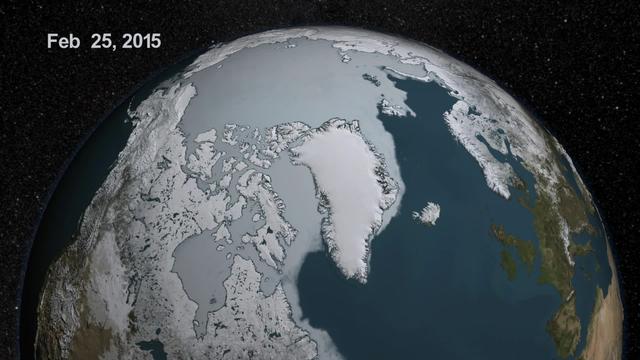
As the sun sets over the Arctic, the end of this year’s melt season is quickly approaching and the sea ice cover has already shrunk to the fourth lowest in the satellite record. With possibly some days of melting left, the sea ice extent could still drop to the second or third lowest on record. Arctic sea ice, which regulates the planet’s temperature by bouncing solar energy back to space, has been on a steep decline for the last two decades. This animation shows the evolution of Arctic sea ice in 2015, from its annual maximum wintertime extent, reached on February 25, to September 6. Credit: NASA Scientific Visualization Studio DOWNLOAD THIS VIDEO HERE: <a href="https://svs.gsfc.nasa.gov/cgi-bin/details.cgi?aid=11999" rel="nofollow">svs.gsfc.nasa.gov/cgi-bin/details.cgi?aid=11999</a> <b><a href="http://www.nasa.gov/audience/formedia/features/MP_Photo_Guidelines.html" rel="nofollow">NASA image use policy.</a></b> <b><a href="http://www.nasa.gov/centers/goddard/home/index.html" rel="nofollow">NASA Goddard Space Flight Center</a></b> enables NASA’s mission through four scientific endeavors: Earth Science, Heliophysics, Solar System Exploration, and Astrophysics. Goddard plays a leading role in NASA’s accomplishments by contributing compelling scientific knowledge to advance the Agency’s mission. <b>Follow us on <a href="http://twitter.com/NASAGoddardPix" rel="nofollow">Twitter</a></b> <b>Like us on <a href="http://www.facebook.com/pages/Greenbelt-MD/NASA-Goddard/395013845897?ref=tsd" rel="nofollow">Facebook</a></b> <b>Find us on <a href="http://instagrid.me/nasagoddard/?vm=grid" rel="nofollow">Instagram</a></b>
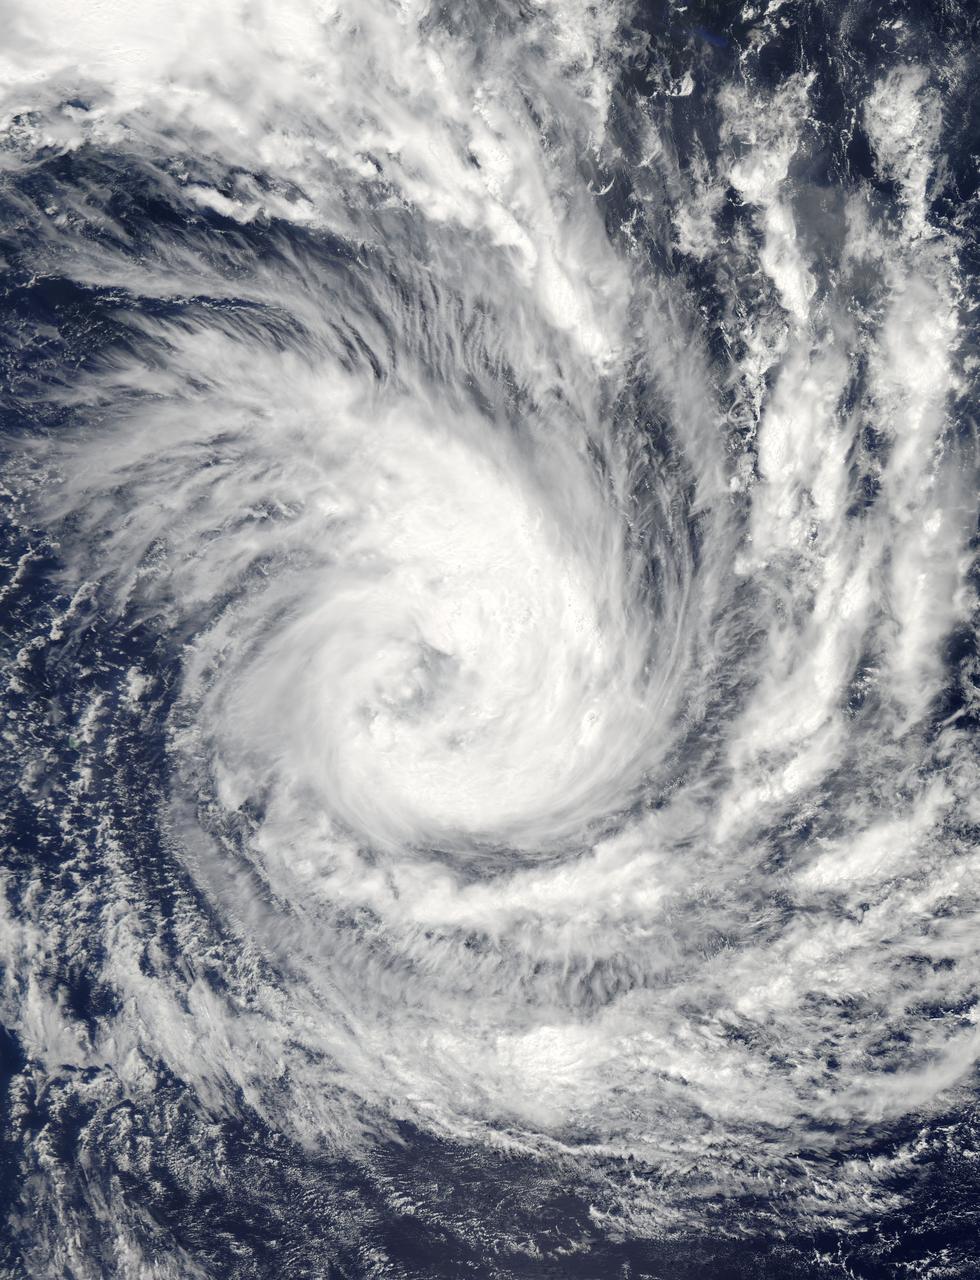
Tropical Cyclone Glenda took a five day tour of the Southern Indian Ocean in late February, 2015. The storm formed from a low pressure system, System 90S on February 24, when maximum sustained winds reached 40 mph (64 km/h). The Moderate Resolution Imaging Spectroradiometer (MODIS) aboard NASA’s Aqua satellite captured this true-color image of Tropical Storm Glenda on February 25 at 08:55 UTC (3:55 a.m. EST). At that time bands of thunderstorms wrapped into the low-level center of circulation. An eye was beginning to form. At 0900 UTC (4 a.m. EST) on February 25, Glenda's maximum sustained winds were near 63.2 mph (102 km/h). It was centered near 17.6 south latitude and 69.1 east longitude, about 760 miles (1,224 km) south-southwest of Diego Garcia. Glenda was moving to the west-southwest at 8 mph (13 km/h). At that time, the Joint Typhoon Warning Center expect Glenda to strengthen to near 109 mph (176 km/h) before beginning to weaken. However, strong wind shear began to affect the storm. By the afternoon of February 26 Tropical Cyclone Glenda’s winds had dropped to about 58 mph (93 km/h), and by February 28 the storm had transitioned to an extra-tropical storm. Credit: NASA/GSFC/Jeff Schmaltz/MODIS Land Rapid Response Team <b><a href="http://www.nasa.gov/audience/formedia/features/MP_Photo_Guidelines.html" rel="nofollow">NASA image use policy.</a></b> <b><a href="http://www.nasa.gov/centers/goddard/home/index.html" rel="nofollow">NASA Goddard Space Flight Center</a></b> enables NASA’s mission through four scientific endeavors: Earth Science, Heliophysics, Solar System Exploration, and Astrophysics. Goddard plays a leading role in NASA’s accomplishments by contributing compelling scientific knowledge to advance the Agency’s mission. <b>Follow us on <a href="http://twitter.com/NASAGoddardPix" rel="nofollow">Twitter</a></b> <b>Like us on <a href="http://www.facebook.com/pages/Greenbelt-MD/NASA-Goddard/395013845897?ref=tsd" rel="nofollow">Facebook</a></b> <b>Find us on <a href="http://instagram.com/nasagoddard?vm=grid" rel="nofollow">Instagram</a></b>
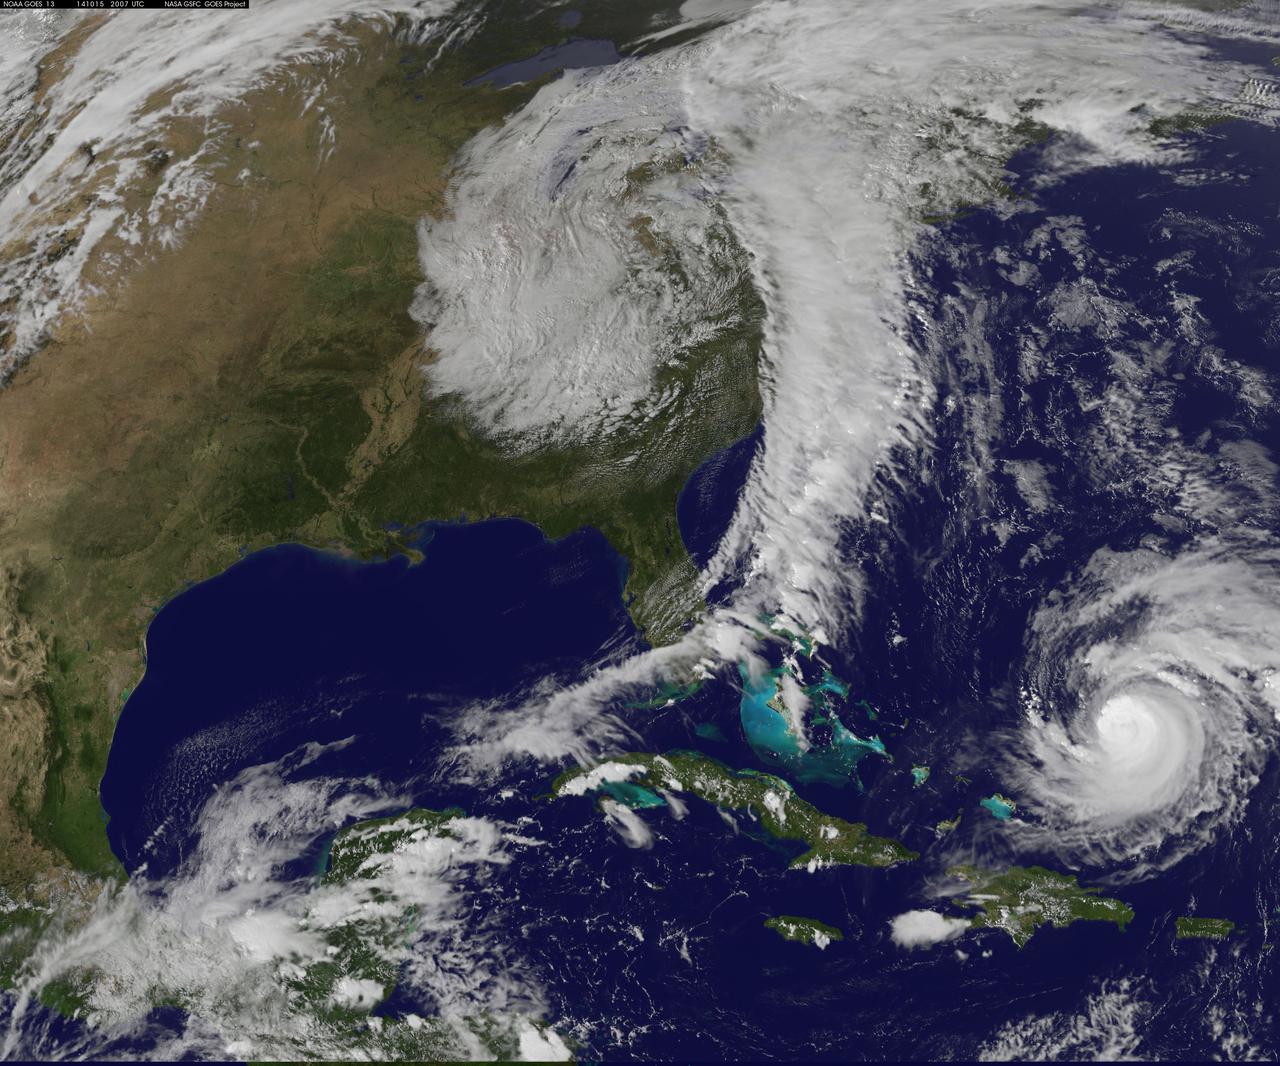
Hurricane Gonzalo has made the jump to major hurricane status and on Oct. 15 was a Category 4 storm on the Saffir-Simpson Hurricane Scale. NOAA's GOES-East satellite provided imagery of the storm. According to the National Hurricane Center, Gonzalo is the first category 4 hurricane in the Atlantic basin since Ophelia in 2011. NOAA's GOES-East satellite provides visible and infrared images of weather from its orbit in a fixed position over the Earth. On Oct. 15 at 15:15 UTC (11:15 a.m. EDT) GOES saw Gonzalo had tightly wrapped bands of thunderstorms spiraling into the center of its circulation. The eye of the storm was obscured by high clouds in the image. NOAA aircraft data and microwave images clearly show concentric eyewalls, with the inner radius of maximum winds now only about 4-5 nautical miles from the center. NOAA manages the GOES satellites, while NASA/NOAA's GOES Project at NASA's Goddard Space Flight Center in Greenbelt, Maryland created the image. The NASA/NOAA GOES Project creates images and animations from GOES data. At 11 a.m. EDT on Oct. 15, Gonzalo's maximum sustained winds increased to near 130 mph (215 kph) and the National Hurricane Center (NHC) noted that fluctuations in intensity are expected over the next couple of days. Gonzalo's cloud-covered eye was located near latitude 23.5 north and longitude 68.0 west, about 640 miles (1,025 km) south-southwest of Bermuda. Gonzalo is moving toward the northwest near 12 mph (19 kph). The minimum central pressure recently reported by an air force reconnaissance aircraft was 949 millibars. Tropical storm conditions are possible in Bermuda by late Thursday night, Oct. 16, and hurricane conditions are possible over Bermuda on Friday Oct. 16. Ocean swells however, will be felt over a much larger area, reached the U.S. east coast on Oct. 16. Large swells generated by Gonzalo are affecting portions of the Virgin Islands, the northern coasts of Puerto Rico and the Dominican Republic and portions of the Bahamas. Swells will reach much of the east coast of the United States and Bermuda on Thursday. By late Oct. 16, Gonzalo is expected to turn to the northeast and the center is expected to approach Bermuda sometime on Oct. 17. Credit: NASA/GSFC/Jeff Schmaltz/MODIS Land Rapid Response Team <b><a href="http://www.nasa.gov/audience/formedia/features/MP_Photo_Guidelines.html" rel="nofollow">NASA image use policy.</a></b> <b><a href="http://www.nasa.gov/centers/goddard/home/index.html" rel="nofollow">NASA Goddard Space Flight Center</a></b> enables NASA’s mission through four scientific endeavors: Earth Science, Heliophysics, Solar System Exploration, and Astrophysics. Goddard plays a leading role in NASA’s accomplishments by contributing compelling scientific knowledge to advance the Agency’s mission. <b>Follow us on <a href="http://twitter.com/NASAGoddardPix" rel="nofollow">Twitter</a></b> <b>Like us on <a href="http://www.facebook.com/pages/Greenbelt-MD/NASA-Goddard/395013845897?ref=tsd" rel="nofollow">Facebook</a></b> <b>Find us on <a href="http://instagram.com/nasagoddard?vm=grid" rel="nofollow">Instagram</a></b>
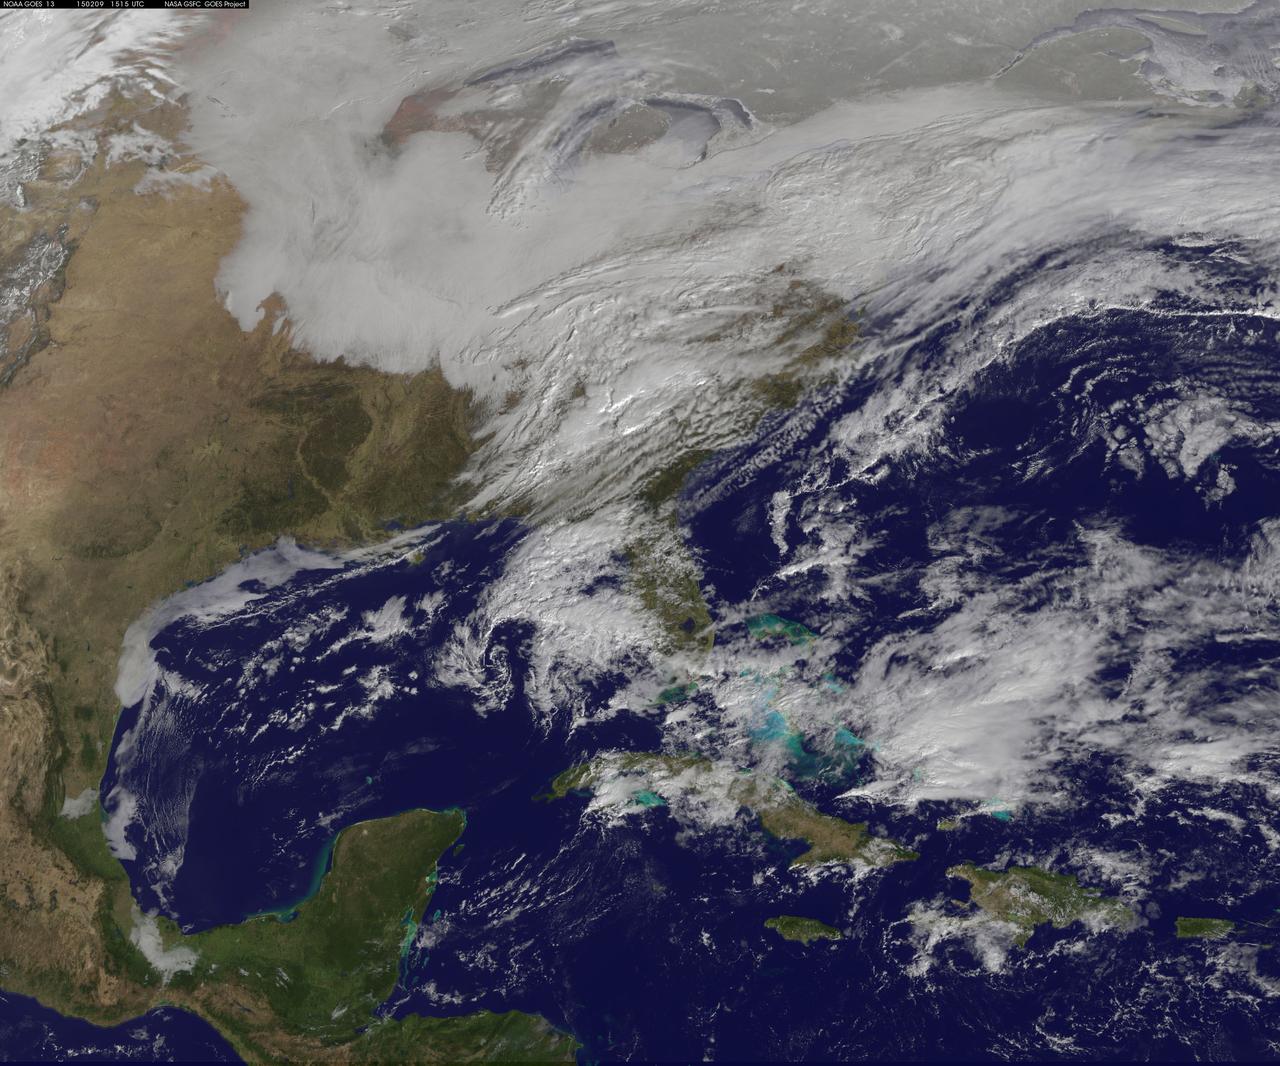
Another large snowstorm affecting New England was dropping more snow on the region and breaking records on February 9, as NOAA's GOES-East satellite captured an image of the clouds associated with the storm system. On Feb. 9, NOAA's National Weather Service in Boston, Massachusetts noted that "The 30-day snowfall total at Boston ending 7 a.m. this morning is 61.6 inches. This exceeds the previous maximum 30 day snowfall total on record at Boston, which was 58.8 inches ending Feb 7 1978." The GOES-East image was created by NASA/NOAA's GOES Project at NASA's Goddard Space Flight Center in Greenbelt, Maryland. It showed a blanket of clouds over the U.S. northeast that stretched down to the Mid-Atlantic where there was no snow on the ground in Washington, D.C. NOAA's National Weather Service Weather Prediction Center provided a look at the extent of the storm system and noted "Heavy snow will impact portions of New York State and New England as the new week begins. Freezing rain will spread from western Pennsylvania to Long Island, with rain for the mid-Atlantic states." The low pressure area bringing the snow to the northeast was located in central Pennsylvania. A cold front extended southward from the low across the Tennessee Valley while a stationary boundary extended eastward from the low across the central mid-Atlantic. To create the image, NASA/NOAA's GOES Project takes the cloud data from NOAA's GOES-East satellite and overlays it on a true-color image of land and ocean created by data from the Moderate Resolution Imaging Spectroradiometer, or MODIS, instrument that flies aboard NASA's Aqua and Terra satellites. Together, those data created the entire picture of the storm. NOAA's GOES satellites provide the kind of continuous monitoring necessary for intensive data analysis. Geostationary describes an orbit in which a satellite is always in the same position with respect to the rotating Earth. This allows GOES to hover continuously over one position on Earth's surface, appearing stationary. As a result, GOES provide a constant vigil for the atmospheric triggers for severe weather conditions such as tornadoes, flash floods, hail storms and hurricanes. For updated information about the storm system, visit NOAA's NWS website: <a href="http://www.weather.gov" rel="nofollow">www.weather.gov</a> For more information about GOES satellites, visit: <a href="http://www.goes.noaa.gov/" rel="nofollow">www.goes.noaa.gov/</a> or goes.gsfc.nasa.gov/ Rob Gutro NASA's Goddard Space Flight Center <b><a href="http://goes.gsfc.nasa.gov/" rel="nofollow">Credit: NOAA/NASA GOES Project</a></b> <b><a href="http://www.nasa.gov/audience/formedia/features/MP_Photo_Guidelines.html" rel="nofollow">NASA image use policy.</a></b> <b><a href="http://www.nasa.gov/centers/goddard/home/index.html" rel="nofollow">NASA Goddard Space Flight Center</a></b> enables NASA’s mission through four scientific endeavors: Earth Science, Heliophysics, Solar System Exploration, and Astrophysics. Goddard plays a leading role in NASA’s accomplishments by contributing compelling scientific knowledge to advance the Agency’s mission. <b>Follow us on <a href="http://twitter.com/NASAGoddardPix" rel="nofollow">Twitter</a></b> <b>Like us on <a href="http://www.facebook.com/pages/Greenbelt-MD/NASA-Goddard/395013845897?ref=tsd" rel="nofollow">Facebook</a></b> <b>Find us on <a href="http://instagram.com/nasagoddard?vm=grid" rel="nofollow">Instagram</a></b>
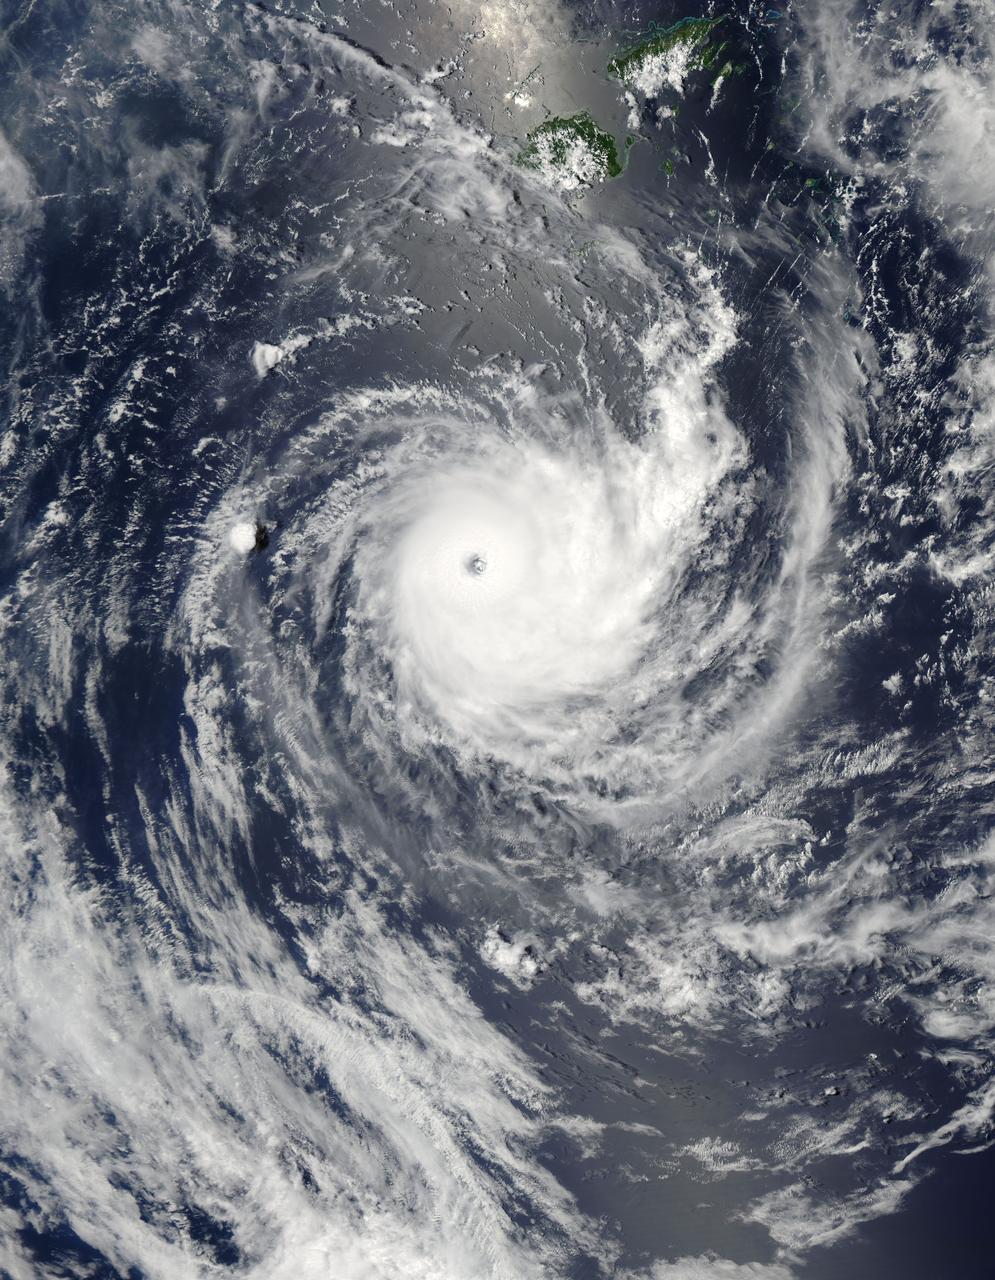
NASA image acquired January 26,02011 Tropical Cyclone Wilma raged over the Pacific Ocean in late January 2011. At 8:00 p.m. New Caledonia time (9:00 UTC) on January 26, the U.S. Navy’s Joint Typhoon Warning Center (JTWC) reported that Wilma was located some 555 nautical miles (1,030 kilometers) east of Noumea, New Caledonia. Wilma packed maximum sustained winds of 115 knots (215 kilometers per hour) with gusts up to 140 knots (260 kilometers per hour). The Moderate Resolution Imaging Spectroradiometer (MODIS) on NASA’s Aqua satellite captured this natural-color image at 12:45 p.m. New Caledonia time (1:45 UTC) on January 26, 2011. Wilma has a tightly coiled configuration and a well-defined eye. The storm hovers over the Pacific Ocean just south of Fiji. According to the JTWC, Wilma would remain strong for a day or so, then would being to gradually weaken, thanks to greater vertical wind shear and lower sea surface temperatures. NASA/GSFC/Jeff Schmaltz/MODIS Land Rapid Response Team <b><a href="http://www.nasa.gov/centers/goddard/home/index.html" rel="nofollow">NASA Goddard Space Flight Center</a></b> enables NASA’s mission through four scientific endeavors: Earth Science, Heliophysics, Solar System Exploration, and Astrophysics. Goddard plays a leading role in NASA’s accomplishments by contributing compelling scientific knowledge to advance the Agency’s mission. <b>Follow us on <a href="http://twitter.com/NASA_GoddardPix" rel="nofollow">Twitter</a></b> <b>Join us on <a href="http://www.facebook.com/pages/Greenbelt-MD/NASA-Goddard/395013845897?ref=tsd" rel="nofollow">Facebook</a></b>

On August 9 at 03:00 UTC (Aug. 8 at 11 p.m. EDT) the MODIS instrument aboard NASA's Terra satellite passed over the remnant clouds of Typhoon Soudelor when it was over eastern China. By 22:35 UTC (6:35 p.m. EDT) on August 8, 2015, Typhoon Soudelor had made landfall in eastern China and was rapidly dissipating. Maximum sustained winds had dropped to 45 knots (51.7 mph/83.3 kph) after landfall, making it a tropical storm. Image credit: NASA Goddard MODIS Rapid Response Team/Jeff Schmaltz..<b><a href="http://www.nasa.gov/audience/formedia/features/MP_Photo_Guidelines.html" rel="nofollow">NASA image use policy.</a></b> <b><a href="http://www.nasa.gov/centers/goddard/home/index.html" rel="nofollow">NASA Goddard Space Flight Center</a></b> enables NASA’s mission through four scientific endeavors: Earth Science, Heliophysics, Solar System Exploration, and Astrophysics. Goddard plays a leading role in NASA’s accomplishments by contributing compelling scientific knowledge to advance the Agency’s mission. <b>Follow us on <a href="http://twitter.com/NASAGoddardPix" rel="nofollow">Twitter</a></b> <b>Like us on <a href="http://www.facebook.com/pages/Greenbelt-MD/NASA-Goddard/395013845897?ref=tsd" rel="nofollow">Facebook</a></b> <b>Find us on <a href="http://instagrid.me/nasagoddard/?vm=grid" rel="nofollow">Instagram</a></b>
On July 9 at 02:05 UTC (July 8 at 10:05 p.m. EDT) the MODIS instrument aboard NASA's Terra satellite captured an image of Typhoon Chan-Hom east of Taiwan. The image clearly showed an eye with powerful bands of thunderstorms spiraling into the center of circulation. At 1500 UTC (11 a.m. EDT) on July 9, Typhoon Chan-Hom's maximum sustained winds were near 100 knots (115.1 mph/185.2 kph) and the storm continued to strengthen. Chan-Hom was centered near 24.2 North latitude and 127.6 East longitude, about 138 nautical miles (158.8 miles/255.6 km) southwest of Kadena Air Force Base, Iwo to, and has tracked westward at 13 knots (15 mph/24 kph). Read more: <a href="http://go.nasa.gov/1LYNdr0" rel="nofollow">go.nasa.gov/1LYNdr0</a> <b><a href="http://go.nasa.gov/1LYNZV6" rel="nofollow">NASA image use policy.</a></b> <b><a href="http://go.nasa.gov/1LYNXMW" rel="nofollow">NASA Goddard Space Flight Center</a></b> enables NASA’s mission through four scientific endeavors: Earth Science, Heliophysics, Solar System Exploration, and Astrophysics. Goddard plays a leading role in NASA’s accomplishments by contributing compelling scientific knowledge to advance the Agency’s mission. <b>Follow us on <a href="http://go.nasa.gov/1LYNZV9" rel="nofollow">Twitter</a></b> <b>Like us on <a href="http://go.nasa.gov/1LYNXN0" rel="nofollow">Facebook</a></b> <b>Find us on <a href="http://go.nasa.gov/1LYNZVc" rel="nofollow">Instagram</a></b>
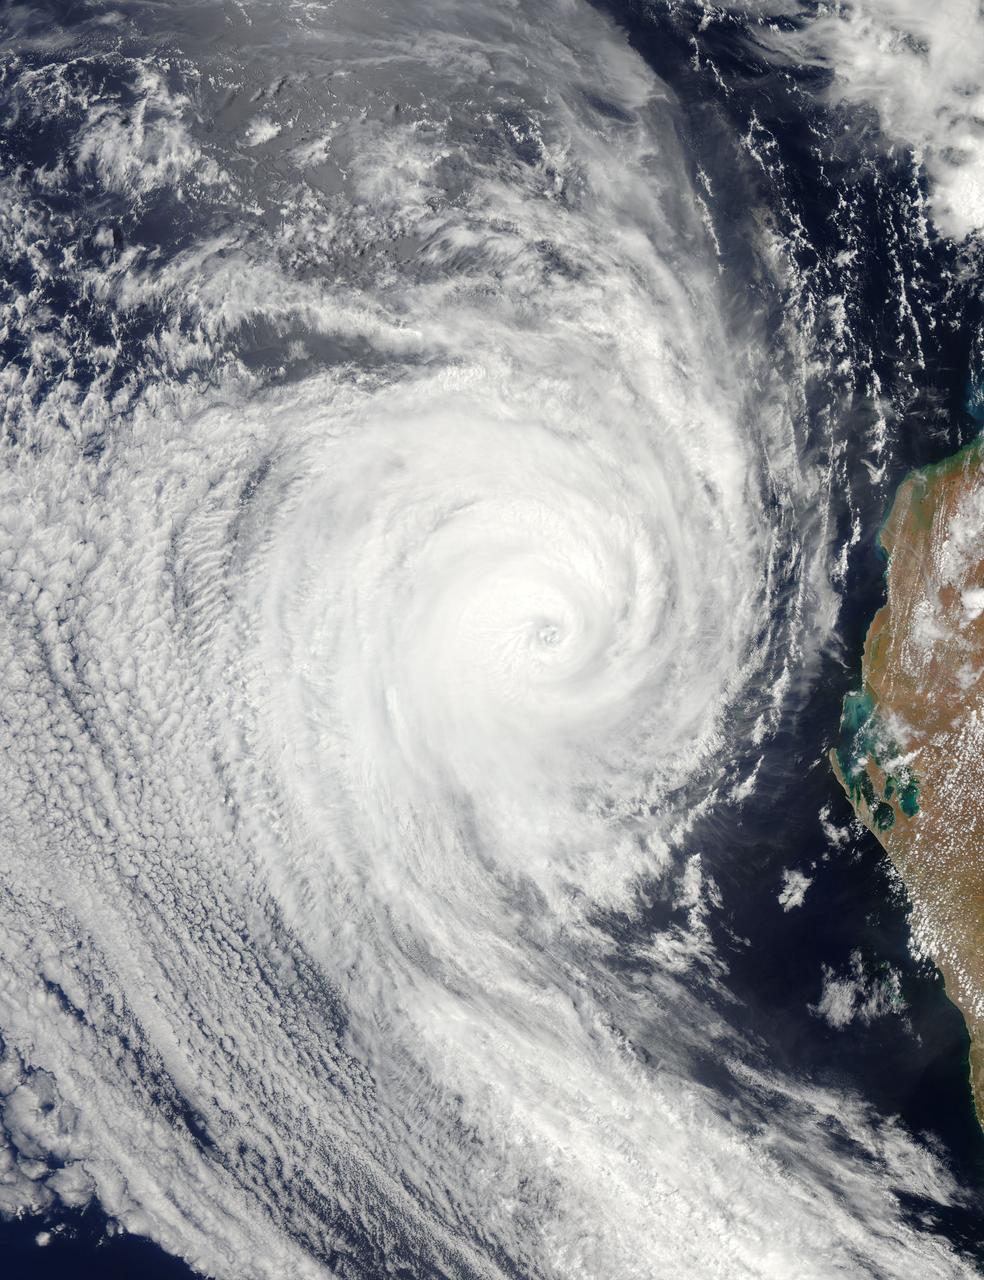
NASA image acquired January 28, 2011 Tropical Cyclone Bianca continued moving southward along the coast of Western Australia on January 28, 2011. At 5:00 a.m. on January 28 local time (21:00 UTC on January 27), the U.S. Navy’s Joint Typhoon Warning Center (JTWC) reported that Bianca was located about 135 nautical miles (250 kilometers) west of Learmonth, Western Australia. The storm had maximum sustained winds of 90 knots (165 kilometers per hour) and gusts up to 110 knots (205 kilometers per hour), having intensified over the previous day. The Moderate Resolution Imaging Spectroradiometer (MODIS) on NASA’s Aqua satellite captured this natural-color image at 2:30 p.m. Western Australia time (6:30 UTC) on January 28, 2011. Bianca spans hundreds of kilometers, and the storm’s eye appears west-southwest of Learmonth. The JTWC forecast that Bianca would continue strengthening for about 12 more hours then begin to weaken, thanks to reduced sea surface temperatures and increased vertical wind shear. NASA image by Jeff Schmaltz, MODIS Rapid Response Team at NASA GSFC. Caption by Michon Scott. Instrument: Aqua - MODIS To view more images of this event go to: <a href="http://earthobservatory.nasa.gov/NaturalHazards/event.php?id=48914" rel="nofollow">earthobservatory.nasa.gov/NaturalHazards/event.php?id=48914</a> Credit: <b><a href="http://www.earthobservatory.nasa.gov/" rel="nofollow"> NASA Earth Observatory</a></b> <b><a href="http://www.nasa.gov/centers/goddard/home/index.html" rel="nofollow">NASA Goddard Space Flight Center</a></b> enables NASA’s mission through four scientific endeavors: Earth Science, Heliophysics, Solar System Exploration, and Astrophysics. Goddard plays a leading role in NASA’s accomplishments by contributing compelling scientific knowledge to advance the Agency’s mission. <b>Follow us on <a href="http://twitter.com/NASA_GoddardPix" rel="nofollow">Twitter</a></b> <b>Join us on <a href="http://www.facebook.com/pages/Greenbelt-MD/NASA-Goddard/395013845897?ref=tsd" rel="nofollow">Facebook</a></b>

In this MODIS image from NASA's Aqua satellite, the eye of Typhoon Soudelor is seen over northwestern Taiwan on August 8, 2015 at 05:25 UTC (1:25 a.m. EDT). At that time, Soudelor had maximum sustained winds near 90 knots. It was less than 100 miles southwest of Taipei, Taiwan. Typhoon-force winds were felt up to 35 miles from the center, covering a 70 mile-wide diameter. Image credit: NASA Goddard MODIS Rapid Response Team/Jeff Schmaltz..<b><a href="http://www.nasa.gov/audience/formedia/features/MP_Photo_Guidelines.html" rel="nofollow">NASA image use policy.</a></b> <b><a href="http://www.nasa.gov/centers/goddard/home/index.html" rel="nofollow">NASA Goddard Space Flight Center</a></b> enables NASA’s mission through four scientific endeavors: Earth Science, Heliophysics, Solar System Exploration, and Astrophysics. Goddard plays a leading role in NASA’s accomplishments by contributing compelling scientific knowledge to advance the Agency’s mission. <b>Follow us on <a href="http://twitter.com/NASAGoddardPix" rel="nofollow">Twitter</a></b> <b>Like us on <a href="http://www.facebook.com/pages/Greenbelt-MD/NASA-Goddard/395013845897?ref=tsd" rel="nofollow">Facebook</a></b> <b>Find us on <a href="http://instagrid.me/nasagoddard/?vm=grid" rel="nofollow">Instagram</a></b>

NASA's Terra satellite captured this image of Typhoon Phanfone and its large eye in the western Pacific Ocean on Friday, Oct. 3 at 1:55 UTC. On Oct. 3 at 0900 UTC (5 a.m. EDT), Typhoon Phanfone's maximum sustained winds were near 110 knots (126.6 mph/203.7 kph). It was centered near 23.6 north longitude and 134.4 east latitude, about 374 nautical miles west-southwest of the island of Iwo To. Phanfone has tracked northwestward at 12 knots (13.8 mph/22.2 kph). Read more: <a href="http://1.usa.gov/1vjS1vs" rel="nofollow">1.usa.gov/1vjS1vs</a> Credit: NASA Goddard MODIS Rapid Response Team <b><a href="http://www.nasa.gov/audience/formedia/features/MP_Photo_Guidelines.html" rel="nofollow">NASA image use policy.</a></b> <b><a href="http://www.nasa.gov/centers/goddard/home/index.html" rel="nofollow">NASA Goddard Space Flight Center</a></b> enables NASA’s mission through four scientific endeavors: Earth Science, Heliophysics, Solar System Exploration, and Astrophysics. Goddard plays a leading role in NASA’s accomplishments by contributing compelling scientific knowledge to advance the Agency’s mission. <b>Follow us on <a href="http://twitter.com/NASAGoddardPix" rel="nofollow">Twitter</a></b> <b>Like us on <a href="http://www.facebook.com/pages/Greenbelt-MD/NASA-Goddard/395013845897?ref=tsd" rel="nofollow">Facebook</a></b> <b>Find us on <a href="http://instagram.com/nasagoddard?vm=grid" rel="nofollow">Instagram</a></b>
At about 6:00 a.m. EDT (10:00 UTC) on May 10, 2015, Tropical Storm Ana made landfall between Myrtle Beach and North Myrtle Beach, South Carolina. One day earlier, on the morning of May 9, the Moderate Resolution Imaging Spectroradiometer (MODIS) on NASA’s Terra satellite acquired this true-color image of the storm off the coast of the Carolinas. At the time, Ana had just evolved from a subtropical storm to a tropical storm with maximum sustained winds of 93 kilometers (58 miles) per hour. Ana’s life ashore was brief – the storm was downgraded to a tropical depression at 2:00 p.m. EDT (14:00 UTC) on May 10. During that time, parts of South Carolina and eastern North Carolina was drenched with heavy rain – some areas reported over 6 inches of rainfall – and heavy winds. A water spout was reported in Dare County, North Carolina, and the storm contributed to significant beach erosion along the coast. Credit: NASA/GSFC/Jeff Schmaltz/MODIS Land Rapid Response Team <b><a href="http://www.nasa.gov/audience/formedia/features/MP_Photo_Guidelines.html" rel="nofollow">NASA image use policy.</a></b> <b><a href="http://www.nasa.gov/centers/goddard/home/index.html" rel="nofollow">NASA Goddard Space Flight Center</a></b> enables NASA’s mission through four scientific endeavors: Earth Science, Heliophysics, Solar System Exploration, and Astrophysics. Goddard plays a leading role in NASA’s accomplishments by contributing compelling scientific knowledge to advance the Agency’s mission. <b>Follow us on <a href="http://twitter.com/NASAGoddardPix" rel="nofollow">Twitter</a></b> <b>Like us on <a href="http://www.facebook.com/pages/Greenbelt-MD/NASA-Goddard/395013845897?ref=tsd" rel="nofollow">Facebook</a></b> <b>Find us on <a href="http://instagrid.me/nasagoddard/?vm=grid" rel="nofollow">Instagram</a></b>

On April 5, 2015, the Moderate Resolution Imaging Spectroradiometer (MODIS) on NASA’s Terra satellite acquired this natural-color image of sea ice off the coast of East Antarctica’s Princess Astrid Coast. White areas close to the continent are sea ice, while white areas in the northeast corner of the image are clouds. One way to better distinguish ice from clouds is with false-color imagery. In the false-color view of the scene here, ice is blue and clouds are white. The image was acquired after Antarctic sea ice had passed its annual minimum extent (reached on February 20, 2015), and had resumed expansion toward its maximum extent (usually reached in September). Credit: NASA image by Jeff Schmaltz, LANCE/EOSDIS Rapid Response. Caption by Kathryn Hansen via NASA's Earth Observatory Read more: <a href="http://www.nasa.gov/content/sea-ice-off-east-antarcticas-princess-astrid-coast/" rel="nofollow">www.nasa.gov/content/sea-ice-off-east-antarcticas-princes...</a> <b><a href="http://www.nasa.gov/audience/formedia/features/MP_Photo_Guidelines.html" rel="nofollow">NASA image use policy.</a></b> <b><a href="http://www.nasa.gov/centers/goddard/home/index.html" rel="nofollow">NASA Goddard Space Flight Center</a></b> enables NASA’s mission through four scientific endeavors: Earth Science, Heliophysics, Solar System Exploration, and Astrophysics. Goddard plays a leading role in NASA’s accomplishments by contributing compelling scientific knowledge to advance the Agency’s mission. <b>Follow us on <a href="http://twitter.com/NASAGoddardPix" rel="nofollow">Twitter</a></b> <b>Like us on <a href="http://www.facebook.com/pages/Greenbelt-MD/NASA-Goddard/395013845897?ref=tsd" rel="nofollow">Facebook</a></b> <b>Find us on <a href="http://instagrid.me/nasagoddard/?vm=grid" rel="nofollow">Instagram</a></b>
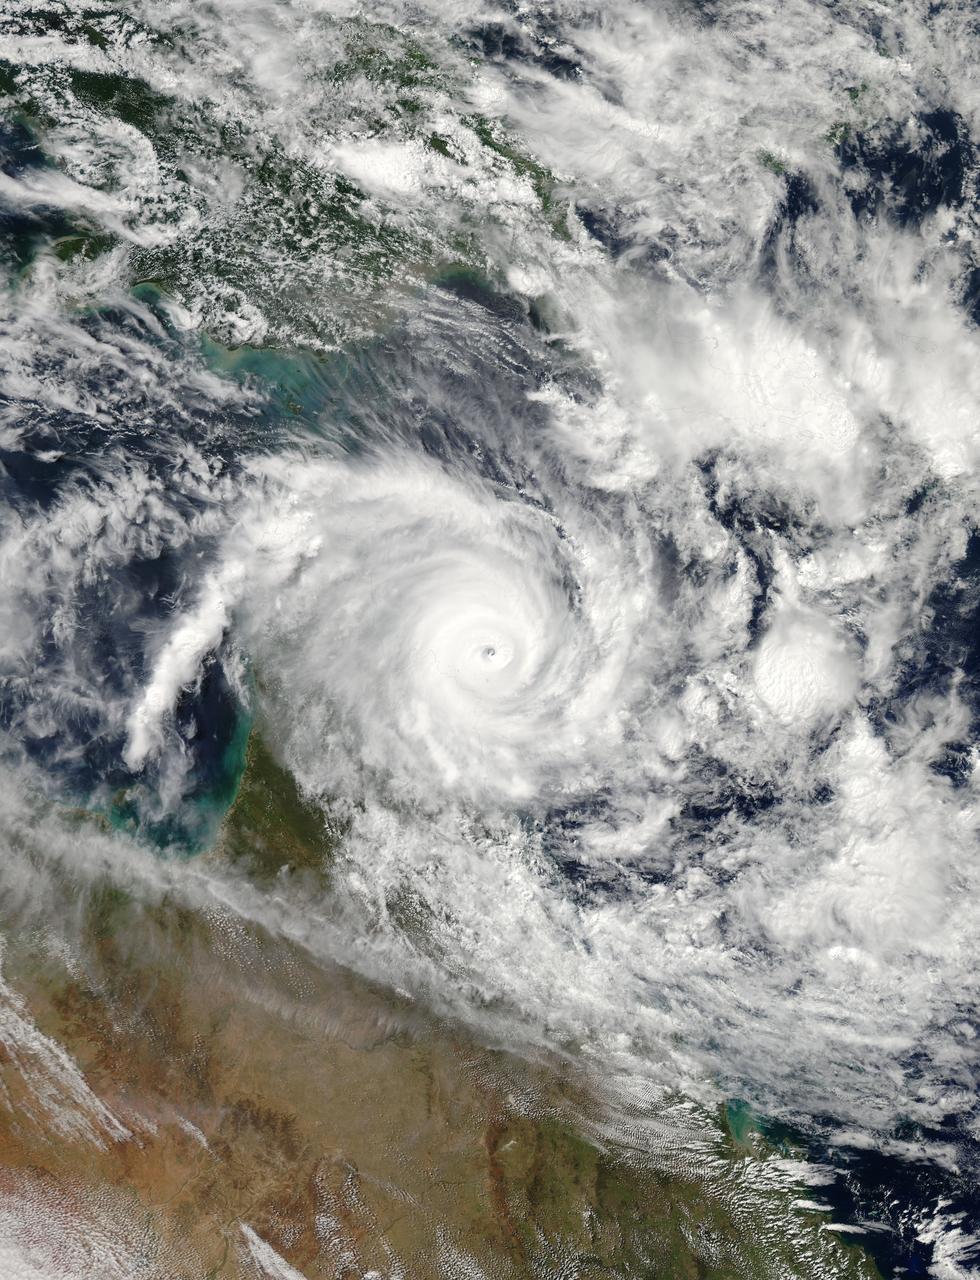
NASA's Aqua satellite passed over Tropical Cyclone Ita as it began making landfall on the Eastern Cape York Peninsula of Queensland, Australia, today, April 11, 2014. Ita officially made landfall at Cape Flattery about 9:00 p.m. local AEST time as a Category 4 storm according to reports from the Australian Broadcasting Corporation (ABC). The Moderate Resolution Imaging Spectroradiometer that flies aboard Aqua captured an image of the Category 4 storm on April 11 at 12:00 a.m. EDT (4 a.m. UTC). Satellite imagery indicates the eye is 9.2 miles wide (8 nautical miles, or 14.8 km). Warnings and watches remain in effect as the center of Ita is expected to remain at hurricane strength as it moves in a southerly direction, staying just west of Cairns over the next day. A tropical cyclone warning is in effect between Coen and Innisfail, including Cooktown, Port Douglas, Cairns, extending inland to Kalinga, Palmerville, Mareeba and Chillagoe. A tropical cyclone watch is in effect between Innisfail to Cardwell, extending inland. ABC reported that the strongest maximum sustained winds around the center of circulation were near 142.9 mph (124.2 knots, or 230 kph) and many trees have been downed and homes damaged. According to ABC, preliminary reports suggest that power may be out for a month in some areas. On April 11 at 5 a.m. EDT (9 a.m. UTC), Tropical Cyclone Ita had maximum sustained winds near 143.8 mph (125 knots, or 231.5 kph). It was centered near 14.8 degrees south latitude and 145.3 degrees east longitude, about 168 miles (146 nautical miles, or 288 km) north of Cairns, Australia, and has tracked south-southwestward at 10.3 mph (9 knots, or 16.6 kph). Ita is moving around a subtropical ridge (elongated area) of high pressure and the Joint Typhoon Warning Center expects Ita to start curving to the southeast around that ridge in the next day before heading back out into the Coral Sea. Credit: NASA/GSFC/Jeff Schmaltz/MODIS Land Rapid Response Team Rob Gutro, NASA's Goddard Space Flight Center, Greenbelt, Md. <b><a href="http://www.nasa.gov/audience/formedia/features/MP_Photo_Guidelines.html" rel="nofollow">NASA image use policy.</a></b> <b><a href="http://www.nasa.gov/centers/goddard/home/index.html" rel="nofollow">NASA Goddard Space Flight Center</a></b> enables NASA’s mission through four scientific endeavors: Earth Science, Heliophysics, Solar System Exploration, and Astrophysics. Goddard plays a leading role in NASA’s accomplishments by contributing compelling scientific knowledge to advance the Agency’s mission. <b>Follow us on <a href="http://twitter.com/NASAGoddardPix" rel="nofollow">Twitter</a></b> <b>Like us on <a href="http://www.facebook.com/pages/Greenbelt-MD/NASA-Goddard/395013845897?ref=tsd" rel="nofollow">Facebook</a></b> <b>Find us on <a href="http://instagram.com/nasagoddard?vm=grid" rel="nofollow">Instagram</a></b>

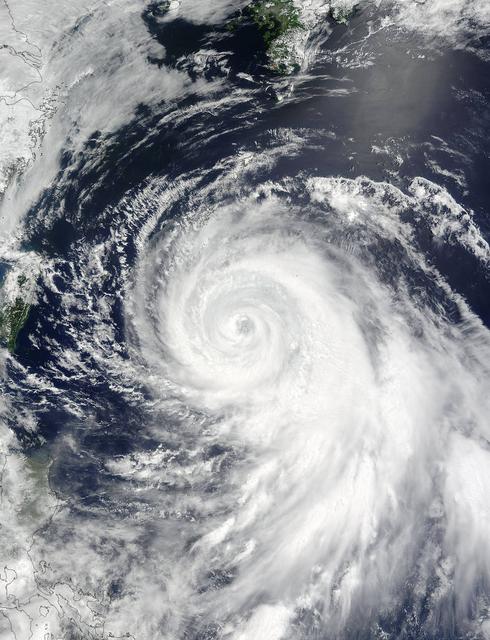
NASA satellite imagery from July 10 revealed a very clear and cloudless eye in the Northwestern Pacific’s Typhoon Soulik as it moves toward a landfall in China by the end of the week. The Moderate Resolution Imaging Spectroradiometer (MODIS) instrument aboard NASA’s Terra satellite captured a visible image of Typhoon Soulik and its clear eye on July 10, 2013 at 2:10 UTC as it continues to move through the northwestern Pacific Ocean. Soulik’s round eye is about 25 nautical miles (28.7 miles/46.3 km) wide. Typhoon Soulik’s maximum sustained winds have increased dramatically over the last 24 hours and at 1500 UTC (11 a.m. EDT) on July 10, were blowing at 120 knots (138 mph/222 kph). According to the Joint Typhoon Warning Center, Soulik’s powerful winds are creating seas over 40 feet (12.2 meters) high in the northwestern Pacific Ocean. Soulik’s center was near 21.9 north latitude and 132.9 east longitude, about 420 nautical miles (483.3 miles/777.7 km) southeast of Kadena Air Base, Japan. Soulik is moving to the west-northwest at 13 knots (15 mph/24 kph). Soulik is tracking west-northwest along the southern edge of a subtropical ridge (elongated area) of high pressure. The ridge of high pressure stretches from east to west and westward over the Ryukyu Islands and into the East China Sea along about 30 north latitude. Soulik is still expected to make a landfall in southeastern China on July 12 or 13 after passing north of Taiwan. Text credit: Rob Gutro More info about the storm: <a href="http://1.usa.gov/12mvQcC" rel="nofollow">1.usa.gov/12mvQcC</a> <b><a href="http://www.nasa.gov/audience/formedia/features/MP_Photo_Guidelines.html" rel="nofollow">NASA image use policy.</a></b> <b><a href="http://www.nasa.gov/centers/goddard/home/index.html" rel="nofollow">NASA Goddard Space Flight Center</a></b> enables NASA’s mission through four scientific endeavors: Earth Science, Heliophysics, Solar System Exploration, and Astrophysics. Goddard plays a leading role in NASA’s accomplishments by contributing compelling scientific knowledge to advance the Agency’s mission. <b>Follow us on <a href="http://twitter.com/NASA_GoddardPix" rel="nofollow">Twitter</a></b> <b>Like us on <a href="http://www.facebook.com/pages/Greenbelt-MD/NASA-Goddard/395013845897?ref=tsd" rel="nofollow">Facebook</a></b> <b>Find us on <a href="http://instagram.com/nasagoddard?vm=grid" rel="nofollow">Instagram</a></b>
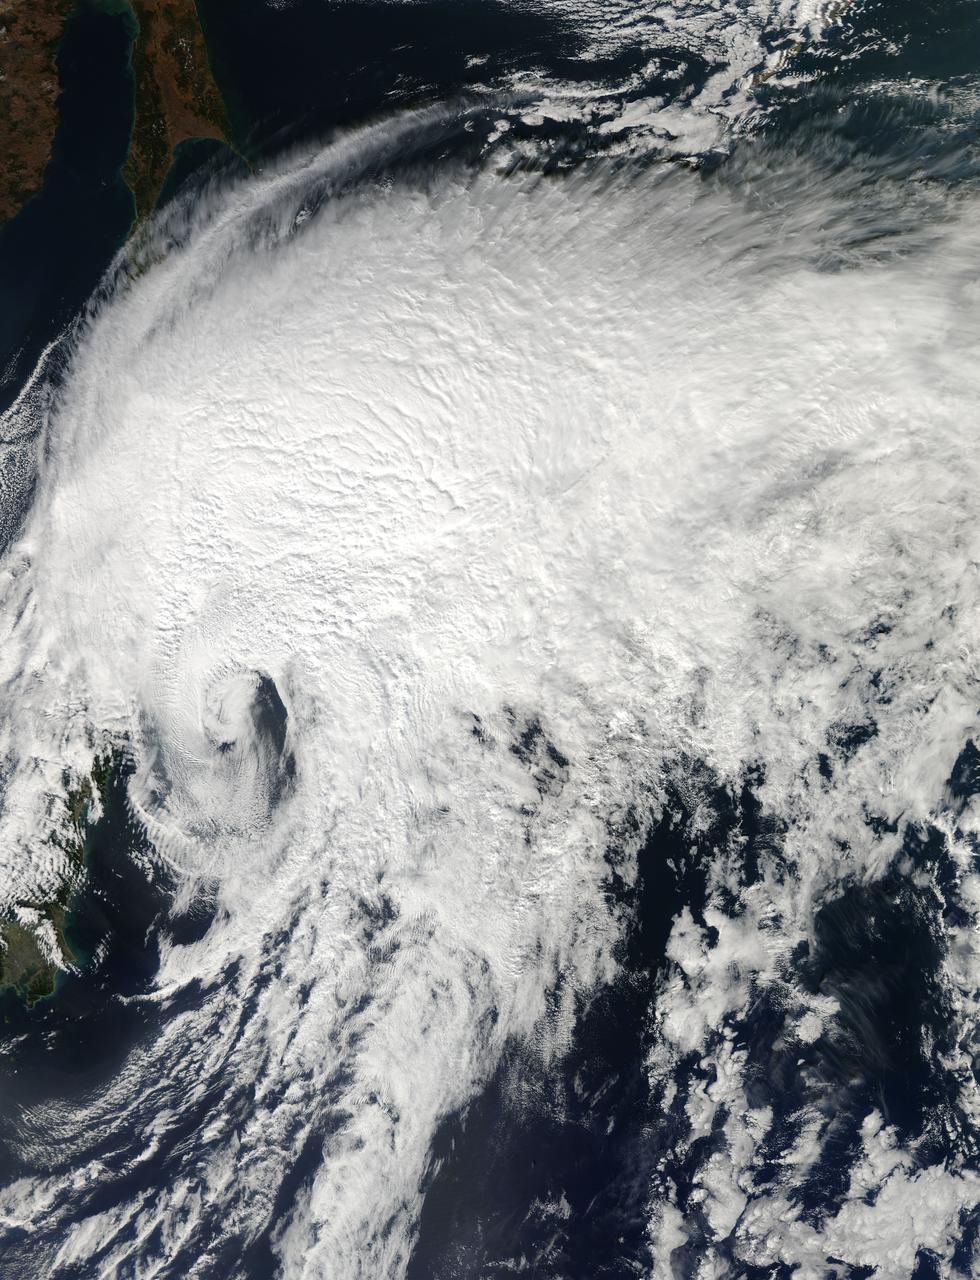
NASA's Aqua satellite passed over Extra-Tropical Storm Vongfong on Oct. 4 as it was moving away from Hokkaido, Japan, the northernmost of the big islands. Vongfong transitioned into an extra-tropical storm early on Oct. 4 as its core changed from warm to cold. The MODIS or Moderate Resolution Imaging Spectroradiometer instrument aboard NASA's Aqua satellite captured a visible image of Tropical Storm Vongfong over Japan on Oct. 14 at 03:15 UTC as it was southeast of the island of Hokkaido, Japan. The image showed that south of the center of circulation was almost devoid of clouds and showers, which were all pushed to the north and east of the center as a result of southwesterly wind shear. At 0300 UTC on Oct. 14, the Joint Typhoon Warning Center issued its final advisory on Tropical storm Vongfong. At that time Vongfong's center was located near 29.1 north latitude and 142.9 east longitude, about 111 nautical miles (127.7 miles/205.6 km) southeast of Misawa, Japan. Vongfong was moving to the northeast at a speedy 36 knots (41.4 mph/66.67 kph). Vongfong's maximum sustained winds were near 35 knots (40.2 mph/64.8 kph). Vongfong had transitioned into an extra-tropical system and will continue to move away from northern Japan and over the northwestern Pacific Ocean. Credit: NASA/GSFC/Jeff Schmaltz/MODIS Land Rapid Response Team <b><a href="http://www.nasa.gov/audience/formedia/features/MP_Photo_Guidelines.html" rel="nofollow">NASA image use policy.</a></b> <b><a href="http://www.nasa.gov/centers/goddard/home/index.html" rel="nofollow">NASA Goddard Space Flight Center</a></b> enables NASA’s mission through four scientific endeavors: Earth Science, Heliophysics, Solar System Exploration, and Astrophysics. Goddard plays a leading role in NASA’s accomplishments by contributing compelling scientific knowledge to advance the Agency’s mission. <b>Follow us on <a href="http://twitter.com/NASAGoddardPix" rel="nofollow">Twitter</a></b> <b>Like us on <a href="http://www.facebook.com/pages/Greenbelt-MD/NASA-Goddard/395013845897?ref=tsd" rel="nofollow">Facebook</a></b> <b>Find us on <a href="http://instagram.com/nasagoddard?vm=grid" rel="nofollow">Instagram</a></b>
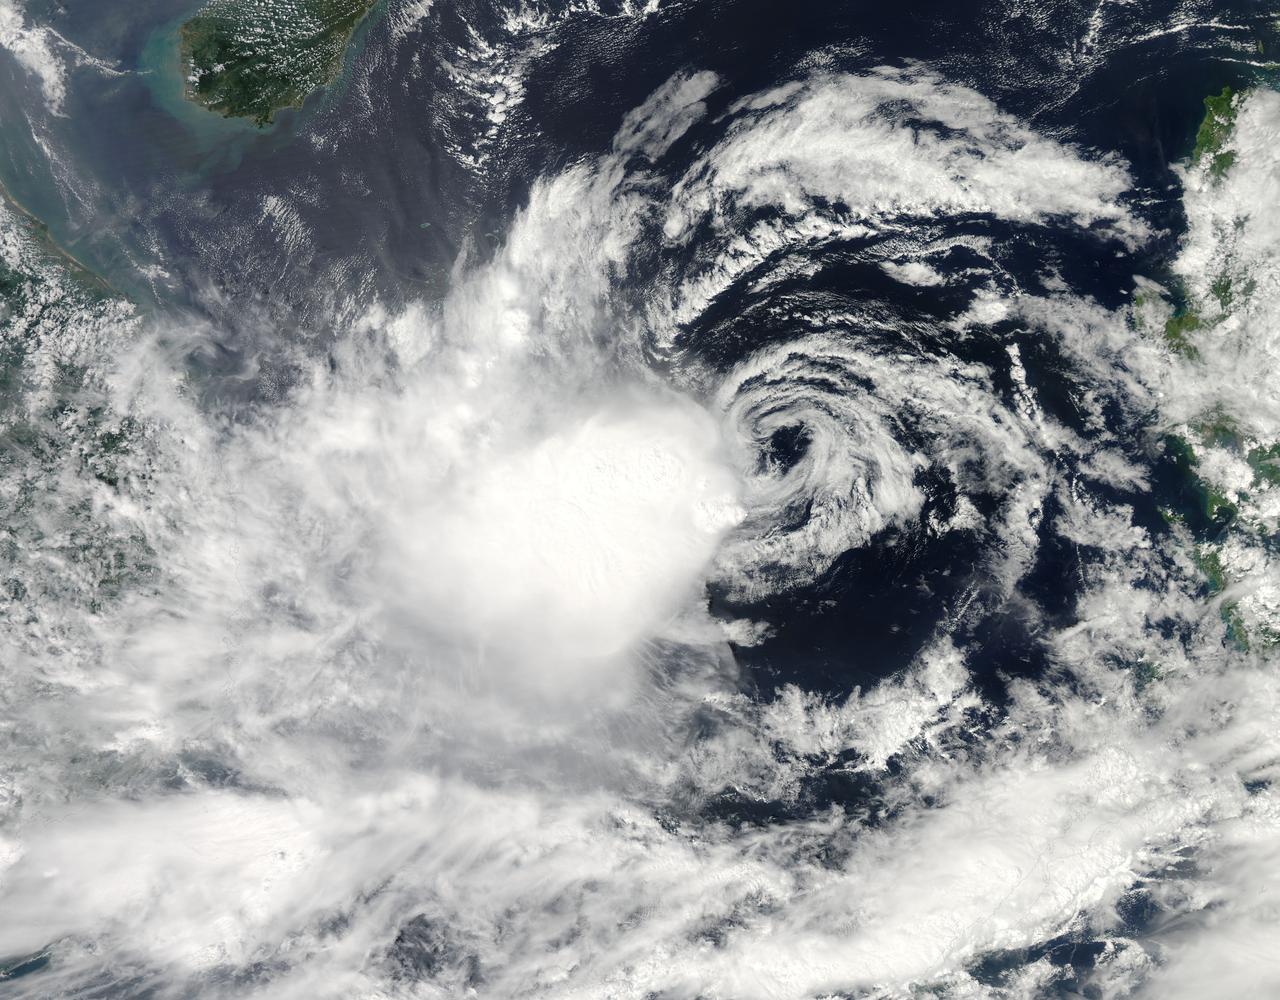
It is easy to see the effect of the strong northeasterly wind shear battering Tropical Storm Gaemi in satellite imagery from NASA. This true-color image acquired on Oct. 5 shows a large oval-shaped area of showers and thunderstorms associated with the storm, southwest of the exposed center of circulation. NASA's Aqua satellite passed over Tropical Storm Gaemi as it was approaching Vietnam on Oct. 5, 2012 at 0550 UTC (1:50 a.m. EDT). A true-color image of the storm was captured by the Moderate Resolution Imaging Spectroradiometer (MODIS) instrument and shows bulk of showers and thunderstorms were clearly to the southwest of the center. The circulation center appears as a ring of concentric bands of clouds northeast of the large rounded area of clouds and showers associated with the storm. On Tuesday, October 5, 2012 at 1500 UTC (11 a.m. EDT), Tropical Storm Gaemi still had maximum sustained winds near 35 knots (40 mph/65 km/h) as it did 24 hours before. It was located 425 nautical miles (489 miles/787 km) east of Hue, Vietnam near 14.7 North latitude and 117.7 East longitude. Early on October 7, Tropical Storm Gaemi made landfall over Vietnam with wind speeds reported at 34 mph (55 mph), and bringing rainfall of more than 4 inches in some areas of Vietnam. Once ashore, the storm quickly moved inland and rapidly weakened as it headed towards Cambodia. With winds reduced, Gaemi served primarily as a rainmaker, but the rain may bring flooding and landslides to the region. Credit: NASA/GSFC/Jeff Schmaltz/MODIS Land Rapid Response Team <b><a href="http://www.nasa.gov/audience/formedia/features/MP_Photo_Guidelines.html" rel="nofollow">NASA image use policy.</a></b> <b><a href="http://www.nasa.gov/centers/goddard/home/index.html" rel="nofollow">NASA Goddard Space Flight Center</a></b> enables NASA’s mission through four scientific endeavors: Earth Science, Heliophysics, Solar System Exploration, and Astrophysics. Goddard plays a leading role in NASA’s accomplishments by contributing compelling scientific knowledge to advance the Agency’s mission. <b>Follow us on <a href="http://twitter.com/NASA_GoddardPix" rel="nofollow">Twitter</a></b> <b>Like us on <a href="http://www.facebook.com/pages/Greenbelt-MD/NASA-Goddard/395013845897?ref=tsd" rel="nofollow">Facebook</a></b> <b>Find us on <a href="http://instagrid.me/nasagoddard/?vm=grid" rel="nofollow">Instagram</a></b>
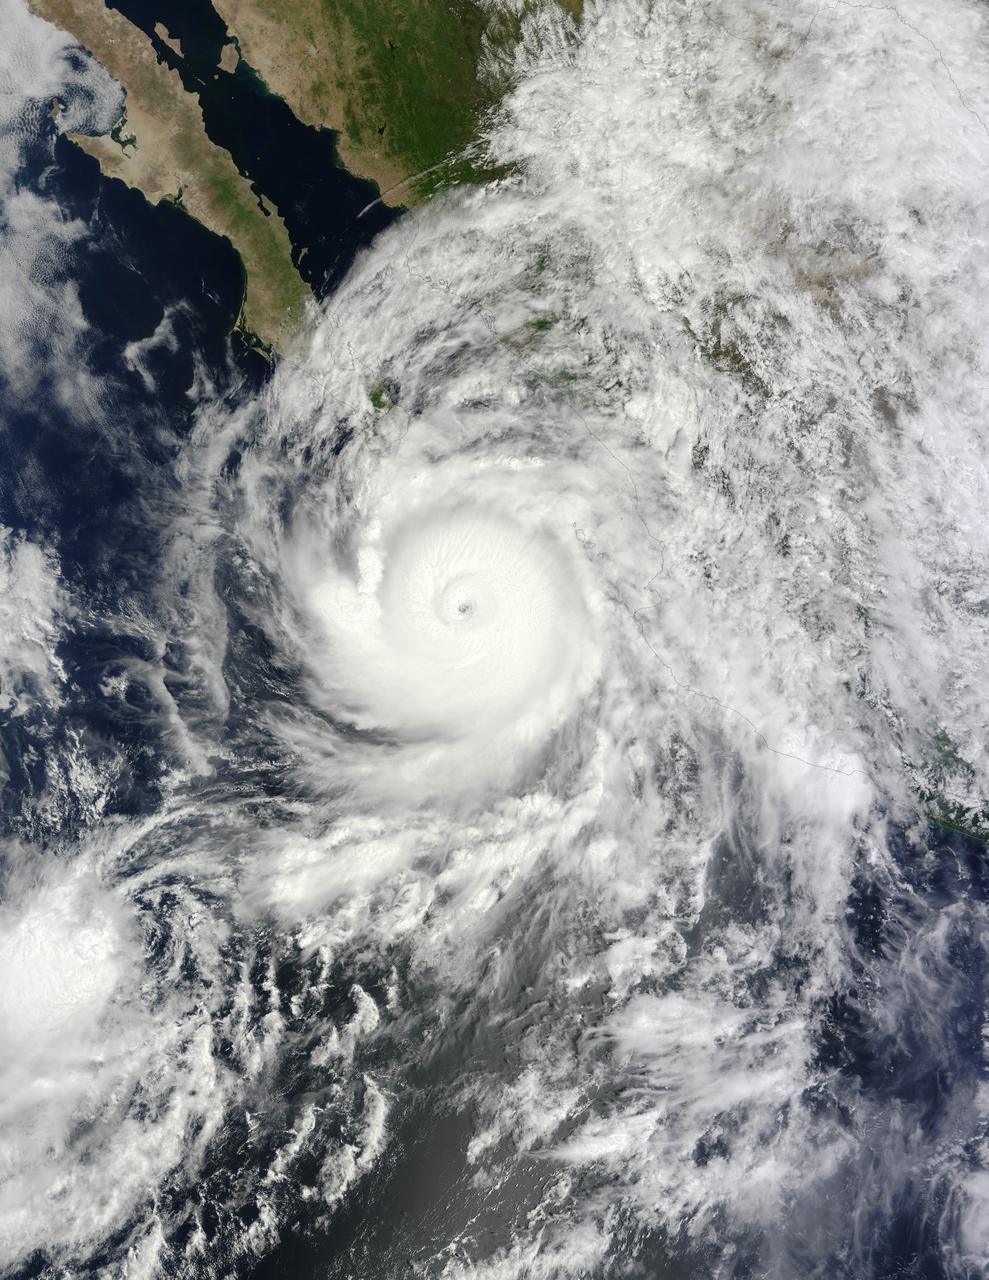
At about 10:45 p.m. Mountain Daylight Time (MDT) on September 14, 2014, Hurricane Odile made landfall as a Category 3 storm near Cabo San Lucas, Mexico. According to the U.S. National Hurricane Center, Odile arrived with wind speeds of 110 knots (204 kilometers or 127 miles per hour). The storm tied Olivia (1967) as the strongest hurricane to make landfall in the state of Baja California Sur in the satellite era. The Moderate Resolution Imaging Spectroradiometer (MODIS) on NASA’s Terra satellite acquired this natural-color view of the storm at about noon MDT on September 14, when it was still southeast of the Baja California peninsula. Unisys Weather reported that the Category 4 storm had maximum sustained wind speeds of 115 knots (213 kilometers per hour) at the time. Odile had weakened to a Category 2 hurricane by 6 a.m. MDT on September 15. The storm was expected to continue weakening as it moved up the peninsula and over the area’s rough terrain, according to weather blogger Jeff Masters. Meteorologists noted that while damaging winds posed the biggest threat in the short term, inland areas of the U.S. Southwest could face heavy rainfall by September 16. The rain expected from Odile came one week after the U.S. Southwest experienced flash floods from the remnants of Hurricane Norbert. According to weather and climate blogger Eric Holthaus, those floods did little to relieve the area’s ongoing drought. NASA image by Jeff Schmaltz, LANCE/EOSDIS Rapid Response. Caption by Kathryn Hansen. Instrument(s): Terra - MODIS Read more: <a href="http://earthobservatory.nasa.gov/IOTD/view.php?id=84378&eocn=home&eoci=iotd_title" rel="nofollow">earthobservatory.nasa.gov/IOTD/view.php?id=84378&eocn...</a> <b><a href="http://www.nasa.gov/audience/formedia/features/MP_Photo_Guidelines.html" rel="nofollow">NASA image use policy.</a></b> <b><a href="http://www.nasa.gov/centers/goddard/home/index.html" rel="nofollow">NASA Goddard Space Flight Center</a></b> enables NASA’s mission through four scientific endeavors: Earth Science, Heliophysics, Solar System Exploration, and Astrophysics. Goddard plays a leading role in NASA’s accomplishments by contributing compelling scientific knowledge to advance the Agency’s mission. <b>Follow us on <a href="http://twitter.com/NASAGoddardPix" rel="nofollow">Twitter</a></b> <b>Like us on <a href="http://www.facebook.com/pages/Greenbelt-MD/NASA-Goddard/395013845897?ref=tsd" rel="nofollow">Facebook</a></b> <b>Find us on <a href="http://instagram.com/nasagoddard?vm=grid" rel="nofollow">Instagram</a></b>
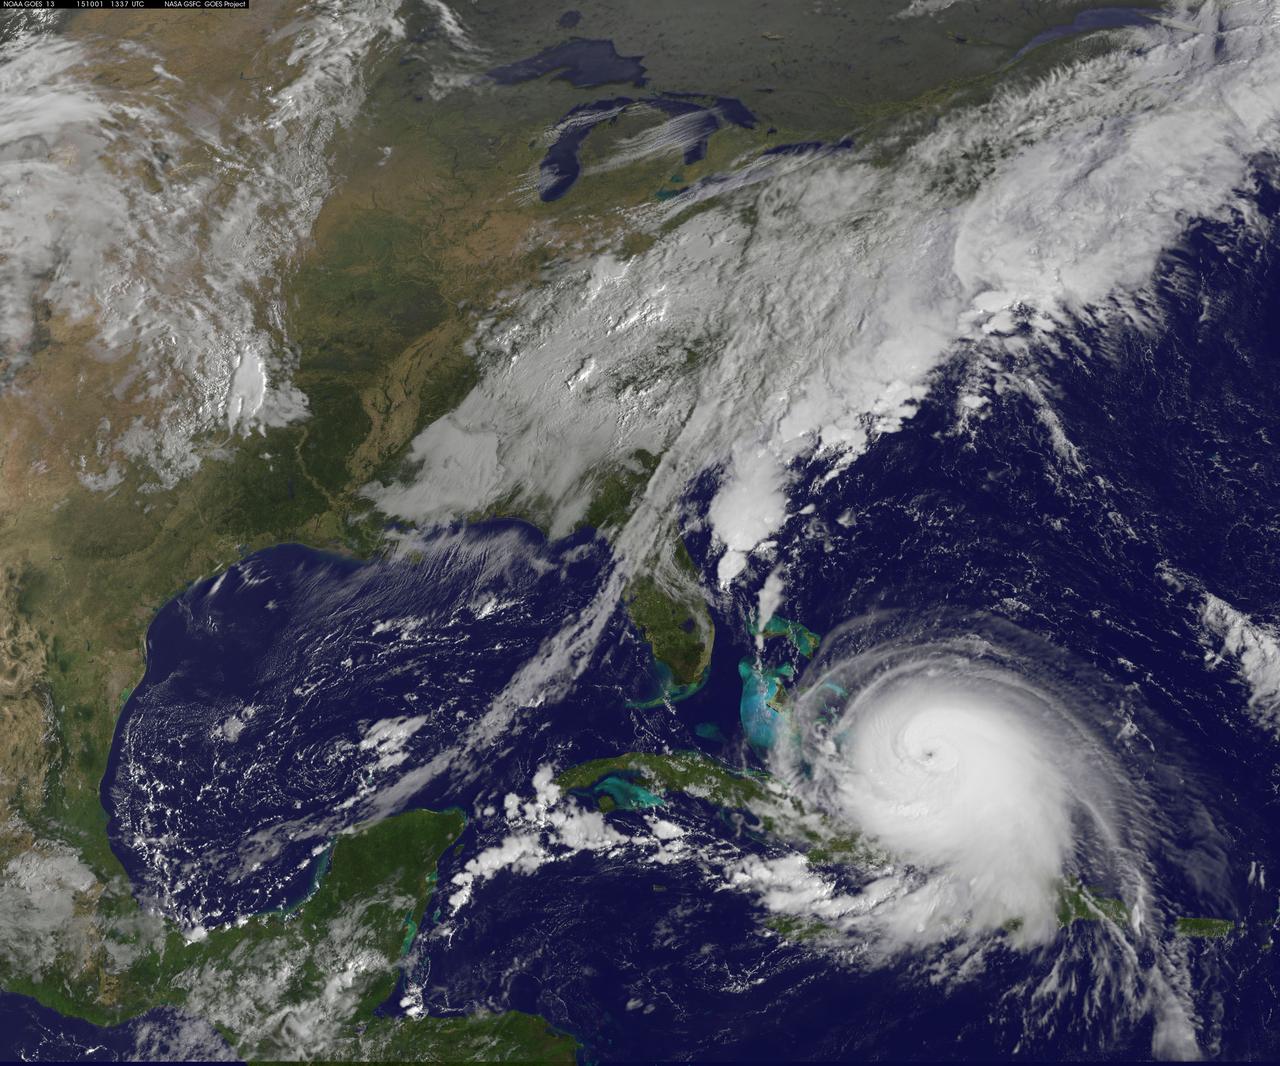
Hurricane Joaquin continued to intensify in the Bahamas on October 1 and NASA and NOAA satellites have been providing valuable data on the storm. NASA's GPM and Terra satellites and NOAA's GOES-East satellite provided rainfall, cloud extent, cloud height and other data to forecasters. Joaquin became a major hurricane today, October 1, reaching Category 3 status on the Saffir-Simpson Wind Scale. On October 1 at 1330 UTC (9:30 a.m. EDT) NOAA's GOES-East satellite captured this visible image of Hurricane Joaquin covering the southern Bahamas and extending over southeastern Cuba, and the island of Hispaniola (which includes Haiti and the Dominican Republic). Joaquin's eye had become completely visible now that the storm had reached Category 3 status. On October 1, a Hurricane Warning was in effect for the Central Bahamas, Northwestern Bahamas including the Abacos, Berry Islands, Eleuthera, Grand Bahama Island, and New Providence, The Acklins, Crooked Island, and Mayaguana in the southeastern Bahamas. A Hurricane Watch was in effect for Bimini and Andros Island, and a Tropical Storm Warning was in effect for the remainder of the southeastern Bahamas excluding the Turks and Caicos Islands and Andros Island. According to NHC, at 8 a.m. EDT (1200 UTC), the center of Hurricane Joaquin was located near latitude 23.2 North, longitude 73.7 West. That's just 10 miles (15 km) north of Samana Cays, Bahamas and about 75 miles (120 km) southeast of San Salvador, Bahamas. Joaquin was moving toward the west-southwest near 5 mph (7 kph), and this motion is expected to continue today. NHC noted that a turn toward the west- northwest is forecast tonight (Oct. 1), followed by a turn toward the north and an increase in forward speed on Friday, Oct. 2. On the forecast track, the center of Joaquin will move near or over portions of the central Bahamas today and tonight and pass near or over portions of the northwestern Bahamas on Friday. Maximum sustained winds are near 120 mph (195 km/h) with higher gusts. Joaquin is a category 3 hurricane on the Saffir-Simpson Hurricane Wind Scale. Some strengthening is forecast in the next day or so, with some fluctuations in intensity possible on Friday. Hurricane force winds extend outward up to 35 miles (55 km) from the center and tropical storm force winds extend outward up to 140 miles (220 km). The minimum central pressure just extrapolated by an Air Force Reserve Hurricane Hunter aircraft is 942 millibars. For updated forecasts, watches and warnings visit the National Hurricane Center (NHC) website: <a href="http://www.nhc.noaa.gov" rel="nofollow">www.nhc.noaa.gov</a>. Credit: NASA/NOAA GOES Project <b><a href="http://www.nasa.gov/audience/formedia/features/MP_Photo_Guidelines.html" rel="nofollow">NASA image use policy.</a></b> <b><a href="http://www.nasa.gov/centers/goddard/home/index.html" rel="nofollow">NASA Goddard Space Flight Center</a></b> enables NASA’s mission through four scientific endeavors: Earth Science, Heliophysics, Solar System Exploration, and Astrophysics. Goddard plays a leading role in NASA’s accomplishments by contributing compelling scientific knowledge to advance the Agency’s mission. <b>Follow us on <a href="http://twitter.com/NASAGoddardPix" rel="nofollow">Twitter</a></b> <b>Like us on <a href="http://www.facebook.com/pages/Greenbelt-MD/NASA-Goddard/395013845897?ref=tsd" rel="nofollow">Facebook</a></b> <b>Find us on <a href="http://instagrid.me/nasagoddard/?vm=grid" rel="nofollow">Instagram</a></b>
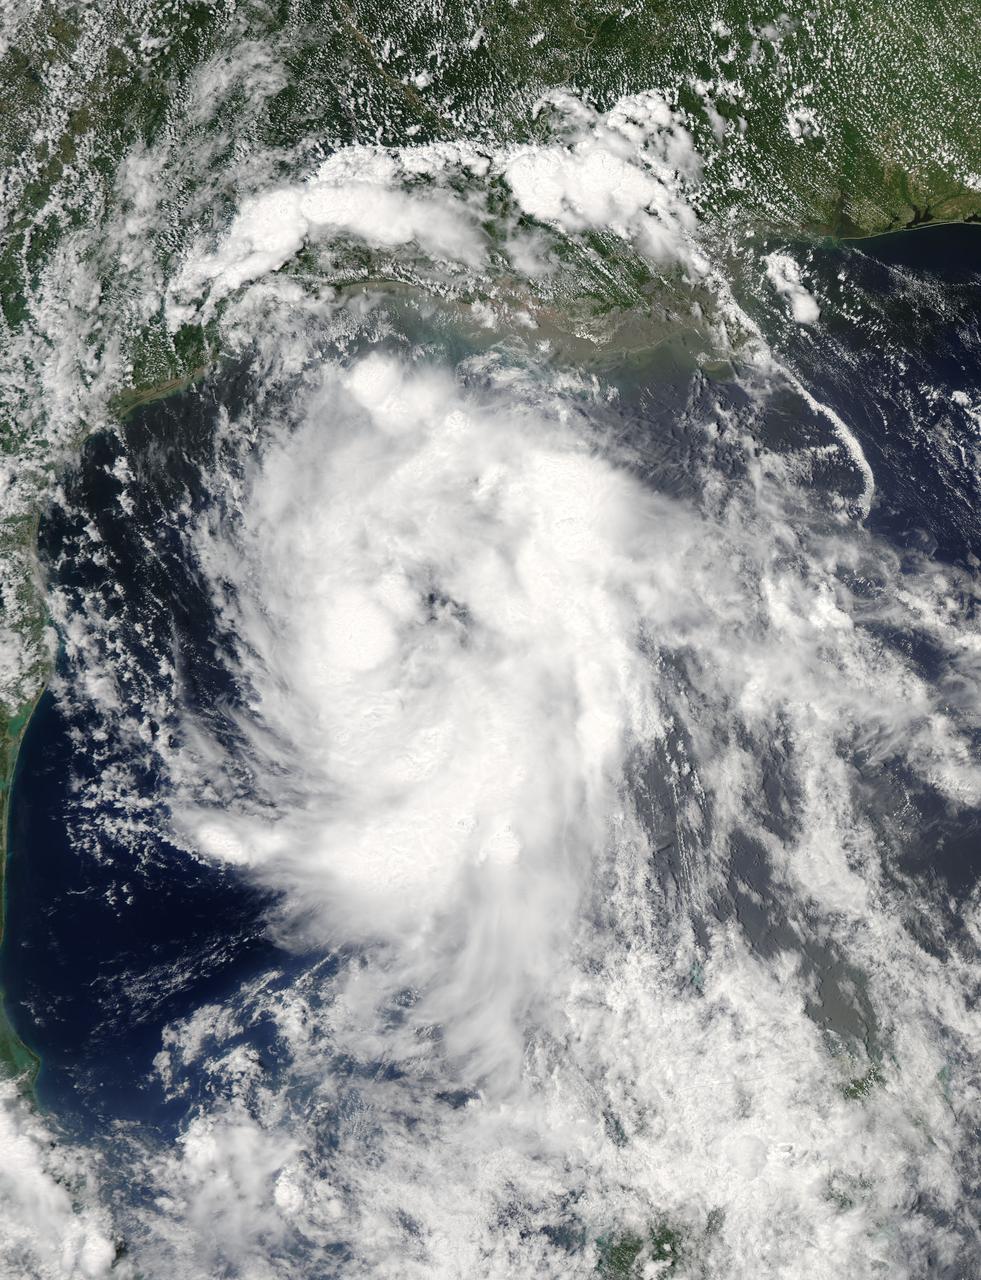
On June 15 at 19:15 UTC (3:15 p.m. EDT) the MODIS instrument aboard NASA's Aqua satellite captured a visible image of Tropical Storm Bill approaching Texas and Louisiana. Powerful thunderstorms circled the center in fragmented bands. At 11 a.m. CDT on June 16, a Tropical Storm Warning was in effect from Baffin Bay to High Island Texas as Bill was making landfall. The National Hurricane Center noted that Bill is expected to produce total rain accumulations of 4 to 8 inches over eastern Texas and eastern Oklahoma and 2 to 4 inches over western Arkansas and southern Missouri, with possible isolated maximum amounts of 12 inches in eastern Texas. In eastern Texas and far western Louisiana today and tonight, isolated tornadoes are also possible, as with any landfalling tropical storm. Tropical storm conditions are expected to continue into the evening in the warning area. Along the coasts, the combination of a storm surge and the tide will cause normally dry areas near the coast to be flooded by rising waters. The water could reach the following heights above ground if the peak surge occurs at the time of high tide. The NHC noted that the Upper Texas coast could experience 2 to 4 feet, and the western Louisiana coast between 1 to 2 feet. At 10 a.m. CDT (1500 UTC), the center of Tropical Storm Bill was located near latitude 28.2 North, longitude 96.4 West. Bill was moving toward the northwest near 10 mph (17 kph) and that general motion is expected to continue today. The latest minimum central pressure reported by an Air Force Reserve Hurricane Hunter aircraft was 997 millibars. Reports from an Air Force Reserve reconnaissance aircraft indicate that maximum sustained winds remain near 60 mph (95 kph) with higher gusts. Unlike Carlos, Bill is not a compact storm. Tropical-storm-force winds extend outward up to 150 miles (240 km) from the center. Between 9 and 10 a.m. CDT, an automated observing station at Port O'Connor also reported a sustained wind of 44 mph (70 kph) and a gust to 53 mph (85 kph). For updated forecasts, watches and warnings, visit the National Hurricane Center webpage at <a href="http://www.nhc.noaa.gov" rel="nofollow">www.nhc.noaa.gov</a>. For local forecasts and advisories, visit: <a href="http://www.weather.gov" rel="nofollow">www.weather.gov</a>. Bill is forecast to continue moving inland and is expected to be a tropical depression by Wednesday, June 17, west of Dallas. The remnants of Bill are forecast to move into the Midwest later in the week. Credit: NASA/GSFC/Jeff Schmaltz/MODIS Land Rapid Response Team <b><a href="http://www.nasa.gov/audience/formedia/features/MP_Photo_Guidelines.html" rel="nofollow">NASA image use policy.</a></b> <b><a href="http://www.nasa.gov/centers/goddard/home/index.html" rel="nofollow">NASA Goddard Space Flight Center</a></b> enables NASA’s mission through four scientific endeavors: Earth Science, Heliophysics, Solar System Exploration, and Astrophysics. Goddard plays a leading role in NASA’s accomplishments by contributing compelling scientific knowledge to advance the Agency’s mission. <b>Follow us on <a href="http://twitter.com/NASAGoddardPix" rel="nofollow">Twitter</a></b> <b>Like us on <a href="http://www.facebook.com/pages/Greenbelt-MD/NASA-Goddard/395013845897?ref=tsd" rel="nofollow">Facebook</a></b> <b>Find us on <a href="http://instagrid.me/nasagoddard/?vm=grid" rel="nofollow">Instagram</a></b>
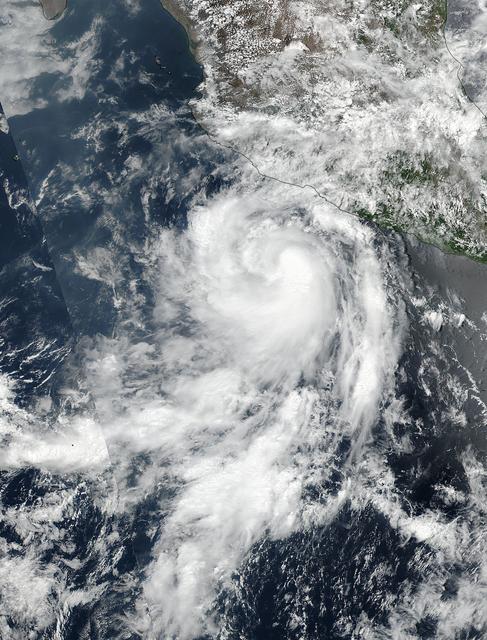
The fourth tropical cyclone of the Eastern Pacific Ocean season formed on June 25 and by June 26 it was already a hurricane. NASA-NOAA's Suomi NPP satellite passed over Dora on June 25 when it was a tropical storm and the next day it became the first hurricane of the season. Tropical Depression Dora developed around 11 p.m. EDT on Saturday, June 24 about 180 miles (290 km) south of Acapulco, Mexico. By 5 a.m. EDT on June 25, the depression had strengthened into a tropical storm and was named Dora. At 19:36 UTC (3:36 p.m. EDT), the Visible Infrared Imaging Radiometer Suite (VIIRS) instrument aboard NASA-NOAA's Suomi NPP satellite provided a visible-light image of the storm. The VIIRS imagery showed well-defined convective spiral bands of thunderstorms with a developing central dense overcast or CDO cloud feature. Seven and a half hours later, Dora showed signs of better organization. At 11 p.m. EDT, the National Hurricane Center or NHC noted "Dora's cloud pattern has continued to quickly improve this evening. Several well-defined spiral bands wrap around the center and the CDO has become more symmetric and expanded since the previous advisory." At 5 a.m. EDT on Monday, June 26, Dora became the first hurricane of the Eastern Pacific Ocean hurricane season. Satellite data indicate that maximum sustained winds have increased to near 80 mph (130 kph) with higher gusts. The NHC said the eye of Hurricane Dora was located near latitude 16.7 degrees North and longitude 105.3 degrees West. That's about 170 miles (275 km) south-southwest of Manzanillo, Mexico. Dora was moving toward the west-northwest near 13 mph (20 kph), and the NHC forecast said that general motion with some decrease in forward speed is expected over the next 48 hours. On the forecast track, the center of Dora is expected to remain offshore of the coast of southwestern Mexico. Some strengthening is likely today before weakening is forecast to begin on Tuesday, June 27. For updated forecasts, visit: <a href="http://www.nhc.noaa.gov" rel="nofollow">www.nhc.noaa.gov</a>. Credit: NASA/NOAA <b><a href="http://www.nasa.gov/audience/formedia/features/MP_Photo_Guidelines.html" rel="nofollow">NASA image use policy.</a></b> <b><a href="http://www.nasa.gov/centers/goddard/home/index.html" rel="nofollow">NASA Goddard Space Flight Center</a></b> enables NASA’s mission through four scientific endeavors: Earth Science, Heliophysics, Solar System Exploration, and Astrophysics. Goddard plays a leading role in NASA’s accomplishments by contributing compelling scientific knowledge to advance the Agency’s mission. <b>Follow us on <a href="http://twitter.com/NASAGoddardPix" rel="nofollow">Twitter</a></b> <b>Like us on <a href="http://www.facebook.com/pages/Greenbelt-MD/NASA-Goddard/395013845897?ref=tsd" rel="nofollow">Facebook</a></b> <b>Find us on <a href="http://instagrid.me/nasagoddard/?vm=grid" rel="nofollow">Instagram</a></b>
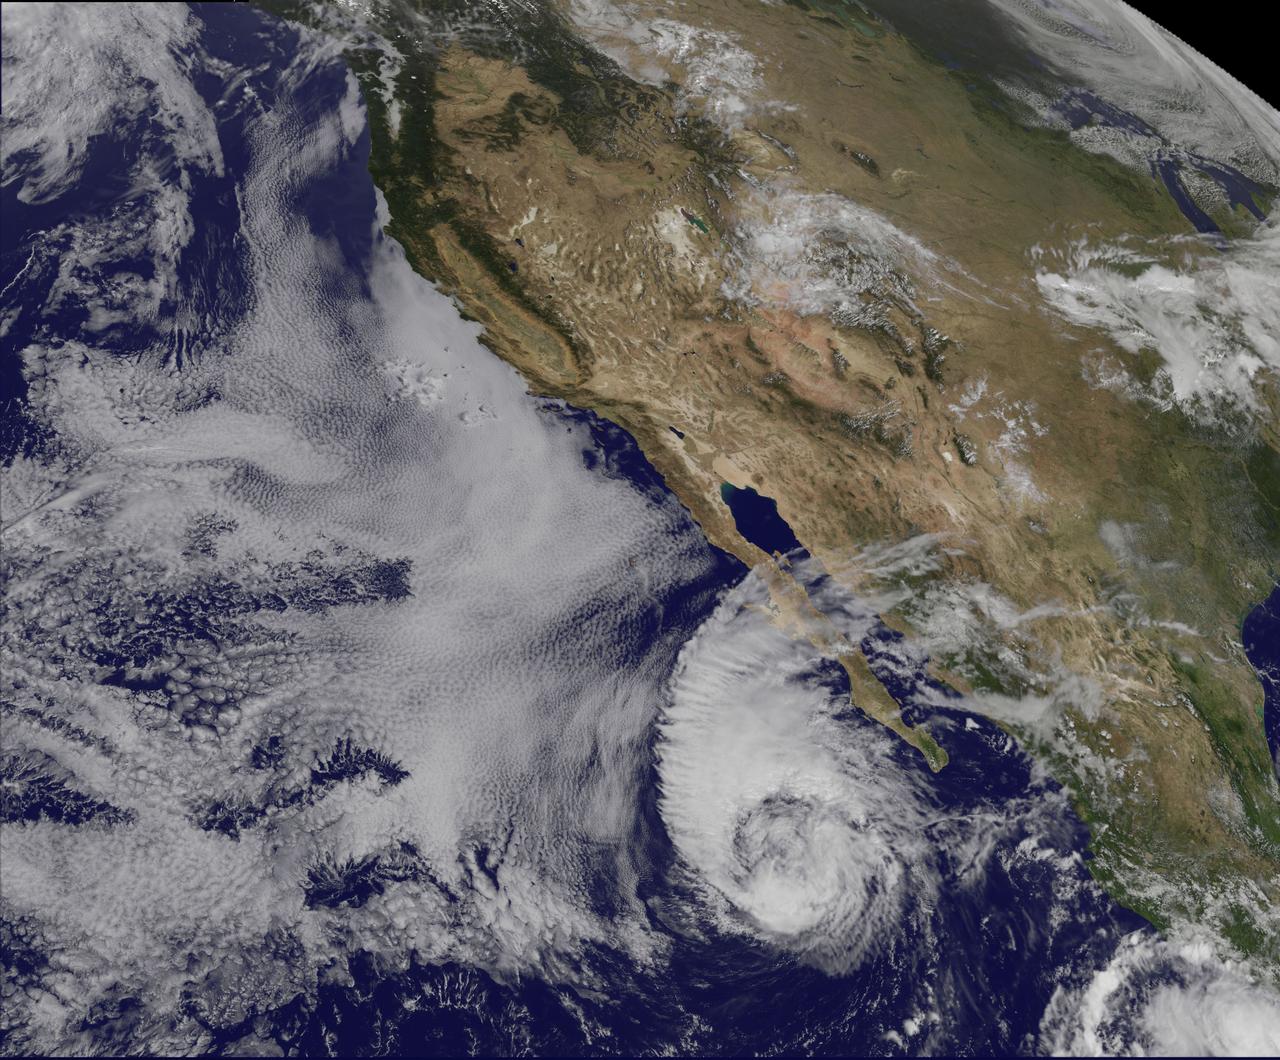
This visible image of Tropical Storm Miriam was captured by NOAA's GOES-15 satellite on Sept. 26, 2012 at 10:45 a.m. EDT off the coast of Baja California. The strongest thunderstorms were in a large band of thunderstorms north and northwest of the center. Miriam is banked to the north and west by an extensive field of stratocumulus clouds. Credit: NASA/NOAA GOES Project ---- Once a powerful hurricane, Miriam is now a tropical storm off the coast of Baja California, Mexico. Tropical Storm Miriam was seen in the Eastern Pacific Ocean by NOAA's GOES-15 satellite, and the visible image revealed that the strongest part of the storm was north and west of the center. NOAA's GOES-15 satellite sits in a fixed position over the western U.S. that allows it to monitor the Eastern Pacific Ocean and it captured a visible image of Tropical Storm Miriam on Sept. 26, 2012 at 10:45 a.m. EDT off the coast of Baja California. The strongest thunderstorms were north and northwest of the center in a large band, wrapping around the center of the tropical storm. Miriam is banked to the north and west by an extensive field of stratocumulus clouds Wind shear is taking its toll on Miriam. The National Hurricane Center noted there is an increasing "separation between the low- to mid-level centers of the storm (think of the storm as having multiple layers) due to 20-25 knots of southwesterly shear associated with a shortwave trough (elongated area of low pressure) rotating around the northwestern side of the storm. At 11 a.m. EDT on Sept. 26, Tropical Storm Miriam had maximum sustained winds near 65 mph (100 kph), dropping from 70 mph (100 kmh) just six hours before. It was located about 425 miles (680 km) west-southwest of the southern tip of Baja California Miriam was moving slowly at 6 mph (9 kmh) to the north-northwest and away from the coast. Miriam's minimum central pressure was near 992 millibars. A Miriam continues to pull away from Baja California, rough ocean swells will keep affecting the south and west coasts today, Sept. 26, and tomorrow, Sept. 27. By Sept. 28, Friday, the ocean swells will gradually begin to subside. Miriam is moving into a region where wind shear is forecast to increase and sea surface temperatures will fall. Those are two factors that will contribute to the weakening of the tropical storm over the next several days. Rob Gutro NASA's Goddard Space Flight Center Image: NASA GOES Project <b><a href="http://www.nasa.gov/audience/formedia/features/MP_Photo_Guidelines.html" rel="nofollow">NASA image use policy.</a></b> <b><a href="http://www.nasa.gov/centers/goddard/home/index.html" rel="nofollow">NASA Goddard Space Flight Center</a></b> enables NASA’s mission through four scientific endeavors: Earth Science, Heliophysics, Solar System Exploration, and Astrophysics. Goddard plays a leading role in NASA’s accomplishments by contributing compelling scientific knowledge to advance the Agency’s mission. <b>Follow us on <a href="http://twitter.com/NASA_GoddardPix" rel="nofollow">Twitter</a></b> <b>Like us on <a href="http://www.facebook.com/pages/Greenbelt-MD/NASA-Goddard/395013845897?ref=tsd" rel="nofollow">Facebook</a></b> <b>Find us on <a href="http://instagrid.me/nasagoddard/?vm=grid" rel="nofollow">Instagram</a></b>
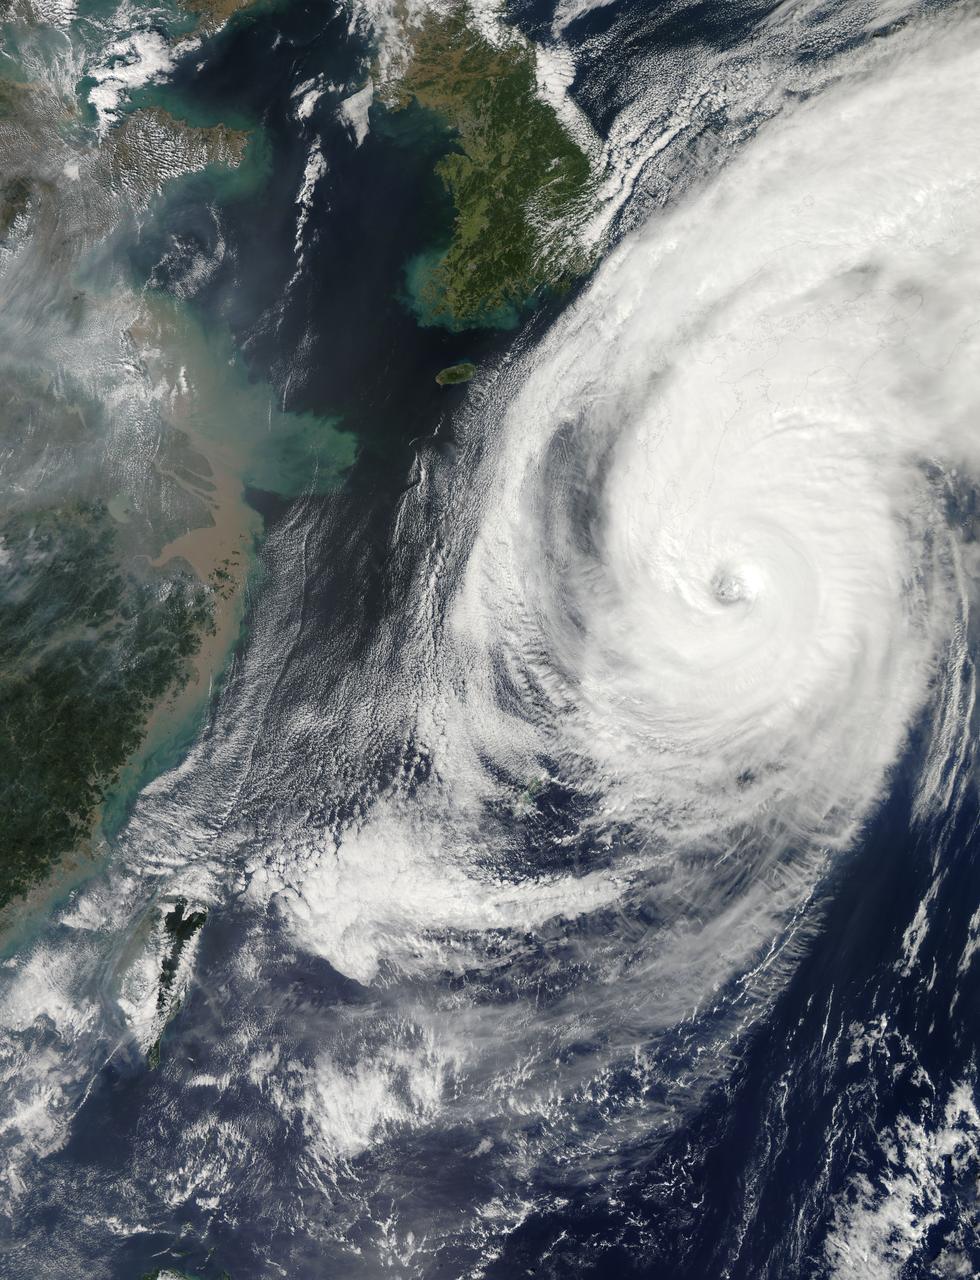
Over the weekend of Oct. 5 and 6, Typhoon Phanfone's center made landfall just south of Tokyo and passed over the city before exiting back into the Northwestern Pacific Ocean. NASA's Aqua satellite captured a picture of the typhoon as Tokyo braced for its large eye. On its way to mainland Japan, Phanfone struck Kadena Air Base on the island of Okinawa. According to the website for U.S. Air Force Kadena Air Base (<a href="http://www.kadena.af.mil" rel="nofollow">www.kadena.af.mil</a>), "One Airman is confirmed deceased and two more are missing after they were washed out to sea from the northwest coast of Okinawa at about 3:45 p.m. Oct. 5. An Airman that was found by the Japanese Coast Guard and pulled from the sea was later pronounced dead at a local hospital. HH-60s from Kadena Air Base and Japanese Coast Guard are continuing to search for the remaining two Airmen. Rough seas are complicating rescue efforts." Typhoon Phanfone's large eye made landfall near the city of Hamamatsu on Oct. 5 around 8 a.m. local time and then tracked north before turning eastward into the Pacific Ocean north of Tokyo. The MODIS instrument known as the Moderate Resolution Imaging Spectroradiometer captures amazing pictures from its orbit aboard NASA's Aqua satellite. MODIS snapped a picture of Typhoon Phanfone approaching Japan on Oct. 5 at 12:55 a.m. EDT. At that time, the Typhoon had already passed north of Okinawa, and was just south of the large island of Kyushu. The MODIS image revealed a large eye with powerful bands of thunderstorms spiraling into the center. On Oct. 6 by 0900 UTC (5 a.m. EDT), Phanfone had weakened from a typhoon to a tropical storm back over open waters of the Northwestern Pacific Ocean. Maximum sustained winds were near 60 knots (69.0 mph/111.1 kph). Phanfone was located near 38.0 north longitude and 145.0 east latitude. That's about 201 nautical miles (271 miles/372 km) south-southeast of Misawa Air Base, Japan. Phanfone was moving to the northeast at 40 knots (46 mph/74 kph). Forecasters at the Joint Typhoon Warning Center (JTWC) using animated multispectral satellite imagery noted that Phanfone is being affected by strong wind shear. The wind shear has stretched the tropical storm out, and pushed the bulk of thunderstorms northeast of the center. In addition, Phanfone has transitioned into an extra-tropical storm, which means that its core transitioned from warm to cold. JTWC called for Phanfone to continue accelerating northeastward and weaken as an extra-tropical cyclone over water. <b><a href="http://www.nasa.gov/audience/formedia/features/MP_Photo_Guidelines.html" rel="nofollow">NASA image use policy.</a></b> <b><a href="http://www.nasa.gov/centers/goddard/home/index.html" rel="nofollow">NASA Goddard Space Flight Center</a></b> enables NASA’s mission through four scientific endeavors: Earth Science, Heliophysics, Solar System Exploration, and Astrophysics. Goddard plays a leading role in NASA’s accomplishments by contributing compelling scientific knowledge to advance the Agency’s mission. <b>Follow us on <a href="http://twitter.com/NASAGoddardPix" rel="nofollow">Twitter</a></b> <b>Like us on <a href="http://www.facebook.com/pages/Greenbelt-MD/NASA-Goddard/395013845897?ref=tsd" rel="nofollow">Facebook</a></b> <b>Find us on <a href="http://instagram.com/nasagoddard?vm=grid" rel="nofollow">Instagram</a></b>
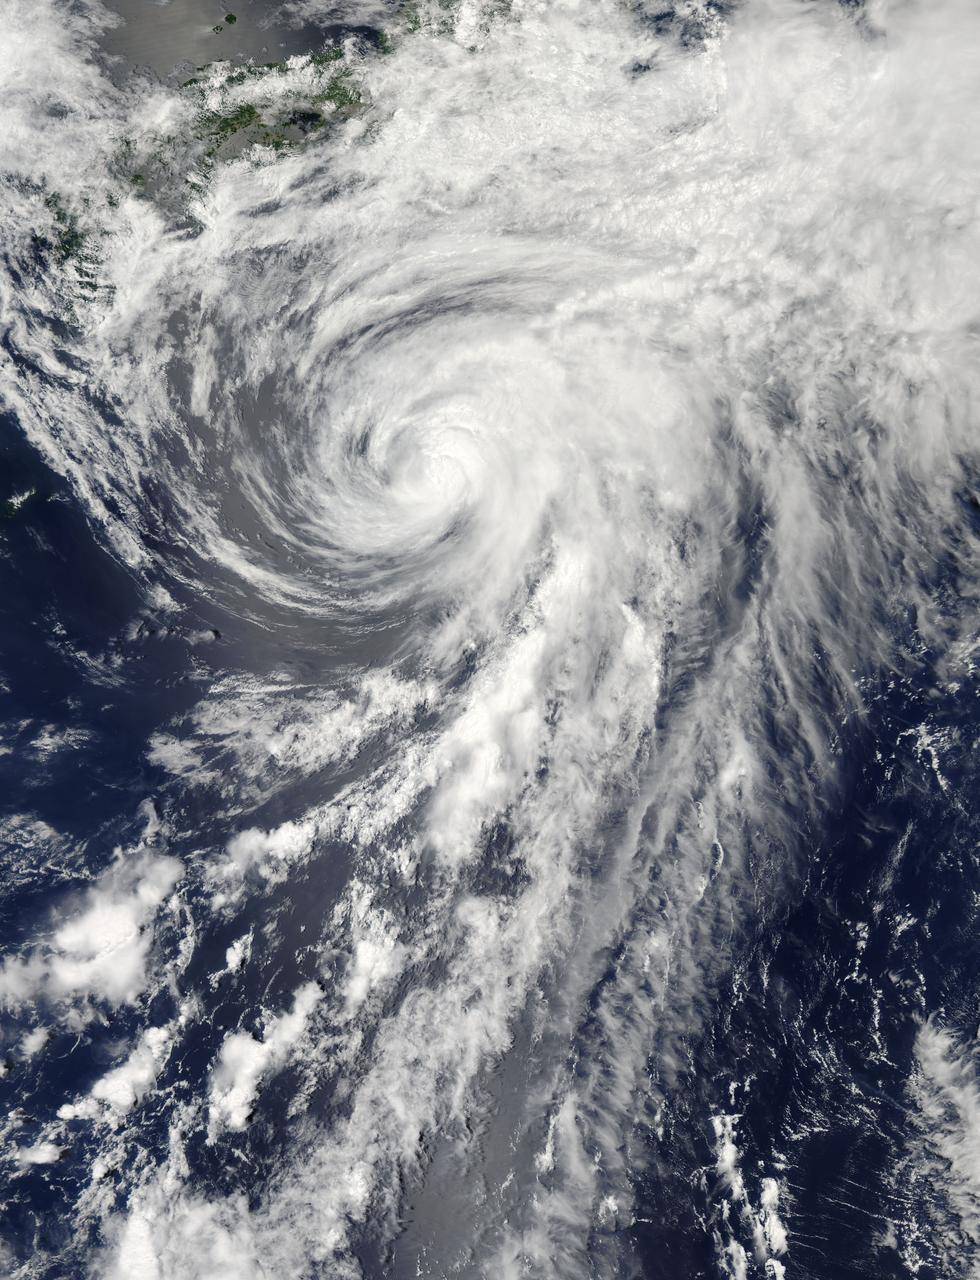
On Tuesday, June 11, 2013 Tropical Storm Yagi spun in the North Pacific Ocean just south of Japan. The Moderate Resolution Imaging Spectroradiometer (MODIS) aboard NASA’s Aqua satellite captured this beautiful true-color image of the storm on that same date at 4:10 UTC (1:10 p.m. Japan local time). The image shows a clear apostrophe-shaped cyclone, with a closed eye and somewhat elliptical shape. The clouds associated with the northern fringes of the storm draped over southeastern coastal Japan, and a long “tail” (or band) of thunderstorms fed into the center from the south. Multispectral imagery also showed tight bands of thunderstorms wrapping into the center of the storm, although the building of thunderstorms was weakening around the center. Near the same time as the image was captured, the Joint Typhoon Warning Center announced that vertical wind shear was starting to take a toll on Yagi. Northwesterly wind shear had caused the system to tilt slightly with the upper-level center displaced about 20 nautical miles east of the low-level center. Tropical Storm Yagi developed from Tropical Depression 03W in the Western North Pacific Ocean on June 6, and intensified the weekend of June 8-9, when it reached Tropical Storm status and was given the name Yagi. Also known as Dante, the storm reached the maximum wind speeds on June 10 and 11, after which it began to weaken as it moved into cooler waters. On June 14, Yagi’s remnants passed about 200 miles south of Tokyo, and brought soaking rains to the coastline of Japan’s Honshu Island. Credit: NASA/GSFC/Jeff Schmaltz/MODIS Land Rapid Response Team <b><a href="http://www.nasa.gov/audience/formedia/features/MP_Photo_Guidelines.html" rel="nofollow">NASA image use policy.</a></b> <b><a href="http://www.nasa.gov/centers/goddard/home/index.html" rel="nofollow">NASA Goddard Space Flight Center</a></b> enables NASA’s mission through four scientific endeavors: Earth Science, Heliophysics, Solar System Exploration, and Astrophysics. Goddard plays a leading role in NASA’s accomplishments by contributing compelling scientific knowledge to advance the Agency’s mission. <b>Follow us on <a href="http://twitter.com/NASA_GoddardPix" rel="nofollow">Twitter</a></b> <b>Like us on <a href="http://www.facebook.com/pages/Greenbelt-MD/NASA-Goddard/395013845897?ref=tsd" rel="nofollow">Facebook</a></b> <b>Find us on <a href="http://instagram.com/nasagoddard?vm=grid" rel="nofollow">Instagram</a></b>

Typhoon Kilo continues to thrive in the Northwestern Pacific and imagery from NASA's Terra satellite late on September 7 showed that the storm still maintained a clear eye. The MODIS or Moderate Resolution Imaging Spectroradiometer instrument that flies aboard Terra provided a visible-light image of Kilo on September 7 at 23:50 UTC (7:50 p.m. EDT). The image showed thick bands of thunderstorms wrapping around the eastern and northern quadrants of the visible eye. At 0900 UTC (5 a.m. EDT) on September 9, Typhoon Kilo had maximum sustained winds near 65 knots (74.8 mph/120.4 kph). Kilo is expected to strengthen to 75 knots (86.3 mph/ 138.9 kph) later in the day before weakening. It was centered near 26.8 North latitude and 158.5 East longitude, about 289 nautical miles northeast of Minami Tori Shima, Japan. Kilo was moving to the west-northwest at 18 knots (20.7 mph/33.3 kph). The Joint Typhoon Warning Center noted that Kilo is expected to take more of a northerly track by September 10. Thereafter, Kilo is expected to become extra-tropical and curve to the northeast near the Kuril Islands in Russia's Sakhalin Oblast region. The islands form an 808 mile (1,300 kilometer) volcanic archipelago that stretches northeast from Hokkaido, Japan, to Kamchatka, Russia. For updated watches and warnings from the Japan Meteorological Agency, visit: <a href="http://www.jma.go.jp/en/warn/" rel="nofollow">www.jma.go.jp/en/warn/</a> <b><a href="http://www.nasa.gov/audience/formedia/features/MP_Photo_Guidelines.html" rel="nofollow">NASA image use policy.</a></b> <b><a href="http://www.nasa.gov/centers/goddard/home/index.html" rel="nofollow">NASA Goddard Space Flight Center</a></b> enables NASA’s mission through four scientific endeavors: Earth Science, Heliophysics, Solar System Exploration, and Astrophysics. Goddard plays a leading role in NASA’s accomplishments by contributing compelling scientific knowledge to advance the Agency’s mission. <b>Follow us on <a href="http://twitter.com/NASAGoddardPix" rel="nofollow">Twitter</a></b> <b>Like us on <a href="http://www.facebook.com/pages/Greenbelt-MD/NASA-Goddard/395013845897?ref=tsd" rel="nofollow">Facebook</a></b> <b>Find us on <a href="http://instagrid.me/nasagoddard/?vm=grid" rel="nofollow">Instagram</a></b>
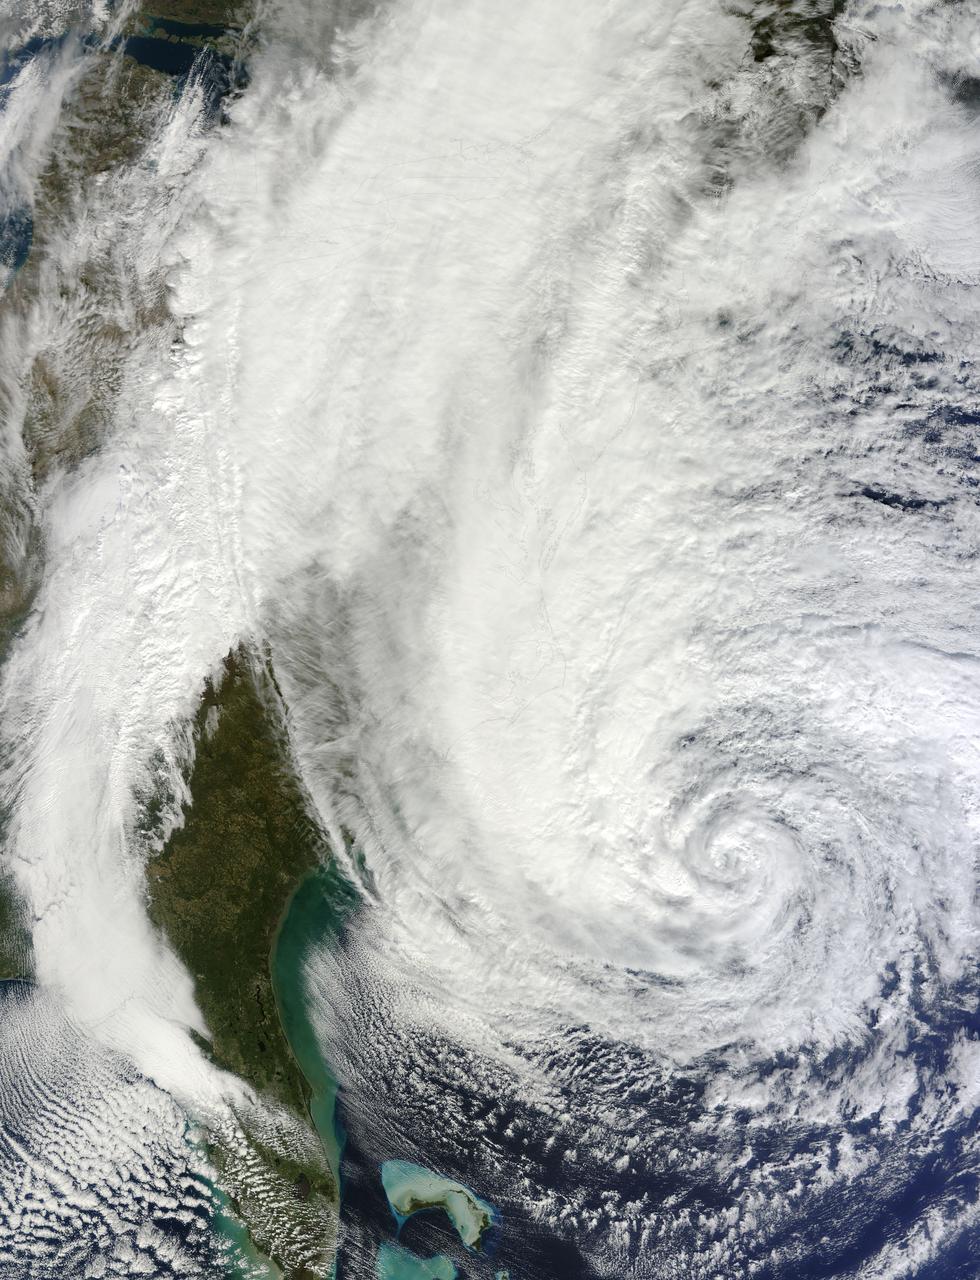
NASA image acquired acquired October 28, 2012 <b>For the latest info from NASA on Hurricane Sandy go to: <a href="http://1.usa.gov/Ti5SgS" rel="nofollow">1.usa.gov/Ti5SgS</a></b> At noon Eastern Daylight Time (16:00 Universal Time) on October 28, 2012, the Moderate Resolution Imaging Spectroradiometer (MODIS) on NASA’s Terra satellite acquired this image of Hurricane Sandy off the southeastern United States. At 11 a.m. local time (one hour before the image was captured), the U.S. National Hurricane Center reported that the storm was located at 32.5° North and 72.6° West, about 250 miles (400 kilometers) southeast of Cape Hatteras, North Carolina, and 575 miles (930 kilometers) south of New York City. Maximum sustained winds were 75 miles (120 kilometers) per hour, and the central pressure was 951 millibars (28.08 inches). Forecasters predicted that the storm would continue heading north-northeast until the morning of October and then take a hard turn to the northwest into the coastaline of Delaware, New Jersey, or New York. The wind field from the storm was said to stretch 500 to 700 miles and was likely to affect an area from South Carolina to Maine, and as far inland as the Great Lakes. The storm has already caused significant damage in the Bahamas, Cuba, Jamaica, Puerto Rico, the Dominican Republic, and Haiti; at least 65 lives have been lost to the storm. NASA image courtesy LANCE MODIS Rapid Response Team at NASA GSFC. Caption by Michael Carlowicz. Instrument: Terra - MODIS Credit: <b><a href="http://www.earthobservatory.nasa.gov/" rel="nofollow"> NASA Earth Observatory</a></b> <b><a href="http://www.nasa.gov/audience/formedia/features/MP_Photo_Guidelines.html" rel="nofollow">NASA image use policy.</a></b> <b><a href="http://www.nasa.gov/centers/goddard/home/index.html" rel="nofollow">NASA Goddard Space Flight Center</a></b> enables NASA’s mission through four scientific endeavors: Earth Science, Heliophysics, Solar System Exploration, and Astrophysics. Goddard plays a leading role in NASA’s accomplishments by contributing compelling scientific knowledge to advance the Agency’s mission. <b>Follow us on <a href="http://twitter.com/NASA_GoddardPix" rel="nofollow">Twitter</a></b> <b>Like us on <a href="http://www.facebook.com/pages/Greenbelt-MD/NASA-Goddard/395013845897?ref=tsd" rel="nofollow">Facebook</a></b> <b>Find us on <a href="http://instagrid.me/nasagoddard/?vm=grid" rel="nofollow">Instagram</a></b>
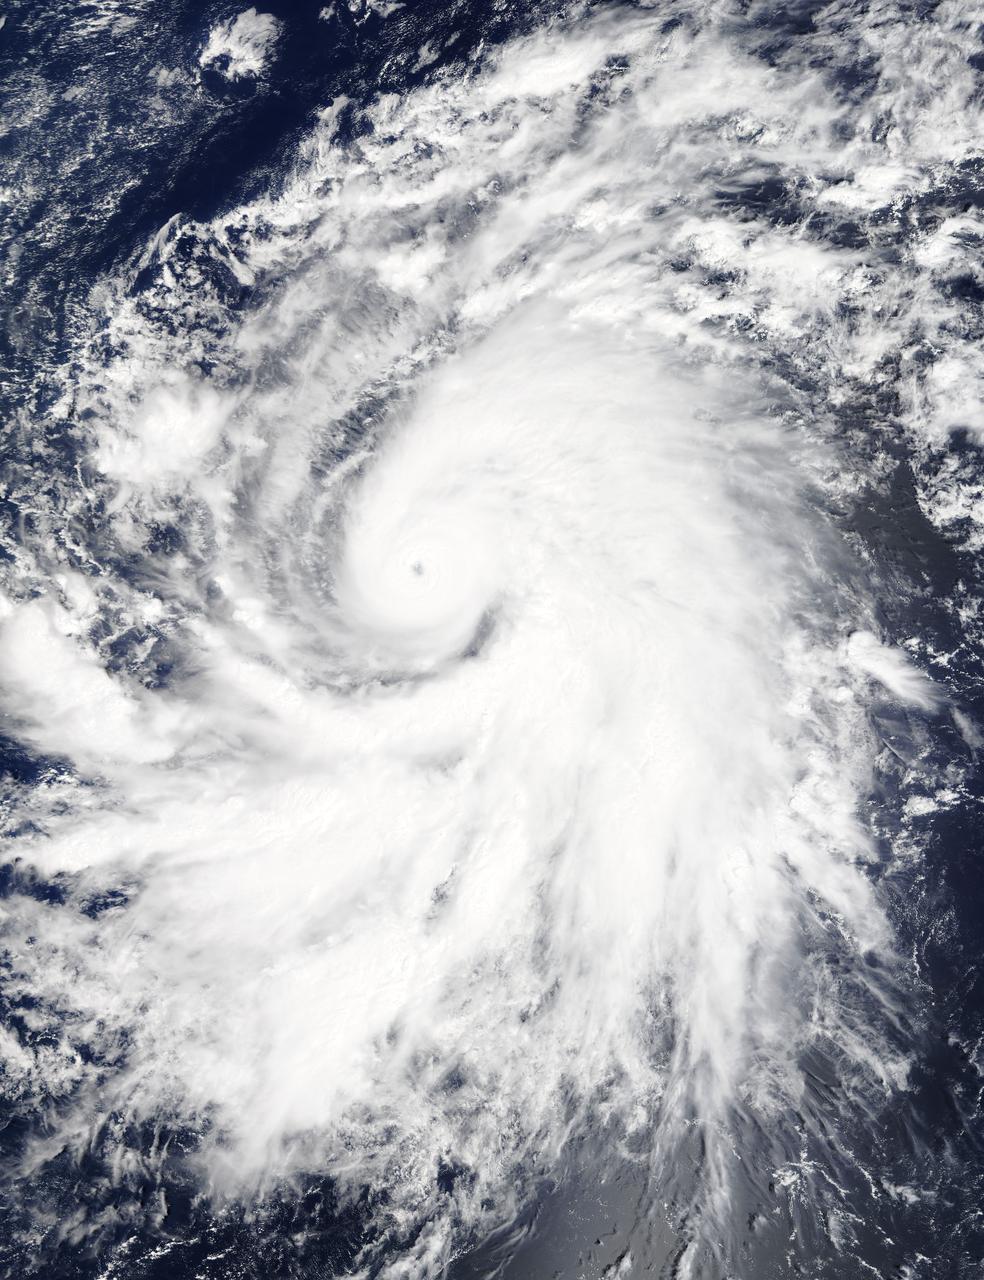
On Oct. 19 at 19:35 UTC (3:35 p.m. EDT) the MODIS instrument aboard NASA's Terra satellite saw Hurricane Olaf moving into the central Pacific Ocean with a visible eye. Powerful thunderstorms circled the eye and extended in a thick band in the eastern quadrant from north to south. At 5 a.m. EDT (0900 UTC) on Oct. 20, Hurricane Olaf's center was located near latitude 10.3 north and longitude 140.4 west. That's about 1,175 miles (1,890 km) east-southeast of Hilo, Hawaii. Despite being so far from Hawaii and because Olaf is a powerful hurricane, large swells generated by Olaf will begin to arrive along east facing shores of the main Hawaiian Islands over the next couple of days. The CPHC said that resultant surf will be large...potentially life-threatening and damaging. Olaf is moving toward the west-northwest near 10 mph (17 kph) and the Central Pacific Hurricane Center (CPHC), who has taken over forecast responsibilities now that Olaf has crossed the 140 degree longitude line, expects Olaf to turn toward the west-northwest and then northwest by October 21. Maximum sustained winds are near 150 mph (240 kph). Olaf is a category four hurricane on the Saffir-Simpson Hurricane wind scale. Some additional strengthening is forecast on Tuesday, Oct. 20 and fluctuations in intensity are possible Tuesday night and Wednesday. The estimated minimum central pressure is 938 millibars. Olaf is expected to remain a major hurricane for the next couple of days and begin curving to the northeast and away from Hawaii by Friday, October 23. For updates, visit: <a href="http://www.prh.noaa.gov/cphc" rel="nofollow">www.prh.noaa.gov/cphc</a>. Credit: NASA Goddard's MODIS Rapid Response Team <b><a href="http://www.nasa.gov/audience/formedia/features/MP_Photo_Guidelines.html" rel="nofollow">NASA image use policy.</a></b> <b><a href="http://www.nasa.gov/centers/goddard/home/index.html" rel="nofollow">NASA Goddard Space Flight Center</a></b> enables NASA’s mission through four scientific endeavors: Earth Science, Heliophysics, Solar System Exploration, and Astrophysics. Goddard plays a leading role in NASA’s accomplishments by contributing compelling scientific knowledge to advance the Agency’s mission. <b>Follow us on <a href="http://twitter.com/NASAGoddardPix" rel="nofollow">Twitter</a></b> <b>Like us on <a href="http://www.facebook.com/pages/Greenbelt-MD/NASA-Goddard/395013845897?ref=tsd" rel="nofollow">Facebook</a></b> <b>Find us on <a href="http://instagrid.me/nasagoddard/?vm=grid" rel="nofollow">Instagram</a></b>

Composite image of category 5 Hurricane Patricia, off the Pacific coast of Mexico, from 06:00 UTC on Friday, 23 October 2015. At 8 a.m. EDT on October 23, 2015, the National Hurricane Center said that Hurricane Patricia had grown into a monster hurricane. In fact, it is the strongest eastern north pacific hurricane on record. At 8 a.m. EDT (1200 UTC) on Oct. 23, the eye of Hurricane Patricia was located near latitude 17.3 North, longitude 105.6 West. That's about 145 miles (235 km) southwest of Manzanillo, Mexico and about 215 miles (345 km) south of Cabo Corrientes, Mexico. Patricia was moving toward the north-northwest near 12 mph (19 kph) and a turn toward the north is expected later this morning, followed by a turn toward the north-northeast this afternoon. On the forecast track, the core of Patricia will make landfall in the hurricane warning area today, October 23, 2015 during the afternoon or evening. Maximum sustained winds remain near 200 mph (325 kph) with higher gusts. The National Hurricane Center (NHC) said that Patricia is a category 5 hurricane on the Saffir-Simpson Hurricane Wind Scale. Some fluctuations in intensity are possible today, but Patricia is expected to remain an extremely dangerous category 5 hurricane through landfall. Hurricane force winds extend outward up to 30 miles (45 km) from the center and tropical storm force winds extend outward up to 175 miles (280 km). The estimated minimum central pressure is 880 millibars. Copyright: 2015 EUMETSAT. Infrared data from the geostationary satellites of EUMETSAT and NOAA overlays a computer-generated model of the Earth, containing NASA's Blue Marble Next Generation imagery <b><a href="http://www.nasa.gov/audience/formedia/features/MP_Photo_Guidelines.html" rel="nofollow">NASA image use policy.</a></b> <b><a href="http://www.nasa.gov/centers/goddard/home/index.html" rel="nofollow">NASA Goddard Space Flight Center</a></b> enables NASA’s mission through four scientific endeavors: Earth Science, Heliophysics, Solar System Exploration, and Astrophysics. Goddard plays a leading role in NASA’s accomplishments by contributing compelling scientific knowledge to advance the Agency’s mission. <b>Follow us on <a href="http://twitter.com/NASAGoddardPix" rel="nofollow">Twitter</a></b> <b>Like us on <a href="http://www.facebook.com/pages/Greenbelt-MD/NASA-Goddard/395013845897?ref=tsd" rel="nofollow">Facebook</a></b> <b>Find us on <a href="http://instagrid.me/nasagoddard/?vm=grid" rel="nofollow">Instagram</a></b>
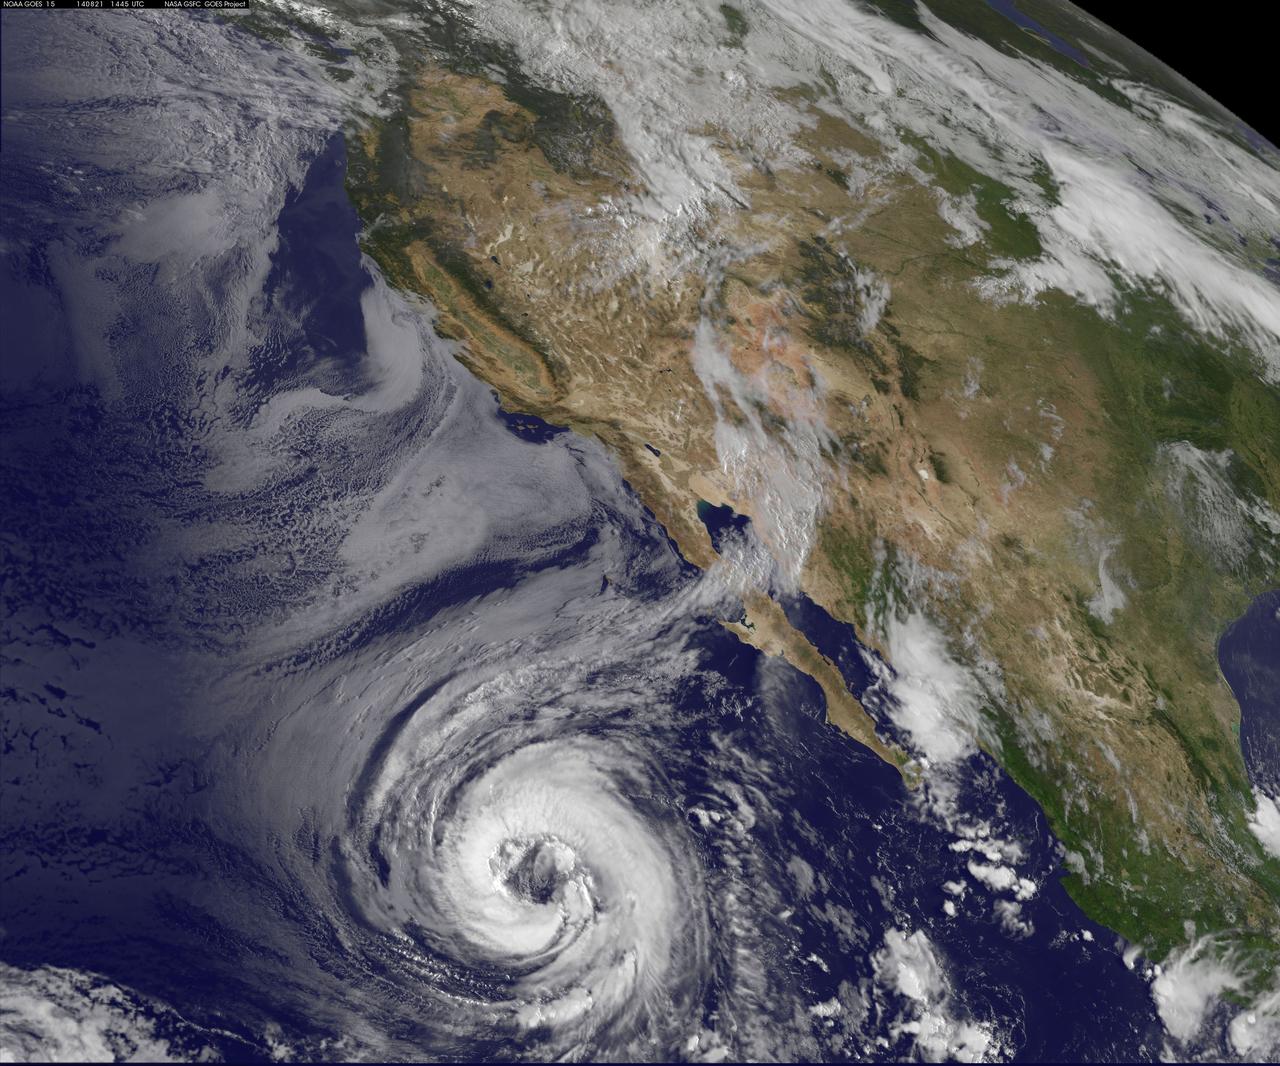
NOAA's GOES-West satellite watched as Tropical Storm Lowell strengthened into a large hurricane during the morning of August 21 and opened its eye. Hurricane force winds extend outward up to 60 miles (95 km) from the center, while tropical storm force winds extend outward up to 185 miles (295 km). The storm stretches over a greater distance. Lowell became the seventh hurricane of the Eastern Pacific Ocean season today, August 21 at 11 a.m. EDT (1500 UTC). Maximum sustained winds had increased to 75 mph (120 kph) making Lowell a Category One hurricane on the Saffir-Simpson Wind Scale. Little change in intensity is forecast by the National Hurricane Center (NHC) today, and NHC forecasters expect a slow weakening trend later today through August 22. It was centered near latitude 20.0 north and longitude 122.1 west, about 810 miles (1,300 km) west-southwest of the southern tip of Baja California, Mexico. It is moving to the northwest near 3 mph (4 kph) and is expected to move faster in that direction over the next two days. The NHC said that Lowell should begin to slowly weaken by August 22 as it moves over progressively cooler waters and into a drier and more stable air mass. Since Lowell is such a large cyclone, it will likely take longer than average to spin down. The GOES-West image of Lowell was created at the NASA/NOAA GOES Project, located at NASA's Goddard Space Flight Center in Greenbelt, Maryland. Rob Gutro NASA's Goddard Space Flight Center <b><a href="http://goes.gsfc.nasa.gov/" rel="nofollow">Credit: NOAA/NASA GOES Project</a></b> <b><a href="http://www.nasa.gov/audience/formedia/features/MP_Photo_Guidelines.html" rel="nofollow">NASA image use policy.</a></b> <b><a href="http://www.nasa.gov/centers/goddard/home/index.html" rel="nofollow">NASA Goddard Space Flight Center</a></b> enables NASA’s mission through four scientific endeavors: Earth Science, Heliophysics, Solar System Exploration, and Astrophysics. Goddard plays a leading role in NASA’s accomplishments by contributing compelling scientific knowledge to advance the Agency’s mission. <b>Follow us on <a href="http://twitter.com/NASAGoddardPix" rel="nofollow">Twitter</a></b> <b>Like us on <a href="http://www.facebook.com/pages/Greenbelt-MD/NASA-Goddard/395013845897?ref=tsd" rel="nofollow">Facebook</a></b> <b>Find us on <a href="http://instagram.com/nasagoddard?vm=grid" rel="nofollow">Instagram</a></b>
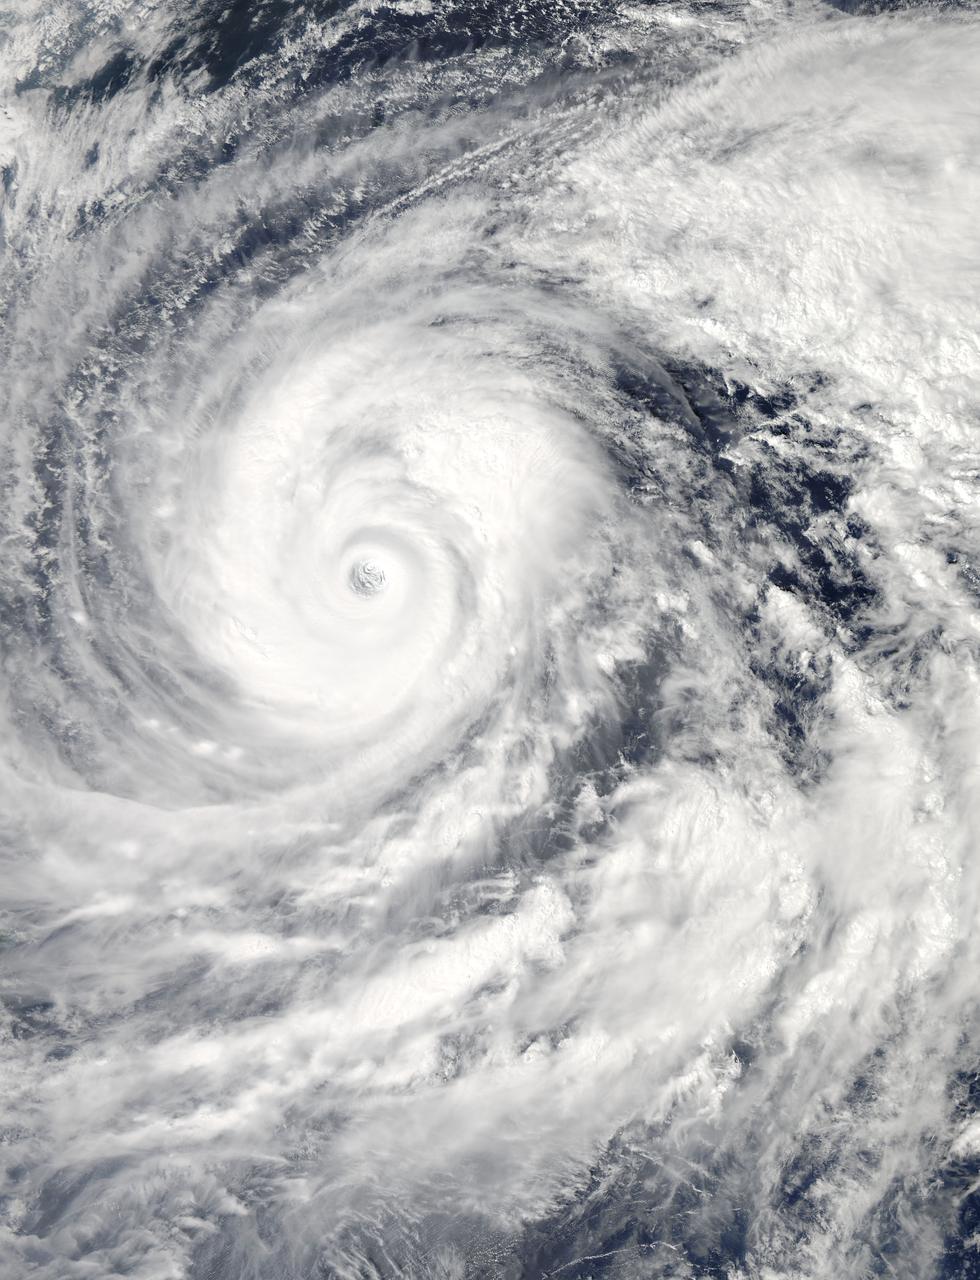
The MODIS instrument aboard NASA's Aqua satellite captured this visible image of Super Typhoon Vongfong on Oct. 9 at 04:25 UTC (12:25 a.m. EDT as it moved north through the Philippine Sea. Credit: NASA Goddard MODIS Rapid Response Team --- Vongfong weakened to a Category 4 typhoon on the Saffir-Simpson scale on Thursday, October 9, with maximum sustained winds near 130 knots (149.6 mph/240.8 kph), down from a Category 5 typhoon on Oct. 8. Forecasters at the Joint Typhoon Warning Center predict slow weakening over the next several days. Vongfong was centered near 20.6 north and 129.5 east, about 384 nautical miles south-southeast of Kadena Air Base, Okinawa, Japan. It is moving to the north-northwest at 7 knots (8 mph/12.9 kph) and generating 44 foot (13.4 meter) high seas. For warnings and watches, visit the Japan Meteorological Agency website at: <a href="http://www.jma.go.jp/en/typh/" rel="nofollow">www.jma.go.jp/en/typh/</a>. Vongfong is forecast to continue moving north through the Philippine Sea and is expected to pass just to the east of Kadena Air Base, then track over Amami Oshima before making landfall in Kyushu and moving over the other three big islands of Japan. Residents of all of these islands should prepare for typhoon conditions beginning on October 10. Read more: <a href="http://1.usa.gov/1s0CCQy" rel="nofollow">1.usa.gov/1s0CCQy</a> <b><a href="http://www.nasa.gov/audience/formedia/features/MP_Photo_Guidelines.html" rel="nofollow">NASA image use policy.</a></b> <b><a href="http://www.nasa.gov/centers/goddard/home/index.html" rel="nofollow">NASA Goddard Space Flight Center</a></b> enables NASA’s mission through four scientific endeavors: Earth Science, Heliophysics, Solar System Exploration, and Astrophysics. Goddard plays a leading role in NASA’s accomplishments by contributing compelling scientific knowledge to advance the Agency’s mission. <b>Follow us on <a href="http://twitter.com/NASAGoddardPix" rel="nofollow">Twitter</a></b> <b>Like us on <a href="http://www.facebook.com/pages/Greenbelt-MD/NASA-Goddard/395013845897?ref=tsd" rel="nofollow">Facebook</a></b> <b>Find us on <a href="http://instagram.com/nasagoddard?vm=grid" rel="nofollow">Instagram</a></b>
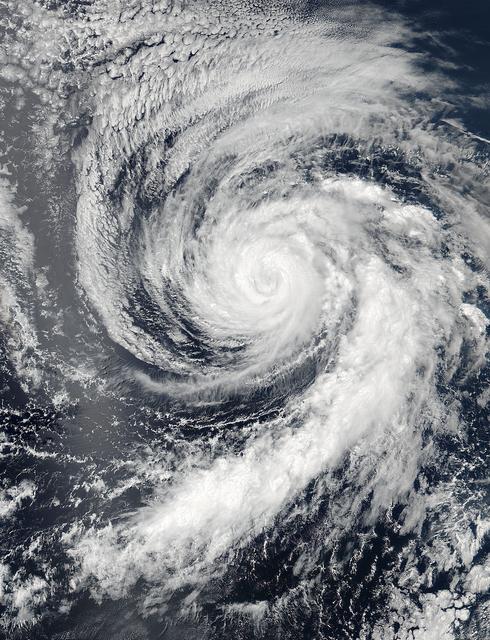
Hurricane Celia is currently in the Eastern Pacific Ocean, but once it passes west of 140 degrees west longitude, warnings on the system will be issued by NOAA's Central Pacific Hurricane Center. On July 11 at 22:05 UTC (6:05 p.m. EDT) the Visible Infrared Imaging Radiometer Suite (VIIRS) instrument aboard NASA-NOAA-DOD's Suomi NPP satellite captured a visible light image of Hurricane Celia that showed a cloud-filled eye with powerful bands of thunderstorms wrapping around the low level center. The VIIRS image also showed a large band of thunderstorms that extended to the south, wrapping into the storms' eastern quadrant. At 5 a.m. EDT (0900 UTC) on July 12 the center of Hurricane Celia was located near 16.2 north latitude and 127.9 west longitude. That's about 1,260 miles (2,025 km) west-southwest of the southern tip of Baja California, Mexico. It was moving to the west-northwest at 10 mph (17 kph) and NOAA's National Hurricane Center (NHC) expects Celia to turn toward the northwest later today, with this motion continuing Tuesday night and Wednesday. Maximum sustained winds were near 100 mph (155 kph). NHC forecasts weakening over the next two days and Celia could weaken to a tropical storm on Wednesday. Read more: NASA Sees Hurricane Celia Headed for Central Pacific Credit: NASA/Goddard/Jeff Schmaltz/MODIS Land Rapid Response Team <b><a href="http://www.nasa.gov/audience/formedia/features/MP_Photo_Guidelines.html" rel="nofollow">NASA image use policy.</a></b> <b><a href="http://www.nasa.gov/centers/goddard/home/index.html" rel="nofollow">NASA Goddard Space Flight Center</a></b> enables NASA’s mission through four scientific endeavors: Earth Science, Heliophysics, Solar System Exploration, and Astrophysics. Goddard plays a leading role in NASA’s accomplishments by contributing compelling scientific knowledge to advance the Agency’s mission. <b>Follow us on <a href="http://twitter.com/NASAGoddardPix" rel="nofollow">Twitter</a></b> <b>Like us on <a href="http://www.facebook.com/pages/Greenbelt-MD/NASA-Goddard/395013845897?ref=tsd" rel="nofollow">Facebook</a></b> <b>Find us on <a href="http://instagrid.me/nasagoddard/?vm=grid" rel="nofollow">Instagram</a></b>
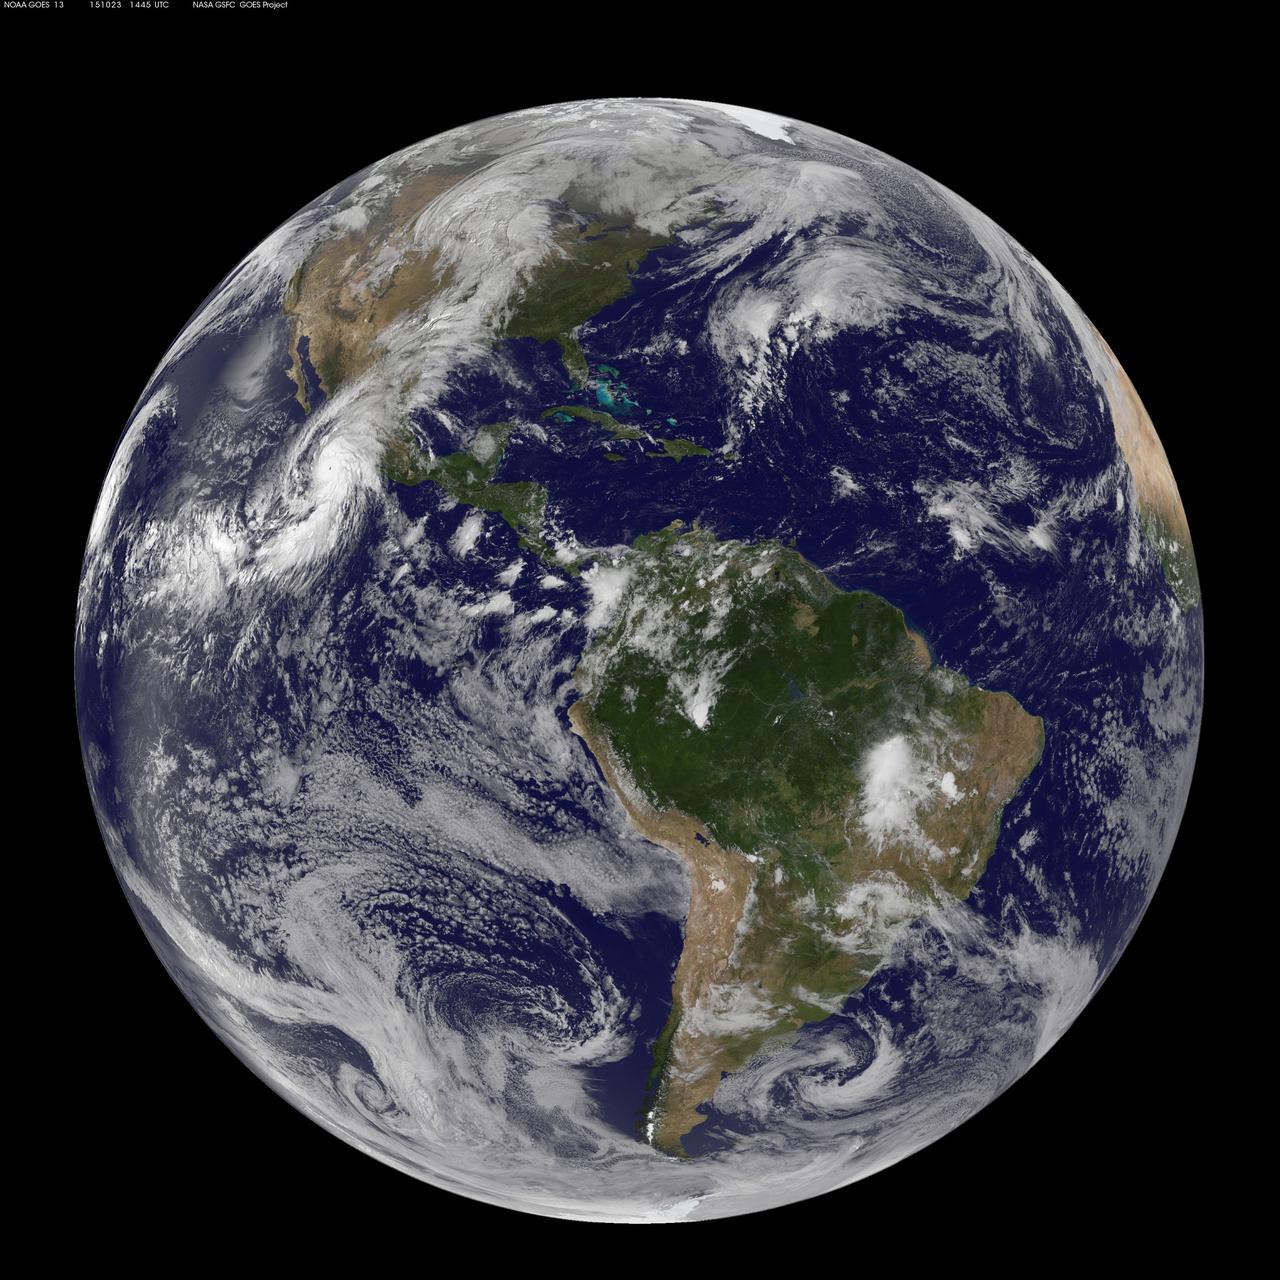
This full-disk image from NOAA’s GOES-13 satellite was captured at 14:45 UTC (10:45 a.m. EDT) and shows Hurricane Patricia off the coast of Mexico on September 23, 2015. At 8 a.m. EDT on October 23, 2015, the National Hurricane Center said that Hurricane Patricia had grown into a monster hurricane. In fact, it is the strongest eastern north pacific hurricane on record. At 8 a.m. EDT (1200 UTC) on Oct. 23, the eye of Hurricane Patricia was located near latitude 17.3 North, longitude 105.6 West. That's about 145 miles (235 km) southwest of Manzanillo, Mexico and about 215 miles (345 km) south of Cabo Corrientes, Mexico. Patricia was moving toward the north-northwest near 12 mph (19 kph) and a turn toward the north is expected later this morning, followed by a turn toward the north-northeast this afternoon. On the forecast track, the core of Patricia will make landfall in the hurricane warning area today, October 23, 2015 during the afternoon or evening. Maximum sustained winds remain near 200 mph (325 kph) with higher gusts. The National Hurricane Center (NHC) said that Patricia is a category 5 hurricane on the Saffir-Simpson Hurricane Wind Scale. Some fluctuations in intensity are possible today, but Patricia is expected to remain an extremely dangerous category 5 hurricane through landfall. Hurricane force winds extend outward up to 30 miles (45 km) from the center and tropical storm force winds extend outward up to 175 miles (280 km). The estimated minimum central pressure is 880 millibars. <b><a href="http://www.nasa.gov/audience/formedia/features/MP_Photo_Guidelines.html" rel="nofollow">NASA image use policy.</a></b> <b><a href="http://www.nasa.gov/centers/goddard/home/index.html" rel="nofollow">NASA Goddard Space Flight Center</a></b> enables NASA’s mission through four scientific endeavors: Earth Science, Heliophysics, Solar System Exploration, and Astrophysics. Goddard plays a leading role in NASA’s accomplishments by contributing compelling scientific knowledge to advance the Agency’s mission. <b>Follow us on <a href="http://twitter.com/NASAGoddardPix" rel="nofollow">Twitter</a></b> <b>Like us on <a href="http://www.facebook.com/pages/Greenbelt-MD/NASA-Goddard/395013845897?ref=tsd" rel="nofollow">Facebook</a></b> <b>Find us on <a href="http://instagrid.me/nasagoddard/?vm=grid" rel="nofollow">Instagram</a></b>

NASA image acquired January 28, 2011 High res file here: <a href="http://www.flickr.com/photos/gsfc/5400445475">www.flickr.com/photos/gsfc/5400445475</a> Tropical Cyclone Bianca continued moving southward along the coast of Western Australia on January 28, 2011. At 5:00 a.m. on January 28 local time (21:00 UTC on January 27), the U.S. Navy’s Joint Typhoon Warning Center (JTWC) reported that Bianca was located about 135 nautical miles (250 kilometers) west of Learmonth, Western Australia. The storm had maximum sustained winds of 90 knots (165 kilometers per hour) and gusts up to 110 knots (205 kilometers per hour), having intensified over the previous day. The Moderate Resolution Imaging Spectroradiometer (MODIS) on NASA’s Aqua satellite captured this natural-color image at 2:30 p.m. Western Australia time (6:30 UTC) on January 28, 2011. Bianca spans hundreds of kilometers, and the storm’s eye appears west-southwest of Learmonth. The JTWC forecast that Bianca would continue strengthening for about 12 more hours then begin to weaken, thanks to reduced sea surface temperatures and increased vertical wind shear. NASA image by Jeff Schmaltz, MODIS Rapid Response Team at NASA GSFC. Caption by Michon Scott. Instrument: Aqua - MODIS To view more images of this event go to: <a href="http://earthobservatory.nasa.gov/NaturalHazards/event.php?id=48914" rel="nofollow">earthobservatory.nasa.gov/NaturalHazards/event.php?id=48914</a> Credit: <b><a href="http://www.earthobservatory.nasa.gov/" rel="nofollow"> NASA Earth Observatory</a></b> <b><a href="http://www.nasa.gov/centers/goddard/home/index.html" rel="nofollow">NASA Goddard Space Flight Center</a></b> enables NASA’s mission through four scientific endeavors: Earth Science, Heliophysics, Solar System Exploration, and Astrophysics. Goddard plays a leading role in NASA’s accomplishments by contributing compelling scientific knowledge to advance the Agency’s mission. <b>Follow us on <a href="http://twitter.com/NASA_GoddardPix" rel="nofollow">Twitter</a></b> <b>Join us on <a href="http://www.facebook.com/pages/Greenbelt-MD/NASA-Goddard/395013845897?ref=tsd" rel="nofollow">Facebook</a></b>

Typhoon Chan-Hom's eye was visible from space when NASA's Aqua satellite passed overhead early on July 8, 2015. The MODIS instrument, known as the Moderate Resolution Imaging Spectrometer, flies aboard NASA's Aqua satellite. When Aqua passed over Typhoon Chan-Hom on July 8 at 04:25 UTC (12:25 a.m. EDT), MODIS captured a visible-light image of the storm that clearly showed its eye. The MODIS image also a ring of powerful thunderstorms surrounding the eye of the storm, and the bulk of thunderstorms wrapping around the system from west to east, along the southern side. At 0900 UTC (5 a.m. EDT), Typhoon Chan-Hom's maximum sustained winds were near 85 knots (97.8 mph/157.4 kph). Tropical-storm-force winds extended 145 nautical miles (166.9 miles/268.5 km) from the center, making the storm almost 300 nautical miles (345 miles/555 km) in diameter. Typhoon-force winds extended out to 35 nautical miles (40 miles/64.8 km) from the center. Chan-Hom's eye was centered near 20.5 North latitude and 132.7 East longitude, about 450 nautical miles (517.9 miles/833.4 km) southeast of Kadena Air Base, Iwo To, Japan. Chan-Hom was moving to the northwest at 11 knots (12.6 mph/20.3 kph). The typhoon was generating very rough seas with wave heights to 28 feet (8.5 meters). The Joint Typhoon Warning Center expects Chan-Hom to continue tracking northwestward over the next three days under the steering influence of a sub-tropical ridge (elongated area of high pressure). Chan-Hom is expected to intensify steadily peaking at 120 knots (138.1 mph/222.2 kph) on July 10. The JTWC forecast predicts that Chan-Hom will make landfall near Wenzhou, Zhejiang, China and begin decaying due to land interaction. For updated warnings and watches from China's National Meteorological Centre, visit: <a href="http://www.cma.gov.cn/en/WeatherWarnings/" rel="nofollow">www.cma.gov.cn/en/WeatherWarnings/</a>. Credit: NASA/GSFC/Jeff Schmaltz/MODIS Land Rapid Response Team b><a href="http://www.nasa.gov/audience/formedia/features/MP_Photo_Guidelines.html" rel="nofollow">NASA image use policy.</a> <b><a href="http://www.nasa.gov/centers/goddard/home/index.html" rel="nofollow">NASA Goddard Space Flight Center</a></b> enables NASA’s mission through four scientific endeavors: Earth Science, Heliophysics, Solar System Exploration, and Astrophysics. Goddard plays a leading role in NASA’s accomplishments by contributing compelling scientific knowledge to advance the Agency’s mission. <b>Follow us on <a href="http://twitter.com/NASAGoddardPix" rel="nofollow">Twitter</a></b> <b>Like us on <a href="http://www.facebook.com/pages/Greenbelt-MD/NASA-Goddard/395013845897?ref=tsd" rel="nofollow">Facebook</a></b> <b>Find us on <a href="http://instagrid.me/nasagoddard/?vm=grid" rel="nofollow">Instagram</a></b>
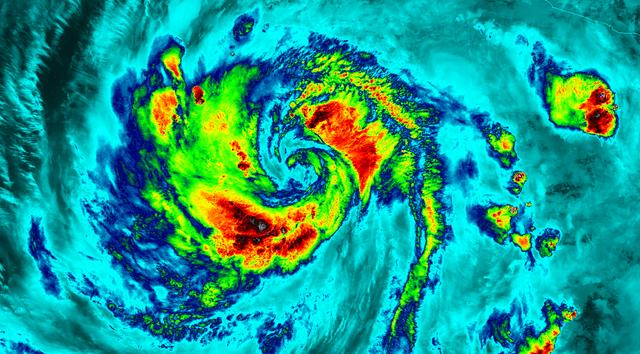
NASA-NOAA's Suomi NPP satellite flew over Hurricane Blanca in the Eastern Pacific Ocean and gathered infrared data on the storm that was false-colored to show locations of the strongest thunderstorms within the storm. The Visible Infrared Imaging Radiometer Suite or VIIRS instrument aboard the satellite gathered infrared data of the storm that was made into an image at the University of Wisconsin-Madison. The image was false-colored to show temperature. Coldest cloud top temperatures indicate higher, stronger, thunderstorms within a tropical cyclone. Those are typically the strongest storms with potential for heavy rainfall. VIIRS is a scanning radiometer that collects visible and infrared imagery and "radiometric" measurements. Basically it means that VIIRS data is used to measure cloud and aerosol properties, ocean color, sea and land surface temperature, ice motion and temperature, fires, and Earth's albedo (reflected light). The VIIRS image from June 5 at 8:11 UTC (4:11 a.m. EDT) showed two areas of coldest cloud top temperatures and strongest storms were west-southwest and east-northeast of the center of Blanca's circulation center. On June 5 at 5 a.m. EDT (0900 UTC) Blanca's maximum sustained winds were near 105 mph (165 kph) with higher gusts. The National Hurricane Center (NHC) forecast expects some strengthening during the next day or so. Weakening is forecast to begin by late Saturday. At that time, NHC placed the center of Hurricane Blanca near latitude 14.3 North, longitude 106.2 West. That puts the center about 350 miles (560 km) south-southwest of Manzanillo, Mexico and about 640 miles (1,030 km) south-southeast of Cabo San Lucas, Mexico. The estimated minimum central pressure is 968 millibars (28.59 inches). Blanca is moving toward the northwest near 10 mph (17 kph). A northwestward to north-northwestward motion at a similar forward speed is expected to continue through Saturday night. Blanca has been stirring up surf along the coast of southwestern Mexico and will reach the Pacific coast of the Baja California peninsula and the southern Gulf of California later today, June 5. These swells are likely to cause life-threatening surf and rip current conditions. On the forecast track, the center of Blanca will approach the southern Baja California peninsula on Sunday. NHC cautions that "Interests in the southern Baja California peninsula should monitor the progress of Blanca. A tropical storm or hurricane watch will likely be required for a portion of Baja California Sur later today." The NHC forecast track shows Blanca making landfall in the southeastern tip of Baja California on Sunday, June 7 and tracking north-northeast along the Baja California peninsula, for several days following. Image credit: Credits: NASA/NOAA/UW-CIMSS <b><a href="http://www.nasa.gov/audience/formedia/features/MP_Photo_Guidelines.html" rel="nofollow">NASA image use policy.</a></b> <b><a href="http://www.nasa.gov/centers/goddard/home/index.html" rel="nofollow">NASA Goddard Space Flight Center</a></b> enables NASA’s mission through four scientific endeavors: Earth Science, Heliophysics, Solar System Exploration, and Astrophysics. Goddard plays a leading role in NASA’s accomplishments by contributing compelling scientific knowledge to advance the Agency’s mission. <b>Follow us on <a href="http://twitter.com/NASAGoddardPix" rel="nofollow">Twitter</a></b> <b>Like us on <a href="http://www.facebook.com/pages/Greenbelt-MD/NASA-Goddard/395013845897?ref=tsd" rel="nofollow">Facebook</a></b> <b>Find us on <a href="http://instagrid.me/nasagoddard/?vm=grid" rel="nofollow">Instagram</a></b>
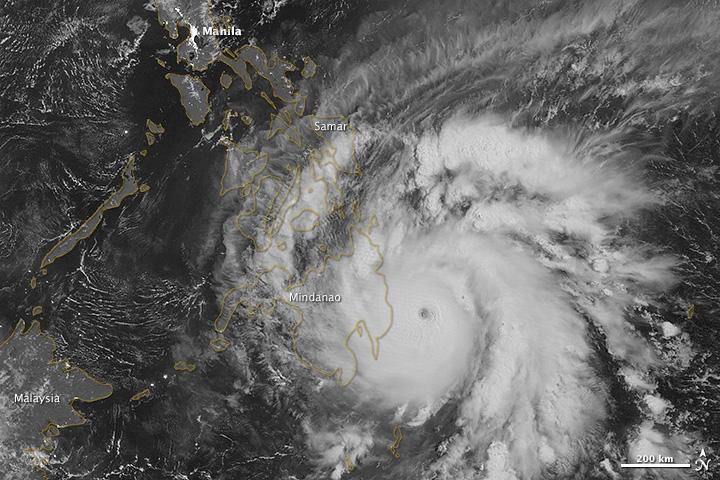
NASA image acquired December 3, 2012 As predicted, Typhoon Bopha made landfall on the Philippine island of Mindanao overnight December 3–4, 2012. Known in the Philippines as Pablo, the storm was blamed for 43 deaths and 25 injuries as of December 4, according to the Philippine Daily Inquirer. (To view the high res or to read more go to: <a href="http://1.usa.gov/XnYhVG" rel="nofollow">1.usa.gov/XnYhVG</a>) The Visible Infrared Imaging Radiometer Suite (VIIRS) on the Suomi NPP satellite acquired this image around 1:12 a.m. local time on December 4 (17:12 UTC on December 3). This image is from the VIIRS “day-night band,” which detects light in a range of wavelengths from green to near-infrared and uses filtering techniques to observe signals such as gas flares, auroras, wildfires, city lights, and reflected moonlight. Bopha remained a powerful typhoon as it made landfall on Mindanao, retaining a distinct eye and spiral shape as storm clouds stretched over the eastern part of the island. Unisys Weather reported that Bopha carried super-typhoon strength at the time it was coming ashore. William Straka, associate researcher at the Cooperative Institute for Meteorological Satellite Studies at the University of Wisconsin–Madison, estimated that the storm spanned at least 1,677 kilometers (1,042 miles). Bopha lost some strength after making landfall. On December 4 (late in the evening in the Philippines), the U.S. Navy’s Joint Typhoon Warning Center (JTWC) reported that the storm had maximum sustained winds of 95 knots (175 kilometers per hour) and gusts up to 115 knots (215 kilometers per hour)—still a fierce storm, but weakened since the previous day. The JTWC projected storm track showed Bopha continuing its movement toward the west-northwest, passing over the southern Philippines toward the South China Sea. NASA Earth Observatory image by Jesse Allen, using VIIRS day-night band data from the Suomi National Polar-orbiting Partnership. Suomi NPP is the result of a partnership between NASA, the National Oceanic and Atmospheric Administration, and the Department of Defense. Caption by Michon Scott. Instrument: Suomi NPP - VIIRS Credit: <b><a href="http://www.earthobservatory.nasa.gov/" rel="nofollow"> NASA Earth Observatory</a></b> <b><a href="http://www.nasa.gov/audience/formedia/features/MP_Photo_Guidelines.html" rel="nofollow">NASA image use policy.</a></b> <b><a href="http://www.nasa.gov/centers/goddard/home/index.html" rel="nofollow">NASA Goddard Space Flight Center</a></b> enables NASA’s mission through four scientific endeavors: Earth Science, Heliophysics, Solar System Exploration, and Astrophysics. Goddard plays a leading role in NASA’s accomplishments by contributing compelling scientific knowledge to advance the Agency’s mission. <b>Follow us on <a href="http://twitter.com/NASA_GoddardPix" rel="nofollow">Twitter</a></b> <b>Like us on <a href="http://www.facebook.com/pages/Greenbelt-MD/NASA-Goddard/395013845897?ref=tsd" rel="nofollow">Facebook</a></b> <b>Find us on <a href="http://instagrid.me/nasagoddard/?vm=grid" rel="nofollow">Instagram</a></b>
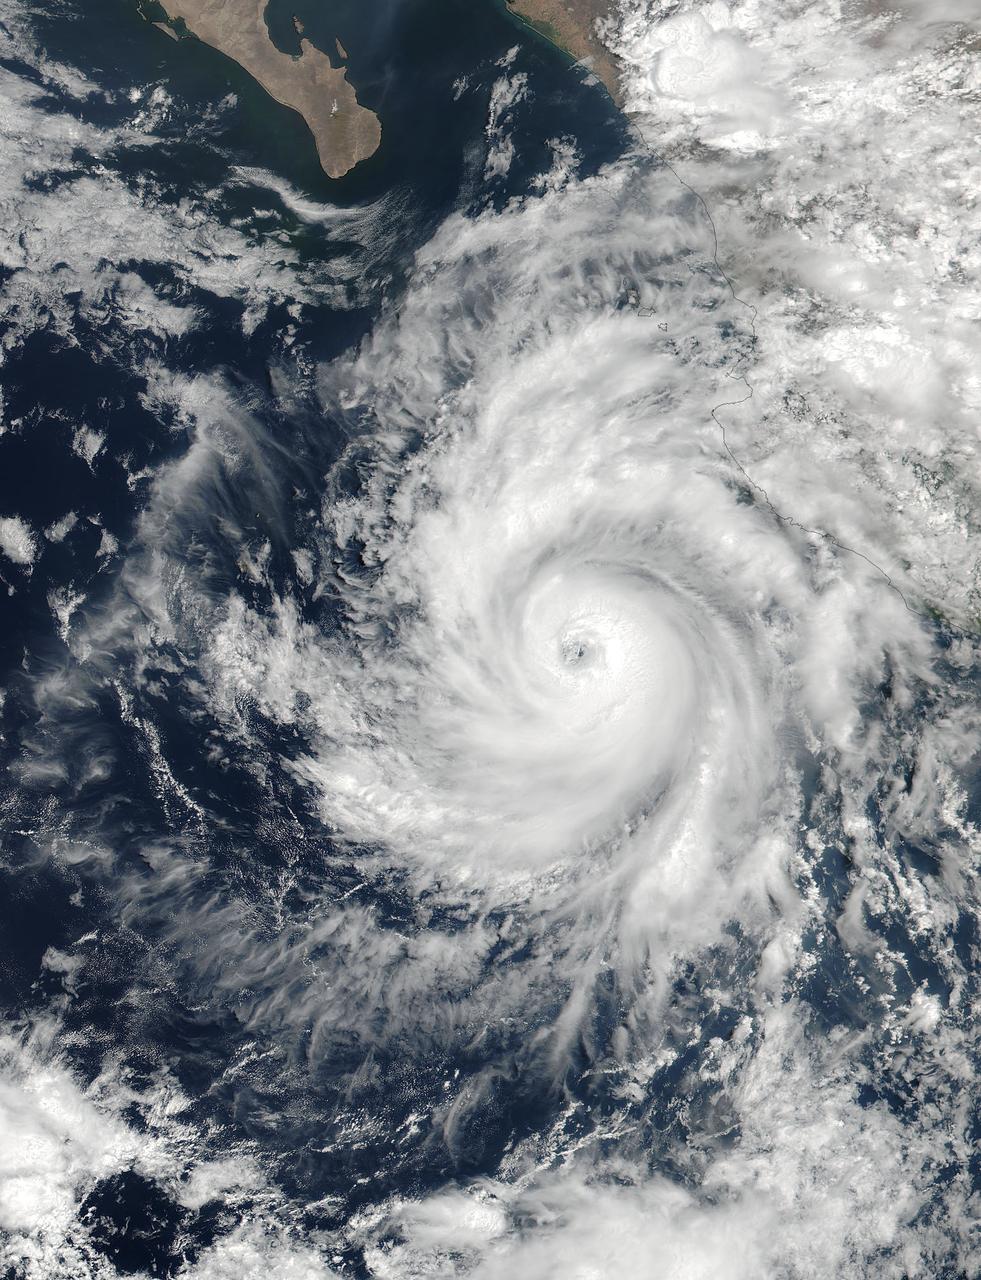
At 19:36 UTC (3:36 p.m. EDT) on June 26, the Visible Infrared Imaging Radiometer Suite (VIIRS) instrument aboard NASA-NOAA's Suomi NPP satellite provided a visible-light image of Hurricane Dora. The VIIRS imagery showed a small hurricane with a visible pinhole eye surrounded by a thick band of powerful thunderstorms. That strength didn't last long as Dora moved over cooler waters and began to weaken early on June 27. Dora appeared degraded in satellite imagery as strong convection and thunderstorms were diminishing, although the storm still maintained a visible eye. At 11 a.m. EDT (1500 UTC) on Tuesday, June 27, Dora's maximum sustained winds have decreased slightly to near 75 mph (120 kph) with higher gusts. Dora is a small tropical cyclone, as hurricane-force winds extended outward up to 15 miles (30 km) from the center. The NHC said the eye of Hurricane Dora was located near latitude 19.3 degrees north and longitude 110.2 degrees west. That's about 250 miles (400 km) south of the southern tip of Baja California, Mexico. Dora was moving toward the west-northwest near 13 mph (20 kph). The NHC said the center of Dora is expected to pass just north of Socorro Island later today, and remain well south of the Baja California Peninsula. Ocean swells generated by Dora are affecting portions of the coast of southwest Mexico and are expected to spread northwestward and begin affecting portions of the coast of the southern Baja California peninsula through Wednesday, June 28. Dora is moving over sea surface temperatures cooler than 26.6 degrees Celsius or 80 degrees Fahrenheit, which is the threshold to maintain a tropical cyclone. Temperatures cooler than that weaken tropical cyclones. The NHC said that the waters beneath Dora will continue to cool for the next couple of days so Dora is expected to weaken to a tropical storm later today, June 27, and degenerate to a remnant low pressure area over the next two days. For updated forecasts, visit: <a href="http://www.nhc.noaa.gov" rel="nofollow">www.nhc.noaa.gov</a>. Credit: NASA/NOAA <b><a href="http://www.nasa.gov/audience/formedia/features/MP_Photo_Guidelines.html" rel="nofollow">NASA image use policy.</a></b> <b><a href="http://www.nasa.gov/centers/goddard/home/index.html" rel="nofollow">NASA Goddard Space Flight Center</a></b> enables NASA’s mission through four scientific endeavors: Earth Science, Heliophysics, Solar System Exploration, and Astrophysics. Goddard plays a leading role in NASA’s accomplishments by contributing compelling scientific knowledge to advance the Agency’s mission. <b>Follow us on <a href="http://twitter.com/NASAGoddardPix" rel="nofollow">Twitter</a></b> <b>Like us on <a href="http://www.facebook.com/pages/Greenbelt-MD/NASA-Goddard/395013845897?ref=tsd" rel="nofollow">Facebook</a></b> <b>Find us on <a href="http://instagrid.me/nasagoddard/?vm=grid" rel="nofollow">Instagram</a></b>
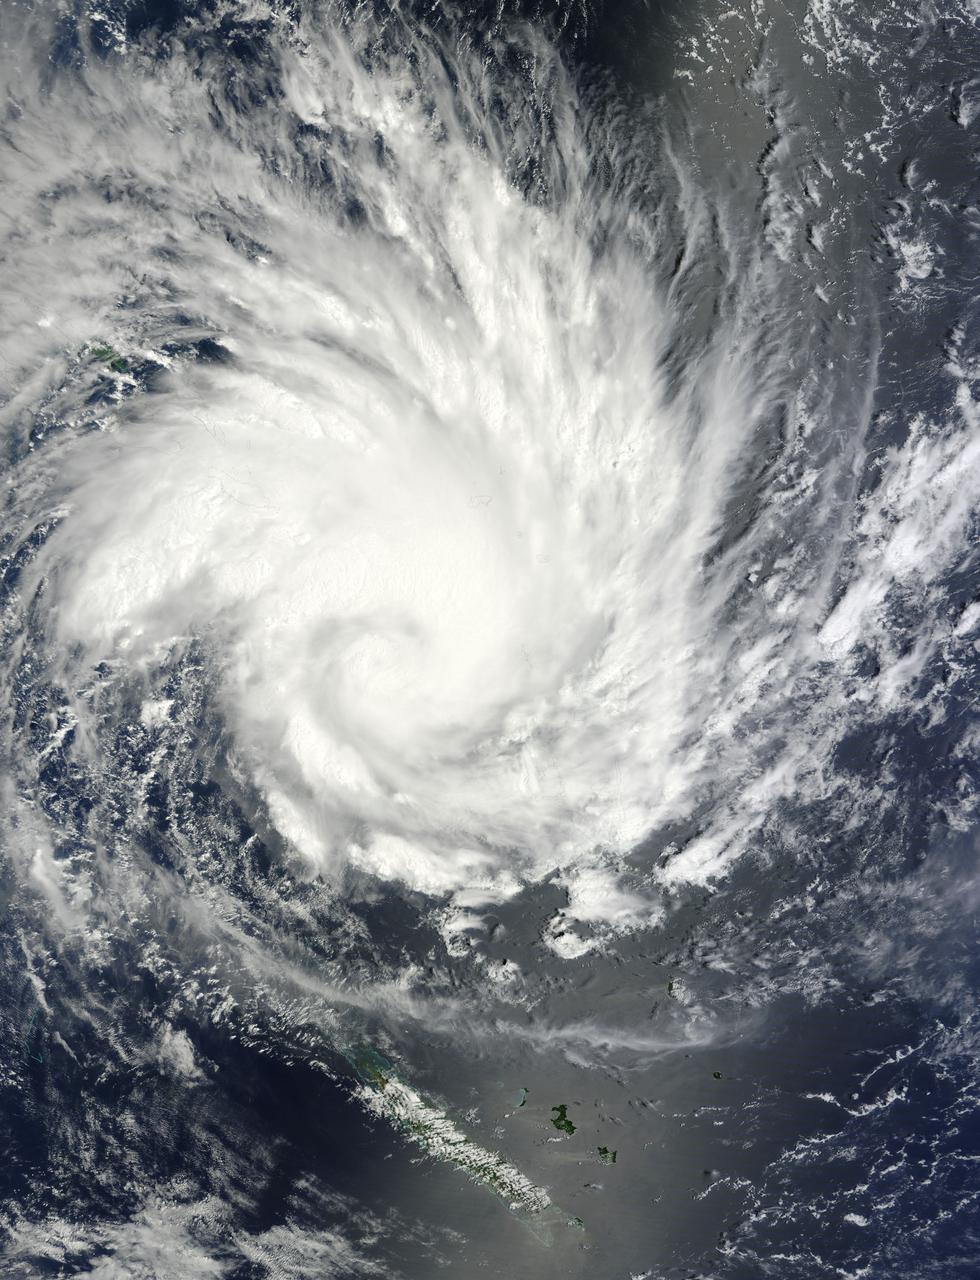
NASA image acquired January 30, 2011 at 23:20 UTC. Satellite: Terra <b> Click here to see the most recent image captured Feb. 1: <a href="http://www.flickr.com/photos/gsfc/5407540724/">www.flickr.com/photos/gsfc/5407540724/</a></b> Tropical Storm Anthony made landfall in Queensland, Australia this past weekend, and now the residents are watching a larger, more powerful cyclone headed their way. NASA's Terra satellite captured a visible image of the large Tropical Cyclone Yasi late yesterday as it makes its way west through the Coral Sea toward Queensland. The Moderate Resolution Imaging Spectroradiometer (MODIS) instrument that flies aboard NASA's Terra satellite captured an image of Cyclone Yasi on Jan. 30 at 23:20 UTC (6:20 p.m. EST/09:20 a.m., Monday, January 31 in Australia/Brisbane local time). Although the image did not reveal a visible eye, the storm appears to be well-formed and also appears to be strengthening. Warnings and watches are already in effect throughout the Coral Sea. The Solomon Islands currently have a Tropical Cyclone warning for the provinces of Temotu, Rennell & Bellona, Makira and Guadalcanal. The Australian Bureau of Meteorology has already posted a Tropical Cyclone Watch from Cooktown to Yeppoon and inland to between Georgetown and Moranbah in Queensland, Australia. The Australian Bureau of Meteorology expects damaging winds to develop in coastal and island communities between Cooktown and Yeppoon Wednesday morning, and inland areas on Wednesday afternoon. Updates from the Australian Bureau of Meteorology can be monitored at the Bureau's website at <a href="http://www.bom.gov.au" rel="nofollow">www.bom.gov.au</a>. On January 31 at 1500 UTC (10 a.m. EST/ 1:00 a.m. Tuesday February 1, 2011 in Australia/Brisbane local time), Tropical Cyclone Yasi had maximum sustained winds near 90 knots (103 mph/166 kmh). Yasi is a Category Two Cyclone on the Saffir-Simpson Scale. It was centered about 875 miles E of Cairns, Australia, near 13.4 South latitude and 160.4 East longitude. It was moving west near 19 knots (22 mph/35 kmh). Cyclone-force winds extend out to 30 miles (48 km) from the center. Animated infrared satellite imagery, such as that from the Atmospheric Infrared Sounder (AIRS) that flies on NASA's Aqua satellite, showed deep convective (thunderstorm) bands wrapping tighter into the low level circulation center. Wrapping bands of thunderstorms indicate strengthening. Yasi is forecast to move west then southwestward into an area of low vertical wind shear (strong wind shear can weaken a storm). Forecasters at the Joint Typhoon Warning Center (JTWC) expect Yasi to continue strengthening over the next 36 hours. JTWC forecasts a landfall just south of Cairns as a large 100-plus knot (115 mph/185 kmh)n system by Wednesday. Residents along the Queensland coast should now be making preparations now for the storm's arrival. Rob Gutro NASA's Goddard Space Flight Center Credit: NASA/GSFC/Jeff Schmaltz/MODIS Land Rapid Response Team Click here to see more images from <b><a href="http://rapidfire.sci.gsfc.nasa.gov/gallery/?latest" rel="nofollow">MODIS</a></b> <b><a href="http://www.nasa.gov/centers/goddard/home/index.html" rel="nofollow">NASA Goddard Space Flight Center</a></b> enables NASA’s mission through four scientific endeavors: Earth Science, Heliophysics, Solar System Exploration, and Astrophysics. Goddard plays a leading role in NASA’s accomplishments by contributing compelling scientific knowledge to advance the Agency’s mission. <b>Follow us on <a href="http://twitter.com/NASA_GoddardPix" rel="nofollow">Twitter</a></b> <b>Join us on <a href="http://www.facebook.com/pages/Greenbelt-MD/NASA-Goddard/395013845897?ref=tsd" rel="nofollow">Facebook</a></b>
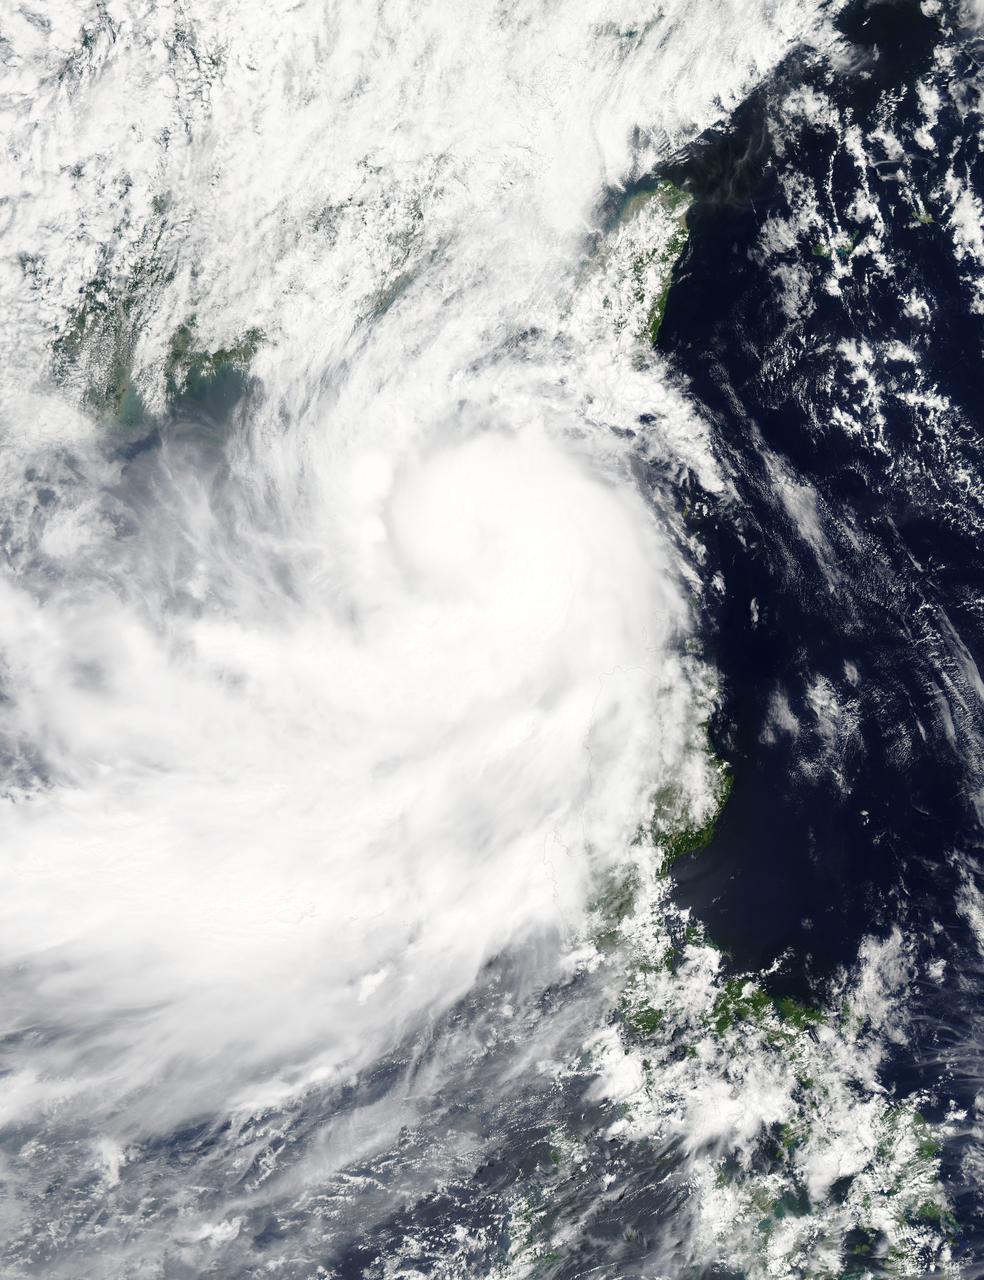
NASA's Aqua satellite captured a picture of Tropical Storm Linfa in the South China Sea on July 7 when it was between southern Taiwan and the northern Philippines. Aqua passed over Linfa on July 7 at 05:25 UTC (1:25 a.m. EDT) and the Moderate Resolution Imaging Spectroradiometer or MODIS instrument captured a visible image of the storm. Bands of thunderstorms wrapping into the center of circulation from the south, draped over western Luzon. The MODIS image showed the tight concentration of thunderstorms around Linfa's center were located over the South China Sea. Fragmented bands of thunderstorms north of the center were brushing over Southern Taiwan while clouds from another band of fragmented thunderstorms stretched northwest through the Taiwan Strait. On July 7 at 1500 UTC (11 a.m. EDT), Tropical Storm Linfa's maximum sustained winds had increased to 50 knots (57.5 mph/92.6 kph), up from 45 knots (51.7 mph/83.3 kph) six hours before. Linfa strengthened in the warm waters of the South China Sea now that its center has moved away from the northern Philippines and was no longer over land. Linfa was centered near 21.0 North latitude and 118.8 East longitude, about 277 nautical miles (319 miles/513.3 km) east-southeast of Hong Kong, China. Linfa has tracked northward at 3 knots (3.5 mph/5.5 kph). China's National Meteorological Centre has (CNMC) issued a yellow category warning of typhoon at 6:00 a.m. July 7, Beijing Time. CNMC noted that Linfa is the tenth typhoon this year and at that time it was centered about 430 km (267.2 miles) southeast of border between Fujian and Guangdong For updated warnings and watches from the China Meteorological Service, visit: <a href="http://www.cma.gov.cn/en/WeatherWarnings/" rel="nofollow">www.cma.gov.cn/en/WeatherWarnings/</a>. Linfa is moving north between Luzon and Taiwan. The Joint Typhoon Warning Center expects Linfa to strengthen to 60 knots (69 mph/111 kph) by mid-day on July 9, before weakening and then making landfall in mainland China. Credit: NASA/GSFC/Jeff Schmaltz/MODIS Land Rapid Response Team <b><a href="http://www.nasa.gov/audience/formedia/features/MP_Photo_Guidelines.html" rel="nofollow">NASA image use policy.</a></b> <b><a href="http://www.nasa.gov/centers/goddard/home/index.html" rel="nofollow">NASA Goddard Space Flight Center</a></b> enables NASA’s mission through four scientific endeavors: Earth Science, Heliophysics, Solar System Exploration, and Astrophysics. Goddard plays a leading role in NASA’s accomplishments by contributing compelling scientific knowledge to advance the Agency’s mission. <b>Follow us on <a href="http://twitter.com/NASAGoddardPix" rel="nofollow">Twitter</a></b> <b>Like us on <a href="http://www.facebook.com/pages/Greenbelt-MD/NASA-Goddard/395013845897?ref=tsd" rel="nofollow">Facebook</a></b> <b>Find us on <a href="http://instagrid.me/nasagoddard/?vm=grid" rel="nofollow">Instagram</a></b>