
This poster artfully depicts Solar Surfing, an early stage NASA study to support potential future missions that could travel closer to the Sun’s surface than ever before. The solar transition region, a very thin layer near the Sun’s surface, is of great interest to heliophysicists. In this zone, temperatures range from 10,000 to 1.8 million degrees Fahrenheit. The NASA Innovative Advanced Concepts (NIAC) program funds a study by a team at NASA’s Kennedy Space Center in Florida to further research a novel, highly reflective coating for a solar shield that could allow spacecraft to approach the Sun close enough to investigate this exciting region – about 500,000 miles from the surface. The better heliophysicists understand the Sun and how it generates energy, the better they can make predictions of the Sun’s effect on our planet – and improve our everyday communications, electronics, and transportation.
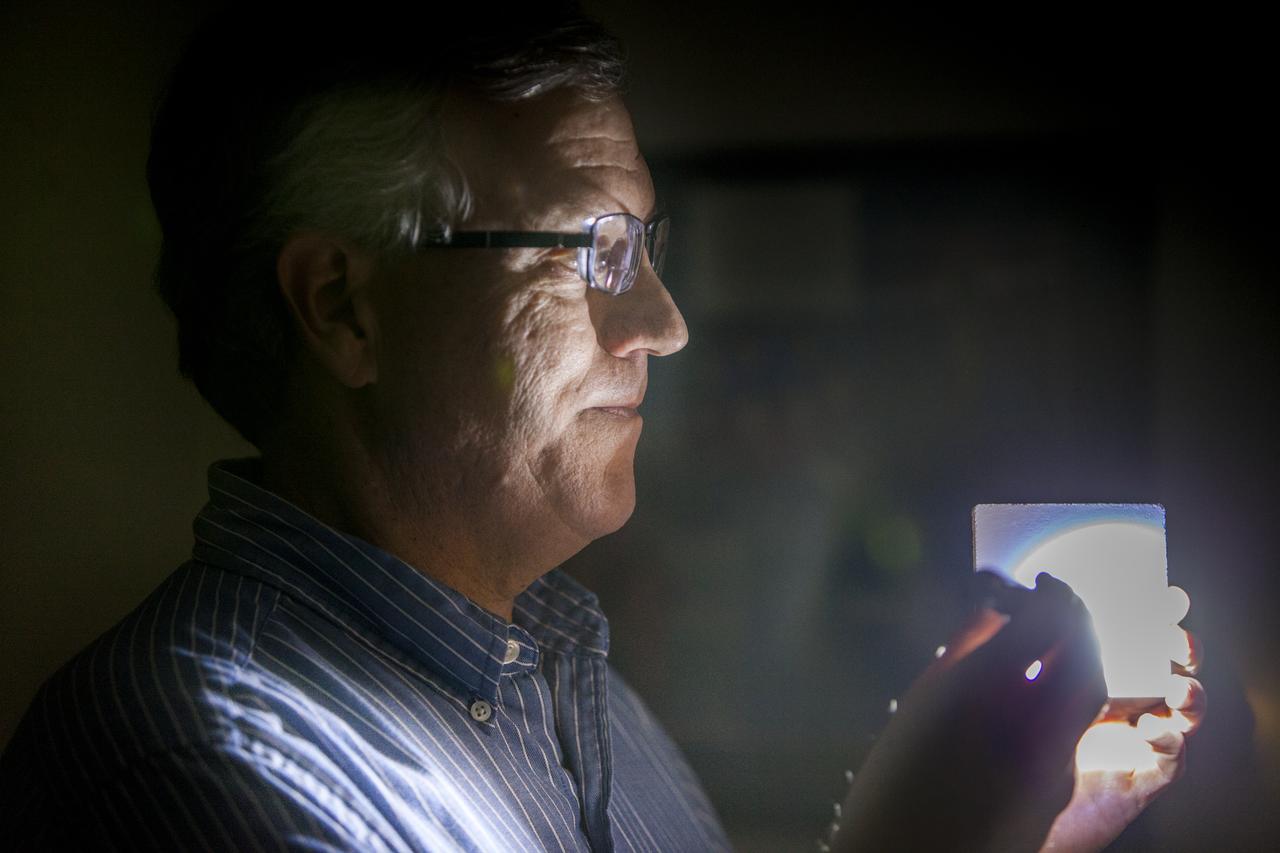
Robert Youngquist, Ph.D., tests a sample disk with a "Solar White" cryogenic selective surface coating with a flash light, demonstrating the coating’s reflective properties. The innovative coating is predicted to reflect more than 99.9 percent of the simulated solar infrared radiation. This technology could enable storing super-cold, or cryogenic, liquids and support systems that shield astronauts against radiation during the Journey to Mars.
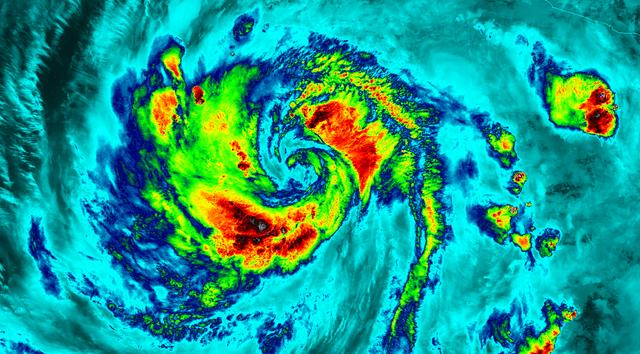
NASA-NOAA's Suomi NPP satellite flew over Hurricane Blanca in the Eastern Pacific Ocean and gathered infrared data on the storm that was false-colored to show locations of the strongest thunderstorms within the storm. The Visible Infrared Imaging Radiometer Suite or VIIRS instrument aboard the satellite gathered infrared data of the storm that was made into an image at the University of Wisconsin-Madison. The image was false-colored to show temperature. Coldest cloud top temperatures indicate higher, stronger, thunderstorms within a tropical cyclone. Those are typically the strongest storms with potential for heavy rainfall. VIIRS is a scanning radiometer that collects visible and infrared imagery and "radiometric" measurements. Basically it means that VIIRS data is used to measure cloud and aerosol properties, ocean color, sea and land surface temperature, ice motion and temperature, fires, and Earth's albedo (reflected light). The VIIRS image from June 5 at 8:11 UTC (4:11 a.m. EDT) showed two areas of coldest cloud top temperatures and strongest storms were west-southwest and east-northeast of the center of Blanca's circulation center. On June 5 at 5 a.m. EDT (0900 UTC) Blanca's maximum sustained winds were near 105 mph (165 kph) with higher gusts. The National Hurricane Center (NHC) forecast expects some strengthening during the next day or so. Weakening is forecast to begin by late Saturday. At that time, NHC placed the center of Hurricane Blanca near latitude 14.3 North, longitude 106.2 West. That puts the center about 350 miles (560 km) south-southwest of Manzanillo, Mexico and about 640 miles (1,030 km) south-southeast of Cabo San Lucas, Mexico. The estimated minimum central pressure is 968 millibars (28.59 inches). Blanca is moving toward the northwest near 10 mph (17 kph). A northwestward to north-northwestward motion at a similar forward speed is expected to continue through Saturday night. Blanca has been stirring up surf along the coast of southwestern Mexico and will reach the Pacific coast of the Baja California peninsula and the southern Gulf of California later today, June 5. These swells are likely to cause life-threatening surf and rip current conditions. On the forecast track, the center of Blanca will approach the southern Baja California peninsula on Sunday. NHC cautions that "Interests in the southern Baja California peninsula should monitor the progress of Blanca. A tropical storm or hurricane watch will likely be required for a portion of Baja California Sur later today." The NHC forecast track shows Blanca making landfall in the southeastern tip of Baja California on Sunday, June 7 and tracking north-northeast along the Baja California peninsula, for several days following. Image credit: Credits: NASA/NOAA/UW-CIMSS <b><a href="http://www.nasa.gov/audience/formedia/features/MP_Photo_Guidelines.html" rel="nofollow">NASA image use policy.</a></b> <b><a href="http://www.nasa.gov/centers/goddard/home/index.html" rel="nofollow">NASA Goddard Space Flight Center</a></b> enables NASA’s mission through four scientific endeavors: Earth Science, Heliophysics, Solar System Exploration, and Astrophysics. Goddard plays a leading role in NASA’s accomplishments by contributing compelling scientific knowledge to advance the Agency’s mission. <b>Follow us on <a href="http://twitter.com/NASAGoddardPix" rel="nofollow">Twitter</a></b> <b>Like us on <a href="http://www.facebook.com/pages/Greenbelt-MD/NASA-Goddard/395013845897?ref=tsd" rel="nofollow">Facebook</a></b> <b>Find us on <a href="http://instagrid.me/nasagoddard/?vm=grid" rel="nofollow">Instagram</a></b>
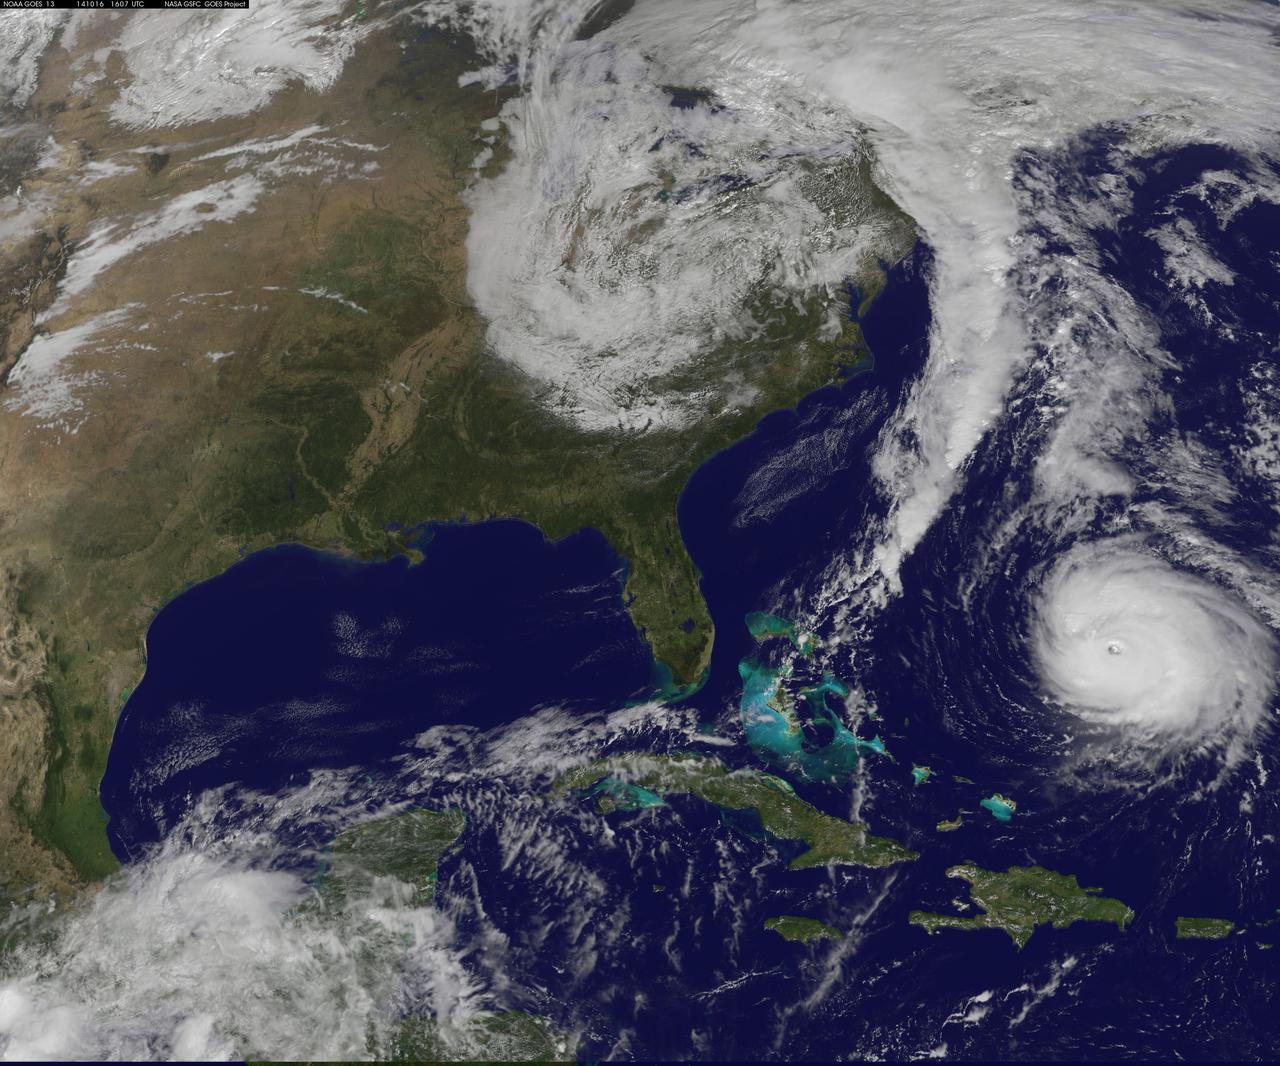
Hurricane Gonzalo is moving toward the northwest near 12 mph. A turn toward the north-northwest and then north is expected during the next day or so, followed by a north northeastward acceleration by late Thursday. Maximum sustained winds are near 130 mph making Gonzalo a Category 4 hurricane on the Saffir-Simpson Hurricane Wind Scale. Tropical storm conditions are possible on Bermuda by late Thursday night, with hurricane conditions possible on Friday. Large swells generated by Gonzalo will reach much of the U.S. east coast and Bermuda on Thursday. These swells are likely to cause life-threatening surf and rip current conditions. This image was taken by GOES 13 at 1607 UTC on October 16, 2014. Caption: NOAA Image Credit: NOAA/NASA GOES Project <b><a href="http://www.nasa.gov/audience/formedia/features/MP_Photo_Guidelines.html" rel="nofollow">NASA image use policy.</a></b> <b><a href="http://www.nasa.gov/centers/goddard/home/index.html" rel="nofollow">NASA Goddard Space Flight Center</a></b> enables NASA’s mission through four scientific endeavors: Earth Science, Heliophysics, Solar System Exploration, and Astrophysics. Goddard plays a leading role in NASA’s accomplishments by contributing compelling scientific knowledge to advance the Agency’s mission. <b>Follow us on <a href="http://twitter.com/NASAGoddardPix" rel="nofollow">Twitter</a></b> <b>Like us on <a href="http://www.facebook.com/pages/Greenbelt-MD/NASA-Goddard/395013845897?ref=tsd" rel="nofollow">Facebook</a></b> <b>Find us on <a href="http://instagram.com/nasagoddard?vm=grid" rel="nofollow">Instagram</a></b>
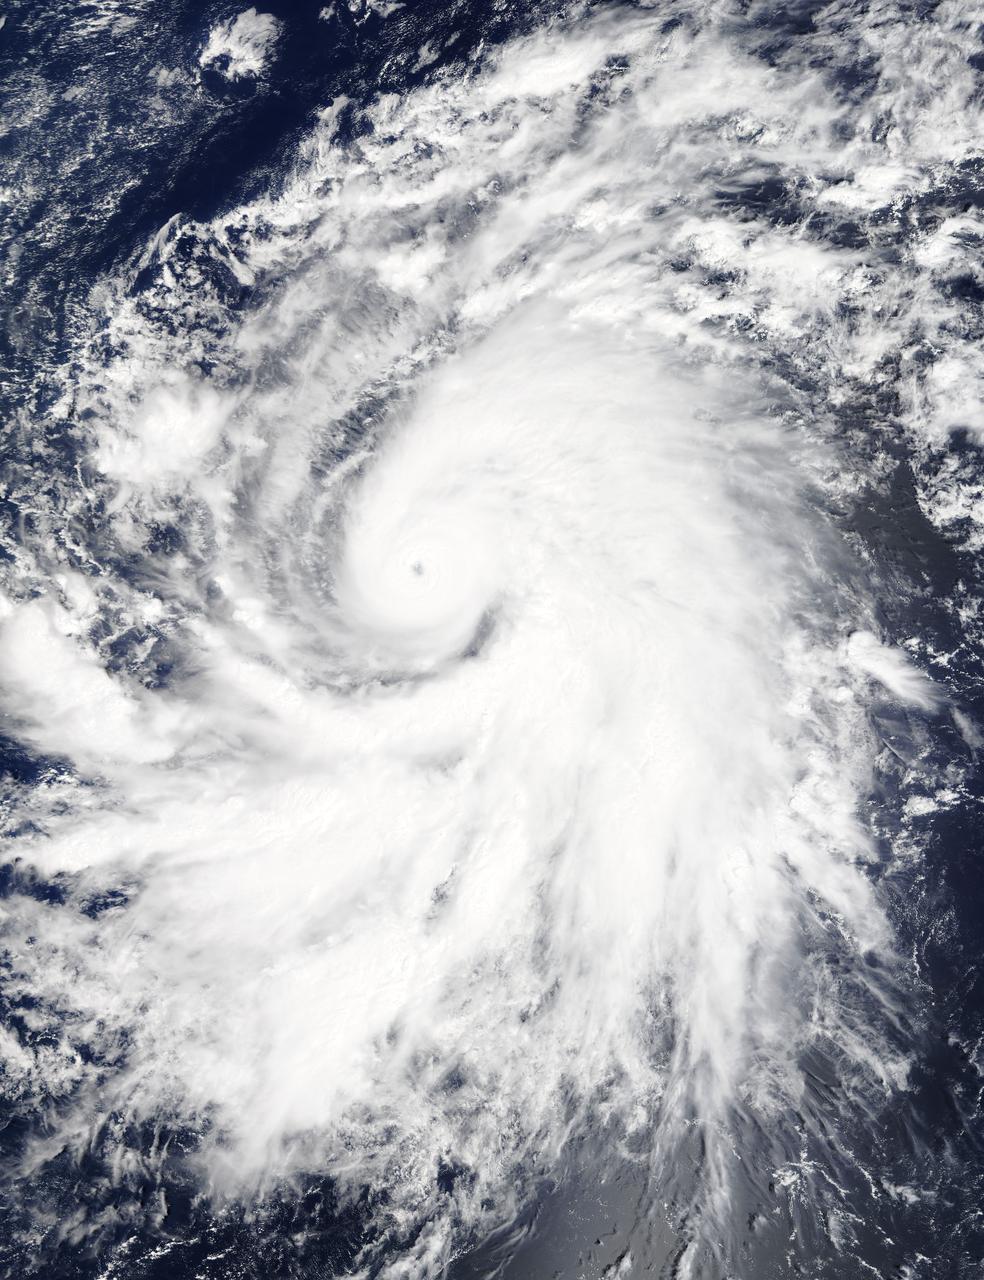
On Oct. 19 at 19:35 UTC (3:35 p.m. EDT) the MODIS instrument aboard NASA's Terra satellite saw Hurricane Olaf moving into the central Pacific Ocean with a visible eye. Powerful thunderstorms circled the eye and extended in a thick band in the eastern quadrant from north to south. At 5 a.m. EDT (0900 UTC) on Oct. 20, Hurricane Olaf's center was located near latitude 10.3 north and longitude 140.4 west. That's about 1,175 miles (1,890 km) east-southeast of Hilo, Hawaii. Despite being so far from Hawaii and because Olaf is a powerful hurricane, large swells generated by Olaf will begin to arrive along east facing shores of the main Hawaiian Islands over the next couple of days. The CPHC said that resultant surf will be large...potentially life-threatening and damaging. Olaf is moving toward the west-northwest near 10 mph (17 kph) and the Central Pacific Hurricane Center (CPHC), who has taken over forecast responsibilities now that Olaf has crossed the 140 degree longitude line, expects Olaf to turn toward the west-northwest and then northwest by October 21. Maximum sustained winds are near 150 mph (240 kph). Olaf is a category four hurricane on the Saffir-Simpson Hurricane wind scale. Some additional strengthening is forecast on Tuesday, Oct. 20 and fluctuations in intensity are possible Tuesday night and Wednesday. The estimated minimum central pressure is 938 millibars. Olaf is expected to remain a major hurricane for the next couple of days and begin curving to the northeast and away from Hawaii by Friday, October 23. For updates, visit: <a href="http://www.prh.noaa.gov/cphc" rel="nofollow">www.prh.noaa.gov/cphc</a>. Credit: NASA Goddard's MODIS Rapid Response Team <b><a href="http://www.nasa.gov/audience/formedia/features/MP_Photo_Guidelines.html" rel="nofollow">NASA image use policy.</a></b> <b><a href="http://www.nasa.gov/centers/goddard/home/index.html" rel="nofollow">NASA Goddard Space Flight Center</a></b> enables NASA’s mission through four scientific endeavors: Earth Science, Heliophysics, Solar System Exploration, and Astrophysics. Goddard plays a leading role in NASA’s accomplishments by contributing compelling scientific knowledge to advance the Agency’s mission. <b>Follow us on <a href="http://twitter.com/NASAGoddardPix" rel="nofollow">Twitter</a></b> <b>Like us on <a href="http://www.facebook.com/pages/Greenbelt-MD/NASA-Goddard/395013845897?ref=tsd" rel="nofollow">Facebook</a></b> <b>Find us on <a href="http://instagrid.me/nasagoddard/?vm=grid" rel="nofollow">Instagram</a></b>
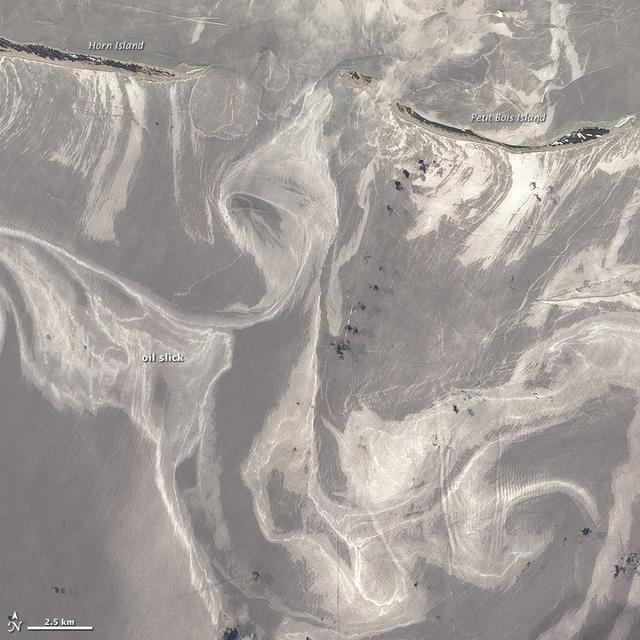
NASA image acquired June 26, 2010 As of June 27, 2010, the entire gulf-facing beachfront of several barrier islands in eastern Mississippi (offshore of Pascagoula) had received a designation of at least “lightly oiled” by the interagency Shoreline Cleanup Assessment Team that is responding to the disaster in the Gulf of Mexico. A few small stretches of Petit Bois Island had been labeled heavily or moderately oiled. (To view this image without a description go to: This high-resolution image shows Petit Bois Island (top right) and the eastern end of Horn Island (top left) on June 26. In general, oil-covered waters are silvery and cleaner waters are blue-gray. This pattern is especially consistent farther from the islands. The intensely bright patches of water directly offshore of the barrier islands, however, may be from a combination of factors, including sediment and organic material, coastal currents and surf, and oil. The islands provide a sense of scale for the ribbons of oil swirling into the area from the south. Petit Bois Island is about 10 kilometers (6 miles) long. It is one of seven barrier islands that, along with some mainland areas of Mississippi and Florida, make up the Gulf Islands National Seashore. According to the National Park Service Gulf Islands National Seashore Website, all the islands remained open to the public as of June 28, 2010, and clean-up crews were on hand to respond to any oil coming ashore. The large version of this image, which was captured by the Advanced Land Imager on NASA’s Earth Observing-1 (EO-1) satellite, shows a larger area, including the Mississippi Sound and parts of mainland Mississippi. Although oil has been observed in the Sound, it is unlikely that all the bright patches of water in that area are thickly oil-covered. Differences in brightness in coastal area waters may be due to other factors, including freshwater runoff, strong currents, and water depth and clarity. NASA Earth Observatory image created by Jesse Allen and Robert Simmon, using EO-1 ALI data provided courtesy of the NASA EO-1 team. Caption by Rebecca Lindsey. Instrument: EO-1 - ALI To see more images go to: <a href="http://earthobservatory.nasa.gov/" rel="nofollow">earthobservatory.nasa.gov/</a> <b><a href="http://www.nasa.gov/centers/goddard/home/index.html" rel="nofollow">NASA Goddard Space Flight Center</a></b> is home to the nation's largest organization of combined scientists, engineers and technologists that build spacecraft, instruments and new technology to study the Earth, the sun, our solar system, and the universe.
![A swirling Eastern Pacific Ocean storm system headed for California was spotted by NOAA's GOES-West satellite on February 28. According to the National Weather Service, this storm system has the potential to bring heavy rainfall to the drought-stricken state. The storm was captured using visible data from NOAA's GOES-West or GOES-15 satellite on Feb. 28 at 1915 UTC/11:15 a.m. PST was made into an image by NASA/NOAA's GOES Project at NASA's Goddard Space Flight Center in Greenbelt, Md. The storm's center appeared as a tight swirl, with bands of clouds and showers already sweeping over the state extending from northern California to Baja California, Mexico. At 11:30 a.m. PST on February 28, Bill Patzert, climatologist at NASA's Jet Propulsion Laboratory in Pasadena, Calif. said, "Right now from northern to southern California we are being battered by very heavy rain, strong winds and our coastal communities are being battered by high surf. Through the weekend we are bracing for mud and rock slides in areas that recently burned [from wildfires]. Flooding is looming up and down the state." The National Weather Service (NWS) serving Los Angeles posted a Flood Watch for the region on Friday, February 28. The Flood Watch notes the "potential for flash flooding and debris flows for some 2013 and 2014 burn areas in Los Angeles County from this morning through Saturday evening (March 1).” The NWS Flood Watch also noted "a very strong and dynamic storm will bring a significant amount of rain to much of southwestern California through Saturday evening. A flash flood watch has been issued for several recent burn areas in Los Angeles County due to the abundant rainfall expected. Rain rates at times are expected to range from a half inch to one inch per hour which could cause significant mud and debris flows. There will be a chance of thunderstorms with locally higher rainfall rates." "Californians haven't seen rain and wind this powerful in 3 years," Patzert said. "By early next week, as this system moves east, this powerful system will wreak havoc causing snow and ice storms through the Midwest into the Northeast." GOES satellites provide the kind of continuous monitoring necessary for intensive data analysis. Geostationary describes an orbit in which a satellite is always in the same position with respect to the rotating Earth. This allows GOES to hover continuously over one position on Earth's surface, appearing stationary. As a result, GOES provide a constant vigil for the atmospheric "triggers" for severe weather conditions such as tornadoes, flash floods, hail storms and hurricanes. On a positive note, Patzert noted, "This is a nice down payment on drought recovery in the parched Western U.S." For updated information about the storm system, visit NOAA's National Weather Service website: <a href="http://www.weather.gov" rel="nofollow">www.weather.gov</a> For more information about GOES satellites, visit: <a href="http://www.goes.noaa.gov/" rel="nofollow">www.goes.noaa.gov/</a> or <a href="http://goes.gsfc.nasa.gov/" rel="nofollow">goes.gsfc.nasa.gov/</a> Rob Gutro NASA's Goddard Space Flight Center <b><a href="http://www.nasa.gov/audience/formedia/features/MP_Photo_Guidelines.html" rel="nofollow">NASA image use policy.</a></b> <b><a href="http://www.nasa.gov/centers/goddard/home/index.html" rel="nofollow">NASA Goddard Space Flight Center</a></b> enables NASA’s mission through four scientific endeavors: Earth Science, Heliophysics, Solar System Exploration, and Astrophysics. Goddard plays a leading role in NASA’s accomplishments by contributing compelling scientific knowledge to advance the Agency’s mission. <b>Follow us on <a href="http://twitter.com/NASAGoddardPix" rel="nofollow">Twitter</a></b> <b>Like us on <a href="http://www.facebook.com/pages/Greenbelt-MD/NASA-Goddard/395013845897?ref=tsd" rel="nofollow">Facebook</a></b> <b>Find us on <a href="http://instagram.com/nasagoddard?vm=grid" rel="nofollow">Instagram</a></b>](https://images-assets.nasa.gov/image/GSFC_20171208_Archive_e001192/GSFC_20171208_Archive_e001192~medium.jpg)
A swirling Eastern Pacific Ocean storm system headed for California was spotted by NOAA's GOES-West satellite on February 28. According to the National Weather Service, this storm system has the potential to bring heavy rainfall to the drought-stricken state. The storm was captured using visible data from NOAA's GOES-West or GOES-15 satellite on Feb. 28 at 1915 UTC/11:15 a.m. PST was made into an image by NASA/NOAA's GOES Project at NASA's Goddard Space Flight Center in Greenbelt, Md. The storm's center appeared as a tight swirl, with bands of clouds and showers already sweeping over the state extending from northern California to Baja California, Mexico. At 11:30 a.m. PST on February 28, Bill Patzert, climatologist at NASA's Jet Propulsion Laboratory in Pasadena, Calif. said, "Right now from northern to southern California we are being battered by very heavy rain, strong winds and our coastal communities are being battered by high surf. Through the weekend we are bracing for mud and rock slides in areas that recently burned [from wildfires]. Flooding is looming up and down the state." The National Weather Service (NWS) serving Los Angeles posted a Flood Watch for the region on Friday, February 28. The Flood Watch notes the "potential for flash flooding and debris flows for some 2013 and 2014 burn areas in Los Angeles County from this morning through Saturday evening (March 1).” The NWS Flood Watch also noted "a very strong and dynamic storm will bring a significant amount of rain to much of southwestern California through Saturday evening. A flash flood watch has been issued for several recent burn areas in Los Angeles County due to the abundant rainfall expected. Rain rates at times are expected to range from a half inch to one inch per hour which could cause significant mud and debris flows. There will be a chance of thunderstorms with locally higher rainfall rates." "Californians haven't seen rain and wind this powerful in 3 years," Patzert said. "By early next week, as this system moves east, this powerful system will wreak havoc causing snow and ice storms through the Midwest into the Northeast." GOES satellites provide the kind of continuous monitoring necessary for intensive data analysis. Geostationary describes an orbit in which a satellite is always in the same position with respect to the rotating Earth. This allows GOES to hover continuously over one position on Earth's surface, appearing stationary. As a result, GOES provide a constant vigil for the atmospheric "triggers" for severe weather conditions such as tornadoes, flash floods, hail storms and hurricanes. On a positive note, Patzert noted, "This is a nice down payment on drought recovery in the parched Western U.S." For updated information about the storm system, visit NOAA's National Weather Service website: <a href="http://www.weather.gov" rel="nofollow">www.weather.gov</a> For more information about GOES satellites, visit: <a href="http://www.goes.noaa.gov/" rel="nofollow">www.goes.noaa.gov/</a> or <a href="http://goes.gsfc.nasa.gov/" rel="nofollow">goes.gsfc.nasa.gov/</a> Rob Gutro NASA's Goddard Space Flight Center <b><a href="http://www.nasa.gov/audience/formedia/features/MP_Photo_Guidelines.html" rel="nofollow">NASA image use policy.</a></b> <b><a href="http://www.nasa.gov/centers/goddard/home/index.html" rel="nofollow">NASA Goddard Space Flight Center</a></b> enables NASA’s mission through four scientific endeavors: Earth Science, Heliophysics, Solar System Exploration, and Astrophysics. Goddard plays a leading role in NASA’s accomplishments by contributing compelling scientific knowledge to advance the Agency’s mission. <b>Follow us on <a href="http://twitter.com/NASAGoddardPix" rel="nofollow">Twitter</a></b> <b>Like us on <a href="http://www.facebook.com/pages/Greenbelt-MD/NASA-Goddard/395013845897?ref=tsd" rel="nofollow">Facebook</a></b> <b>Find us on <a href="http://instagram.com/nasagoddard?vm=grid" rel="nofollow">Instagram</a></b>