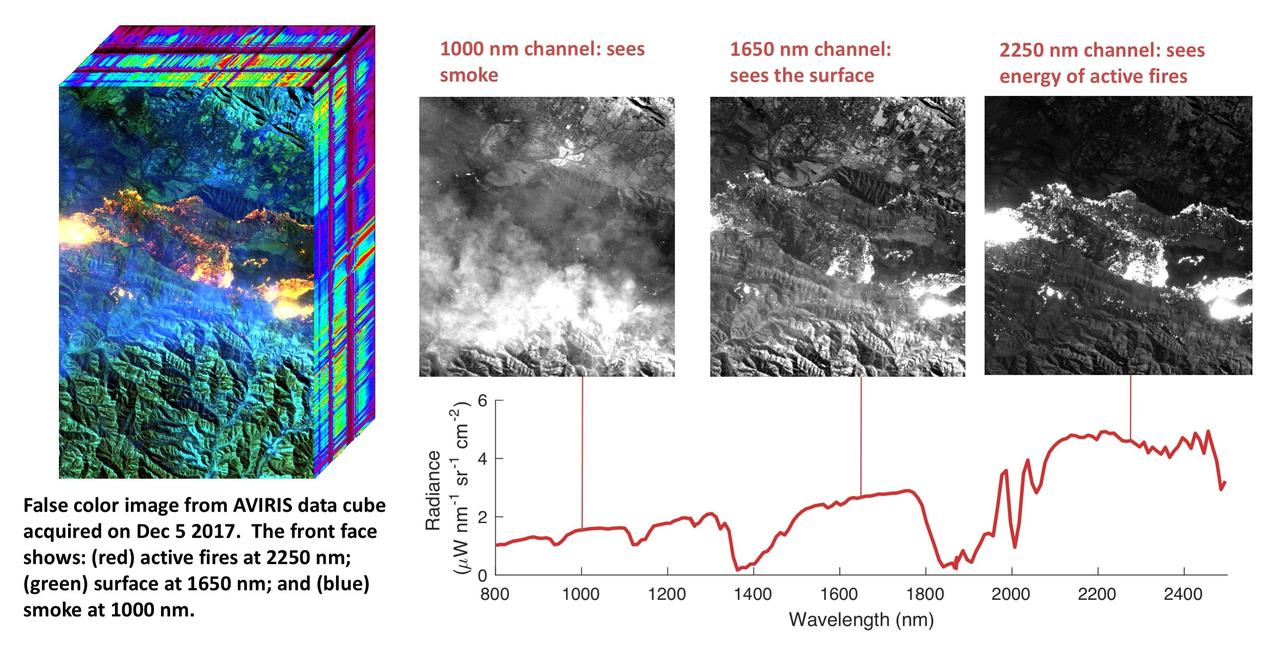
NASA's Airborne Visible Infrared Imaging Spectrometer instrument (AVIRIS), flying aboard a NASA Armstrong Flight Research Center high-altitude ER-2 aircraft, flew over the wildfires burning in Southern California on Dec. 5, 2017 and acquired this false-color image. Active fires are visible in red, ground surfaces are in green and smoke is in blue. AVIRIS is an imaging spectrometer that observes light in visible and infrared wavelengths, measuring the full spectrum of radiated energy. Unlike regular cameras with three colors, AVIRIS has 224 spectral channels from the visible through the shortwave infrared. This permits mapping of fire temperatures, fractional coverage, and surface properties, including how much fuel is available for a fire. Spectroscopy is also valuable for characterizing forest drought conditions and health to assess fire risk. AVIRIS has been observing fire-prone areas in Southern California for many years, forming a growing time series of before/after data cubes. These data are helping improve scientific understanding of fire risk and how ecosystems respond to drought and fire. https://photojournal.jpl.nasa.gov/catalog/PIA11243

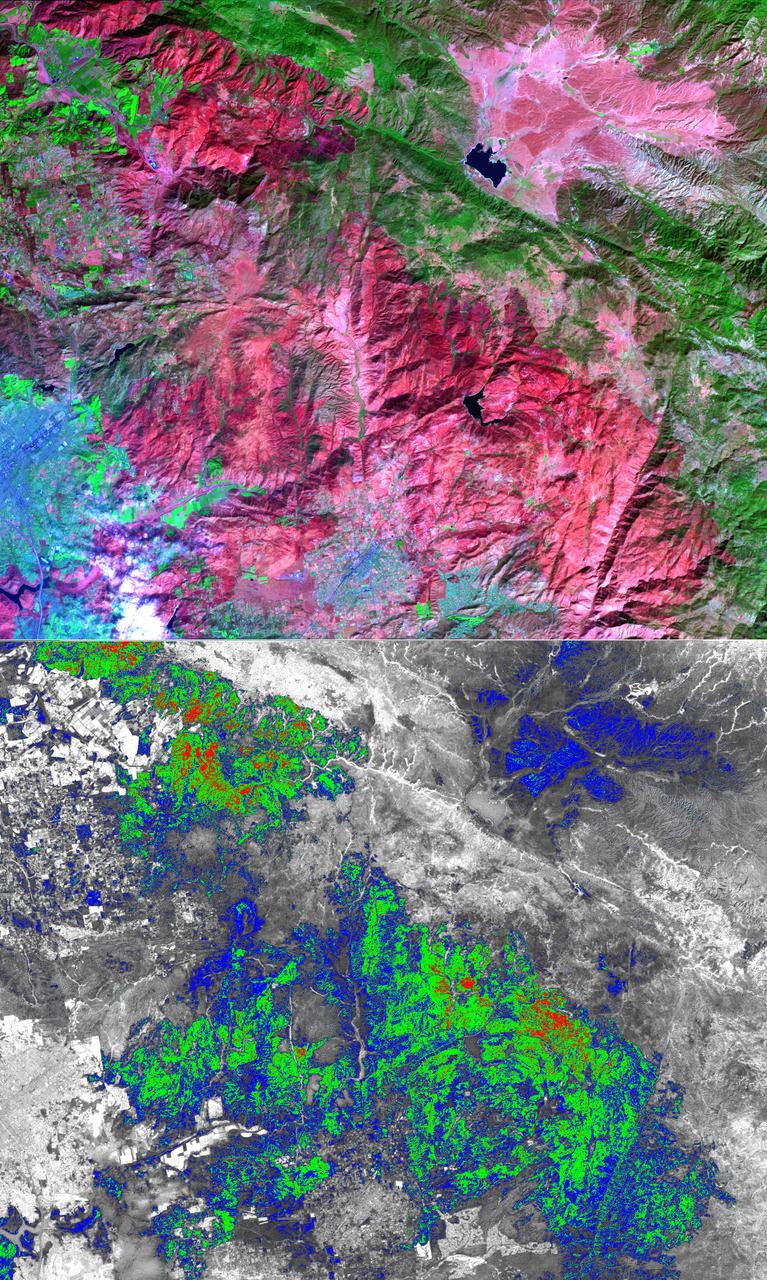
NASA's Airborne Visible Infrared Imaging Spectrometer instrument (AVIRIS), flying aboard a NASA Armstrong Flight Research Center high-altitude ER-2 aircraft, observed wildfires burning in Southern California on Dec. 5-7, 2017. AVIRIS is an imaging spectrometer that observes light in visible and infrared wavelengths, measuring the full spectrum of radiated energy. Unlike regular cameras with three colors, AVIRIS has 224 spectral channels, measuring contiguously from the visible through the shortwave infrared. Data from these flights, compared against measurements acquired earlier in the year, show many ways this one instrument can improve both our understanding of fire risk and the response to fires in progress. The top row in this image compilation shows pre-fire data acquired from June 2017. At top left is a visible-wavelength image similar to what our own eyes would see. The top middle image is a map of surface composition based on analyzing the full electromagnetic spectrum, revealing green vegetated areas and non-photosynthetic vegetation that is potential fuel as well as non-vegetated surfaces that may slow an advancing fire. The image at top right is a remote measurement of the water in tree canopies, a proxy for how much moisture is in the vegetation. The bottom row in the compilation shows data acquired from the Thomas fire in progress in December 2017. At bottom left is a visible wavelength image. The bottom middle image is an infrared image, with red at 2,250 nanometers showing fire energy, green at 1,650 nanometers showing the surface through the smoke, and blue at 1,000 nanometers showing the smoke itself. The image at bottom right is a fire temperature map using spectroscopic analysis to measure fire thermal emission recorded in the AVIRIS spectra. https://photojournal.jpl.nasa.gov/catalog/PIA22194
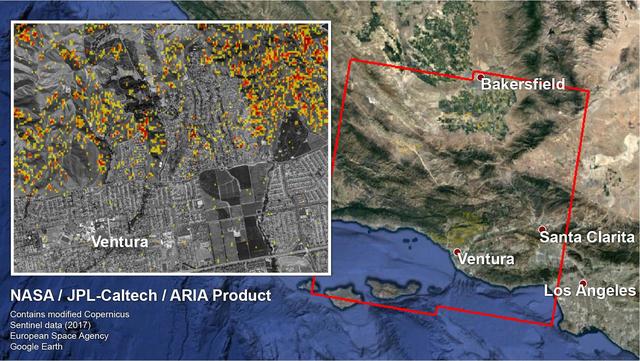
The Advanced Rapid Imaging and Analysis (ARIA) team at NASA's Jet Propulsion Laboratory in Pasadena, California, and Caltech, also in Pasadena, created a Damage Proxy Map (DPM) depicting areas in Southern California that are likely damaged (shown by red and yellow pixels) as a result of recent wildfires, including the Thomas Fire in Ventura and Santa Barbara Counties, highlighted in the attached image taken from the DPM. The map is derived from synthetic aperture radar (SAR) images from the Copernicus Sentinel-1 satellites, operated by the European Space Agency (ESA). The images were taken before (Nov. 28, 2017, 6 a.m. PST) and after (Dec. 10, 2017, 6 a.m. PST) the onset of the fires. The map covers an area of 107 by 107 miles (172 by 172 kilometers), shown by the large red polygon. Each pixel measures about 33 yards (30 meters) across. The color variation from yellow to red indicates increasingly more significant ground surface change. Preliminary validation was done by comparing the map to optical satellite imagery from DigitalGlobe. This damage proxy map should be used as guidance to identify damaged areas, and may be less reliable over vegetated areas. For example, the colored pixels seen over mountainous areas may seem a little scattered even though the reality could be that the contiguous areas were burned. Patches of farmland can also appear as signals due to plowing or irrigation. The full map is available to download from https://aria-share.jpl.nasa.gov/events/20171210-SoCal_Fire/. https://photojournal.jpl.nasa.gov/catalog/PIA22191

With smoke from the Lake Arrowhead area fires streaming in the background, NASA's Ikhana unmanned aircraft heads out on a Southern California wildfires imaging mission.

With smoke from the Lake Arrowhead area fires streaming in the background, NASA's Ikhana unmanned aircraft heads out on a Southern California wildfires imaging mission.
The October 2007 wildfires, including the Witch Wildland fire, plagued southern California and were some of the worst on record. Image from NASA Terra satellite.
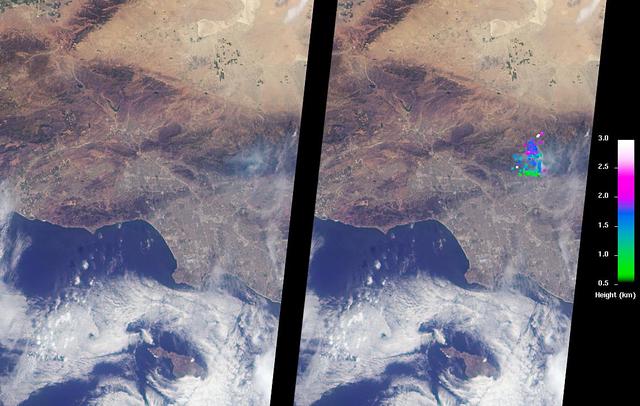
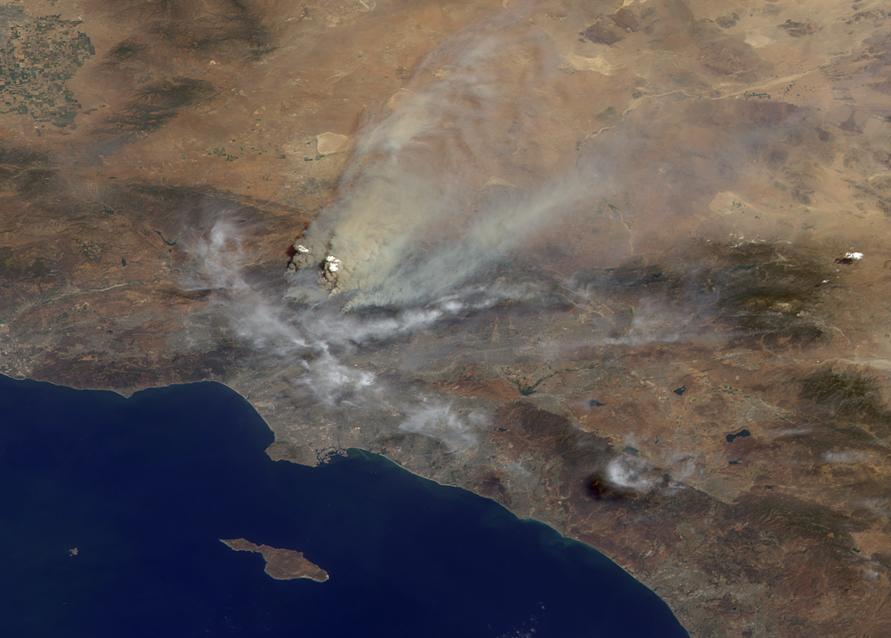
The Los Angeles area is currently suffering the effects of three major wildfires that are blanketing the area with smoke. Over the past few days, Southern California has experienced record-breaking temperatures, topping 110 degrees Fahrenheit in some cities. The heat, in combination with offshore winds, helped to stoke the Sherpa Fire west of Santa Barbara, which has been burning since June 15, 2016. Over the weekend of June 18-19, this fire rapidly expanded in size, forcing freeway closures and evacuations of campgrounds and state beaches. On Monday, June 20, two new fires ignited in the San Gabriel Mountains north of Azusa and Duarte, together dubbed the San Gabriel Complex Fire. They have burned more than 4,900 acres since June 20, sending up plumes of smoke visible to many in the Los Angeles basin and triggering air quality warnings. More than 1,400 personnel have been battling the blazes in the scorching heat, and evacuations were ordered for neighborhoods in the foothills. On June 21, the Multi-angle Imaging SpectroRadiometer (MISR) instrument aboard NASA's Terra satellite captured this view of the San Gabriel Mountains and Los Angeles Basin from its 46-degree forward-viewing camera, which enhances the visibility of the smoke compared to the more conventional nadir (vertical) view. The width of this image is about 75 miles (120 kilometers) across. Smoke from the San Gabriel Complex Fire is visible at the very right of the image. Stereoscopic analysis of MISR's multiple camera angles is used to compute the height of the smoke plume from the San Gabriel Complex Fire. In the right-hand image, these heights are superimposed on the underlying image. The color scale shows that the plume is not much higher than the surrounding mountains. As a result, much of the smoke is confined to the local area. http://photojournal.jpl.nasa.gov/catalog/PIA20718

Large plumes of smoke rising from devastating wildfires burning near Los Angeles and San Diego on Sunday, October 26, 2003, are highlighted in this set of images from NASA Terra spacecraft.
Smoke from multiple wildfires burning in Southern California in October, 2007, can be seen in this false-color image from the Atmospheric Infrared Sounder AIRS on NASA Aqua satellite.
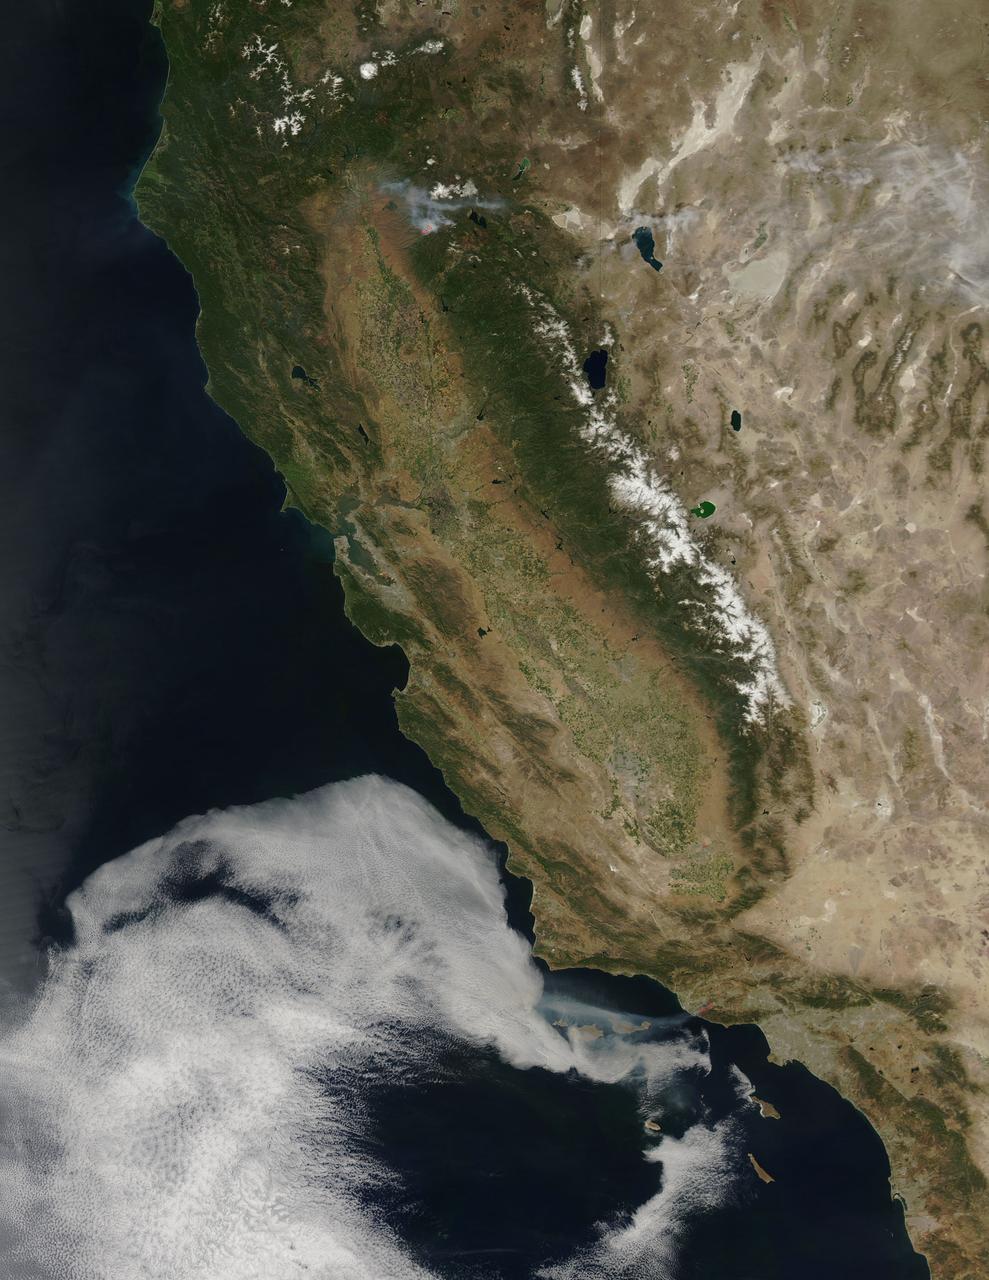
The Multi-angle Imaging SpectroRadiometer MISR instrument on NASA Terra satellite captured this Aug. 30 image of smoke plumes from the Station and other wildfires burning throughout Southern California.

Equipped with a pod-mounted infrared imaging sensor, the Altair UAS aided fire mapping efforts over wildfires in central and southern California in late 2006.

Data from NASA's ECOSTRESS (Ecosystem Spaceborne Thermal Radiometer Experiment on Space Station) instrument aboard the International Space Station shows three wildfires burning in the mountains east and southeast of the Los Angeles area on Sept. 10, 2024. The Bridge Fire started Sept. 8 in the Angeles National Forest during an intense heat wave that blanketed the area for about a week. As of Sept. 13, the fire was only 3% contained. The Line Fire started Sept. 5 in Highland, within San Bernardino County, and spread toward the mountain communities of Running Springs and Big Bear. After more than a week of battling the blaze, firefighters had the conflagration 21% contained. The Airport Fire ignited Sept. 9 in the foothills of the Santa Ana Mountains east of the Orange County city of Irvine and spread into Riverside County. As of Sept. 13, it was 8% contained. The ECOSTRESS instrument measures the temperature of the land rather than air temperatures that most people are familiar with in weather forecasts. Bright white spots in the active fire areas in the visual above indicate a land surface temperature of over 300 degrees Fahrenheit (149 degrees Celsius). Dark red represents areas closer to 100 F (38 C). https://photojournal.jpl.nasa.gov/catalog/PIA26187
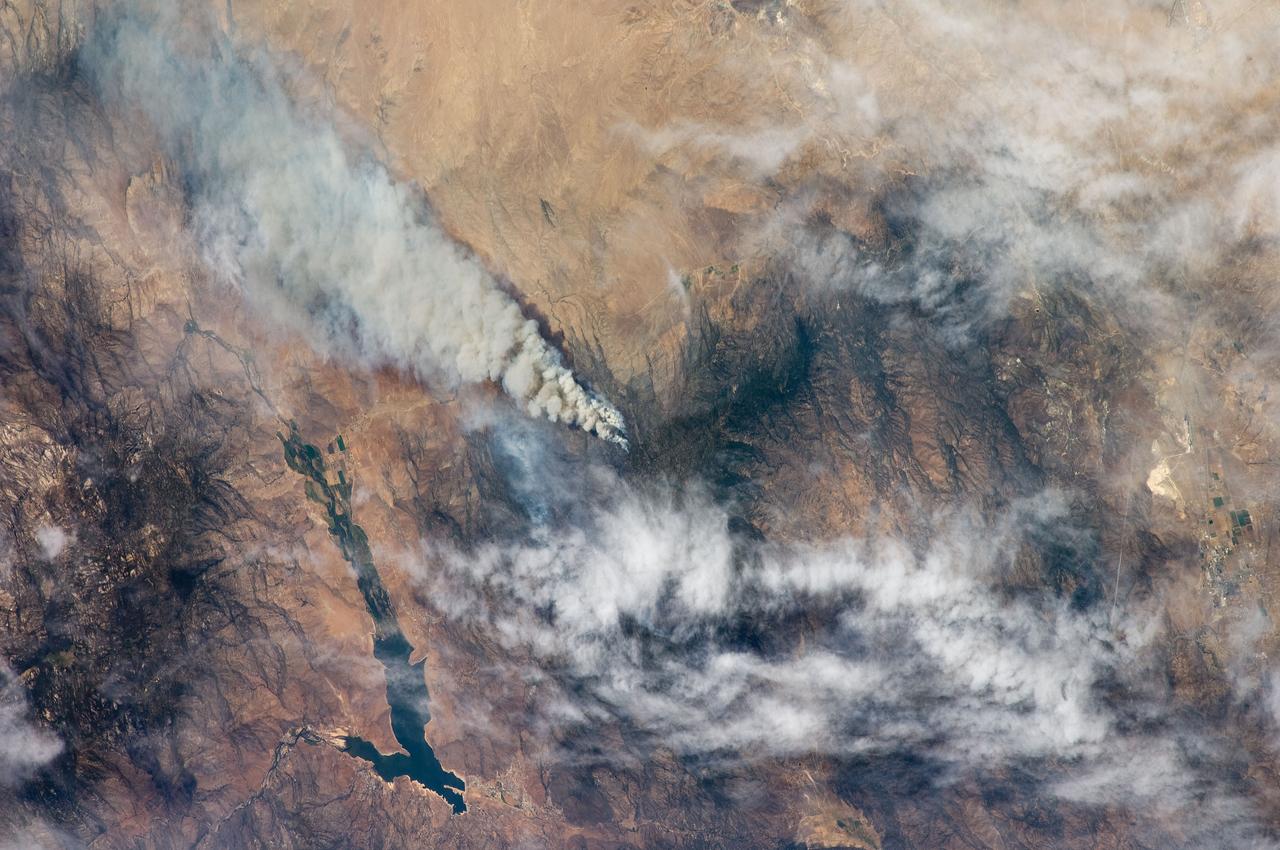
ISS017-E-010310 (4 July 2008) --- The Piute fire in California is featured in this image photographed by an Expedition 17 crewmember on the International Space Station. The Piute fire, burning south of Lake Isabella in the Sequoia National Forest in the southern Sierra Nevada Mountains, is one of the more than 300 wildfires burning across the state of California. The fire started June 28 just north of Twin Oaks, California, and has burned nearly 14,000 acres so far. Current estimates by fire officials suggest the fire may not be brought under control for another two weeks.
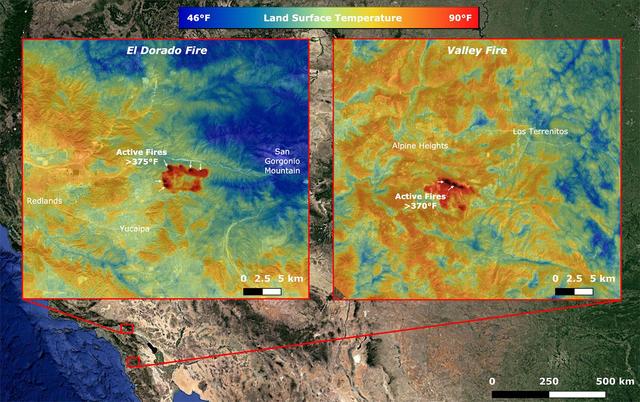
On Sept. 6, NASA's ECOsystem Spaceborne Thermal Radiometer Experiment on Space Station (ECOSTRESS) imaged active fires across California, including the El Dorado fire near Yucaipa and the Valley fire in Japatul Valley in the southern part of the state. As of Sept. 8, there were 25 major wildfires burning in California. Both images, taken at 12:13 a.m. PDT (3:13 a.m. EDT), show multiple concentrated areas of surface temperatures (in red) higher than 375 degrees Fahrenheit (191 degrees Celsius). These high temperature regions were likely where the active fires were occurring. The surrounding areas show abnormally warm middle-of-the-night background surface temperatures (orange) due to the ongoing heat wave. https://photojournal.jpl.nasa.gov/catalog/PIA23788
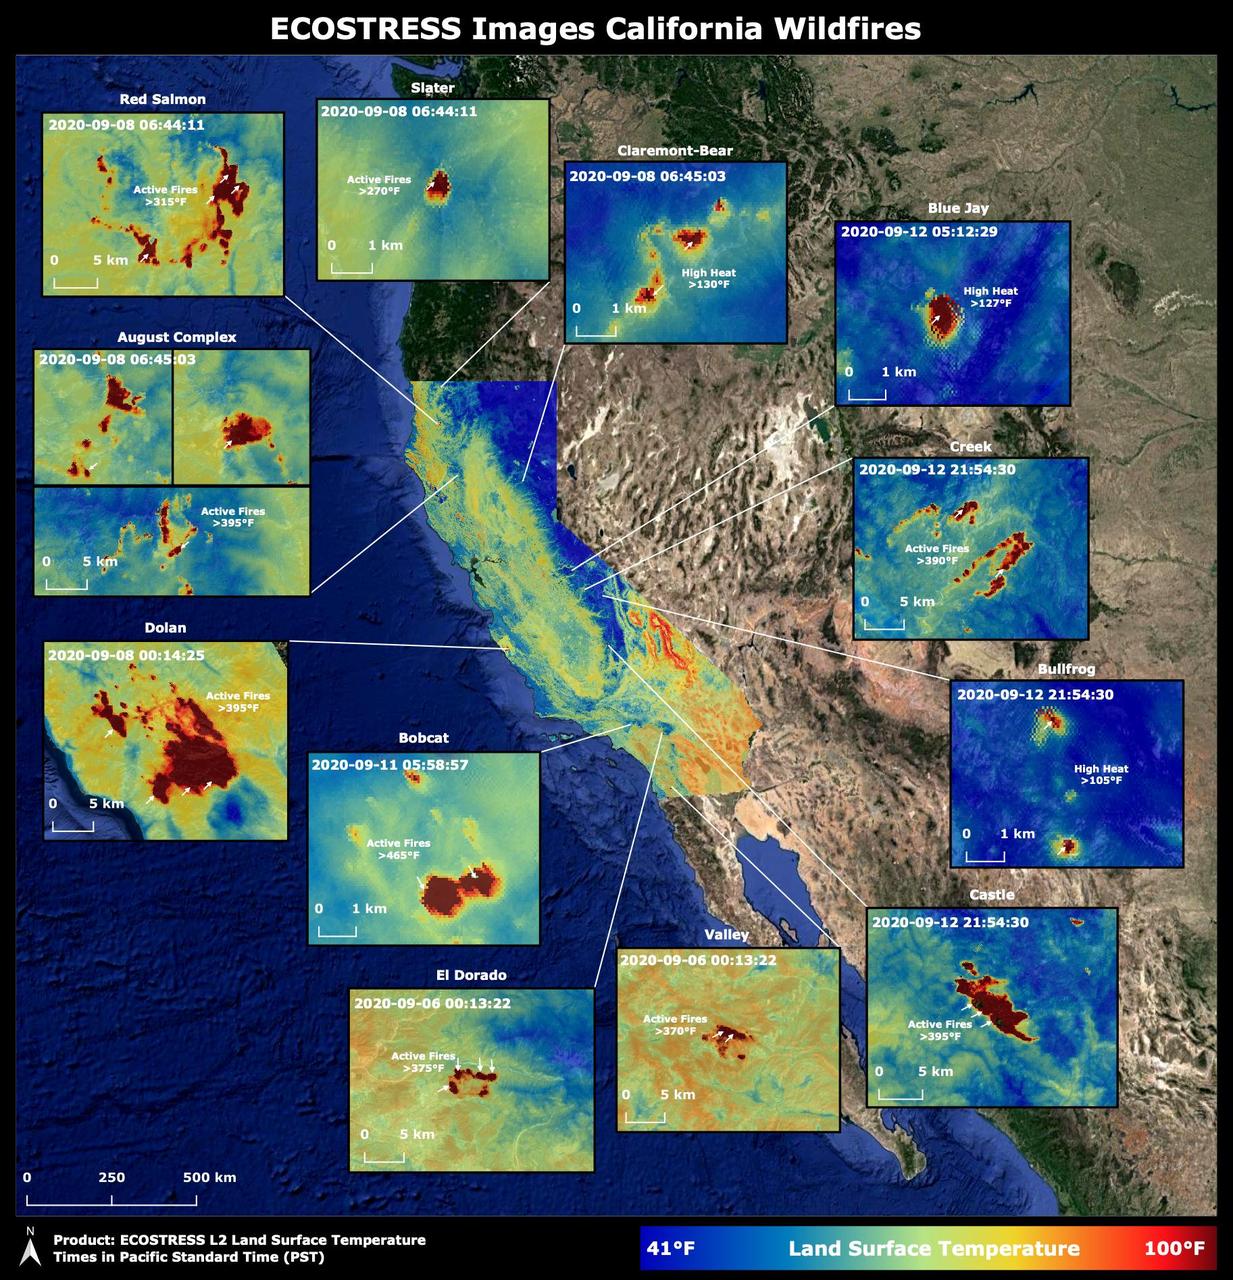
Throughout the month of September 2020, NASA's ECOsystem Spaceborne Thermal Radiometer Experiment on Space Station (ECOSTRESS) imaged multiple wildfires across the state of California. The image above shows the ECOSTRESS land surface temperature of California. Multiple insets highlight a fraction of the multiple fires that have impacted California, with effects seen throughout the U.S. and beyond. The dark red spots show areas of high heat, with arrows pointing out the active fires. The contiguous California image was stitched together from multiple evening (10 p.m.-6 a.m. PDT) ECOSTRESS images from Sept 6 to 12, 2020, to generate a cloud-free statewide map. NASA's Jet Propulsion Laboratory in Southern California built and manages the ECOSTRESS mission for the Earth Science Division in the Science Mission Directorate at NASA Headquarters in Washington. ECOSTRESS is an Earth Venture Instrument mission; the program is managed by NASA's Earth System Science Pathfinder program at NASA's Langley Research Center in Hampton, Virginia. Future studies could use ECOSTRESS data products in a similar fashion as LST was used to assess the fires pictured above. https://photojournal.jpl.nasa.gov/catalog/PIA23721
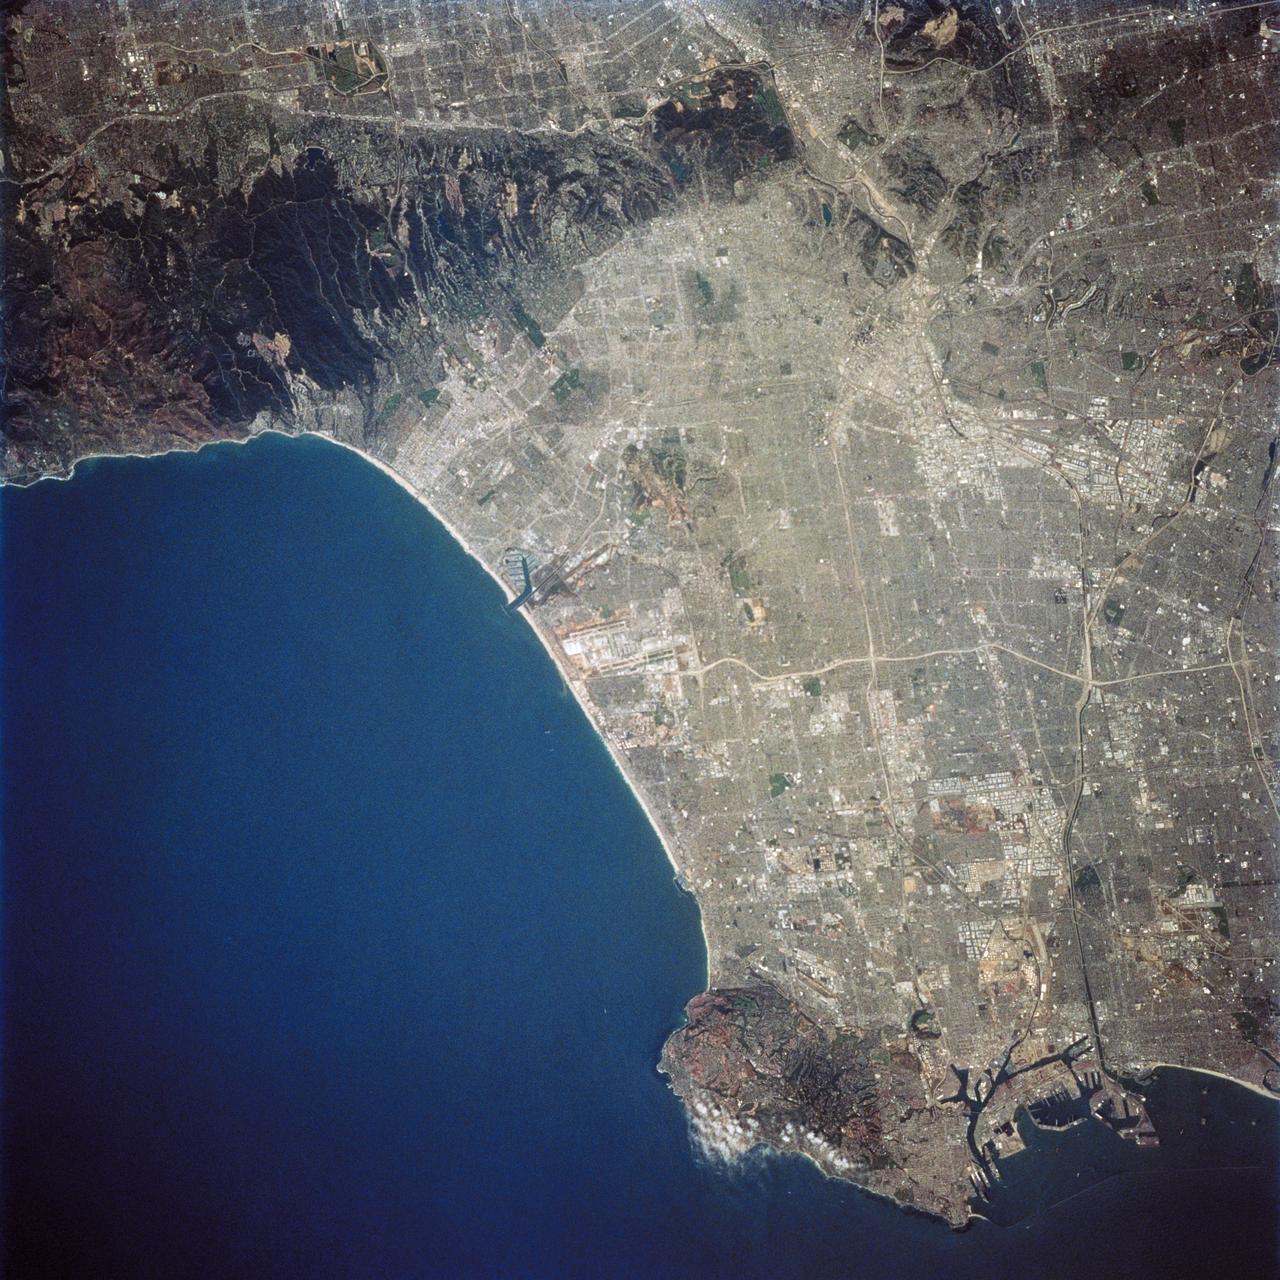
STS059-227-050 (9-20 April 1994) --- A low altitude, and unusually clear air, provided perhaps the most detailed view of Los Angeles, California ever obtained during a shuttle flight. Orient with the bulk of the ocean to the lower left. Then Long Beach is in the lower right, just east of the Palos Verdes Hills that extend into the Pacific Ocean. Marina del Rey is cut into the straight segment of beach, with Los Angeles International Airport (LAX) clearly visible to the southeast. Downtown Los Angeles is the light-toned sprawl in the upper right, with the rectangular grid pattern of Pasadena extending out of the picture. The Santa Monica Mountains to the upper left extend east-west, separating the San Fernando Valley (epicenter of the 1993 earthquake) from the Los Angeles Basin proper. It is impossible to determine by photo interpretation whether or not the de-vegetated scars along the southern edge of the mountains represent man-made features (real-estate development) or wildfires.
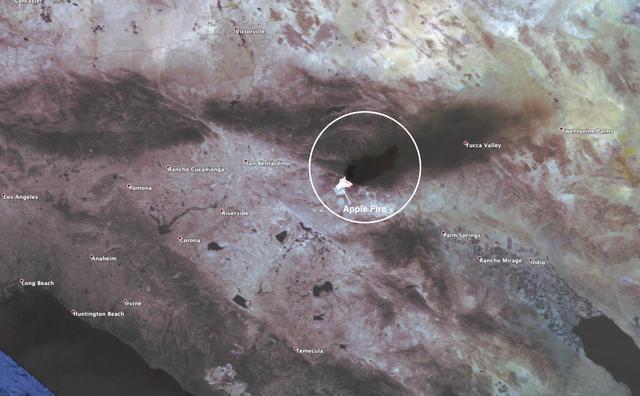
This observation shows the burn area and smoke plume created by the Apple fire in Southern California on Aug. 1, 2020. The observation was made possible by NASA's Ecosystem Spaceborne Thermal Radiometer Experiment on Space Station (ECOSTRESS). Data gathered by the mission can be further refined to measure the temperature of the wildfire, smoke plume and surrounding landscape. ECOSTRESS collected this data when the space station passed over the region at about 1:15 p.m. PST on Saturday, Aug. 1, 2020, when the burn area was approximately 4,000 acres in size. As of Aug. 3, it was more than 26,000 acres. Black smoke can be seen drifting east and over Joshua Tree National Park in the Mojave Desert. With a resolution of about 77 by 77 yards (70 by 70 meters), the image enables surface-temperature conditions down to the size of a football field to be studied. Tasked with detecting plant water use and stress, ECOSTRESS measures the temperature of plants as they heat up when they run out of water. But it can also measure and track heat-related phenomena like fires, heat waves, and volcanoes. https://photojournal.jpl.nasa.gov/catalog/PIA23799
According to the NBCnews.com, Southern California firefighters were battling a growing, brush-fueled wildfire early Friday that had reached the beach in Ventura County and was pushing toward the upscale city of Malibu, officials said. Dubbed the Springs Fire, this "monster" of a wildfire has been made worse by howling Santa Ana winds and unusually dry vegetation. As of 2 am local time in California on Friday the 3rd, it was within "seven or eight miles" of Malibu, Ventura County Fire Department spokesman Bill Nash said. Weather conditions are not cooperating in the containment of this fire. The Weather Channel has predicted dry winds from offshore that will bring gusts of 40 to 50 miles per hour to the Southern California region on Friday the 3rd which could easily spread the fire. A complication to the winds is the extremely dry plant life left from a season in which only about five inches of rain fell in the area. The Springs Fire grew to 10,000 acres and was ten percent contained as of early Friday morning, according to the California Department of Forestry and Fire Prevention. Evacuations took place Thursday, and as of Friday morning 15 homes had been damaged. More than 2,000 homes and 100 commercial properties were under threat from the fire and those numbers could grow with weather conditions today (May 3). Currently the fire is burning in a rural area outside of Malibu, but it doesn't have to go very far to get to some expensive homes and more populated areas. It's current direction has it burning down the mountainside toward Malibu. Firefighters expect to receive help from tankers and helicopters in the air Friday morning, according to a release from the Ventura County Fire Department. The cause of the fire remained under investigation Friday. There had been no lightning or other natural fire-starting phenomenon in the area when the blaze began, Nash said. This natural-color satellite image was collected by the Moderate Resolution Imaging Spectroradiometer (MODIS) aboard the Aqua satellite on May 02, 2013. Actively burning areas, detected by MODIS’s thermal bands, are outlined in red. NASA image courtesy Jeff Schmaltz LANCE/EOSDIS MODIS Rapid Response Team, GSFC. Caption by Lynn Jenner with information from NBCnews.com <b><a href="http://www.nasa.gov/audience/formedia/features/MP_Photo_Guidelines.html" rel="nofollow">NASA image use policy.</a></b> <b><a href="http://www.nasa.gov/centers/goddard/home/index.html" rel="nofollow">NASA Goddard Space Flight Center</a></b> enables NASA’s mission through four scientific endeavors: Earth Science, Heliophysics, Solar System Exploration, and Astrophysics. Goddard plays a leading role in NASA’s accomplishments by contributing compelling scientific knowledge to advance the Agency’s mission. <b>Follow us on <a href="http://twitter.com/NASA_GoddardPix" rel="nofollow">Twitter</a></b> <b>Like us on <a href="http://www.facebook.com/pages/Greenbelt-MD/NASA-Goddard/395013845897?ref=tsd" rel="nofollow">Facebook</a></b> <b>Find us on <a href="http://instagram.com/nasagoddard?vm=grid" rel="nofollow">Instagram</a></b>
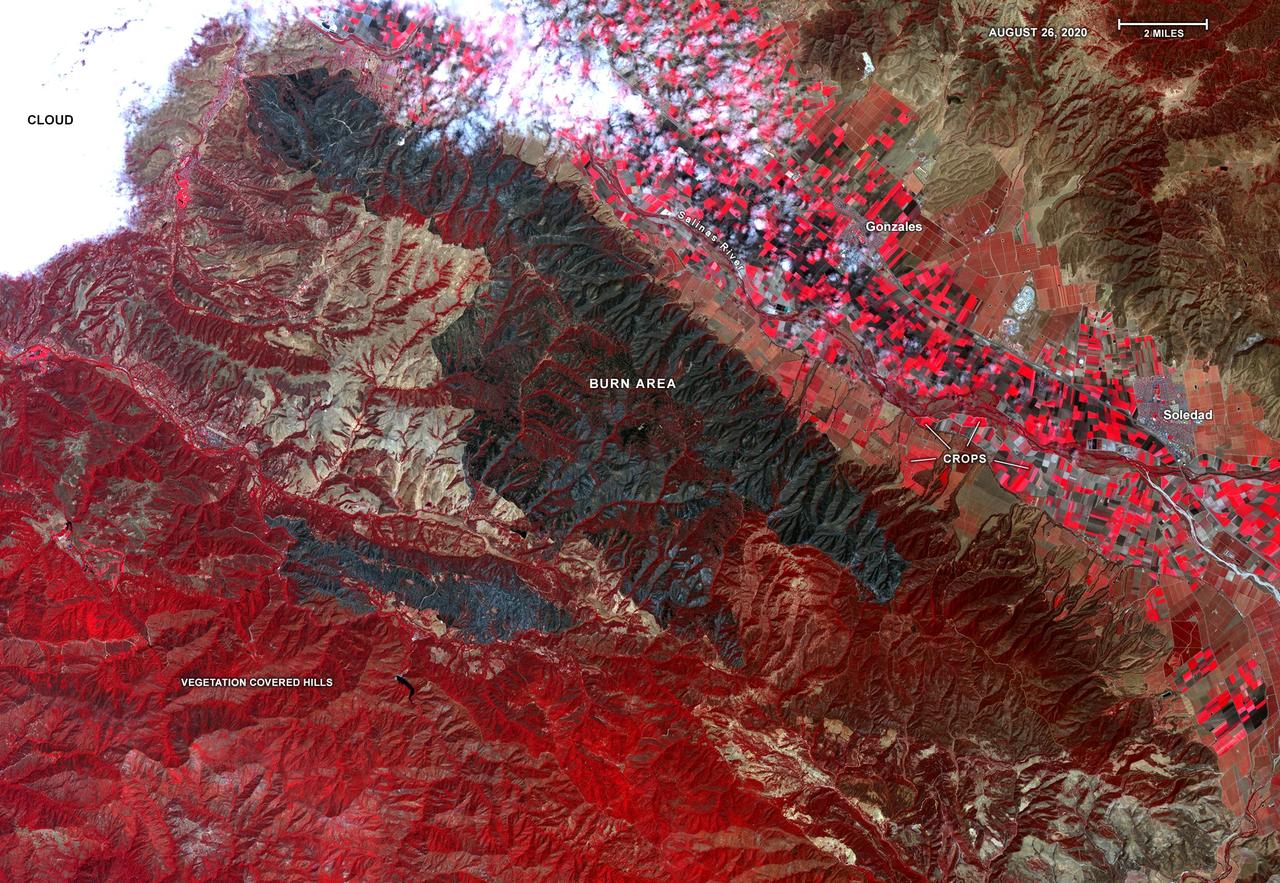
On Aug. 26, 2020, Advanced Spaceborne Thermal Emission and Reflection Radiometer (ASTER) instrument aboard NASA's Terra satellite passed over the River and Carmel fires in Monterey County, California, got a bird's eye view of the vast fire burn area. This false-color map shows the burn area as dark blue and gray, in the center of the image. Vegetation is in red, including agricultural crops along the Salinas River (bright red rectangles) surrounding the towns of Soledad and Gonzales; bare areas with no vegetation and rock are shown in tan and brown. The city of Salinas is in the upper left of the image, obscured by thick clouds. ASTER obtains high-resolution (15-90 square meters, or 161-969 square feet, per pixel) images of the Earth in 14 wavelengths of the electromagnetic spectrum, ranging from visible to thermal infrared light. Data from ASTER — which is managed by Japan Space Systems and NASA's Jet Propulsion Laboratory in Southern California — are used by scientists to create detailed maps of land surface temperature, how much infrared energy the land emits, how much light the land reflects and its elevation. On this occasion, ASTER was able to support NASA's Disaster Program response to the state's wildfires, providing data products that can be used by resources on the ground to fight the fires and for scientists to better understand their long-term effects. The area covered here is 21.4 by 31 miles (34.4 by 49.9 kilometers). https://photojournal.jpl.nasa.gov/catalog/PIA23800
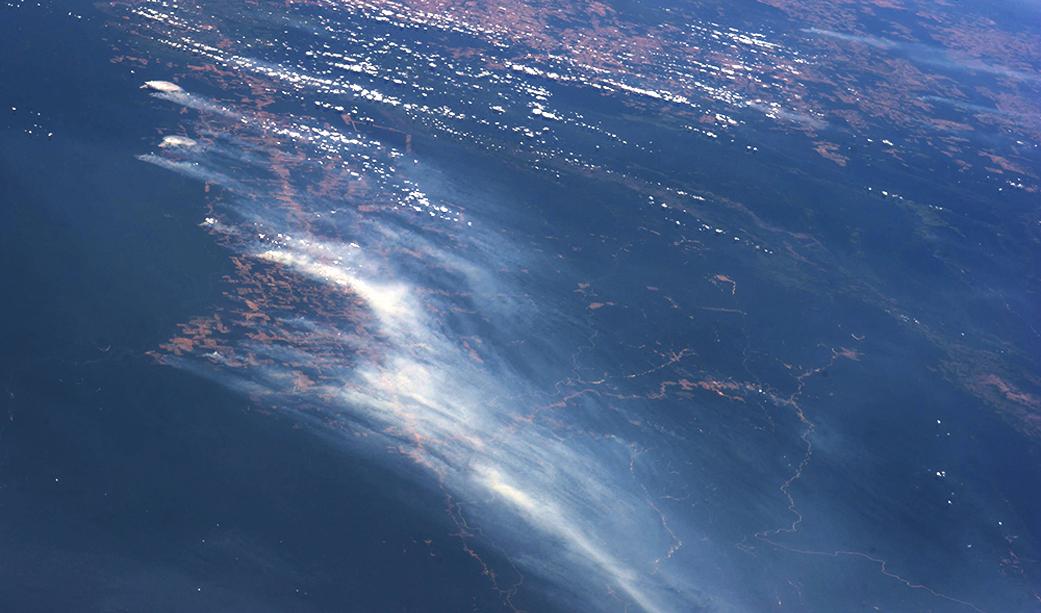
El Niño conditions in 2015 and early 2016 altered rainfall patterns around the world. In the Amazon, El Niño reduced rainfall during the wet season, leaving the region drier at the start of the 2016 dry season than any year since 2002, according to NASA satellite data. Wildfire risk for the dry season months of July to October this year now exceeds fire risk in 2005 and 2010, drought years when wildfires burned large areas of Amazon rainforest, said Doug Morton, an Earth scientist at NASA’s Goddard Space Flight Center who helped create the fire forecast. "Severe drought conditions at the start of the dry season set the stage for extreme fire risk in 2016 across the southern Amazon," Morton said. The Amazon fire forecast uses the relationship between climate and active fire detections from NASA satellites to predict fire season severity during the region’s dry season. Developed in 2011 by scientists at University of California, Irvine and NASA’s Goddard Space Flight Center, the forecast model is focused particularly on the link between sea surface temperatures and fire activity. Warmer sea surface temperatures in the tropical Pacific (El Niño) and Atlantic oceans shift rainfall away from the Amazon region, increasing the risk of fires during dry season months. Read more: <a href="http://go.nasa.gov/2937ADt" rel="nofollow">go.nasa.gov/2937ADt</a> <b><a href="http://www.nasa.gov/audience/formedia/features/MP_Photo_Guidelines.html" rel="nofollow">NASA image use policy.</a></b> <b><a href="http://www.nasa.gov/centers/goddard/home/index.html" rel="nofollow">NASA Goddard Space Flight Center</a></b> enables NASA’s mission through four scientific endeavors: Earth Science, Heliophysics, Solar System Exploration, and Astrophysics. Goddard plays a leading role in NASA’s accomplishments by contributing compelling scientific knowledge to advance the Agency’s mission. <b>Follow us on <a href="http://twitter.com/NASAGoddardPix" rel="nofollow">Twitter</a></b> <b>Like us on <a href="http://www.facebook.com/pages/Greenbelt-MD/NASA-Goddard/395013845897?ref=tsd" rel="nofollow">Facebook</a></b> <b>Find us on <a href="http://instagrid.me/nasagoddard/?vm=grid" rel="nofollow">Instagram</a></b>
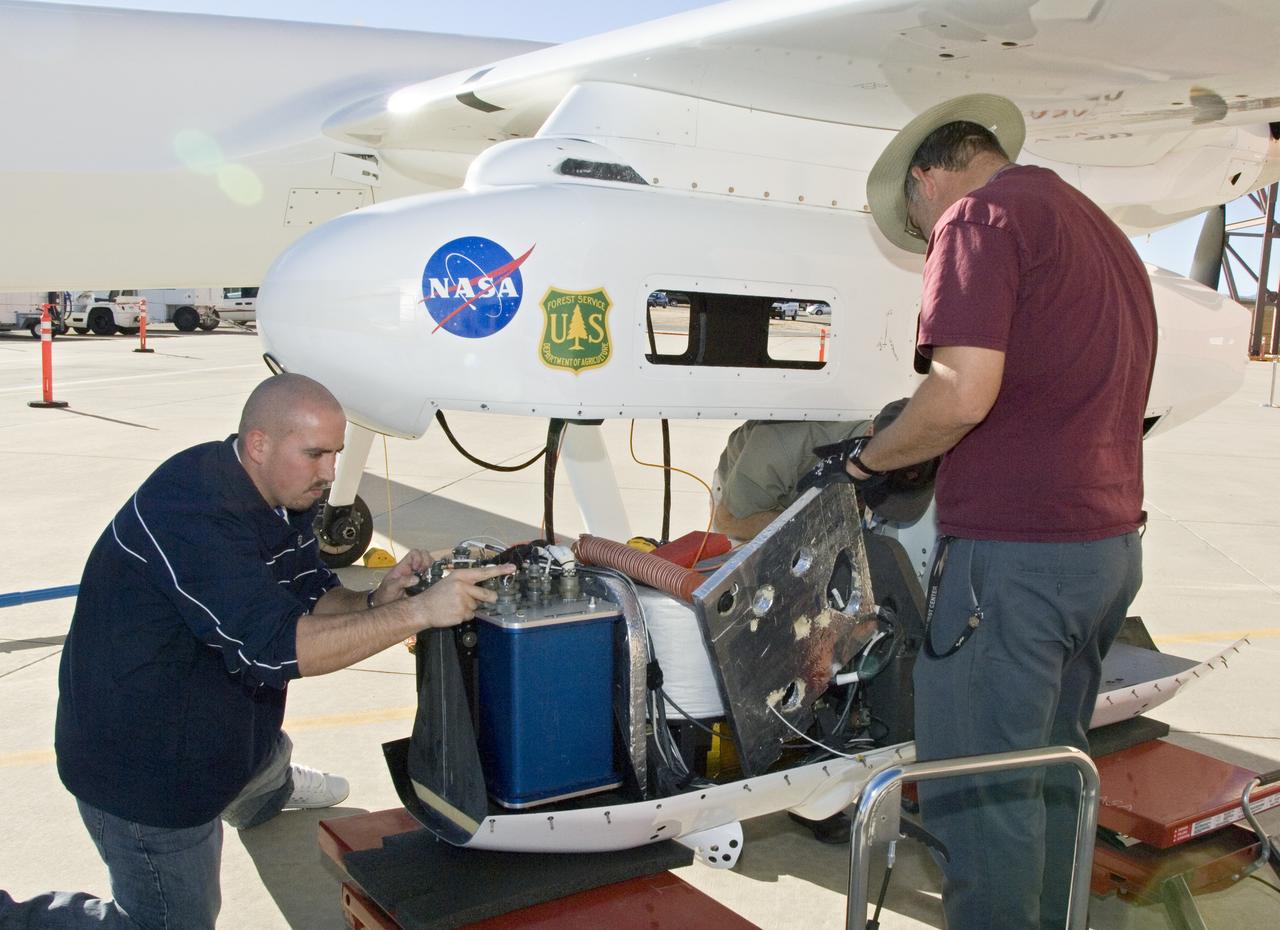
NASA Dryden's Ikhana ground crewmen Gus Carreno and James Smith load the thermal-infrared imaging scanner pallet into the Ikhana's underwing payload pod.
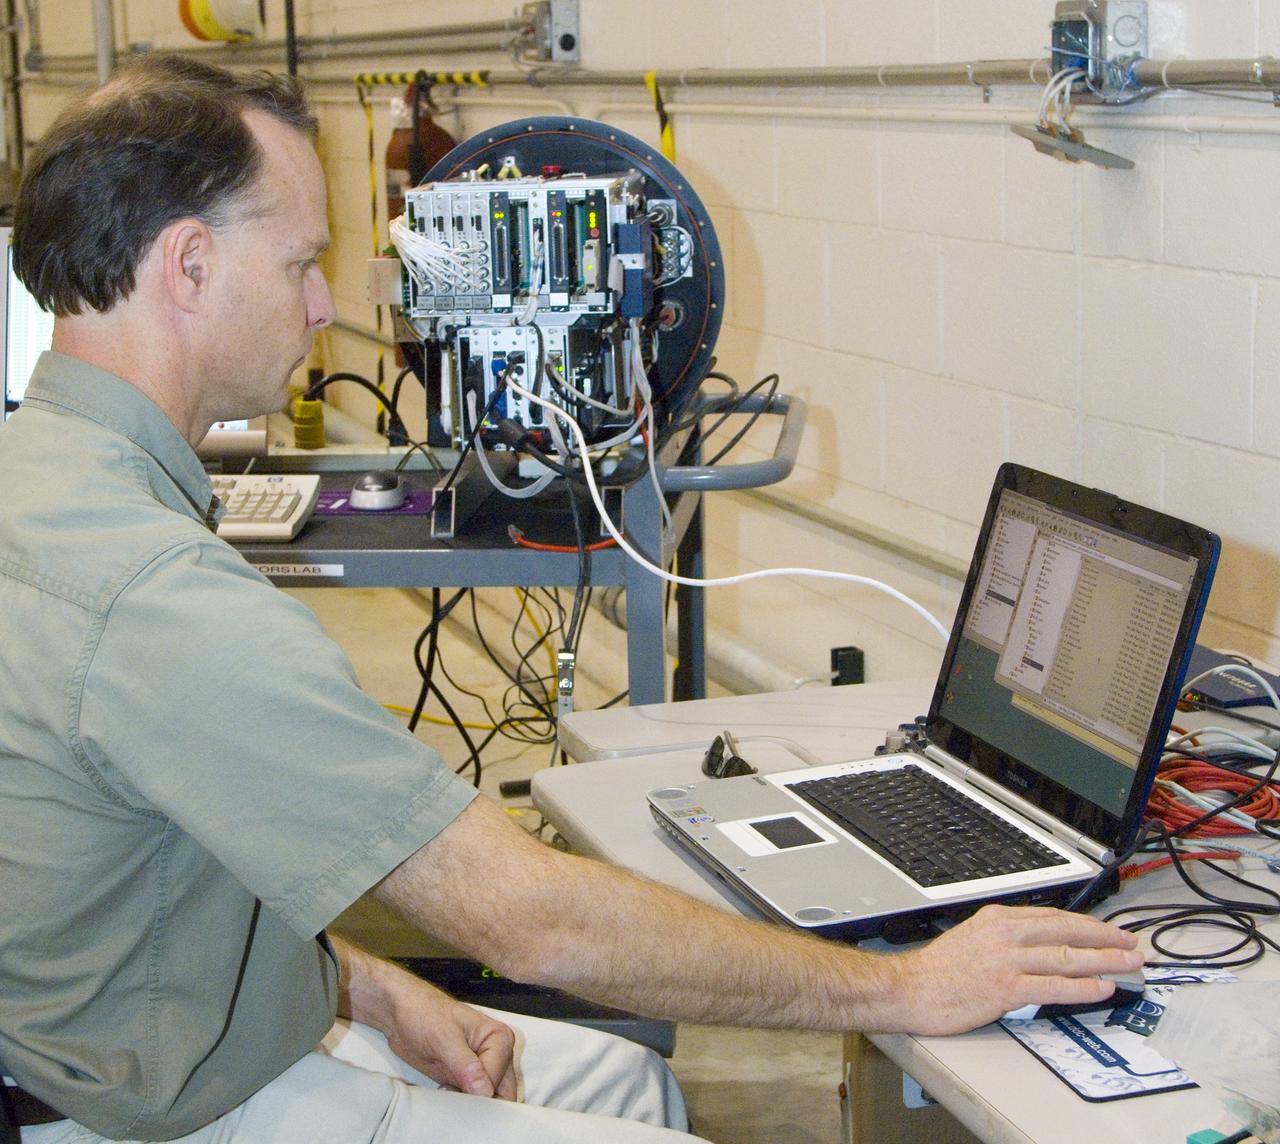
NASA Ames engineer Ted Hildum checks out the thermal-infrared scanner computer before it is loaded on NASA's Ikhana unmanned aircraft.
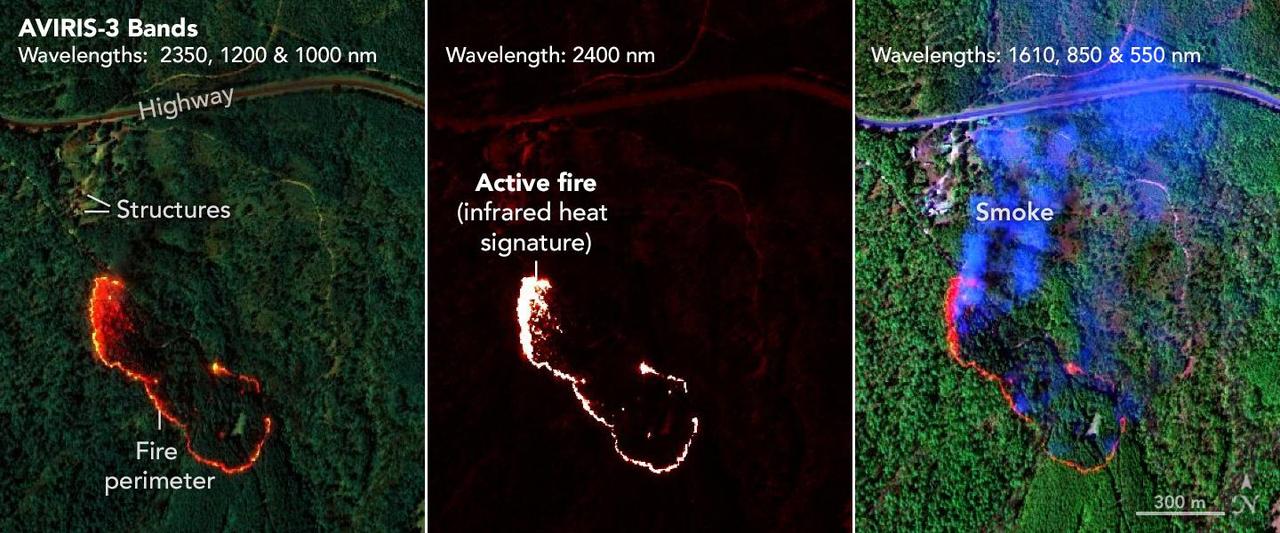
NASA's AVIRIS-3 sensor, an airborne imaging spectrometer built and operated by the agency's Jet Propulsion Laboratory in Southern California, captured infrared data on a wildfire about 3 miles (5 kilometers) west of the town of Mount Vernon, Alabama, on March 21, 2025. Within minutes of flying over, real-time maps of the fire were sent via satellite internet to firefighters with the Alabama Forestry Commission, who used it to contain the fire, preventing it from reaching four buildings. The first image in the series combines reflection data from AVIRIS-3 (Airborne Visible Infrared Imaging Spectrometer 3) at three infrared wavelengths that are invisible to the human eye – 2,350 nanometers, 1,200 nanometers, and 1,000 nanometers. In the resulting composite image, the colors indicate where the fire was burning most intensely. Orange and red areas show cooler-burning areas, while yellow indicates the most intense flames. Burned areas show up as dark red or brown. The second image in the series looks solely at the 2,400 nanometers wavelength. This wavelength is particularly useful for seeing hot spots and the perimeters of fires, which show brightly against a red background. The third image in the series combines light at 1,610 nanometers, 850 nanometers, and 550 nanometers. This view shows burn areas and smoke. The AVIRIS-3 sensor belongs to a line of imaging spectrometers built at JPL since 1986. The instruments have been used to study a wide range of phenomena – including fire – by measuring sunlight reflecting from the planet's surface. Data from imaging spectrometers like AVIRIS-3 typically takes days or weeks to be processed into highly detailed, multilayer image products used for research. By simplifying the calibration algorithms, researchers were able to process data on a computer aboard the plane in a sliver of the time it otherwise would have taken, and airborne satellite internet connectivity enabled the images to be distributed almost immediately, while the plane was still in flight, rather than after it landed. Flying about 9,000 feet (3,000 meters) in altitude aboard a NASA King Air B200 research plane, AVIRIS-3 collected data on the Castleberry Fire while preparing for prescribed burn experiments that took place in the Geneva State Forest in Alabama on March 28 and at Fort Stewart-Hunter Army Airfield in Georgia from April 14 to 20. The burns were part of a NASA 2025 FireSense Airborne Campaign. https://photojournal.jpl.nasa.gov/catalog/PIA26499
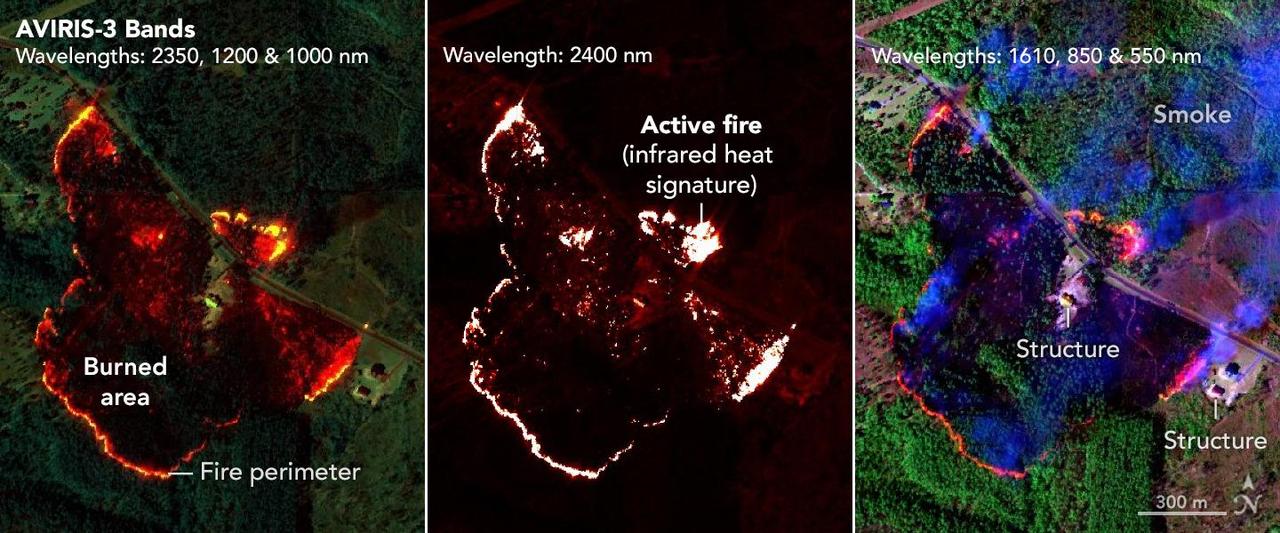
NASA's AVIRIS-3 sensor, an airborne imaging spectrometer built and operated by the agency's Jet Propulsion Laboratory in Southern California, captured infrared data of a wildfire 4 miles (2.5 kilometers) southwest of the unincorporated community of Perdido, Alabama, on March 21, 2025. Within minutes of flying over, real-time maps of the fire were sent via satellite internet to firefighters with the Alabama Forestry Commission, who used it to contain the fire, preventing it from reaching six buildings. The first image in the series combines reflection data from AVIRIS-3 (Airborne Visible Infrared Imaging Spectrometer 3) at three infrared wavelengths that are invisible to the human eye – 2,350 nanometers, 1,200 nanometers, and 1,000 nanometers. In the resulting composite image, the colors indicate where the fire was burning most intensely. Orange and red areas show cooler-burning areas, while yellow indicates the most intense flames. Burned areas show up as dark red or brown. The second image in the series looks solely at the 2,400 nanometers wavelength. The images are particularly useful for seeing hot spots and the perimeters of fires, which show brightly against a red background. The third image in the series combines light at 1,610 nanometers, 850 nanometers, and 550 nanometers. This view shows burn areas and smoke. The AVIRIS-3 sensor belongs to a line of imaging spectrometers built at JPL since 1986. The instruments have been used to study a wide range of phenomena – including fire – by measuring sunlight reflecting from the planet's surface. Data from imaging spectrometers like AVIRIS-3 typically takes days or weeks to be processed into highly detailed, multilayer image products used for research. By simplifying the calibration algorithms, researchers were able to process data on a computer aboard the plane in a sliver of the time it otherwise would have taken, and airborne satellite internet connectivity enabled the images to be distributed almost immediately, while the plane was still in flight, rather than after it landed. Flying about 9,000 feet (3,000 meters) in altitude aboard a NASA King Air B200 research plane, AVIRIS-3 collected data on the Castleberry Fire while preparing for prescribed burn experiments that took place in the Geneva State Forest in Alabama on March 28 and at Fort Stewart-Hunter Army Airfield in Georgia from April 14 to 20. The burns were part of a NASA 2025 FireSense Airborne Campaign. https://photojournal.jpl.nasa.gov/catalog/PIA26498
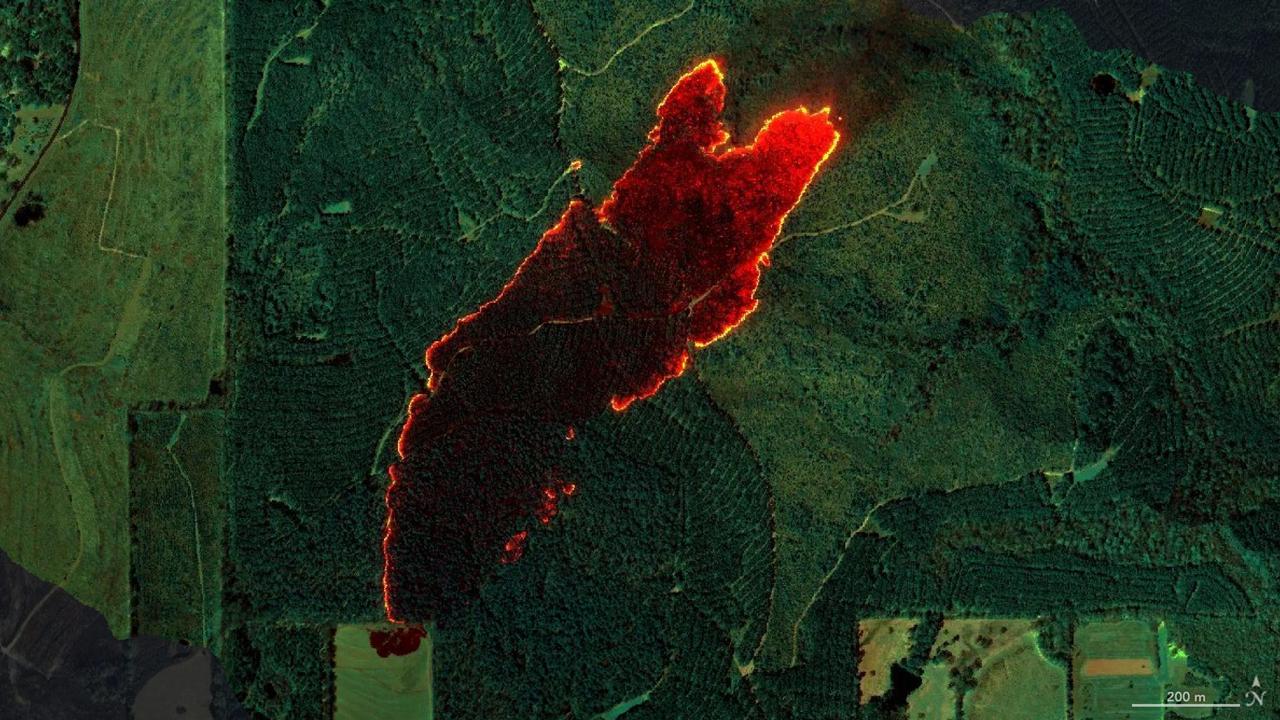
NASA's AVIRIS-3 sensor, an airborne imaging spectrometer built and operated by the agency's Jet Propulsion Laboratory in Southern California, captured infrared data of a roughly 120-acre wildfire about 3 miles (5 kilometers) east of the town of Castleberry, Alabama, on March 19, 2025. Within minutes of flying over the Castleberry Fire, which had not previously been reported to authorities, real-time maps of where burning was most intense were sent via satellite internet to firefighters with the Alabama Forestry Commission, who used it to decide how to deploy their personnel and firefighting equipment. The image combines reflection data from AVIRIS-3 (Airborne Visible Infrared Imaging Spectrometer 3) at three infrared wavelengths that are invisible to the human eye: 2,350 nanometers, 1,200 nanometers, and 1,000 nanometers. In the resulting composite image, the colors indicate where the fire was burning most intensely. Orange and red areas show cooler-burning areas, while yellow indicates the most intense flames. Burned areas show up as dark red or brown. The AVIRIS-3 sensor belongs to a line of imaging spectrometers built at JPL since 1986. The instruments have been used to study a wide range of phenomena – including fire – by measuring sunlight reflecting from the planet's surface. Data from imaging spectrometers like AVIRIS-3 typically takes days or weeks to be processed into highly detailed, multilayer image products used for research. By simplifying the calibration algorithms, researchers were able to process data on a computer aboard the plane in a sliver of the time it otherwise would have taken, and airborne satellite internet connectivity enabled the images to be distributed almost immediately, while the plane was still in flight, rather than after it landed. Flying about 9,000 feet (3,000 meters) in altitude aboard a NASA King Air B200 research plane, AVIRIS-3 collected data on the Castleberry Fire while preparing for prescribed burn experiments that took place in the Geneva State Forest in Alabama on March 28 and at Fort Stewart-Hunter Army Airfield in Georgia from April 14 to 20. The burns were part of a NASA 2025 FireSense Airborne Campaign. https://photojournal.jpl.nasa.gov/catalog/PIA26497
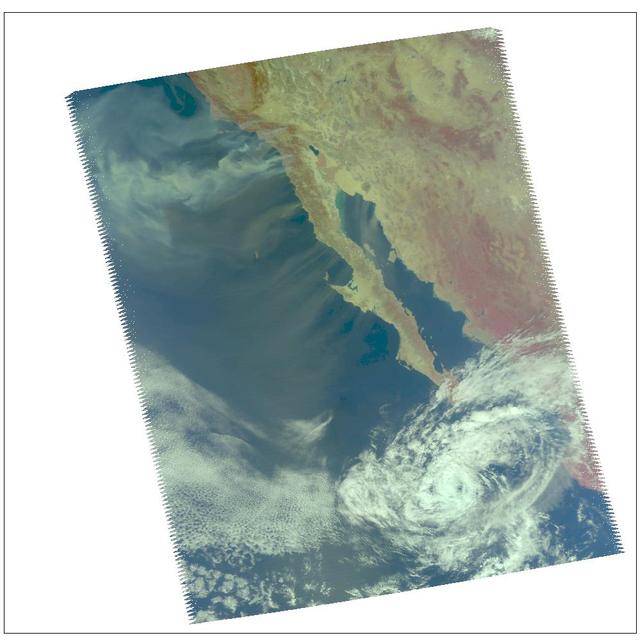
![A swirling Eastern Pacific Ocean storm system headed for California was spotted by NOAA's GOES-West satellite on February 28. According to the National Weather Service, this storm system has the potential to bring heavy rainfall to the drought-stricken state. The storm was captured using visible data from NOAA's GOES-West or GOES-15 satellite on Feb. 28 at 1915 UTC/11:15 a.m. PST was made into an image by NASA/NOAA's GOES Project at NASA's Goddard Space Flight Center in Greenbelt, Md. The storm's center appeared as a tight swirl, with bands of clouds and showers already sweeping over the state extending from northern California to Baja California, Mexico. At 11:30 a.m. PST on February 28, Bill Patzert, climatologist at NASA's Jet Propulsion Laboratory in Pasadena, Calif. said, "Right now from northern to southern California we are being battered by very heavy rain, strong winds and our coastal communities are being battered by high surf. Through the weekend we are bracing for mud and rock slides in areas that recently burned [from wildfires]. Flooding is looming up and down the state." The National Weather Service (NWS) serving Los Angeles posted a Flood Watch for the region on Friday, February 28. The Flood Watch notes the "potential for flash flooding and debris flows for some 2013 and 2014 burn areas in Los Angeles County from this morning through Saturday evening (March 1).” The NWS Flood Watch also noted "a very strong and dynamic storm will bring a significant amount of rain to much of southwestern California through Saturday evening. A flash flood watch has been issued for several recent burn areas in Los Angeles County due to the abundant rainfall expected. Rain rates at times are expected to range from a half inch to one inch per hour which could cause significant mud and debris flows. There will be a chance of thunderstorms with locally higher rainfall rates." "Californians haven't seen rain and wind this powerful in 3 years," Patzert said. "By early next week, as this system moves east, this powerful system will wreak havoc causing snow and ice storms through the Midwest into the Northeast." GOES satellites provide the kind of continuous monitoring necessary for intensive data analysis. Geostationary describes an orbit in which a satellite is always in the same position with respect to the rotating Earth. This allows GOES to hover continuously over one position on Earth's surface, appearing stationary. As a result, GOES provide a constant vigil for the atmospheric "triggers" for severe weather conditions such as tornadoes, flash floods, hail storms and hurricanes. On a positive note, Patzert noted, "This is a nice down payment on drought recovery in the parched Western U.S." For updated information about the storm system, visit NOAA's National Weather Service website: <a href="http://www.weather.gov" rel="nofollow">www.weather.gov</a> For more information about GOES satellites, visit: <a href="http://www.goes.noaa.gov/" rel="nofollow">www.goes.noaa.gov/</a> or <a href="http://goes.gsfc.nasa.gov/" rel="nofollow">goes.gsfc.nasa.gov/</a> Rob Gutro NASA's Goddard Space Flight Center <b><a href="http://www.nasa.gov/audience/formedia/features/MP_Photo_Guidelines.html" rel="nofollow">NASA image use policy.</a></b> <b><a href="http://www.nasa.gov/centers/goddard/home/index.html" rel="nofollow">NASA Goddard Space Flight Center</a></b> enables NASA’s mission through four scientific endeavors: Earth Science, Heliophysics, Solar System Exploration, and Astrophysics. Goddard plays a leading role in NASA’s accomplishments by contributing compelling scientific knowledge to advance the Agency’s mission. <b>Follow us on <a href="http://twitter.com/NASAGoddardPix" rel="nofollow">Twitter</a></b> <b>Like us on <a href="http://www.facebook.com/pages/Greenbelt-MD/NASA-Goddard/395013845897?ref=tsd" rel="nofollow">Facebook</a></b> <b>Find us on <a href="http://instagram.com/nasagoddard?vm=grid" rel="nofollow">Instagram</a></b>](https://images-assets.nasa.gov/image/GSFC_20171208_Archive_e001192/GSFC_20171208_Archive_e001192~medium.jpg)
A swirling Eastern Pacific Ocean storm system headed for California was spotted by NOAA's GOES-West satellite on February 28. According to the National Weather Service, this storm system has the potential to bring heavy rainfall to the drought-stricken state. The storm was captured using visible data from NOAA's GOES-West or GOES-15 satellite on Feb. 28 at 1915 UTC/11:15 a.m. PST was made into an image by NASA/NOAA's GOES Project at NASA's Goddard Space Flight Center in Greenbelt, Md. The storm's center appeared as a tight swirl, with bands of clouds and showers already sweeping over the state extending from northern California to Baja California, Mexico. At 11:30 a.m. PST on February 28, Bill Patzert, climatologist at NASA's Jet Propulsion Laboratory in Pasadena, Calif. said, "Right now from northern to southern California we are being battered by very heavy rain, strong winds and our coastal communities are being battered by high surf. Through the weekend we are bracing for mud and rock slides in areas that recently burned [from wildfires]. Flooding is looming up and down the state." The National Weather Service (NWS) serving Los Angeles posted a Flood Watch for the region on Friday, February 28. The Flood Watch notes the "potential for flash flooding and debris flows for some 2013 and 2014 burn areas in Los Angeles County from this morning through Saturday evening (March 1).” The NWS Flood Watch also noted "a very strong and dynamic storm will bring a significant amount of rain to much of southwestern California through Saturday evening. A flash flood watch has been issued for several recent burn areas in Los Angeles County due to the abundant rainfall expected. Rain rates at times are expected to range from a half inch to one inch per hour which could cause significant mud and debris flows. There will be a chance of thunderstorms with locally higher rainfall rates." "Californians haven't seen rain and wind this powerful in 3 years," Patzert said. "By early next week, as this system moves east, this powerful system will wreak havoc causing snow and ice storms through the Midwest into the Northeast." GOES satellites provide the kind of continuous monitoring necessary for intensive data analysis. Geostationary describes an orbit in which a satellite is always in the same position with respect to the rotating Earth. This allows GOES to hover continuously over one position on Earth's surface, appearing stationary. As a result, GOES provide a constant vigil for the atmospheric "triggers" for severe weather conditions such as tornadoes, flash floods, hail storms and hurricanes. On a positive note, Patzert noted, "This is a nice down payment on drought recovery in the parched Western U.S." For updated information about the storm system, visit NOAA's National Weather Service website: <a href="http://www.weather.gov" rel="nofollow">www.weather.gov</a> For more information about GOES satellites, visit: <a href="http://www.goes.noaa.gov/" rel="nofollow">www.goes.noaa.gov/</a> or <a href="http://goes.gsfc.nasa.gov/" rel="nofollow">goes.gsfc.nasa.gov/</a> Rob Gutro NASA's Goddard Space Flight Center <b><a href="http://www.nasa.gov/audience/formedia/features/MP_Photo_Guidelines.html" rel="nofollow">NASA image use policy.</a></b> <b><a href="http://www.nasa.gov/centers/goddard/home/index.html" rel="nofollow">NASA Goddard Space Flight Center</a></b> enables NASA’s mission through four scientific endeavors: Earth Science, Heliophysics, Solar System Exploration, and Astrophysics. Goddard plays a leading role in NASA’s accomplishments by contributing compelling scientific knowledge to advance the Agency’s mission. <b>Follow us on <a href="http://twitter.com/NASAGoddardPix" rel="nofollow">Twitter</a></b> <b>Like us on <a href="http://www.facebook.com/pages/Greenbelt-MD/NASA-Goddard/395013845897?ref=tsd" rel="nofollow">Facebook</a></b> <b>Find us on <a href="http://instagram.com/nasagoddard?vm=grid" rel="nofollow">Instagram</a></b>