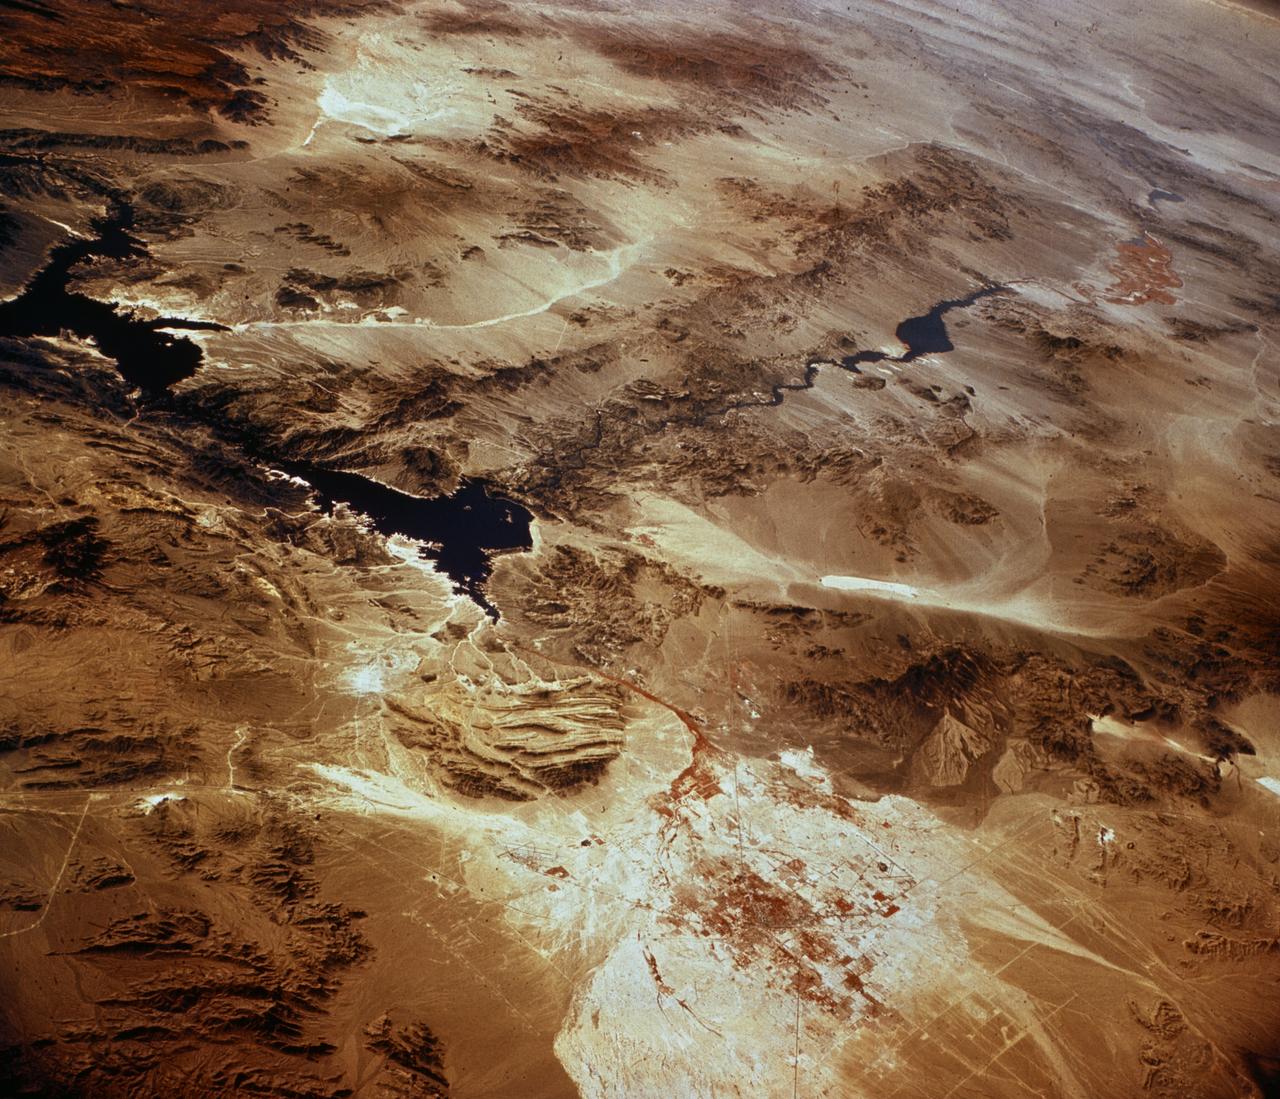
Southwestern US, with Las Vegas, NV in foreground, taken by X-15 Hycon HR-236 Camera during flt. 2-39-70 on June 27, 1965.
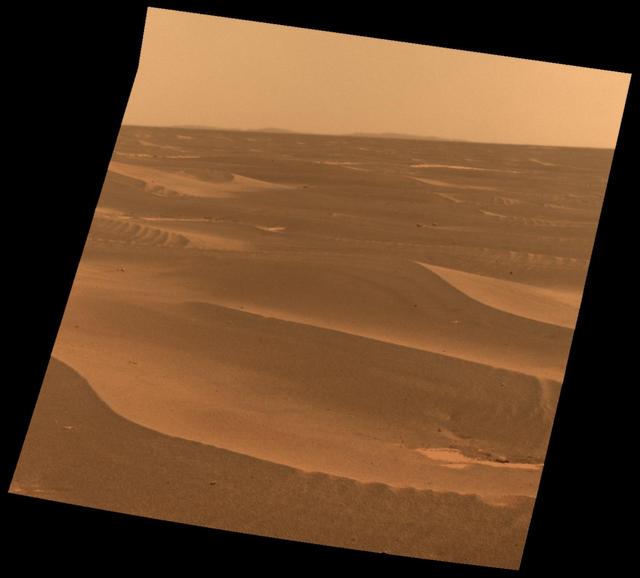
NASA Mars Exploration Rover used its panoramic camera to record this view of the rim of a crater about 65 kilometers 40 miles in the distance, on the southwestern horizon. This crater, Bopolu, is about 19 kilometers 12 miles in diameter.
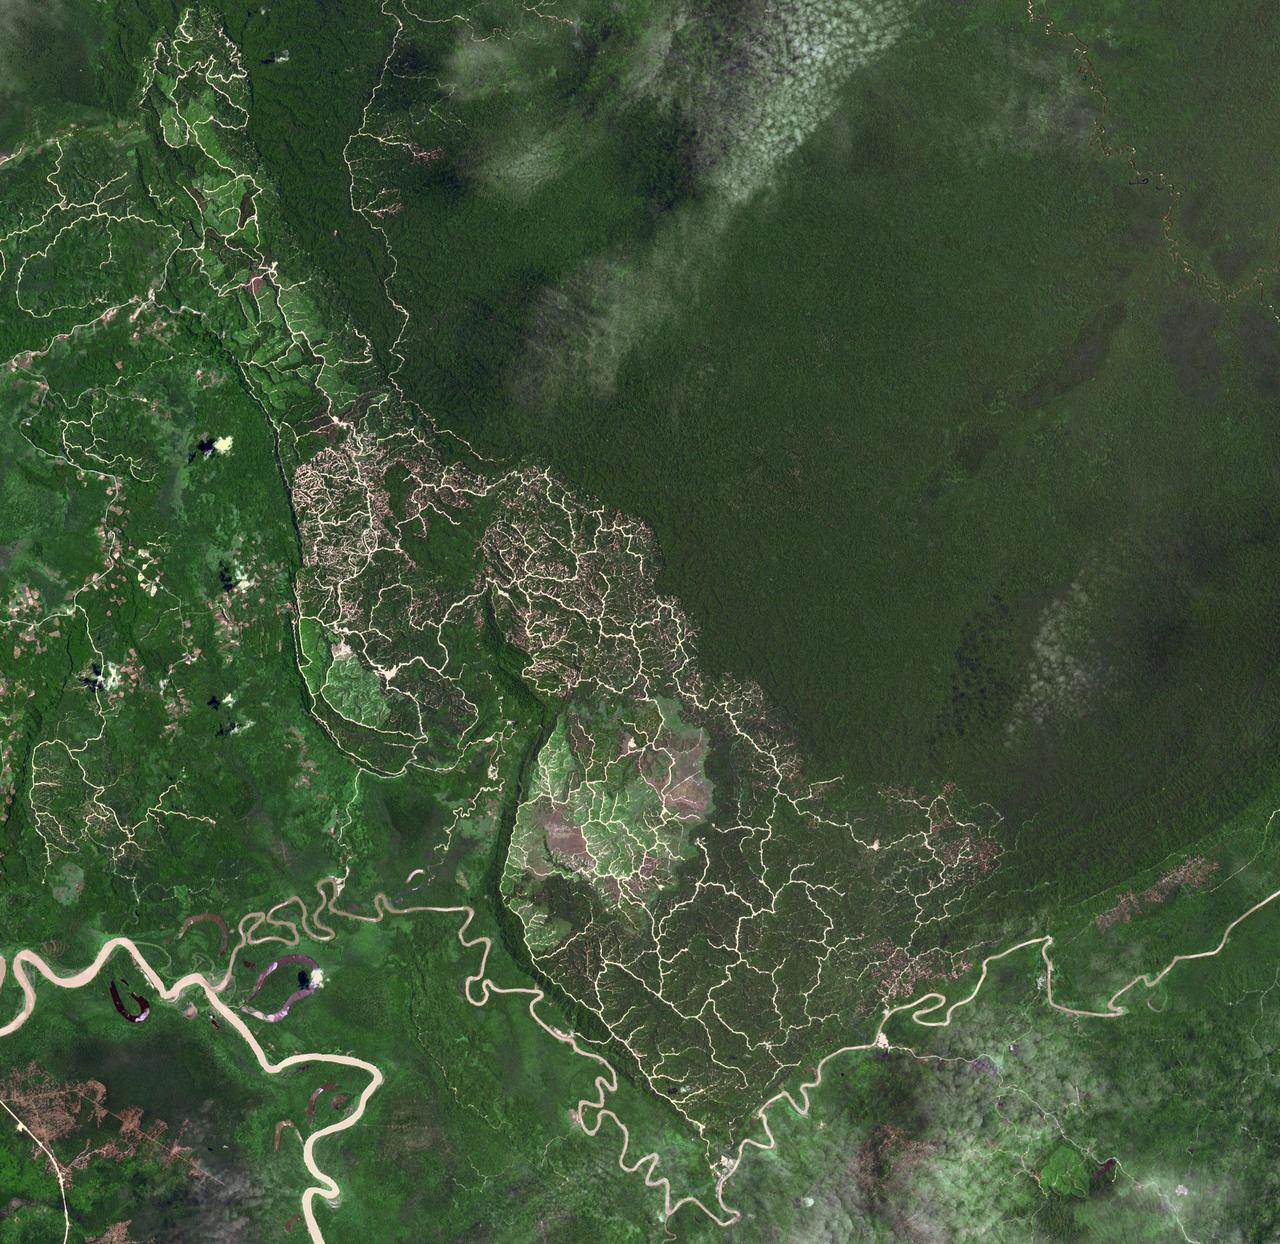
The southwestern border of Brunei with Sarawak, Malaysia is strikingly apparent due to differences in land use practice. On the Malaysian side, a spider web of small roads indicates intensive land use: in this case clearing of the forest for palm oil plantations. On the Brunei side, the virgin forest is preserved, with few if any roads cutting through the forest. The image was acquired September 10, 2012, covers an area of 38 by 38 km, and is located at 4.2 degrees north, 114.4 degrees east. https://photojournal.jpl.nasa.gov/catalog/PIA22034
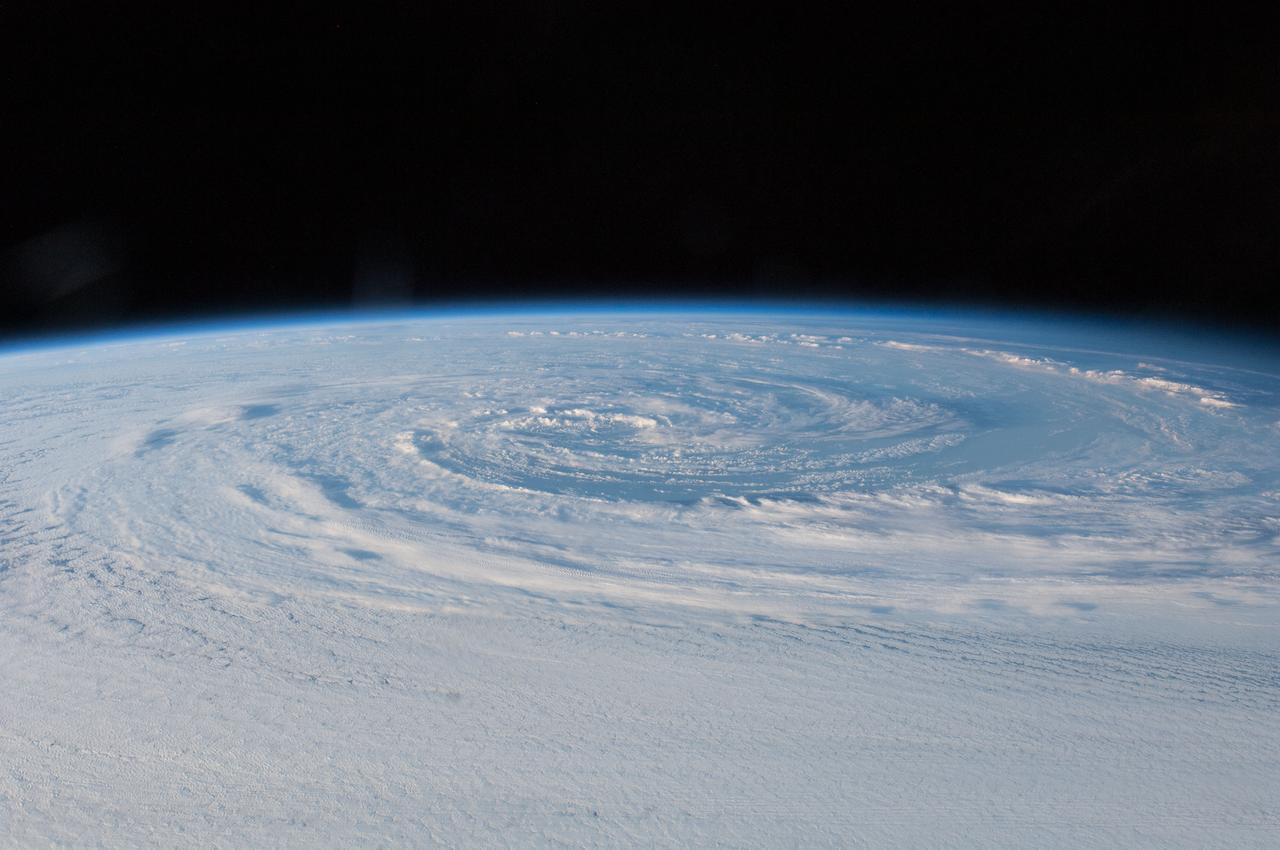
ISS039-E-005745 (29 March 2014) --- One of the Expedition 39 crew members aboard the International Space Station on March 29 used a 35mm lens on a digital still camera to photograph this pre-winter storm located just off the coast of southwestern Australia. The orbital outpost was located to the southwest of this weather system over the southeastern Indian Ocean near 45.6 degrees south latitude and 108.9 degrees west longitude. The panoramic view is towards the northeast, just before sunset local time (note the terminator approaching from the upper right). The storm is sweeping an early-season cold front in extreme southwestern Australia.

This un-named crater in southwestern Arabia Terra contains a treasure! Layered sediments are the key to the puzzle of Martian history. They tell us about the conditions that existed when the sediments were deposited, and how they changed over time. This image shows an eroded mesa made up of rhythmically layered bedrock that seems to indicate cyclic deposition. The layers are accentuated by recent dark sand deposits that have accumulated on the benches of the brighter sediments. The plateau is topped by a younger set of layers that appear to be finer and less blocky than the older layers below, suggesting a different depositional environment. Similar layered sediments are found in nearby craters in southwestern Arabia Terra. This image was requested by a member of the public who is interested in these deposits and will study them further by making a digital elevation model and measuring the thickness of the layers. Everyone is welcome to suggest interesting targets for HiRISE observations! https://photojournal.jpl.nasa.gov/catalog/PIA24946
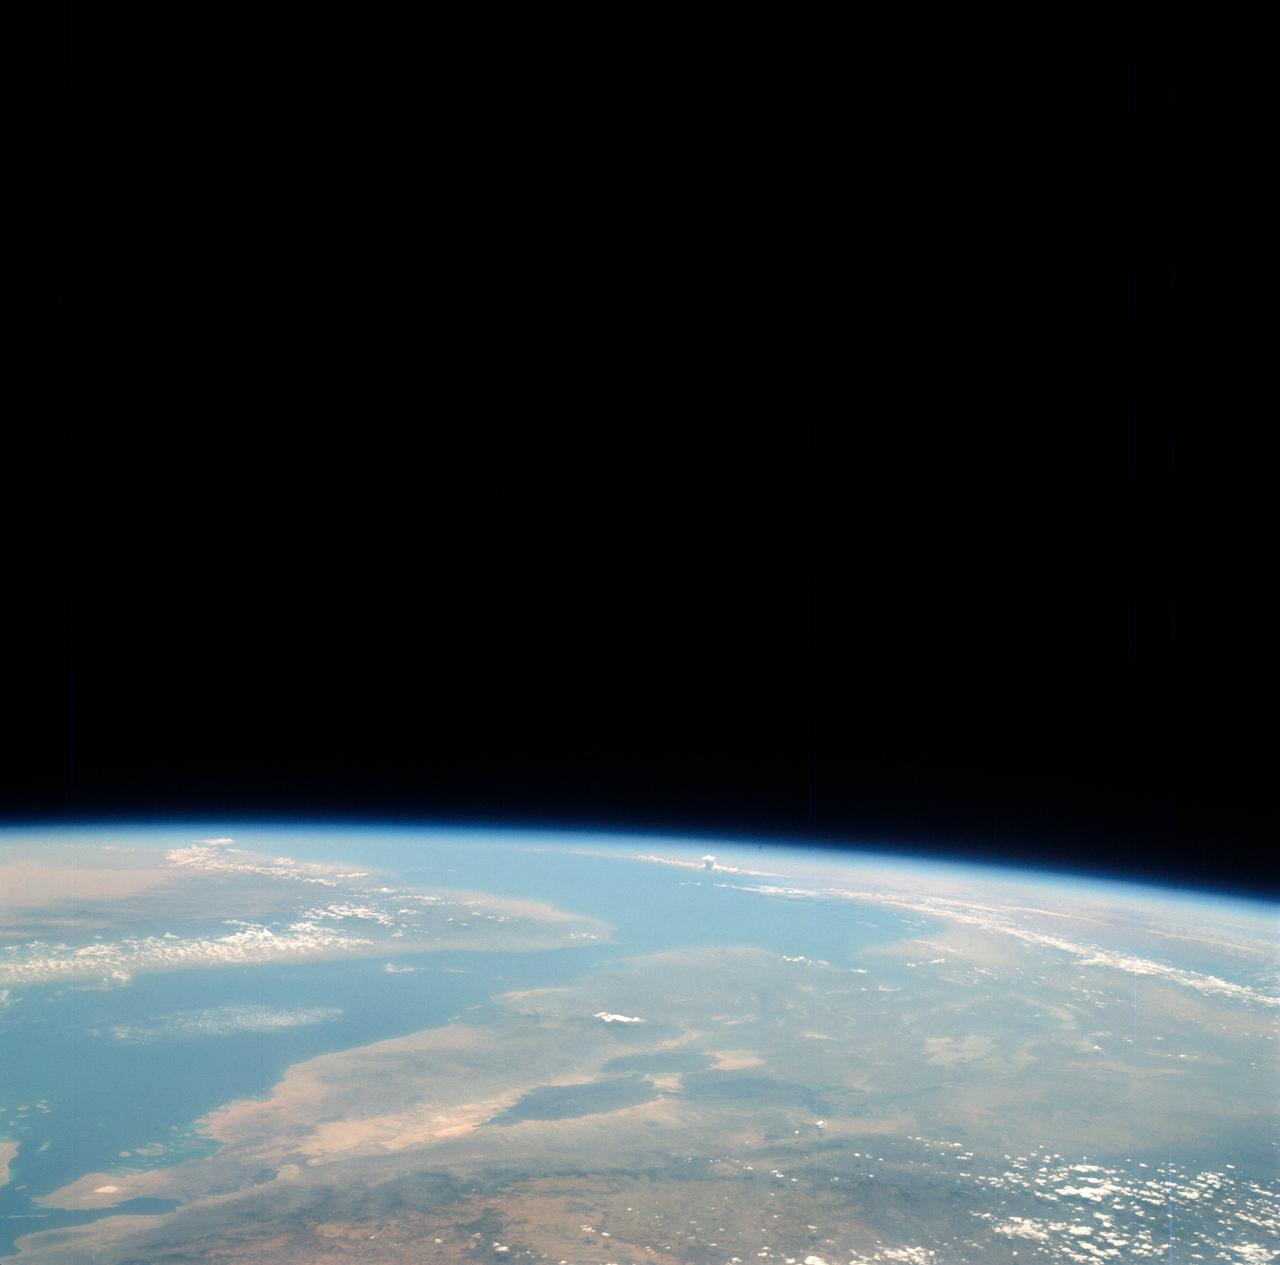
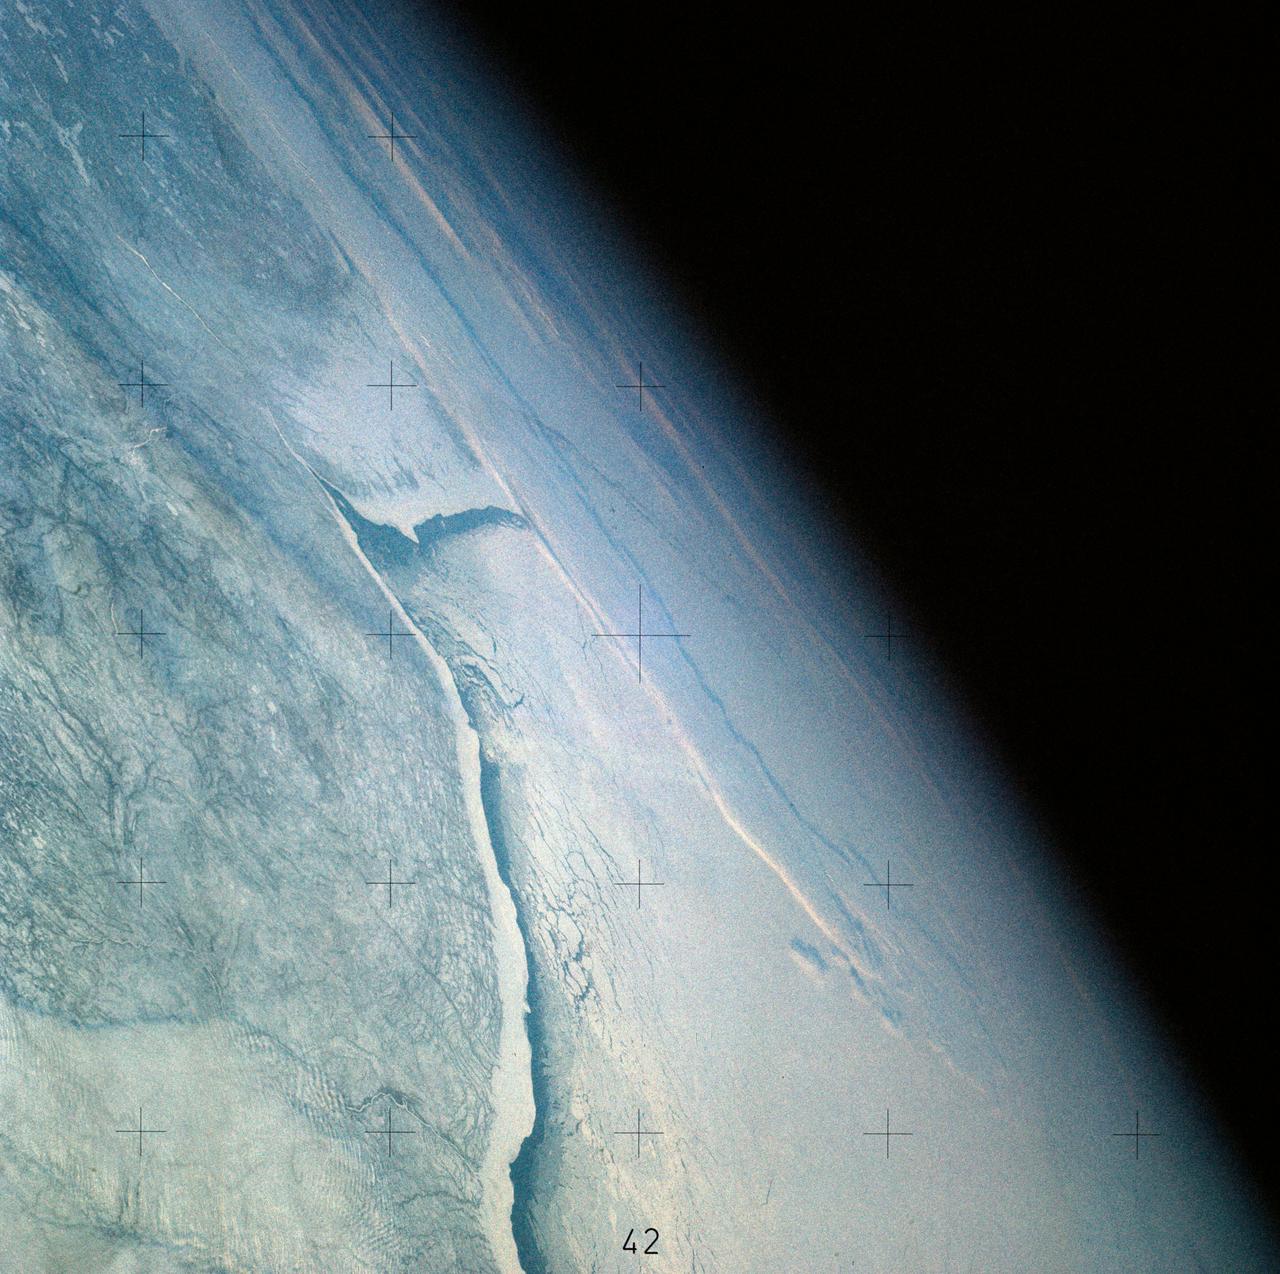
S66-38423 (6 June 1966) --- The southern tip of the Red Sea area as seen from the Gemini-9A spacecraft during its 43rd revolution of Earth. The Red Sea is at lower left. The Gulf of Aden is in the center of the picture. The land mass at bottom center is Ethiopia. Yemen is at upper center, southwestern tip of Arabian Peninsula. Somalia is the land mass in the background, center of picture. The image was taken with a modified 70mm Hasselblad camera, using Eastman Kodak, Ektachrome MS (S.O. 217) color film. Photo credit: NASA
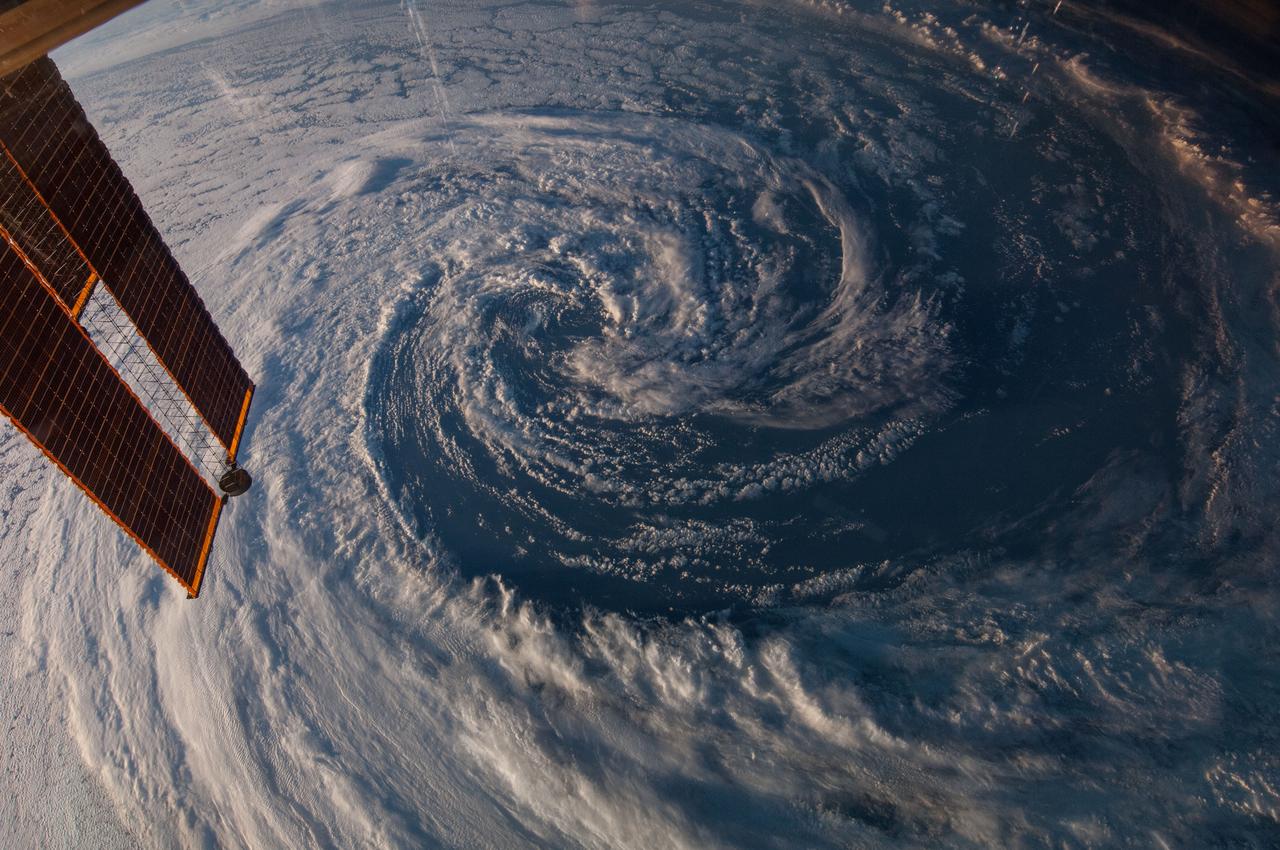
ISS039-E-005762 (29 March 2014) --- One of the Expedition 39 crew members aboard the International Space Station on March 29 used a 14mm lens on a digital still camera to photograph this pre-winter storm located just off the coast of southwestern Australia. A solar array panel on the orbital outpost is in the left side of the frame.
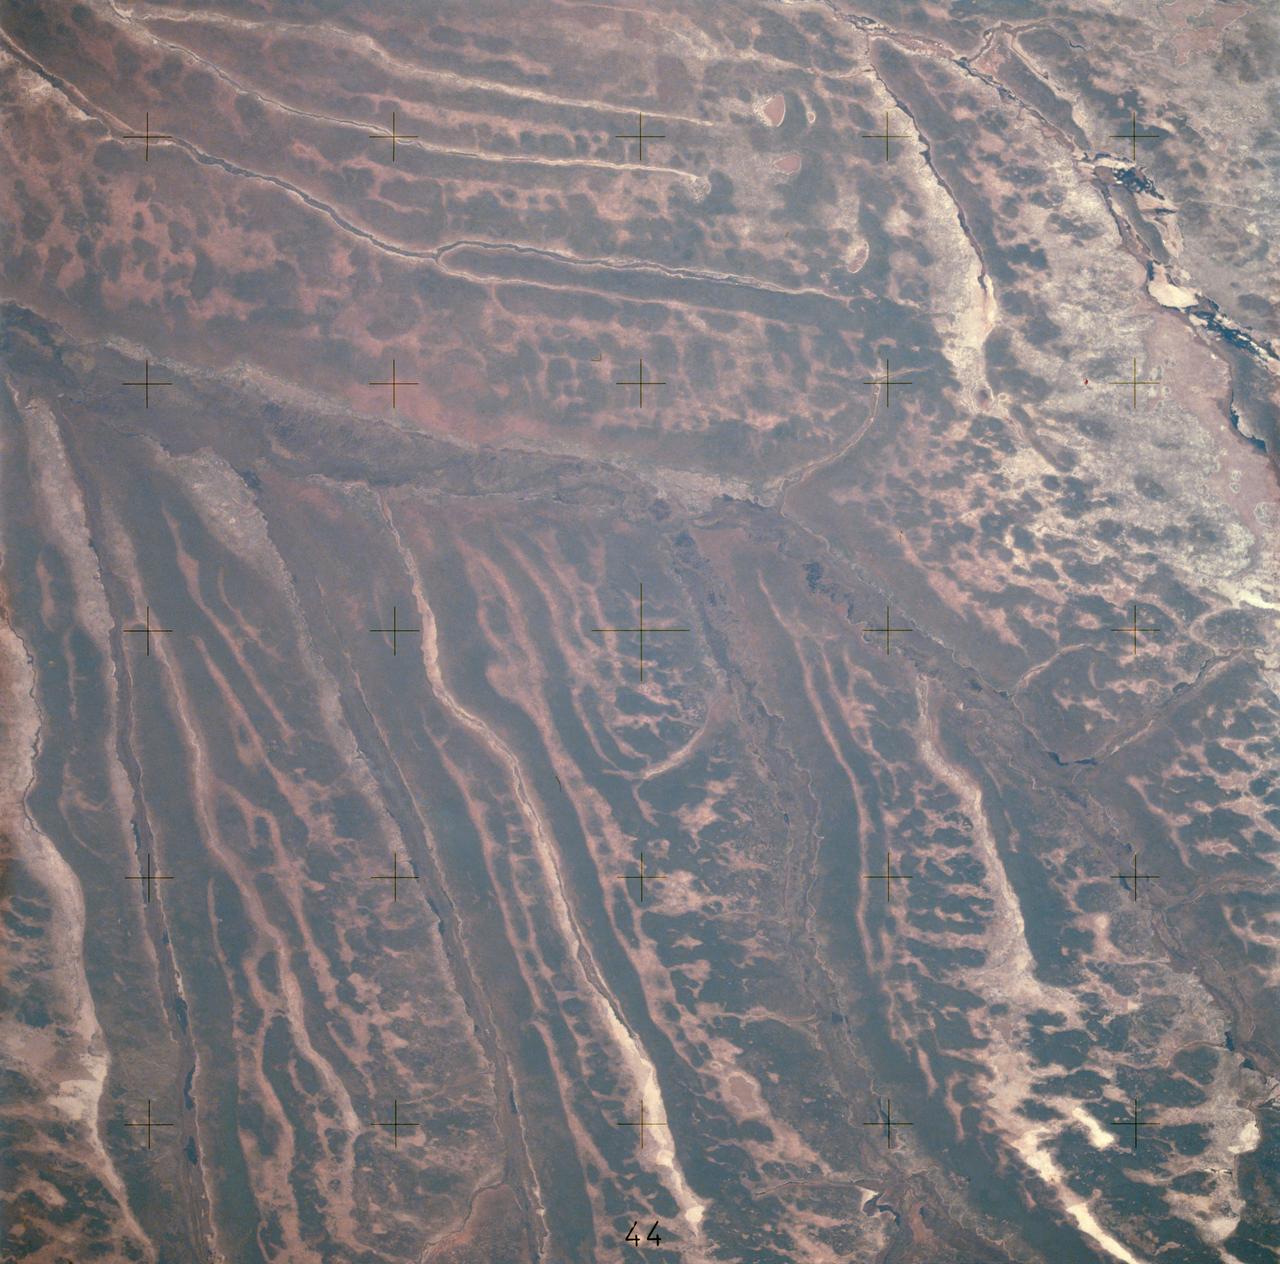
AST-14-890 (18 July 1975) --- An oblique view of unique drainage patterns in southwestern Africa in the Rio Cuando area of Angola and South-West Africa, as photographed from the Apollo spacecraft in Earth orbit during the joint U.S.-USSR Apollo-Soyuz Test Project mission. The picture was taken at an altitude of 223 kilometers (138 statute miles) with a 70mm Hasselblad camera using high-definition Ektachrome aerial SO-242 type film.
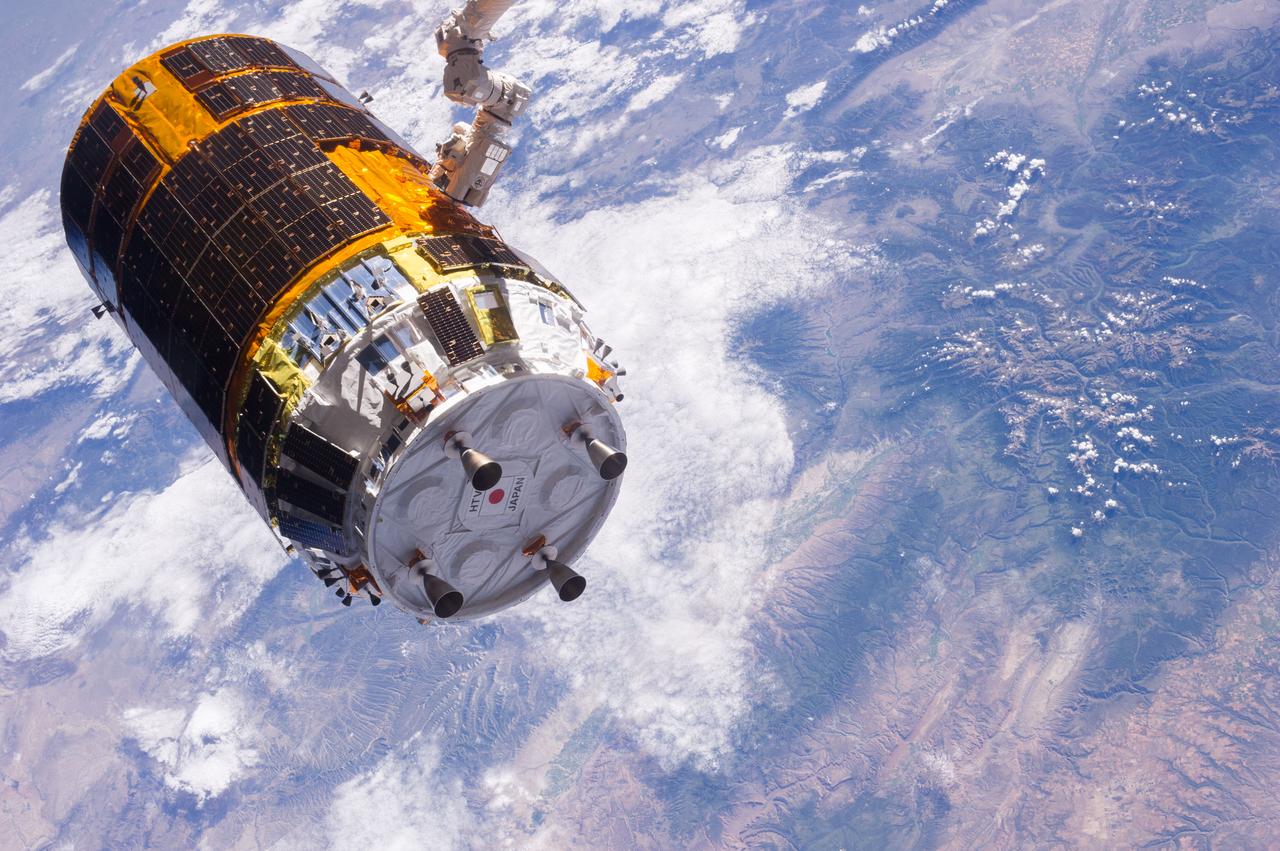
One of the Expedition 36 crew members aboard the International Space Station took this picture of the Japanese HTV-4 unmanned cargo spacecraft,backdropped against a land mass on Earth,following its unberthing but just prior to its release from the orbital outpost's Canadarm2. HTV-4,after backing away from the flying complex,headed for re-entry into Earth's atmosphere,burning upon re-entry. Per Twitter message: Flying over southwestern US, not long before release of #HTV4 by #Canadarm2.
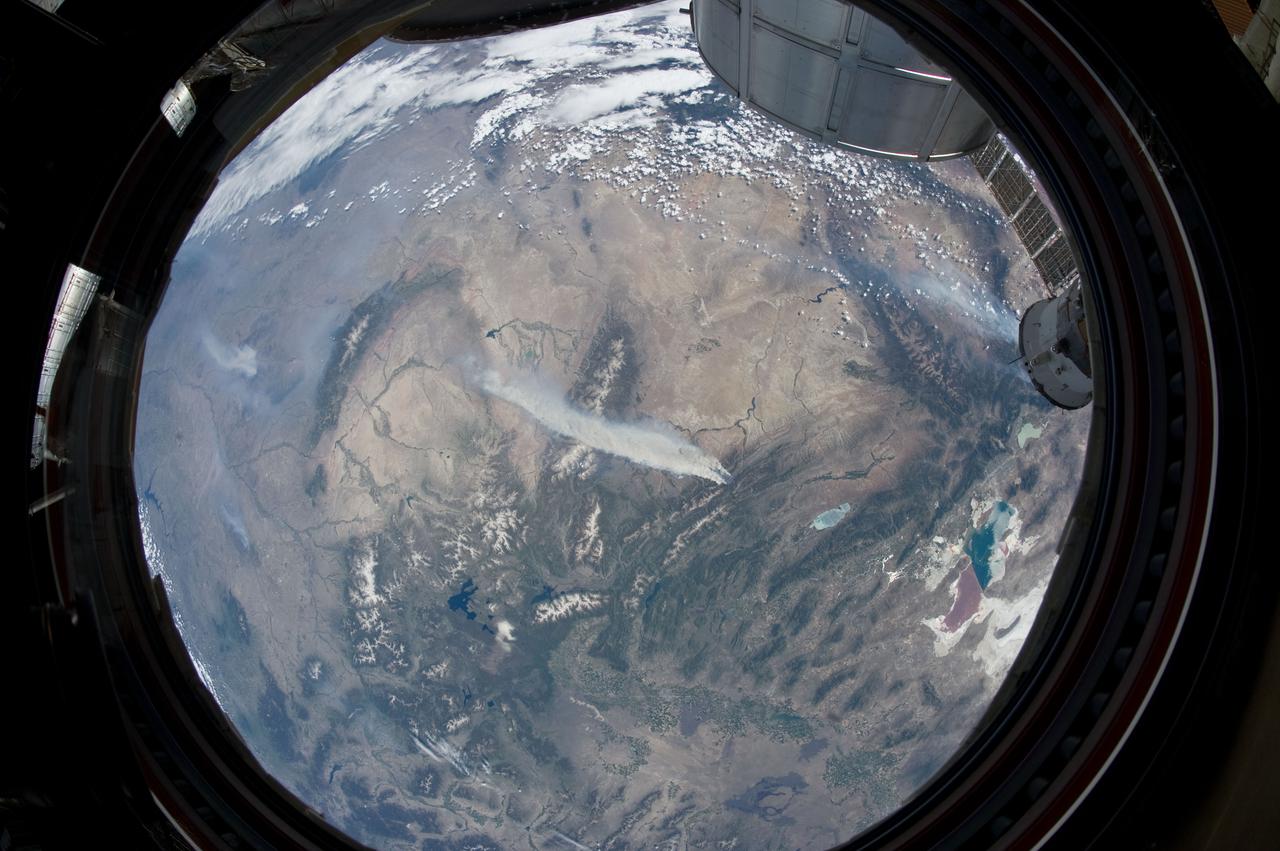
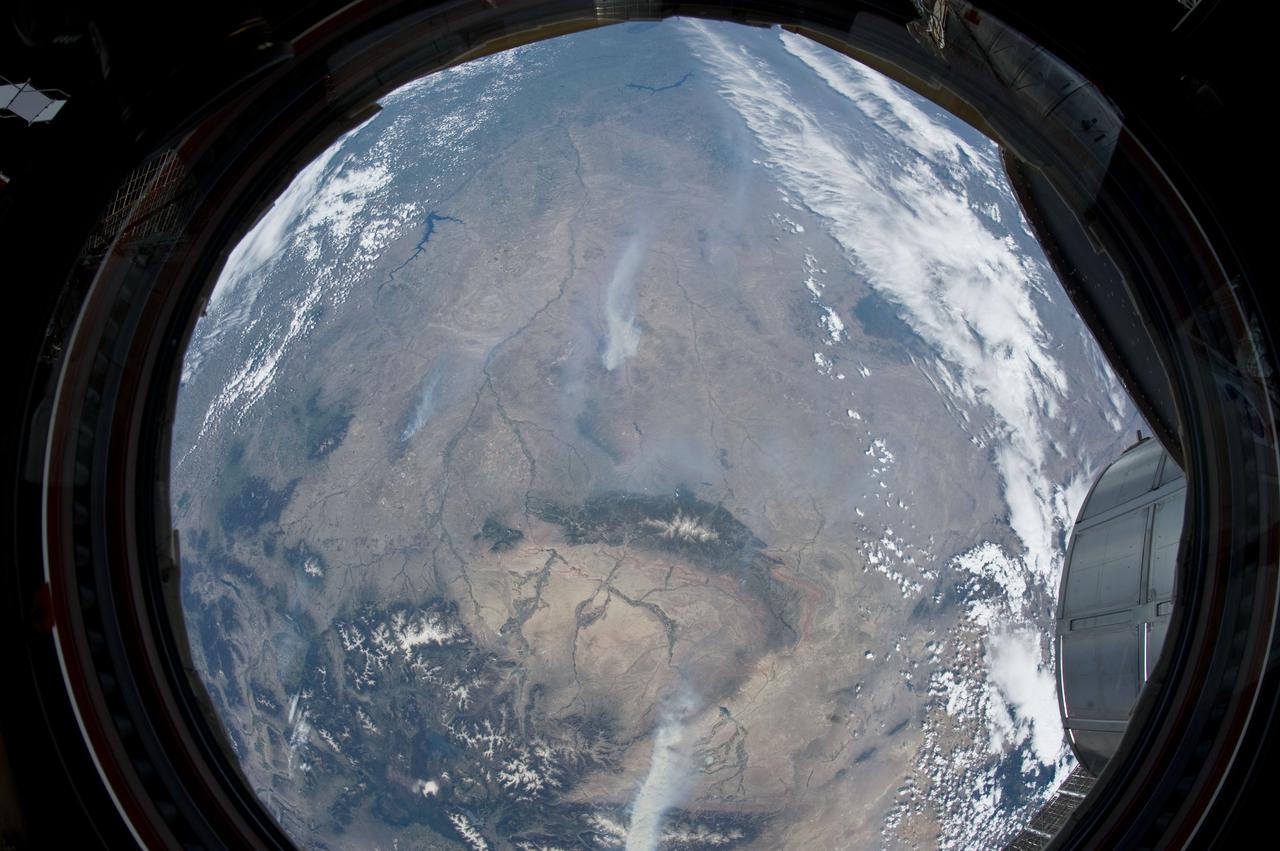
ISS031-E-146344 (27 June 2012) --- An Expedition 31 crew member aboard the International Space Station, flying approximately 240 miles above Earth, recorded a series of images of the current wild fires in the southwestern United States. For this particular image, taken from the station?s Cupola, he used a 16mm lens, which gives this view a ?fisheye? affect. The fires give rise to thick smoke plumes on the southernmost extremity of the Wyoming Range, which occupies the center of the image. Slopes of the central Salt River Range appear at left. Three helicopters and more than 100 personnel are fighting the fire, which is being managed by the Bridger?Teton National Forest.
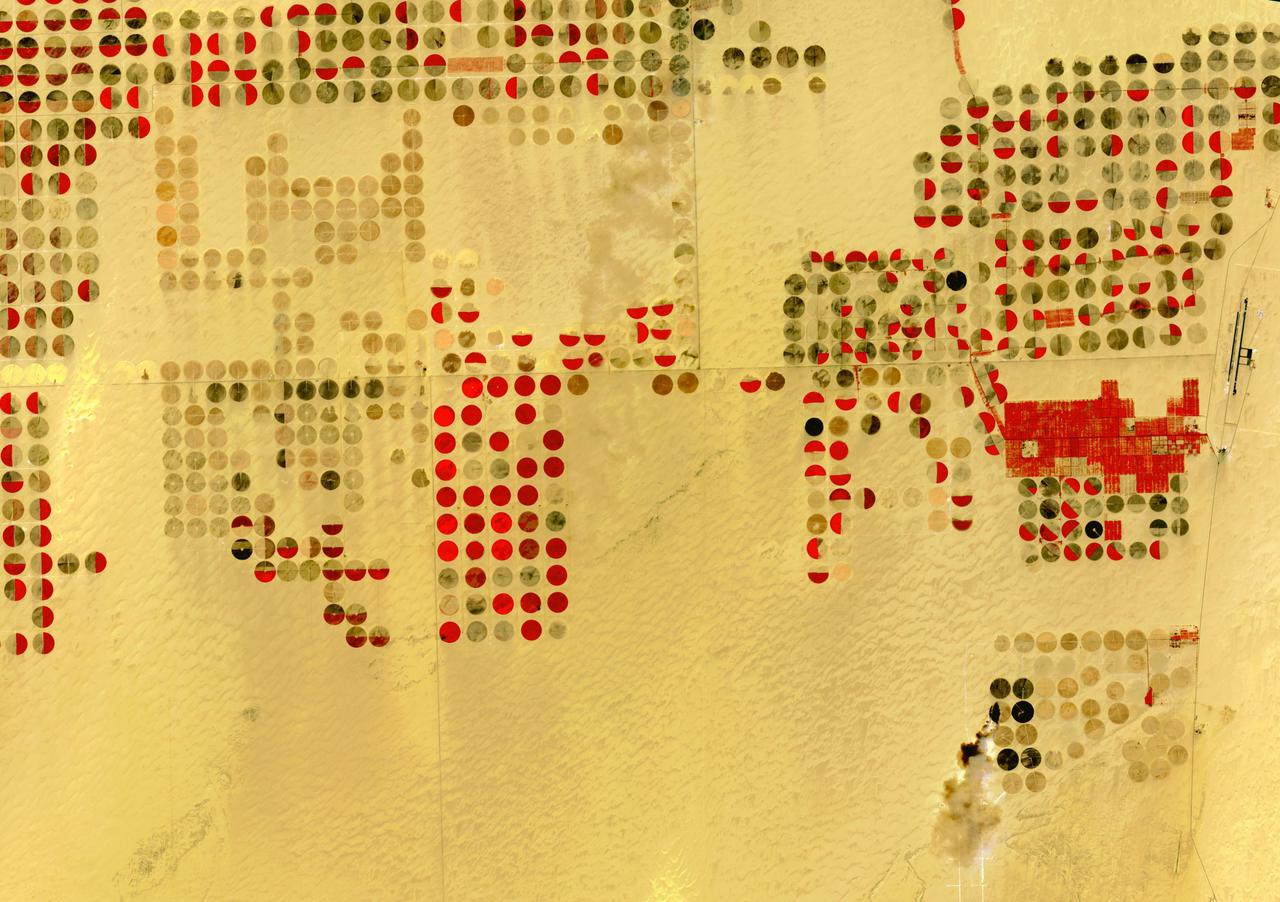
The Nubian Sandstone Aquifer System is the world's largest fossil water aquifer system. It covers an estimated area of 2.6 million square kilometers, including parts of Sudan, Chad, Libya, and most of Egypt. In the southwestern part of Egypt, the East Oweinat development project uses central pivot irrigation to mine the fossil water for extensive agricultural development. Crops include wheat and potatoes; they are transported via the airport on the eastern side. The image was acquired October 12, 2015, covers an area of 33.3 by 47.2 km, and is located near 22.6 degrees north, 28.5 degrees east. https://photojournal.jpl.nasa.gov/catalog/PIA24616
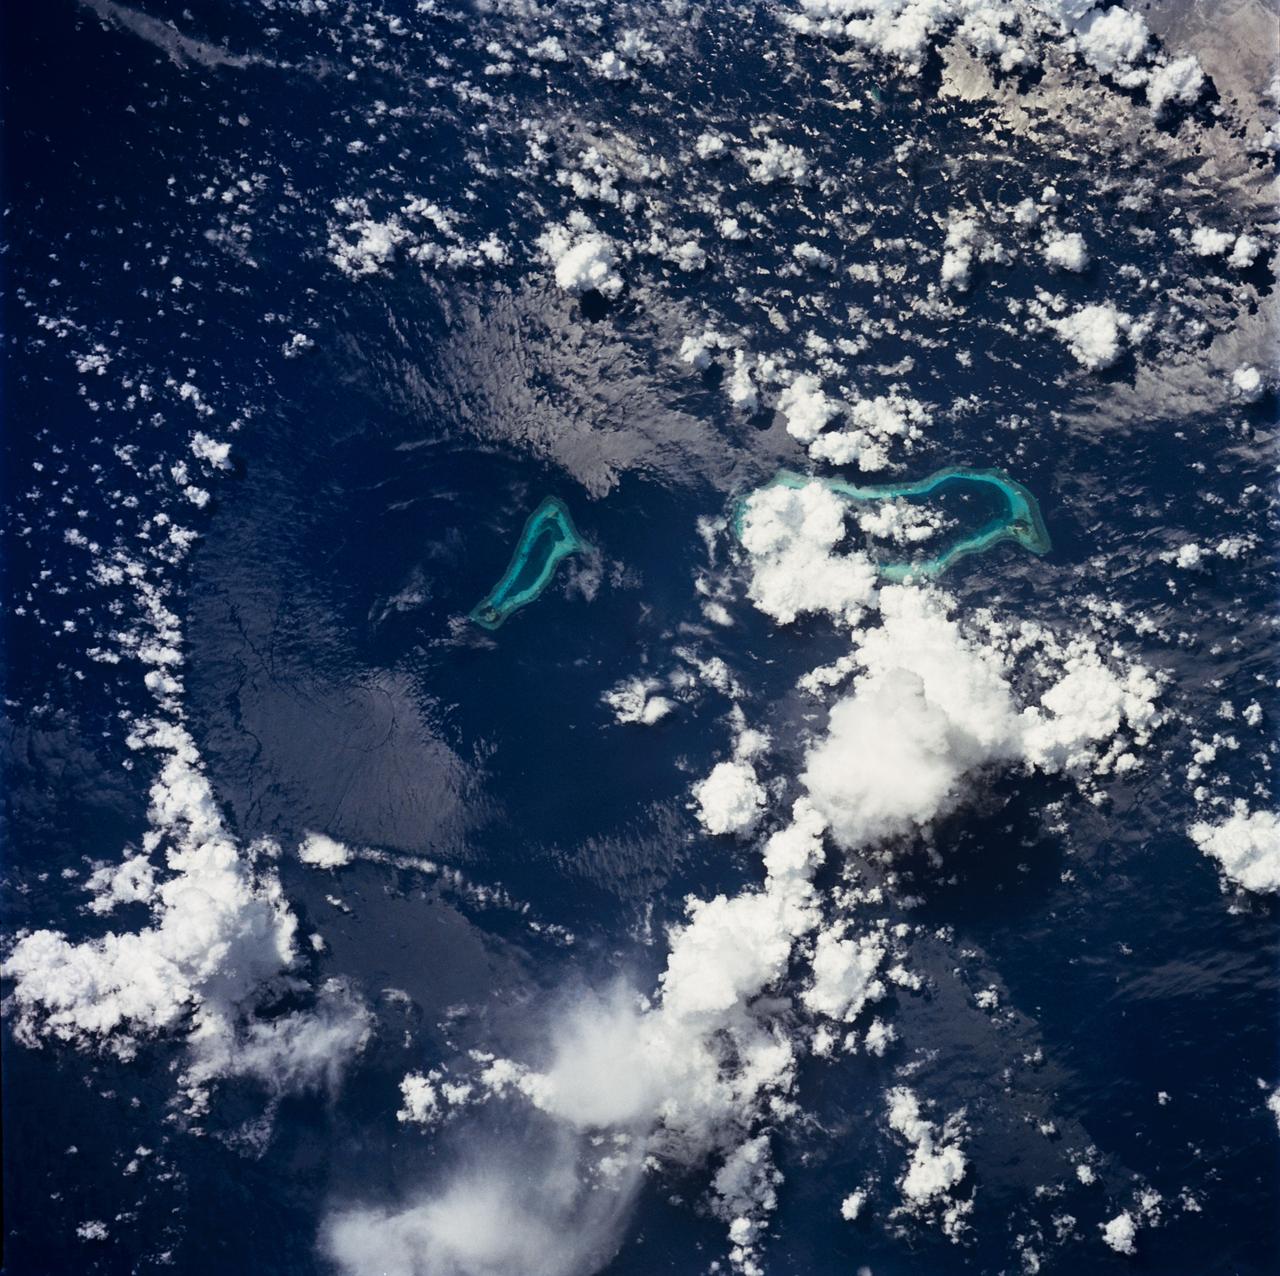
STS049-71-042 (8 May 1992) --- This photograph, taken from the Earth-orbiting Space Shuttle Endeavour, shows a collapsed thunderstorm in the southwestern Pacific Ocean. The clouds were pushed from this circular area of the ocean's surface by relatively cool air that spread downward and outward from a dying thunderstorm. Around the edges of the downdrafted air, new, though smaller, storms are developing. The photo was taken on May 8, 1992, between Borneo and the Philippine island of Mindoro. Two coral atolls can be seen near the center of the photograph. The crew members used a handheld Hasselblad camera, 250-mm lens, color film to expose the image.
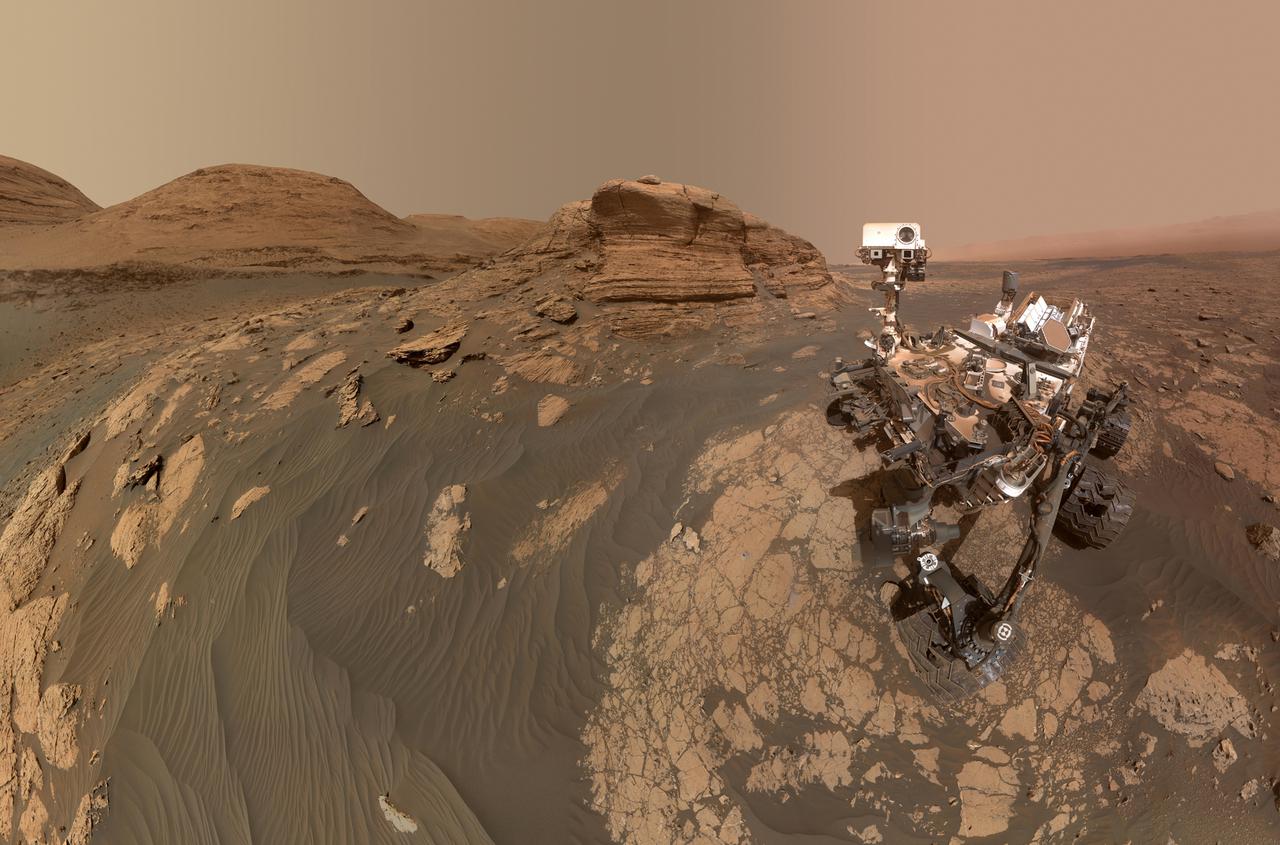
NASA's Curiosity Mars rover used two different cameras to create this selfie in front of Mont Mercou, a rock outcrop that stands 20 feet (6 meters) tall. The panorama is made up of 60 images taken by the Mars Hand Lens Imager (MAHLI) on the rover's robotic arm on March 26, 2021, the 3070th Martian day, or sol, of the mission. These were combined with 11 images taken by the Mastcam on the mast, or "head," of the rover on March 16, 2021, the 3,060th Martian day of the mission. The hole visible to the left of the rover is where its robotic drill sampled a rock nicknamed "Nontron." The Curiosity team is nicknaming features in this part of Mars using names from the region around the village of Nontron in southwestern France. https://photojournal.jpl.nasa.gov/catalog/PIA24543
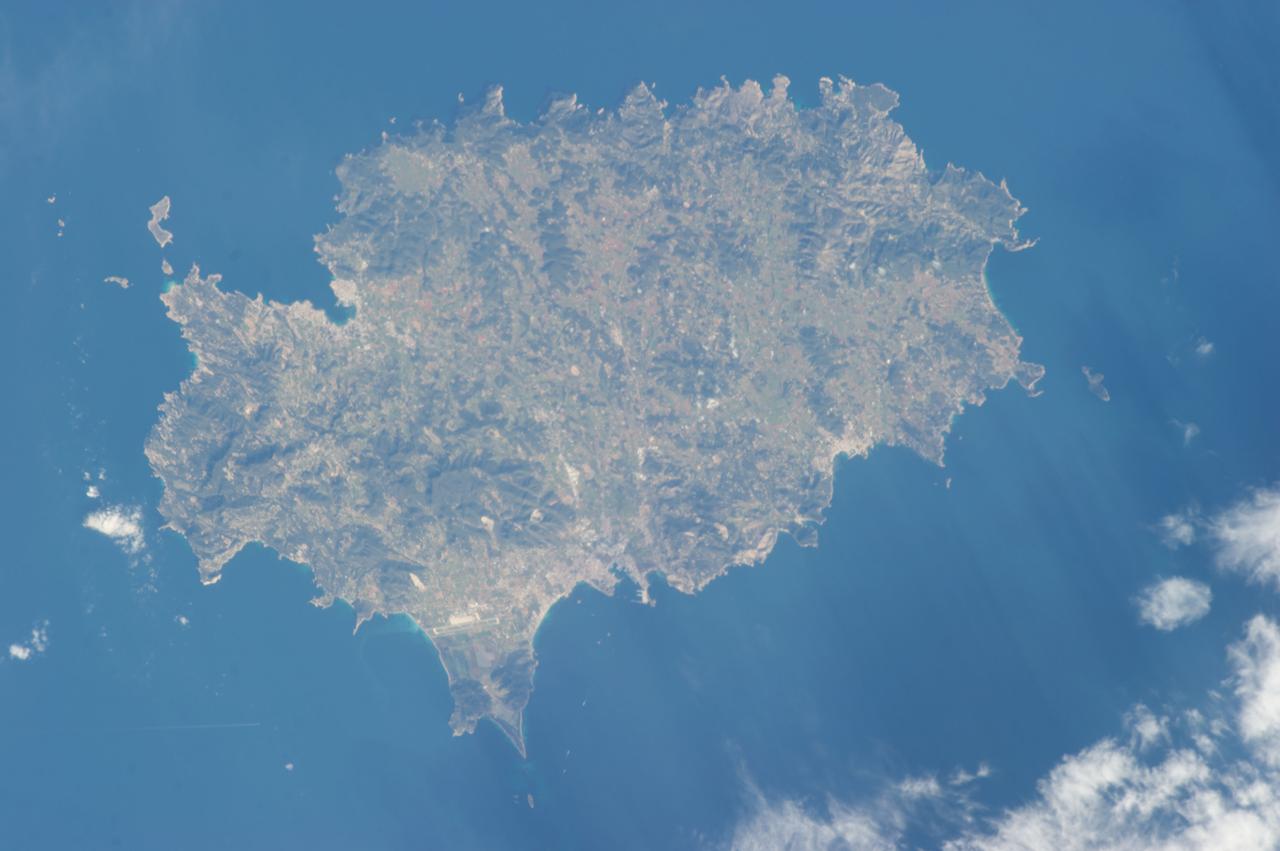
ISS035-E-007431 (22 March 2013) --- One of the Expedition 35 crew members aboard the Earth-orbiting International Space Station used a digital camera equipped with a 400 millimeter lens to capture this image of the island of Ibiza (Eivissa in the native Catalan language), located off of the southeastern coast of Spain. Ibiza is part of the Balearic archipelago. Together with the neighboring island of Formentera (not shown), it comprises the Pine Islands of the western archipelago. The largest cities on the island, Ibiza Town, Sant Antoni de Portmany, and Santa Eularia des Riu, appear as white to pink regions near coastal bays in the image. Much of the lowland interior of the island is covered with green to light brown agricultural fields; some are still in active production for such crops as wheat, olives, and grapes but many fields are inactive and experiencing regrowth of native trees such as pine (Pinus halpensis) and savine (Juniperus phoenicea). The northern and southwestern coastlines are hilly (grey-brown regions), with the highest peak (Sa Talaia, 475 meters above sea level) located in the southwestern region. Like many of the Balearic Islands, the major industry of Ibiza is European tourism, and it is particularly well known for the nightlife of Ibiza Town and Sant Antoni de Portmany. Ships near Ibiza Town and a ship wake off the southwestern coastline are visible at image lower left. The island hosts a large variety of birds and lizards; however no large land fauna are present. The Mediterranean Sea to the southeast of the island appears dark in the image due to shadowing by clouds, just visible at the lower right corner of the image.
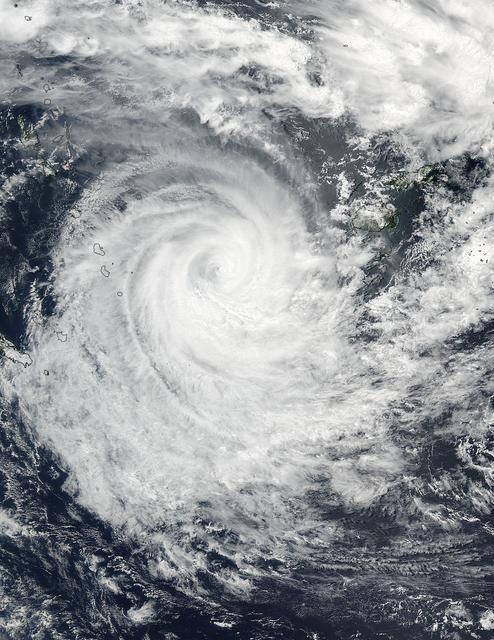
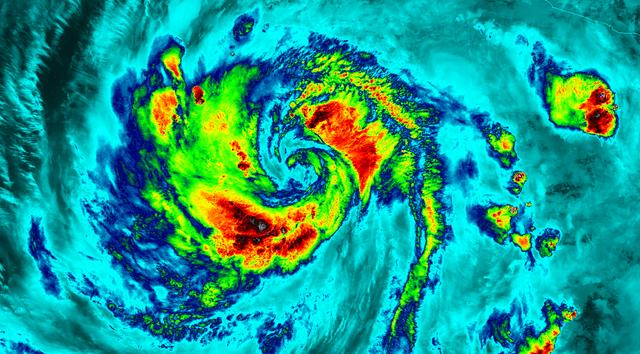
NASA-NOAA's Suomi NPP satellite saw that Tropical Cyclone Winston maintained a pinhole eye as it tracked east of southern Vanuatu's islands in the Southern Pacific Ocean on Feb. 23. Infrared imagery showed bands of strong thunderstorms were wrapping into the low-level center of the storm. Tropical Cyclone Winston was moving past Vanuatu in the South Pacific Ocean on Feb. 23 at 0140 UTC when NASA-NOAA's Suomi NPP satellite captured this image of the storm. Credits: NOAA/NASA Goddard Rapid Response Read more: <a href="http://www.nasa.gov/feature/goddard/2016/winston-southwestern-pacific-ocean" rel="nofollow">www.nasa.gov/feature/goddard/2016/winston-southwestern-pa...</a> <b><a href="http://www.nasa.gov/audience/formedia/features/MP_Photo_Guidelines.html" rel="nofollow">NASA image use policy.</a></b> <b><a href="http://www.nasa.gov/centers/goddard/home/index.html" rel="nofollow">NASA Goddard Space Flight Center</a></b> enables NASA’s mission through four scientific endeavors: Earth Science, Heliophysics, Solar System Exploration, and Astrophysics. Goddard plays a leading role in NASA’s accomplishments by contributing compelling scientific knowledge to advance the Agency’s mission. <b>Follow us on <a href="http://twitter.com/NASAGoddardPix" rel="nofollow">Twitter</a></b> <b>Like us on <a href="http://www.facebook.com/pages/Greenbelt-MD/NASA-Goddard/395013845897?ref=tsd" rel="nofollow">Facebook</a></b> <b>Find us on <a href="http://instagrid.me/nasagoddard/?vm=grid" rel="nofollow">Instagram</a></b>
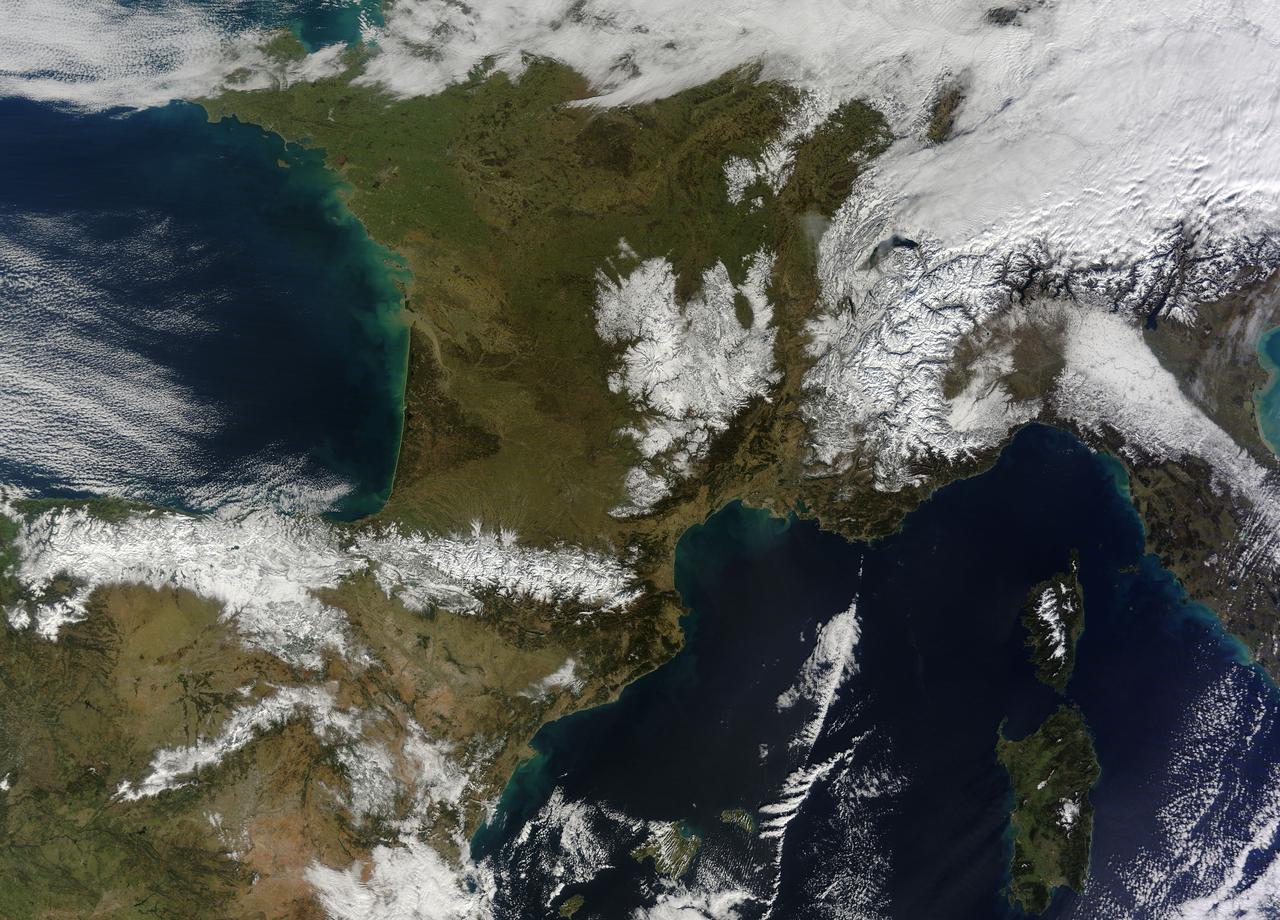
In February 2015, New England was not alone in dealing with the wrath of Old Man Winter. Thick snow blanketed mountain ranges in southwestern Europe after a winter storm pushed through the region in early February. The Moderate Resolution Imaging Spectroradiometer (MODIS) on NASA’s Terra satellite captured this true-color image of the snow-covered peaks of the Cantabrian Mountains, the Pyrenees, the Alps, and Massif Central on February 9, 2015. Credit: NASA/GSFC/Jeff Schmaltz/MODIS Land Rapid Response Team <b><a href="http://www.nasa.gov/audience/formedia/features/MP_Photo_Guidelines.html" rel="nofollow">NASA image use policy.</a></b> <b><a href="http://www.nasa.gov/centers/goddard/home/index.html" rel="nofollow">NASA Goddard Space Flight Center</a></b> enables NASA’s mission through four scientific endeavors: Earth Science, Heliophysics, Solar System Exploration, and Astrophysics. Goddard plays a leading role in NASA’s accomplishments by contributing compelling scientific knowledge to advance the Agency’s mission. <b>Follow us on <a href="http://twitter.com/NASAGoddardPix" rel="nofollow">Twitter</a></b> <b>Like us on <a href="http://www.facebook.com/pages/Greenbelt-MD/NASA-Goddard/395013845897?ref=tsd" rel="nofollow">Facebook</a></b> <b>Find us on <a href="http://instagram.com/nasagoddard?vm=grid" rel="nofollow">Instagram</a></b>
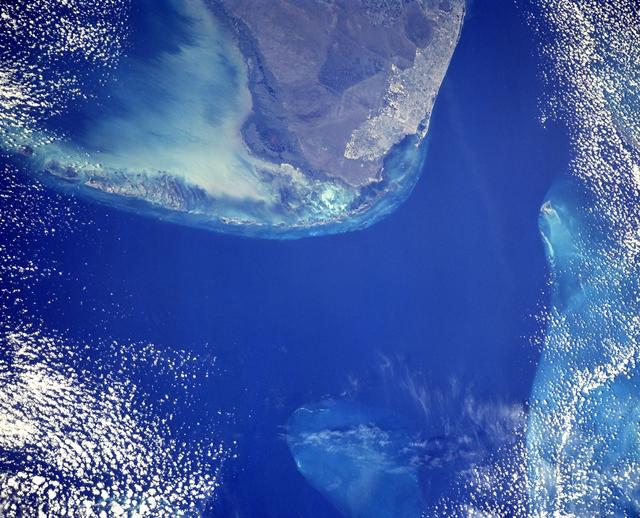
STS103-501-152 (19-27 December 1999) --- One of the astronauts aboard the Earth-orbiting Space Shuttle Discovery used a handheld large format camera to photograph this southern Florida scene. The city of Miami encroaches the eastern edge of the Everglades, which constitute an International Biosphere Reserve World Heritage Site. This subtropical wilderness encompasses a relatively flat (does not exceed 2.4 m above sea level) saw-grass marsh region of 10,000 square kilometers (4,000 square miles). According to NASA Earth scientists, the only source of water in the Everglades is from rainfall. The flow of water is detectable in this image, slowly moving from Lake Okeechobee to Florida Bay; the light blue, shallow area between the mainland and the Keys; and the southwestern Florida coast.
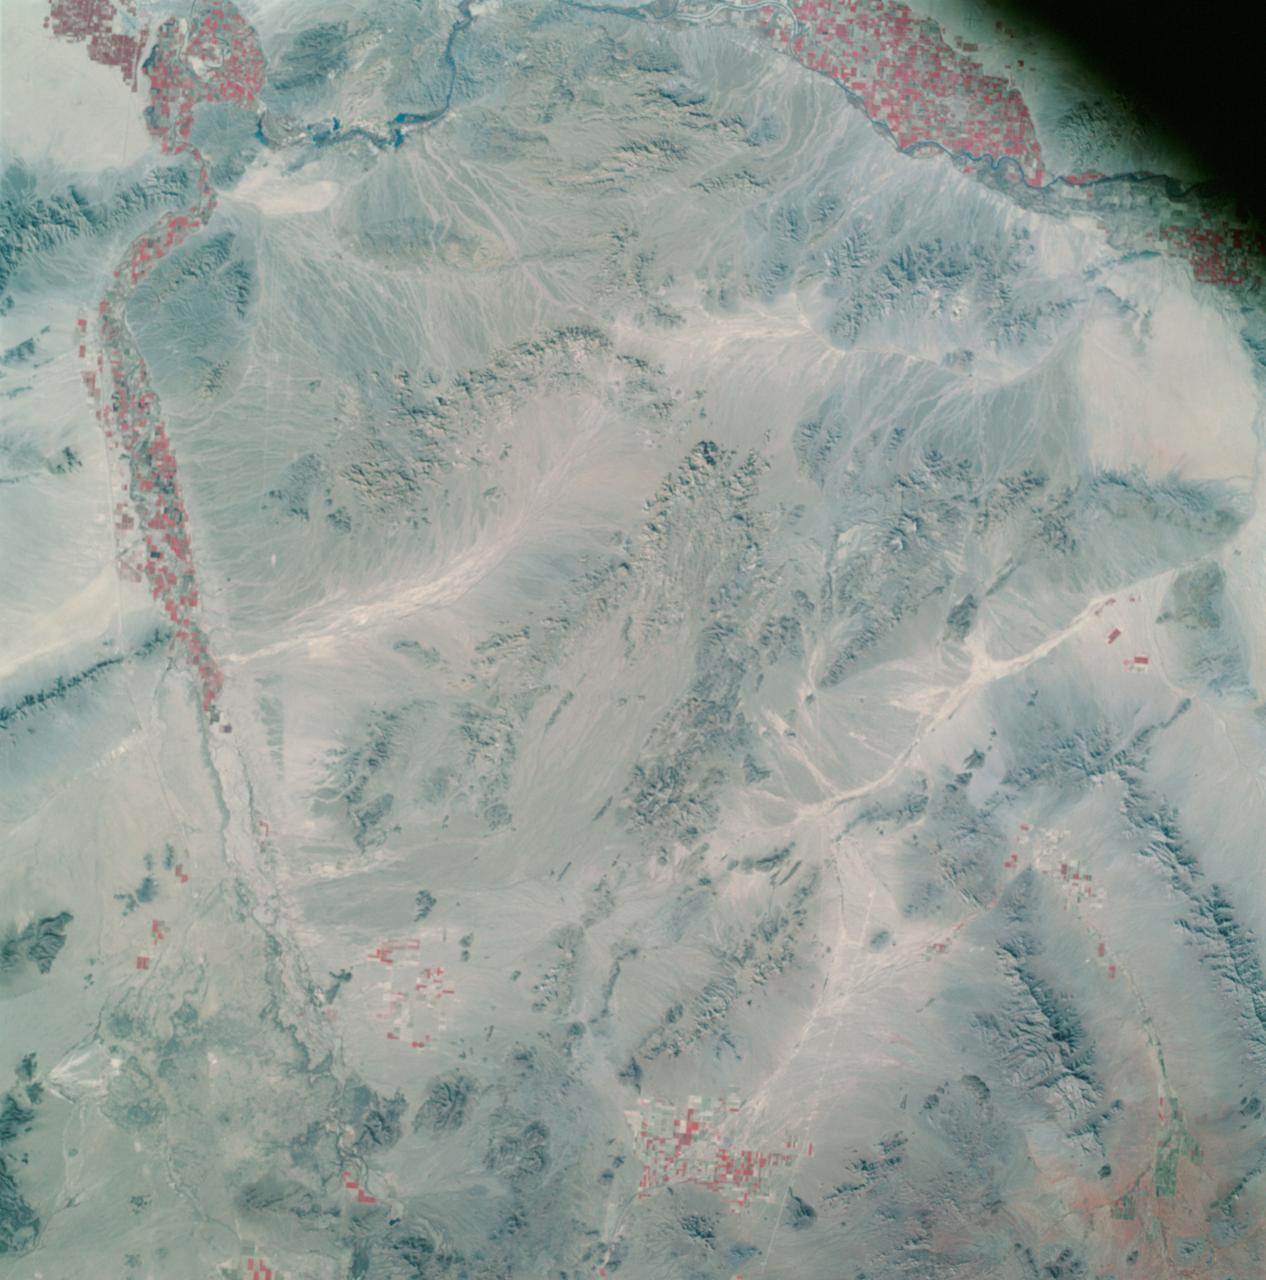
AS09-26A-3800A (12 March 1969) --- Color infrared photograph of southwestern Arizona, Yuma-Gila Desert-Gila River-Colorado River area, taken on March 12, 1969, by one of the four synchronized cameras of the Apollo 9 Earth Resources Survey SO65 Experiment. At 11:28 a.m. (EST) when this picture was made the Apollo 9 spacecraft was at an altitude of 128 nautical miles, and the sun elevation was 30 degrees above the horizon. The location of the point on Earth's surface at which the four-camera combination was aimed 33 degrees 19 minutes north latitude, and 113 degrees 45 minutes west longitude. The other three cameras used: (B) black and white film with a red filter; (C) black and white infrared film; and (D) black and white film with a green filter.
ISS031-E-146343 (27 June 2012) --- An Expedition 31 crew member aboard the International Space Station, flying approximately 240 miles above Earth, recorded a series of images of the current wild fires in the west and southwestern United States. For this particular image, taken from the station?s Cupola, he used a 16mm lens, which gives this view a ?fisheye? affect. The fires give rise to thick smoke plumes on the southernmost extremity of the Wyoming Range, which occupies the bottom left portion of the image. Three helicopters and more than 100 personnel are fighting the fire, which is being managed by the Bridger?Teton National Forest. Part of a docked Russian Soyuz spacecraft and the Multi-Purpose Logistics Module (MPLM) are at lower right.
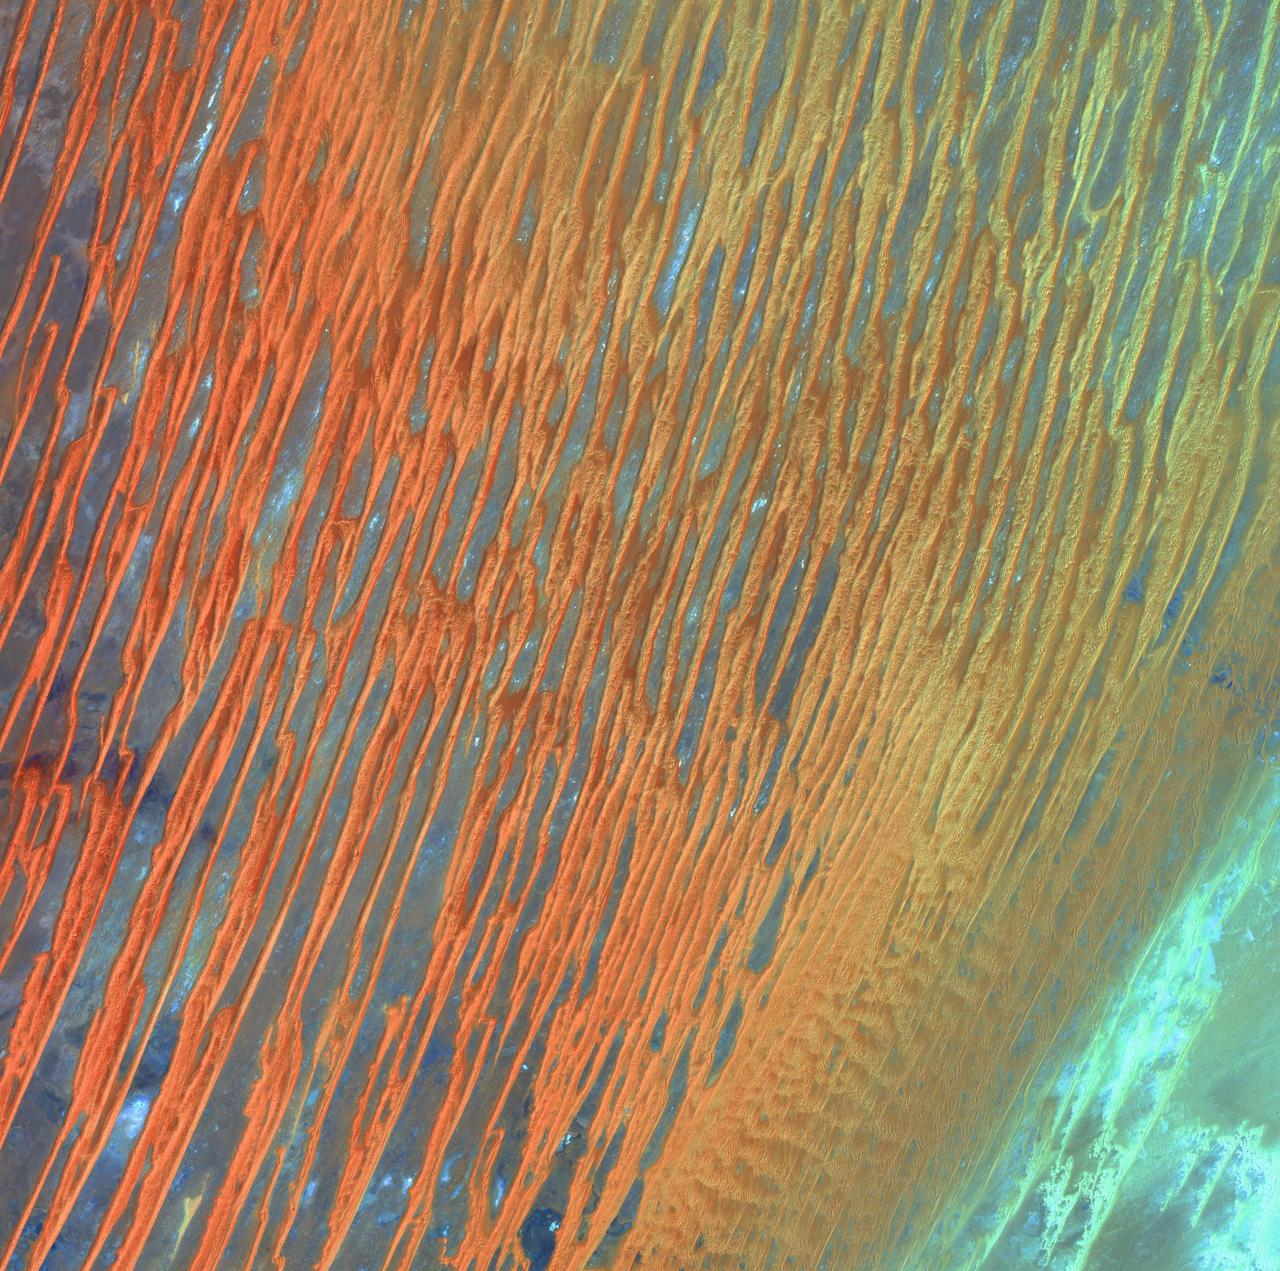
Desert Patterns - April 13th, 2003 Description: Seen through the "eyes" of a satellite sensor, ribbons of Saharan sand dunes seem to glow in sunset colors. These patterned stripes are part of Erg Chech, a desolate sand sea in southwestern Algeria, Africa, where the prevailing winds create an endlessly shifting collage of large, linear sand dunes. The term "erg" is derived from an Arabic word for a field of sand dunes. Credit: USGS/NASA/Landsat 7 To learn more about the Landsat satellite go to: <a href="http://landsat.gsfc.nasa.gov/" rel="nofollow">landsat.gsfc.nasa.gov/</a> <b><a href="http://www.nasa.gov/centers/goddard/home/index.html" rel="nofollow">NASA Goddard Space Flight Center</a></b> enables NASA’s mission through four scientific endeavors: Earth Science, Heliophysics, Solar System Exploration, and Astrophysics. Goddard plays a leading role in NASA’s accomplishments by contributing compelling scientific knowledge to advance the Agency’s mission. <b>Follow us on <a href="http://twitter.com/NASA_GoddardPix" rel="nofollow">Twitter</a></b> <b>Join us on <a href="http://www.facebook.com/pages/Greenbelt-MD/NASA-Goddard/395013845897?ref=tsd" rel="nofollow">Facebook</a></b>

Read more from: <a href="http://go.nasa.gov/2duxEeZ" rel="nofollow">go.nasa.gov/2duxEeZ</a> On October 4, 2016, Hurricane Matthew made landfall on southwestern Haiti as a category-4 storm—the strongest storm to hit the Caribbean nation in more than 50 years. Just hours after landfall, the Moderate Resolution Imaging Spectroradiometer (MODIS) on NASA’s Terra satellite acquired this natural-color image. At the time, Matthew had top sustained winds of about 230 kilometers (145 miles) per hour. Earlier on October 4, temperature data collected by MODIS on NASA’s Aqua satellite revealed that the cloud tops around Matthew were very cold (at least -57° Celsius, or -70° Fahrenheit). Cold cloud tops are known to produce heavy rainfall. The National Hurricane Center called for 380 to 500 millimeters (15 to 20 inches) of rain in Southern Haiti and in the southwestern Dominican Republic. The northward movement of the storm should bring the center of Matthew over eastern Cuba late on October 4. Dangerous conditions can extend far beyond a storm’s center. According to National Hurricane Center forecasters, Matthew is “likely to produce devastating impacts from storm surge, extreme winds, heavy rains, flash floods, and/or mudslides in portions of the watch and warning areas in Haiti, Cuba, and the Bahamas.” NASA Earth Observatory image by Joshua Stevens, using MODIS data from the Land Atmosphere Near real-time Capability for EOS (LANCE). Caption by Kathryn Hansen.
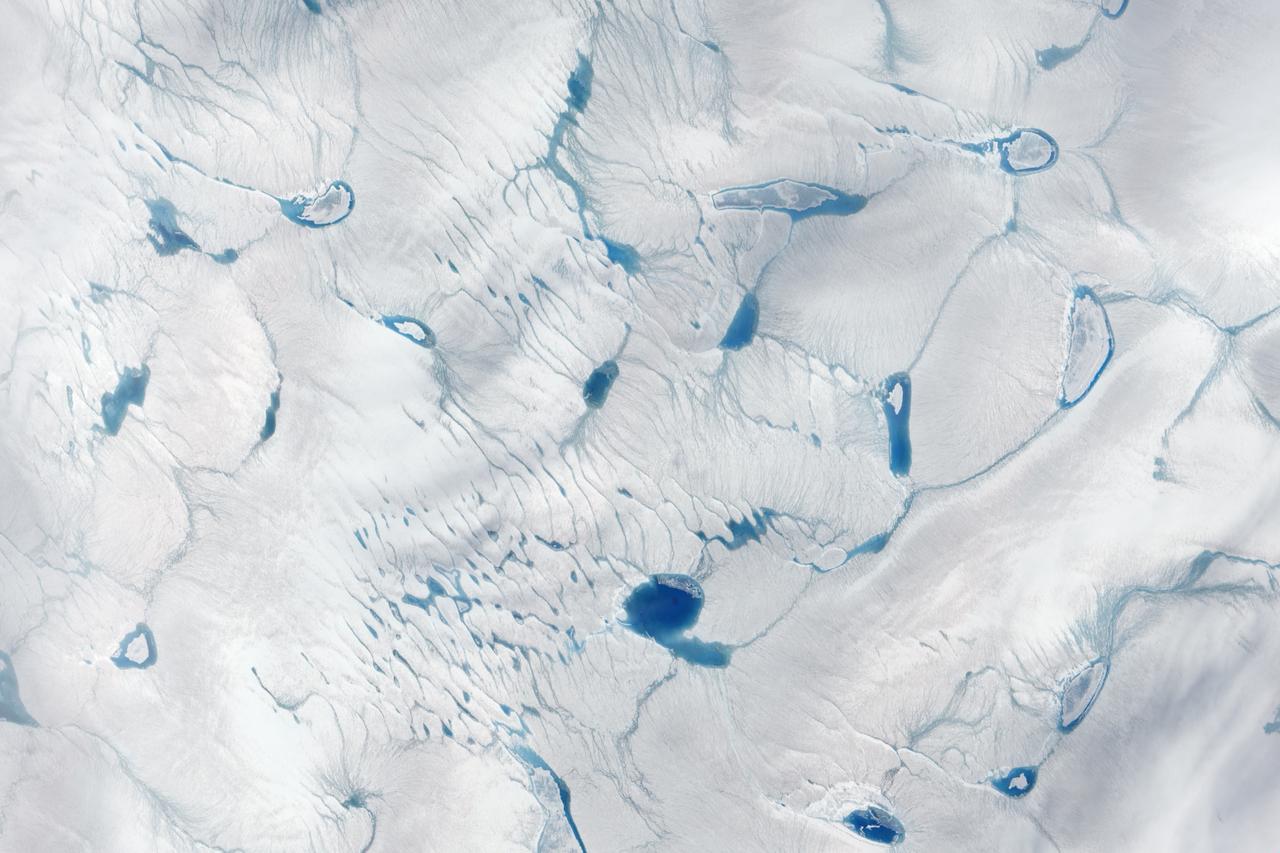
On June 15, 2016, the Advanced Land Imager (ALI) on NASA’s Earth Observing-1 satellite acquired a natural-color image of an area just inland from the coast of southwestern Greenland (120 kilometers southeast of Ilulisat and 500 kilometers north-northeast of Nuuk). According to Marco Tedesco, a professor at Columbia University’s Lamont Doherty Earth Observatory, melting in this area began relatively early in April but was not sustained. It started up again in May and grew into the watery June scene pictured above. Surface melt can directly contribute to sea level rise via runoff. It can also force its way through crevasses to the base of a glacier, temporarily speeding up ice flow and indirectly contributing to sea level rise. Also, ponding of meltwater can “darken” the ice sheet’s surface and lead to further melting. Read more: <a href="https://earthobservatory.nasa.gov/IOTD/view.php?id=88288" rel="nofollow">earthobservatory.nasa.gov/IOTD/view.php?id=88288</a> Credit: NASA Earth Observatory image by Jesse Allen, using EO-1 ALI data provided courtesy of the NASA EO-1 team <b><a href="http://www.nasa.gov/audience/formedia/features/MP_Photo_Guidelines.html" rel="nofollow">NASA image use policy.</a></b> <b><a href="http://www.nasa.gov/centers/goddard/home/index.html" rel="nofollow">NASA Goddard Space Flight Center</a></b> enables NASA’s mission through four scientific endeavors: Earth Science, Heliophysics, Solar System Exploration, and Astrophysics. Goddard plays a leading role in NASA’s accomplishments by contributing compelling scientific knowledge to advance the Agency’s mission. <b>Follow us on <a href="http://twitter.com/NASAGoddardPix" rel="nofollow">Twitter</a></b> <b>Like us on <a href="http://www.facebook.com/pages/Greenbelt-MD/NASA-Goddard/395013845897?ref=tsd" rel="nofollow">Facebook</a></b> <b>Find us on <a href="http://instagrid.me/nasagoddard/?vm=grid" rel="nofollow">Instagram</a></b>
SL4-141-4316 (20 Jan. 1974) --- An oblique view of ice formations in Canada's Hudson Bay, as photographed from the Skylab space station in Earth orbit by one of the Skylab 4 crewmen. The camera used was a hand-held 70mm Hasselblad, with SO-368 medium-speed Ektachrome film. The southwestern part of the bay is prominent with the Nelson River in Manitoba flowing into it. Skylab never flew this far north in latitude. However, its orbital vantage point allowed observations and photography while over a point some 600 miles away as in the case of this picture. The ice formation along the southwest portion of Hudson Bay can be studied from photographs such as this one. The buildup of ice along the windward shore (very white) followed by the clear water gap (dark) caused by the wind blowing the newly formed ice toward the opposite shore, and finally the patterns in the ice structure itself are studied to learn more of the nature of the "winterization" of this area. Photo credit: NASA
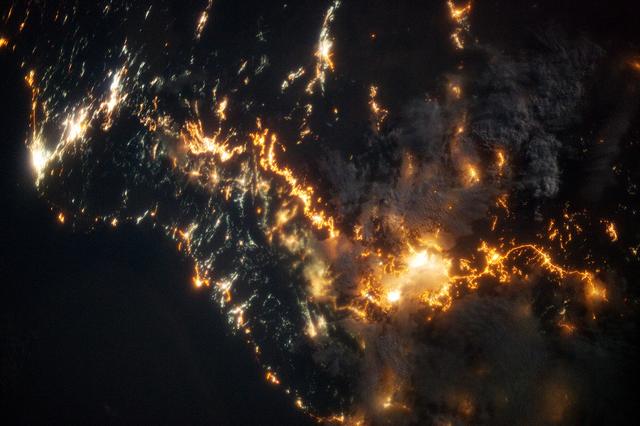
This striking image of the coastline of southwestern Saudi Arabia was taken by astronauts on the International Space Station. Patchy cloud cover partially obscures and blurs the city lights, especially in the vicinity of Khamis Mushait and Abha. While much of the country is lightly populated desert—and relatively dark at night due to lack of city and roadway lights—the southwestern coastal region has a more moderate climate and several large cities. Three brightly lit urban centers are visible at image top left: Jeddah, Mecca, and Taif. Jeddah is the gateway city for Islamic pilgrims going to nearby Mecca, a religious journey known as the Hajj. Taif is located on the slopes of the Sarawat Mountains and provides a summer retreat for the Saudi government from the desert heat of the capital, Riyadh. Bright yellow-orange lighting marks highways that parallel the trend of the Asir Mountains (image center), connecting Mecca to the resort cities of Al Bahah and Abha. Smaller roadways, lit with blue lights, extend to the west to small cities along the Red Sea coastline. The bright yellow-orange glow of the city of Abha is matched by that of Khamis Mushait (or Khamis Mushayt) to the northeast. The brightly lit ribbon of highway continues towards other large cities to the south (Jazan, not shown) and southeast (Najran, not shown). Astronaut photograph ISS036-E-25802 was acquired on July 26, 2013, with a Nikon D3S digital camera using a 50 millimeter lens, and is provided by the ISS Crew Earth Observations experiment and Image Science & Analysis Laboratory, Johnson Space Center. The image was taken by the Expedition 36 crew. It has been cropped and enhanced to improve contrast, and lens artifacts have been removed. The International Space Station Program supports the laboratory as part of the ISS National Lab to help astronauts take pictures of Earth that will be of the greatest value to scientists and the public, and to make those images freely available on the Internet. Additional images taken by astronauts and cosmonauts can be viewed at the NASA/JSC Gateway to Astronaut Photography of Earth. Caption by William L. Stefanov, Jacobs/JETS at NASA-JSC. Instrument: ISS - Digital Camera More info: <a href="http://1.usa.gov/13TqPcr" rel="nofollow">1.usa.gov/13TqPcr</a> Credit: <b><a href="http://www.earthobservatory.nasa.gov/" rel="nofollow"> NASA Earth Observatory</a></b> <b><a href="http://www.nasa.gov/audience/formedia/features/MP_Photo_Guidelines.html" rel="nofollow">NASA image use policy.</a></b> <b><a href="http://www.nasa.gov/centers/goddard/home/index.html" rel="nofollow">NASA Goddard Space Flight Center</a></b> enables NASA’s mission through four scientific endeavors: Earth Science, Heliophysics, Solar System Exploration, and Astrophysics. Goddard plays a leading role in NASA’s accomplishments by contributing compelling scientific knowledge to advance the Agency’s mission. <b>Follow us on <a href="http://twitter.com/NASA_GoddardPix" rel="nofollow">Twitter</a></b> <b>Like us on <a href="http://www.facebook.com/pages/Greenbelt-MD/NASA-Goddard/395013845897?ref=tsd" rel="nofollow">Facebook</a></b> <b>Find us on <a href="http://instagram.com/nasagoddard?vm=grid" rel="nofollow">Instagram</a></b>
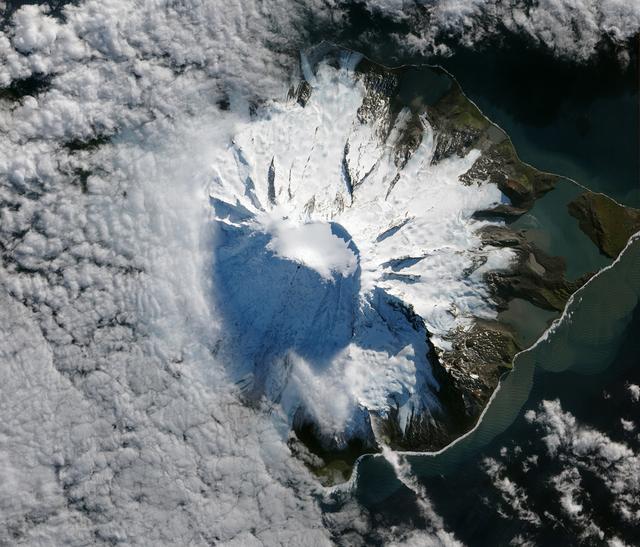
In October 2012, satellites measured subtle signals that suggested volcanic activity on remote Heard Island. These images, captured several months later, show proof of an eruption on Mawson Peak. By April 7, 2013, Mawson's steep-walled summit crater had filled, and a trickle of lava had spilled down the volcano’s southwestern flank. On April 20, the lava flow remained visible and had even widened slightly just below the summit. These natural-color images were collected by the Advanced Land Imager (ALI) on the Earth Observing-1 (EO-1) satellite. Image Credit: NASA Earth Observatory Read more: <a href="http://earthobservatory.nasa.gov/NaturalHazards/view.php?id=81024" rel="nofollow">earthobservatory.nasa.gov/NaturalHazards/view.php?id=81024</a> <b><a href="http://www.nasa.gov/audience/formedia/features/MP_Photo_Guidelines.html" rel="nofollow">NASA image use policy.</a></b> <b><a href="http://www.nasa.gov/centers/goddard/home/index.html" rel="nofollow">NASA Goddard Space Flight Center</a></b> enables NASA’s mission through four scientific endeavors: Earth Science, Heliophysics, Solar System Exploration, and Astrophysics. Goddard plays a leading role in NASA’s accomplishments by contributing compelling scientific knowledge to advance the Agency’s mission. <b>Follow us on <a href="http://twitter.com/NASA_GoddardPix" rel="nofollow">Twitter</a></b> <b>Like us on <a href="http://www.facebook.com/pages/Greenbelt-MD/NASA-Goddard/395013845897?ref=tsd" rel="nofollow">Facebook</a></b> <b>Find us on <a href="http://instagram.com/nasagoddard?vm=grid" rel="nofollow">Instagram</a></b>
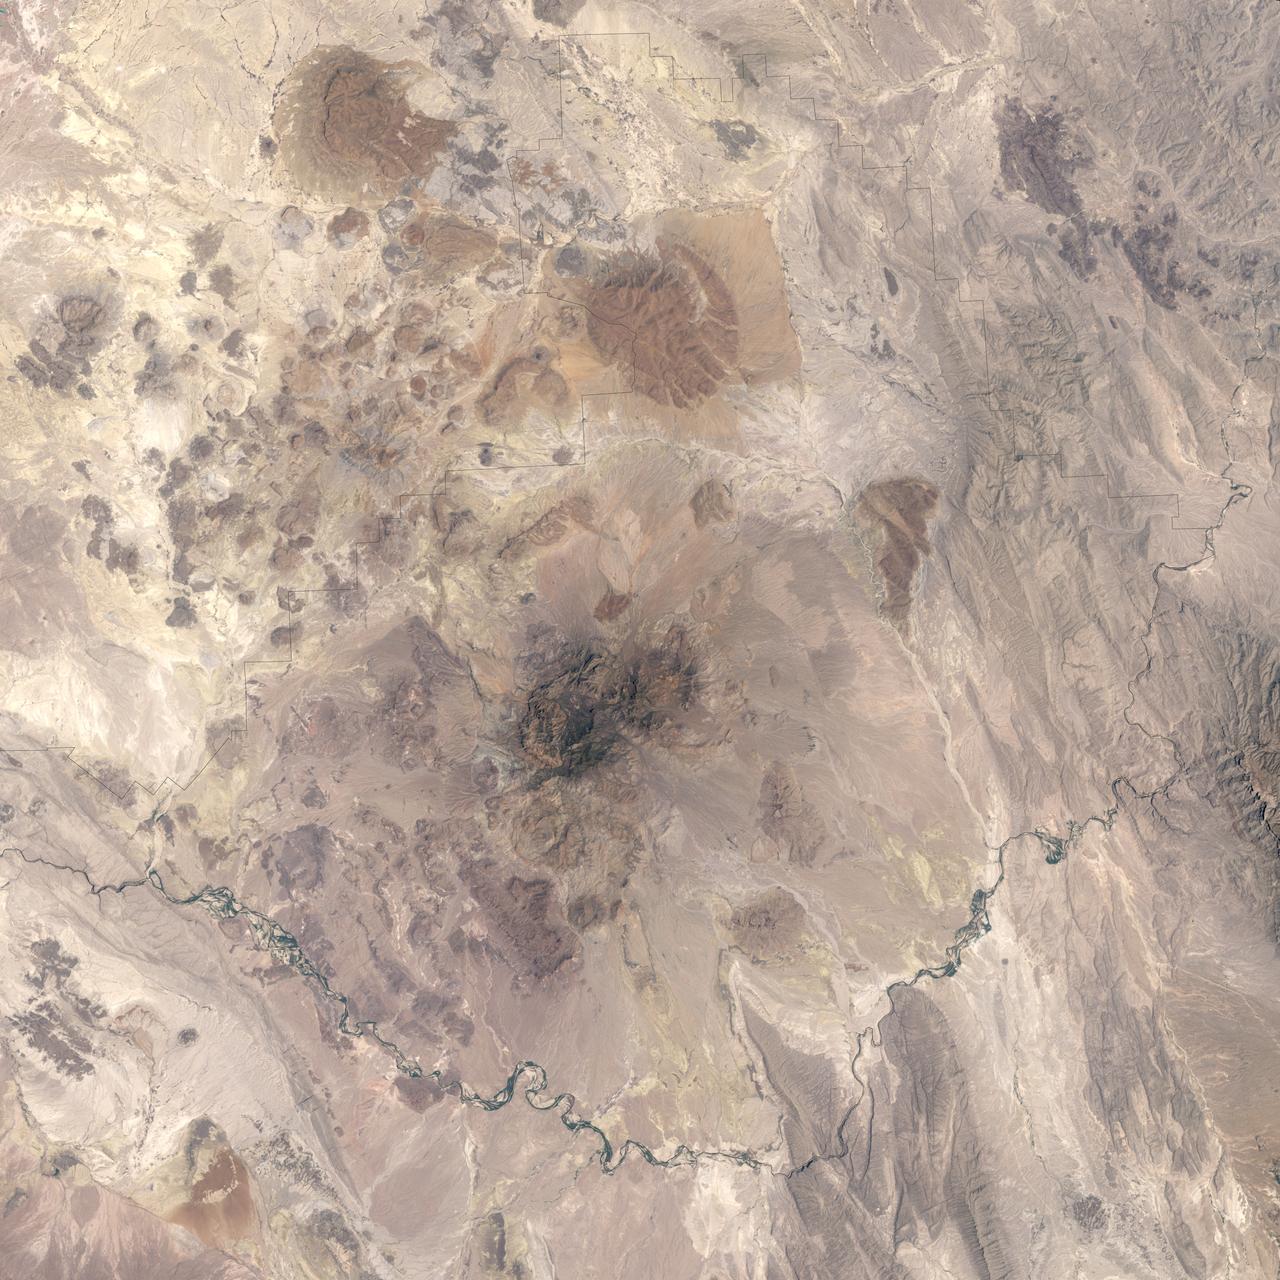
Alternately known as a geologist’s paradise and a geologist’s nightmare, Big Bend National Park in southwestern Texas offers a multitude of rock formations. Sparse vegetation makes finding and observing the rocks easy, but they document a complicated geologic history extending back 500 million years. On May 10, 2002, the Enhanced Thematic Mapper Plus on NASA’s Landsat 7 satellite captured this natural-color image of Big Bend National Park. A black line delineates the park perimeter. The arid landscape appears in muted earth tones, some of the darkest hues associated with volcanic structures, especially the Rosillos and Chisos Mountains. Despite its bone-dry appearance, Big Bend National Park is home to some 1,200 plant species, and hosts more kinds of cacti, birds, and bats than any other U.S. national park. Read more: <a href="http://go.nasa.gov/2bzGaZU" rel="nofollow">go.nasa.gov/2bzGaZU</a> Credit: NASA/Landsat7 <b><a href="http://www.nasa.gov/audience/formedia/features/MP_Photo_Guidelines.html" rel="nofollow">NASA image use policy.</a></b> <b><a href="http://www.nasa.gov/centers/goddard/home/index.html" rel="nofollow">NASA Goddard Space Flight Center</a></b> enables NASA’s mission through four scientific endeavors: Earth Science, Heliophysics, Solar System Exploration, and Astrophysics. Goddard plays a leading role in NASA’s accomplishments by contributing compelling scientific knowledge to advance the Agency’s mission. <b>Follow us on <a href="http://twitter.com/NASAGoddardPix" rel="nofollow">Twitter</a></b> <b>Like us on <a href="http://www.facebook.com/pages/Greenbelt-MD/NASA-Goddard/395013845897?ref=tsd" rel="nofollow">Facebook</a></b> <b>Find us on <a href="http://instagrid.me/nasagoddard/?vm=grid" rel="nofollow">Instagram</a></b>
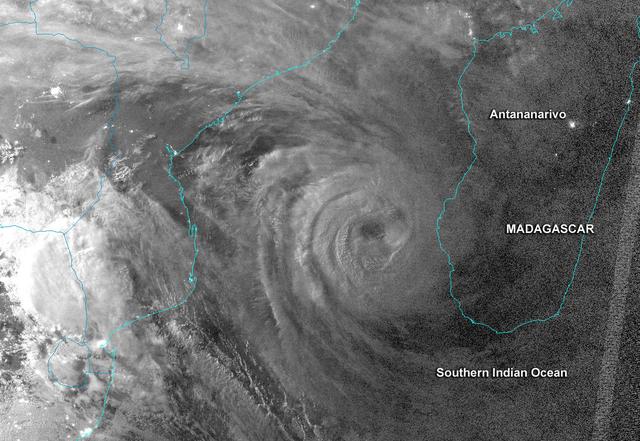
This night-time image revealed Cyclone Haruna's massive eye before it made landfall in southwestern Madagascar. This image was taken from the VIIRS instrument that flies aboard the NASA-NOAA Suomi NPP satellite. The image was taken on Feb. 20 at 2242 UTC (5:42 p.m. EST/U.S.) and shows a clear eye, surrounded by very powerful thunderstorms. The bright lights of the Capital city of Antananarivo are seen in this image. The capital city lies about 300 nautical miles northwest of the storm's center. Haruna's center made landfall near Manombo, Madagascar around 0600 UTC (1 a.m. EST/U.S.) and its eye became cloud-filled quickly. For the entire storm history, visit NASA's Hurricane Page: <a href="http://www.nasa.gov/mission_pages/hurricanes/archives/2013/h2013_Haruna.html" rel="nofollow">www.nasa.gov/mission_pages/hurricanes/archives/2013/h2013...</a> Text: Credit: Univ.of Wisconsin/NASA/NOAA <b><a href="http://www.nasa.gov/audience/formedia/features/MP_Photo_Guidelines.html" rel="nofollow">NASA image use policy.</a></b> <b><a href="http://www.nasa.gov/centers/goddard/home/index.html" rel="nofollow">NASA Goddard Space Flight Center</a></b> enables NASA’s mission through four scientific endeavors: Earth Science, Heliophysics, Solar System Exploration, and Astrophysics. Goddard plays a leading role in NASA’s accomplishments by contributing compelling scientific knowledge to advance the Agency’s mission. <b>Follow us on <a href="http://twitter.com/NASA_GoddardPix" rel="nofollow">Twitter</a></b> <b>Like us on <a href="http://www.facebook.com/pages/Greenbelt-MD/NASA-Goddard/395013845897?ref=tsd" rel="nofollow">Facebook</a></b> <b>Find us on <a href="http://instagram.com/nasagoddard?vm=grid" rel="nofollow">Instagram</a></b>

ISS031-E-006398 (30 April 2012) --- Lake Powell and the Rincon in Utah are featured in this image photographed by an Expedition 31 crew member on the International Space Station. This photograph highlights part of Lake Powell; the lake extends across southeastern Utah and northeastern Arizona. Lake Powell started filling in 1963 when the Glen Canyon Dam on the Colorado River in Arizona was completed, and Glen Canyon flooded. The serpentine water surface of the reservoir-highlighted by gray regions of sunglint-follows the incised course of the canyon. Today Lake Powell is part of the Glen Canyon National Recreation Area which extends for more than 186 miles along the shoreline and side canyons. The primary intended use of Lake Powell?s water is support of agricultural production, with a small portion allocated to urban use in Arizona, Nevada, and California. The reservoir did not reach its maximum capacity of 27 million acre-feet until 1980. More recently, extended drought conditions in the southwestern United States over the past decade have resulted in a significant lowering of the Lake water level and emergence of parts of Glen Canyon. Should average precipitation in the Colorado River watershed lessen (as predicted by regional climate change models), that could result in further lowering of the Lake Powell water level and changes to the current water management plans. Fluctuations in water levels and change of river courses are a common occurrence seen in the geologic record of rivers. Looking somewhat like a donut or automobile tire from the vantage point of the space station, the Rincon (center) is an entrenched and abandoned meander, or loop, of the Colorado River, thought to have formed several thousand years ago when the river cut straight across the ends of the loop and shortened its course by six miles. The resulting canyon and 600 ? 750 feet-high central mesa indicate where the river used to flow. The term ?Rincon? also is used by geomorphologists to describe similar ancient river features observed elsewhere. The Goosenecks of the San Juan River are an example of an active entrenched meander.
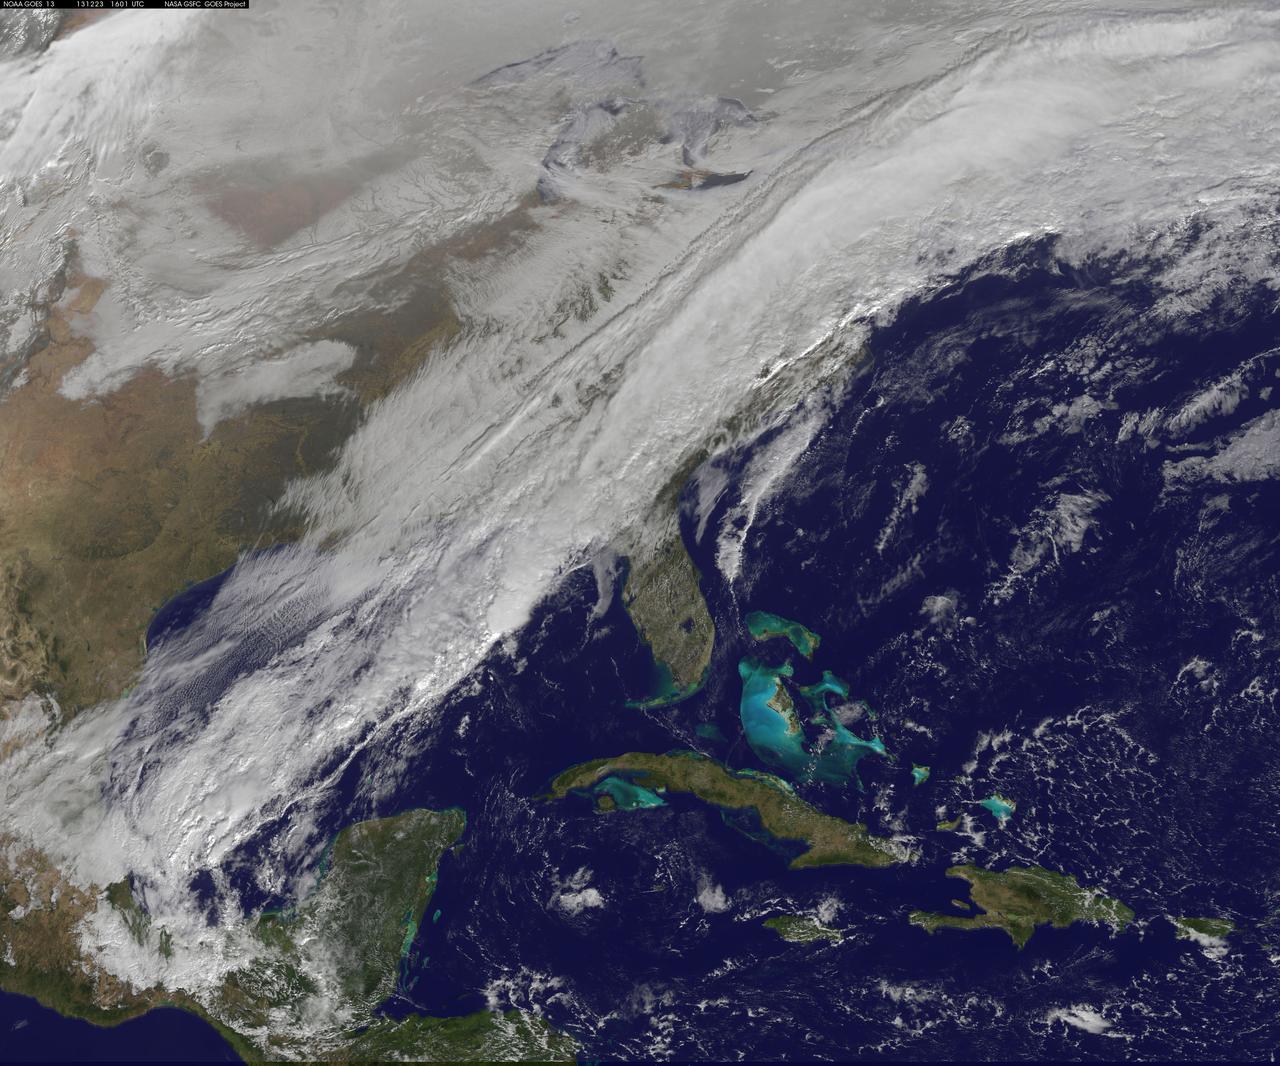
A long, strong, cold front draped over the eastern U.S. is marking a stark change from record-warmth to very cold temperatures. This NOAA GOES-East satellite image from December 23 at 1515 UTC/10:15 a.m. EST shows a powerful cold front covering the U.S. East Coast and stretching into the central and southwestern Gulf of Mexico. According to the National Weather Service, that front is bringing rain and embedded thunderstorms over the Mid-Atlantic and Southeastern U.S. The same system is bringing lingering wintry precipitation to northern New England and upstate New York. Behind the cold front, much colder and dry Canadian air will filter in under high pressure and bring sunshine over the eastern U.S. in time for Christmas. The image was created by the NASA GOES Project at NASA's Goddard Space Flight Center, Greenbelt, Md. Rob Gutro NASA Goddard Space Flight Center <b><a href="http://www.nasa.gov/audience/formedia/features/MP_Photo_Guidelines.html" rel="nofollow">NASA image use policy.</a></b> <b><a href="http://www.nasa.gov/centers/goddard/home/index.html" rel="nofollow">NASA Goddard Space Flight Center</a></b> enables NASA’s mission through four scientific endeavors: Earth Science, Heliophysics, Solar System Exploration, and Astrophysics. Goddard plays a leading role in NASA’s accomplishments by contributing compelling scientific knowledge to advance the Agency’s mission. <b>Follow us on <a href="http://twitter.com/NASA_GoddardPix" rel="nofollow">Twitter</a></b> <b>Like us on <a href="http://www.facebook.com/pages/Greenbelt-MD/NASA-Goddard/395013845897?ref=tsd" rel="nofollow">Facebook</a></b> <b>Find us on <a href="http://instagram.com/nasagoddard?vm=grid" rel="nofollow">Instagram</a></b>
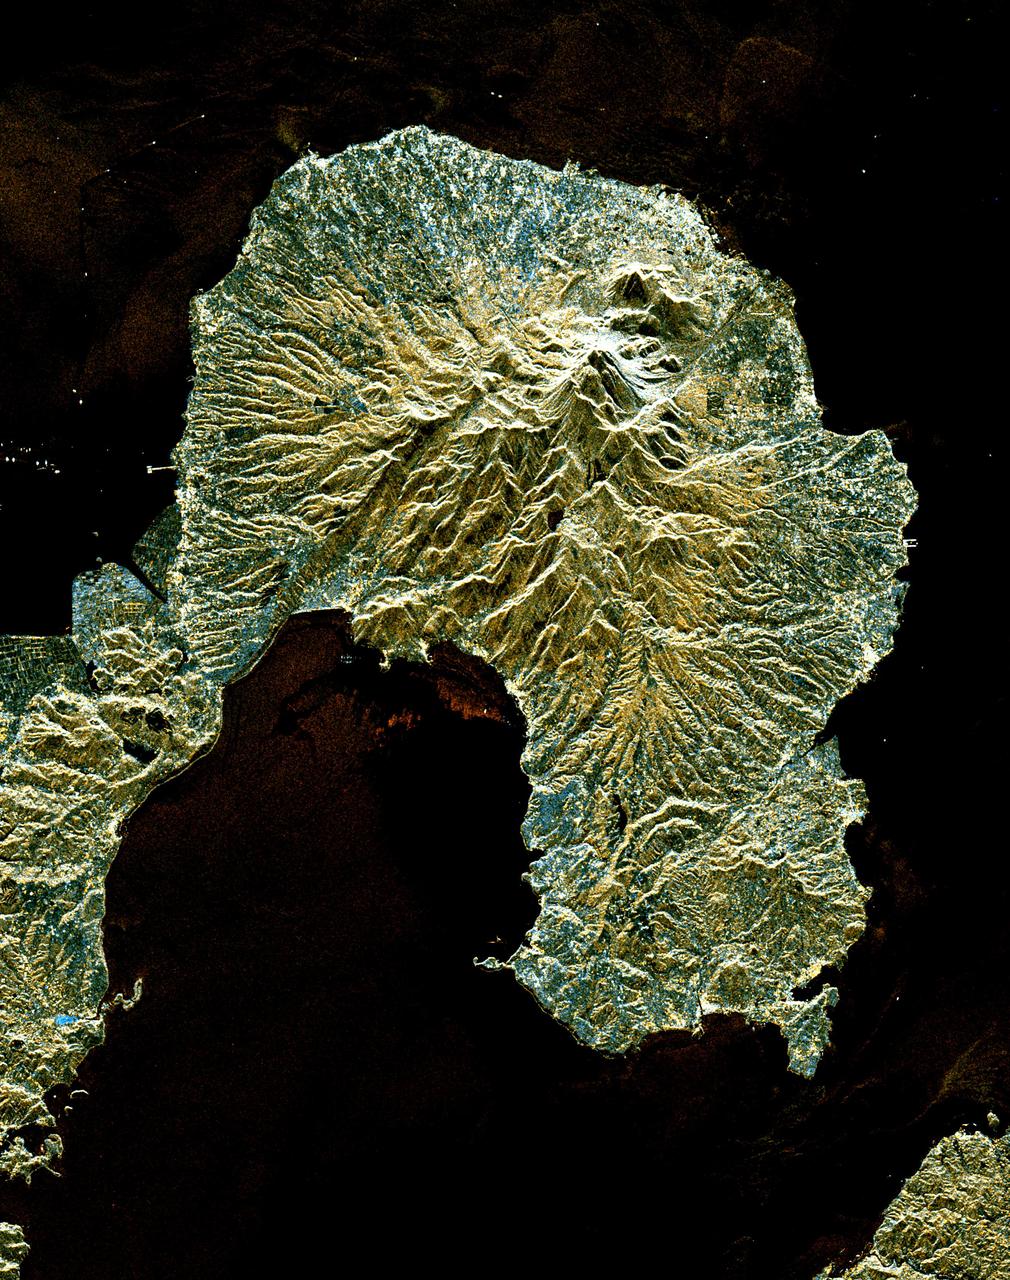
This is a space radar image of the area around the Unzen volcano, on the west coast of Kyushu Island in southwestern Japan. Unzen, which appears in this image as a large triangular peak with a white flank near the center of the peninsula, has been continuously active since a series of powerful eruptions began in 1991. The image was acquired by the Spaceborne Imaging Radar-C/X-band Synthetic Aperture Radar (SIR-C/X-SAR) aboard the space shuttle Endeavour on its 93rd orbit on April 15, 1994. The image shows an area 41.5 kilometers by 32.8 kilometers (25.7 miles by 20.3 miles) that is centered at 32.75 degrees north latitude and 130.15 degrees east longitude. North is toward the upper left of the image. The radar illumination is from the top of the image. The colors in this image were obtained using the following radar channels: red represents the L-band (vertically transmitted and received); green represents the average of L-band and C-band (vertically transmitted and received); blue represents the C-band (vertically transmitted and received). Unzen is one of 15 "Decade" volcanoes identified by the scientific community as posing significant potential threats to large local populations. The city of Shimabara sits along the coast at the foot of Unzen on its east and northeast sides. At the summit of Unzen a dome of thick lava has been growing continuously since 1991. Collapses of the sides of this dome have generated deadly avalanches of hot gas and rock known as pyroclastic flows. Volcanologists can use radar image data to monitor the growth of lava domes, to better understand and predict potentially hazardous collapses. http://photojournal.jpl.nasa.gov/catalog/PIA00504
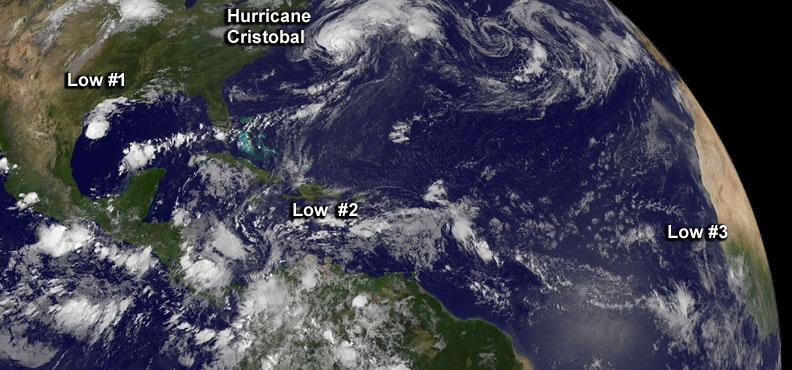
Although there's only one formed tropical cyclone in the Atlantic: Hurricane Cristobal, there are three other developing areas of low pressure and all were captured in this panoramic image from NOAA's GOES-East satellite today at 8 a.m. EDT. Cristobal is a hurricane located east of the U.S. East coast and is forecast to move up toward eastern Canada tonight (and stay off-shore). The image was made at NASA's GOES Project at NASA's Goddard Space Flight Center in Greenbelt, Maryland. Low #1. A weak area of low pressure near the coast of South Texas is producing disorganized showers and thunderstorms. Significant development of this system is unlikely before it moves inland over South Texas and northern Mexico today. It has a ten percent chance of development into a tropical depression in the next 2 days. Low #2. A tropical wave located over the eastern Caribbean Sea continues to produce disorganized cloudiness and showers. Upper-level winds are expected to remain unfavorable for development during the next couple of days while the system moves across the eastern and central Caribbean Sea. However, environmental conditions could become conducive for some development when the system moves over the northwestern Caribbean Sea on Sunday and into the southwestern Gulf of Mexico early next week. It has a near zero chance to develop in the next 2 days. Low #3. A tropical wave is forecast to move off the west coast of Africa on Friday. Environmental conditions could be conducive for some gradual development of this system while it moves westward at 10 to 15 mph across the eastern Atlantic early next week. This has a near zero chance of development in the next two days. <b><a href="http://www.nasa.gov/audience/formedia/features/MP_Photo_Guidelines.html" rel="nofollow">NASA image use policy.</a></b> <b><a href="http://www.nasa.gov/centers/goddard/home/index.html" rel="nofollow">NASA Goddard Space Flight Center</a></b> enables NASA’s mission through four scientific endeavors: Earth Science, Heliophysics, Solar System Exploration, and Astrophysics. Goddard plays a leading role in NASA’s accomplishments by contributing compelling scientific knowledge to advance the Agency’s mission. <b>Follow us on <a href="http://twitter.com/NASAGoddardPix" rel="nofollow">Twitter</a></b> <b>Like us on <a href="http://www.facebook.com/pages/Greenbelt-MD/NASA-Goddard/395013845897?ref=tsd" rel="nofollow">Facebook</a></b> <b>Find us on <a href="http://instagram.com/nasagoddard?vm=grid" rel="nofollow">Instagram</a></b>
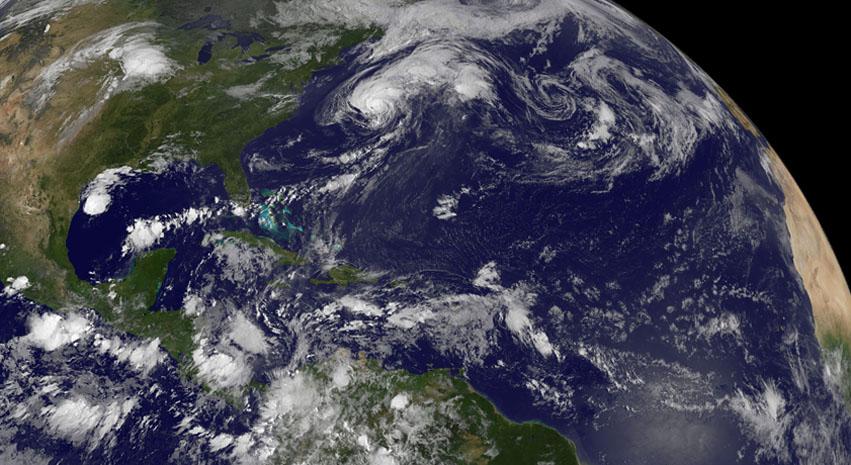
Although there's only one formed tropical cyclone in the Atlantic: Hurricane Cristobal, there are three other developing areas of low pressure and all were captured in this panoramic image from NOAA's GOES-East satellite today at 8 a.m. EDT. Cristobal is a hurricane located east of the U.S. East coast and is forecast to move up toward eastern Canada tonight (and stay off-shore). The image was made at NASA's GOES Project at NASA's Goddard Space Flight Center in Greenbelt, Maryland. Low #1. A weak area of low pressure near the coast of South Texas is producing disorganized showers and thunderstorms. Significant development of this system is unlikely before it moves inland over South Texas and northern Mexico today. It has a ten percent chance of development into a tropical depression in the next 2 days. Low #2. A tropical wave located over the eastern Caribbean Sea continues to produce disorganized cloudiness and showers. Upper-level winds are expected to remain unfavorable for development during the next couple of days while the system moves across the eastern and central Caribbean Sea. However, environmental conditions could become conducive for some development when the system moves over the northwestern Caribbean Sea on Sunday and into the southwestern Gulf of Mexico early next week. It has a near zero chance to develop in the next 2 days. Low #3. A tropical wave is forecast to move off the west coast of Africa on Friday. Environmental conditions could be conducive for some gradual development of this system while it moves westward at 10 to 15 mph across the eastern Atlantic early next week. This has a near zero chance of development in the next two days. <b><a href="http://www.nasa.gov/audience/formedia/features/MP_Photo_Guidelines.html" rel="nofollow">NASA image use policy.</a></b> <b><a href="http://www.nasa.gov/centers/goddard/home/index.html" rel="nofollow">NASA Goddard Space Flight Center</a></b> enables NASA’s mission through four scientific endeavors: Earth Science, Heliophysics, Solar System Exploration, and Astrophysics. Goddard plays a leading role in NASA’s accomplishments by contributing compelling scientific knowledge to advance the Agency’s mission. <b>Follow us on <a href="http://twitter.com/NASAGoddardPix" rel="nofollow">Twitter</a></b> <b>Like us on <a href="http://www.facebook.com/pages/Greenbelt-MD/NASA-Goddard/395013845897?ref=tsd" rel="nofollow">Facebook</a></b> <b>Find us on <a href="http://instagram.com/nasagoddard?vm=grid" rel="nofollow">Instagram</a></b>
Image acquired December 19, 2011 A strong low pressure area in the southwestern U.S. today is bringing snowfall there as NOAA's GOES-13 satellite captured its associated clouds. Blizzard warnings are already posted for some areas. The image was created on Dec. 19 at 19:10 UTC (2:10 p.m. EST) from the Geostationary Operational Environmental Satellite called GOES-13. GOES-13 is operated by the National Oceanic and Atmospheric Administration. Images and animations are created by NASA's GOES Project, located at NASA's Goddard Space Flight Center, Greenbelt, Md. The low is forecast to move northeast across southeastern New Mexico today and reach southwest the Texas panhandle by early evening. The plains states including portions of Kansas, New Mexico and the Texas and Oklahoma panhandles could all have blizzard warnings later in the day on Dec. 19. Wind gusts to 60mph were recorded in northeastern New Mexico during the afternoon hours today. Kansas City may have a mix of rain, sleet and snow as the front moves past and temperatures fall. At 3 p.m. EST, the National Weather Service forecast indicated that moderate to heavy snow and strong north winds to impact the Texas and Oklahoma panhandles today into Tuesday morning. The low and associated cold front are expected to bring heavy snow to the Oklahoma panhandle and all but the far southeast Texas Panhandle. Behind the cold front, the strong winds will blow snow and lead to poor visibilities and blizzard conditions. The GOES image shows the large bank of clouds along the front stretching from the four corners states east-northeast through the Ohio Valley and into upstate New York. The rounded comma shape of clouds over Texas and stretching into Colorado indicate where the low pressure center is located. Image: NASA/NOAA GOES Project Text: NASA, Rob Gutro <b><a href="http://www.nasa.gov/audience/formedia/features/MP_Photo_Guidelines.html" rel="nofollow">NASA image use policy.</a></b> <b><a href="http://www.nasa.gov/centers/goddard/home/index.html" rel="nofollow">NASA Goddard Space Flight Center</a></b> enables NASA’s mission through four scientific endeavors: Earth Science, Heliophysics, Solar System Exploration, and Astrophysics. Goddard plays a leading role in NASA’s accomplishments by contributing compelling scientific knowledge to advance the Agency’s mission. <b>Follow us on <a href="http://twitter.com/NASA_GoddardPix" rel="nofollow">Twitter</a></b> <b>Like us on <a href="http://www.facebook.com/pages/Greenbelt-MD/NASA-Goddard/395013845897?ref=tsd" rel="nofollow">Facebook</a></b> <b>Find us on <a href="http://instagrid.me/nasagoddard/?vm=grid" rel="nofollow">Instagram</a></b>
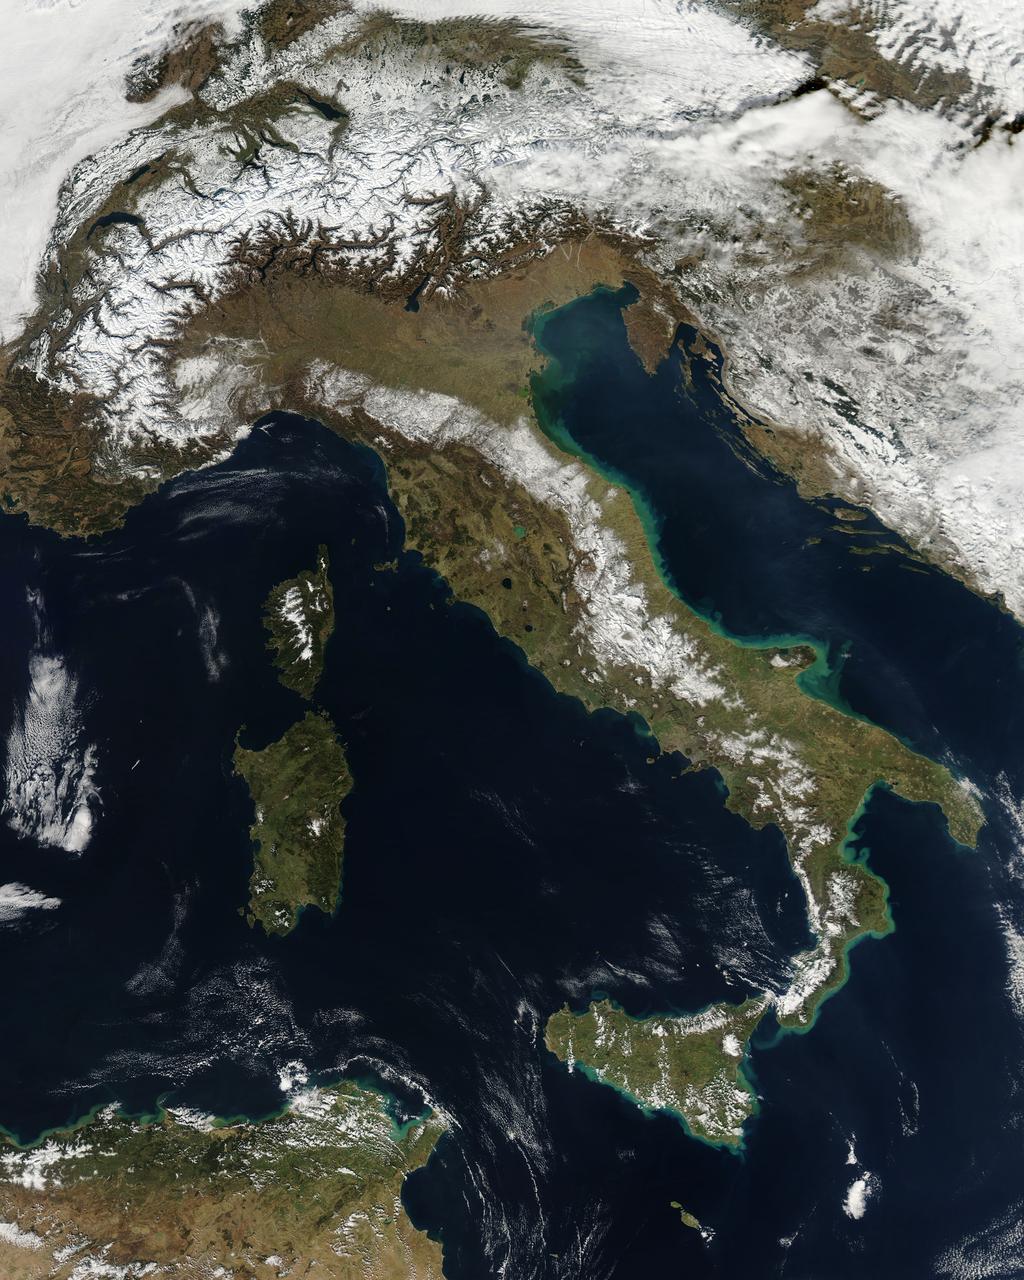
NASA image acquired February 24, 2012 By late February, 2012, the great European cold wave had begun to loosen its frigid grip, but significant snow still remained in the region. The Moderate Resolution Imaging Spectroradiometer (MODIS) aboard the Aqua satellite captured this true-color image of snow in Italy on February 24 at 12:35 UTC (1:30 p.m. local time). In the north of the image, bright white clouds blanket the region in a broad arc. Snow, which tends to be generally less bright that clouds, covers the Alps in the north of Italy. The Apennine Mountains, which form the backbone of the Italian peninsula, also carry a blanket of snow. Although clouds and snow can, at times, be distinguished visually in a true-color image, sometimes they can appear very similar. When it is important to clearly define snow from cloud, false color images are often helpful. Rome, which can be seen as a gray smudge on the southwestern coast of the peninsula, recorded highs of a spring-like 50°F the day this image was captured, but earlier in the month the temperatures dove as low as 26°F on February 5. During that cold snap a rare intense snowfall blanketed Rome, causing the closure of the Colosseum, the Roman Forum and the Palatine Hill due to concerns of the risk of icy footing for tourists, and roads became impassible. Further north, temperatures plummeted to −21 °C (−6 °F) on 7 February. On February 11, news media reported over 2 meters (6.5 feet) of snow had fallen in Urbino, a walled town situated on a high sloping hillside on the eastern side of the Apennine Mountains. That same snowfall cut access to many remote towns in the Apennines, blocking roads and trapping some people in the homes. Credit: NASA/GSFC/Jeff Schmaltz/MODIS Land Rapid Response Team <b><a href="http://www.nasa.gov/centers/goddard/home/index.html" rel="nofollow">NASA Goddard Space Flight Center</a></b> enables NASA’s mission through four scientific endeavors: Earth Science, Heliophysics, Solar System Exploration, and Astrophysics. Goddard plays a leading role in NASA’s accomplishments by contributing compelling scientific knowledge to advance the Agency’s mission. <b>Follow us on <a href="http://twitter.com/NASA_GoddardPix" rel="nofollow">Twitter</a></b> <b>Like us on <a href="http://www.facebook.com/pages/Greenbelt-MD/NASA-Goddard/395013845897?ref=tsd" rel="nofollow">Facebook</a></b> <b>Find us on <a href="http://instagrid.me/nasagoddard/?vm=grid" rel="nofollow">Instagram</a></b>
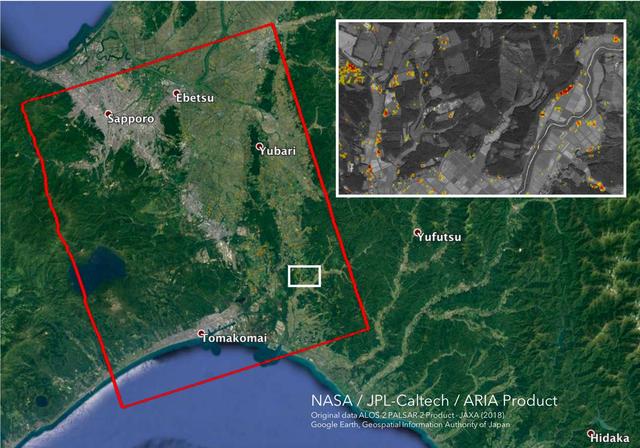
The Advanced Rapid Imaging and Analysis (ARIA) team at NASA's Jet Propulsion Laboratory in Pasadena, California, and Caltech, also in Pasadena, created this Damage Proxy Map (DPM) depicting areas in the southwestern part of Hokkaido, Japan, that are likely damaged as a result of the M6.6 September 5 earthquake in 2018 (shown by red and yellow pixels). The map is derived from synthetic aperture radar (SAR) images from the ALOS-2 satellites, operated by Japan Aerospace Exploration Agency (JAXA). The images were taken before and after the earthquake -- August 23 and September 6, respectively. The map covers an area of 70 by 57 kilometers, shown by the large red polygon. Each pixel measures about 30 meters across. The color variation from yellow to red indicates increasingly more significant ground surface change. Preliminary validation was done by comparing with the high-resolution airborne optical imagery provided by the Geospatial Information Authority of Japan. This damage proxy map should be used as guidance to identify damaged areas, and may be less reliable over vegetated areas. For example, pixels over vegetated areas and farmlands may be false positives, and the lack of colored pixels over vegetated areas does not necessarily mean no damage. The DPM was created by the NASA-JPL/Caltech ARIA team, and the ALOS-2 data were provided by JAXA. The algorithm development was carried out at JPL under a contract with NASA. https://photojournal.jpl.nasa.gov/catalog/PIA22696
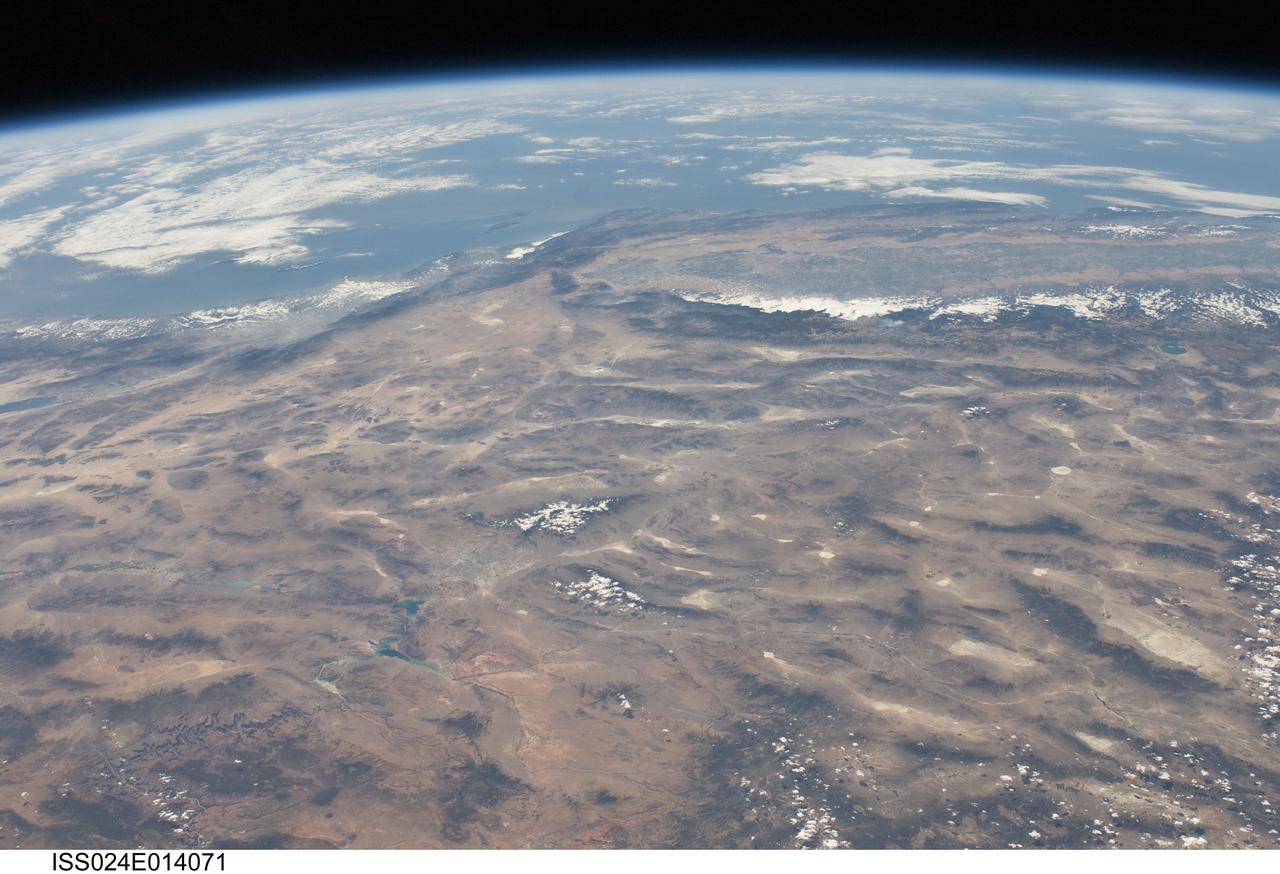
ISS024-E-014071 (9 Sept. 2010) --- This striking panoramic view of the southwestern USA and Pacific Ocean is an oblique image photographed by an Expedition 24 crew member looking outwards at an angle from the International Space Station (ISS). While most unmanned orbital satellites view Earth from a nadir perspective?in other words, collecting data with a ?straight down? viewing geometry?crew members onboard the space station can acquire imagery at a wide range of viewing angles using handheld digital cameras. The ISS nadir point (the point on Earth?s surface directly below the spacecraft) was located in northwestern Arizona, approximately 260 kilometers to the east-southeast, when this image was taken. The image includes parts of the States of Arizona, Nevada, Utah, and California together with a small segment of the Baja California, Mexico coastline at center left. Several landmarks and physiographic features are readily visible. The Las Vegas, NV metropolitan area appears as a gray region adjacent to the Spring Mountains and Sheep Range (both covered by white clouds). The Grand Canyon, located on the Colorado Plateau in Arizona, is visible (lower left) to the east of Las Vegas with the blue waters of Lake Mead in between. The image also includes the Mojave Desert, stretching north from the Salton Sea (left) to the Sierra Nevada mountain range. The Sierra Nevada range is roughly 640 kilometers long (north-south) and forms the boundary between the Central Valley of California and the adjacent Basin and Range. The Basin and Range is so called due to the pattern of long linear valleys separated by parallel linear mountain ranges ? this landscape, formed by extension and thinning of Earth?s crust, is particularly visible at right.
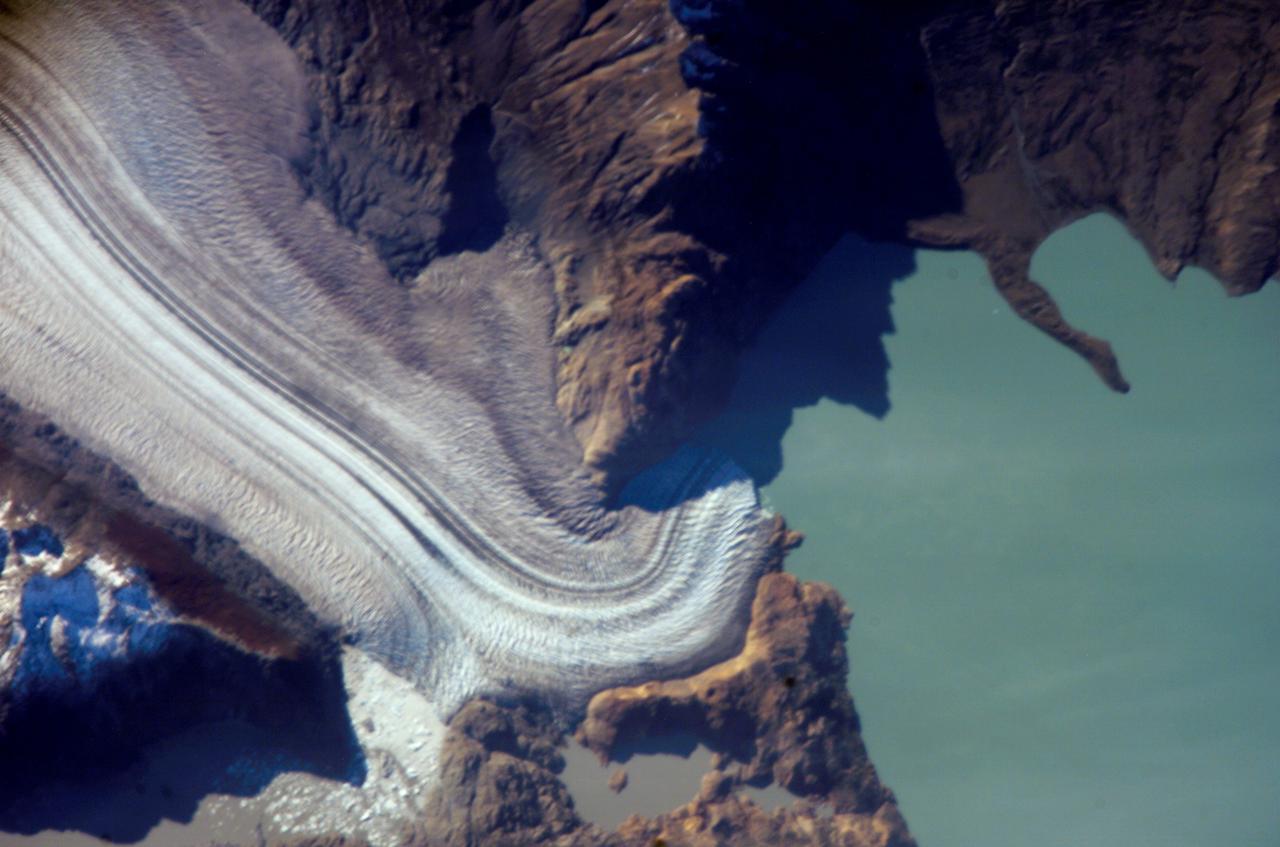
ISS013-E-06947 (12 April 2006) --- Viedma Glacier, Argentina is featured in this image photographed by an Expedition 13 crewmember on the International Space Station. The ice fields of Patagonia, located at the southern end of South America, are the largest masses of ice in the temperate Southern Hemisphere (approximately 55,000 square kilometers in area). The ice fields contain numerous valley glaciers that terminate in melt-water-fed lakes. These are known as "calving" glaciers, as they lose mass by collapse of large ice chunks from the terminus--or end--of the glacier. These newly separated chunks of ice are then free to float away, much like ice cubes in a punch bowl. The Patagonian glaciers are closely monitored using remotely sensed data as they respond to regional climate change. Visual comparison of time series of images is typically performed to quantify change in ice extent and position. The terminus of the Viedma Glacier, approximately two kilometers across where it enters Lake Viedma, is shown in this image. Moraines are accumulations of soil and rock debris that form along the sides and front of a glacier as it flows across the landscape (much like a bulldozer). Independent valley glaciers can merge together as they flow down-slope, and the moraines become entrained in the center of the new ice mass. These medial moraines are visible as dark parallel lines within the white central mass of the glacier (image center and left). Crevasses - oriented roughly perpendicular to the medial moraines - are also visible in the grey-brown ice along the sides of the glacier. According to scientists, the canyon-like crevasses form as a result of stress between the slower moving ice along the valley sides and the more rapidly moving ice in the center of the glacier. Calving of ice from the southwestern fork of the glacier terminus is visible at image lower left.
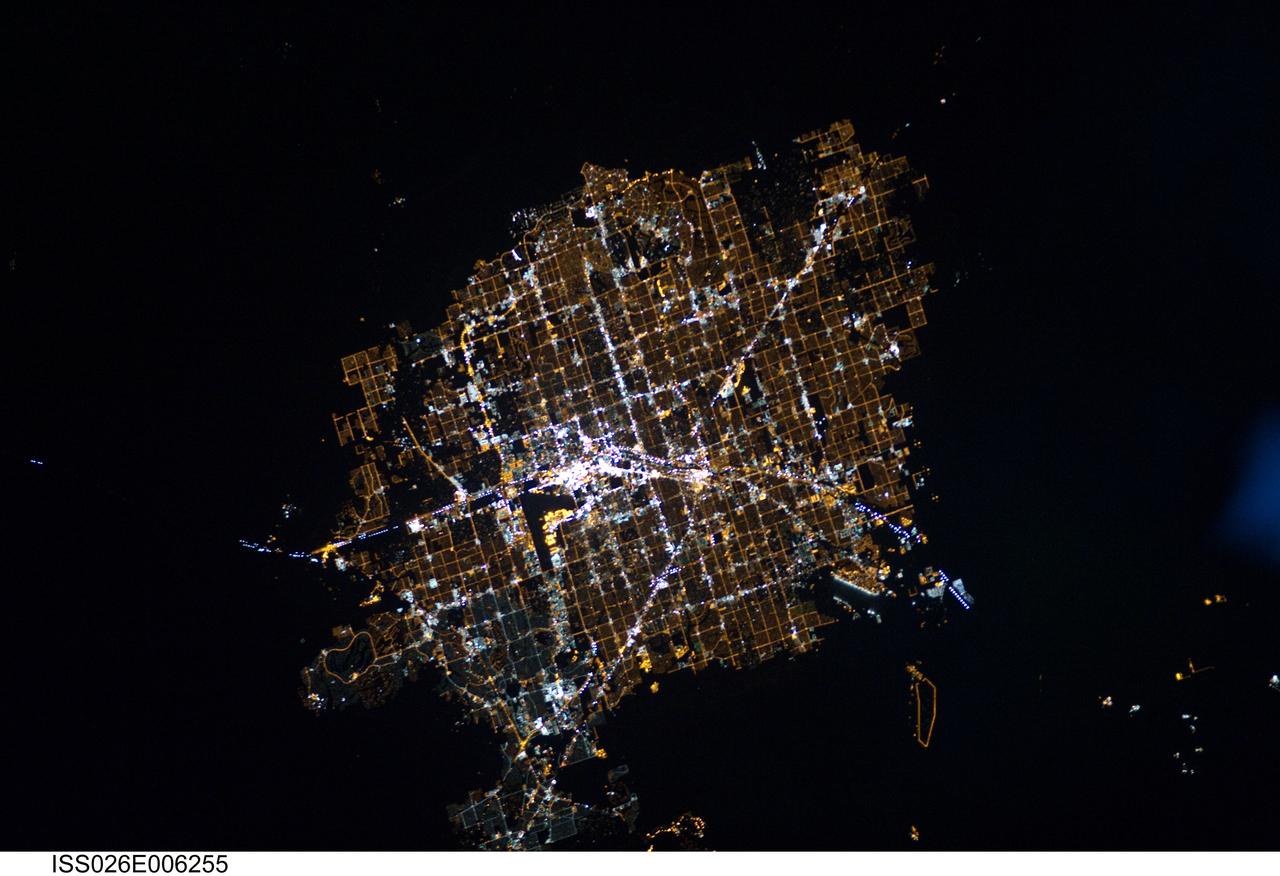
ISS026-E-006255 (30 Nov. 2010) --- This night time image, photographed by an Expedition 26 crew member on the International Space Station, features the Las Vegas, Nevada metropolitan area, located near the southern tip of the state within the Mohave Desert of the southwestern USA. While the city of Las Vegas proper is famous for its casinos and resort hotels – the city bills itself as “the entertainment capital of the world” – the metropolitan area includes several other incorporated cities and unincorporated (not part of a state-recognized municipality) areas. Crew members onboard the ISS observe and photograph numerous metropolitan sites when the areas are illuminated by sunlight, but the extent and pattern of these areas are perhaps best revealed by the city lights at night. The surrounding dark desert presents a stark contrast to the brightly lit, regular street grid of the developed metropolitan area. The Vegas Strip (center) is reputed to be the brightest spot on Earth due to the concentration of lights associated with its hotels and casinos. The tarmac of McCarran International Airport to the south is a dark feature by comparison. The airstrips of Nellis Air Force Base on the northeastern fringe of the metropolitan area are likewise dark compared to the well-lit adjacent streets and neighborhoods. The dark mass of Frenchman Mountain borders the metropolitan area to the east. Acquisition of focused night time images such as this one requires space station crew members to track the target with the handheld camera while the ISS is moving at a speed of more than seven kilometers per second (15,659 miles per hour) relative to Earth’s surface. This was achieved during ISS Expedition Six using a homemade tracking device, but subsequent crews have needed to develop manual tracking skills. These skills, together with advances in digital camera technology, have enabled recent ISS crews to acquire striking night time images of Earth.
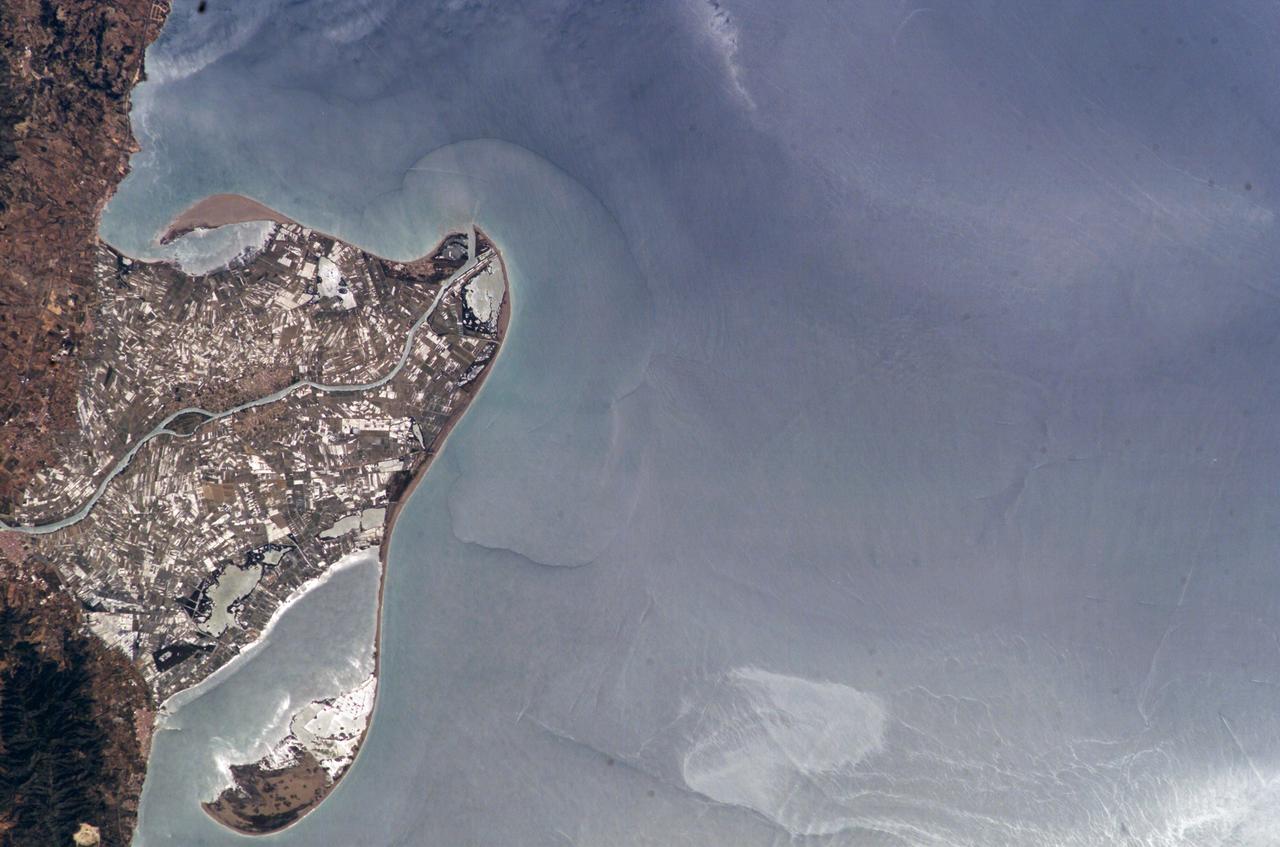
ISS009-E-09985 (3 June 2004) --- The Ebro River Delta, located along the eastern coast of Spain, is featured in this image photographed by an Expedition 9 crewmember on the International Space Station (ISS). Taken in partial sun glint, this view defines the Ebro’s fresh water lens— the water density boundary between the upper layer of fresh water issuing from the Ebro River mouth and the saltier, denser Mediterranean Sea water. According to NASA geologists studying the ISS imagery, diversion and impoundment of the Ebro River upstream has led to a decrease in water and sediment delivery to the delta. This decrease has led to increased erosion in some areas to the northeast of El Fangar Bay and along the southwestern shoreline of the delta. The Ebro River Delta is one of the largest wetland areas in the western Mediterranean region. The Ebro delta has grown rapidly—the historical rate of growth of the delta is demonstrated by the city of Amposta. This city was a seaport in the 4th Century, and is now located well inland from the current Ebro river mouth. The rounded form of the delta attests to the balance between sediment deposition by the Ebro River and removal of this material by wave erosion. The modern delta is in intensive agricultural use for rice, fruit, and vegetables. White polygonal areas to the north and south of the Ebro River are paddy fields. The Ebro delta also hosts numerous beaches, marshes, and saltpans that provide habitat for over 300 species of birds. A large part of the delta was designated as Parc Natural del Delta de l'Ebre (Ebre Delta National Park) in 1983. A network of canals and irrigation ditches constructed by both agricultural and conservation groups are helping to maintain the ecologic and economic resources of the Ebro Delta.
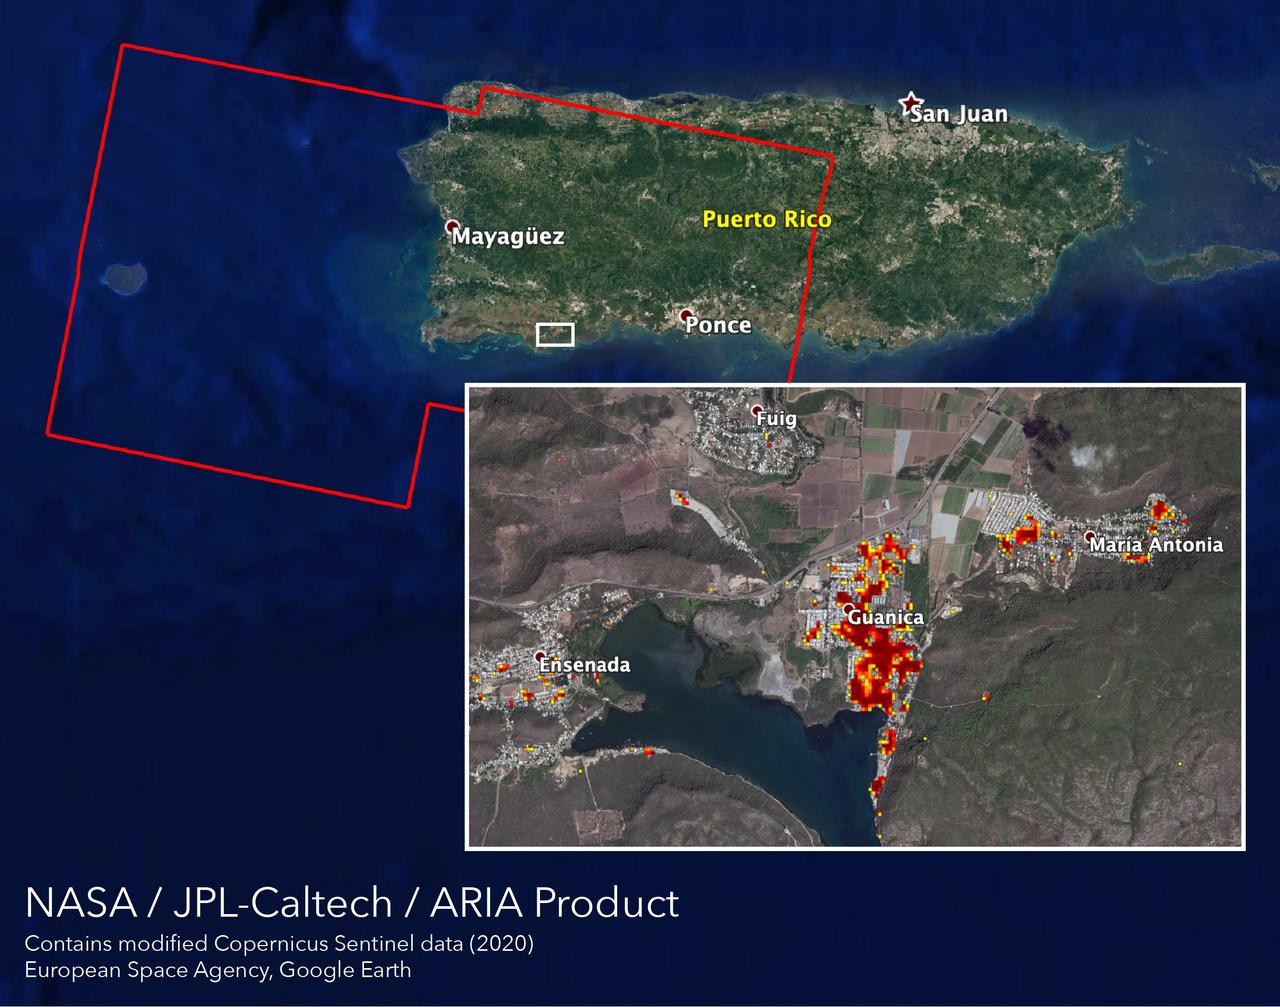
NASA scientists are helping local and federal agencies assess the extent of the damage in Puerto Rico following a 6.4-magnitude earthquake and hundreds of aftershocks. Using synthetic aperture radar data from the Copernicus Sentinel-1 satellites operated by the European Space Agency (ESA), the Advanced Rapid Imaging and Analysis (ARIA) team at NASA's Jet Propulsion Laboratory and Caltech in Pasadena, California created a new damage map that includes the southwestern coast near the main quake's epicenter. The ARIA team compared post-quake satellite data acquired on Jan. 14 with data as far back as Sept. 2019 to produce the map. The color variation from yellow to dark red indicates increasingly more significant damage. Their analysis shows that Guanica, west of the city of Ponce, was particularly hard hit. The map covers an area of 107 by 47 miles (172 by 76 kilometers), shown with the large red polygon, with each pixel measuring about 100 feet (30 meters) across. The data is most sensitive to building damage rather than small scale changes or partial structural damage. It is also less reliable over heavy vegetation. Even with these limitations, the map can still serve an important role in identifying the areas that may need help the most. The map contains modified Copernicus Sentinel data processed by ESA and analyzed by ARIA team scientists at NASA JPL and Caltech. https://photojournal.jpl.nasa.gov/catalog/PIA23429
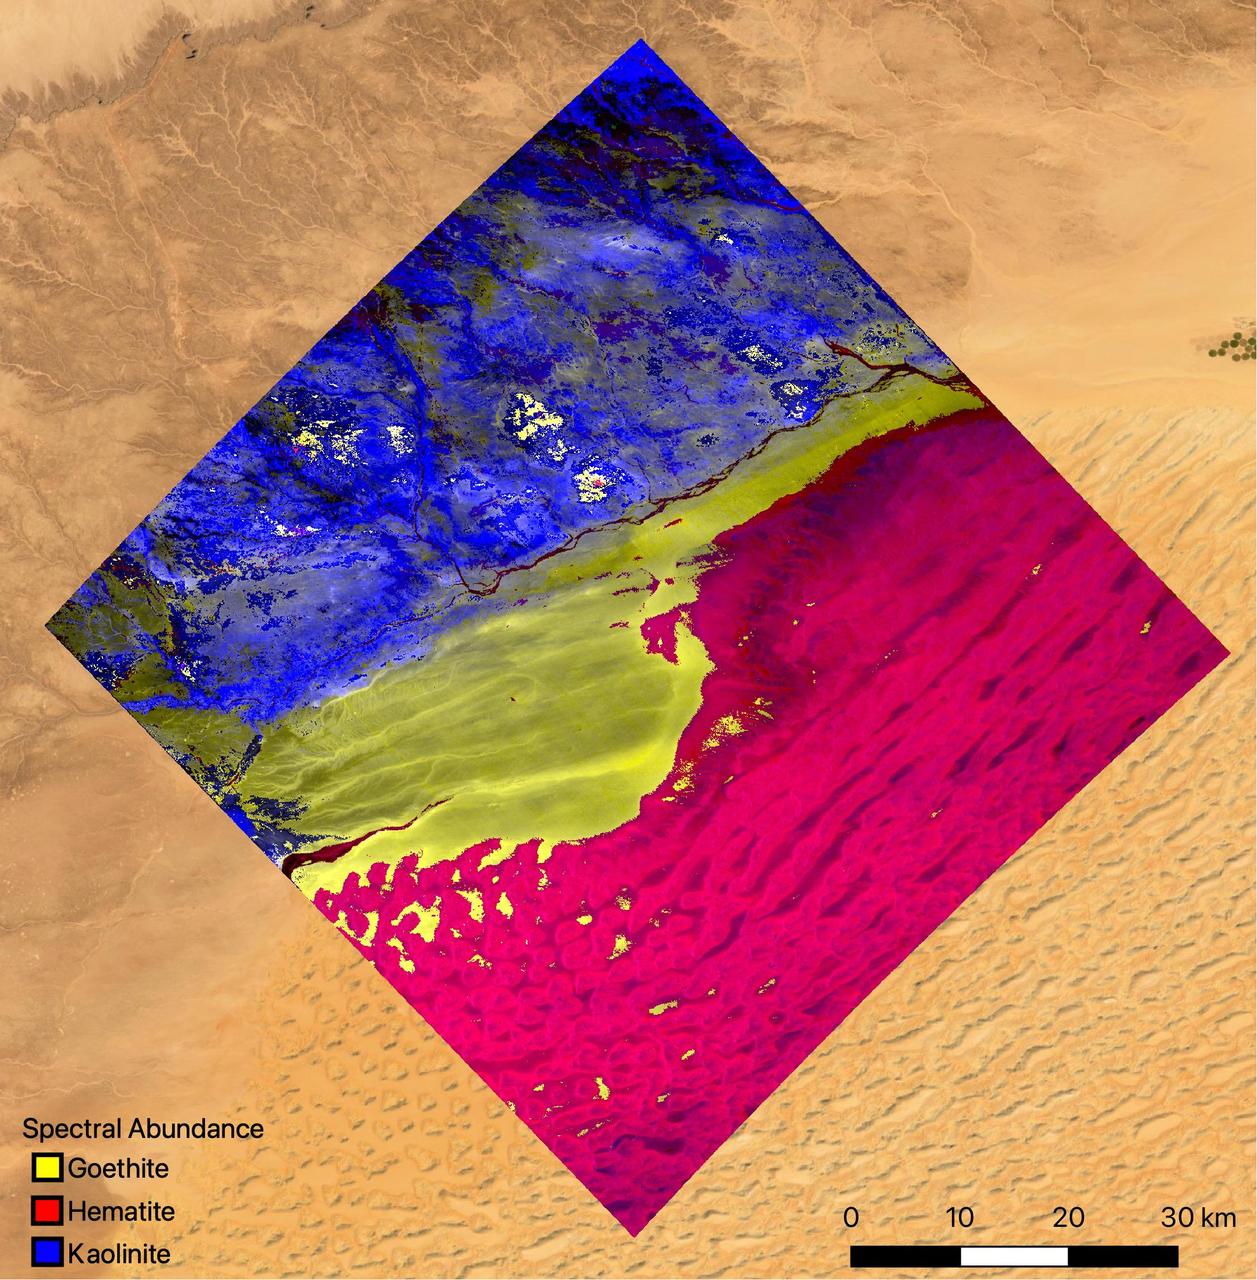
The mineral map shows an area of southwestern Libya in the Sahara Desert observed by NASA's Earth Surface Mineral Dust Source Investigation (EMIT) mission as it maps the world's mineral dust sources, gathering information about surface composition as the instrument, designed at NASA's Jet Propulsion Laboratory in Southern California, orbits aboard the International Space Station. The instrument works by measuring reflected solar energy from Earth across hundreds of wavelengths from the visible to the infrared range of the spectrum. The intensity of the reflected light varies by wavelength based on the material. Scientists are using these patterns, called spectral fingerprints, to identify surface minerals and pinpoint their locations on a map. The map is among the first produced by scientists with EMIT data. Analysis of the patterns indicate that the surface contains kaolinite, a light-colored clay mineral, and goethite and hematite, two varieties of iron oxide, which is darker. When dust from the kaolinite-dominated areas is lofted into the atmosphere, the particles tend to scatter sunlight and reflect it back to space, cooling the air. The opposite effect occurs with airborne particles of iron oxide, which tend to absorb heat and warm the surrounding air. Over the course of its 12-month mission, EMIT will collect measurements of 10 important surface minerals – kaolinite, hematite, goethite, illite, vermiculite, calcite, dolomite, montmorillonite, chlorite, and gypsum – in arid regions between 50-degree south and north latitudes in Africa, Asia, North and South America, and Australia. The data EMIT collects will help scientists better understand the role of airborne dust particles in heating and cooling Earth's atmosphere on global and regional scales. EMIT was developed at NASA's Jet Propulsion Laboratory, which is managed for the agency by Caltech in Pasadena, California. It launched to the space station in July 2022. https://photojournal.jpl.nasa.gov/catalog/PIA25424
NASA-NOAA's Suomi NPP satellite flew over Hurricane Blanca in the Eastern Pacific Ocean and gathered infrared data on the storm that was false-colored to show locations of the strongest thunderstorms within the storm. The Visible Infrared Imaging Radiometer Suite or VIIRS instrument aboard the satellite gathered infrared data of the storm that was made into an image at the University of Wisconsin-Madison. The image was false-colored to show temperature. Coldest cloud top temperatures indicate higher, stronger, thunderstorms within a tropical cyclone. Those are typically the strongest storms with potential for heavy rainfall. VIIRS is a scanning radiometer that collects visible and infrared imagery and "radiometric" measurements. Basically it means that VIIRS data is used to measure cloud and aerosol properties, ocean color, sea and land surface temperature, ice motion and temperature, fires, and Earth's albedo (reflected light). The VIIRS image from June 5 at 8:11 UTC (4:11 a.m. EDT) showed two areas of coldest cloud top temperatures and strongest storms were west-southwest and east-northeast of the center of Blanca's circulation center. On June 5 at 5 a.m. EDT (0900 UTC) Blanca's maximum sustained winds were near 105 mph (165 kph) with higher gusts. The National Hurricane Center (NHC) forecast expects some strengthening during the next day or so. Weakening is forecast to begin by late Saturday. At that time, NHC placed the center of Hurricane Blanca near latitude 14.3 North, longitude 106.2 West. That puts the center about 350 miles (560 km) south-southwest of Manzanillo, Mexico and about 640 miles (1,030 km) south-southeast of Cabo San Lucas, Mexico. The estimated minimum central pressure is 968 millibars (28.59 inches). Blanca is moving toward the northwest near 10 mph (17 kph). A northwestward to north-northwestward motion at a similar forward speed is expected to continue through Saturday night. Blanca has been stirring up surf along the coast of southwestern Mexico and will reach the Pacific coast of the Baja California peninsula and the southern Gulf of California later today, June 5. These swells are likely to cause life-threatening surf and rip current conditions. On the forecast track, the center of Blanca will approach the southern Baja California peninsula on Sunday. NHC cautions that "Interests in the southern Baja California peninsula should monitor the progress of Blanca. A tropical storm or hurricane watch will likely be required for a portion of Baja California Sur later today." The NHC forecast track shows Blanca making landfall in the southeastern tip of Baja California on Sunday, June 7 and tracking north-northeast along the Baja California peninsula, for several days following. Image credit: Credits: NASA/NOAA/UW-CIMSS <b><a href="http://www.nasa.gov/audience/formedia/features/MP_Photo_Guidelines.html" rel="nofollow">NASA image use policy.</a></b> <b><a href="http://www.nasa.gov/centers/goddard/home/index.html" rel="nofollow">NASA Goddard Space Flight Center</a></b> enables NASA’s mission through four scientific endeavors: Earth Science, Heliophysics, Solar System Exploration, and Astrophysics. Goddard plays a leading role in NASA’s accomplishments by contributing compelling scientific knowledge to advance the Agency’s mission. <b>Follow us on <a href="http://twitter.com/NASAGoddardPix" rel="nofollow">Twitter</a></b> <b>Like us on <a href="http://www.facebook.com/pages/Greenbelt-MD/NASA-Goddard/395013845897?ref=tsd" rel="nofollow">Facebook</a></b> <b>Find us on <a href="http://instagrid.me/nasagoddard/?vm=grid" rel="nofollow">Instagram</a></b>
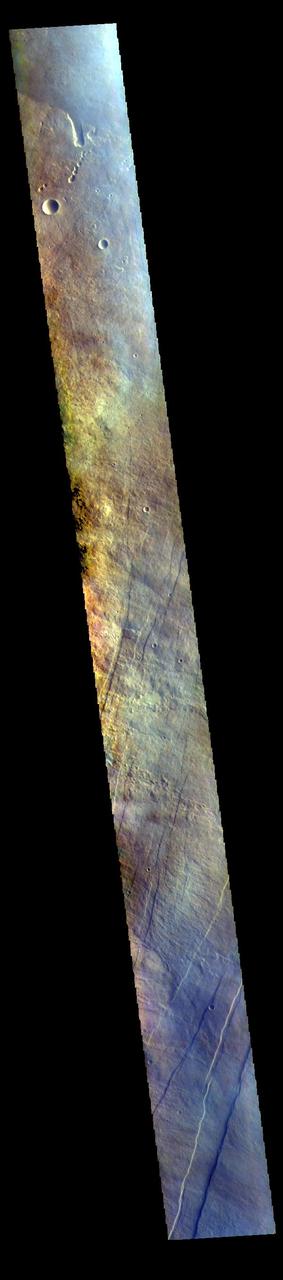
The THEMIS VIS camera contains 5 filters. The data from different filters can be combined in multiple ways to create a false color image. These false color images may reveal subtle variations of the surface not easily identified in a single band image. Today's false color image shows part of the flank of Arsia Mons. The three large aligned Tharsis volcanoes are Arsia Mons, Pavonis Mons and Ascreaus Mons (from south to north). There are collapse features on all three volcanoes, on the southwestern and northeastern flanks. This alignment may indicate a large fracture/vent system was responsible for the eruptions that formed all three volcanoes. This VIS image shows part of the eastern flank of Arsia Mons, west of the aligned fracture system. Arsia Mons is the southernmost of the Tharsis volcanoes. It is 270 miles (450km) in diameter, almost 12 miles (20km) high, and the summit caldera is 72 miles (120km) wide. For comparison, the largest volcano on Earth is Mauna Loa. From its base on the sea floor, Mauna Loa measures only 6.3 miles high and 75 miles in diameter. A large volcanic crater known as a caldera is located at the summit of all of the Tharsis volcanoes. These calderas are produced by massive volcanic explosions and collapse. The Arsia Mons summit caldera is larger than many volcanoes on Earth. The THEMIS VIS camera is capable of capturing color images of the Martian surface using five different color filters. In this mode of operation, the spatial resolution and coverage of the image must be reduced to accommodate the additional data volume produced from using multiple filters. To make a color image, three of the five filter images (each in grayscale) are selected. Each is contrast enhanced and then converted to a red, green, or blue intensity image. These three images are then combined to produce a full color, single image. Because the THEMIS color filters don't span the full range of colors seen by the human eye, a color THEMIS image does not represent true color. Also, because each single-filter image is contrast enhanced before inclusion in the three-color image, the apparent color variation of the scene is exaggerated. Nevertheless, the color variation that does appear is representative of some change in color, however subtle, in the actual scene. Note that the long edges of THEMIS color images typically contain color artifacts that do not represent surface variation. Orbit Number: 94404 Latitude: -8.85515 Longitude: 242.188 Instrument: VIS Captured: 2023-03-27 12:39 https://photojournal.jpl.nasa.gov/catalog/PIA26129
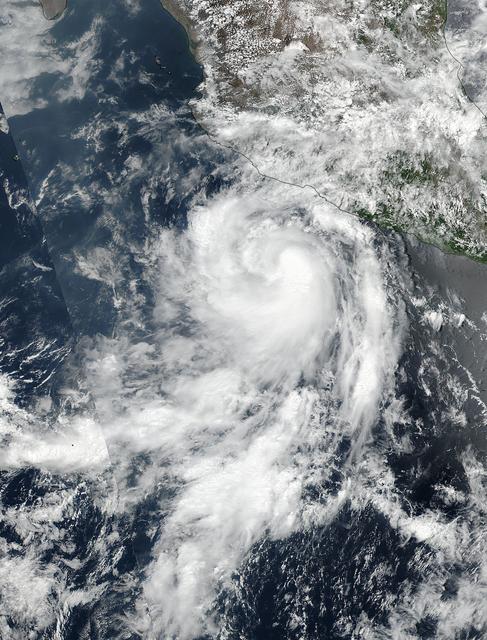
The fourth tropical cyclone of the Eastern Pacific Ocean season formed on June 25 and by June 26 it was already a hurricane. NASA-NOAA's Suomi NPP satellite passed over Dora on June 25 when it was a tropical storm and the next day it became the first hurricane of the season. Tropical Depression Dora developed around 11 p.m. EDT on Saturday, June 24 about 180 miles (290 km) south of Acapulco, Mexico. By 5 a.m. EDT on June 25, the depression had strengthened into a tropical storm and was named Dora. At 19:36 UTC (3:36 p.m. EDT), the Visible Infrared Imaging Radiometer Suite (VIIRS) instrument aboard NASA-NOAA's Suomi NPP satellite provided a visible-light image of the storm. The VIIRS imagery showed well-defined convective spiral bands of thunderstorms with a developing central dense overcast or CDO cloud feature. Seven and a half hours later, Dora showed signs of better organization. At 11 p.m. EDT, the National Hurricane Center or NHC noted "Dora's cloud pattern has continued to quickly improve this evening. Several well-defined spiral bands wrap around the center and the CDO has become more symmetric and expanded since the previous advisory." At 5 a.m. EDT on Monday, June 26, Dora became the first hurricane of the Eastern Pacific Ocean hurricane season. Satellite data indicate that maximum sustained winds have increased to near 80 mph (130 kph) with higher gusts. The NHC said the eye of Hurricane Dora was located near latitude 16.7 degrees North and longitude 105.3 degrees West. That's about 170 miles (275 km) south-southwest of Manzanillo, Mexico. Dora was moving toward the west-northwest near 13 mph (20 kph), and the NHC forecast said that general motion with some decrease in forward speed is expected over the next 48 hours. On the forecast track, the center of Dora is expected to remain offshore of the coast of southwestern Mexico. Some strengthening is likely today before weakening is forecast to begin on Tuesday, June 27. For updated forecasts, visit: <a href="http://www.nhc.noaa.gov" rel="nofollow">www.nhc.noaa.gov</a>. Credit: NASA/NOAA <b><a href="http://www.nasa.gov/audience/formedia/features/MP_Photo_Guidelines.html" rel="nofollow">NASA image use policy.</a></b> <b><a href="http://www.nasa.gov/centers/goddard/home/index.html" rel="nofollow">NASA Goddard Space Flight Center</a></b> enables NASA’s mission through four scientific endeavors: Earth Science, Heliophysics, Solar System Exploration, and Astrophysics. Goddard plays a leading role in NASA’s accomplishments by contributing compelling scientific knowledge to advance the Agency’s mission. <b>Follow us on <a href="http://twitter.com/NASAGoddardPix" rel="nofollow">Twitter</a></b> <b>Like us on <a href="http://www.facebook.com/pages/Greenbelt-MD/NASA-Goddard/395013845897?ref=tsd" rel="nofollow">Facebook</a></b> <b>Find us on <a href="http://instagrid.me/nasagoddard/?vm=grid" rel="nofollow">Instagram</a></b>
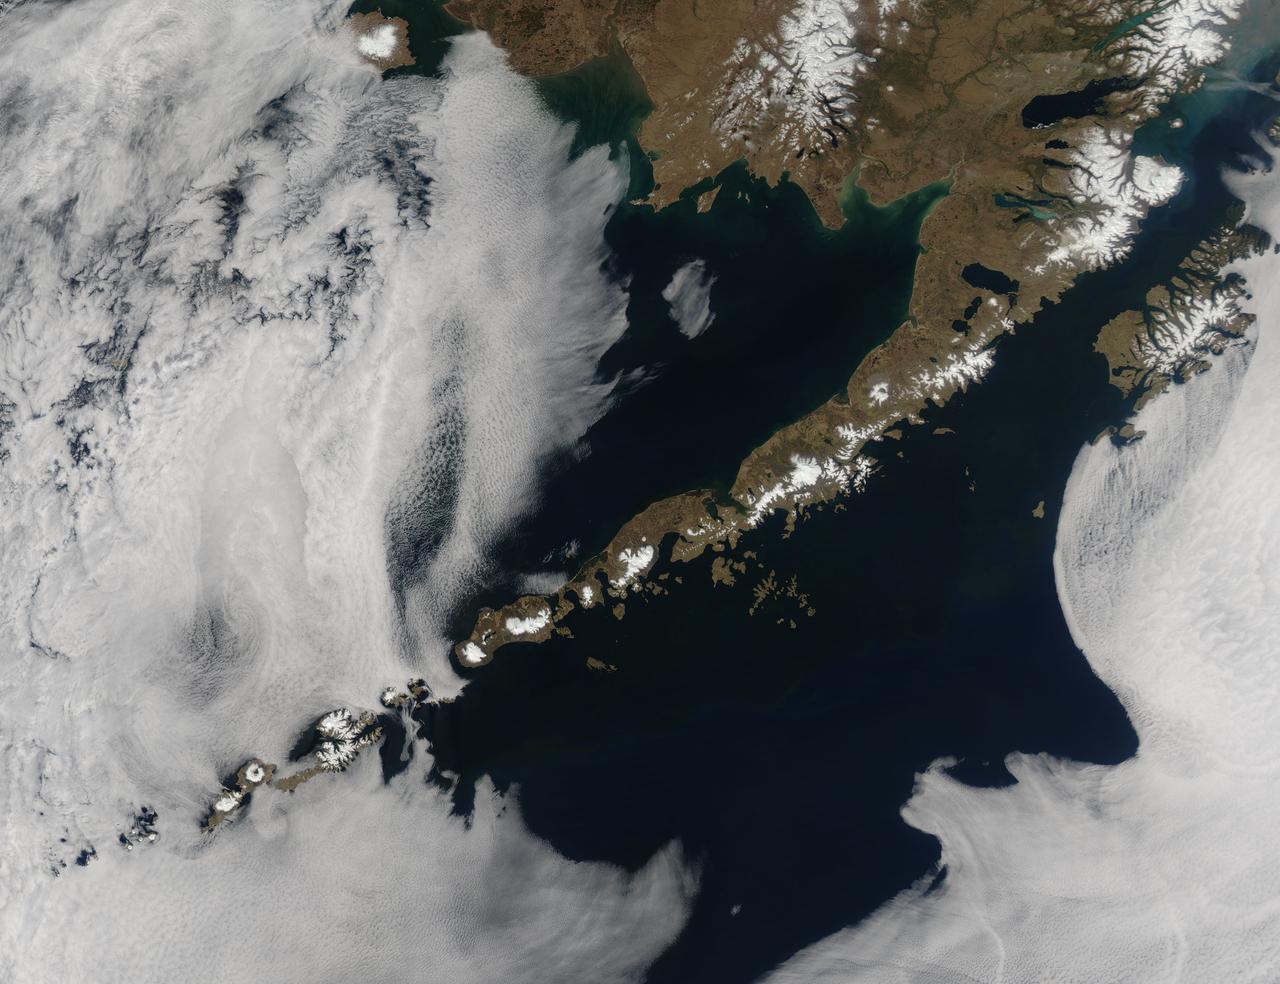
Remote, rugged and extraordinarily beautiful, Alaska’s Aleutian Islands are best known for wildlife reserves, military bases, fishing, furs and fog. The sprawling volcanic archipelago was brought into the spotlight by the Russian-supported expedition of Alexey Chirikov and Vitus Bering in 1741, and soon became controlled by the Russian-American Fur Company. In 1867 the United States purchased Alaska, including the Aleutian Islands, from Russia. By 1900 the port in Unalaska was well established as a shipping port for Alaska gold. The archipelago sweeps about 1,200 miles (1,800 km) from the tip of the Alaskan Peninsula to Attu, the most westward island. Four major island groups hold 14 large islands, about 55 smaller islands, and a large number of islets, adding up to roughly 150 islands/islets in total. This chain separates the Bering Sea (north) from the Pacific Ocean (south) and the islands are connected by the Marine Highway Ferry – at least as far as Unalaska. For the most remote islands, such as birding paradise of Attu, the western-most Aleutian Island, travel becomes trickier and relies primarily on custom charter. The Moderate Resolution Imaging Spectroradiometer (MODIS) flew over the region and captured this spectacular true-color image of the eastern Aleutian Islands on May 15, 2014. In this image, the Alaskan Peninsula protrudes from the mainland and sweeps to the southwest. The first set of islands are called the Fox Island group. Unalaska Island is part of this group and can be identified, with some imagination, as an island formed in the shape of a flying cherub, with two arms (peninsulas) outstretched towards the northeast, seemingly reaching for the round “balls” of Akutan and Akun Islands. The smallest islands in the west of the image belong to the group known as the Islands of Four Mountains. The Aleutians continue far to the west of this image. Fog surrounds the Aleutians, stretching from just off the southwestern Alaska mainland to the western Fox Islands group, then further southwest across the Pacific Ocean. It appears to give way to marine stratocumulus clouds in the west. Fog is common in the area, and can be a hazard to shipping. Credit: NASA/GSFC/Jeff Schmaltz/MODIS Land Rapid Response Team <b><a href="http://www.nasa.gov/audience/formedia/features/MP_Photo_Guidelines.html" rel="nofollow">NASA image use policy.</a></b> <b><a href="http://www.nasa.gov/centers/goddard/home/index.html" rel="nofollow">NASA Goddard Space Flight Center</a></b> enables NASA’s mission through four scientific endeavors: Earth Science, Heliophysics, Solar System Exploration, and Astrophysics. Goddard plays a leading role in NASA’s accomplishments by contributing compelling scientific knowledge to advance the Agency’s mission. <b>Follow us on <a href="http://twitter.com/NASAGoddardPix" rel="nofollow">Twitter</a></b> <b>Like us on <a href="http://www.facebook.com/pages/Greenbelt-MD/NASA-Goddard/395013845897?ref=tsd" rel="nofollow">Facebook</a></b> <b>Find us on <a href="http://instagram.com/nasagoddard?vm=grid" rel="nofollow">Instagram</a></b>
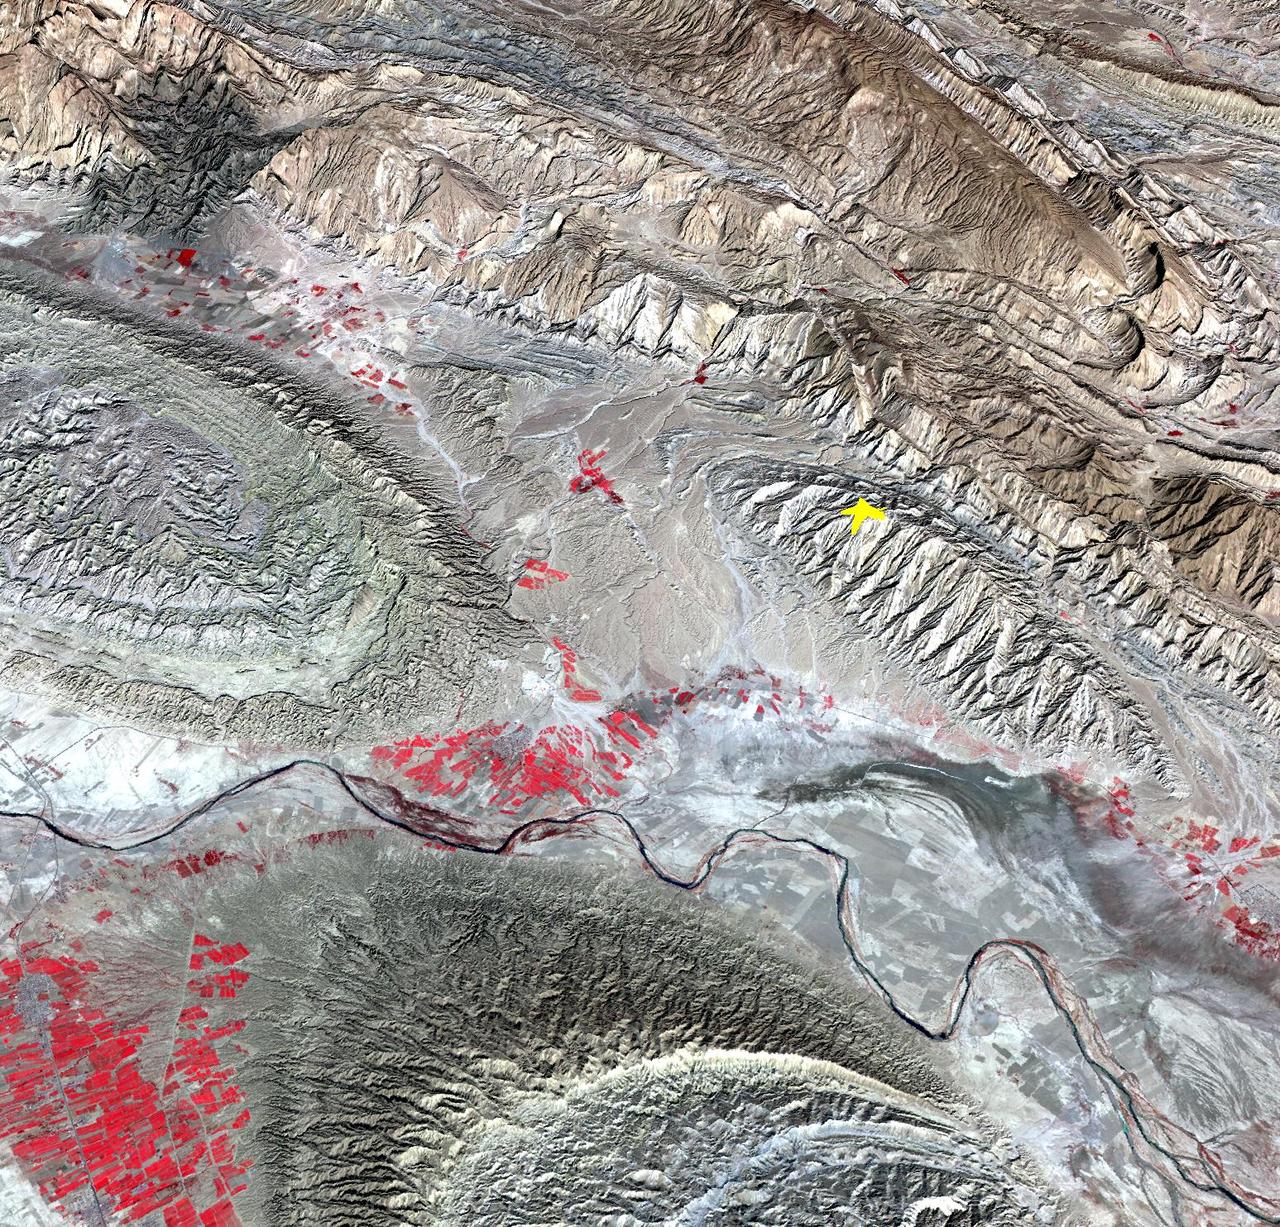
On April 9, 2013 at 11:52 GMT, a magnitude 6.3 earthquake hit southwestern Iran's Bushehr province near the town of Kaki. Preliminary information is that several villages have been destroyed and many people have died, as reported by BBC News. This perspective view of the region was acquired Nov. 17, 2012, by the Advanced Spaceborne Thermal Emission and Reflection Radiometer (ASTER) instrument on NASA's Terra spacecraft. The location of the earthquake's epicenter is marked with a yellow star. Vegetation is displayed in red; the vertical exaggeration of the topography is 2X. The image is centered near 28.5 degrees north latitude, 51.6 degrees east longitude. With its 14 spectral bands from the visible to the thermal infrared wavelength region and its high spatial resolution of 15 to 90 meters (about 50 to 300 feet), ASTER images Earth to map and monitor the changing surface of our planet. ASTER is one of five Earth-observing instruments launched Dec. 18, 1999, on Terra. The instrument was built by Japan's Ministry of Economy, Trade and Industry. A joint U.S./Japan science team is responsible for validation and calibration of the instrument and data products. The broad spectral coverage and high spectral resolution of ASTER provides scientists in numerous disciplines with critical information for surface mapping and monitoring of dynamic conditions and temporal change. Example applications are: monitoring glacial advances and retreats; monitoring potentially active volcanoes; identifying crop stress; determining cloud morphology and physical properties; wetlands evaluation; thermal pollution monitoring; coral reef degradation; surface temperature mapping of soils and geology; and measuring surface heat balance. The U.S. science team is located at NASA's Jet Propulsion Laboratory, Pasadena, Calif. The Terra mission is part of NASA's Science Mission Directorate, Washington, D.C. More information about ASTER is available at <a href="http://asterweb.jpl.nasa.gov/" rel="nofollow">asterweb.jpl.nasa.gov/</a>. Image Credit: NASA/GSFC/METI/ERSDAC/JAROS, and U.S./Japan ASTER Science Team Image Addition Date: 2013-04-10 <b><a href="http://www.nasa.gov/audience/formedia/features/MP_Photo_Guidelines.html" rel="nofollow">NASA image use policy.</a></b> <b><a href="http://www.nasa.gov/centers/goddard/home/index.html" rel="nofollow">NASA Goddard Space Flight Center</a></b> enables NASA’s mission through four scientific endeavors: Earth Science, Heliophysics, Solar System Exploration, and Astrophysics. Goddard plays a leading role in NASA’s accomplishments by contributing compelling scientific knowledge to advance the Agency’s mission. <b>Follow us on <a href="http://twitter.com/NASA_GoddardPix" rel="nofollow">Twitter</a></b> <b>Like us on <a href="http://www.facebook.com/pages/Greenbelt-MD/NASA-Goddard/395013845897?ref=tsd" rel="nofollow">Facebook</a></b> <b>Find us on <a href="http://instagram.com/nasagoddard?vm=grid" rel="nofollow">Instagram</a></b>

NASA image acquired July 27, 2001 In southwestern Jordan lies an unusual landscape. Mountains of granite and sandstone rise next to valleys filled with red sand. Some of the mountains reach a height of about 1,700 meters (5,600 feet) above sea level, and many have near-vertical slopes. So alien is this landscape, it’s nicknamed “Valley of the Moon,” and it has served as the film set for a movie about Mars. Yet nomadic people have lived here for thousands of years. Declared a protected area in 1998, this unearthly landscape is Wadi Rum. The Advanced Land Imager (ALI) on NASA’s Earth Observing-1 (EO-1) satellite captured this natural-color image on July 27, 2001. The scene includes part of Wadi Rum and an adjacent area to the east. East of the protected area, fields with center-pivot irrigation make circles of green and brown (image upper right). As the earth tones throughout the image attest, the area is naturally arid, receiving little annual precipitation and supporting only sparse vegetation. Between rocky peaks, the sandy valleys range in color from beige to brick. Ancient granite rocks dating from the Precambrian underlie younger rocks, and some of these basement rocks have eroded into rugged, steep-sloped mountains. The granite mountains have risen thanks partly to crisscrossing fault lines under the park. Overlying the granite are sandstones from the Cambrian and Ordovician Periods, as well as loose sands. Lawrence of Arabia, who fought in the Arab Revolt of 1917–1918, made frequent references to Wadi Rum in his book The Seven Pillars of Wisdom. Likewise, a prominent feature of the protected area is named after the book. Several popular sites in Wadi Rum bear Lawrence of Arabia’s name, but whether he actually visited those sites is uncertain. To download the full high res go to: <a href="http://earthobservatory.nasa.gov/IOTD/view.php?id=49945" rel="nofollow">earthobservatory.nasa.gov/IOTD/view.php?id=49945</a> NASA Earth Observatory image created by Jesse Allen and Robert Simmon, using EO-1 ALI data provided courtesy of the NASA EO-1 team and the United States Geological Survey. Caption by Michon Scott. Instrument: EO-1 - ALI Credit: <b><a href="http://www.earthobservatory.nasa.gov/" rel="nofollow"> NASA Earth Observatory</a></b> <b><a href="http://www.nasa.gov/centers/goddard/home/index.html" rel="nofollow">NASA Goddard Space Flight Center</a></b> enables NASA’s mission through four scientific endeavors: Earth Science, Heliophysics, Solar System Exploration, and Astrophysics. Goddard plays a leading role in NASA’s accomplishments by contributing compelling scientific knowledge to advance the Agency’s mission. <b>Follow us on <a href="http://twitter.com/NASA_GoddardPix" rel="nofollow">Twitter</a></b> <b>Join us on <a href="http://www.facebook.com/pages/Greenbelt-MD/NASA-Goddard/395013845897?ref=tsd" rel="nofollow">Facebook</a></b>
![A swirling Eastern Pacific Ocean storm system headed for California was spotted by NOAA's GOES-West satellite on February 28. According to the National Weather Service, this storm system has the potential to bring heavy rainfall to the drought-stricken state. The storm was captured using visible data from NOAA's GOES-West or GOES-15 satellite on Feb. 28 at 1915 UTC/11:15 a.m. PST was made into an image by NASA/NOAA's GOES Project at NASA's Goddard Space Flight Center in Greenbelt, Md. The storm's center appeared as a tight swirl, with bands of clouds and showers already sweeping over the state extending from northern California to Baja California, Mexico. At 11:30 a.m. PST on February 28, Bill Patzert, climatologist at NASA's Jet Propulsion Laboratory in Pasadena, Calif. said, "Right now from northern to southern California we are being battered by very heavy rain, strong winds and our coastal communities are being battered by high surf. Through the weekend we are bracing for mud and rock slides in areas that recently burned [from wildfires]. Flooding is looming up and down the state." The National Weather Service (NWS) serving Los Angeles posted a Flood Watch for the region on Friday, February 28. The Flood Watch notes the "potential for flash flooding and debris flows for some 2013 and 2014 burn areas in Los Angeles County from this morning through Saturday evening (March 1).” The NWS Flood Watch also noted "a very strong and dynamic storm will bring a significant amount of rain to much of southwestern California through Saturday evening. A flash flood watch has been issued for several recent burn areas in Los Angeles County due to the abundant rainfall expected. Rain rates at times are expected to range from a half inch to one inch per hour which could cause significant mud and debris flows. There will be a chance of thunderstorms with locally higher rainfall rates." "Californians haven't seen rain and wind this powerful in 3 years," Patzert said. "By early next week, as this system moves east, this powerful system will wreak havoc causing snow and ice storms through the Midwest into the Northeast." GOES satellites provide the kind of continuous monitoring necessary for intensive data analysis. Geostationary describes an orbit in which a satellite is always in the same position with respect to the rotating Earth. This allows GOES to hover continuously over one position on Earth's surface, appearing stationary. As a result, GOES provide a constant vigil for the atmospheric "triggers" for severe weather conditions such as tornadoes, flash floods, hail storms and hurricanes. On a positive note, Patzert noted, "This is a nice down payment on drought recovery in the parched Western U.S." For updated information about the storm system, visit NOAA's National Weather Service website: <a href="http://www.weather.gov" rel="nofollow">www.weather.gov</a> For more information about GOES satellites, visit: <a href="http://www.goes.noaa.gov/" rel="nofollow">www.goes.noaa.gov/</a> or <a href="http://goes.gsfc.nasa.gov/" rel="nofollow">goes.gsfc.nasa.gov/</a> Rob Gutro NASA's Goddard Space Flight Center <b><a href="http://www.nasa.gov/audience/formedia/features/MP_Photo_Guidelines.html" rel="nofollow">NASA image use policy.</a></b> <b><a href="http://www.nasa.gov/centers/goddard/home/index.html" rel="nofollow">NASA Goddard Space Flight Center</a></b> enables NASA’s mission through four scientific endeavors: Earth Science, Heliophysics, Solar System Exploration, and Astrophysics. Goddard plays a leading role in NASA’s accomplishments by contributing compelling scientific knowledge to advance the Agency’s mission. <b>Follow us on <a href="http://twitter.com/NASAGoddardPix" rel="nofollow">Twitter</a></b> <b>Like us on <a href="http://www.facebook.com/pages/Greenbelt-MD/NASA-Goddard/395013845897?ref=tsd" rel="nofollow">Facebook</a></b> <b>Find us on <a href="http://instagram.com/nasagoddard?vm=grid" rel="nofollow">Instagram</a></b>](https://images-assets.nasa.gov/image/GSFC_20171208_Archive_e001192/GSFC_20171208_Archive_e001192~medium.jpg)
A swirling Eastern Pacific Ocean storm system headed for California was spotted by NOAA's GOES-West satellite on February 28. According to the National Weather Service, this storm system has the potential to bring heavy rainfall to the drought-stricken state. The storm was captured using visible data from NOAA's GOES-West or GOES-15 satellite on Feb. 28 at 1915 UTC/11:15 a.m. PST was made into an image by NASA/NOAA's GOES Project at NASA's Goddard Space Flight Center in Greenbelt, Md. The storm's center appeared as a tight swirl, with bands of clouds and showers already sweeping over the state extending from northern California to Baja California, Mexico. At 11:30 a.m. PST on February 28, Bill Patzert, climatologist at NASA's Jet Propulsion Laboratory in Pasadena, Calif. said, "Right now from northern to southern California we are being battered by very heavy rain, strong winds and our coastal communities are being battered by high surf. Through the weekend we are bracing for mud and rock slides in areas that recently burned [from wildfires]. Flooding is looming up and down the state." The National Weather Service (NWS) serving Los Angeles posted a Flood Watch for the region on Friday, February 28. The Flood Watch notes the "potential for flash flooding and debris flows for some 2013 and 2014 burn areas in Los Angeles County from this morning through Saturday evening (March 1).” The NWS Flood Watch also noted "a very strong and dynamic storm will bring a significant amount of rain to much of southwestern California through Saturday evening. A flash flood watch has been issued for several recent burn areas in Los Angeles County due to the abundant rainfall expected. Rain rates at times are expected to range from a half inch to one inch per hour which could cause significant mud and debris flows. There will be a chance of thunderstorms with locally higher rainfall rates." "Californians haven't seen rain and wind this powerful in 3 years," Patzert said. "By early next week, as this system moves east, this powerful system will wreak havoc causing snow and ice storms through the Midwest into the Northeast." GOES satellites provide the kind of continuous monitoring necessary for intensive data analysis. Geostationary describes an orbit in which a satellite is always in the same position with respect to the rotating Earth. This allows GOES to hover continuously over one position on Earth's surface, appearing stationary. As a result, GOES provide a constant vigil for the atmospheric "triggers" for severe weather conditions such as tornadoes, flash floods, hail storms and hurricanes. On a positive note, Patzert noted, "This is a nice down payment on drought recovery in the parched Western U.S." For updated information about the storm system, visit NOAA's National Weather Service website: <a href="http://www.weather.gov" rel="nofollow">www.weather.gov</a> For more information about GOES satellites, visit: <a href="http://www.goes.noaa.gov/" rel="nofollow">www.goes.noaa.gov/</a> or <a href="http://goes.gsfc.nasa.gov/" rel="nofollow">goes.gsfc.nasa.gov/</a> Rob Gutro NASA's Goddard Space Flight Center <b><a href="http://www.nasa.gov/audience/formedia/features/MP_Photo_Guidelines.html" rel="nofollow">NASA image use policy.</a></b> <b><a href="http://www.nasa.gov/centers/goddard/home/index.html" rel="nofollow">NASA Goddard Space Flight Center</a></b> enables NASA’s mission through four scientific endeavors: Earth Science, Heliophysics, Solar System Exploration, and Astrophysics. Goddard plays a leading role in NASA’s accomplishments by contributing compelling scientific knowledge to advance the Agency’s mission. <b>Follow us on <a href="http://twitter.com/NASAGoddardPix" rel="nofollow">Twitter</a></b> <b>Like us on <a href="http://www.facebook.com/pages/Greenbelt-MD/NASA-Goddard/395013845897?ref=tsd" rel="nofollow">Facebook</a></b> <b>Find us on <a href="http://instagram.com/nasagoddard?vm=grid" rel="nofollow">Instagram</a></b>