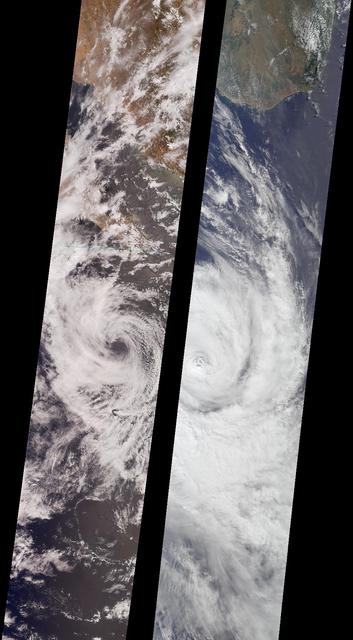
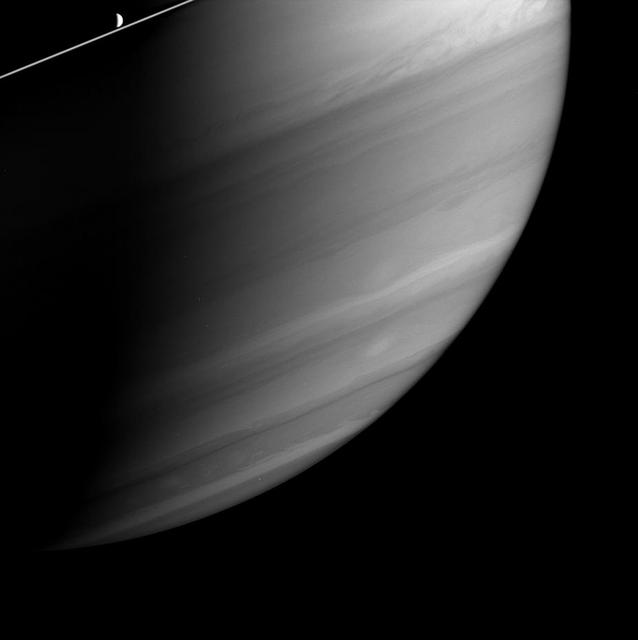
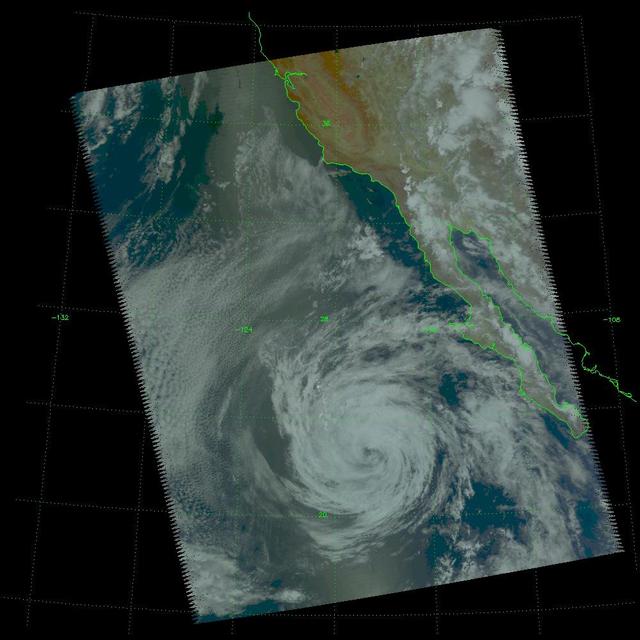
Like dancers pirouetting in opposite directions, the rotational patterns of two different tropical storms are contrasted in this pair of MISR nadir-camera images. The left-hand image is of Tropical Storm Bud, acquired on June 17, 2000 (Terra orbit 2656) as the storm was dissipating. Bud was situated in the eastern Pacific Ocean between Socorro Island and the southern tip of Baja California. South of the storm's center is a vortex pattern caused by obstruction of the prevailing flow by tiny Socorro Island. Sonora, Mexico and Baja California are visible at the top of the image. The right-hand image is of Tropical Cyclone Dera, acquired on March 12, 2001 (Terra orbit 6552). Dera was located in the Indian Ocean, south of Madagascar. The southern end of this large island is visible in the top portion of this image. Northern hemisphere tropical storms, like Bud, rotate in a counterclockwise direction, whereas those in the southern hemisphere, such as Dera, rotate clockwise. The opposite spins are a consequence of Earth's rotation. Each image covers a swath approximately 380 kilometers wide. http://photojournal.jpl.nasa.gov/catalog/PIA03400
Tropical storm Bonnie, Gulf of Mexico, captured on August 11 at 1:30am CDT. Located in the Gulf of Mexico, the center of the storm is positioned about 280 miles south-southwest of the mouth of the Mississippi River. Bonnie is a small tropical storm with wind speeds sustained at 45 mph and extending 30 miles from the storm center. It is moving northward at 5 mph. http://photojournal.jpl.nasa.gov/catalog/PIA00441
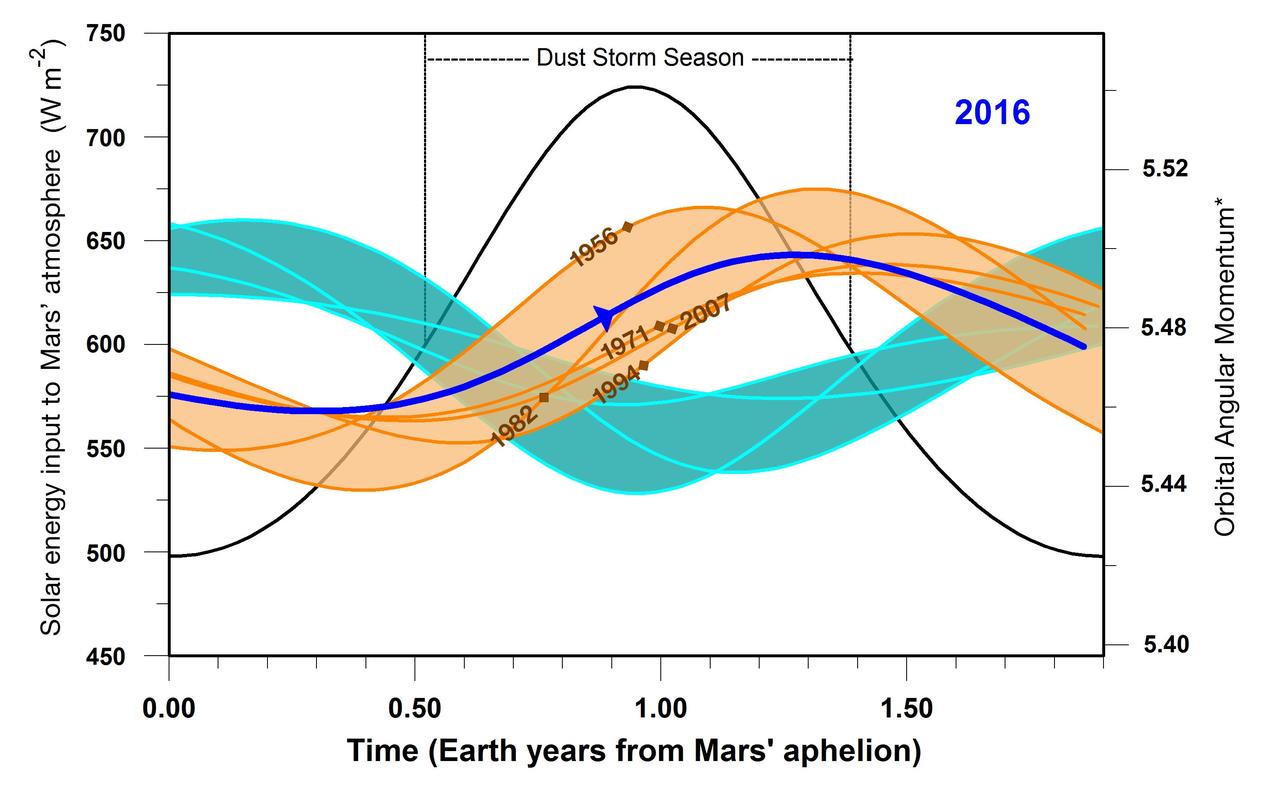
This graphic indicates a similarity between 2016 (dark blue line) and five past years in which Mars has experienced a global dust storm (orange lines and band), compared to years with no global dust storm (blue-green lines and band). The arrow nearly midway across in the dark blue line indicates the Mars time of year in late September 2016. A key factor in the graph is the orbital angular momentum of Mars, which would be steady in a system of only one planet orbiting the sun, but varies due to relatively small effects of having other planets in the solar system. The horizontal scale is time of year on Mars, starting at left with the planet's farthest distance from the sun in each orbit. This point in the Mars year, called "Mars aphelion," corresponds to late autumn in the southern hemisphere. Numeric values on the horizontal axis are in Earth years; each Mars year lasts for about 1.9 Earth years. The vertical scale bar at left applies only to the black-line curve on the graph. The amount of solar energy entering Mars' atmosphere (in watts per square meter) peaks at the time of year when Mars is closest to the sun, corresponding to late spring in the southern hemisphere. The duration of Mars' dust storm season, as indicated, brackets the time of maximum solar input to the atmosphere. The scale bar at right, for orbital angular momentum, applies to the blue, brown and blue-green curves on the graph. The values are based on mass, velocity and distance from the gravitational center of the solar system. Additional information on the units is in a 2015 paper in the journal Icarus, from which this graph is derived. The band shaded in orange is superimposed on the curves of angular momentum for five Mars years that were accompanied by global dust storms in 1956, 1971, 1982, 1994 and 2007. Brown diamond symbols on the curves for these years in indicate the times when the global storms began. The band shaded blue-green lies atop angular momentum curves for six years when no global dust storms occurred: 1939, 1975, 1988, 1998, 2000 and 2011. Note that in 2016, as in the pattern of curves for years with global dust storms, the start of the dust storm season corresponded to a period of increasing orbital angular momentum. In years with no global storm, angular momentum was declining at that point. Observations of whether dust from regional storms on Mars spreads globally in late 2016 or early 2017 will determine whether this correspondence holds up for the current Mars year. http://photojournal.jpl.nasa.gov/catalog/PIA20855
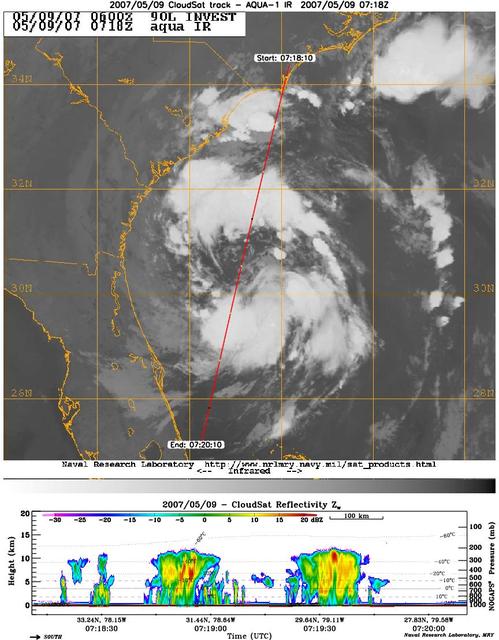
CloudSat's Cloud Profiling Radar captured a profile across Tropical Storm Andrea on Wednesday, May 9, 2007, near the South Carolina/Georgia/Florida Atlantic coast. The upper image shows an infrared view of Tropical Storm Andrea from the Moderate Resolution Imaging Spectroradiometer instrument on NASA's Aqua satellite, with CloudSat's ground track shown as a red line. The lower image is the vertical cross section of radar reflectivity along this path, where the colors indicate the intensity of the reflected radar energy. CloudSat orbits approximately one minute behind Aqua in a satellite formation known as the A-Train. http://photojournal.jpl.nasa.gov/catalog/PIA09379
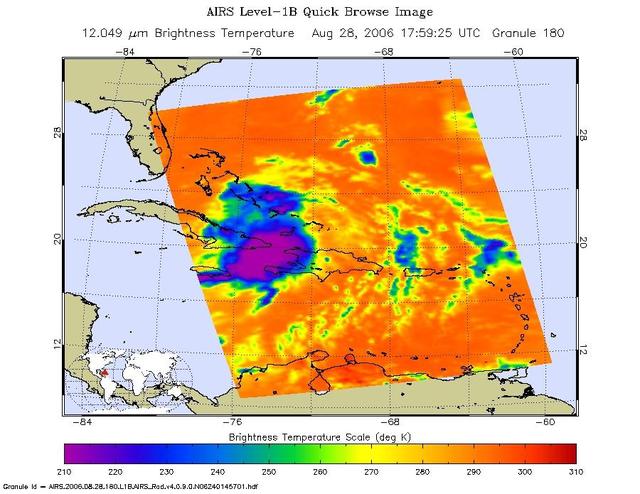
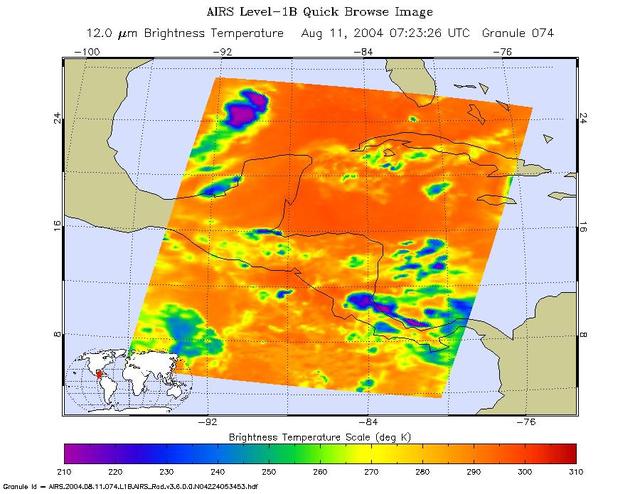
This infrared image shows Tropical Storm Ernesto over Cuba, from the Atmospheric Infrared Sounder AIRS on NASA Aqua satellite in August, 2006. Because infrared radiation does not penetrate through clouds, AIRS infrared images show either the temperature of the cloud tops or the surface of the Earth in cloud-free regions. The lowest temperatures (in purple) are associated with high, cold cloud tops that make up the top of the storm. In cloud-free areas the AIRS instrument will receive the infrared radiation from the surface of the Earth, resulting in the warmest temperatures (orange/red). http://photojournal.jpl.nasa.gov/catalog/PIA00510
Storms and Moons
A Capital Storm
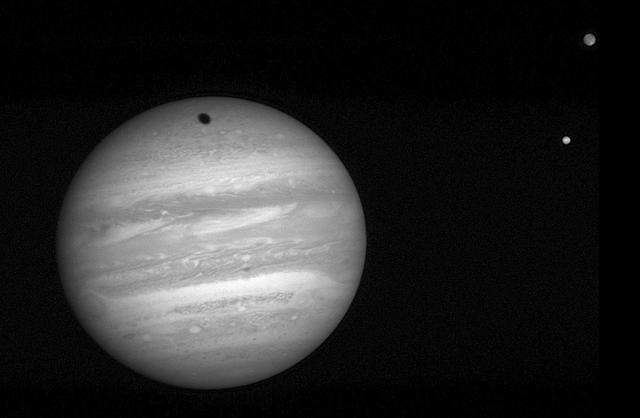
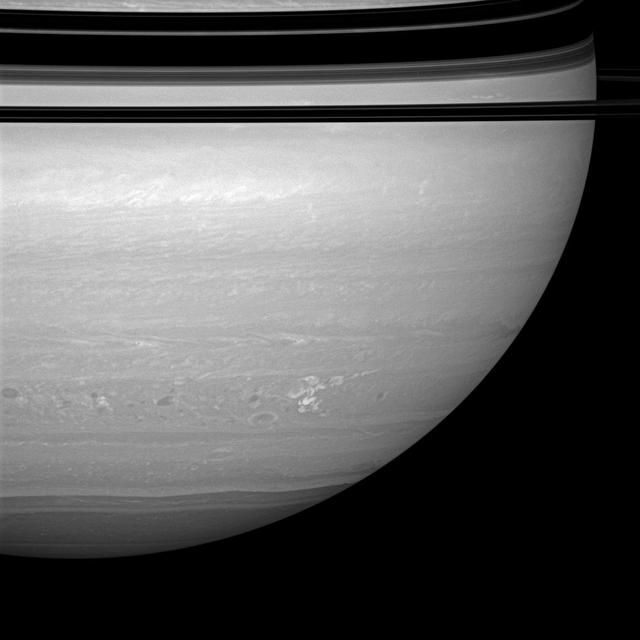
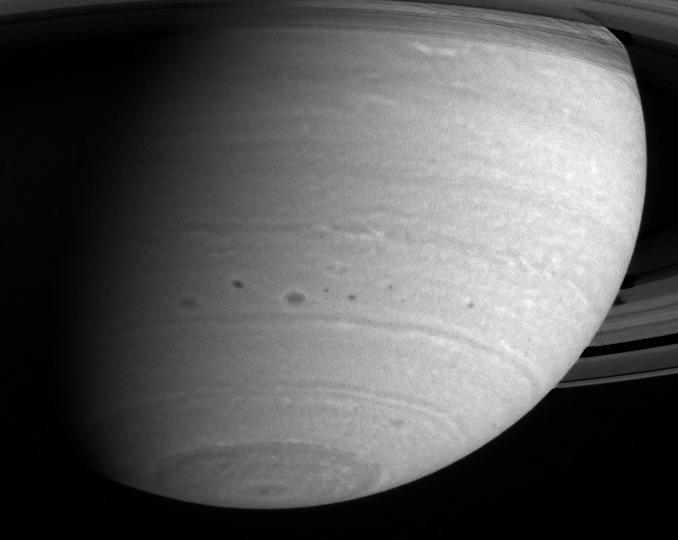
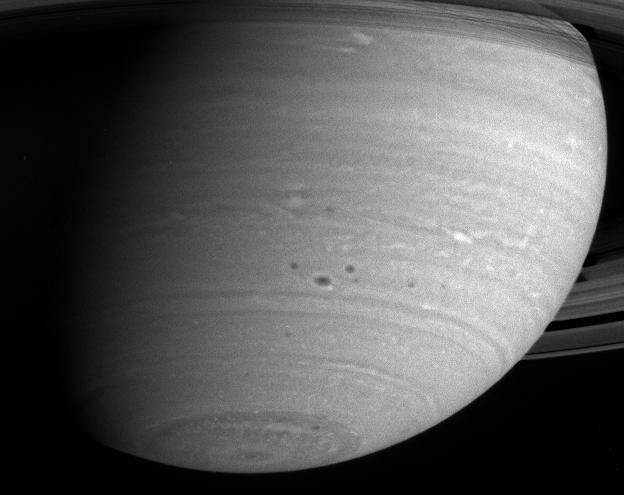
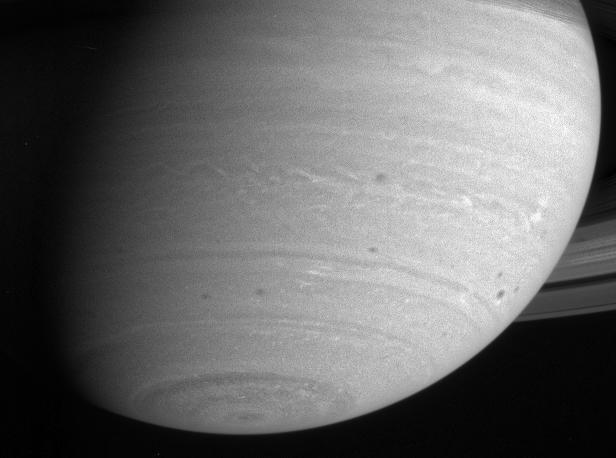
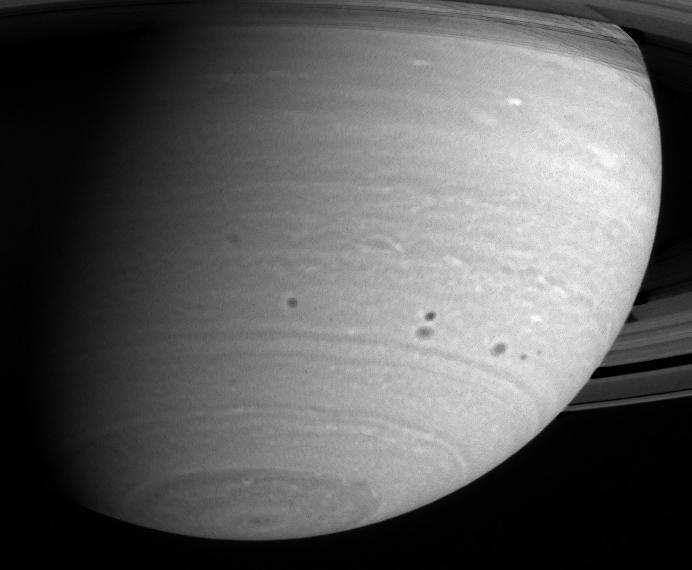
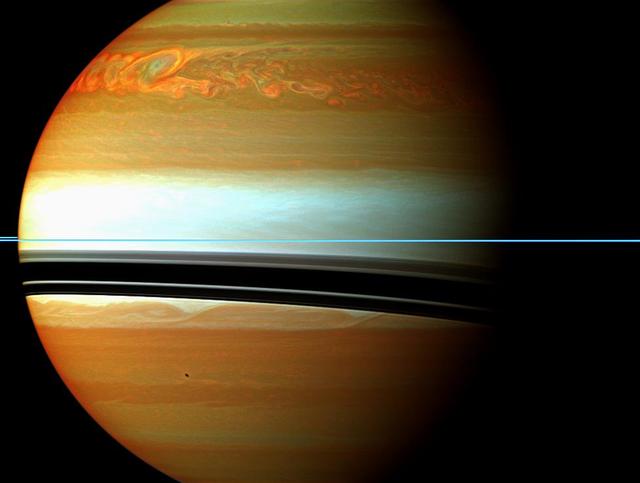
Dwarfed by Storms
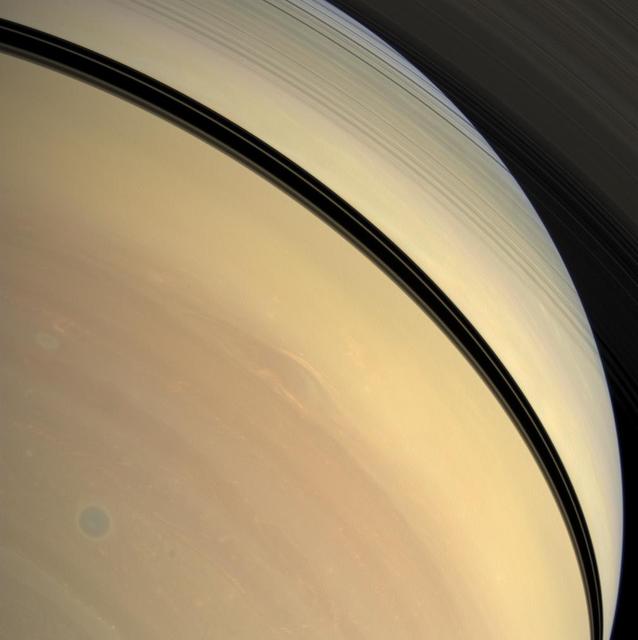
Storms Embrace
Spring Storms
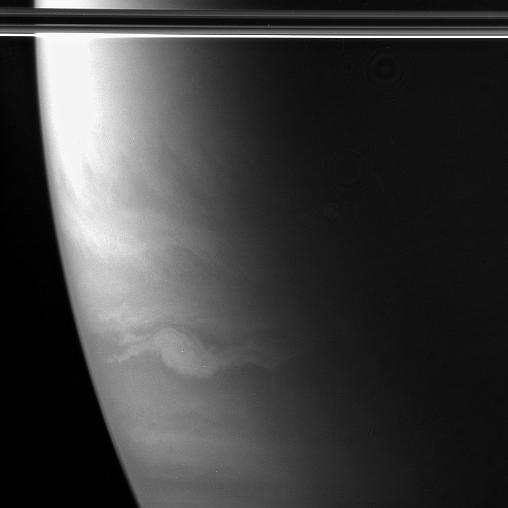
Above the Storms
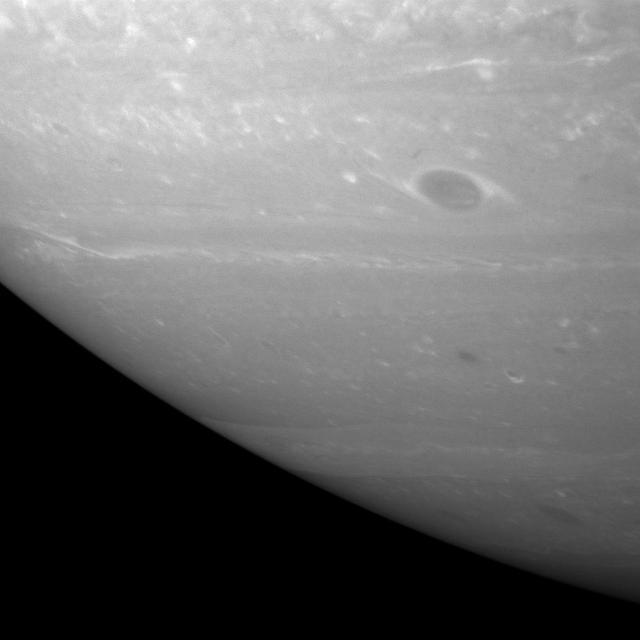
Southern Storms
Storm Clouds
The Storms Within
Continuing Storm
Hissing Storm
The Storms Continue
Storm and Clouds
Dust Storm
Storm Factory?
Storm Spectra
Northern Storms
Storm Front

Eye of the Storm
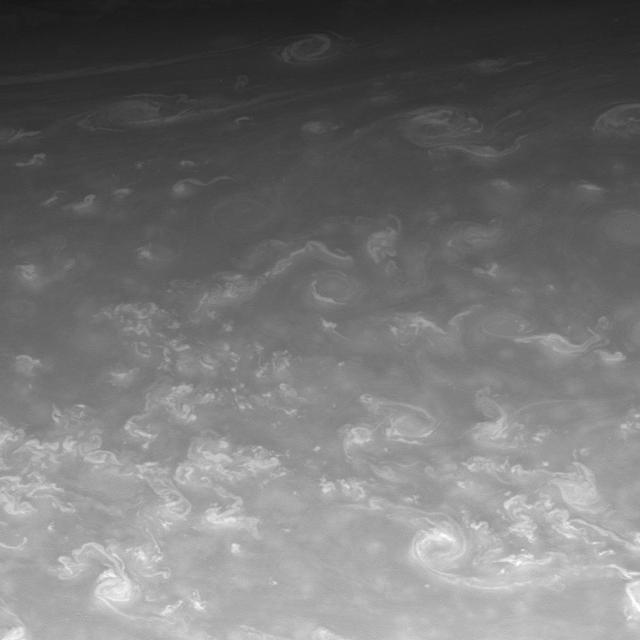
Swirling Storms
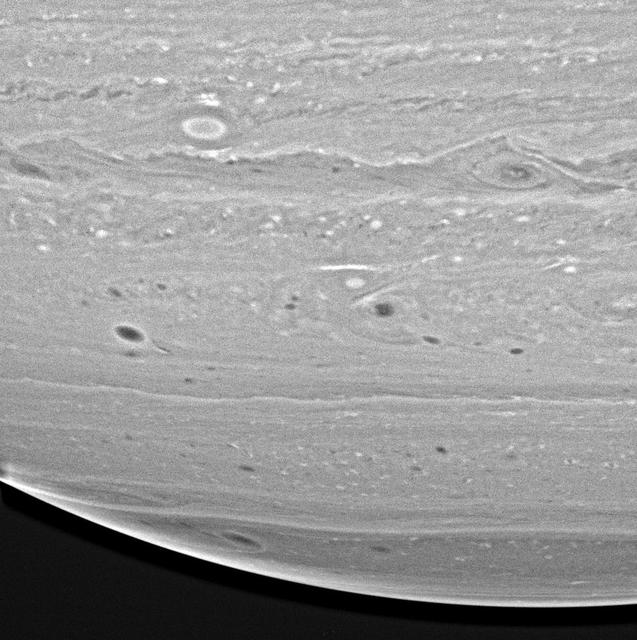
Storm Alley
The Storm Continues

Spring Storms

Storms on the Border
Southern Storm

Dust Storms
Storm Season
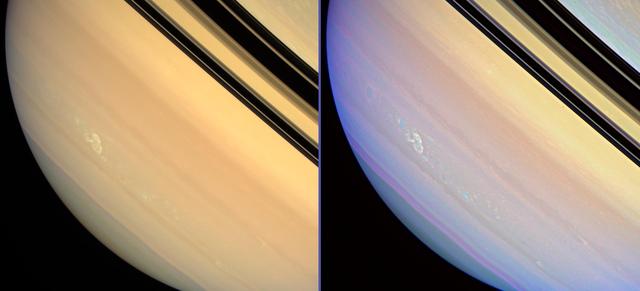
Spotting the Storms
Soft Storms

This global map of Mars shows a growing dust storm as of June 6, 2018. The map was produced by the Mars Color Imager (MARCI) camera on NASA's Mars Reconnaissance Orbiter spacecraft. The blue dot shows the approximate location of Opportunity. The storm was first detected on June 1. The MARCI camera has been used to monitor the storm ever since. Full dust storms like this one are not surprising, but are infrequent. They can crop up suddenly but last weeks, even months. During southern summer, sunlight warms dust particles, lifting them higher into the atmosphere and creating more wind. That wind kicks up yet more dust, creating a feedback loop that NASA scientists still seek to understand. https://photojournal.jpl.nasa.gov/catalog/PIA22329
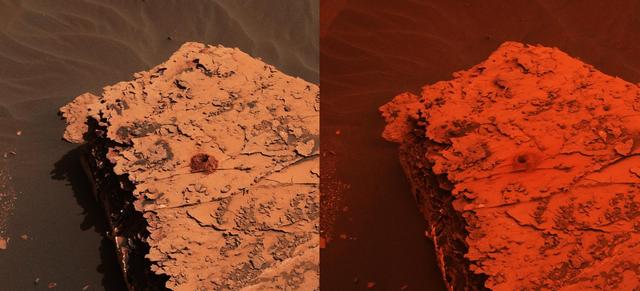
Two images from the Mast Camera (Mastcam) on NASA's Curiosity rover depict the change in the color of light illuminating the Martian surface since a dust storm engulfed Gale Crater. The left image shows the "Duluth" drill site on Sol 2058 (May 21, 2018); the right image is from Sol 2084 (June 17). The cherry red color in the post-storm image is due to a few factors. One difference between the two images is exposure time: the dust over Curiosity creates low-lighting conditions that require longer exposure times for the cameras. The pre-storm image had an exposure time of 7.3 milliseconds, which is normal for the rover; the later image had an exposure time that was 66 milliseconds -- or nine times longer. But a primary factor is red light being filtered through the dust; very little green and essentially no blue light makes it through the dust cloud. It's not unlike the way a forest fire changes the color of light, or a red stage light filters the other colors out. Though the first pre-storm image was taken at an earlier time of day, it has a much deeper shadow than the second image. That is because the whole sky is red and illuminating the rock from all sides. Individual images are available at https://photojournal.jpl.nasa.gov/catalog/PIA22330
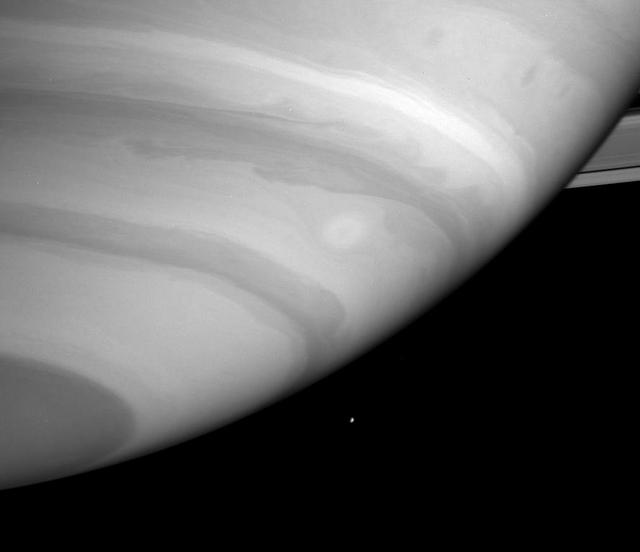
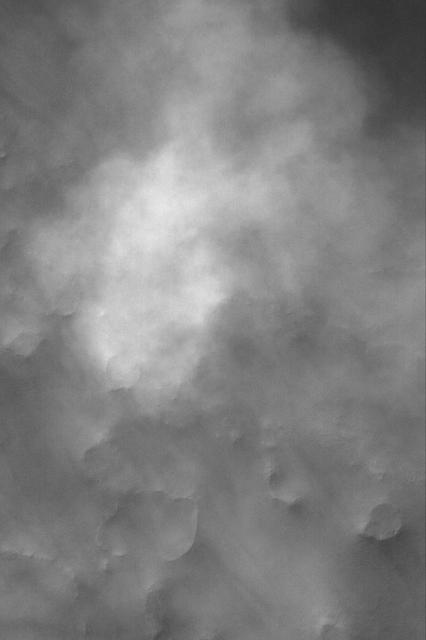
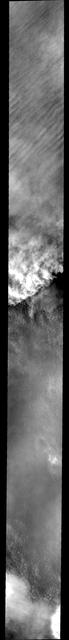
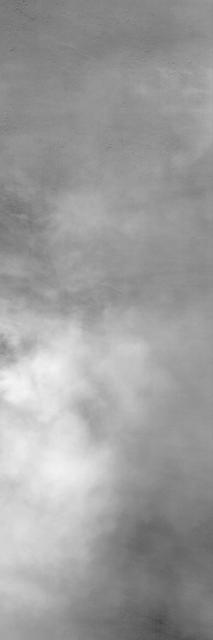
This image shows the edge of a storm
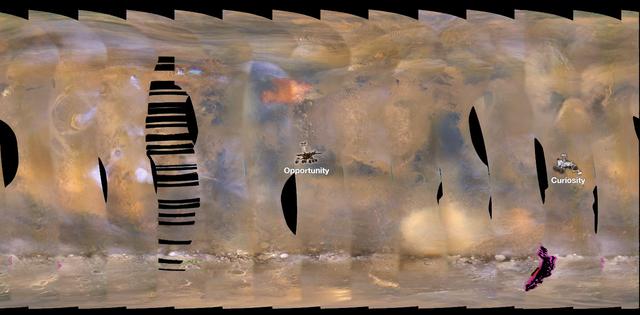
This set of images from NASA's Mars Reconnaissance Orbiter (MRO) shows a fierce, giant dust storm is kicking up on Mars, with rovers on the surface indicated as icons. The spread of the storm can be seen in the salmon-colored overlay. These images from MRO's Mars Color Imager start from May 31, when the dust event was first detected, and go through June 11, 2018. MRO creates global maps of Mars but roll maneuvers for targeted observations produce gaps in the coverage, which appear as black gores in the maps. On some days there are data drops where partial or full orbits of coverage are missing. Green and purple observed in the south polar region indicate saturated pixels. Latitude is indicated along the vertical axis. Longitude is indicated along the horizontal axis. https://photojournal.jpl.nasa.gov/catalog/PIA22519
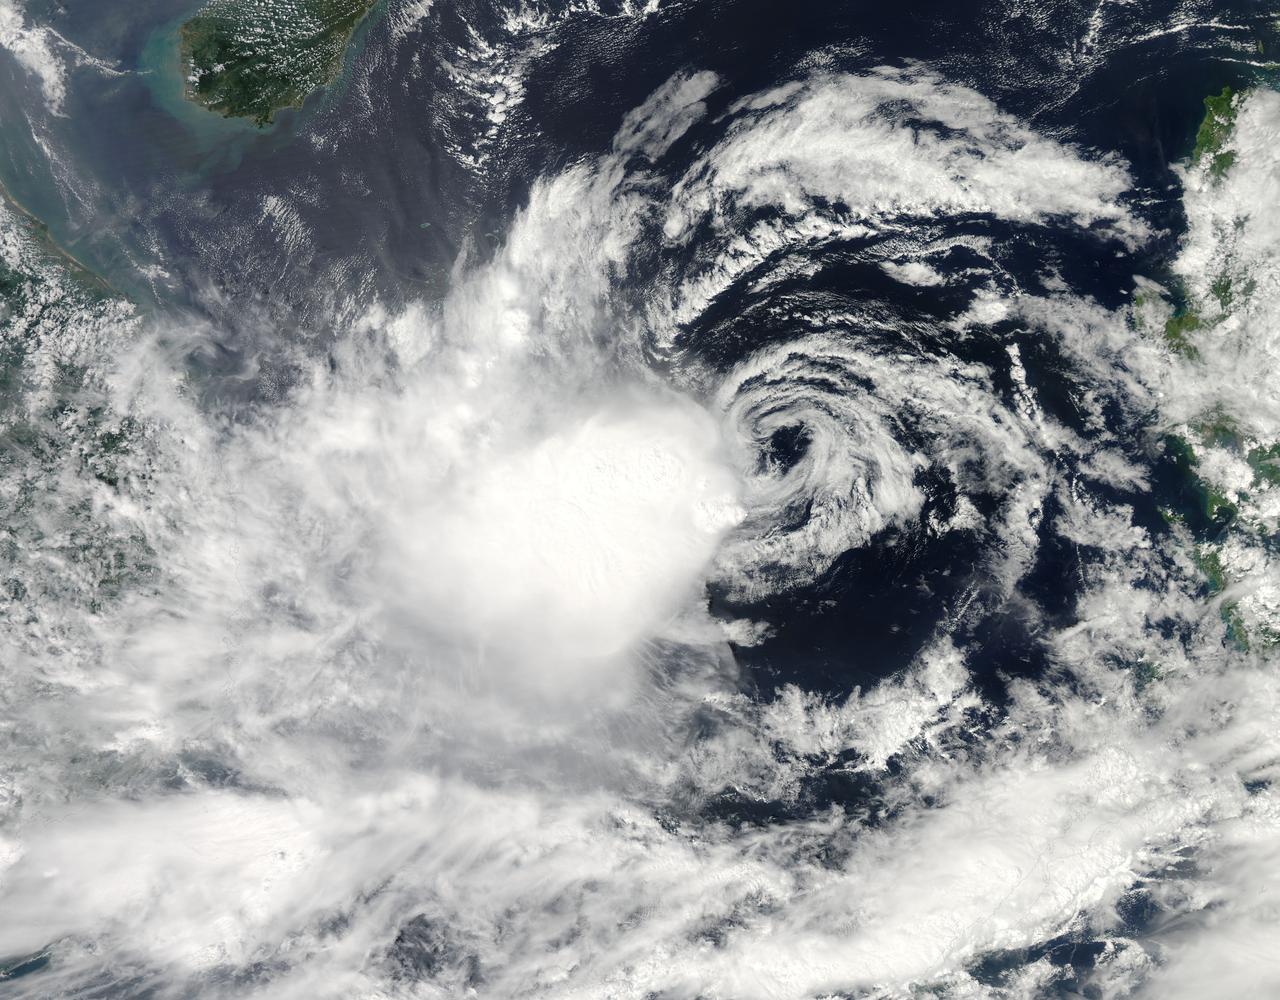
It is easy to see the effect of the strong northeasterly wind shear battering Tropical Storm Gaemi in satellite imagery from NASA. This true-color image acquired on Oct. 5 shows a large oval-shaped area of showers and thunderstorms associated with the storm, southwest of the exposed center of circulation. NASA's Aqua satellite passed over Tropical Storm Gaemi as it was approaching Vietnam on Oct. 5, 2012 at 0550 UTC (1:50 a.m. EDT). A true-color image of the storm was captured by the Moderate Resolution Imaging Spectroradiometer (MODIS) instrument and shows bulk of showers and thunderstorms were clearly to the southwest of the center. The circulation center appears as a ring of concentric bands of clouds northeast of the large rounded area of clouds and showers associated with the storm. On Tuesday, October 5, 2012 at 1500 UTC (11 a.m. EDT), Tropical Storm Gaemi still had maximum sustained winds near 35 knots (40 mph/65 km/h) as it did 24 hours before. It was located 425 nautical miles (489 miles/787 km) east of Hue, Vietnam near 14.7 North latitude and 117.7 East longitude. Early on October 7, Tropical Storm Gaemi made landfall over Vietnam with wind speeds reported at 34 mph (55 mph), and bringing rainfall of more than 4 inches in some areas of Vietnam. Once ashore, the storm quickly moved inland and rapidly weakened as it headed towards Cambodia. With winds reduced, Gaemi served primarily as a rainmaker, but the rain may bring flooding and landslides to the region. Credit: NASA/GSFC/Jeff Schmaltz/MODIS Land Rapid Response Team <b><a href="http://www.nasa.gov/audience/formedia/features/MP_Photo_Guidelines.html" rel="nofollow">NASA image use policy.</a></b> <b><a href="http://www.nasa.gov/centers/goddard/home/index.html" rel="nofollow">NASA Goddard Space Flight Center</a></b> enables NASA’s mission through four scientific endeavors: Earth Science, Heliophysics, Solar System Exploration, and Astrophysics. Goddard plays a leading role in NASA’s accomplishments by contributing compelling scientific knowledge to advance the Agency’s mission. <b>Follow us on <a href="http://twitter.com/NASA_GoddardPix" rel="nofollow">Twitter</a></b> <b>Like us on <a href="http://www.facebook.com/pages/Greenbelt-MD/NASA-Goddard/395013845897?ref=tsd" rel="nofollow">Facebook</a></b> <b>Find us on <a href="http://instagrid.me/nasagoddard/?vm=grid" rel="nofollow">Instagram</a></b>
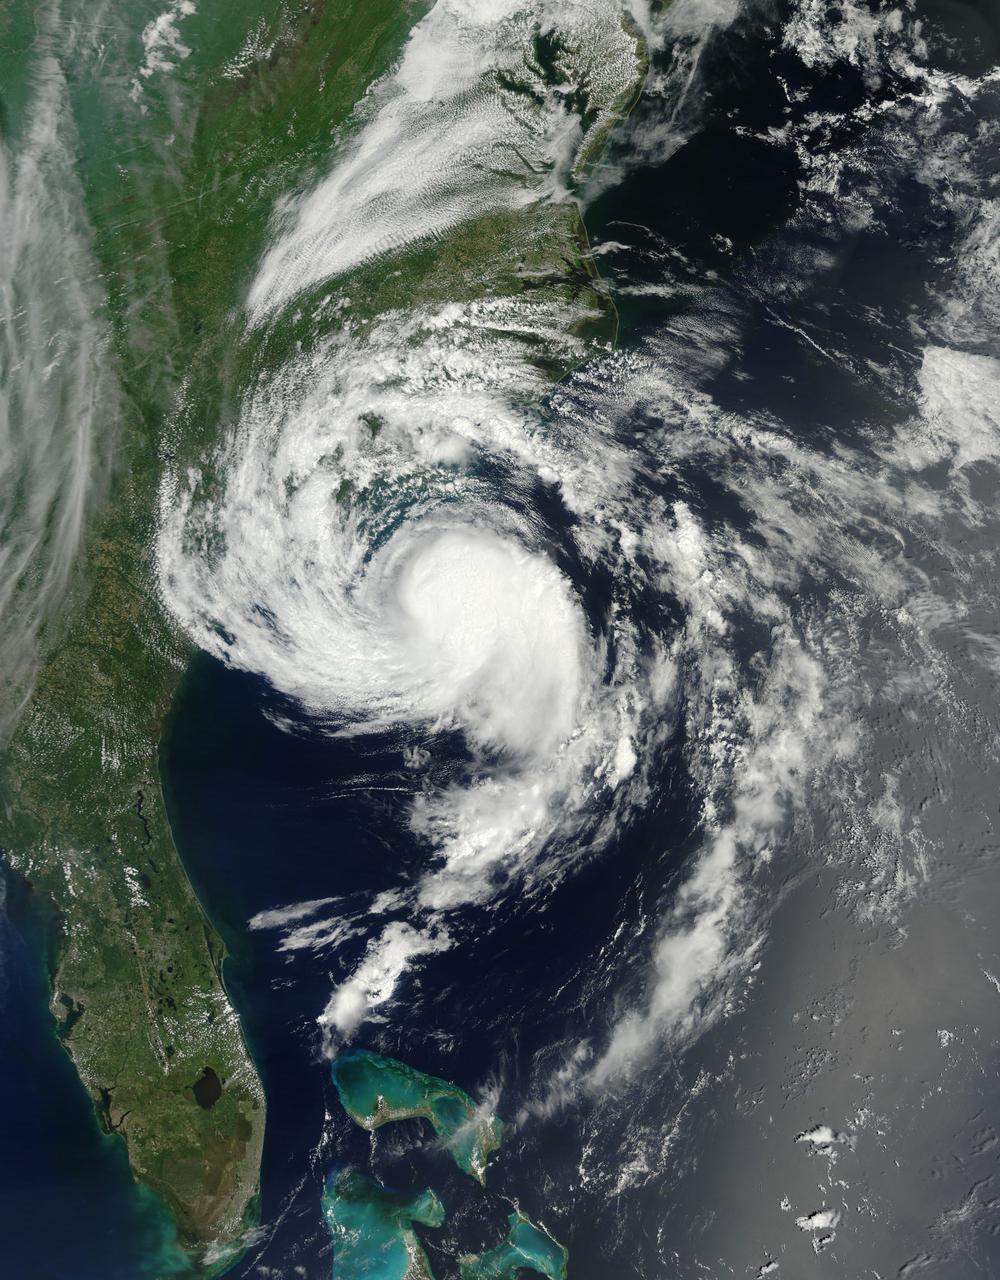
At about 6:00 a.m. EDT (10:00 UTC) on May 10, 2015, Tropical Storm Ana made landfall between Myrtle Beach and North Myrtle Beach, South Carolina. One day earlier, on the morning of May 9, the Moderate Resolution Imaging Spectroradiometer (MODIS) on NASA’s Terra satellite acquired this true-color image of the storm off the coast of the Carolinas. At the time, Ana had just evolved from a subtropical storm to a tropical storm with maximum sustained winds of 93 kilometers (58 miles) per hour. Ana’s life ashore was brief – the storm was downgraded to a tropical depression at 2:00 p.m. EDT (14:00 UTC) on May 10. During that time, parts of South Carolina and eastern North Carolina was drenched with heavy rain – some areas reported over 6 inches of rainfall – and heavy winds. A water spout was reported in Dare County, North Carolina, and the storm contributed to significant beach erosion along the coast. Credit: NASA/GSFC/Jeff Schmaltz/MODIS Land Rapid Response Team <b><a href="http://www.nasa.gov/audience/formedia/features/MP_Photo_Guidelines.html" rel="nofollow">NASA image use policy.</a></b> <b><a href="http://www.nasa.gov/centers/goddard/home/index.html" rel="nofollow">NASA Goddard Space Flight Center</a></b> enables NASA’s mission through four scientific endeavors: Earth Science, Heliophysics, Solar System Exploration, and Astrophysics. Goddard plays a leading role in NASA’s accomplishments by contributing compelling scientific knowledge to advance the Agency’s mission. <b>Follow us on <a href="http://twitter.com/NASAGoddardPix" rel="nofollow">Twitter</a></b> <b>Like us on <a href="http://www.facebook.com/pages/Greenbelt-MD/NASA-Goddard/395013845897?ref=tsd" rel="nofollow">Facebook</a></b> <b>Find us on <a href="http://instagrid.me/nasagoddard/?vm=grid" rel="nofollow">Instagram</a></b>
Southern Storms and Streaks

Dust Storm in Syria

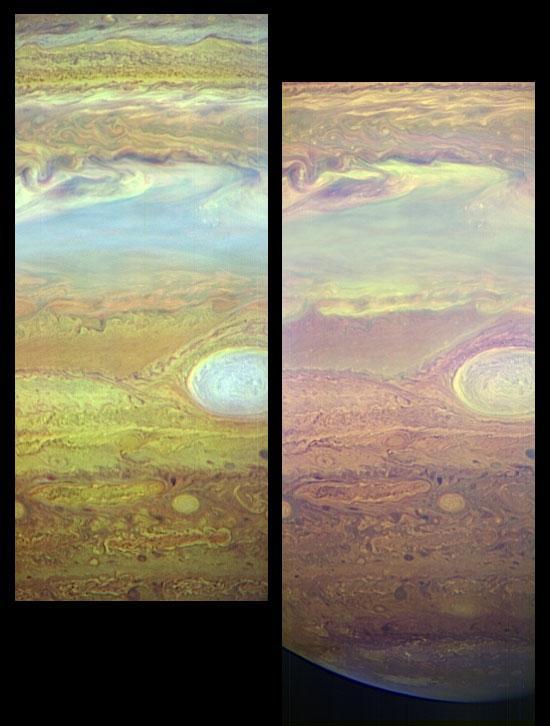
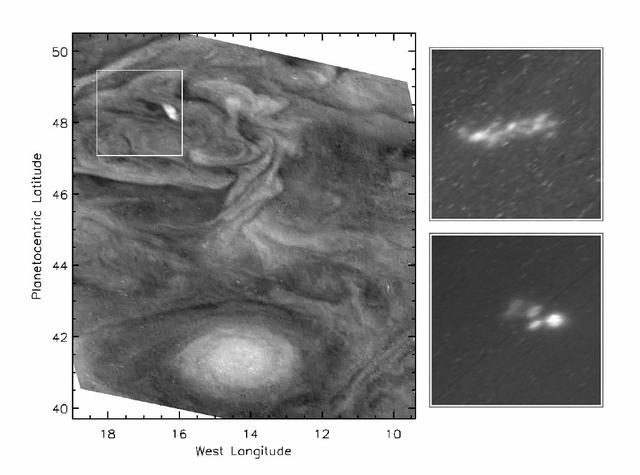
Hubble Tracks Jupiter Storms
Noachis Dust Storm
Clouds and Dust Storms
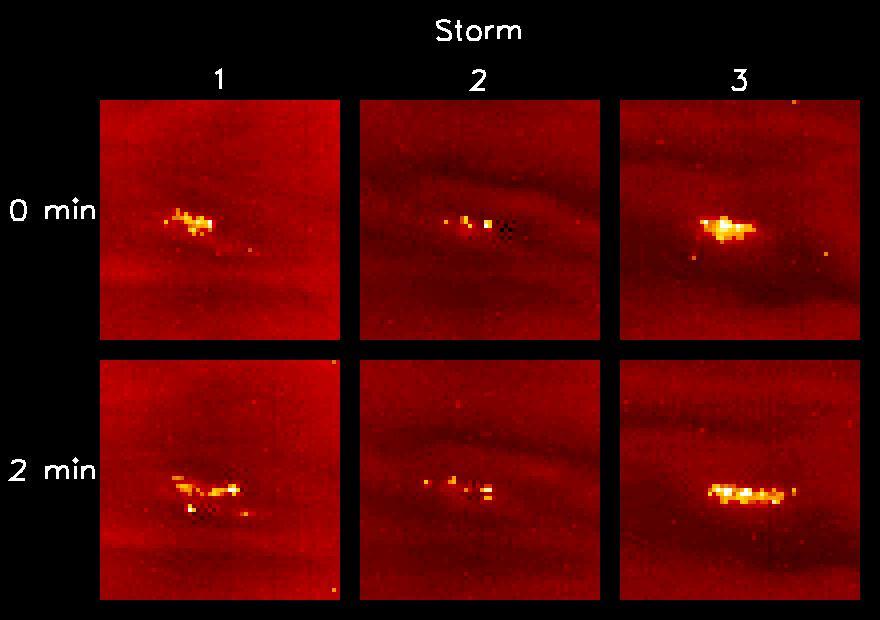
Changing Lightning Storms on Jupiter

Probing Storm Activity on Jupiter
Dark Storms, Bright Clouds

Jupiter Violent Storms

Polar Dust Storm
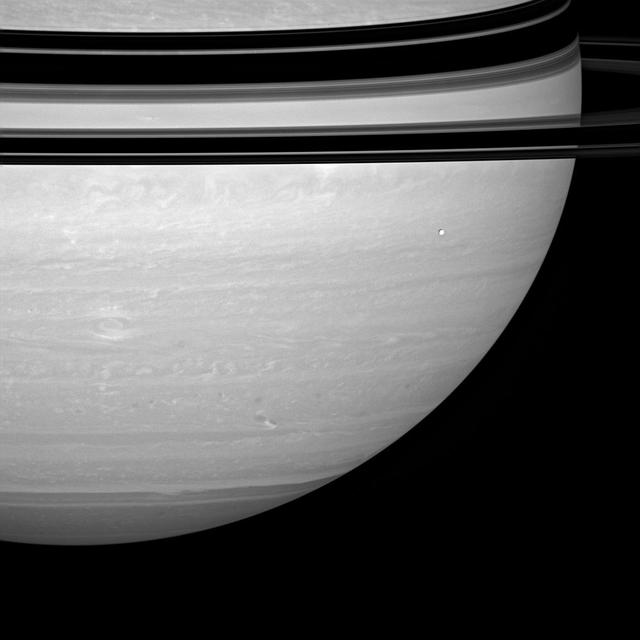
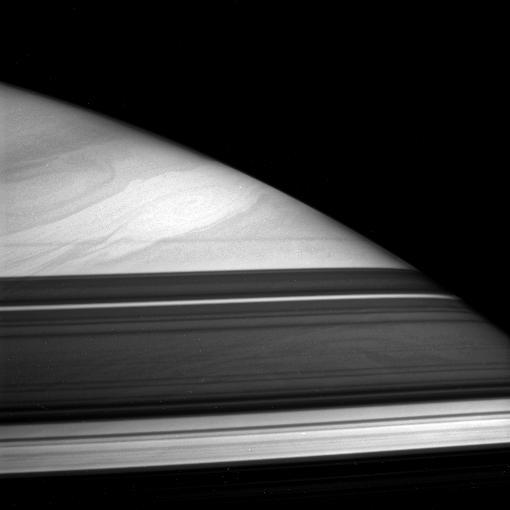
Storms in Saturn Atmosphere

May Dust Storm in Acidalia
The Solar Storm, at Mercury
Autumn Dust Storm
Storms and Feathery Clouds

Decay of a Martian Dust Storm

Autumn Dust Storm
Melas Dust Storm
Jovian Lightning and the Daytime Storm

Historic Merger of Storms on Jupiter

More Storm Clouds
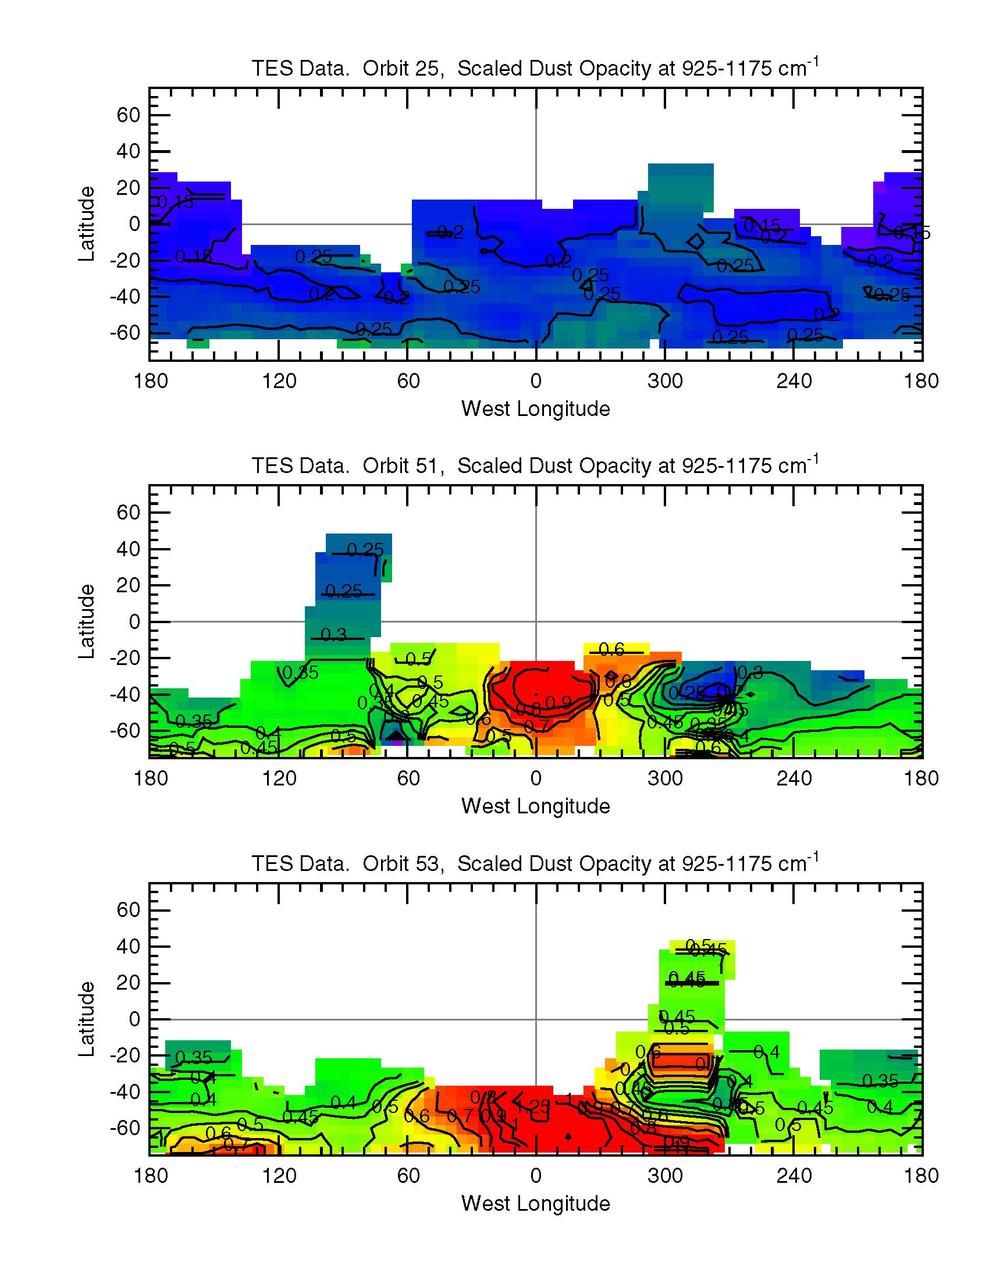
Growth of a Dust Storm TES

Oval Storms Merging on Jupiter
Storm over Dunes
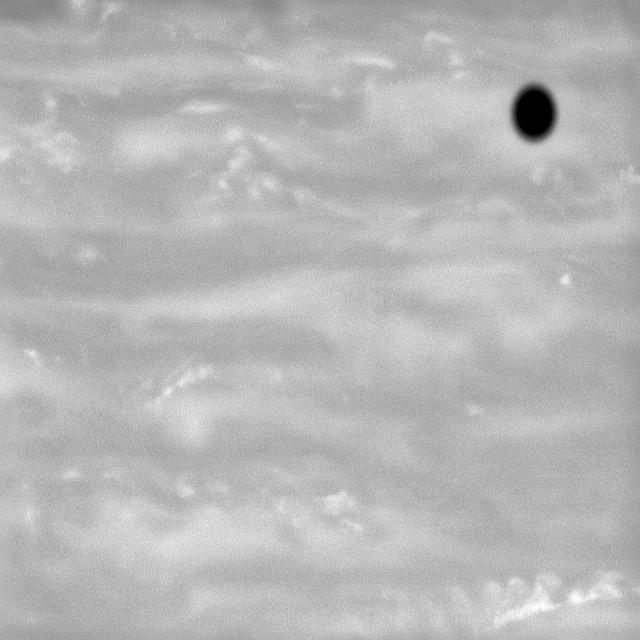
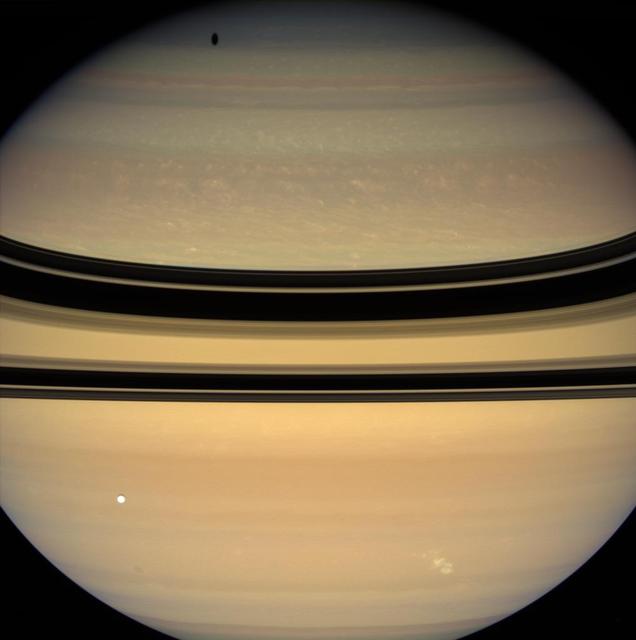
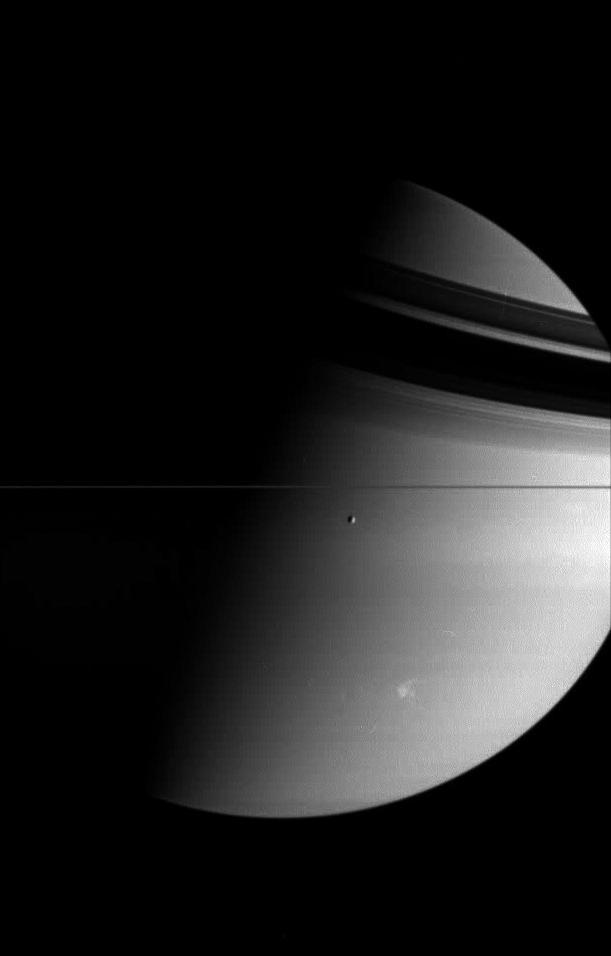
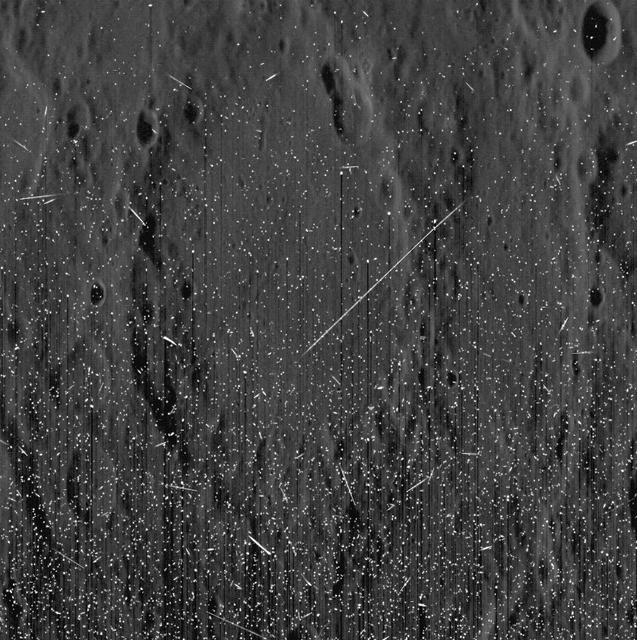
A Shadow Amid the Storms
Mid-Latitude Storms
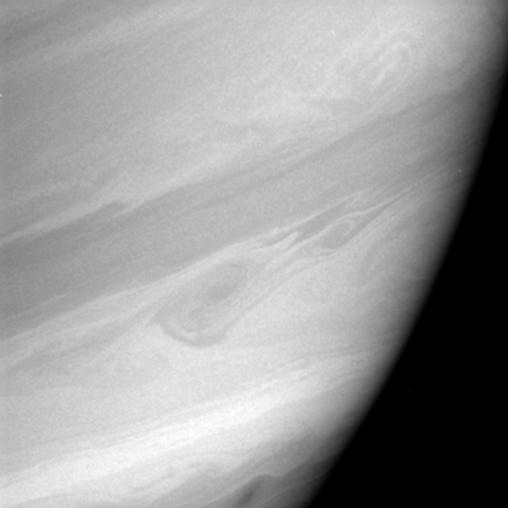
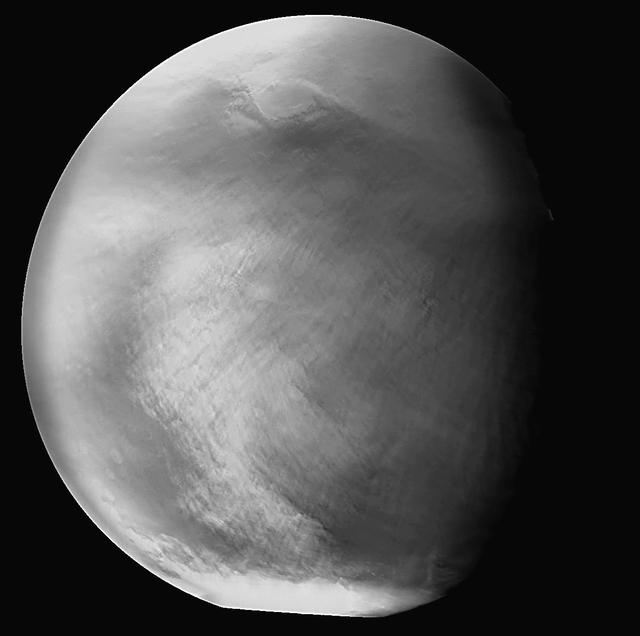
Blue Eyed Storm
Time for Dust Storms
Early Autumn Dust Storm
Storms of the High North
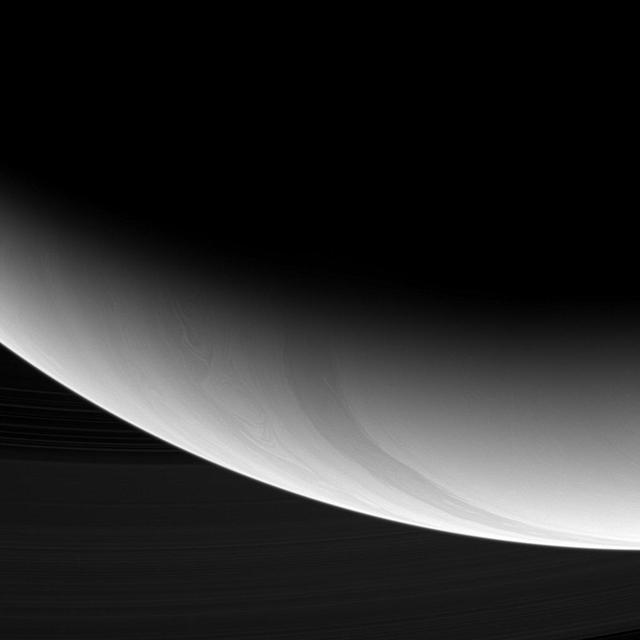
A Storm Escapes the Shadows
1997 Martian Dust Storm

South Polar Storms
Storm Down Under
Syria/Claritas Dust Storm
Saturn Long-lived Storm
North Polar Dust Storm
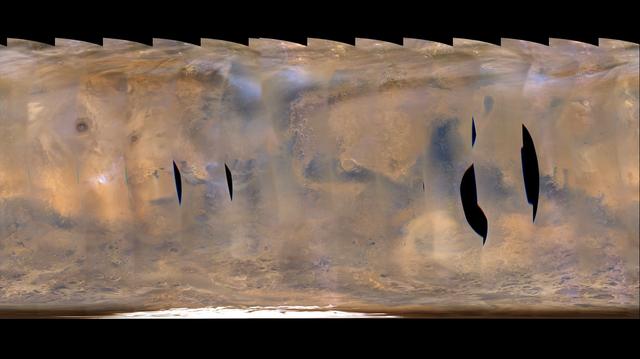
This frame from a movie clip of hundreds of images from NASA's Mars Reconnaissance Orbiter shows a global map of Mars with atmospheric changes from Feb. 18, 2017 through March 6, 2017, a period when two regional-scale dust storms appeared. It combines hundreds of images from the Mars Color Imager (MARCI) camera on NASA's Mars Reconnaissance Orbiter. The date for each map in the series is given at upper left. Dust storms appear as pale tan. In the opening frames, one appears left of center, near the top (north) of the map, then grows in size as it moves south, eventually spreading to about half the width of the map after reaching the southern hemisphere. As the dust from that first storm becomes more diffuse in the south, another storm appears near the center of the map in the final frames. In viewing the movie, it helps to understand some of the artifacts produced by the nature of MARCI images when seen in animation. MARCI acquires images in swaths from pole-to-pole during the dayside portion of each orbit. The camera can cover the entire planet in just over 12 orbits, and takes about one day to accumulate this coverage. The individual swaths for each day are assembled into a false-color, map-projected mosaic for the day. Equally spaced blurry areas that run from south-to-north result from the high off-nadir viewing geometry in those parts of each swath, a product of the spacecraft's low orbit. Portions with sharper-looking details are the central part of an image, viewing more directly downward through less atmosphere than the obliquely viewed portions. MARCI has a 180-degree field of view, and Mars fills about 78 percent of that field of view when the camera is pointed down at the planet. However, the Mars Reconnaissance Orbiter often is pointed to one side or the other off its orbital track in order to acquire targeted observations by other imaging systems on the spacecraft. When such rolls exceed about 20 degrees, gaps occur in the mosaic of MARCI swaths. Other dark gaps appear where data are missing. It isn't easy to see the actual dust motion in the atmosphere in these images, owing to the apparent motion of these artifacts. However, by concentrating on specific surface features (craters, prominent ice deposits, etc.) and looking for the tan clouds of dust, it is possible to see where the storms start and how they grow, move and eventually dissipate. Movies are available at http://photojournal.jpl.nasa.gov/catalog/PIA21484
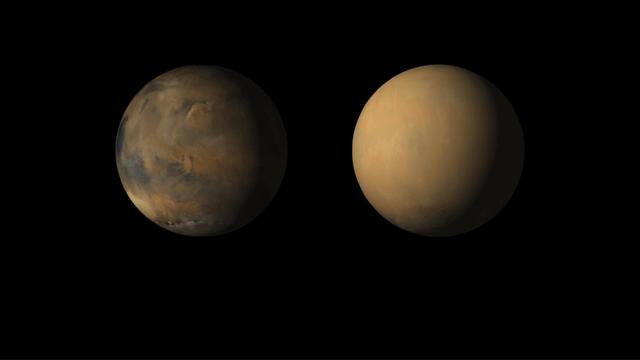
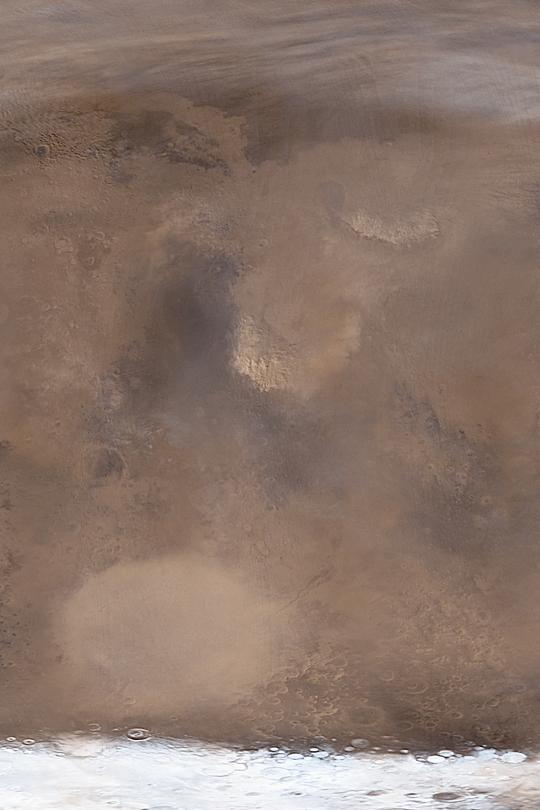
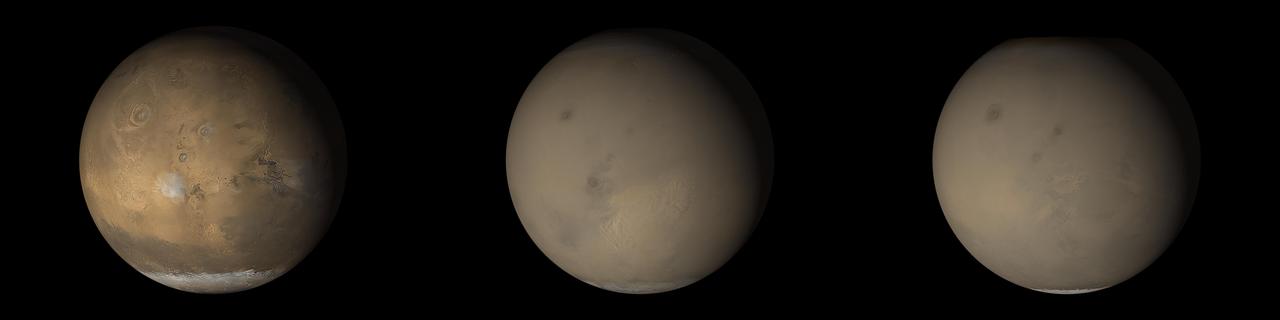
The view from May shows Valles Marineris chasms (left), Meridiani center, an autumn dust storm in Acidalia (top) and the early spring south polar cap (bottom). The view from July shows the same regions, but most of the surface was obscured by the planet-encircling dust cloud and haze. Movies are available at https://photojournal.jpl.nasa.gov/catalog/PIA22487
Tropical Storm Blas as observed by the Atmospheric Infrared Sounder AIRS onboard NASA Aqua in the year 2004. The major contribution to radiation (infrared light) that AIRS channels sense comes from different levels in the atmosphere, depending upon the channel wavelength. To create the movie, a set of AIRS channels were selected which probe the atmosphere at progressively deeper levels. If there were no clouds, the color in each frame would be nearly uniform until the Earth's surface is encountered. The tropospheric air temperature warms at a rate of 6 K (about 11 F) for each kilometer of descent toward the surface. Thus the colors would gradually change from cold to warm as the movie progresses. Clouds block the infrared radiation. Thus wherever there are clouds we can penetrate no deeper in infrared. The color remains fixed as the movie progresses, for that area of the image is "stuck" to the cloud top temperature. The coldest temperatures around 220 K (about -65 F) come from altitudes of about 10 miles. http://photojournal.jpl.nasa.gov/catalog/PIA00436
Springtime North Polar Dust Storms
The 2001 Great Dust Storms - Tharsis
Solar Storms, Devils, Dunes, and Gullies
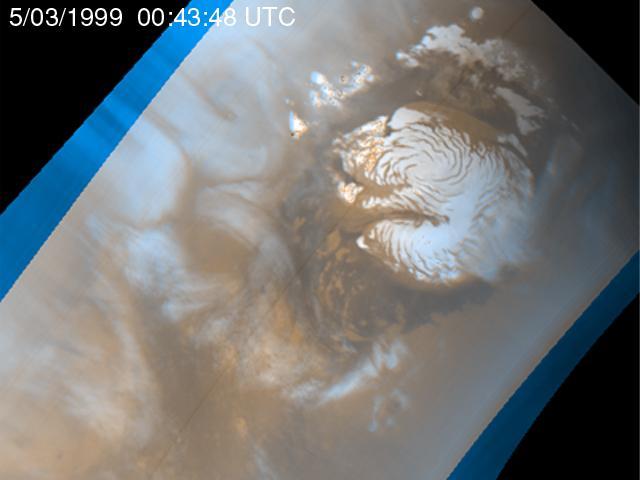
Martian Storm 05/03/99

Late-summer Martian Dust Storm
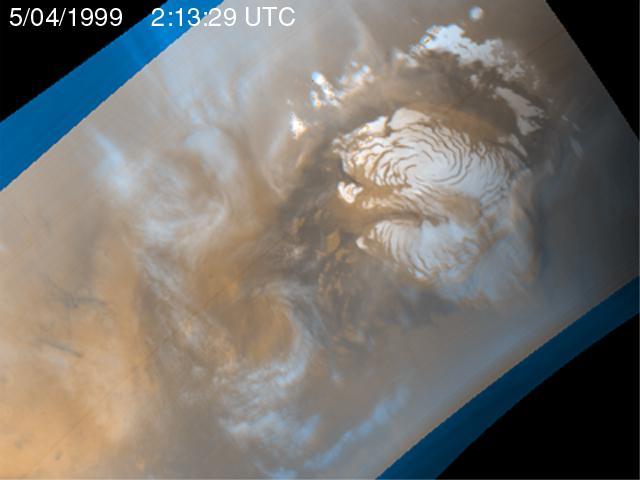
Martian Storm 05/04/99
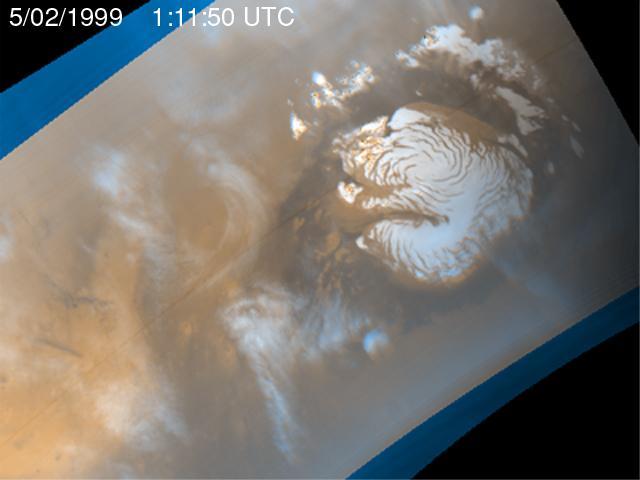
Martian Storm 05/02/99
Seasons Conceal South Pole Storm

Hubble Observes a New Saturn Storm
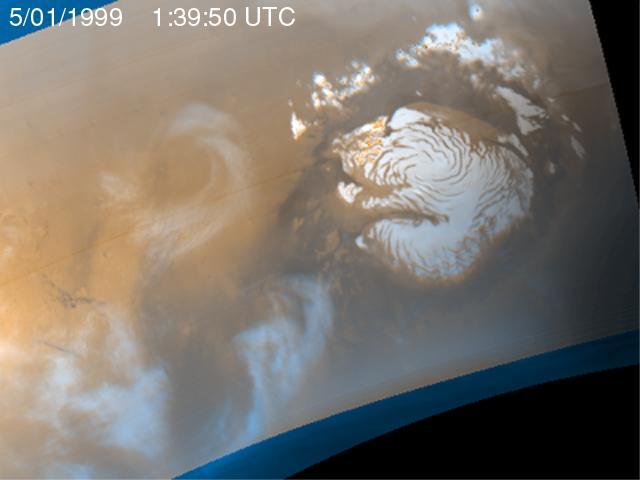
Martian Storm 05/01/99
Dust storm in the Thaumasia region of Mars
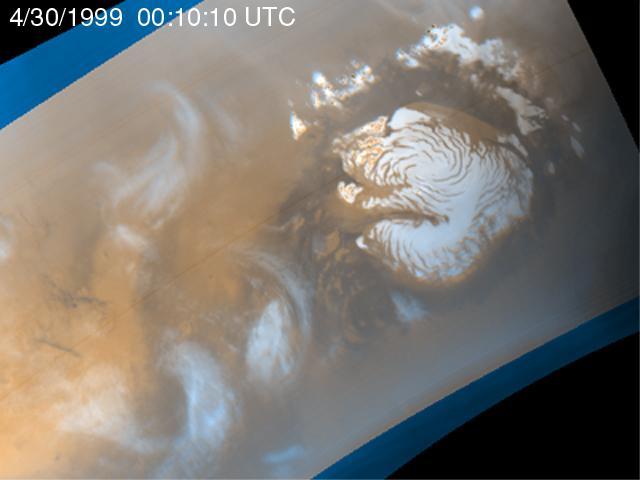
Martian Storm 04/30/99

Small Dust Storm in Syria/Claritas
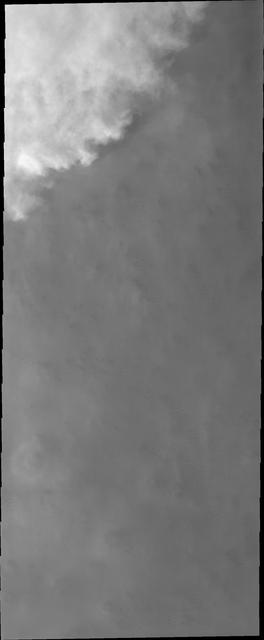
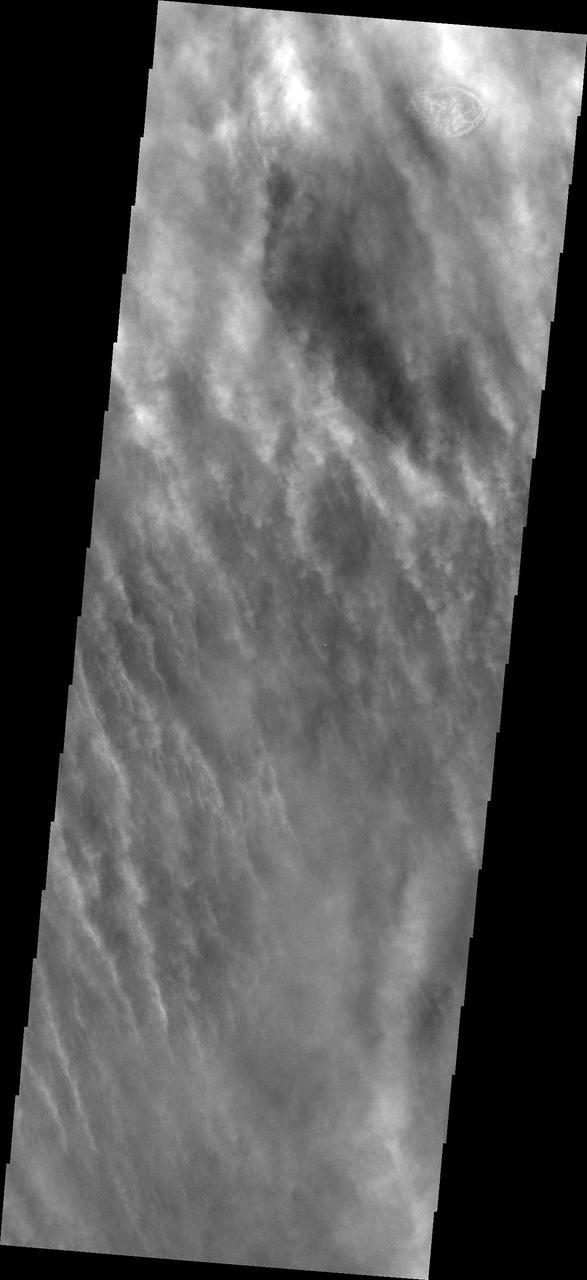
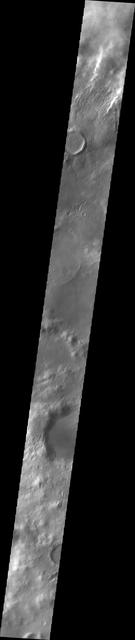
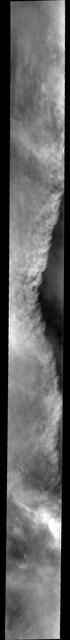
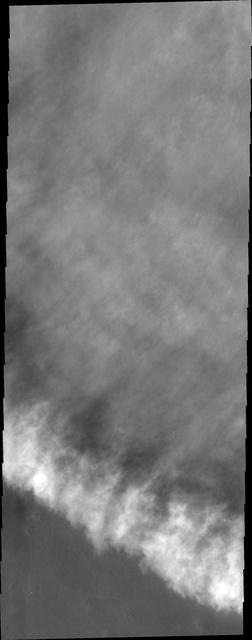
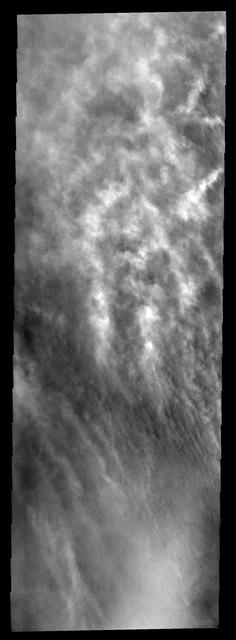
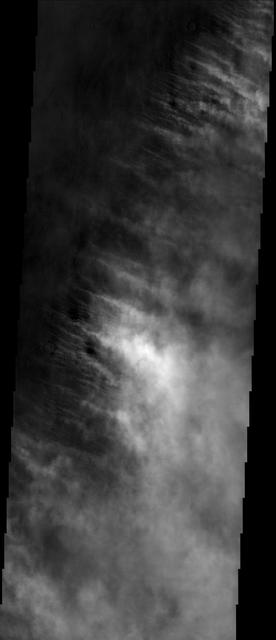
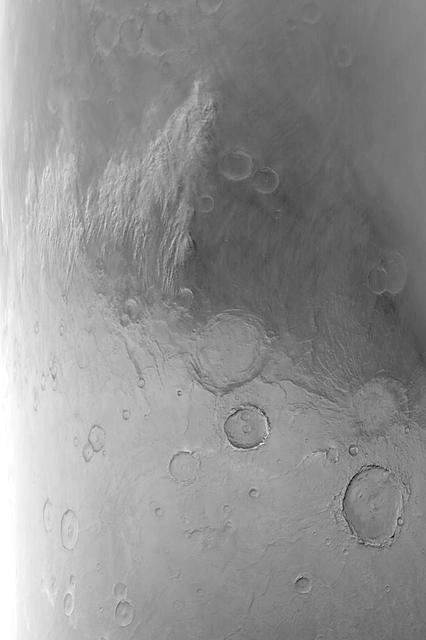
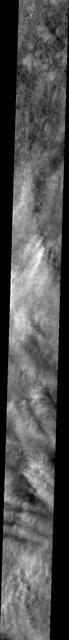
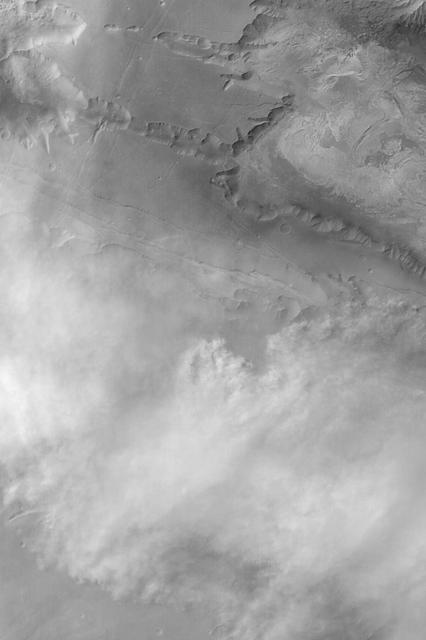
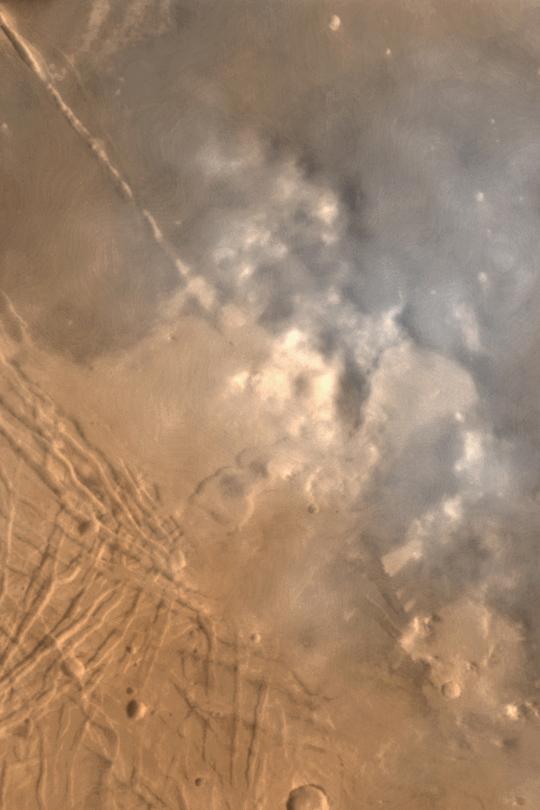
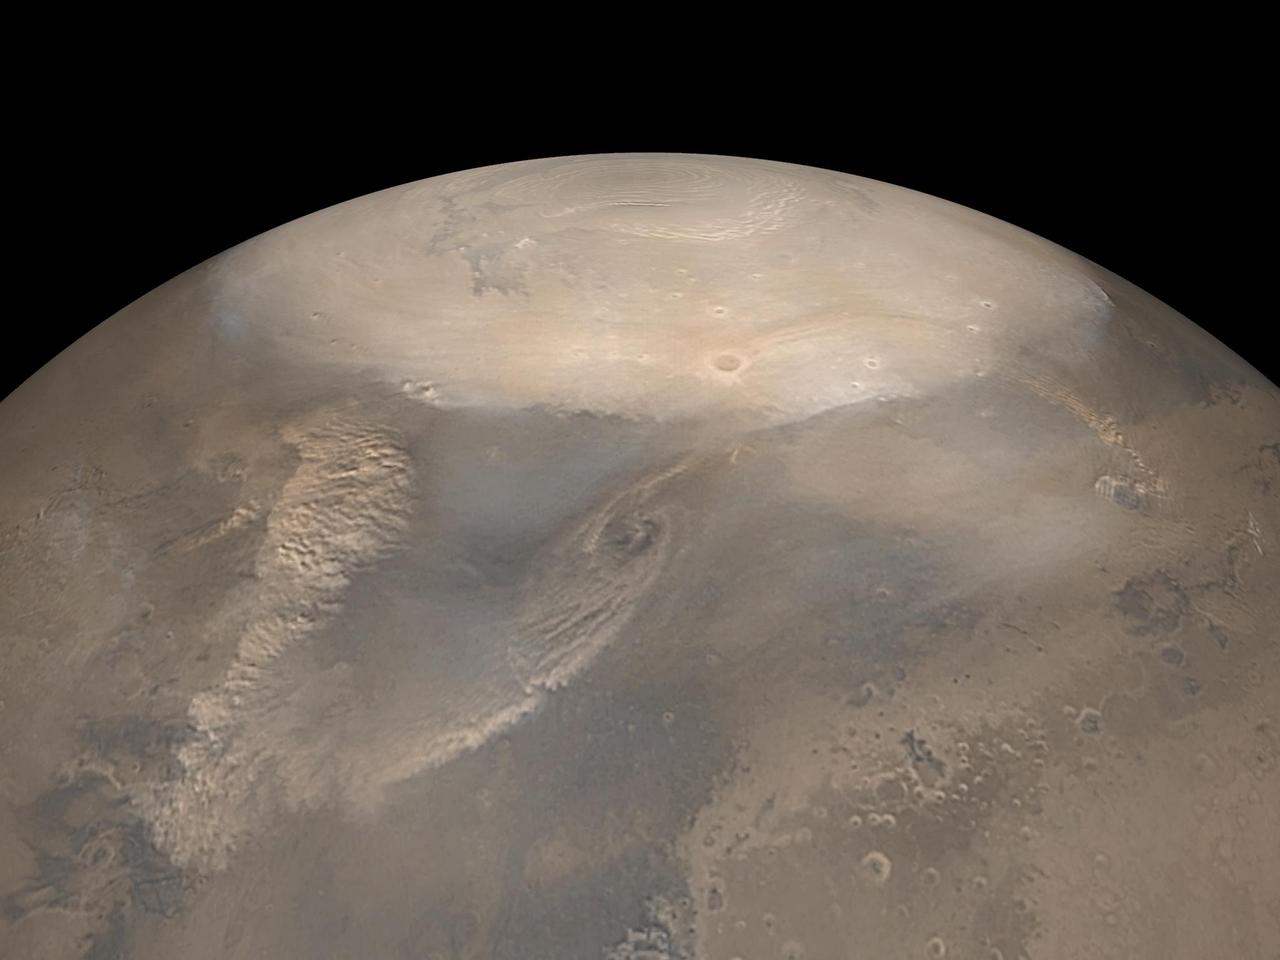
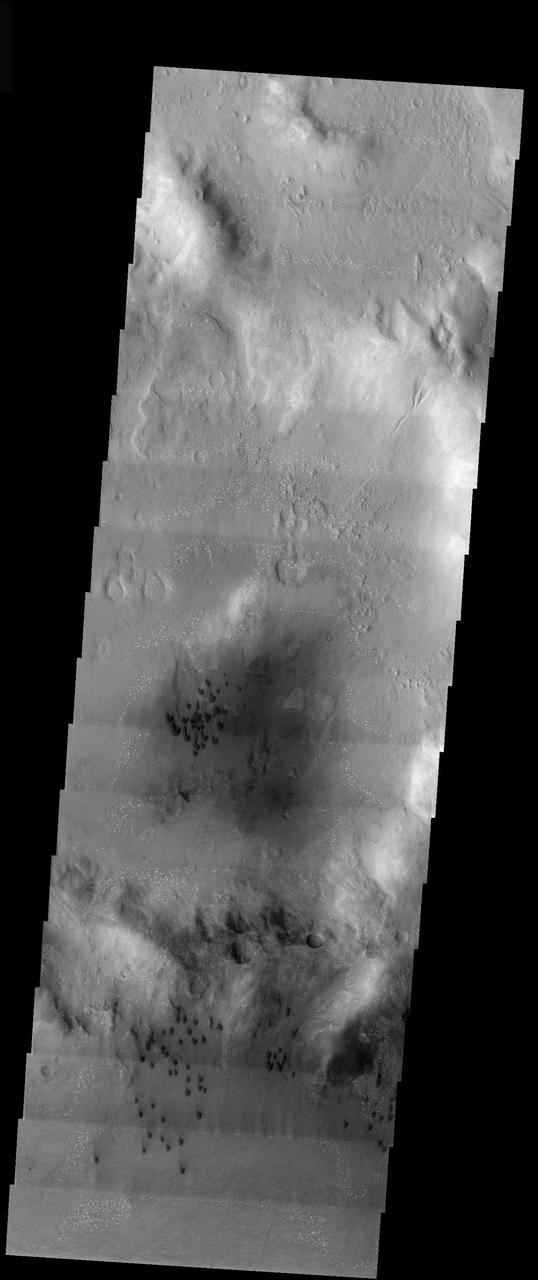
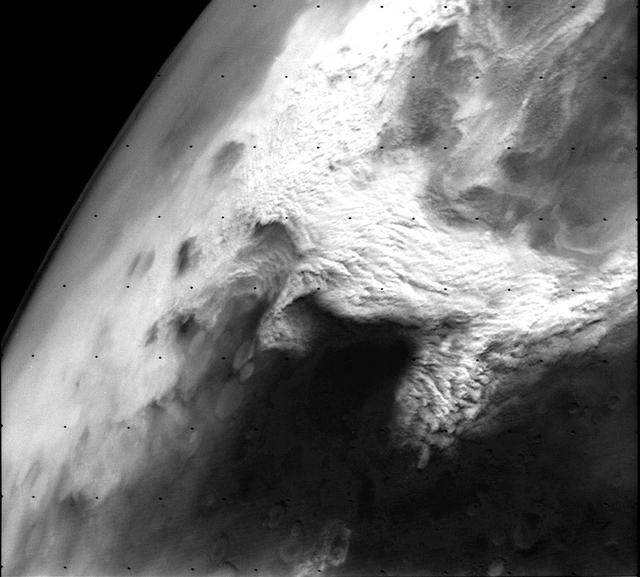
Spring time brings storms to the north polar region of Mars. This image captured by NASA 2001 Mars Odyssey spacecraft shows a storm front, as bright clouds shadow and obscure the surface.
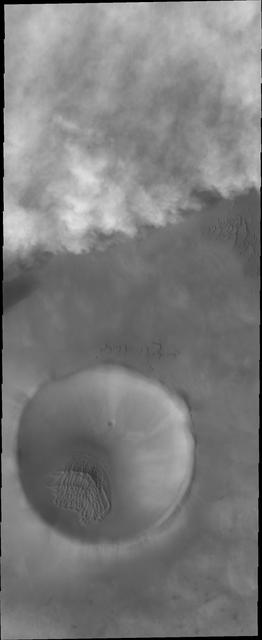
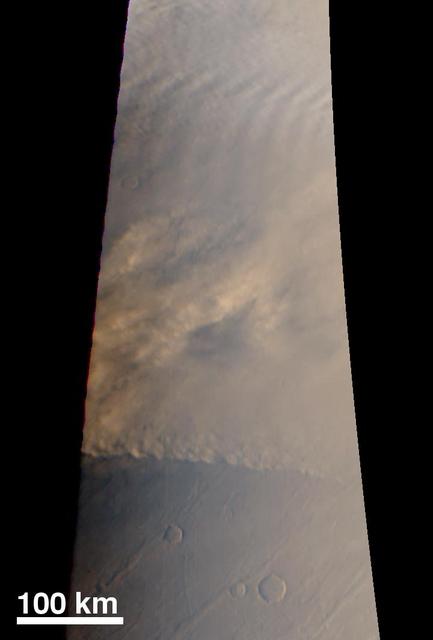
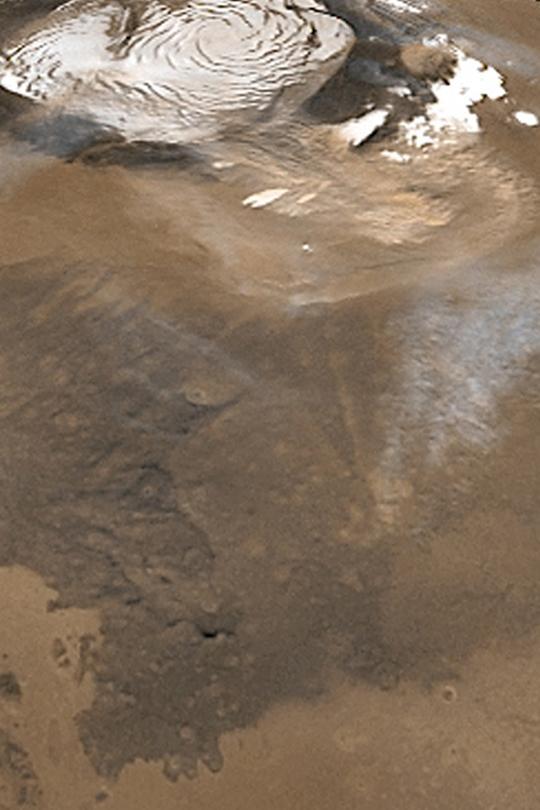
This image from NASA 2001 Mars Odyssey captures storm clouds that are moving towards the crater in the bottom of this image. Storms like this are common during the spring and early summer near the north pole.
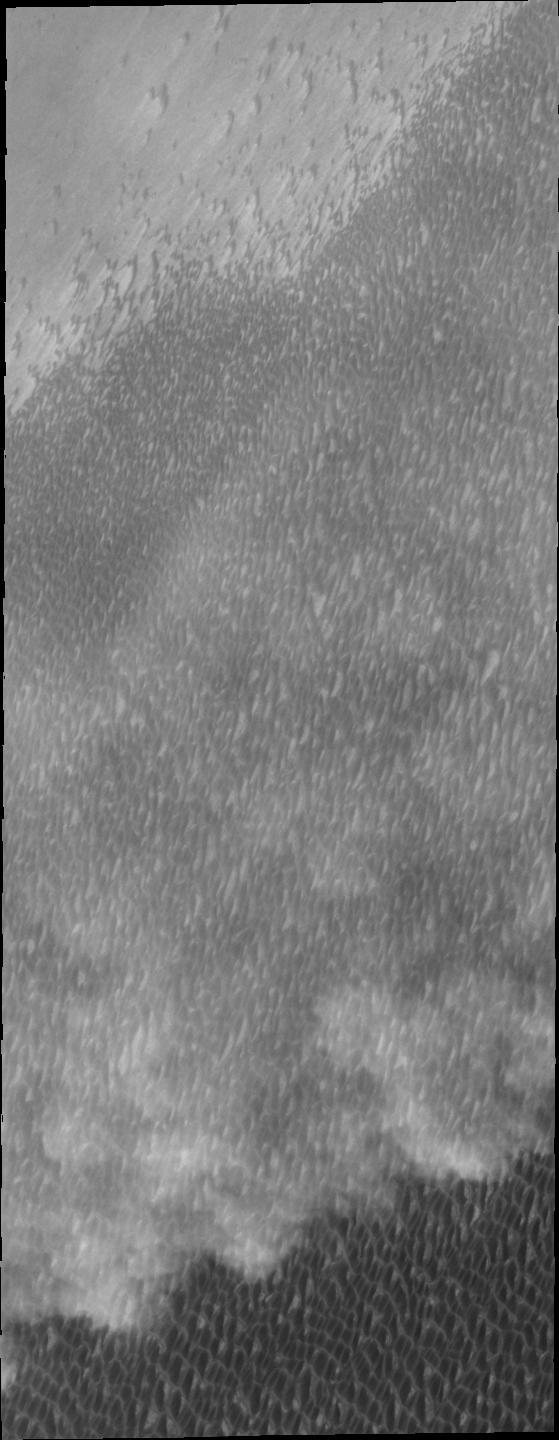
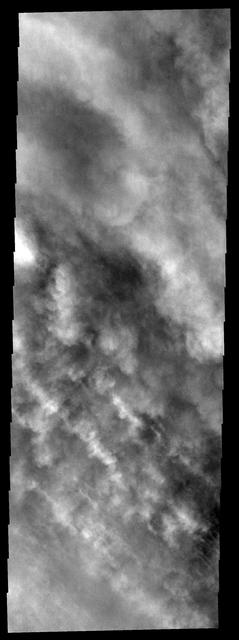
Spring storms are common near the north pole. This image captured by NASA 2001 Mars Odyssey spacecraft shows a storm front over the extensive dune field which surrounds part of the polar cap.
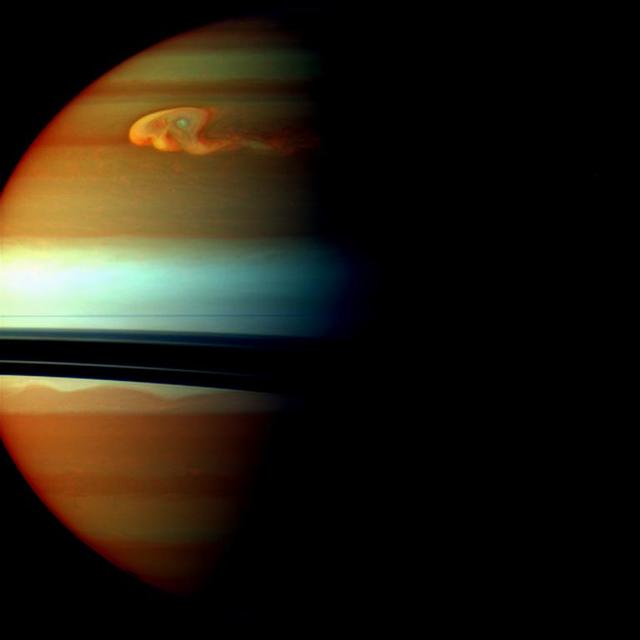
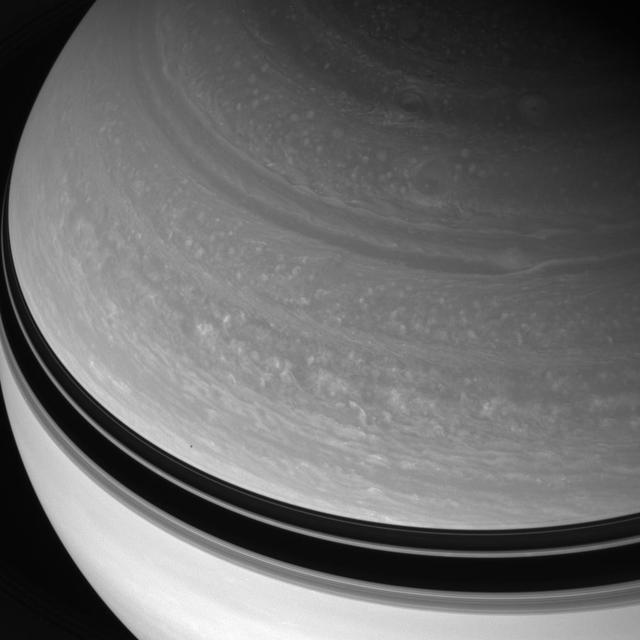
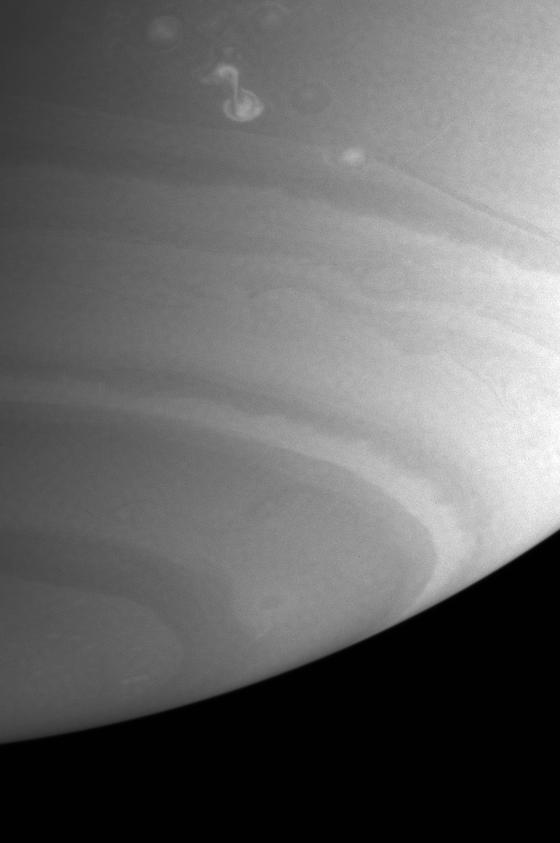
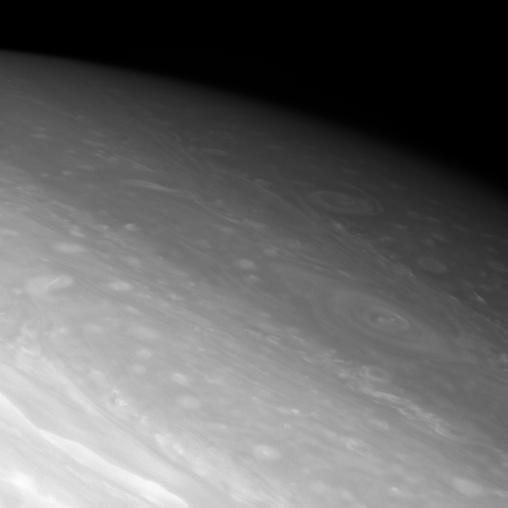
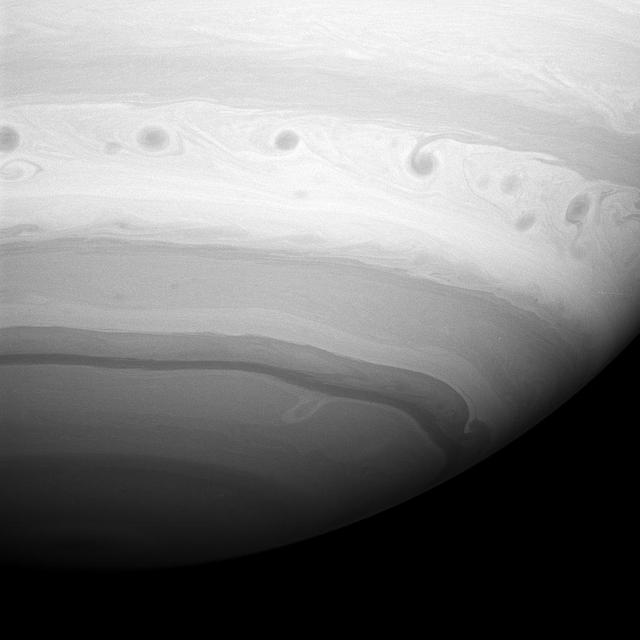
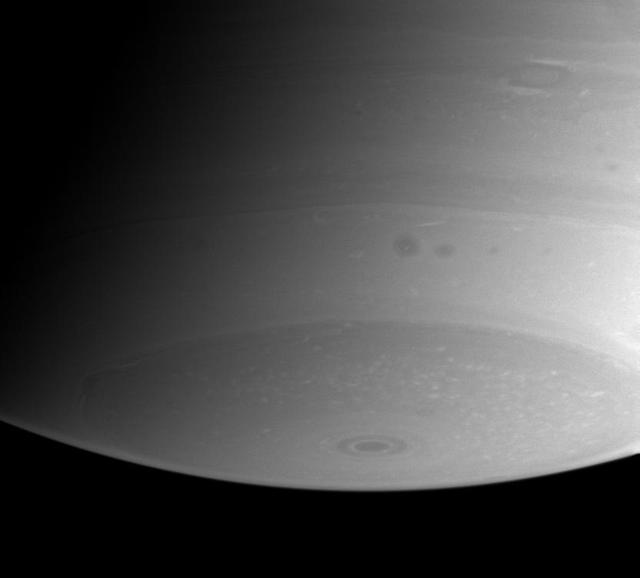
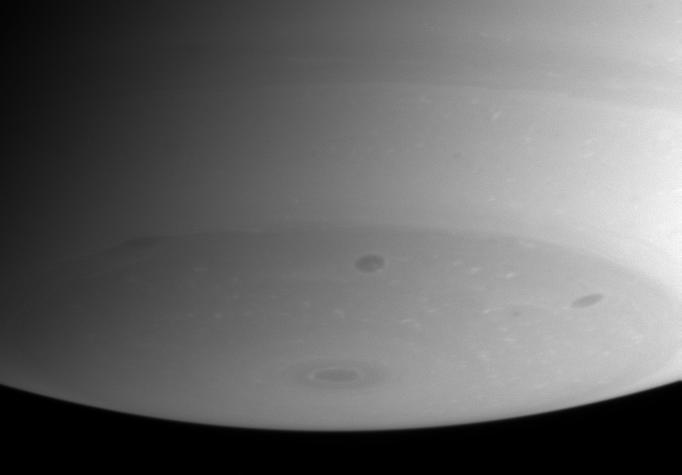
The head of Saturn huge northern storm is well established in this view captured early in the storm development by NASA Cassini spacecraft in late 2010.
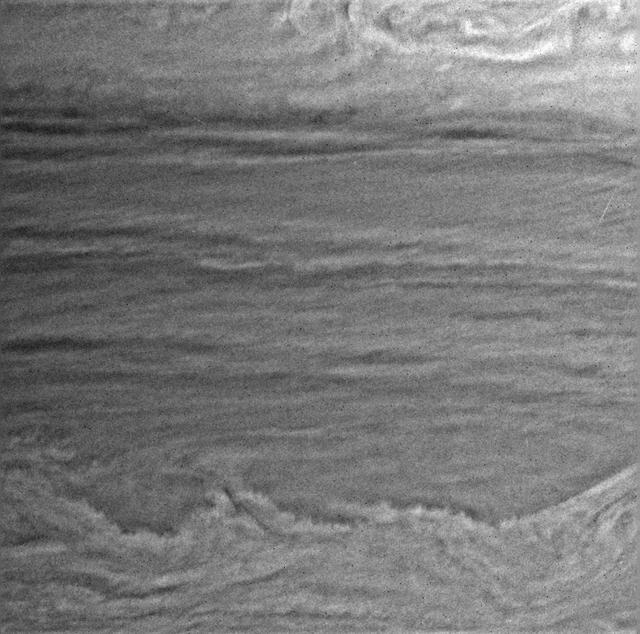
This false-color mosaic from NASA Cassini spacecraft shows the tail of Saturn huge northern storm. The head of the storm is beyond the horizon in this view.
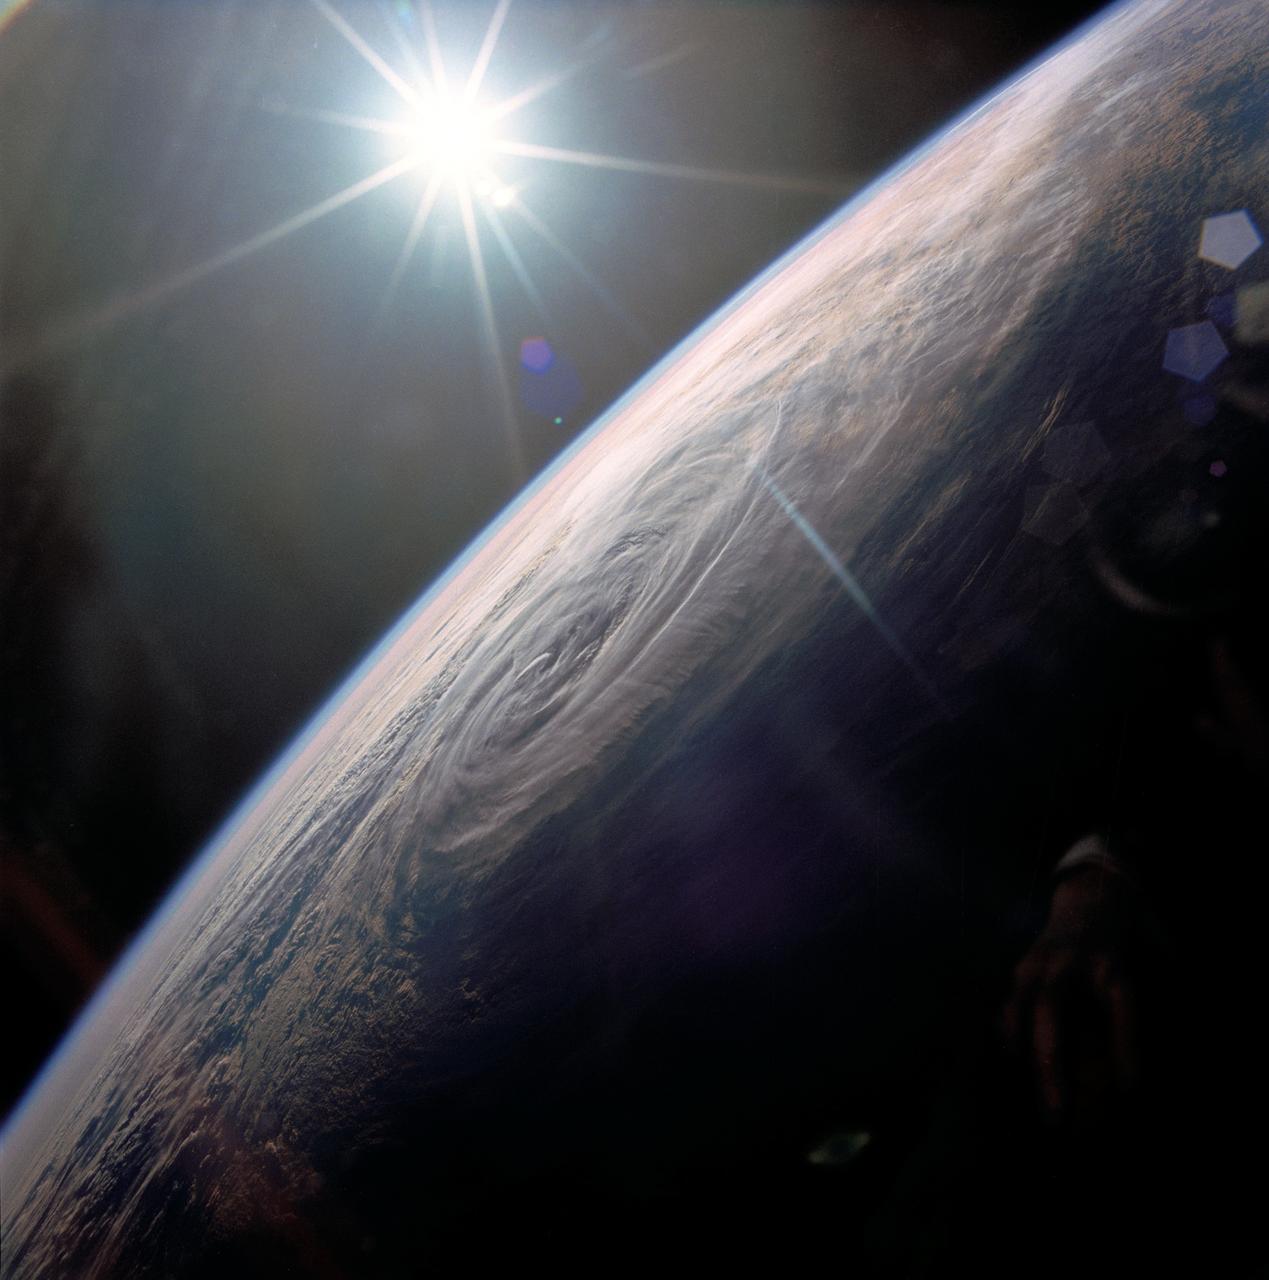
STS032-80-036 (9-20 Jan. 1990) --- This oblique view of Tropical Storm Sam in the eastern Indian Ocean off the western coast of Australia was photographed with a 70mm camera by the astronauts. Tropical Storm Sam (known as Willy-Willy in Australia) was born in the eastern Indian Ocean near the islands of Timor and Sumba in Indonesia. The storm tracked southwestward attaining sustained winds in excess of 60 knots (70 miles per hour). Other than on Christmas Island and the Cocos (Keeling) Islands south of Java, and for strong swells along the western Australia coast, the storm had little impact on land areas. At the time this photograph was taken, the storm was beginning to dissipate in the south Indian Ocean. The eye of the storm is still visible near center, with the swirling bands of the storm propagating in a clockwise direction toward the center. Winds aloft have begun to shear the tops of thunderstorms associated with the storm, forming a high cirrus cloud cover over the center portions of the storm. This picture was used by the crew at their January 30, 1990 Post-Flight Press Conference (PFPC).
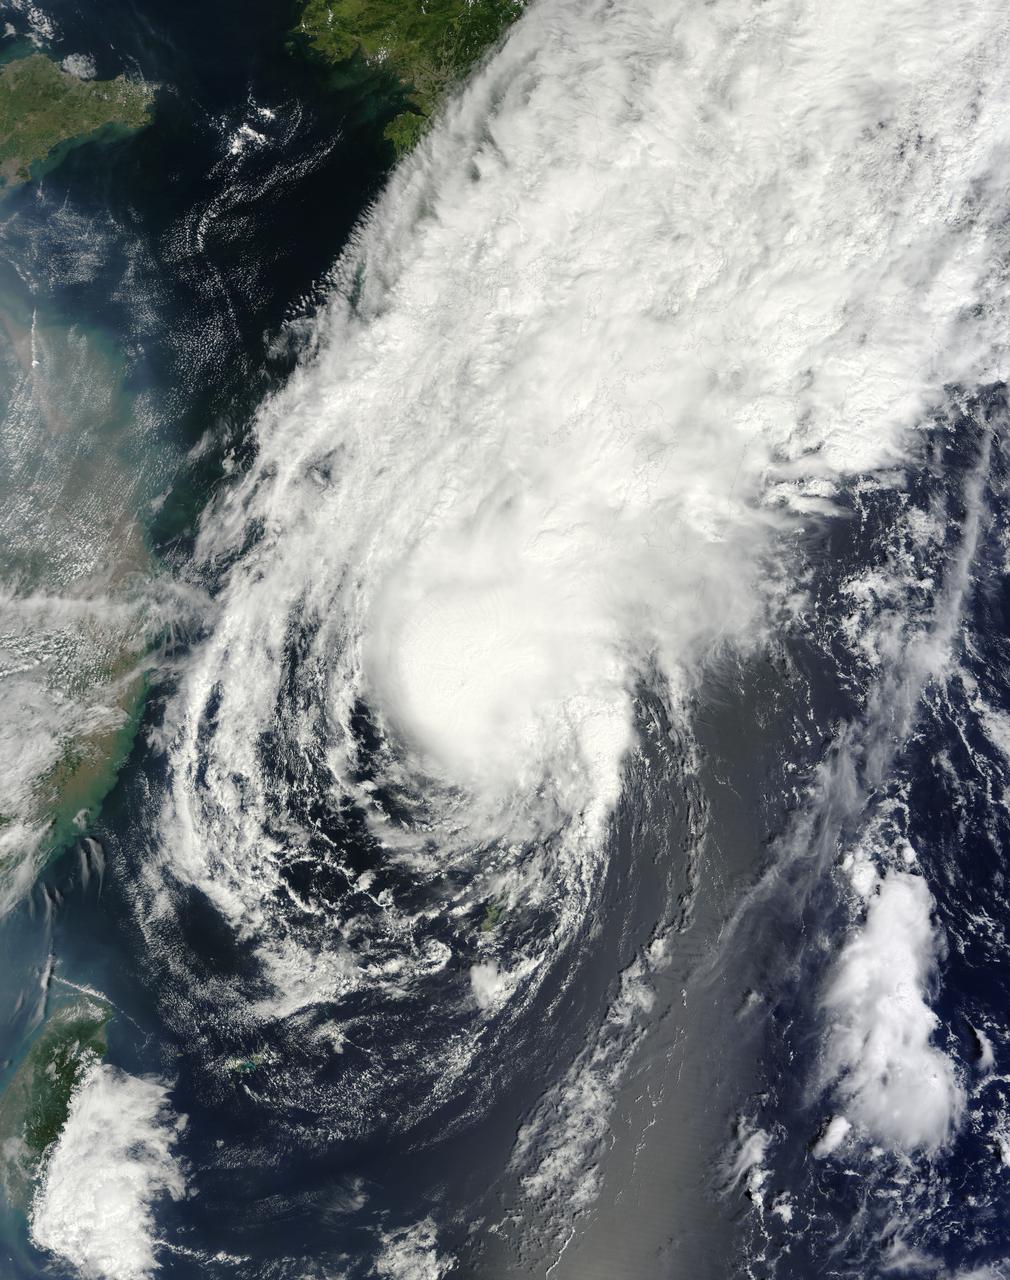
Tropical Storm Toraji Approaching Japan, 09/03/2013 at 02:10 UTC. Terra/MODIS <b><a href="http://www.nasa.gov/audience/formedia/features/MP_Photo_Guidelines.html" rel="nofollow">NASA image use policy.</a></b> <b><a href="http://www.nasa.gov/centers/goddard/home/index.html" rel="nofollow">NASA Goddard Space Flight Center</a></b> enables NASA’s mission through four scientific endeavors: Earth Science, Heliophysics, Solar System Exploration, and Astrophysics. Goddard plays a leading role in NASA’s accomplishments by contributing compelling scientific knowledge to advance the Agency’s mission. <b>Follow us on <a href="http://twitter.com/NASA_GoddardPix" rel="nofollow">Twitter</a></b> <b>Like us on <a href="http://www.facebook.com/pages/Greenbelt-MD/NASA-Goddard/395013845897?ref=tsd" rel="nofollow">Facebook</a></b> <b>Find us on <a href="http://instagram.com/nasagoddard?vm=grid" rel="nofollow">Instagram</a></b>