Storm Clouds
Storm and Clouds
Clouds and Dust Storms
Dark Storms, Bright Clouds
Storms and Feathery Clouds

More Storm Clouds
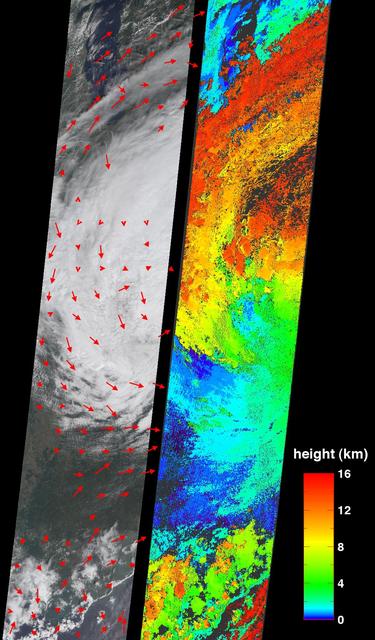
On Tuesday, August 30, 2005, NASA Terra spacecraft retrieved cloud-top heights and cloud-tracked wind velocities for Tropical Storm Katrina, as the center of the storm was situated over the Tennessee Valley.
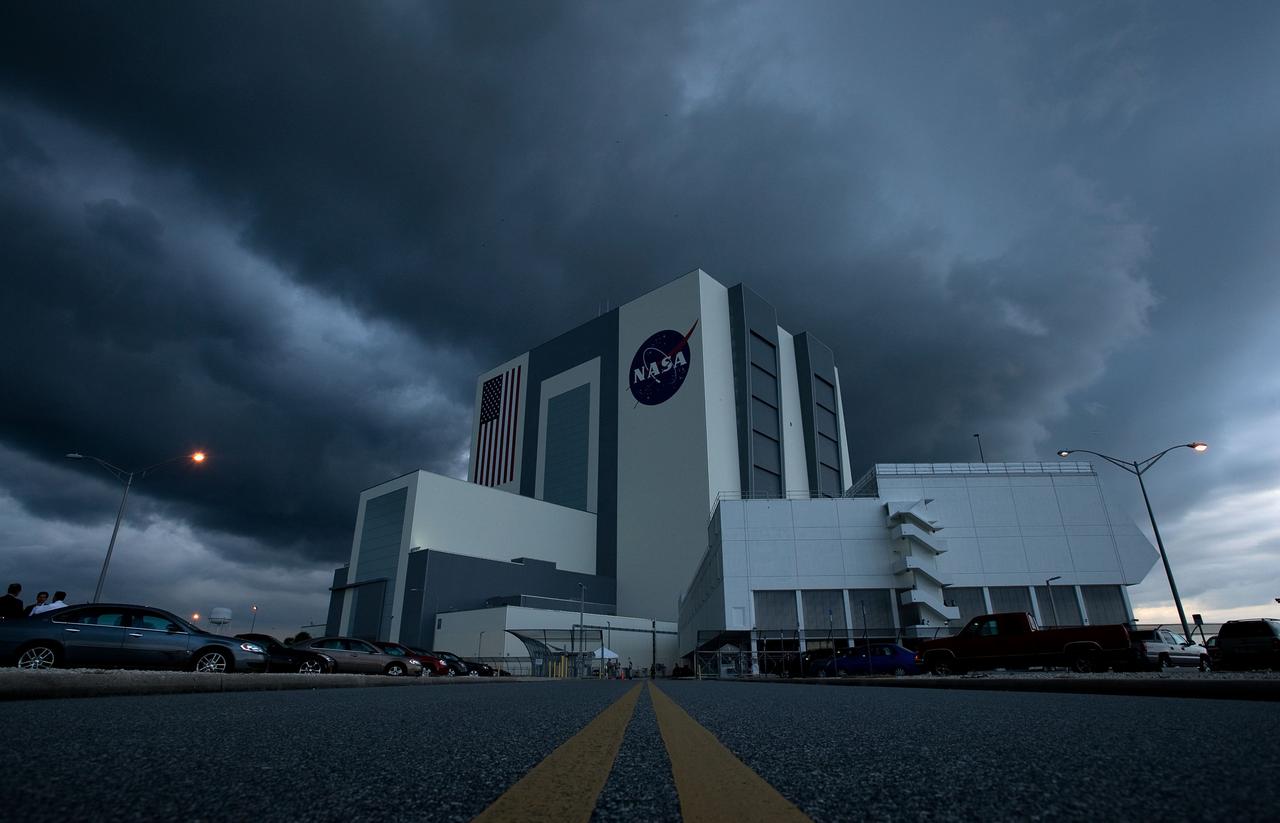
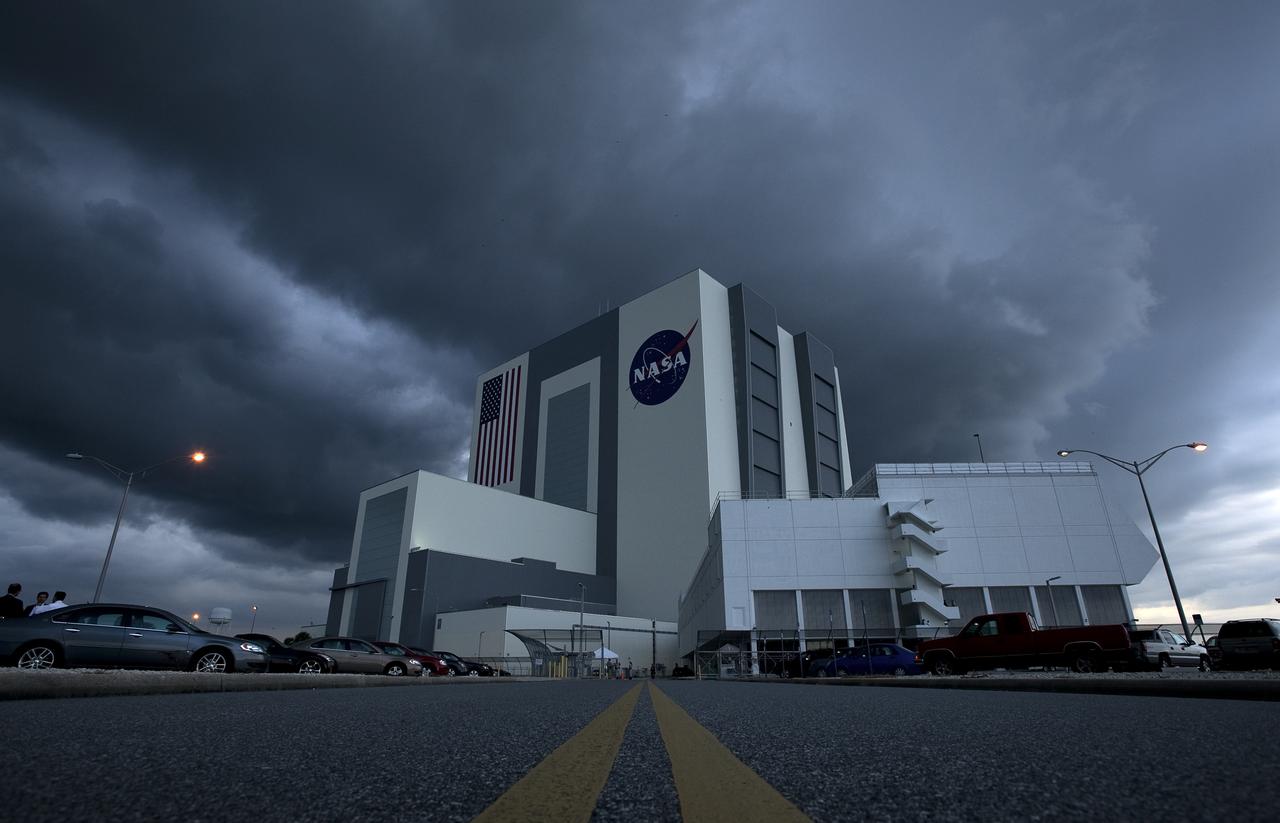
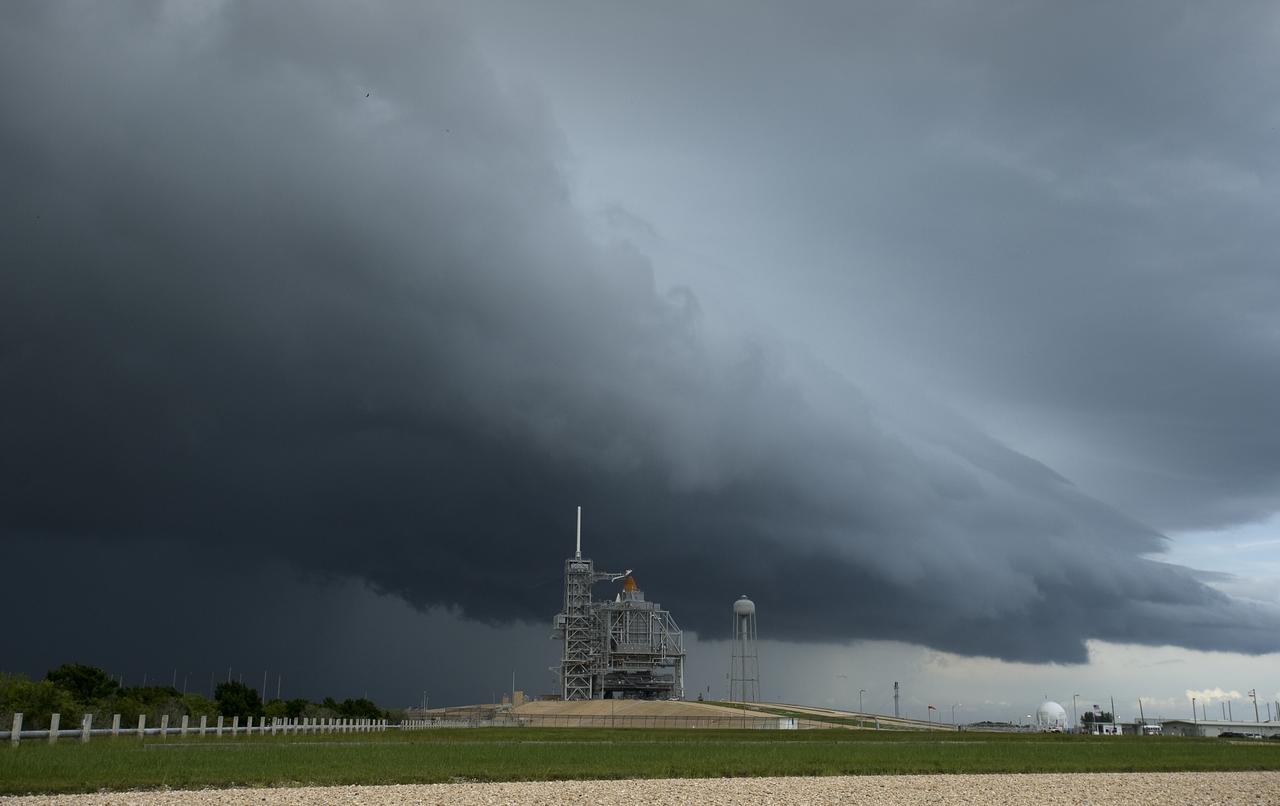
Storm clouds roll in over the NASA Vehicle Assembly building moments after STS-127 Space Shuttle Launch Director Pete Nickolenko and the launch team called the launch a "No Go" due to weather conditions at the NASA Kennedy Space Center in Cape Canaveral, Florida, Sunday, July 12, 2009. Endeavour will be launching with the crew of STS-127 on a 16-day mission that will feature five spacewalks and complete construction of the Japan Aerospace Exploration Agency's Kibo laboratory. Photo Credit: (NASA/Bill Ingalls)
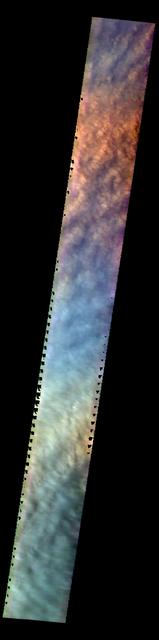
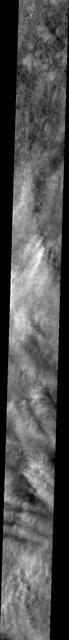
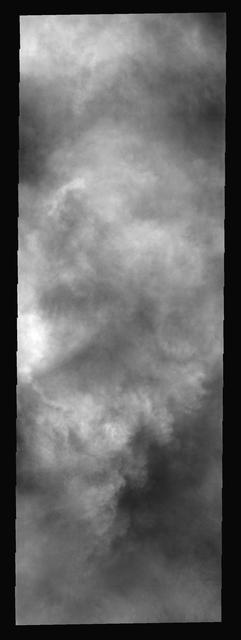
The THEMIS VIS camera contains 5 filters. The data from different filters can be combined in multiple ways to create a false color image. These false color images may reveal subtle variations of the surface not easily identified in a single band image. This VIS image shows the cloud tops of a large storm over Utopia Planitia. The clouds are composed mainly of dust and completely hide the surface. Orbit Number: 60143 Latitude: 56.7602 Longitude: 95.2069 Instrument: VIS Captured: 2015-07-05 22:51 https://photojournal.jpl.nasa.gov/catalog/PIA22679
Storm clouds roll in over the NASA Vehicle Assembly building moments after STS-127 Space Shuttle Launch Director Pete Nickolenko and the launch team called the launch a "No Go" due to weather conditions at the NASA Kennedy Space Center in Cape Canaveral, Florida, Sunday, July 12, 2009. Endeavour will be launching with the crew of STS-127 on a 16-day mission that will feature five spacewalks and complete construction of the Japan Aerospace Exploration Agency's Kibo laboratory. Photo Credit: (NASA/Bill Ingalls)
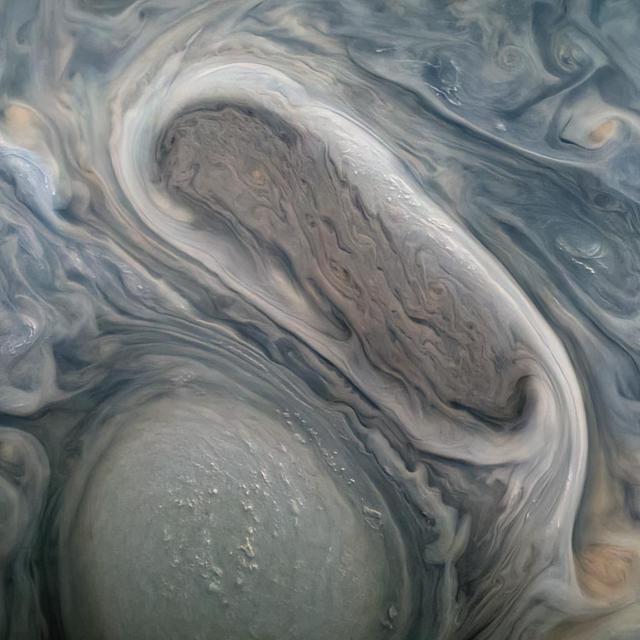
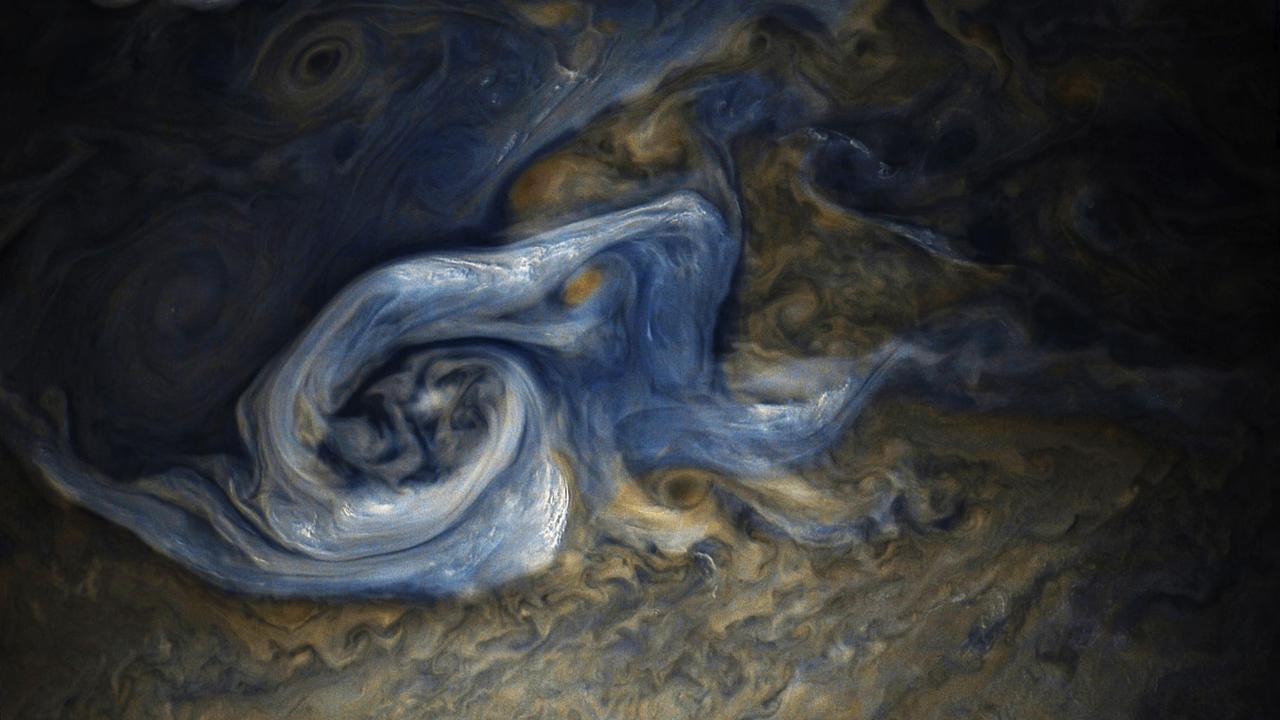
This image shows two of Jupiter's large rotating storms, captured by Juno's visible-light imager, JunoCam, on Juno's 38th perijove pass, on Nov. 29, 2021. This image was acquired at 50 degrees 5 minutes north latitude, at an altitude of 3,815 miles (6,140 kilometers). Atmospheric details as small as 2.5 miles (4 kilometers) can be discerned in the image. Bright "pop-up" clouds are visible above the lower storm, casting shadows on the cloud bank below. Although the pop-up clouds appear small in comparison to the large storm below, such clouds are typically 31 miles (50 kilometers) across. Citizen scientist Kevin M. Gill processed the image to enhance the color and contrast, using raw JunoCam data. https://photojournal.jpl.nasa.gov/catalog/PIA25031
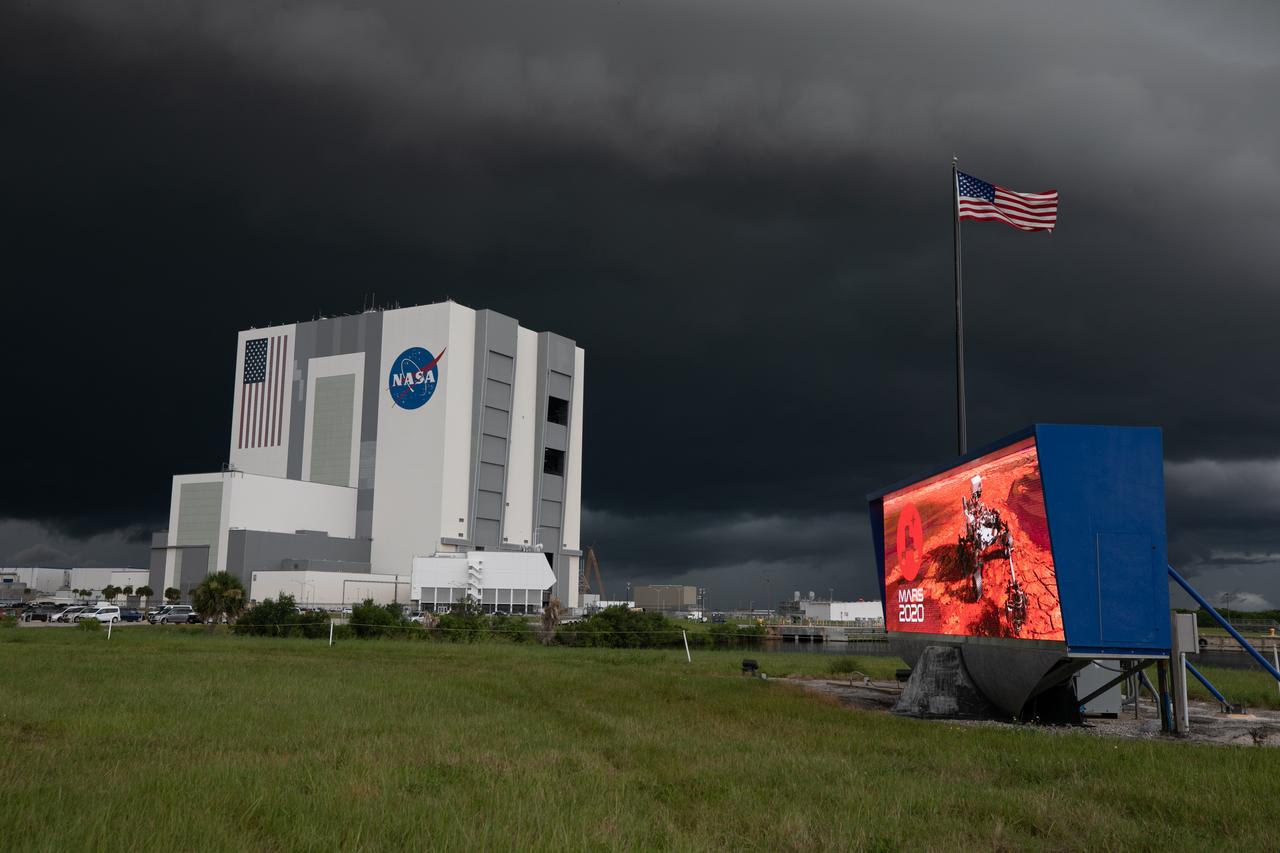
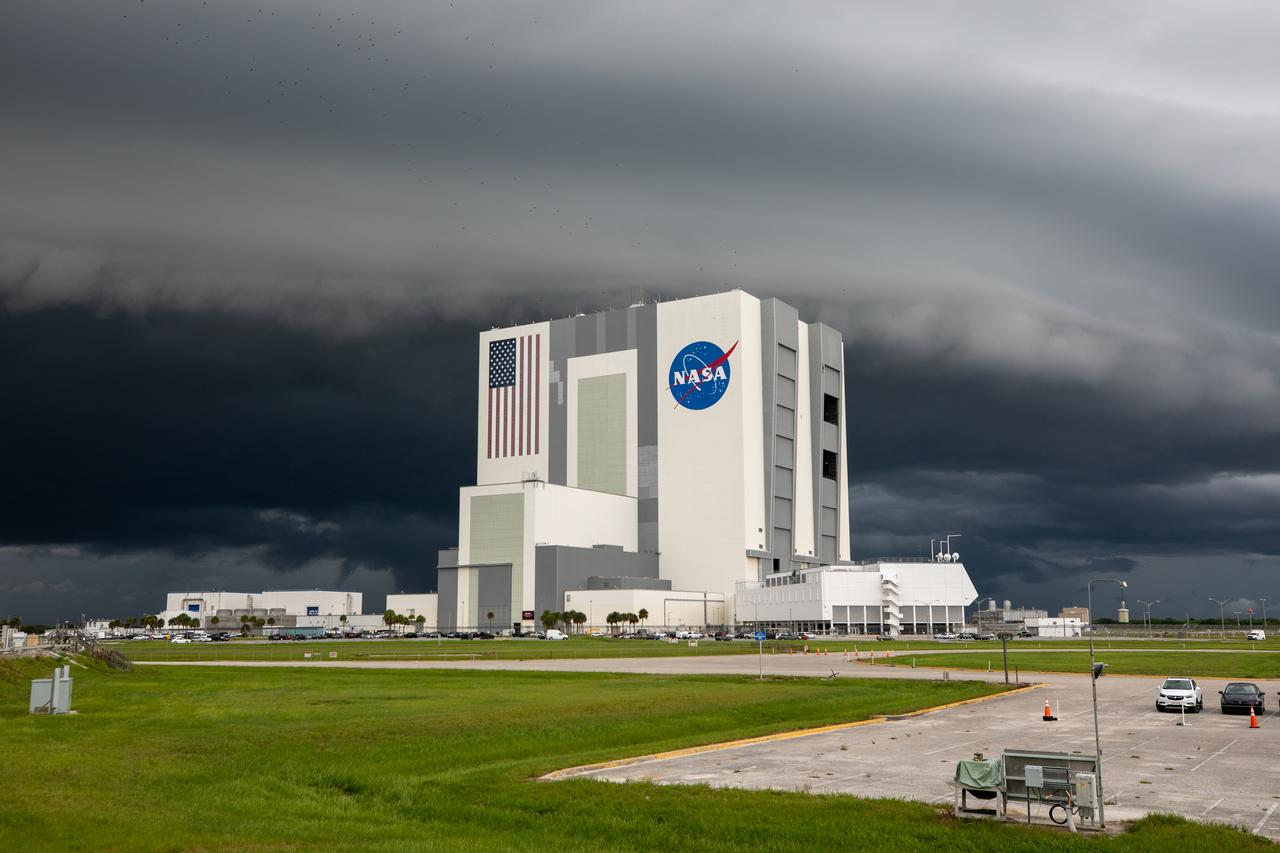
From NASA Kennedy Space Center’s Press Site lawn near the iconic countdown clock, storm clouds can be seen rolling in over the Vehicle Assembly Building (VAB) on July 28, 2020. Standing at 525 feet tall, this facility is capable of hosting multiple varieties of rockets and spacecraft at the same time. Currently, the VAB is being utilized to process and assemble the agency’s Space Launch System (SLS) rocket for Artemis missions to the Moon and beyond to Mars. Artemis I – the first launch under the agency’s Artemis Program – will test SLS and Orion as an integrated system prior to crewed flights to the Moon.
From NASA Kennedy Space Center’s Press Site lawn near the iconic countdown clock, storm clouds can be seen rolling in over the Vehicle Assembly Building (VAB) on July 28, 2020. Standing at 525 feet tall, this facility is capable of hosting multiple varieties of rockets and spacecraft at the same time. Currently, the VAB is being utilized to process and assemble the agency’s Space Launch System (SLS) rocket for Artemis missions to the Moon and beyond to Mars. Artemis I – the first launch under the agency’s Artemis Program – will test SLS and Orion as an integrated system prior to crewed flights to the Moon.
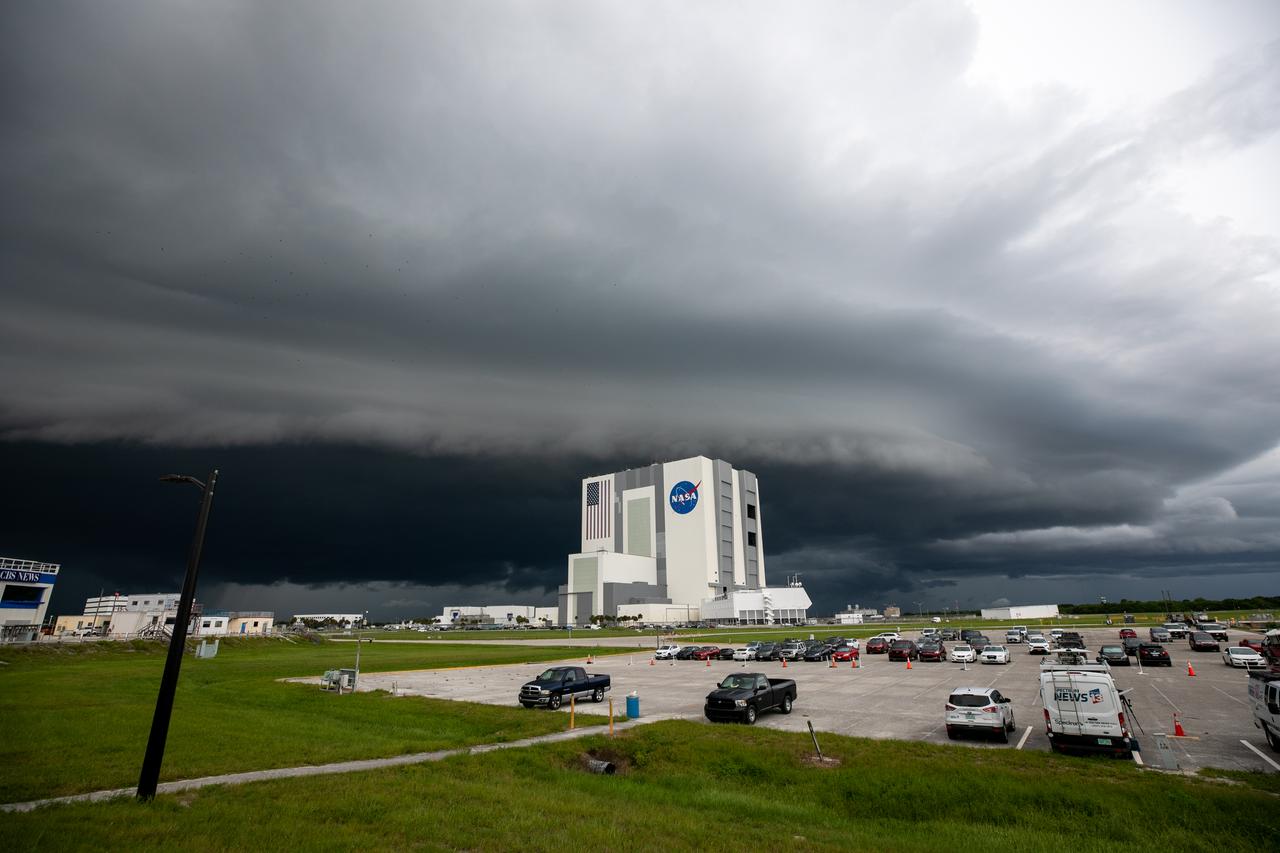
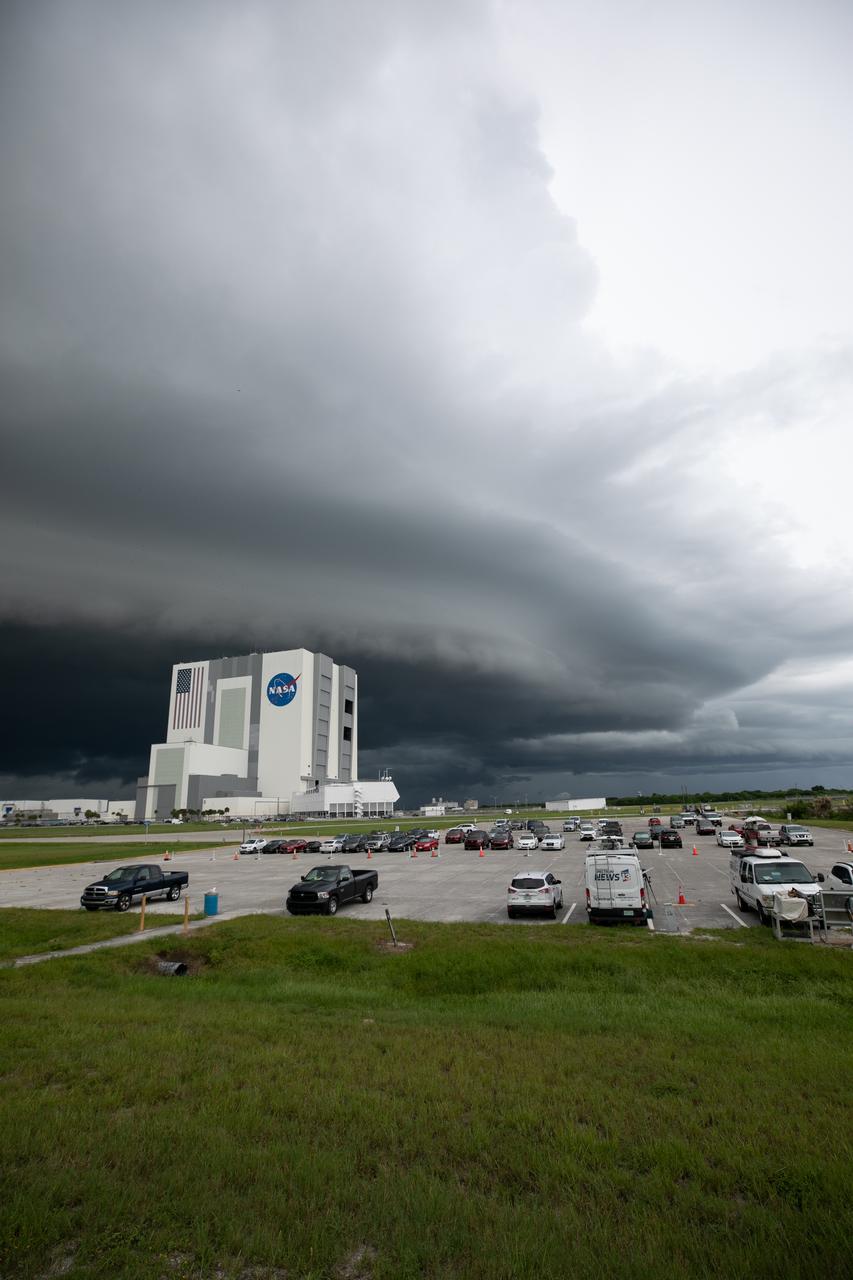
Storm clouds roll in over the Vehicle Assembly Building (VAB) at NASA’s Kennedy Space Center in Florida on July 28, 2020. Standing at 525 feet tall, this iconic landmark at Kennedy is capable of hosting multiple varieties of rockets and spacecraft at the same time. Currently, the VAB is being utilized to process and assemble the agency’s Space Launch System (SLS) rocket for Artemis missions to the Moon and beyond to Mars. Artemis I – the first launch under the agency’s Artemis Program – will test SLS and Orion as an integrated system prior to crewed flights to the Moon.
Storm clouds roll in over the Vehicle Assembly Building (VAB) at NASA’s Kennedy Space Center in Florida on July 28, 2020. Standing at 525 feet tall, this iconic landmark at Kennedy is capable of hosting multiple varieties of rockets and spacecraft at the same time. Currently, the VAB is being utilized to process and assemble the agency’s Space Launch System (SLS) rocket for Artemis missions to the Moon and beyond to Mars. Artemis I – the first launch under the agency’s Artemis Program – will test SLS and Orion as an integrated system prior to crewed flights to the Moon.
From NASA Kennedy Space Center’s Press Site lawn near the iconic countdown clock, storm clouds can be seen rolling in over the Vehicle Assembly Building (VAB) on July 28, 2020. Standing at 525 feet tall, this facility is capable of hosting multiple varieties of rockets and spacecraft at the same time. Currently, the VAB is being utilized to process and assemble the agency’s Space Launch System (SLS) rocket for Artemis missions to the Moon and beyond to Mars. Artemis I – the first launch under the agency’s Artemis Program – will test SLS and Orion as an integrated system prior to crewed flights to the Moon.
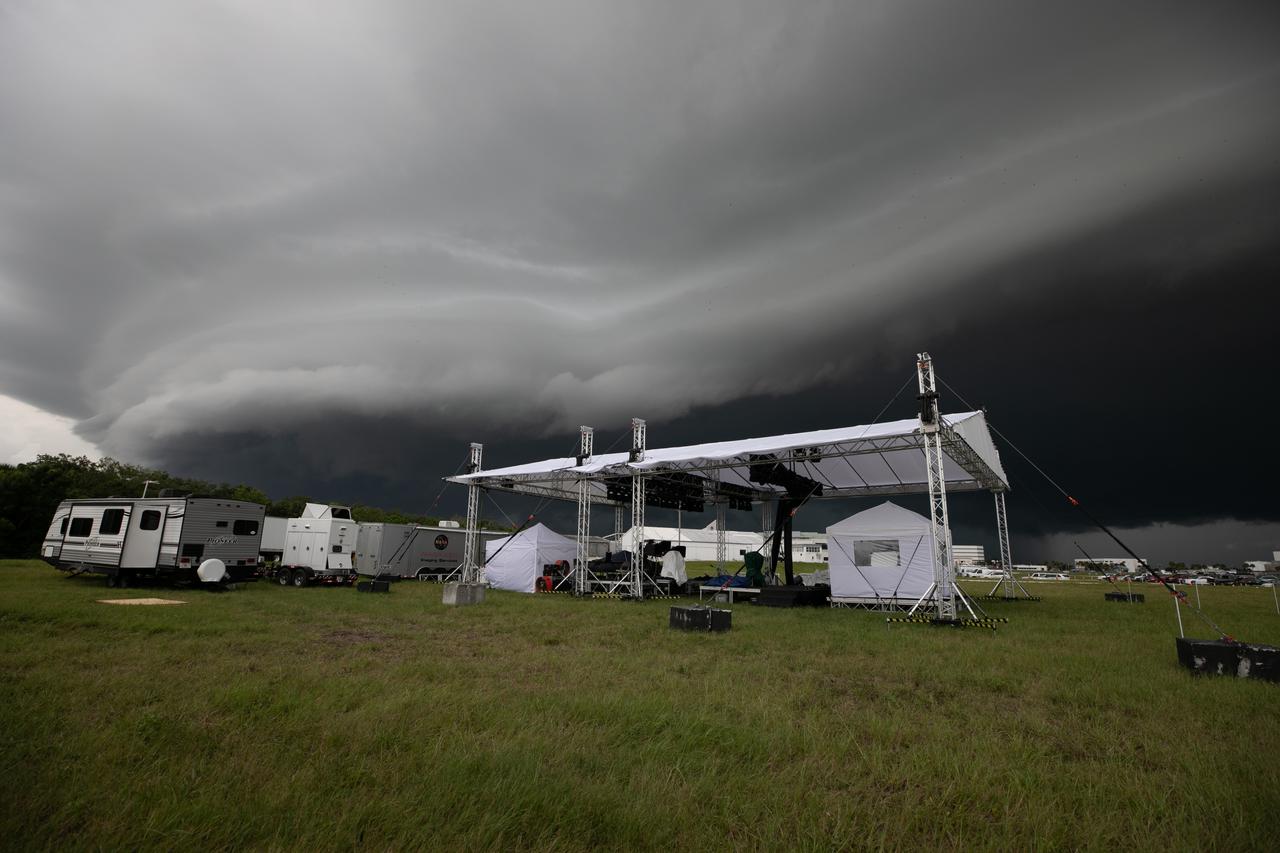
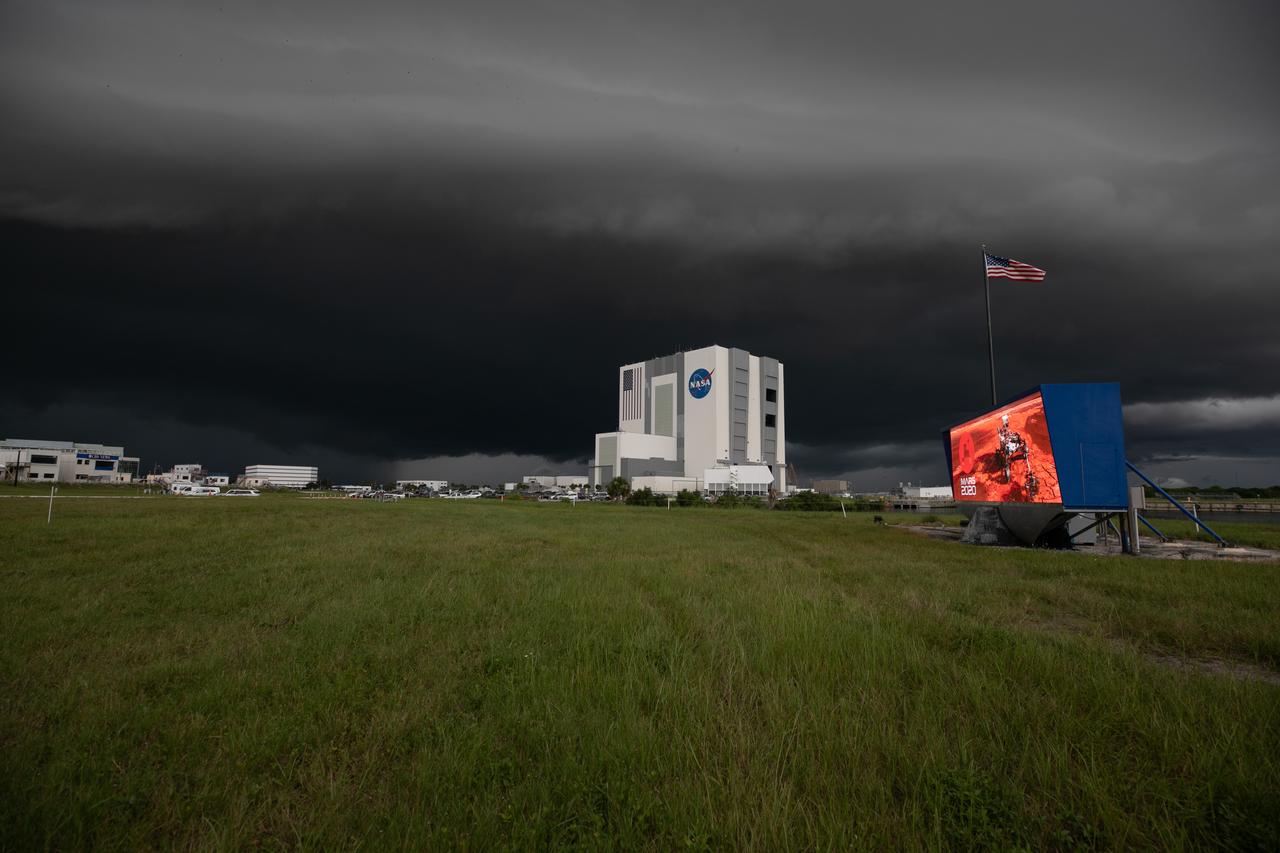
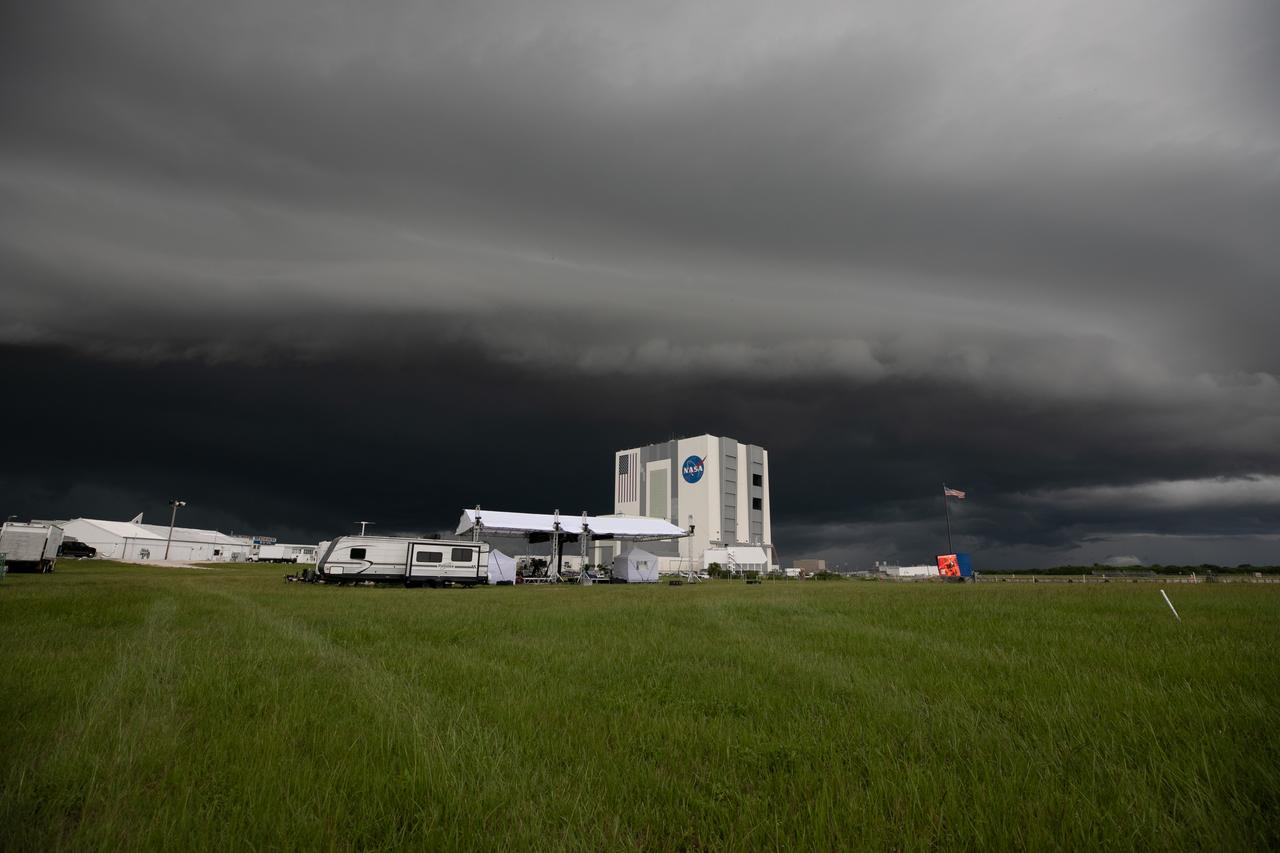
On July 28, 2020, storm clouds roll in over the Press Site lawn, where an exterior host set is being constructed in preparation for NASA’s Mars 2020 launch broadcast at the agency’s Kennedy Space Center in Florida. The United Launch Alliance Atlas V 541 rocket, with the Mars Perseverance rover aboard, lifted off from nearby Cape Canaveral Air Force Station’s Space Launch Complex 41 on July 30 at 7:50 a.m. EDT. Once it arrives at the Red Planet, the rover will search for signs of ancient microbial life on Mars.
Storm clouds roll in over the Vehicle Assembly Building (VAB) at NASA’s Kennedy Space Center in Florida on July 28, 2020. Standing at 525 feet tall, this iconic landmark at Kennedy is capable of hosting multiple varieties of rockets and spacecraft at the same time. Currently, the VAB is being utilized to process and assemble the agency’s Space Launch System (SLS) rocket for Artemis missions to the Moon and beyond to Mars. Artemis I – the first launch under the agency’s Artemis Program – will test SLS and Orion as an integrated system prior to crewed flights to the Moon.
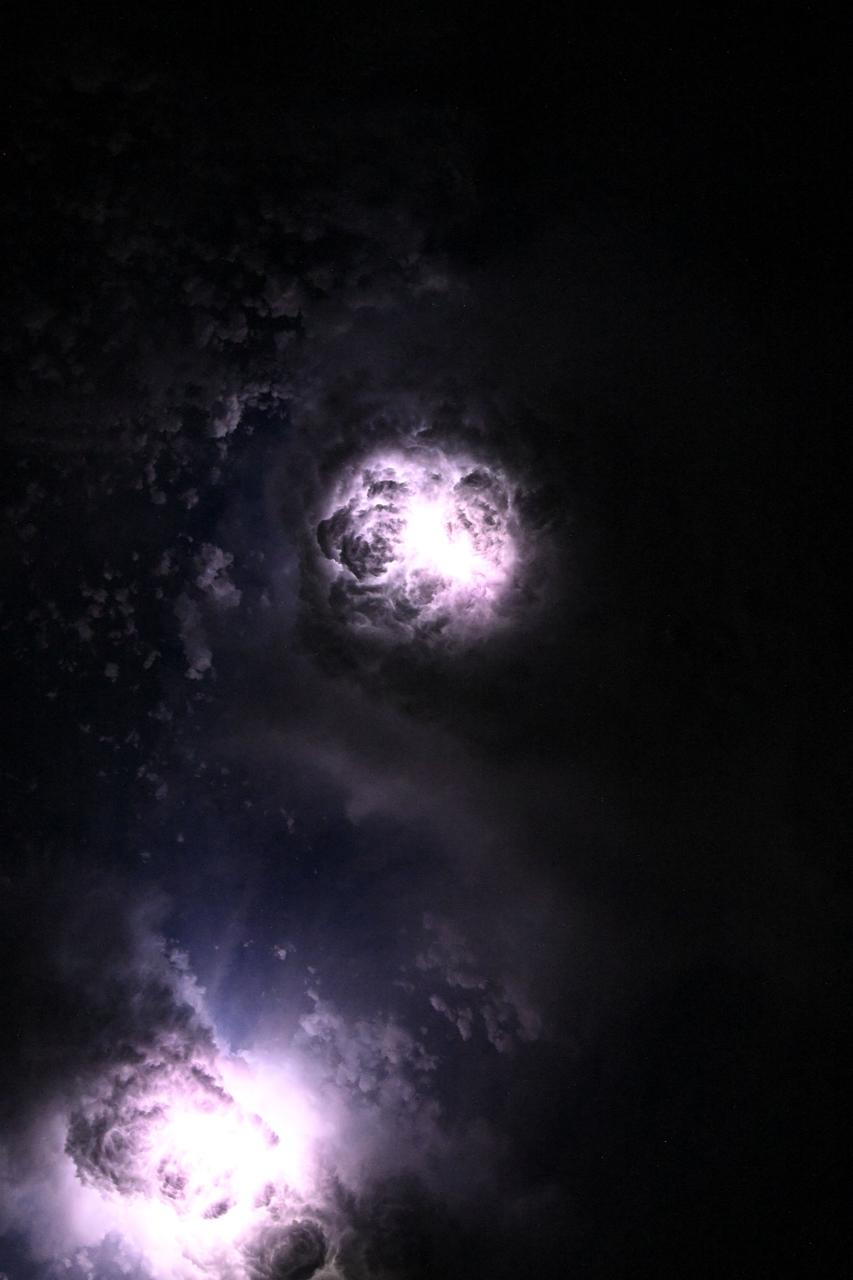
iss073e0332020 (June 20, 2025) --- Lightning illuminates the cloud tops of Tropical Storm Erick as it stormed across the Pacific coast of central Mexico at approximately 3:42 a.m. local time as the International Space Station orbited 258 miles above.
iss073e0330134 (June 20, 2025) --- Lightning illuminates the cloud tops of Tropical Storm Erick as it stormed across the Pacific coast of central Mexico at approximately 3:38 a.m. local time as the International Space Station orbited 258 miles above.
iss073e0330560 (June 20, 2025) --- Lightning illuminates the cloud tops of Tropical Storm Erick as it stormed across the Pacific coast of central Mexico at approximately 3:39 a.m. local time as the International Space Station orbited 258 miles above.
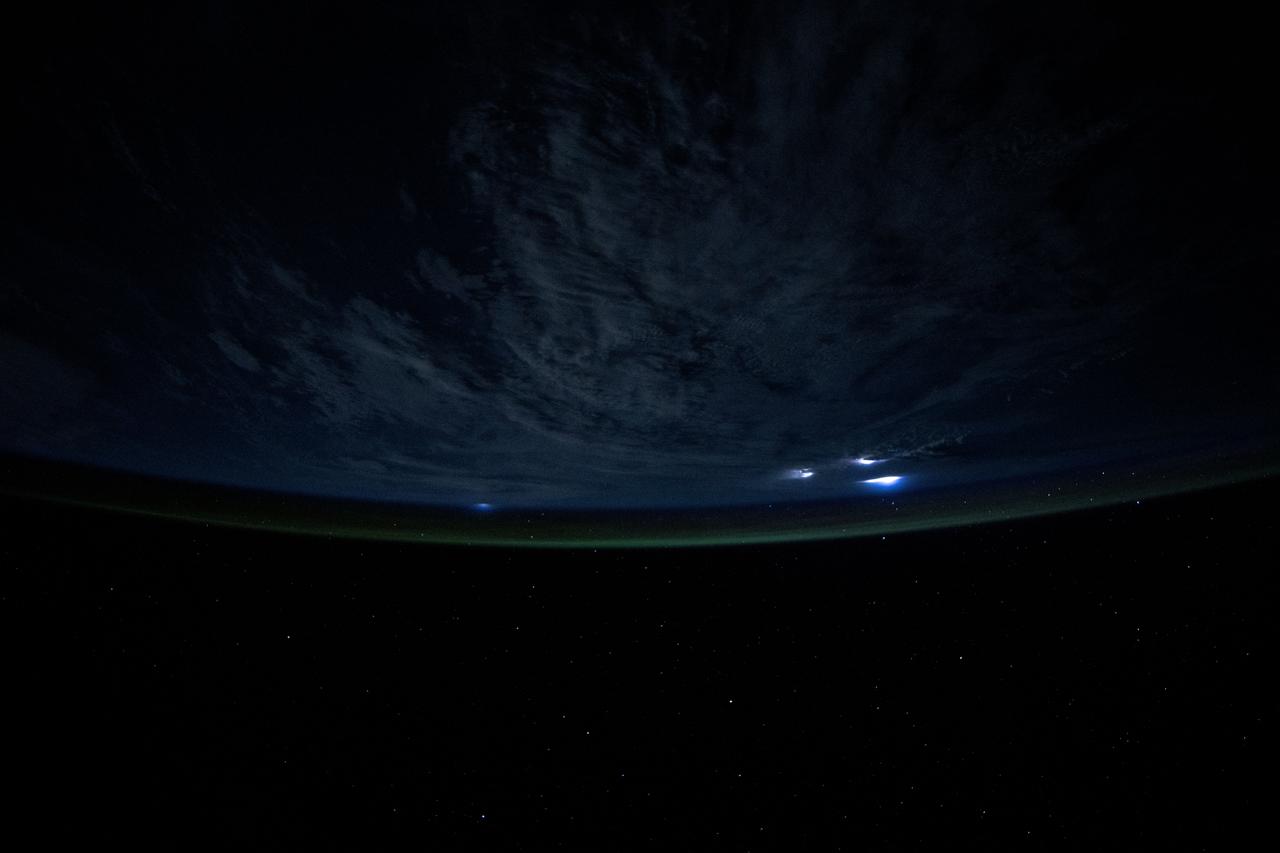
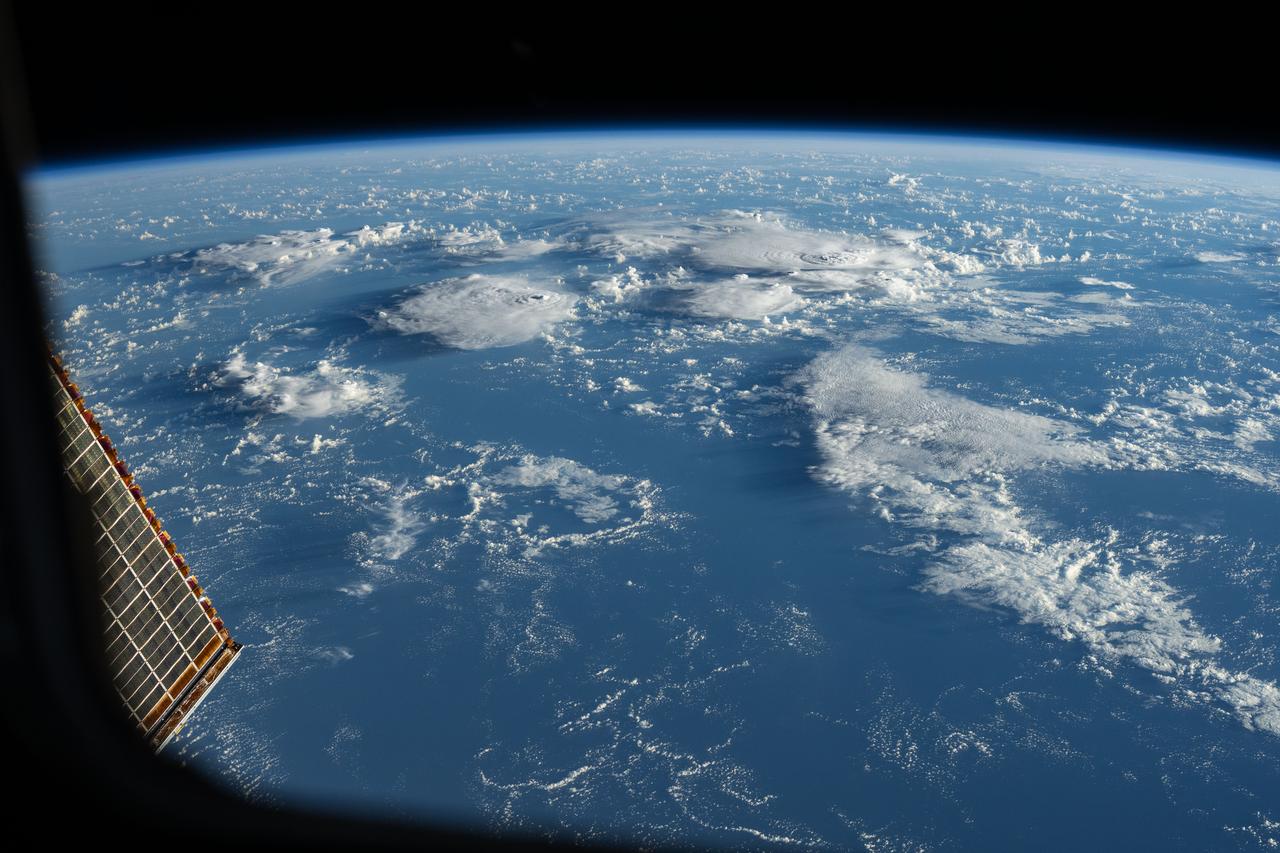
iss073e0111251 (May 18, 2025) --- Lightining illuminates the cloud tops during a storm underneath Earth's atmospheric glow in this photograph from the International Space Station as it orbited 259 miles above the Atlantic Ocean east of the Bahamas.
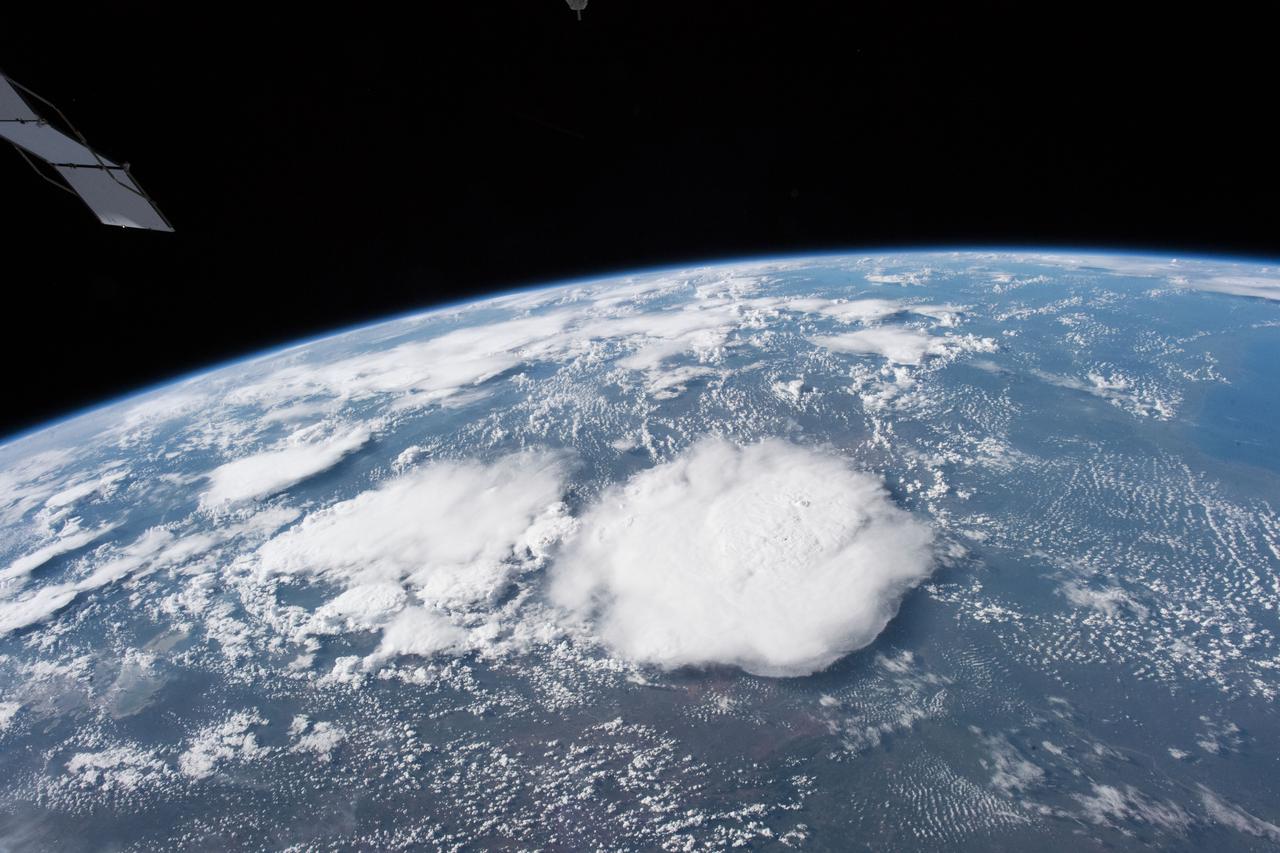
ISS01-E-5011 (November 2000) --- A mass of storm clouds was captured with an electronic still camera (ESC) from the International Space Station (ISS) by the Expedition One crew members. The picture was the first Earth observation still image downlinked by the three-man crew.
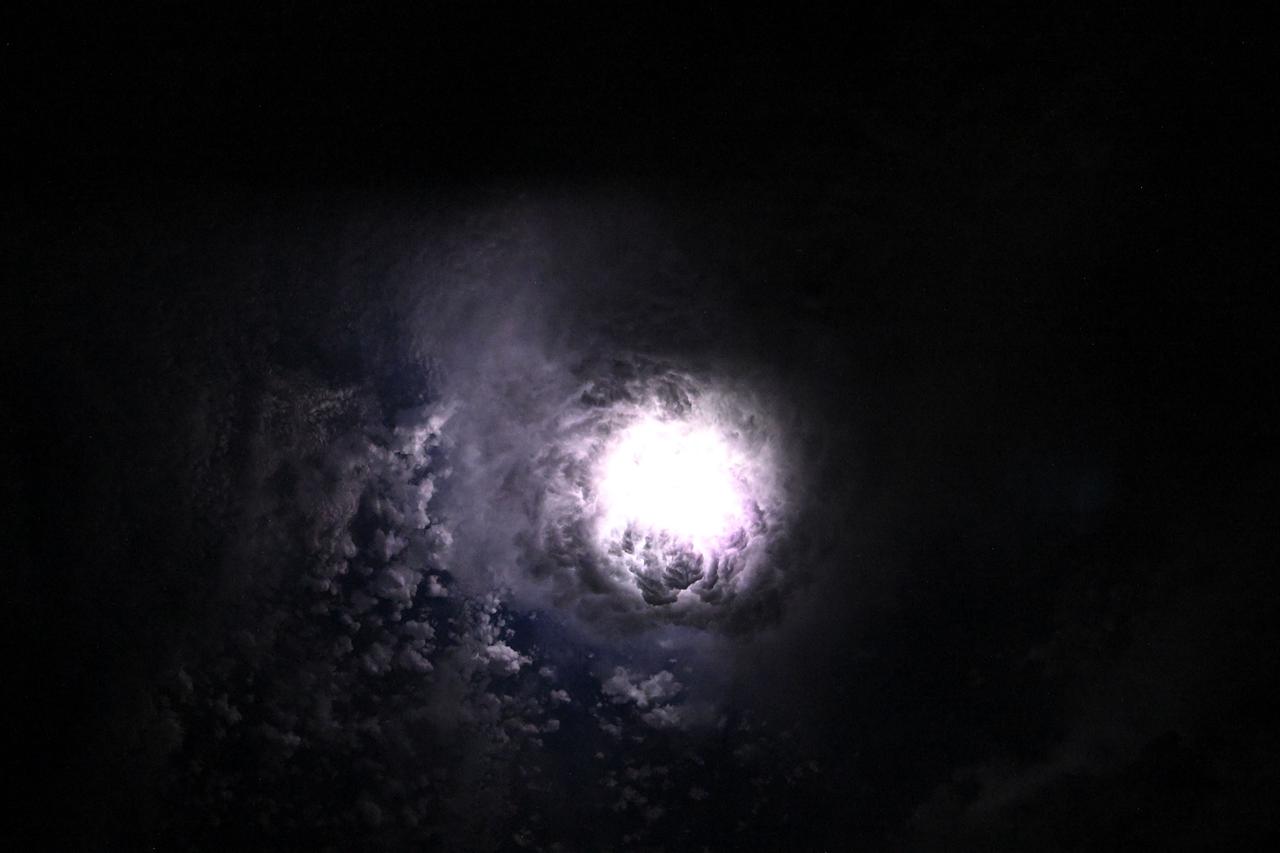
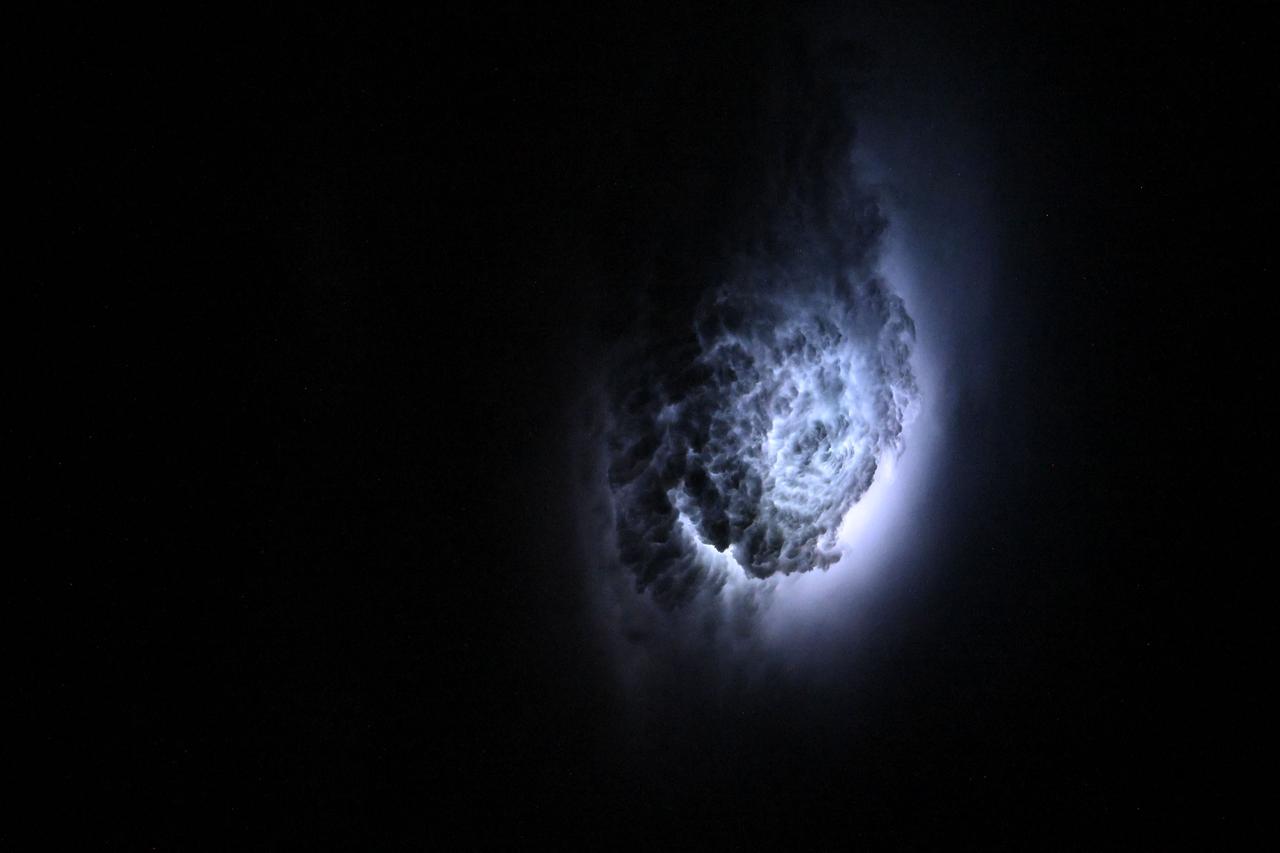
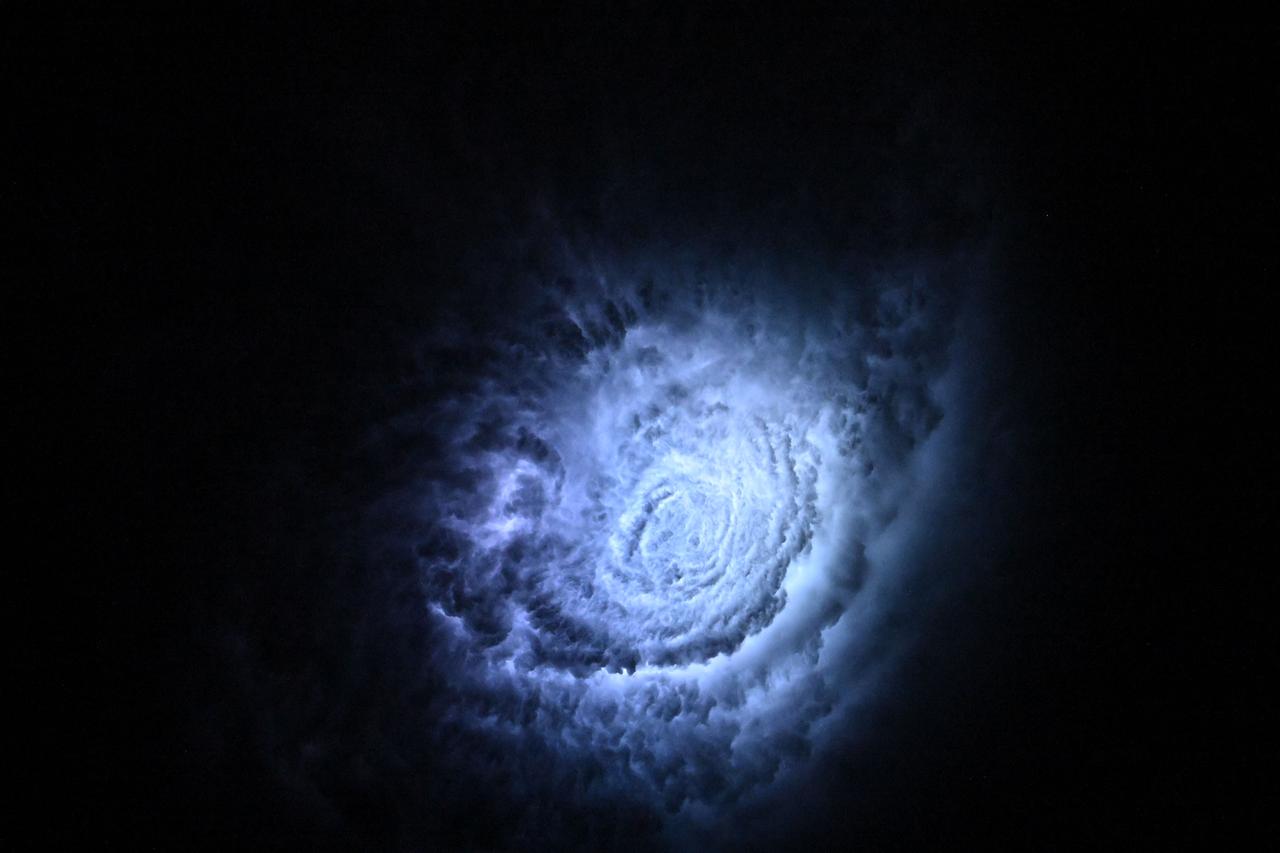
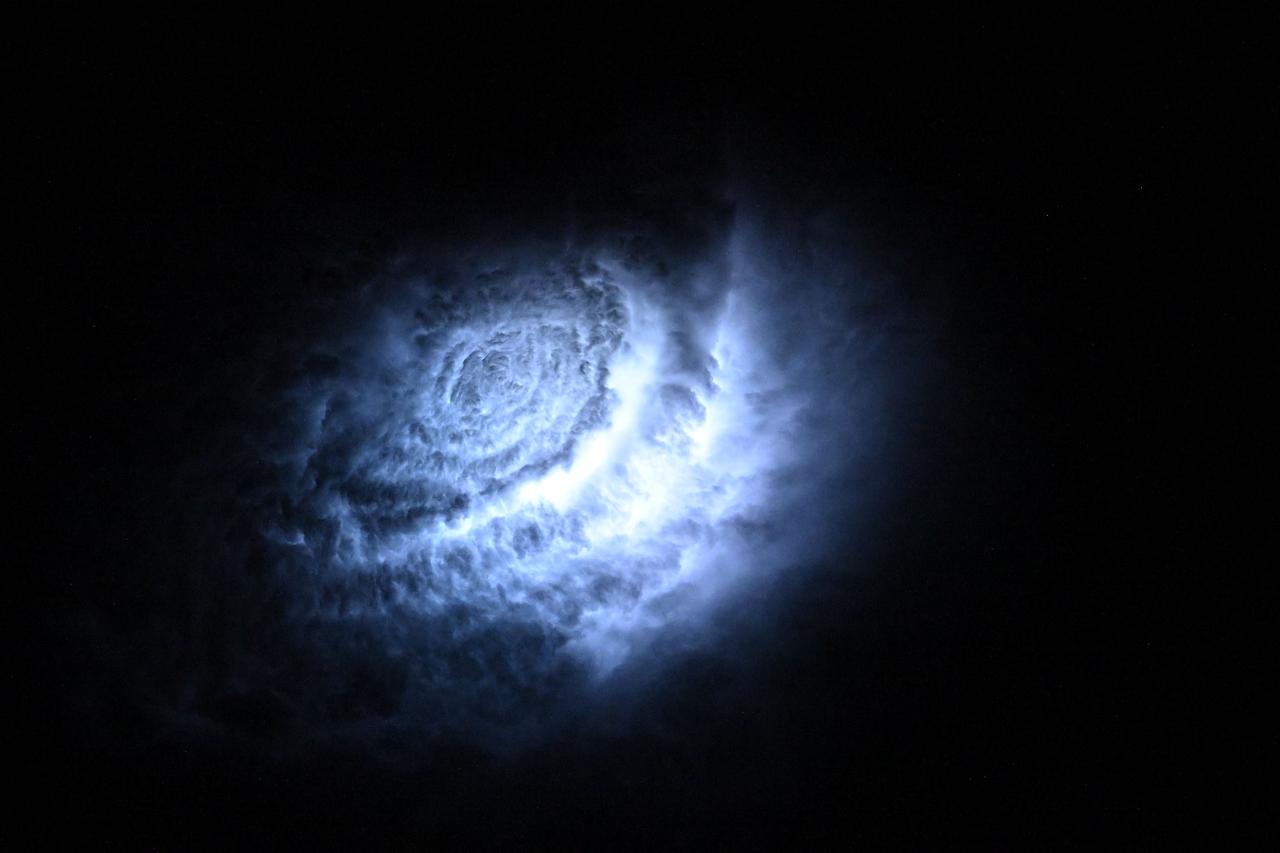
iss073e0080280 (May 15, 2025) --- This nebula-like formation is actually lightning illuminating the clouds during a storm off the coast of North Carolina in this photograph from the International Space Station as it orbited 260 miles above the Atlantic Ocean.
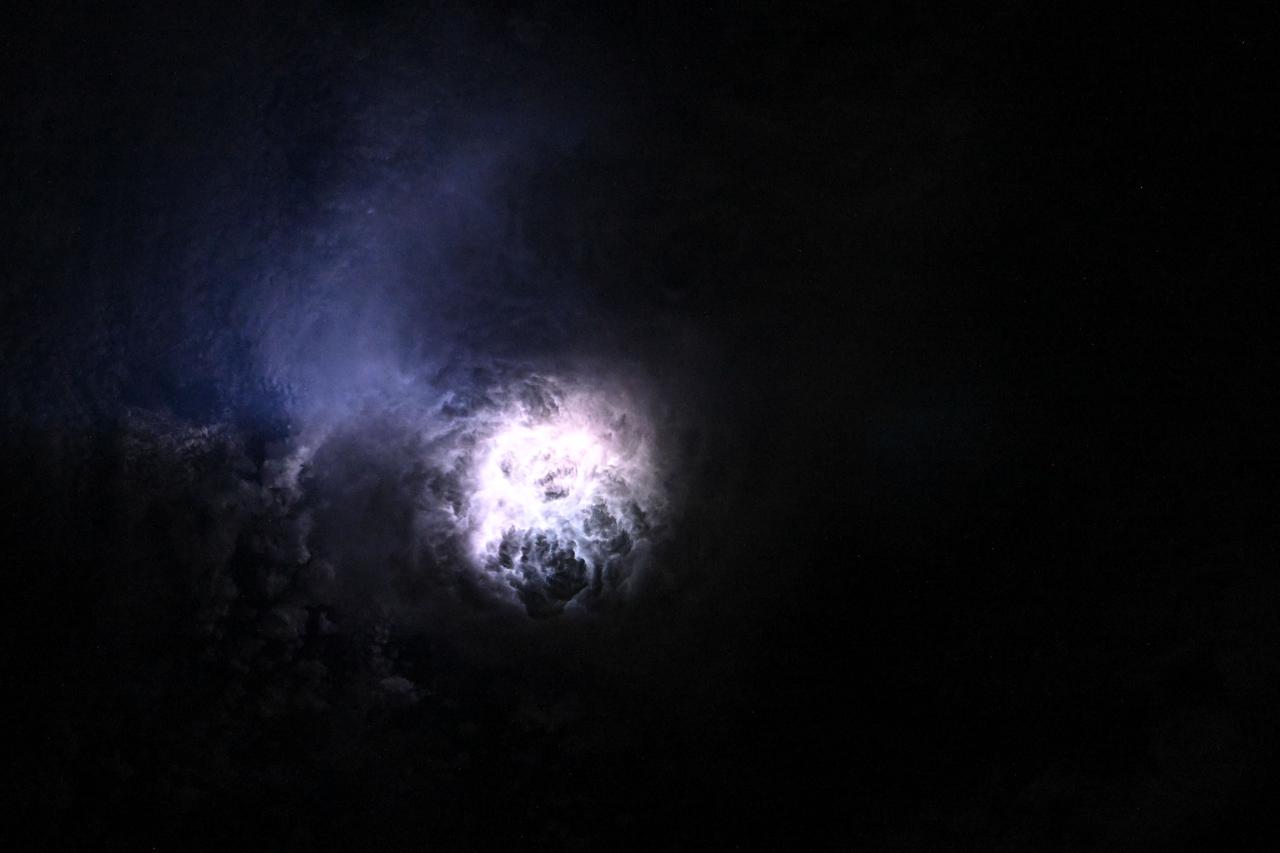
iss073e0080625 (May 15, 2025) --- This nebula-like formation is actually lightning illuminating the clouds during a storm off the coast of North Carolina in this photograph from the International Space Station as it orbited 260 miles above the Atlantic Ocean.
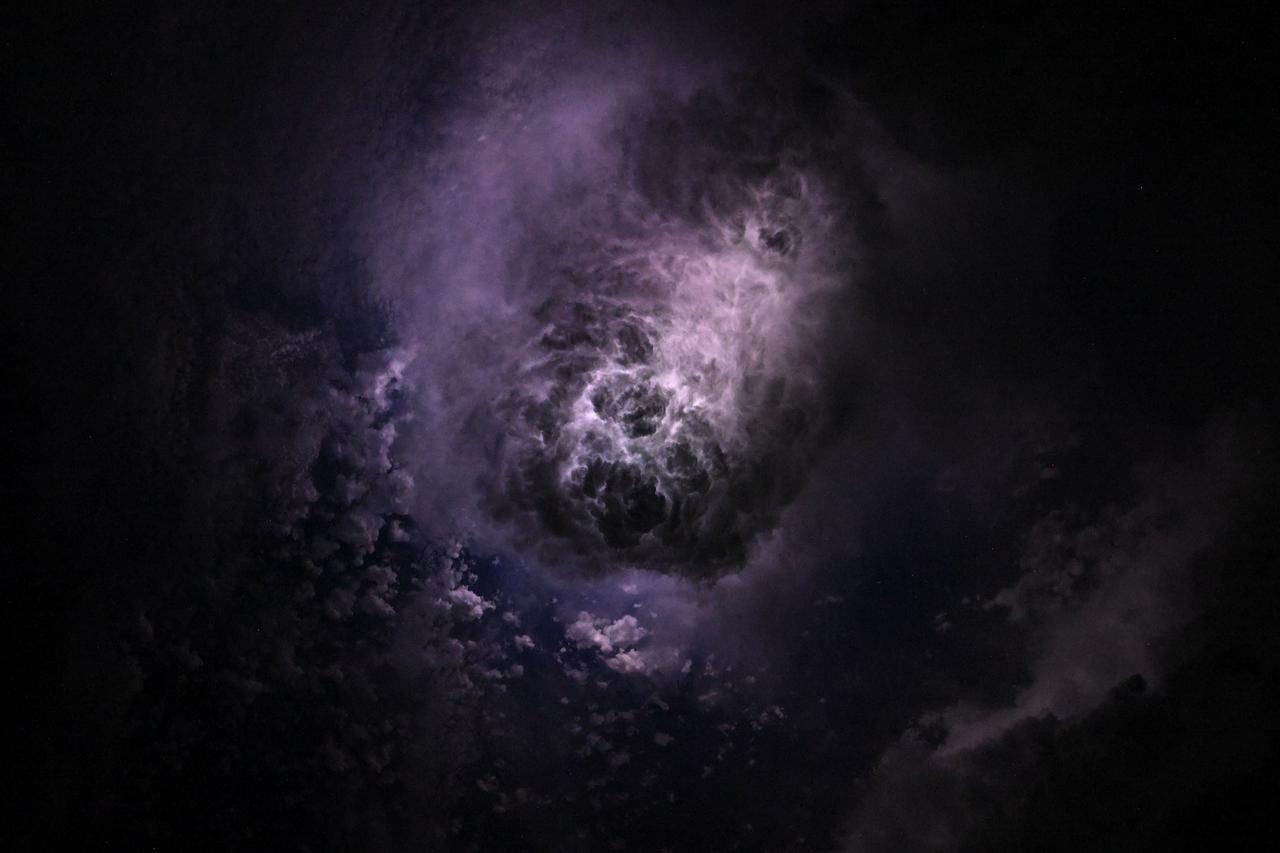
iss073e0080327 (May 15, 2025) --- This nebula-like formation is actually lightning illuminating the clouds during a storm off the coast of North Carolina in this photograph from the International Space Station as it orbited 260 miles above the Atlantic Ocean.
iss072e617674 (Feb. 1, 2025) --- Storm clouds rise above the South Pacific Ocean northwest of New Zealand in this photograph from the International Space Station as it orbited 264 miles above.
iss073e0081060 (May 15, 2025) --- This nebula-like formation is actually lightning illuminating the clouds during a storm off the coast of North Carolina in this photograph from the International Space Station as it orbited 260 miles above the Atlantic Ocean.
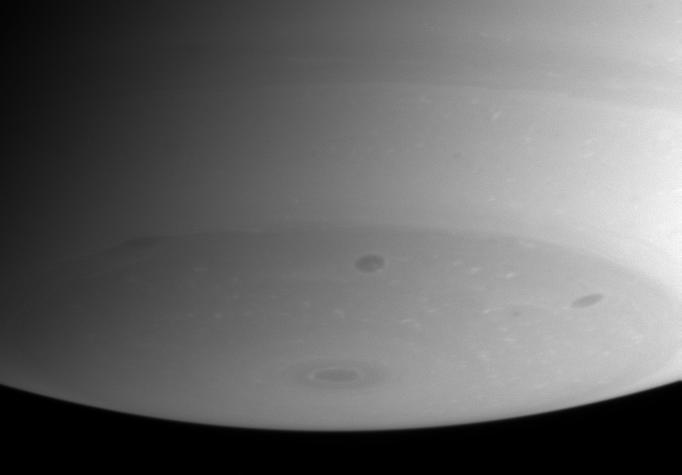
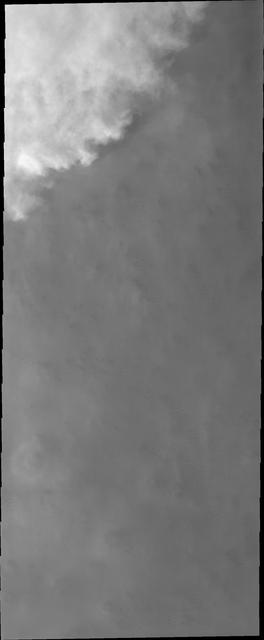
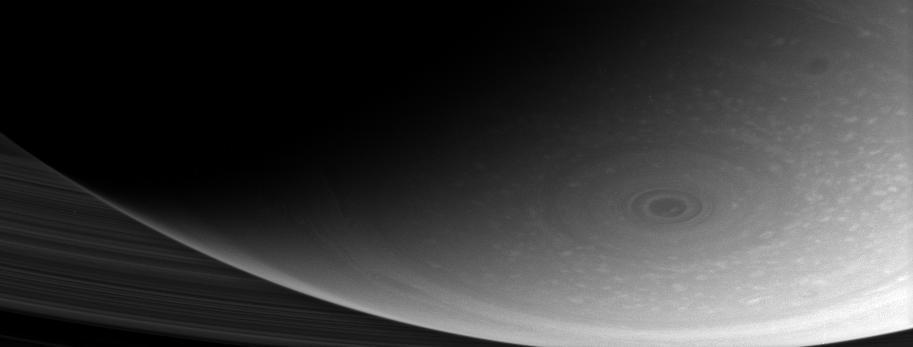
These clouds hide the south polar region. This storm occurred during late summer
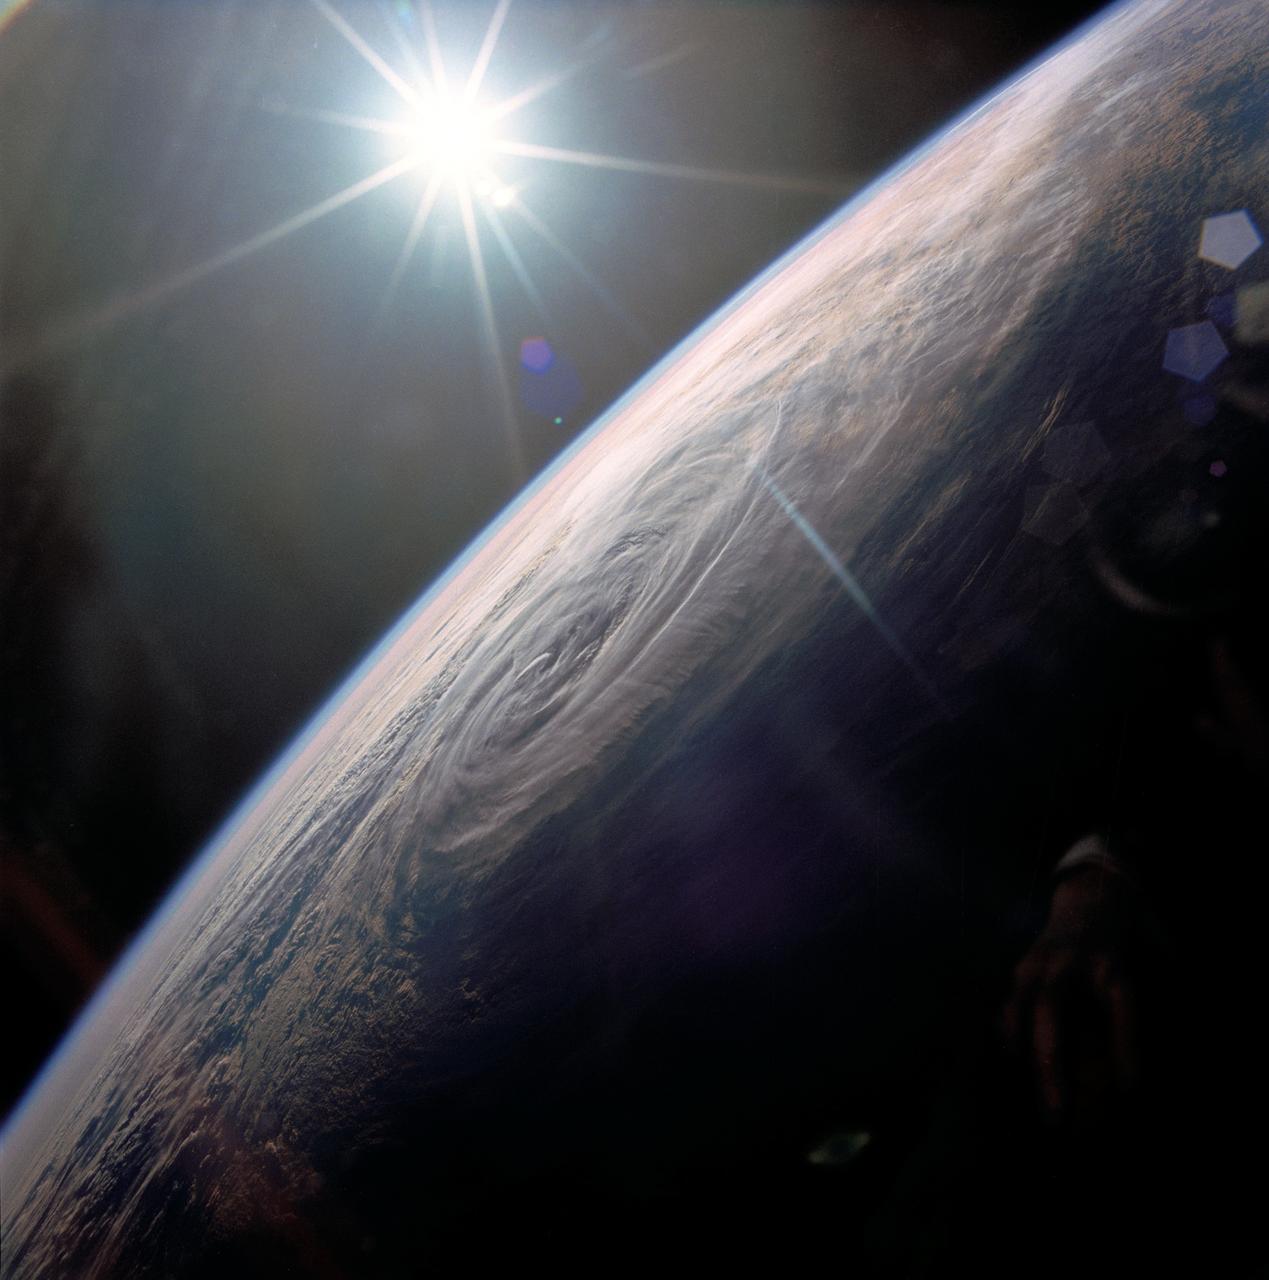
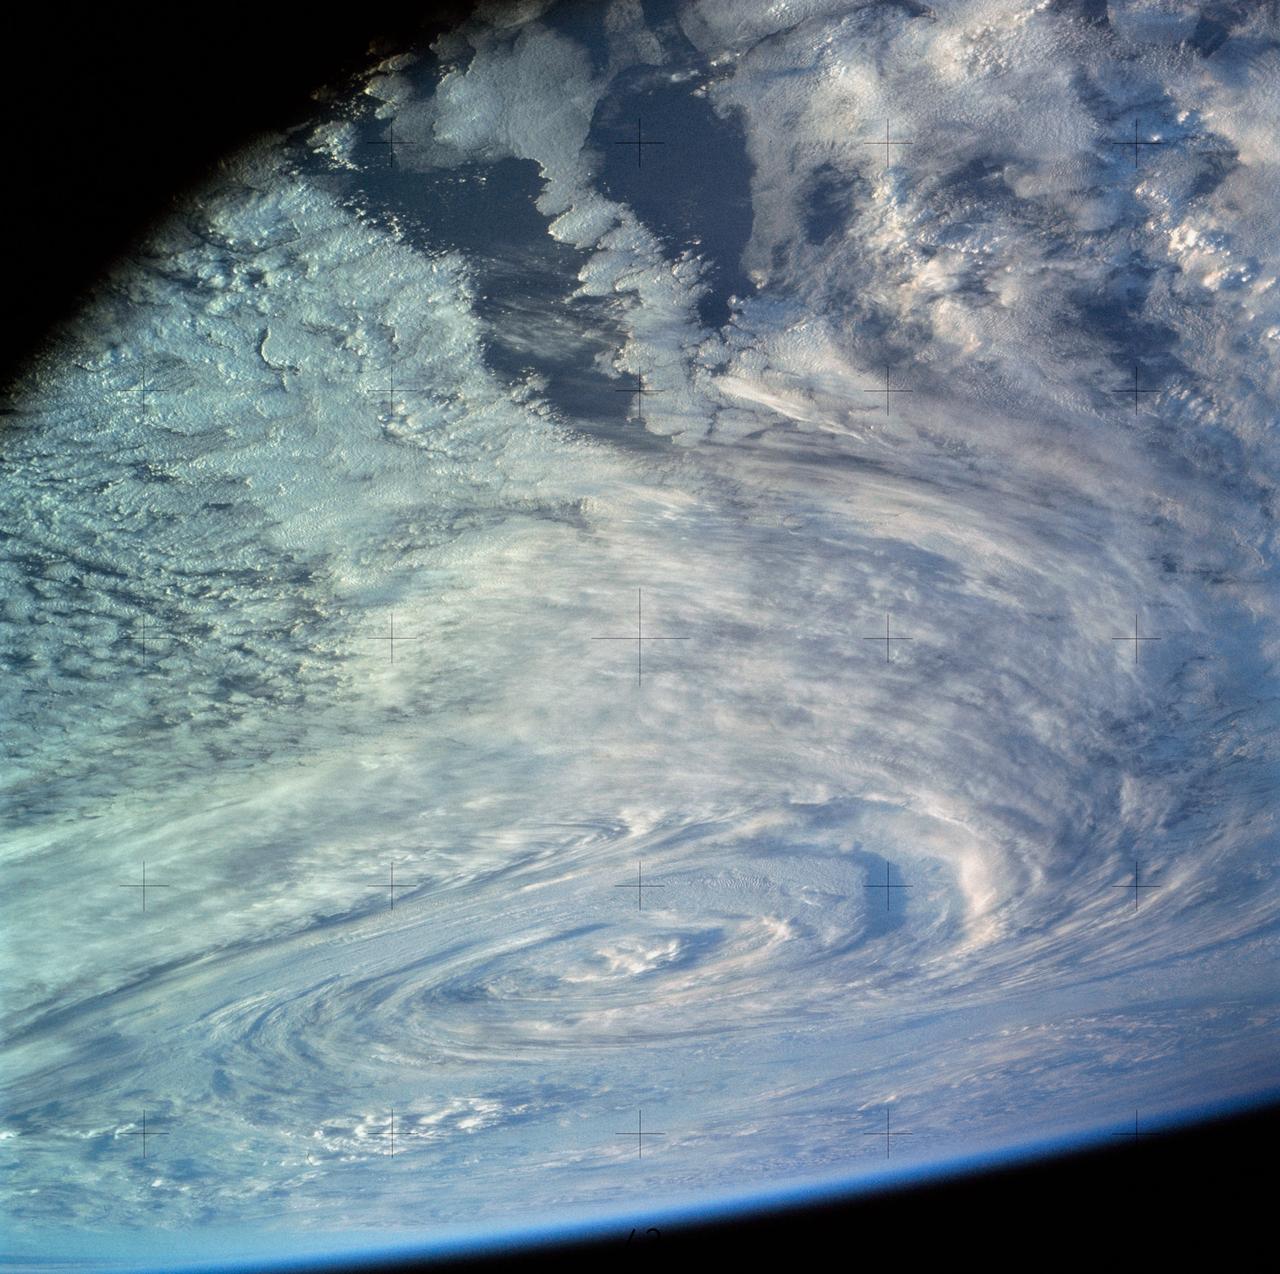
STS032-80-036 (9-20 Jan. 1990) --- This oblique view of Tropical Storm Sam in the eastern Indian Ocean off the western coast of Australia was photographed with a 70mm camera by the astronauts. Tropical Storm Sam (known as Willy-Willy in Australia) was born in the eastern Indian Ocean near the islands of Timor and Sumba in Indonesia. The storm tracked southwestward attaining sustained winds in excess of 60 knots (70 miles per hour). Other than on Christmas Island and the Cocos (Keeling) Islands south of Java, and for strong swells along the western Australia coast, the storm had little impact on land areas. At the time this photograph was taken, the storm was beginning to dissipate in the south Indian Ocean. The eye of the storm is still visible near center, with the swirling bands of the storm propagating in a clockwise direction toward the center. Winds aloft have begun to shear the tops of thunderstorms associated with the storm, forming a high cirrus cloud cover over the center portions of the storm. This picture was used by the crew at their January 30, 1990 Post-Flight Press Conference (PFPC).

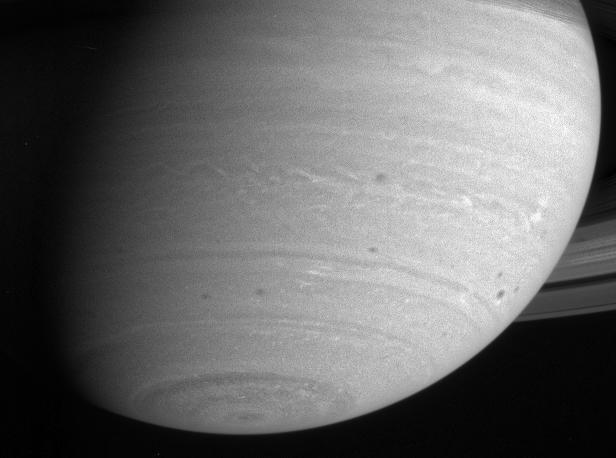
This frame from an animation from NASA Cassini spacecraft shows the swirling clouds in a vortex spawned by a great northern storm on Saturn. The clouds are moving in a clockwise direction.
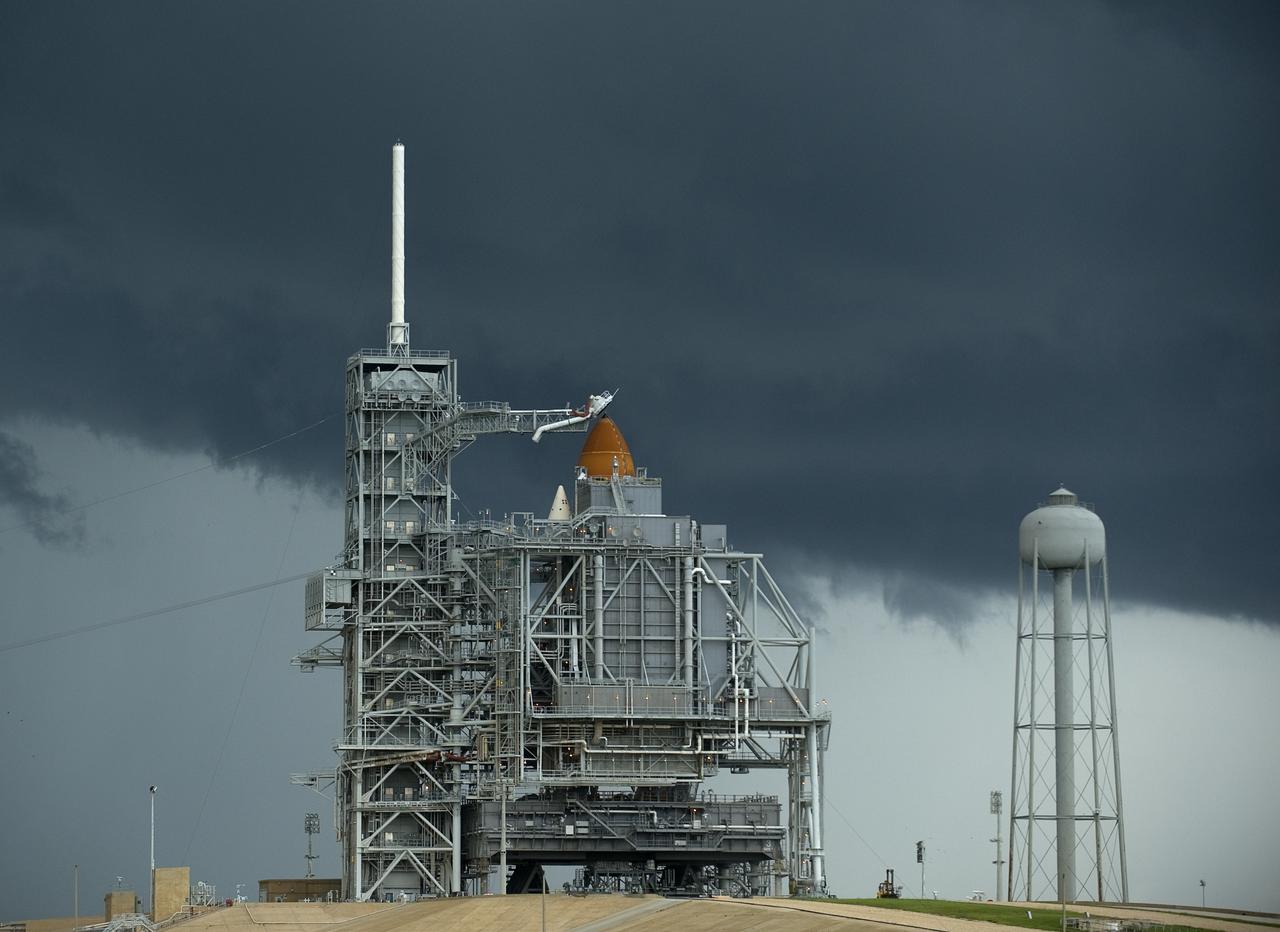
Storm clouds approach Launch Pad 39A at NASA's Kennedy Space Center in Florida on Friday, July 10, 2009 as space shuttle Endeavour stands awaiting Saturday's planned launch of the STS-127 mission. Photo Credit: (NASA/Bill Ingalls)
Storm clouds approach Launch Pad 39A at NASA's Kennedy Space Center in Florida on Friday, July 10, 2009 as space shuttle Endeavour stands awaiting Saturday's planned launch of the STS-127 mission. Photo Credit: (NASA/Bill Ingalls)
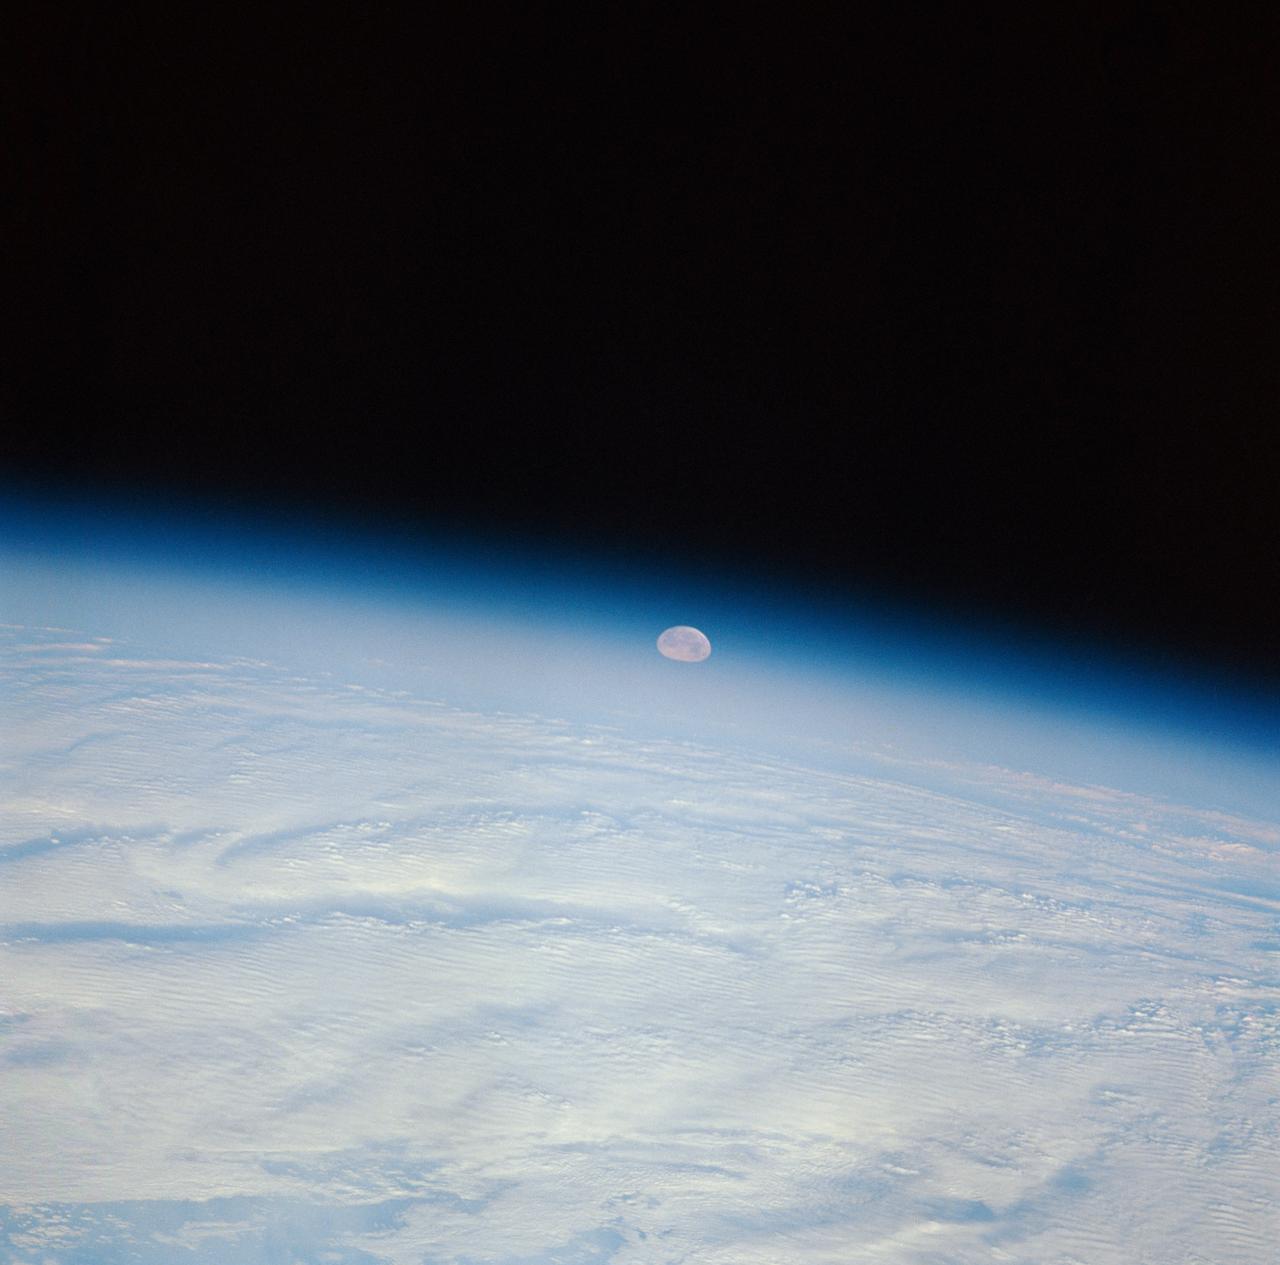
STS-32 crew took this view of the moon setting over the Earth's limb. Near the center is a semi-vortex in the clouds - a storm system in the early stages of formation. The moon's image is distorted due to refraction through the Earth's atmosphere. The near side of the moon is visible showing the vast area of the moon's western seas (Mare Occidental), Apollo landing sites: Apollo 14 at Fra Mauro and Apollo 16 at Central Highlands near Descartes.
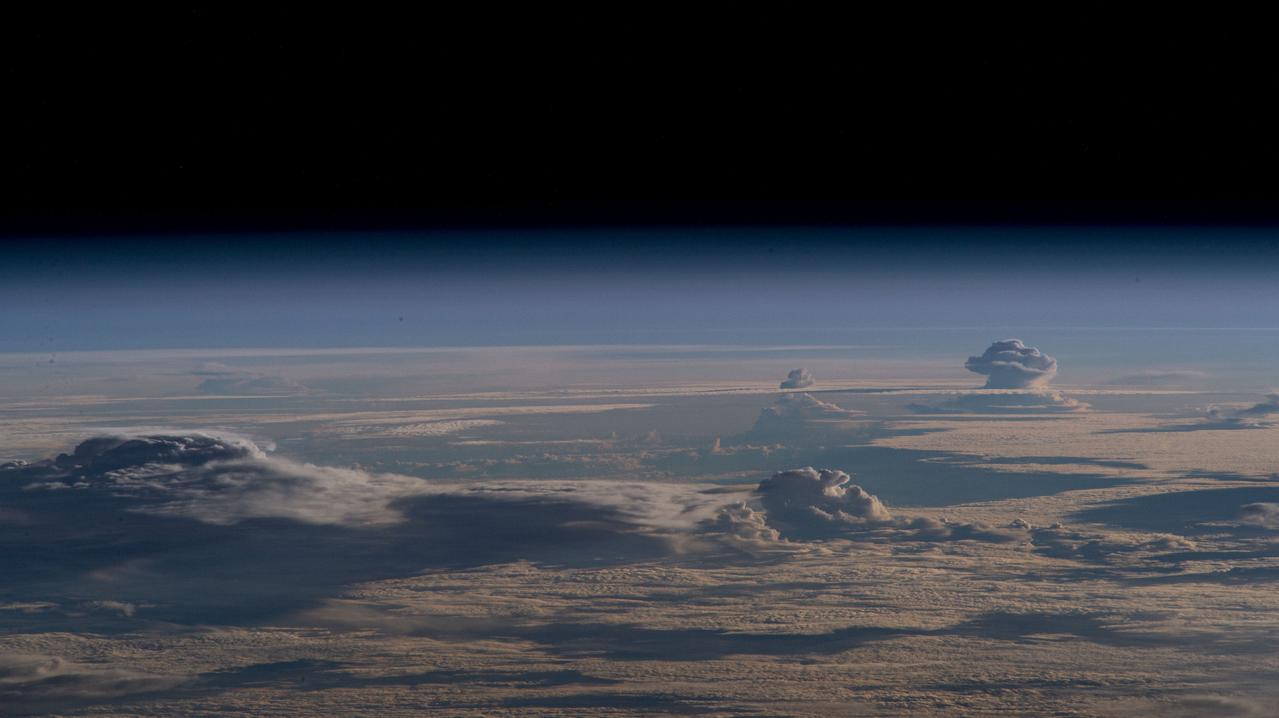
SL4-137-3566 (12 Dec. 1973) --- A group of clouds near New Zealand, as photographed from the Skylab space station in Earth orbit by one of the Skylab 4 crew members. The camera used was a hand-held 70mm Hasselblad with SO-368 medium speed Ektachrome. This picture shows vividly how low sun angles enhance relief, giving these clouds a three-dimensional appearance. In addition to being "pretty," this photograph can be used to study the line of storms seen here at sunset. Relative heights of individuals cells can be measured, as well as their relation to the surrounding clouds. Photo credit: NASA
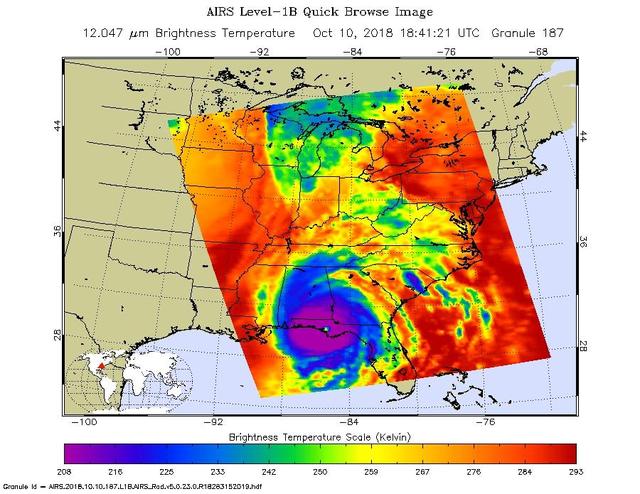
This image from NASA's Atmospheric Infrared Sounder (AIRS) shows the temperature of clouds or the surface in and around Hurricane Michael as the storm made landfall in the Florida panhandle on Wed, Oct 10, 2018. The large purple area indicates very cold clouds carried high into the atmosphere by deep thunderstorms. These storm clouds are associated with heavy rainfall. The warmer eye of the hurricane, located at the center of the cold clouds, is shown in green. The red areas are mostly cloud-free areas, with the clear air caused by air motion outward from the cold clouds near the storm center then downward in the surrounding areas. Michael made landfall as a Category 4 storm with maximum sustained winds of 155 mph (250 kph). https://photojournal.jpl.nasa.gov/catalog/PIA22752
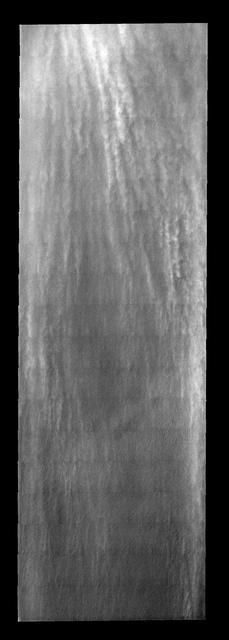
These linear clouds are just one of many storm fronts that occurred near the south pole during the late southern summer season
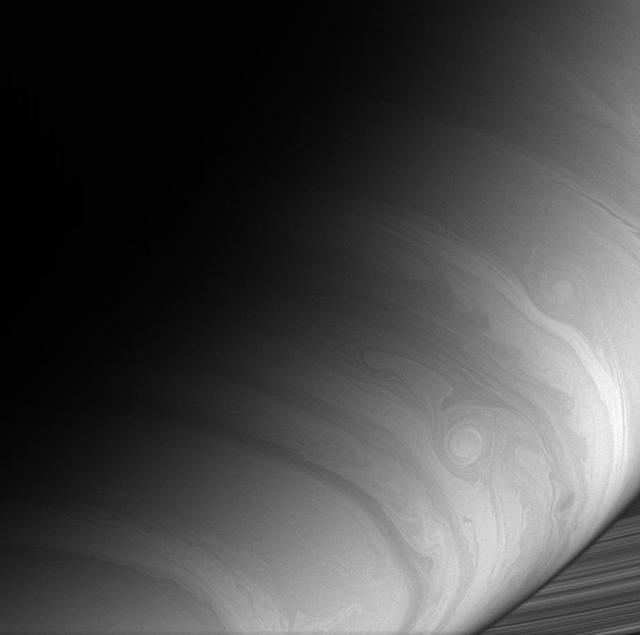
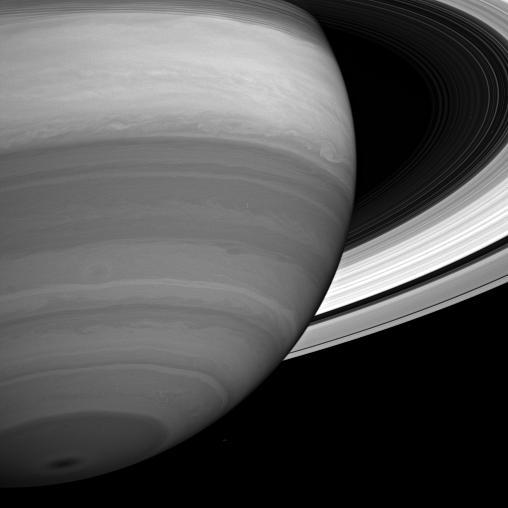
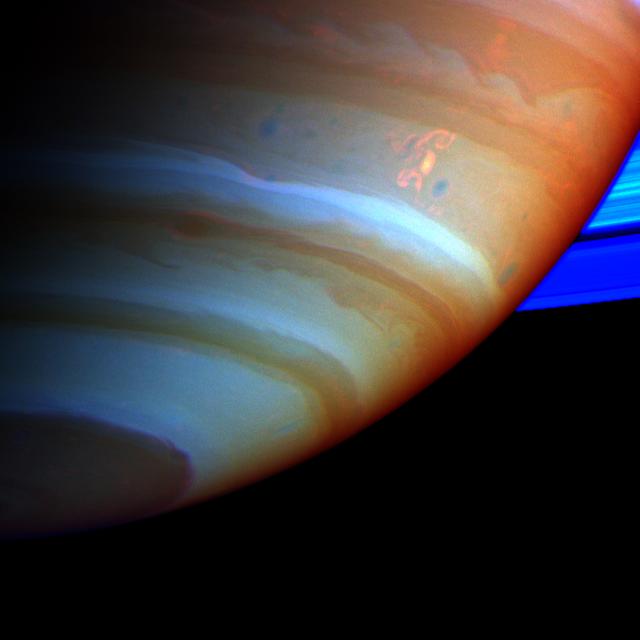
The Cassini spacecraft captures the ripples, loops and storms that swirl in Saturn east-west flowing cloud bands
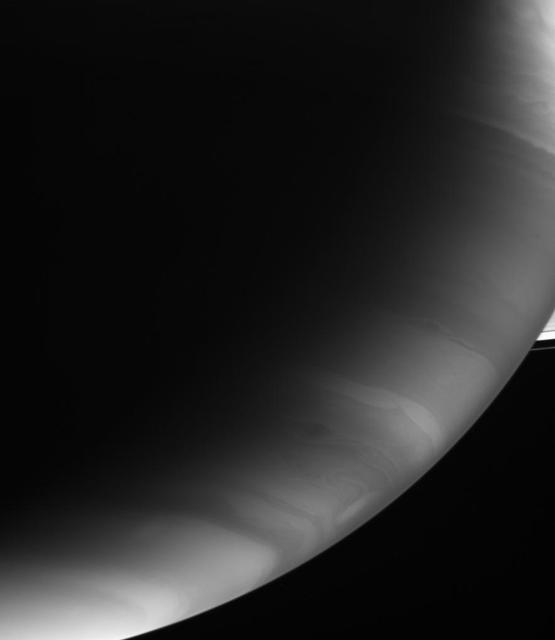
Storms and cloud bands emerge from beneath Saturn obscuring hazes in this infrared view
Storms whip up the cloud bands of Saturn southern hemisphere in this infrared view. Small fractions of the A and F rings are visible at right
These linear clouds are part of a large storm front that occurred near the south pole during late summer
Great, oval-shaped storms churn through Saturn clouds in this Cassini spacecraft view of southern latitudes
The bright features in this image captured by NASA Mars Odyssey are the tops of clouds north of Alba Mons.
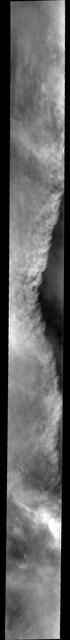
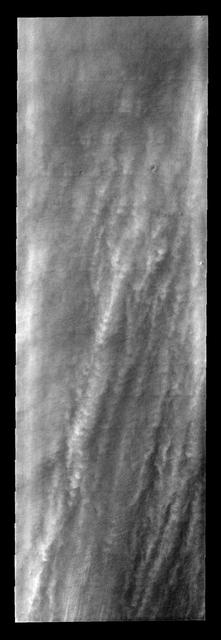
Spring time brings storms to the north polar region of Mars. This image captured by NASA 2001 Mars Odyssey spacecraft shows a storm front, as bright clouds shadow and obscure the surface.
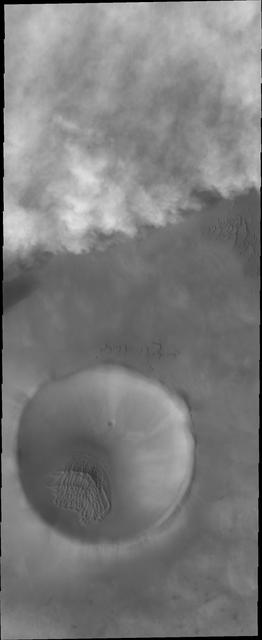
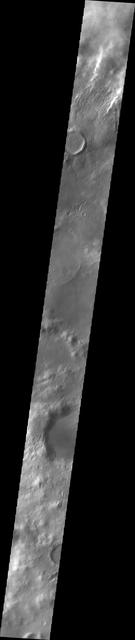
This image from NASA 2001 Mars Odyssey captures storm clouds that are moving towards the crater in the bottom of this image. Storms like this are common during the spring and early summer near the north pole.
This set of images from NASA Cassini spacecraft shows cloud patterns in a band around Saturn before a monstrous thunder-and-lightning storm erupted and again after the head of the storm had disappeared.
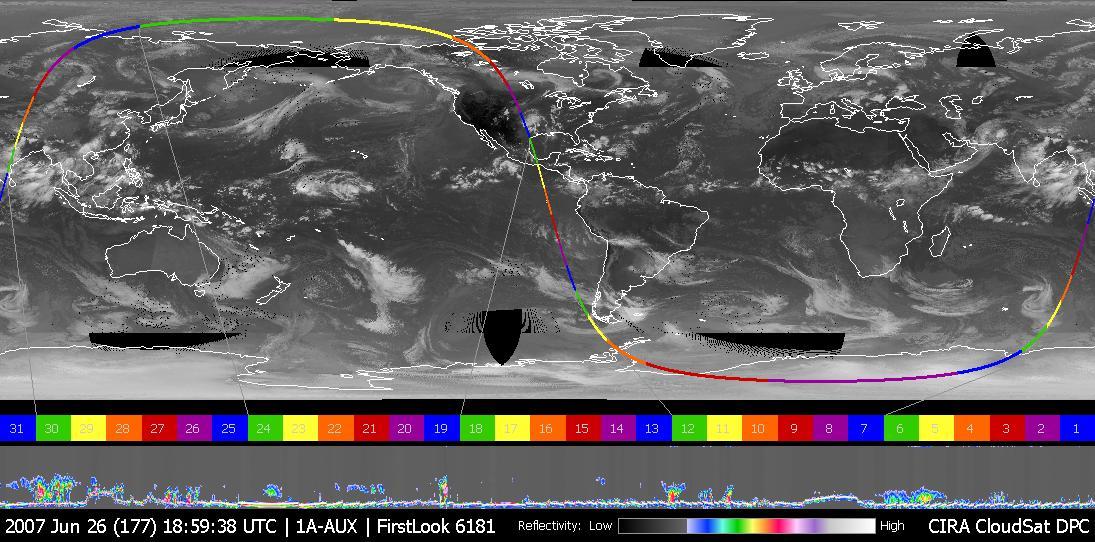
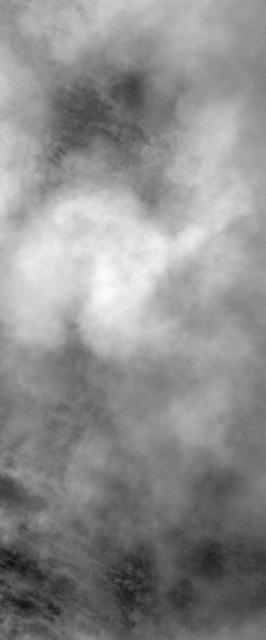
This image was taken on June 26, 2007, UTC 20:00. In this image an obvious storm hangs over the middle of the United States. Figure 1 shows NASA CloudSat data looking, in profile, at the cloud in this storm.
This MOC image shows billowing clouds of dust rising from a storm southeast of Hellas Planitia. The dust storm in this case obscured the Mars Orbiter Camera view of the martian surface
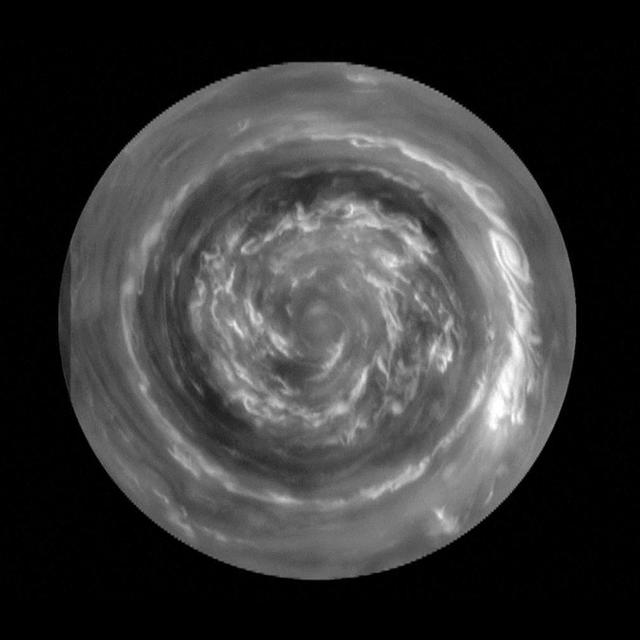
This image obtained by NASA Cassini spacecraft, shows the clouds of a hurricane-like storm, which circulate around the north pole of Saturn out to 88.5 degrees north latitude. The clouds at the very center are spinning rapidly.
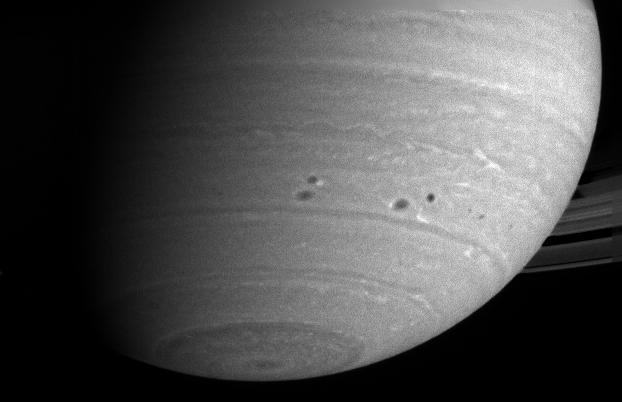
Two pairs of dark spots, or storms, in Saturn atmosphere squeeze past each other as they dance around the planet. In this group of four storms, the top left and lower right storms are fringed with white clouds as seen by NASA Cassini spacecraft.

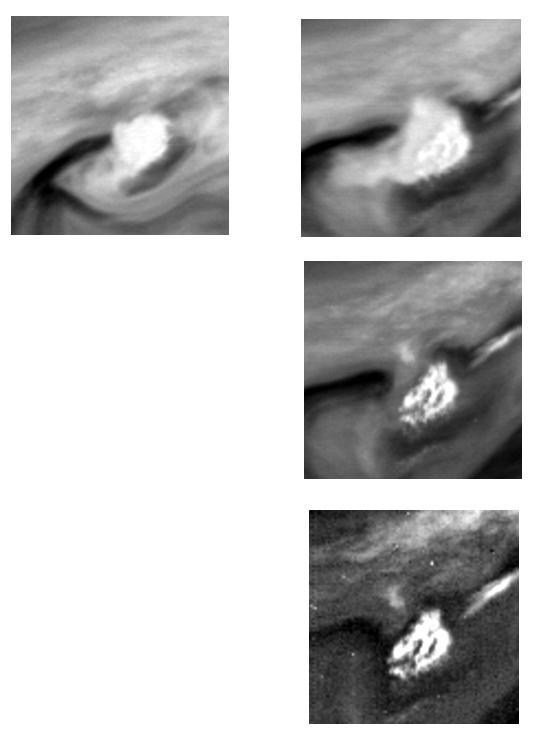
In this annotated, graphic of Jupiter, small, bright "pop-up" clouds rise above the surrounding features in this cyclonic Jovian storm system, dubbed the "Nautilus." The image at left, taken by the Hubble Space Telescope — which observed the storm — was taken on July 16, 2018. The Juno spacecraft's JunoCam captured the storm at higher resolution on July 16, 2018, during Juno's 13th science flyby of Jupiter. The image at right, a magnification of the JunoCam image, offers a closer view. Storms like these pop-up clouds are believed to be the tops of the extreme ammonia-water thunderclouds that produce "shallow lightning" and Jovian hailstones — or "mushballs" — high in Jupiter's atmosphere. The solar-powered Jupiter explorer launched on Aug. 5, 2011 and went into orbit around the gas giant on July 4, 2016. https://photojournal.jpl.nasa.gov/catalog/PIA24303

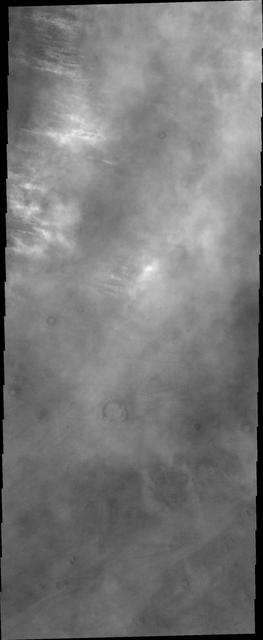
This lower resolution image was taken to explore the extent of storm fronts near the south polar region. The cloud cover is thickest in the middle of the frame
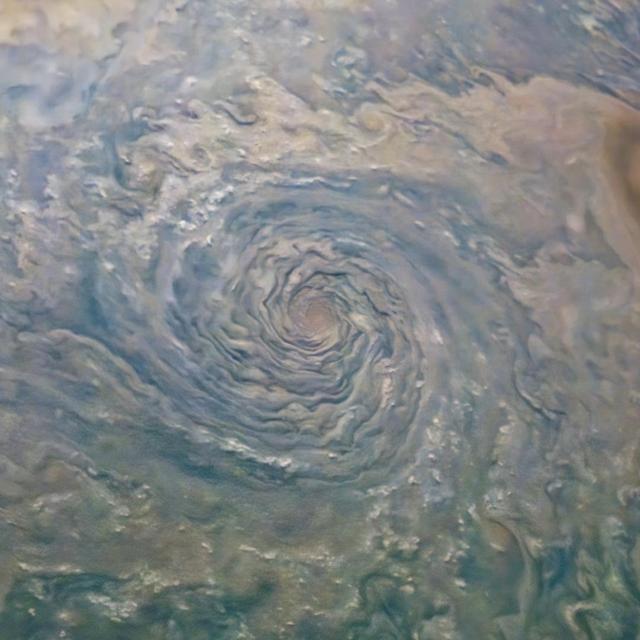
A cyclonic storm in Jupiter's northern hemisphere is captured in this image from NASA's Juno spacecraft. Many bright white cloud tops can be seen popping up in and around the arms of the rotating storm. The color-enhanced image was taken at 9:25 a.m. PST (12:25 p.m. EST) on Feb. 12, 2019, as the spacecraft performed its 17th science flyby of Jupiter. At the time, Juno was about 5,000 miles (8,000 kilometers) from the planet's cloud tops, above approximately 44 degrees north latitude. Citizen scientists Gerald Eichstädt and Seán Doran created this image using data from the spacecraft's JunoCam imager. https://photojournal.jpl.nasa.gov/catalog/PIA22947
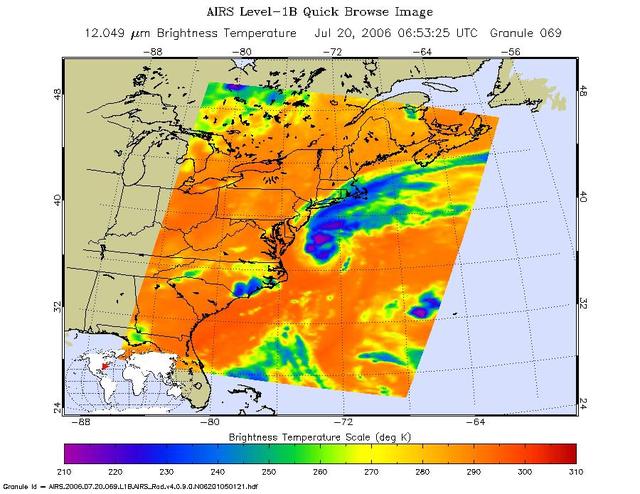
This is an AIRS infrared image of Tropical Storm Beryl in the western Atlantic, from the NASA Aqua satellite on July 20, 2006, 1:30 am local time. The image shows the temperature of the cloud tops or the surface of the Earth in cloud-free regions.
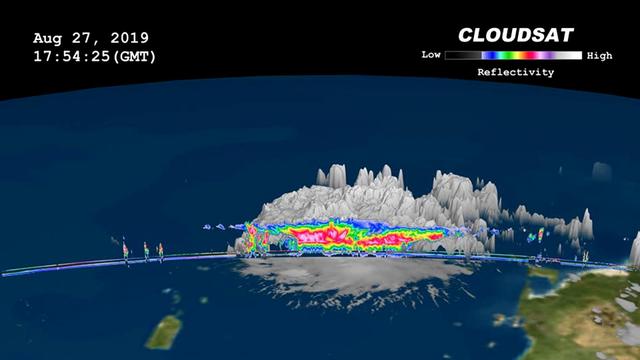
On, Aug. 27, 2019 NASA's CloudSat satellite passed over Dorian, still a tropical storm at the time, near Puerto Rico. CloudSat uses an advanced cloud-profiling radar that "slices" through clouds giving us the ability to see how tall they are, where the different cloud layers are, and where the heavier bands of rain are found within the storm system. The 3D animation shows Dorian when it had maximum sustained winds of 52 mph (84 kph) with some of its cloud tops extending about 9 miles (15 kilometer) into the atmosphere. The colors represent the size of water or ice droplets inside the storm — deep red and pink indicate larger droplets with areas of moderate and heavy rainfall. Movie available at https://photojournal.jpl.nasa.gov/catalog/PIA23359
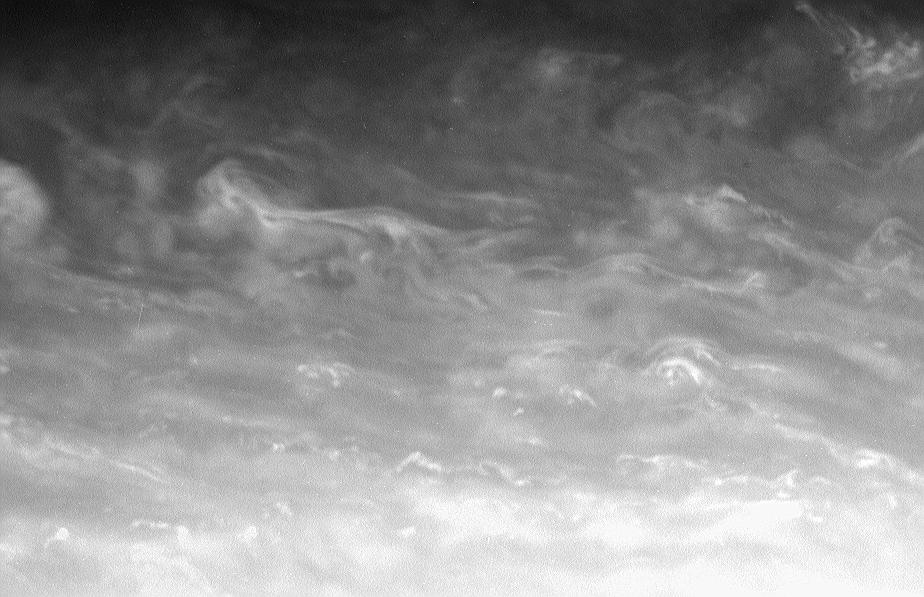
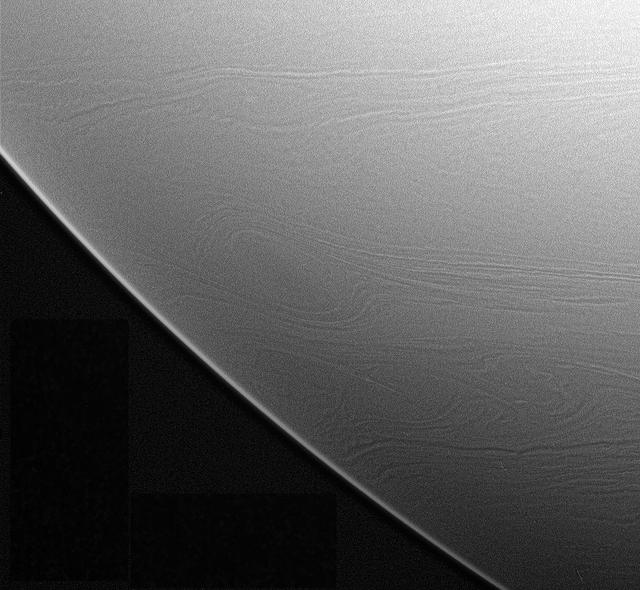
The bright whorls and small-scale specks of convective clouds drift through a region just north of Saturn bright equatorial band. Observers have seen major storms develop in this region in the past 15-20 years
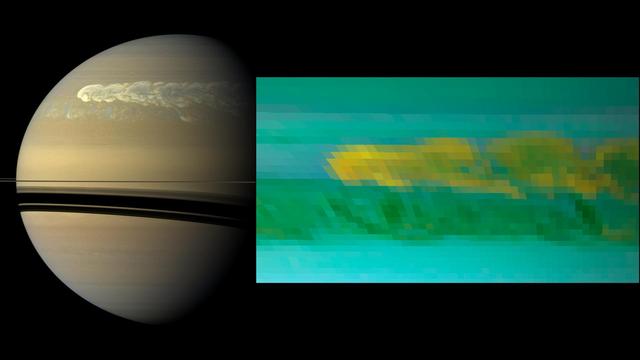
This set of images from NASA Cassini mission shows the turbulent power of a monster Saturn storm. The visible-light image in the back, obtained on Feb. 25, 2011 shows the turbulent clouds churning across the face of Saturn.
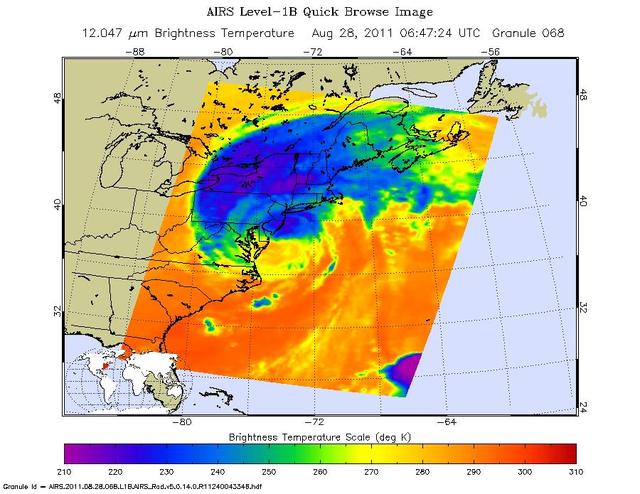
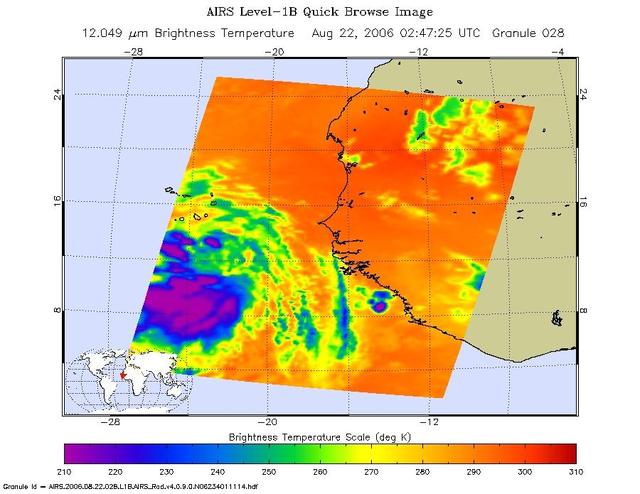
This infrared image of Hurricane Irene from the AIRS instrument on NASA Aqua spacecraft, was taken at 2:47 a.m. EDT on Aug. 28. The storm coldest cloud top temperatures and intense rains are shown in purples and blues.
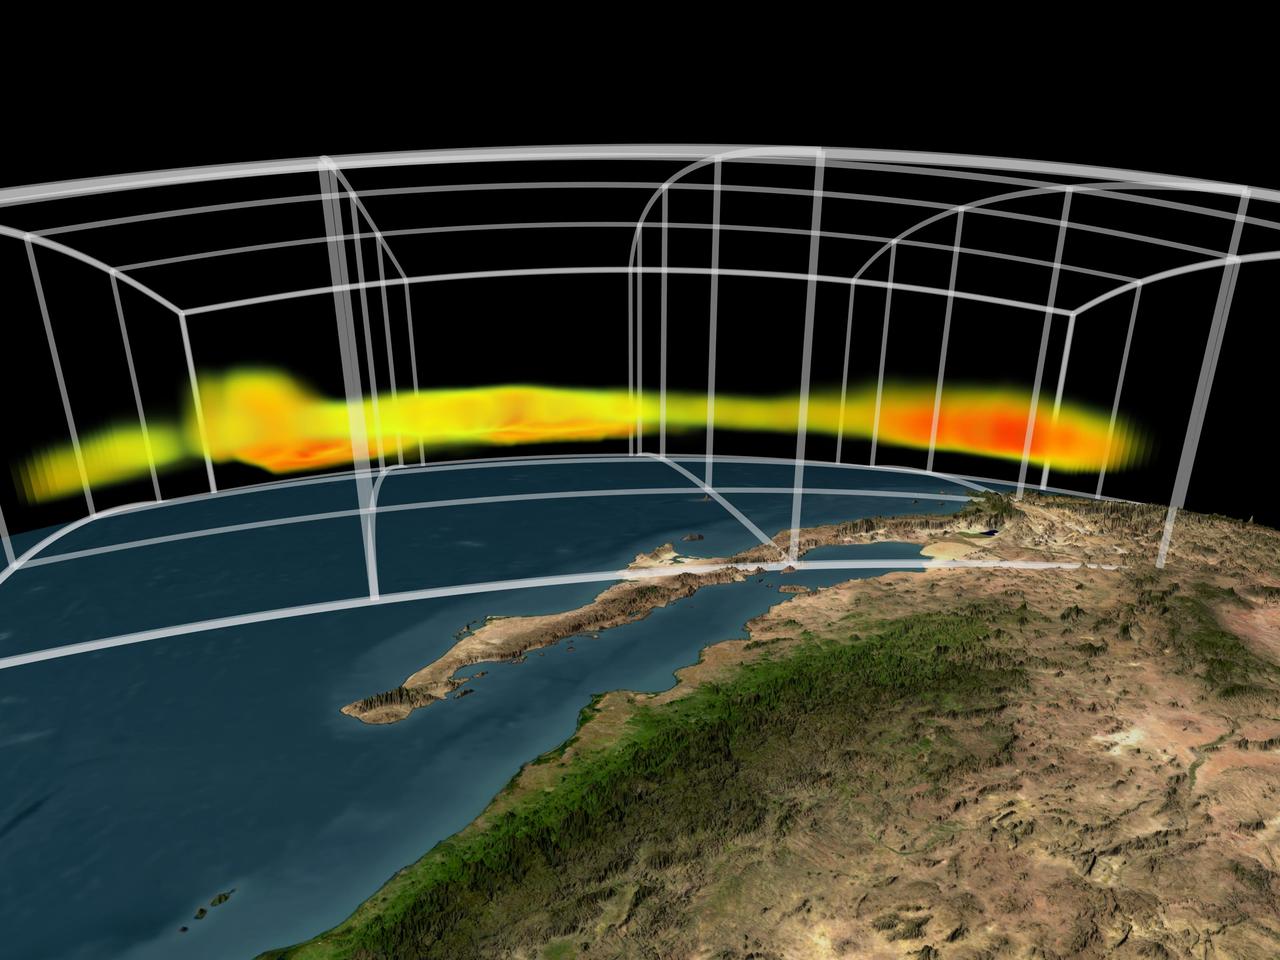
NASA Atmospheric Infrared Sounder instrument is able to peel back cloud cover to reveal 3-D structure of a storm water vapor content, information that can be used to improve weather forecast models.
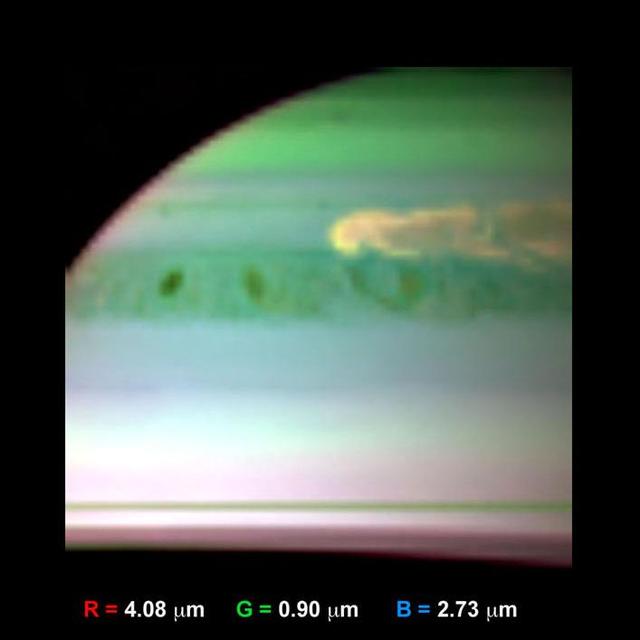
This false-color infrared image, obtained by NASA Cassini spacecraft, shows clouds of large ammonia ice particles dredged up by a powerful storm in Saturn northern hemisphere.
This dramatic close-up of Saturn south pole shows the hurricane-like vortex that resides there. The entire polar region is dotted with bright clouds, including one that appears to be inside the central ring of the polar storm
NASA Aqua satellite captured an infrared image of the storms on April 16, 2011 showing very cold, high cloud tops of the strong thunderstorms that spawned tornadoes in North Carolina and Virginia.
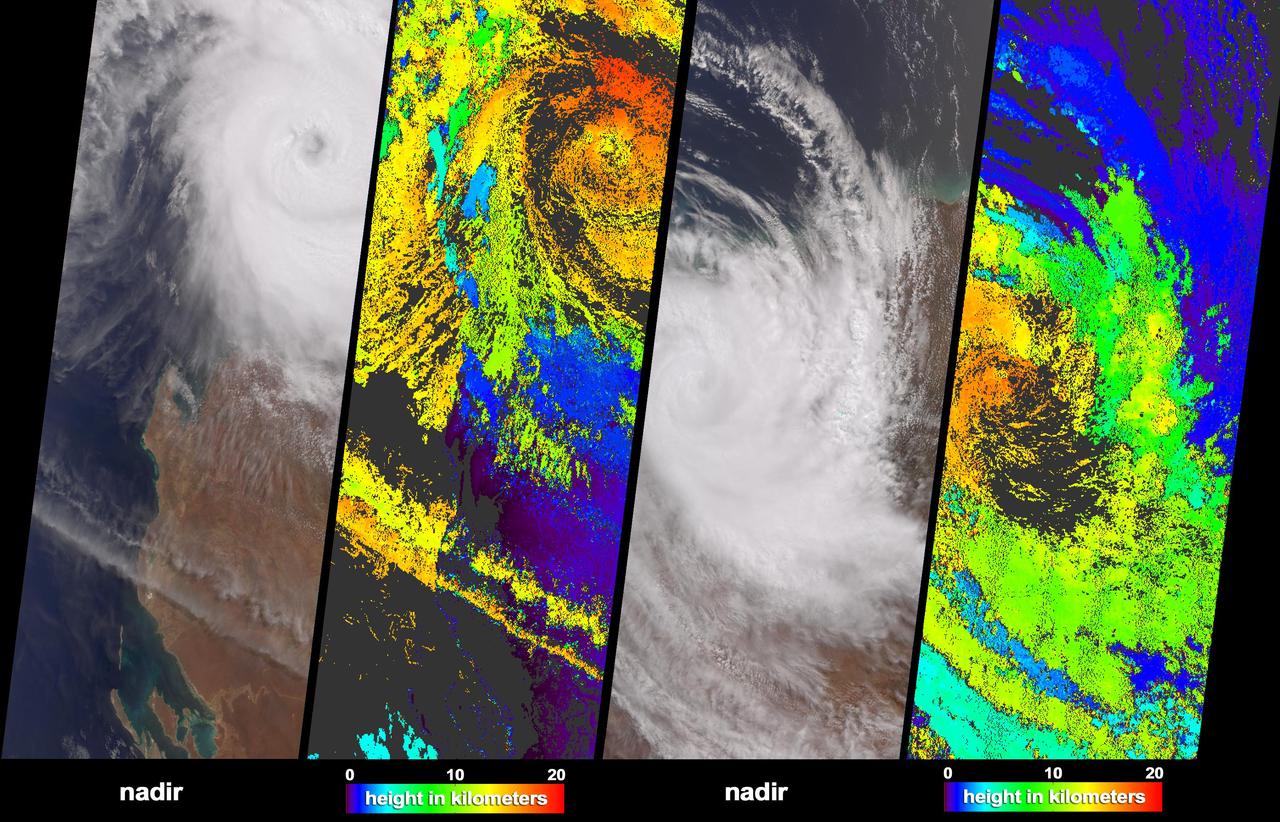
NASA Terra spacecraft acquired these natural color images and cloud top height measurements for Monty before and after the storm made landfall over the remote Pilbara region of Western Australia, on February 29 and March 2, 2004.
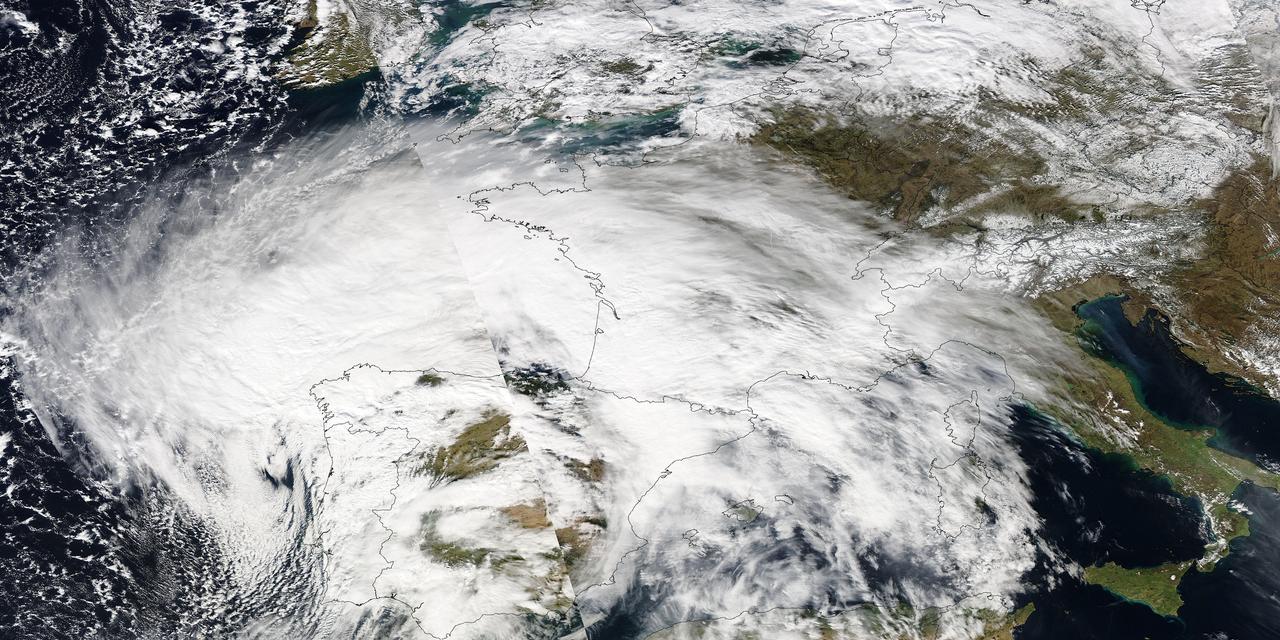
Image acquired February 27, 2010: An extratropical cyclone named Xynthia brought hurricane-force winds and high waves to Western Europe at the end of February 2010, CNN reported. Winds as fast as 200 kilometers (125 miles) per hour reached as far inland as Paris, and at the storm’s peak, hurricane-force winds extended from Portugal to the Netherlands. Hundreds of people had to take refuge from rising waters on their rooftops. By March 1, at least 58 people had died, some of them struck by falling trees. Most of the deaths occurred in France, but the storm also caused casualties in England, Germany, Belgium, Spain, and Portugal. The Moderate Resolution Imaging Spectroradiometer (MODIS) on NASA’s Aqua satellite captured this image of Western Europe, acquired in two separate overpasses on February 27, 2010. MODIS captured the eastern half of the image around 10:50 UTC, and the western half about 12:30 UTC. Forming a giant comma shape, clouds stretch from the Atlantic Ocean to northern Italy. NASA image courtesy MODIS Rapid Response Team at NASA Goddard Space Flight Center. Caption by Michon Scott. Instrument: Aqua - MODIS For more information related to this image go to: <a href="http://earthobservatory.nasa.gov/NaturalHazards/view.php?id=42881" rel="nofollow">earthobservatory.nasa.gov/NaturalHazards/view.php?id=42881</a>
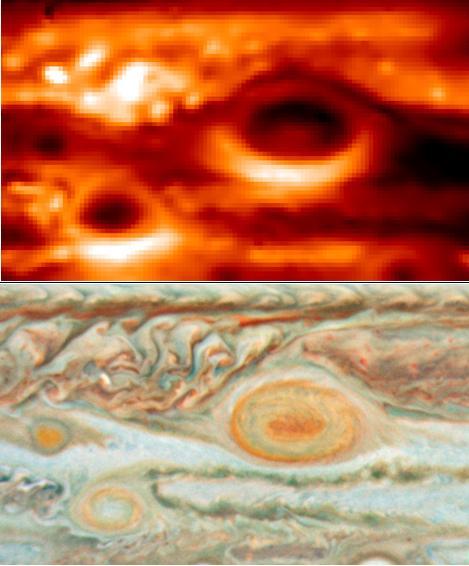
New thermal images from powerful ground-based telescopes show swirls of warmer air and cooler regions never seen before within Jupiter Great Red Spot.
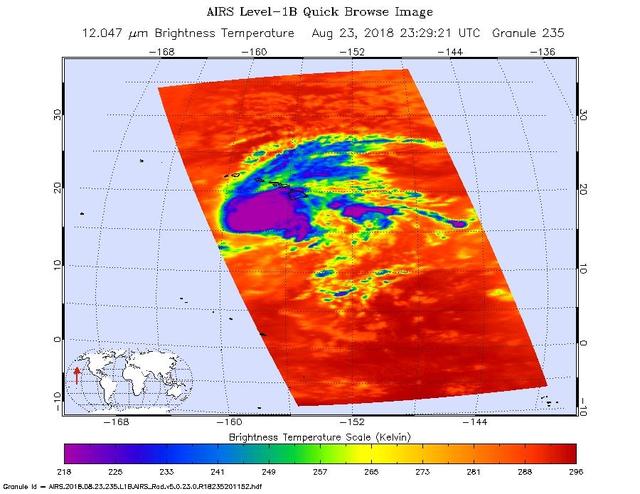
This image shows Hurricane Lane as observed by the Atmospheric Infrared Sounder (AIRS) instrument on NASA's Aqua satellite on Thursday, Aug. 23, 2018. Purple shows very cold clouds high in the atmosphere above the center of the hurricane, blue and green show the warmer temperatures of lower clouds surrounding the storm center; and orange and red areas have almost no clouds. No eye is seen in this image, which means it was either too small for AIRS to detect or it was covered by high, cold clouds. Figure 1 was observed on Aug. 22, 2018. Purple shows very cold clouds high in the atmosphere above the center of the hurricane, blue and green show the warmer temperatures of lower clouds surrounding the storm center; and orange and red areas have almost no clouds. The eye of the storm is clearly visible. https://photojournal.jpl.nasa.gov/catalog/PIA22493
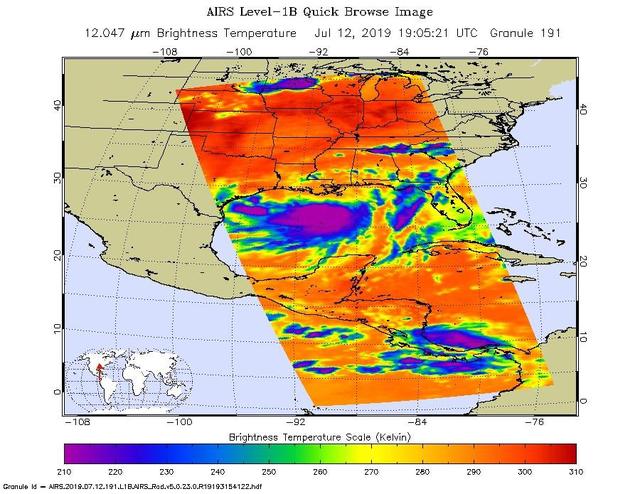
NASA's AIRS instrument imaged Tropical Storm Barry on the afternoon of July 12, 2019, a day before the storm is expected to make landfall on the Louisiana Coast. The infrared image shows very cold clouds that have been carried high into the atmosphere by deep thunderstorms in purple. These clouds are associated with heavy rainfall. Warmer areas with shallower rain clouds are shown in blue and green. And the orange and red areas represent mostly cloud-free air. https://photojournal.jpl.nasa.gov/catalog/PIA23355
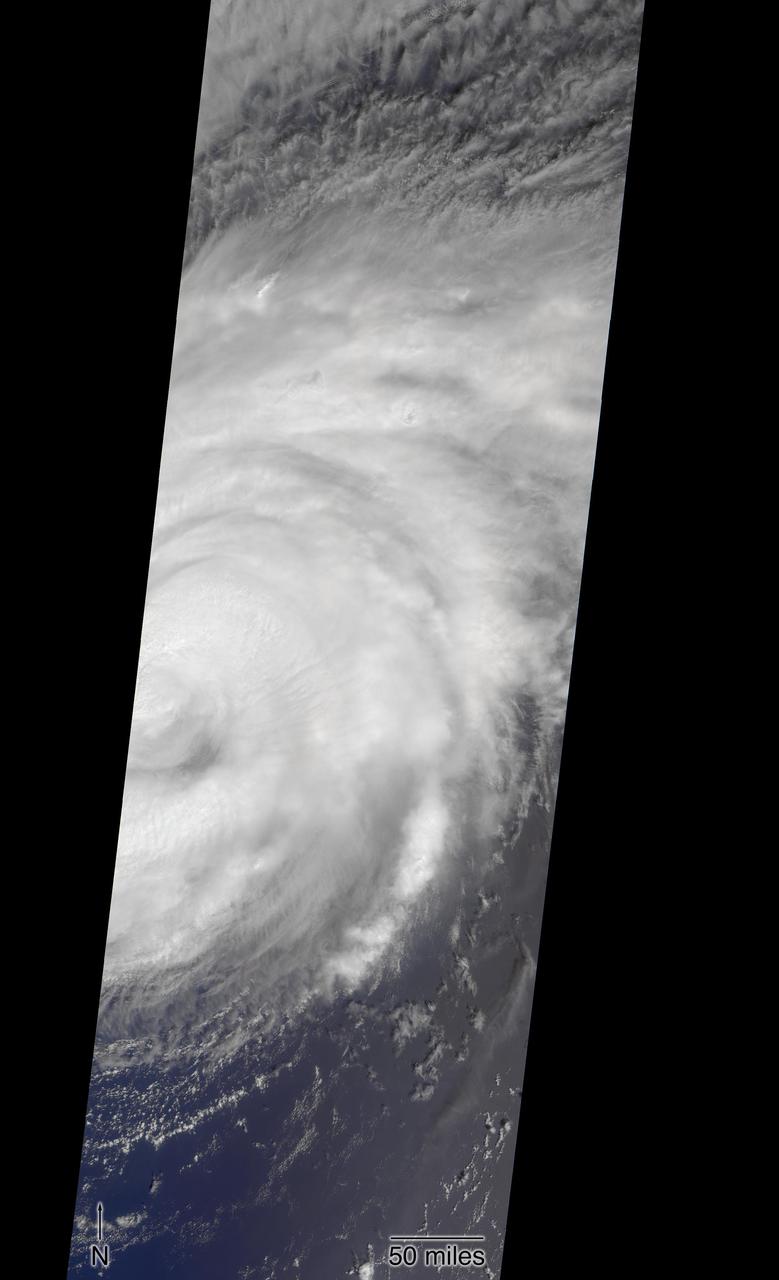
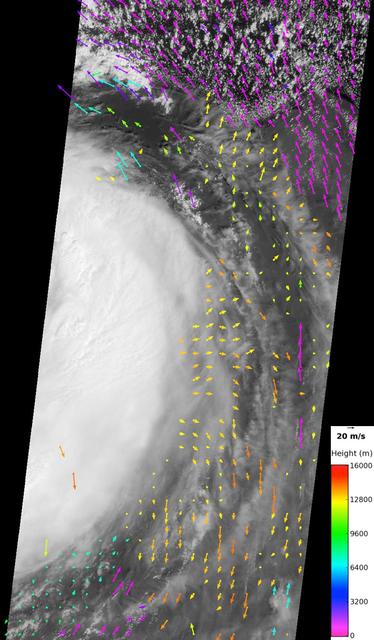
NASA's Multi-angle Imaging SpectroRadiometer (MISR) passed over Hurricane Florence as it approached the eastern coast of the United States on Thursday, September 13, 2018. At the time the image was acquired, Florence was a large Category 2 storm and coastal areas were already being hit with tropical-storm-force winds. The MISR instrument, flying onboard NASA's Terra satellite, carries nine cameras that observe Earth at different angles. It takes about seven minutes for all the cameras to observe the same location. The motion of the clouds during that time is used to compute wind speed at the cloud tops. These images show Florence as viewed by the central, downward-looking camera (left) and the storm's wind speeds (right). In the right image, the length of the arrows is proportional to wind speed and their colors show the altitude of the cloud tops in kilometers. The data show that the cloud top winds near the center of the storm were approximately 70 mph (113 kph), and the maximum cloud-top wind speed throughout the storm was 90 mph (145 kph). The wind data also shows that the lowest clouds are moving counter-clockwise, indicating inflow into the southern part of the hurricane, while the high clouds to the north of the hurricane show a clockwise outflow. https://photojournal.jpl.nasa.gov/catalog/PIA22700
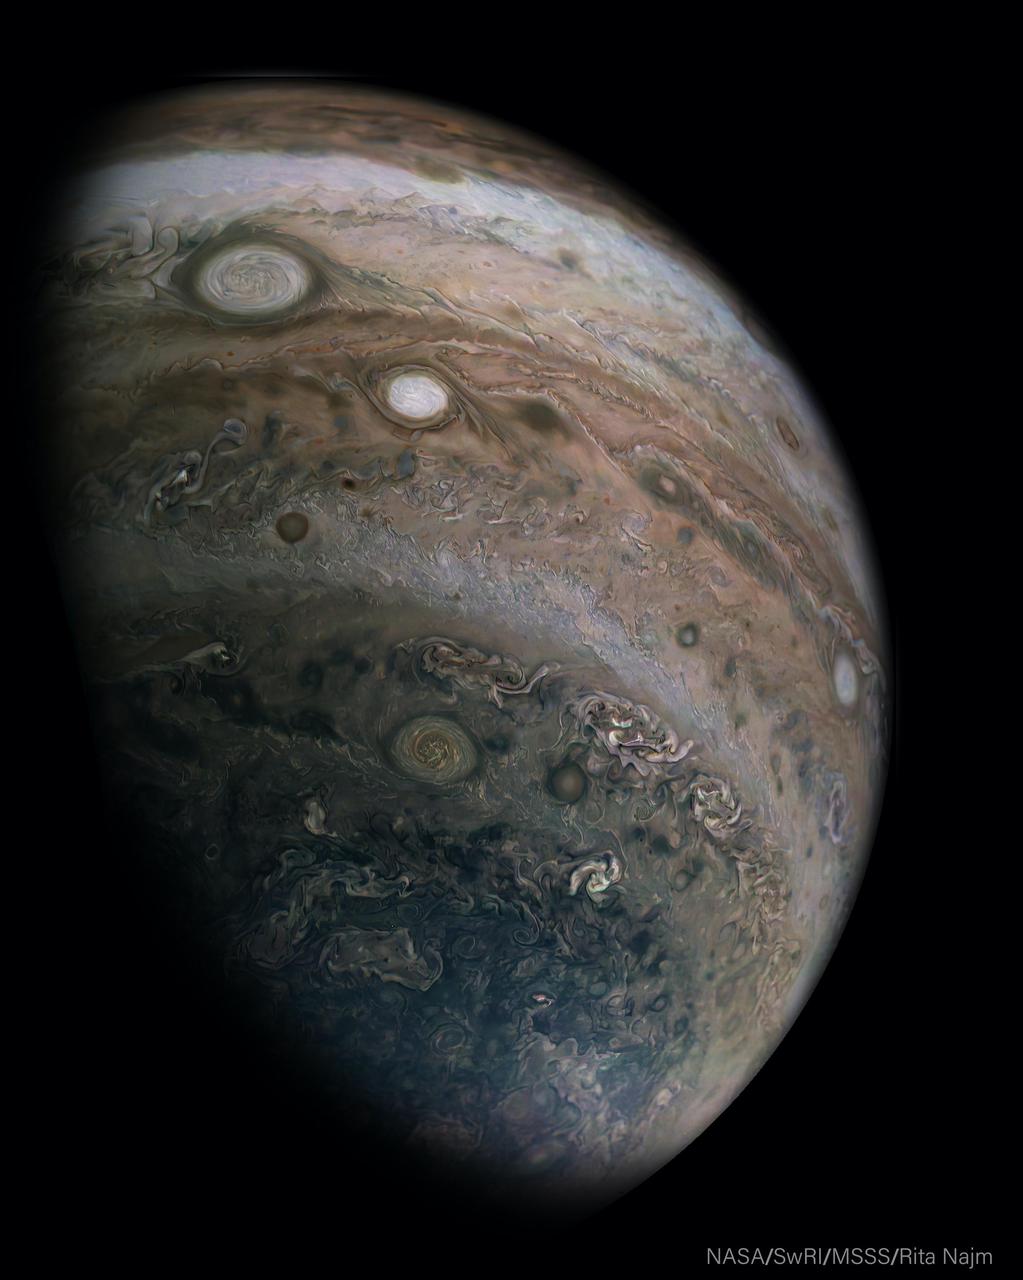
This image was captured by the JunoCam imager aboard NASA's Juno spacecraft on April 10, 2020, during the mission's 25th science pass of Jupiter. Oval BA, a large muddy circle of clouds near the upper-left of picture, is a storm approximately the same size as Earth. The bright storm below and to the right of Oval BA is one of Jupiter's "string of pearls" — massive counterclockwise rotating storms that appear as white ovals in the gas giant's southern hemisphere. The original JunoCam image used to produce this view was taken from an altitude of about 400,000 miles (64,500 kilometers) above Jupiter's cloud tops. Citizen scientist Rita Najm processed the images to enhance the color and contrast. Juno's elliptical orbit around Jupiter is evolving gradually as the perijove (closest approach) point moves farther north on each pass. Shorter closer views in the north are accompanied by a longer duration, more distant perspective, for viewing the southern hemisphere. These changes in perspective give us ever new views of this beautiful giant and its huge storms. https://photojournal.jpl.nasa.gov/catalog/PIA24234
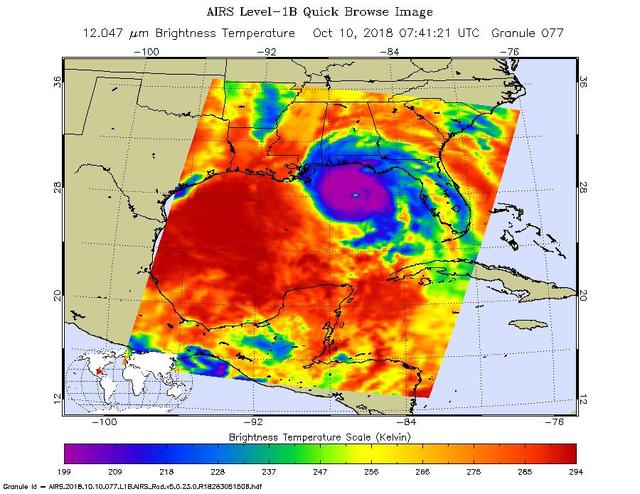
This image from the Atmospheric Infrared Sounder (AIRS) shows the temperature of clouds or the surface in and around Hurricane Michael as it approaches northwestern Florida around 3 AM local time on Tuesday, October 10, 2018. The storm shows all the hallmarks of a powerful, mature hurricane. The large purple area indicates very cold clouds at about -90 F (-68 C) carried high into the atmosphere by deep thunderstorms. These storm clouds are associated with very heavy rainfall. At the center of the cold clouds is the distinct, much warmer eye of the hurricane seen in green. The extensive areas of red away from the storm indicate temperatures of around 60 F (15 C), typical of the surface of the Earth at night. These red areas are mostly cloud-free, with the clear air caused by air motion outward from the cold clouds near the storm center then downward in the surrounding areas. Michael has developed quickly into a dangerous Category 4 storm, with sustained wind of 150 miles per hour. It is currently coming ashore on the Florida Panhandle as the strongest hurricane in that region in recorded history. https://photojournal.jpl.nasa.gov/catalog/PIA22749
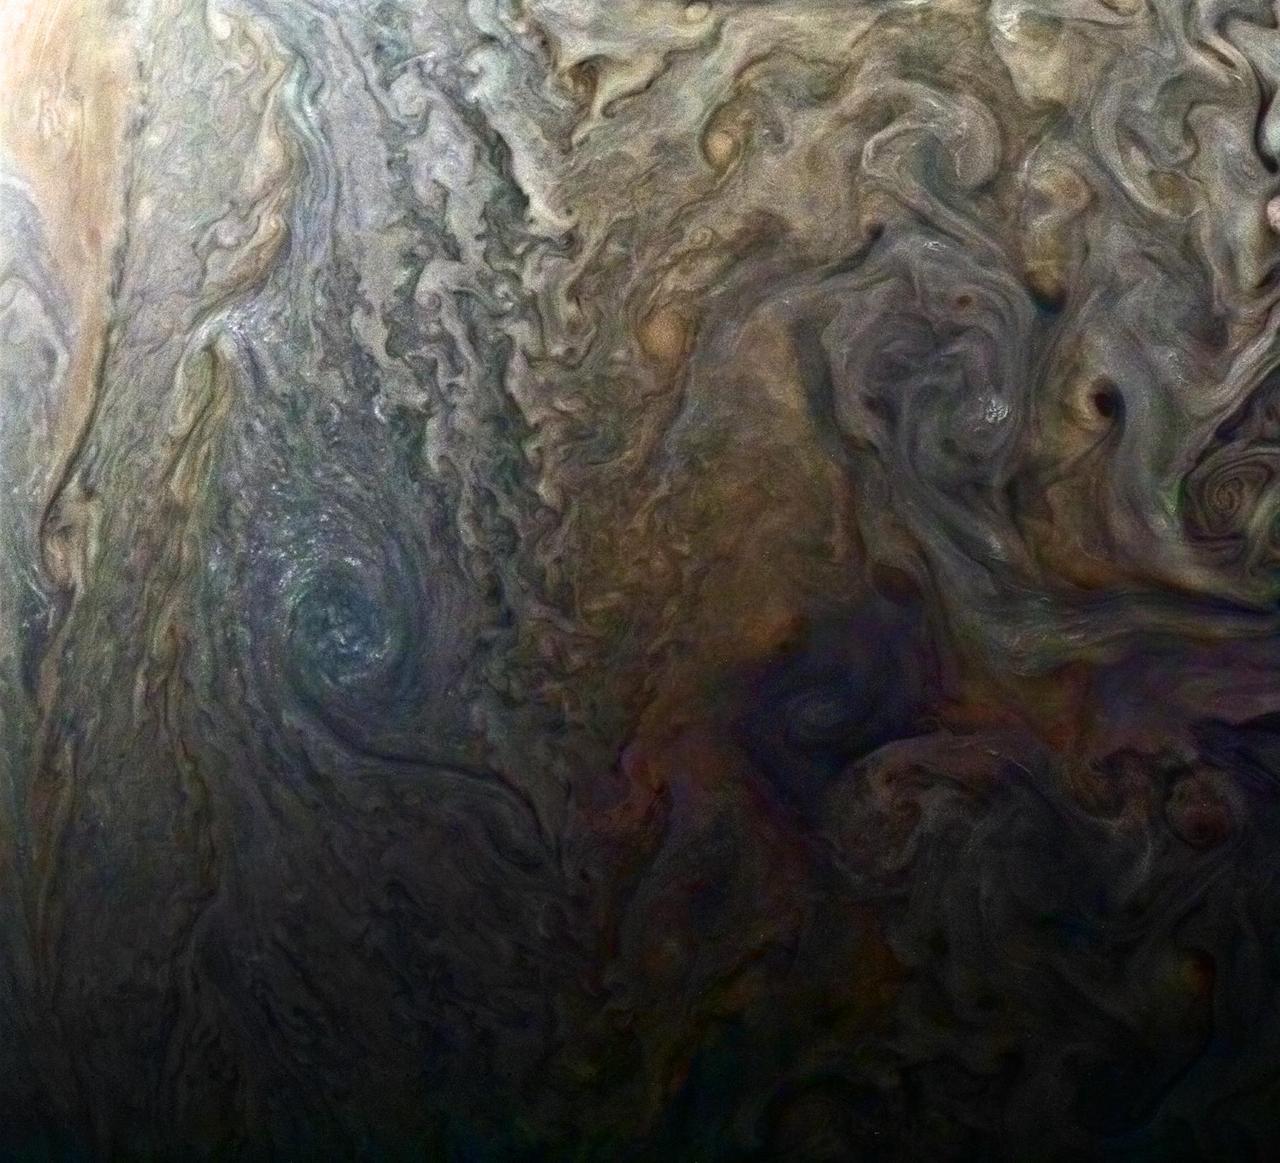
This enhanced-color image of a mysterious dark spot on Jupiter seems to reveal a Jovian "galaxy" of swirling storms. Juno acquired this JunoCam image on Feb. 2, 2017, at 5:13 a.m. PDT (8:13 a.m. EDT), at an altitude of 9,000 miles (14,500 kilometers) above the giant planet's cloud tops. This publicly selected target was simply titled "Dark Spot." In ground-based images it was difficult to tell that it is a dark storm. Citizen scientist Roman Tkachenko enhanced the color to bring out the rich detail in the storm and surrounding clouds. Just south of the dark storm is a bright, oval-shaped storm with high, bright, white clouds, reminiscent of a swirling galaxy. As a final touch, he rotated the image 90 degrees, turning the picture into a work of art. http://photojournal.jpl.nasa.gov/catalog/PIA21386 . - Enhanced image by Roman Tkachenko (CC-BY) based on images provided courtesy of NASA/JPL-Caltech/SwRI/MSSS
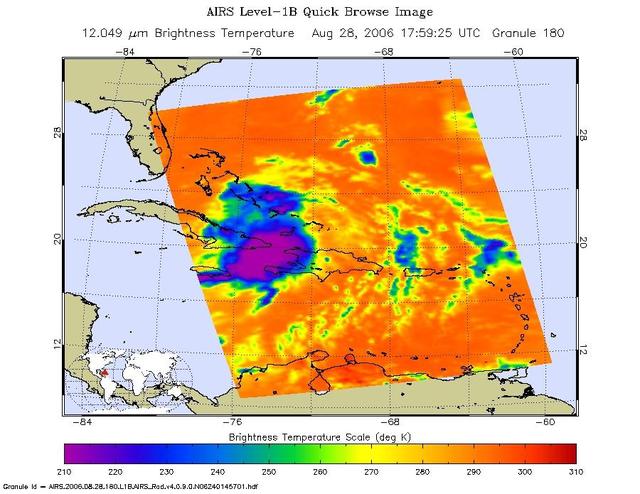
This infrared image shows Tropical Storm Ernesto over Cuba, from the Atmospheric Infrared Sounder AIRS on NASA Aqua satellite in August, 2006. Because infrared radiation does not penetrate through clouds, AIRS infrared images show either the temperature of the cloud tops or the surface of the Earth in cloud-free regions. The lowest temperatures (in purple) are associated with high, cold cloud tops that make up the top of the storm. In cloud-free areas the AIRS instrument will receive the infrared radiation from the surface of the Earth, resulting in the warmest temperatures (orange/red). http://photojournal.jpl.nasa.gov/catalog/PIA00510

This image captures a close-up view of a storm with bright cloud tops in the northern hemisphere of Jupiter. NASA's Juno spacecraft took this color-enhanced image on Feb. 7 at 5:38 a.m. PST (8:38 a.m. EST) during its 11th close flyby of the gas giant planet. At the time, the spacecraft was 7,578 miles (12,195 kilometers) from the tops of Jupiter's clouds at 49.2 degrees north latitude. Citizen scientist Matt Brealey processed the image using data from the JunoCam imager. Citizen scientist Gustavo B C then adjusted colors and embossed Matt Brealey's processing of this storm. https://photojournal.jpl.nasa.gov/catalog/PIA21981 . - Enhanced image by Matt Brealey / Gustavo B C based on images provided courtesy of NASA/JPL-Caltech/SwRI/MSSS
A large, bright and complex convective storm that appeared in Saturn's southern hemisphere in mid-September 2004 was the key in solving a long-standing mystery about the ringed planet. Saturn's atmosphere and its rings are shown here in a false color composite made from Cassini images taken in near infrared light through filters that sense different amounts of methane gas. Portions of the atmosphere with a large abundance of methane above the clouds are red, indicating clouds that are deep in the atmosphere. Grey indicates high clouds, and brown indicates clouds at intermediate altitudes. The rings are bright blue because there is no methane gas between the ring particles and the camera. The complex feature with arms and secondary extensions just above and to the right of center is called the Dragon Storm. It lies in a region of the southern hemisphere referred to as "storm alley" by imaging scientists because of the high level of storm activity observed there by Cassini in the last year. The Dragon Storm was a powerful source of radio emissions during July and September of 2004. The radio waves from the storm resemble the short bursts of static generated by lightning on Earth. Cassini detected the bursts only when the storm was rising over the horizon on the night side of the planet as seen from the spacecraft; the bursts stopped when the storm moved into sunlight. This on/off pattern repeated for many Saturn rotations over a period of several weeks, and it was the clock-like repeatability that indicated the storm and the radio bursts are related. Scientists have concluded that the Dragon Storm is a giant thunderstorm whose precipitation generates electricity as it does on Earth. The storm may be deriving its energy from Saturn's deep atmosphere. One mystery is why the radio bursts start while the Dragon Storm is below the horizon on the night side and end when the storm is on the day side, still in full view of the Cassini spacecraft. A possible explanation is that the lightning source lies to the east of the visible cloud, perhaps because it is deeper where the currents are eastward relative to those at cloud top levels. If this were the case, the lightning source would come up over the night side horizon and would sink down below the day side horizon before the visible cloud. This would explain the timing of the visible storm relative to the radio bursts. The Dragon Storm is of great interest for another reason. In examining images taken of Saturn's atmosphere over many months, imaging scientists found that the Dragon Storm arose in the same part of Saturn's atmosphere that had earlier produced large bright convective storms. In other words, the Dragon Storm appears to be a long-lived storm deep in the atmosphere that periodically flares up to produce dramatic bright white plumes which subside over time. One earlier sighting, in July 2004, was also associated with strong radio bursts. And another, observed in March 2004 and captured in a movie created from images of the atmosphere (PIA06082 and PIA06083) spawned three little dark oval storms that broke off from the arms of the main storm. Two of these subsequently merged with each other; the current to the north carried the third one off to the west, and Cassini lost track of it. Small dark storms like these generally get stretched out until they merge with the opposing currents to the north and south. These little storms are the food that sustains the larger atmospheric features, including the larger ovals and the eastward and westward currents. If the little storms come from the giant thunderstorms, then together they form a food chain that harvests the energy of the deep atmosphere and helps maintain the powerful currents. Cassini has many more chances to observe future flare-ups of the Dragon Storm, and others like it over the course of the mission. It is likely that scientists will come to solve the mystery of the radio bursts and observe storm creation and merging in the next 2 or 3 years. http://photojournal.jpl.nasa.gov/catalog/PIA06197
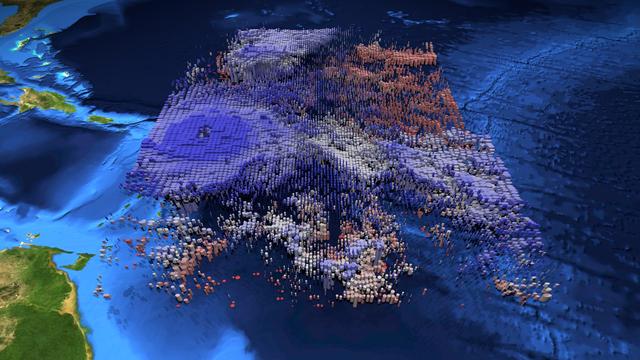
The large-scale structure of clouds in and around Hurricane Irma is seen in this animation and still image created with data from the Atmospheric Infrared Sounder (AIRS) instrument on NASA's Aqua satellite. The clouds are typical of tropical areas both nearby and away from tropical cyclones. Observations were taken at 1 p.m. EDT (5 p.m. UTC) on Tuesday, Sept. 5, 2017, as Irma approached the Caribbean islands and was just becoming a powerful Category 5 storm. Each cylinder represents a volume of cloud detected by AIRS. The oval cylinder ends represent a region viewed by AIRS, with the oval sizes adjusted to reflect the proportion of clouds filling the area viewed. The largest ovals are about 30 miles (45 kilometers) across. The height of the cylinders indicates the cloud thickness, with thickest clouds reaching down to the surface. The vertical scale is exaggerated 15 times. Colors represent temperatures at the tops of the clouds. The perspective views the storm diagonally from above with an initial view toward the north-northwest, with the perspective rotating clockwise for a full circle. The area depicted is about 1,000 miles by 800 miles across (1,600 by 1,300 kilometers). At the start of the loop, North America is seen at the top of the image, and coastal Venezuela at the lower right. In the initial perspective, cirrus clouds (thin and blue), associated with flow outward from the top of the hurricane, overlie warmer (pink and red) shallow clouds. About five seconds into the loop, the deep clouds in the middle of Irma are easily seen. The most dangerous parts of Irma are within the region of high and cold (blue), thick clouds surrounding the central eye. The clouds are cold because they are carried to high, cold altitudes by vigorous thunderstorms within the hurricane. The eye itself is nearly cloud free, but the few clouds within it are low and warm. As the perspective shift toward the south-southeast around seven seconds into the loop, another storm system well north of Irma can be seen. It contains high, thick clouds, with more cirrus carried outward over shallow clouds. At about nine seconds, more outflow from Irma is seen, with high, thin clouds over shallow clouds once again apparent. Shortly afterward when the view is toward the southwest, yet more deep clouds and their outflowing cirrus clouds are apparent. This image depicts many of the clouds typical of the tropics even when cyclones are not present: high, cold thunderstorms pushing cirrus clouds over nearby regions containing many warm, shallow clouds. The animation also shows the structure typical of tropical cyclones around the world: very strong thunderstorms lifting clouds into cold parts of the atmosphere, with strong outflow at upper levels carrying cirrus clouds away from the storm center, and the storm organized symmetrically around a central eye. https://photojournal.jpl.nasa.gov/catalog/PIA21950
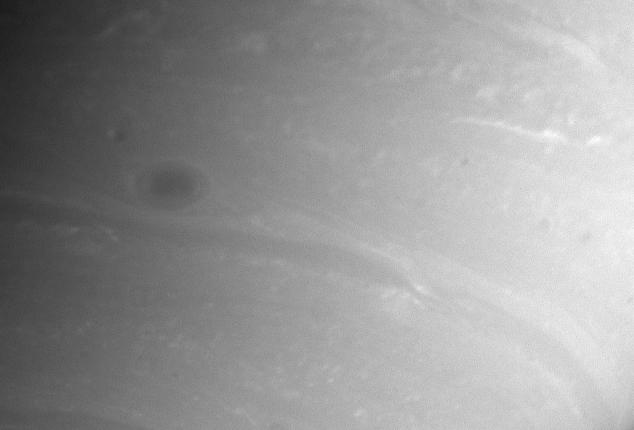
This close-up view shows lots of atmospheric detail, including a dark storm and wisps of clouds. The dark spot is noticeably lighter around its perimeter than in its interior. The image was taken with the Cassini spacecraft narrow angle camera on Sept. 10, 2004, at a distance of 8.8 million kilometers (5.5 million miles) from Saturn, through a filter sensitive to wavelengths of infrared light centered at 750 nanometers. The image scale is 52 kilometers (32 miles) per pixel. The image has been contrast enhanced to improve visibility of features in the atmosphere. http://photojournal.jpl.nasa.gov/catalog/PIA06493
NASA Terra spacecraft recorded low-level wind speeds of up to 75 miles per hour 65 knots from cloud motion observed outside Tropical Storm Isaac eye. The spacecraft flew over Isaac a few hours before Isaac was upgraded to a Category 1 hurricane.
This color-enhanced image of a massive, raging storm in Jupiter's northern hemisphere was captured by NASA's Juno spacecraft during its ninth close flyby of the gas giant planet. The image was taken on Oct. 24, 2017 at 10:32 a.m. PDT (1:32 p.m. EDT). At the time the image was taken, the spacecraft was about 6,281 miles (10,108 kilometers) from the tops of the clouds of Jupiter at a latitude of 41.84 degrees. The spatial scale in this image is 4.2 miles/pixel (6.7 kilometers/pixel). The storm is rotating counter-clockwise with a wide range of cloud altitudes. The darker clouds are expected to be deeper in the atmosphere than the brightest clouds. Within some of the bright "arms" of this storm, smaller clouds and banks of clouds can be seen, some of which are casting shadows to the right side of this picture (sunlight is coming from the left). The bright clouds and their shadows range from approximately 4 to 8 miles (7 to 12 kilometers) in both widths and lengths. These appear similar to the small clouds in other bright regions Juno has detected and are expected to be updrafts of ammonia ice crystals possibly mixed with water ice. Citizen scientists Gerald Eichstädt and Seán Doran processed this image using data from the JunoCam imager. https://photojournal.jpl.nasa.gov/catalog/PIA21971
iss055e004922 (March 24, 2018) --- Storm clouds blanket an area of South Africa just inland from its eastern coast on the Indian Ocean.
iss069e056653 (Aug. 10, 2023) --- Storm clouds are pictured in this oblique view from the International Space Station as it orbited 261 miles above Australia's Gulf of Carpentaria.
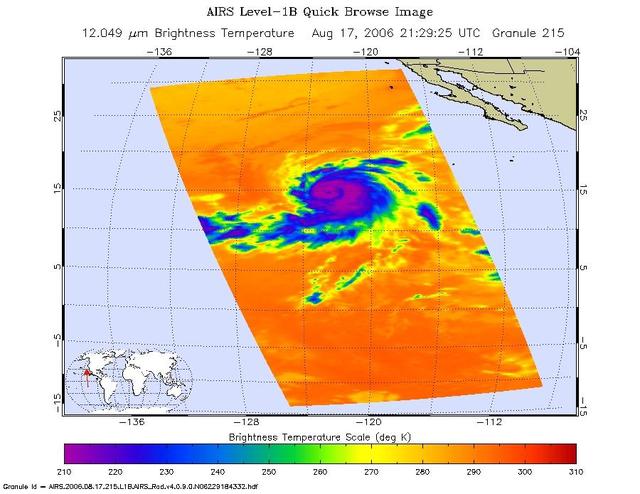
Infrared, microwave, and visible/near-infrared images of Hurricane Hector in the eastern Pacific were created with data from the Atmospheric Infrared Sounder (AIRS) on NASA's Aqua satellite on August 17, 2006. The infrared AIRS image shows the temperature of the cloud tops or the surface of the Earth in cloud-free regions. The lowest temperatures (in purple) are associated with high, cold cloud tops that make up the top of the hurricane. The infrared signal does not penetrate through clouds. Where there are no clouds the AIRS instrument reads the infrared signal from the surface of the Earth, revealing warmer temperatures (red). At the time the data were taken from which these images were made, Hector is a well organized storm, with the strongest convection in the SE quadrant. The increasing vertical wind shear in the NW quadrant is appearing to have an effect. Maximum sustained winds are at 85 kt, gusts to 105 kt. Estimated minimum central pressure is 975 mbar. The microwave image is created from microwave radiation emitted by Earth's atmosphere and received by the instrument. It shows where the heaviest rainfall is taking place (in blue) in the storm. Blue areas outside of the storm where there are either some clouds or no clouds, indicate where the sea surface shines through. The "visible" image is created from data acquired by the visible light/near-infrared sensor on the AIRS instrument. http://photojournal.jpl.nasa.gov/catalog/PIA00507

ISS009-E-18129 (21:08:57 GMT, 12 August 2004) --- Less than a minute after ISS009-E-18123, the Expedition 9 crew captured this more detailed view of Hurricane Charley looking southward. The small eye is visible, but not cloud-free yet. Spiraling streaks of high cirrus clouds around the south southern and western edges of the storm indicate the pronounced outflow of air above the storm.
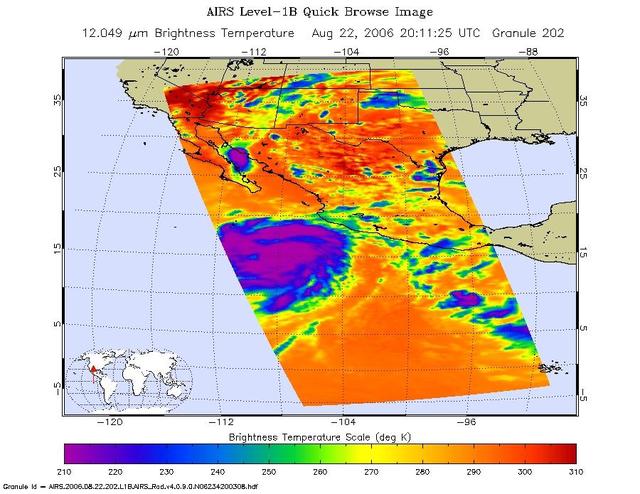
This is an infrared image of Hurricane Ileana in the Eastern Pacific, from the Atmospheric Infrared Sounder (AIRS) on NASA's Aqua satellite on August 22, 2006. This AIRS image shows the temperature of the cloud tops or the surface of the Earth in cloud-free regions. The lowest temperatures (in purple) are associated with high, cold cloud tops that make up the top of the storm. The infrared signal does not penetrate through clouds. Where there are no clouds the AIRS instrument reads the infrared signal from the surface of the Earth, revealing warmer temperatures (red). http://photojournal.jpl.nasa.gov/catalog/PIA00509
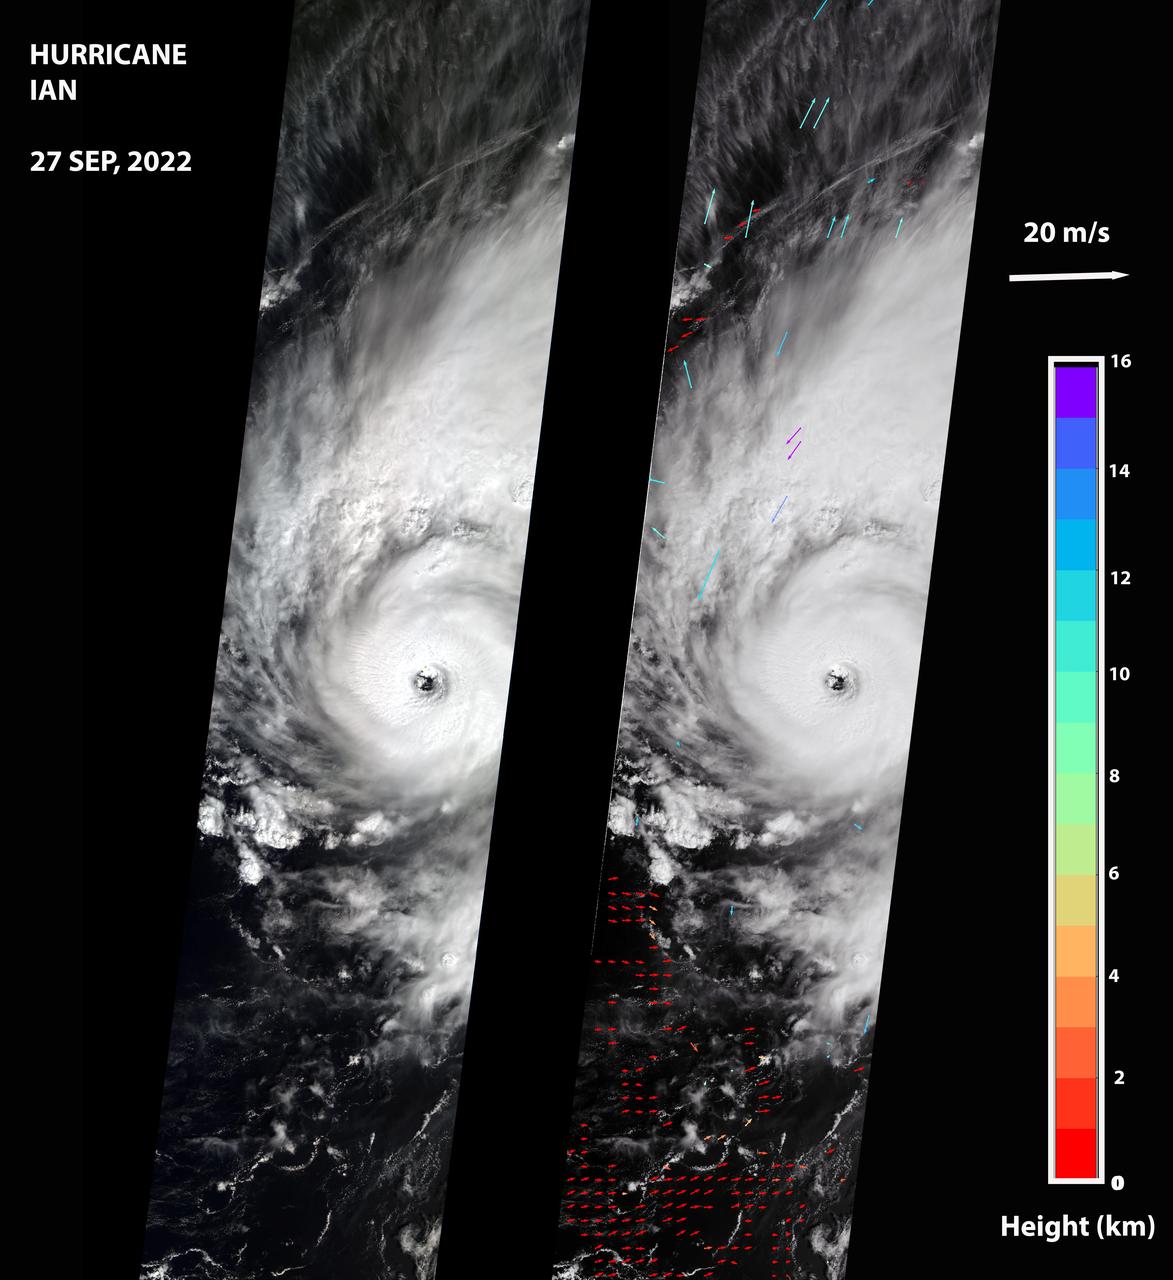
NASA's Multi-angle Imaging SpectroRadiometer (MISR) captured an optical image of Hurricane Ian, as well as measurements of the storm's wind speed, at noon local time Sept. 27, 2022. The storm, a Category 3 hurricane at that time, had maximum sustained winds of 115 mph (185 kph). The eye of the storm was located off the northern coast of Cuba, approximately 70 miles (110 kilometers) west of Havana, after passing over the island in the morning hours. The MISR instrument, flying aboard NASA's Terra satellite, carries nine cameras that observe the Earth at different angles. It takes approximately seven minutes for all the cameras to observe the same location on the Earth, and the motion of clouds during that time is used to calculate wind speed at the cloud tops. The left-hand panel of the first figure shows an image of the storm as viewed by MISR's central, downward-looking camera. The panel on the right shows the wind speeds derived from MISR data superimposed on the image. The length of the arrows is proportional to the wind speed, while their color shows the altitudes of the cloud tops in kilometers. The MISR data shows that the cloud-top winds near the center of the storm reached approximately 108 mph (174 kph), with maximum cloud-top wind speed reaching 123 mph (198 kph). The wind data shows that the lowest clouds are moving counterclockwise, while the high clouds north of the hurricane's center are rotating clockwise. The anaglyph reveals high clouds associated with strong thunderstorms in the eyewall of Hurricane Ian as well as individual strong thunderstorms in the outer rainbands. https://photojournal.jpl.nasa.gov/catalog/PIA24909
These images show Tropical Depression Debbie in the Atlantic, from the Atmospheric Infrared Sounder (AIRS) on NASA's Aqua satellite on August 22, 2006. This AIRS image shows the temperature of the cloud tops or the surface of the Earth in cloud-free regions. The lowest temperatures (in purple) are associated with high, cold cloud tops that make up the top of the storm. The infrared signal does not penetrate through clouds. Where there are no clouds the AIRS instrument reads the infrared signal from the surface of the Earth, revealing warmer temperatures (red). At the time the data were taken from which these images were made the eye had not yet opened but the storm is now well organized. The location of the future eye appears as a circle at 275 K brightness temperature in the microwave image just to the SE of the Azores. http://photojournal.jpl.nasa.gov/catalog/PIA00508
SL4-136-3388 (2 Dec. 1973) --- This excellent view of a South Pacific storm was photographed from the Skylab space station in Earth orbit by one of the Skylab 4 crewmen. The camera used was a hand-held 70mm Hasselblad, with SO-368 medium-speed Ektachrome film. This photograph of a low pressure area and associated frontal activity was taken for studying the development of such storm systems. The low sun angle enhances the relief, giving much of the picture a three-dimensional appearance. The good definition of the clouds with the cumulonimbus (thunderstorm clouds) penetrating the cirrus cloud layer makes this an interesting photograph to study. This storm, located east of New Zealand at 170 degrees west longitude and 50 degrees south latitude, is not and never became a typhoon. However, in some ways it may look similar. Photo credit: NASA
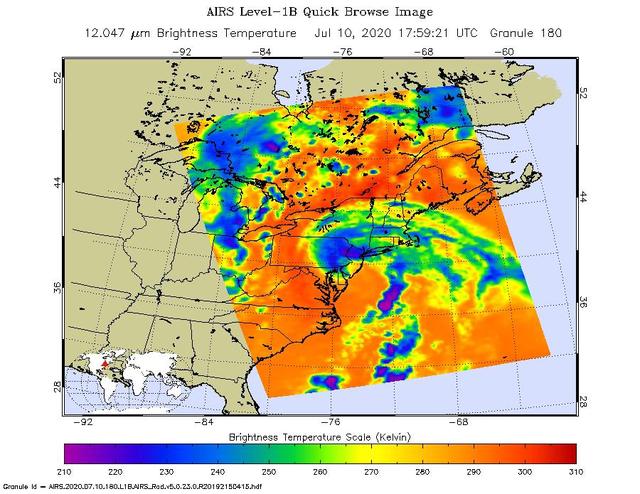
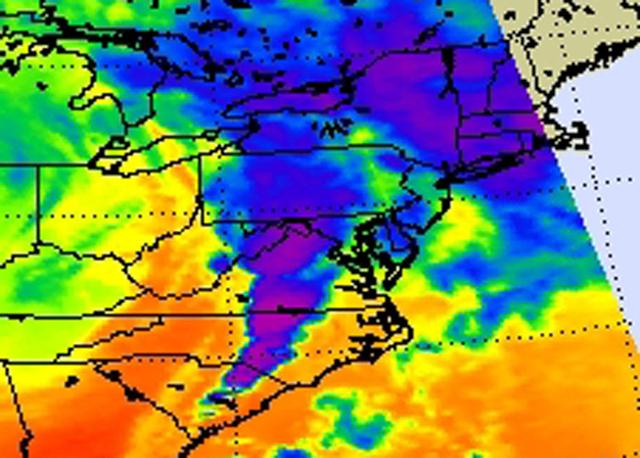
NASA's Atmospheric Infrared Sounder (AIRS) collected this image of Tropical Storm Fay over New England at around 2 p.m. local time on Friday, July 10. The center of the storm made landfall about 10 miles (15 kilometers) north-northeast of Atlantic City, New Jersey, at around 5 p.m. local time, when Fay had maximum sustained winds of around 50 mph (85 kph). In the infrared AIRS image, the purple regions indicate very cold clouds lofted high into the atmosphere by the storm. These clouds are generally linked to heavy rainfall. Warmer clouds closer to the ground show up as green and blue, while the orange areas denote mostly cloud-free parts of the sky. AIRS, together with the Advanced Microwave Sounding Unit (AMSU), measures the infrared and microwave radiation emitted from Earth to study the planet's weather and climate. Both instruments observe Earth from NASA's Aqua satellite, which launched in 2002. AIRS and AMSU work in tandem to make simultaneous observations down to Earth's surface, even in the presence of heavy clouds. With more than 2,000 channels sensing different regions of the atmosphere, the system creates a global, three-dimensional map of atmospheric temperature and humidity, cloud amounts and heights, greenhouse gas concentrations, and many other atmospheric phenomena. https://photojournal.jpl.nasa.gov/catalog/PIA23783
NASA's CloudSat satellite flew over Hurricane Irma on Sept. 6, 2017 at 1:45 p.m. EDT (17:45 UTC) as the storm was approaching Puerto Rico in the Atlantic Ocean. Hurricane Irma contained estimated maximum sustained winds of 185 miles per hour (160 knots) with a minimum pressure of 918 millibars. CloudSat transected the eastern edge of Hurricane Irma's eyewall, revealing details of the storm's cloud structure beneath its thick canopy of cirrus clouds. The CloudSat Cloud Profiling Radar excels in detecting the organization and placement of cloud layers beneath a storm's cirrus canopy, which are not readily detected by other satellite sensors. The CloudSat overpass reveals the inner details beneath the cloud tops of this large system; intense areas of convection with moderate to heavy rainfall (deep red and pink colors), cloud-free areas (moats) in between the inner and outer cloud bands of Hurricane Irma and cloud top heights averaging around 9 to 10 miles (15 to 16 kilometers). Lower values of reflectivity (areas of green and blue) denote smaller-sized ice and water particle sizes typically located at the top of a storm system (in the anvil area). The Cloud Profiling Radar loses signal at around 3 miles (5 kilometers) in height (in the melting layer) due to water (ice) particles larger than 0.12 inches (3 millimeters) in diameter. Moderate to heavy rainfall occurs in these areas where signal weakening is detectable. Smaller cumulus and cumulonimbus cloud types are evident as CloudSat moves farther south, beneath the thick cirrus canopy. An animation is available at https://photojournal.jpl.nasa.gov/catalog/PIA21947
These two images of Jupiter atmosphere were taken by NASA Galileo spacecraft on June 26, 1996. The bright white spot in the center of each image is to the northwest of Jupiter Great Red Spot GRS.
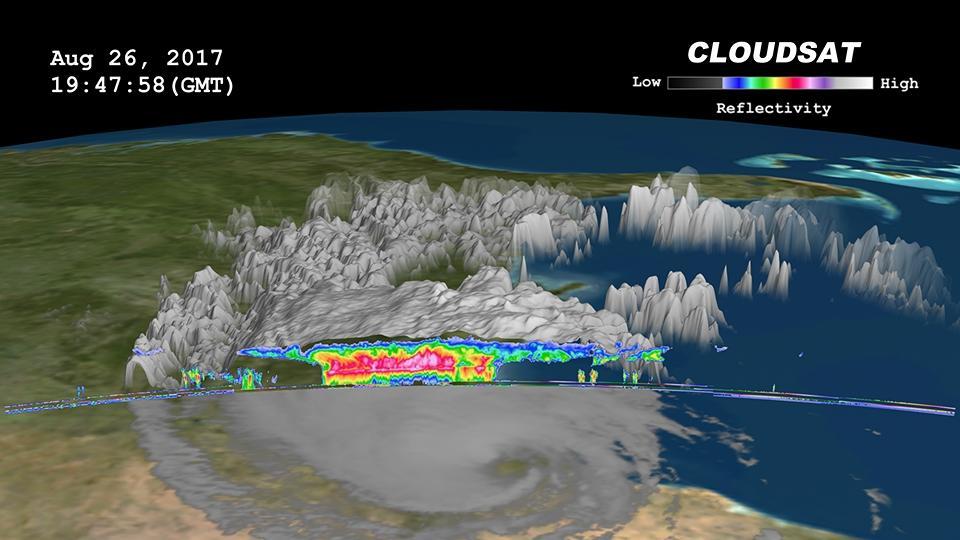
Click on the image for larger animation NASA's CloudSat satellite flew over then-Tropical Storm Harvey on Aug. 26, 2017, at 2:45 p.m. CDT (19:45 UTC) as the storm was nearly stationary over south Texas. At that time, Harvey contained estimated maximum sustained winds of 69 miles per hour (60 knots). CloudSat flew over Harvey northeast of the storm center through an area of moderate to heavy rainfall in the outer rainbands. As seen in the image and animation, large amounts of liquid and ice water (denoted by the red and pink colors) are visible beneath the cloud tops. The lack of a radar signal (attenuation) beneath the melting layer (located around 3 miles, or 5 kilometers, above ground) can be seen in the heavier areas of precipitation, since CloudSat's cloud profiling radar (CPR) signal dampens when precipitation particles are larger than 0.12 inches (3 millimeters) in size. Smaller cumulus and cumulonimbus clouds are seen north of the area of moderate to heavy precipitation. The cirrus canopy (anvil clouds) extends outward from the storm system (shown in blue and green colors). An animation is available at https://photojournal.jpl.nasa.gov/catalog/PIA17392
NASA's CloudSat satellite flew over Hurricane Maria on Sept. 17, 2017, at 1:23 p.m. EDT (17:23 UTC) as the storm had just strengthened into a hurricane in the Atlantic Ocean. Hurricane Maria contained estimated maximum sustained winds of 75 miles per hour (65 knots) and had a minimum barometric pressure of 986 millibars. CloudSat flew over Maria through the center of the rapidly intensifying storm, directly through an overshooting cloud top (a dome-shaped protrusion that shoots out of the top of the anvil cloud of a thunderstorm). CloudSat reveals the vertical extent of the overshooting cloud top, showing the estimated height of the cloud to be 11 miles (18 kilometers). Areas of high reflectivity with deep red and pink colors extend well above 9 miles (15 kilometers) in height, showing large amounts of water being drawn upward high into the atmosphere. A movie is available at https://photojournal.jpl.nasa.gov/catalog/PIA21961
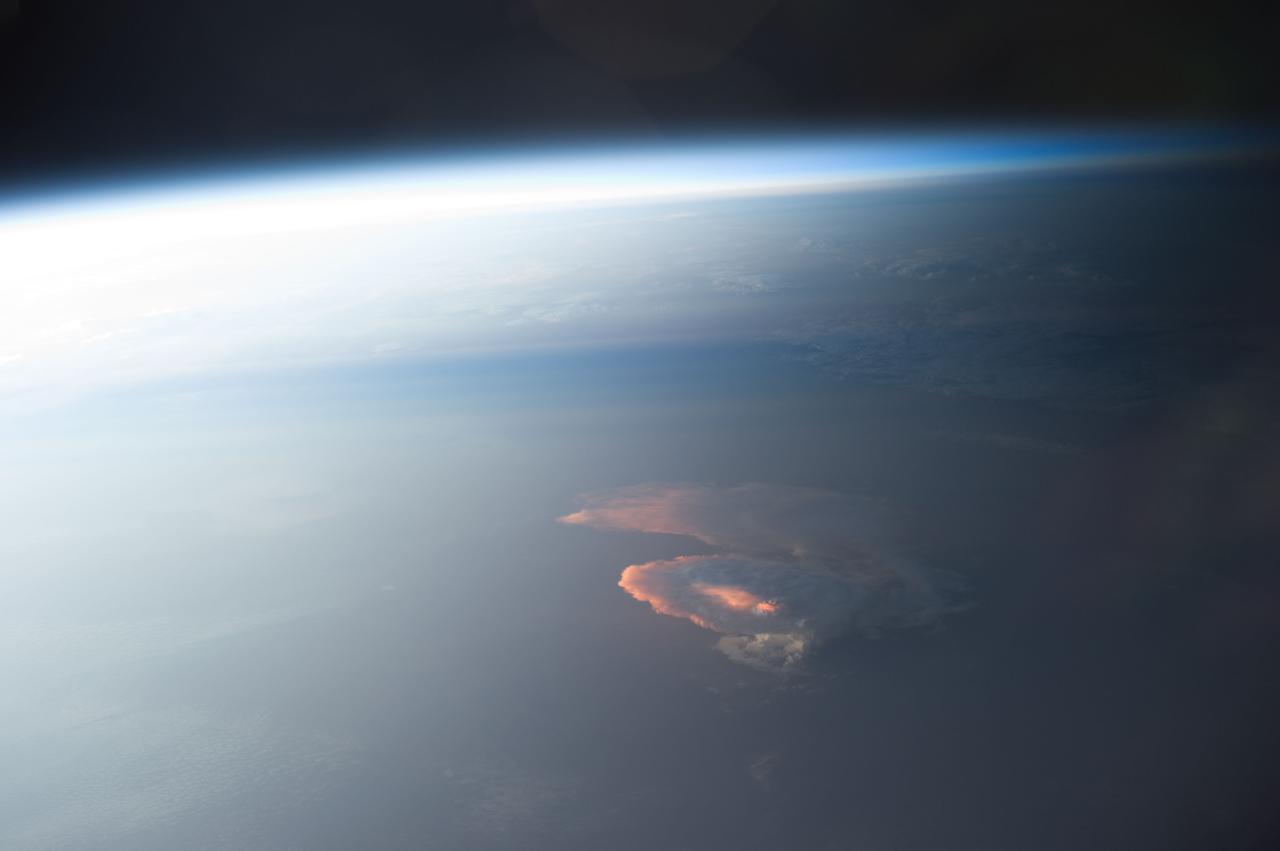
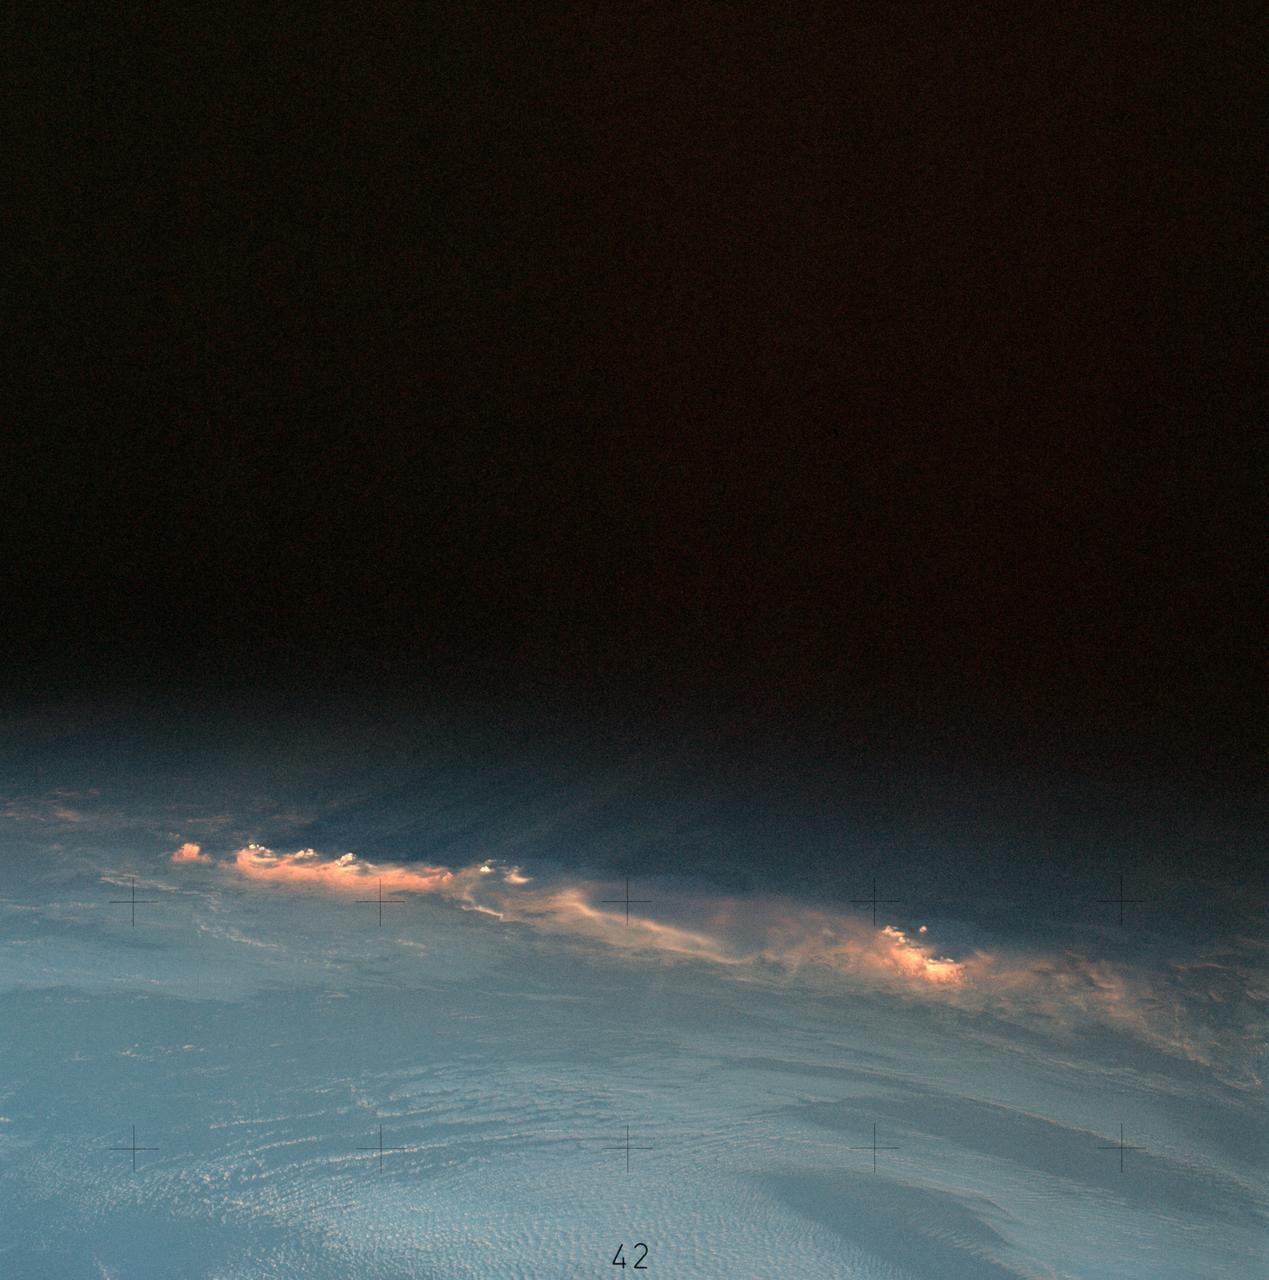
Earth Observation taken during a day pass by the Expedition 40 crew aboard the International Space Station (ISS). Folder lists this as: Afterglow on clouds. Also sent as Twitter message: Sun highlights a storm from underneath.
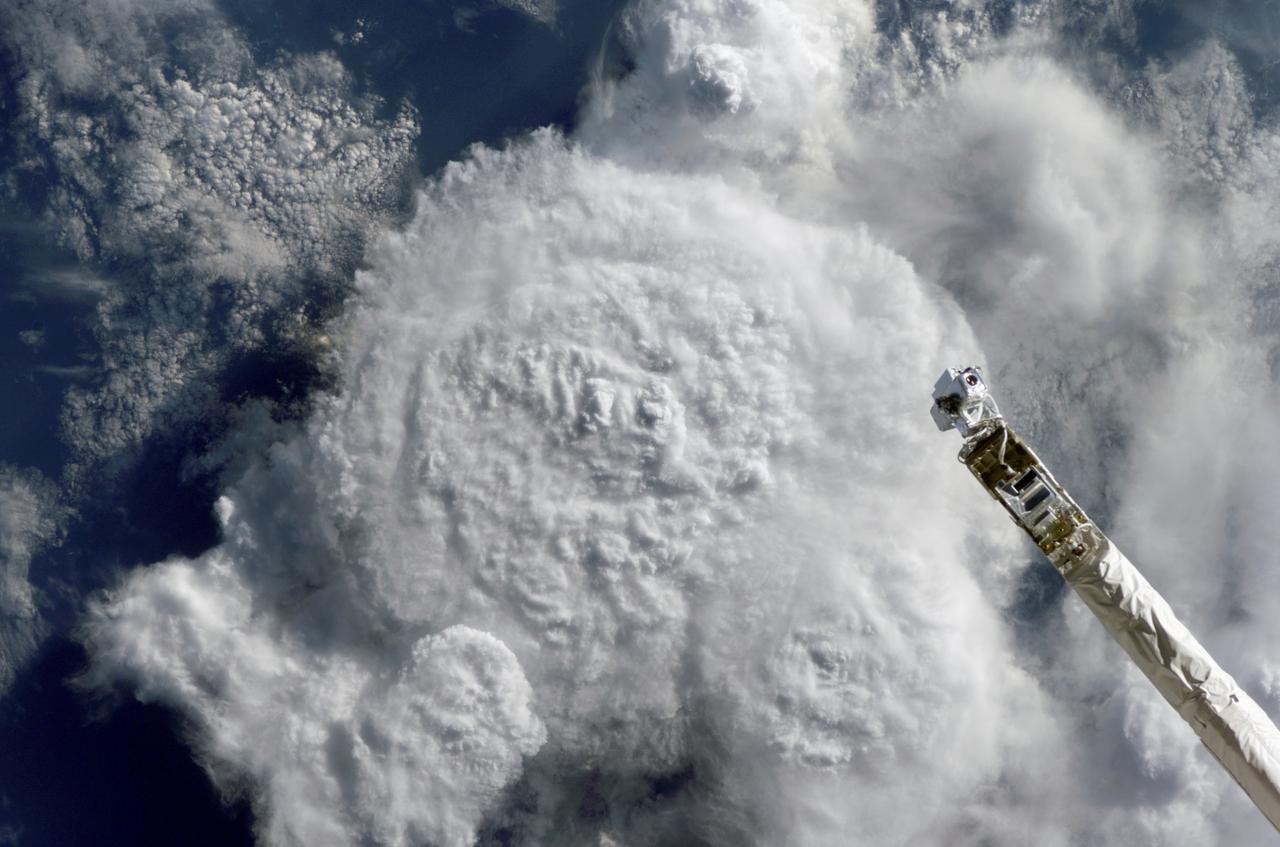
S114-E-5746 (29 July 2005) --- A mass of storm clouds was photographed by a STS-114 crewmember onboard the Space Shuttle Discovery. Part of the Orbiter Boom Sensor system end effector is also visible in the frame.

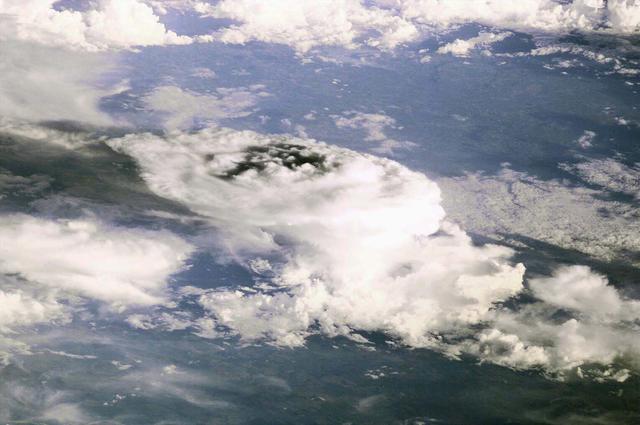
ISS013-E-08167 (19 April 2006) --- A mass of storm clouds was photographed by an Expedition 13 crewmember from a window on the International Space Station. A Soyuz spacecraft docked to the station and the Canadarm2 are visible at right.

iss071e620932 (Aug. 20, 2024) --- Lightning (at center) illuminates the storm clouds above China near the coast of the Taiwan Strait in this photograph from the International Space Station as it orbited 261 miles above the Asian nation.
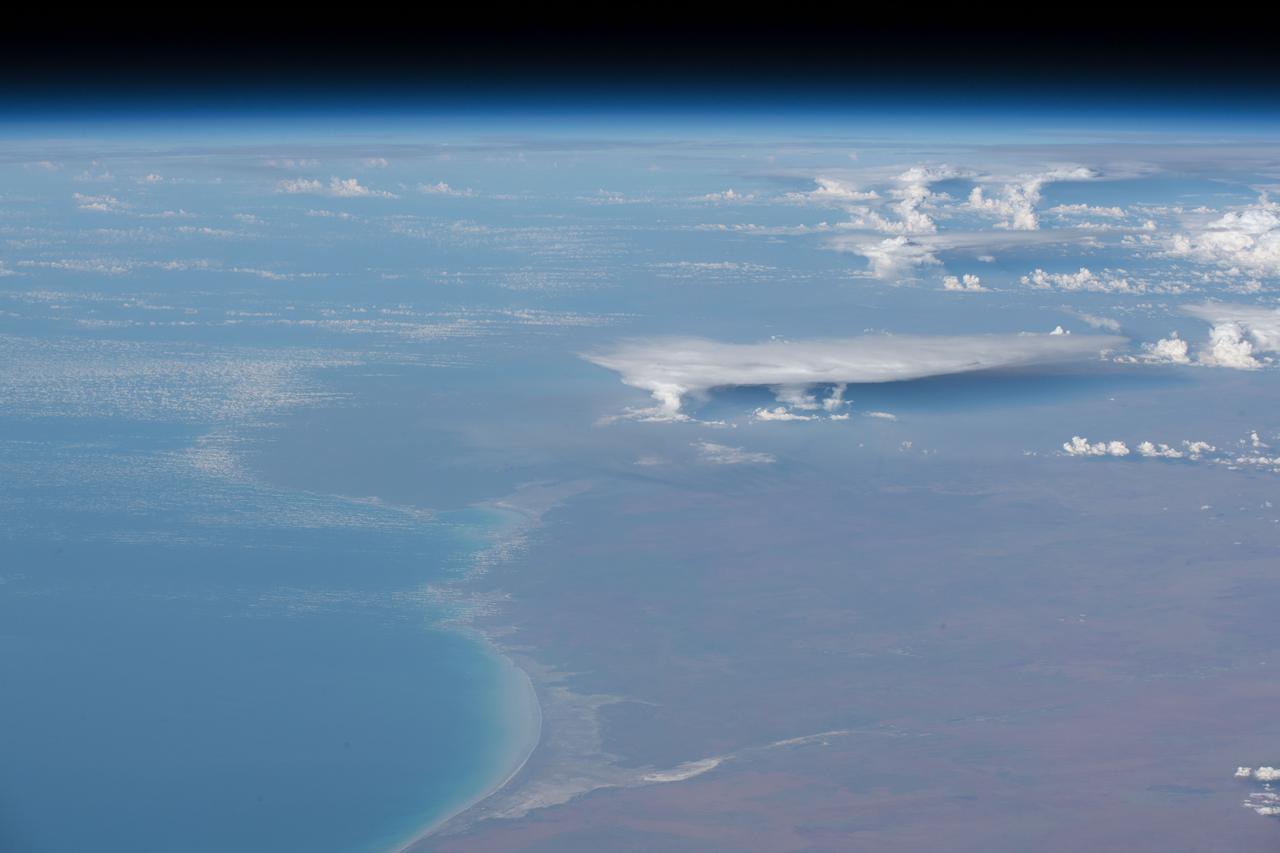
iss057e105417 (Nov. 24, 2018) --- The International Space Station was flying 257 miles above Western Australia when an Expedition 57 crew member photographed storm clouds on the west coast of the continent.
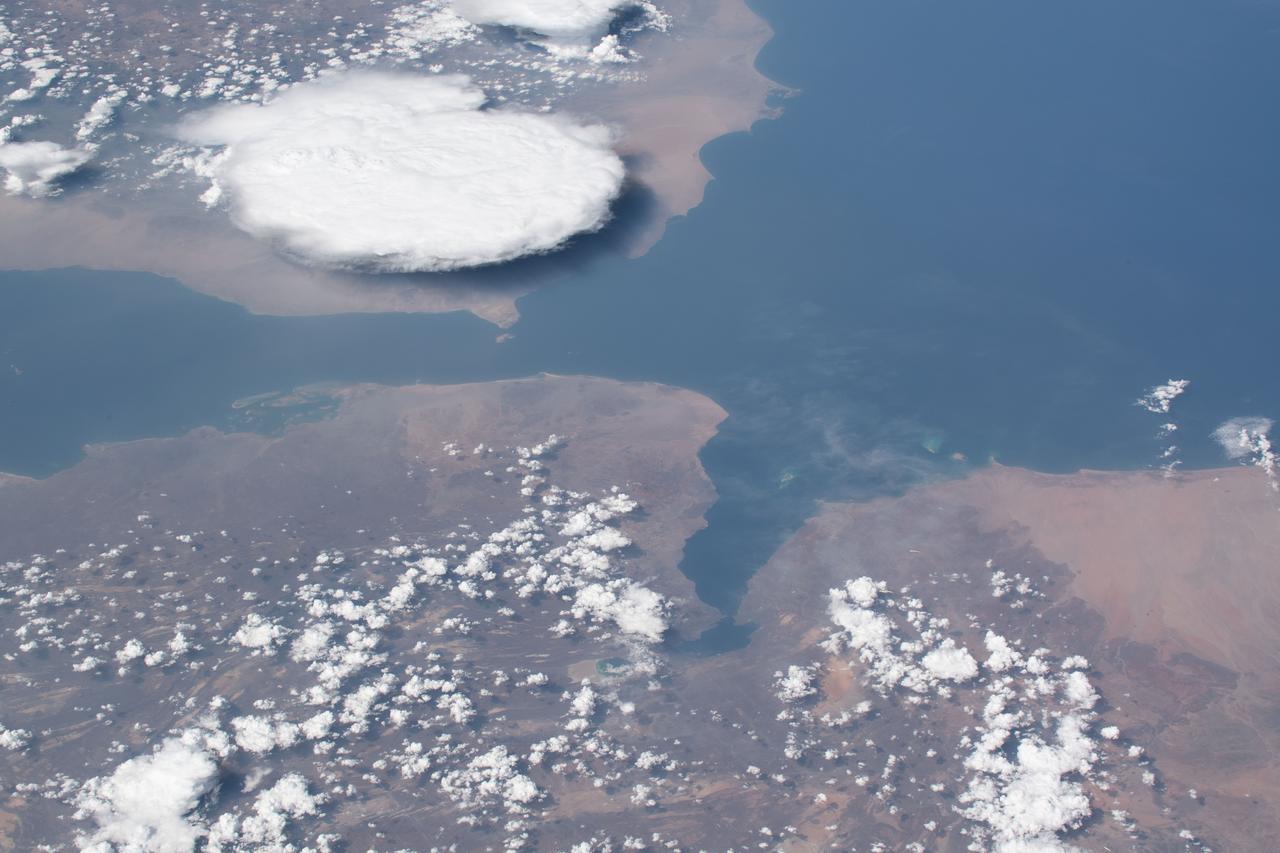
iss059e078914 (May 29, 2019) --- Storm clouds are seen on the southwestern coast of Yemen as the International Space Station was about to fly 254 miles over the Bab al-Mandab Strait in between the Gulf of Aden and the Red Sea.
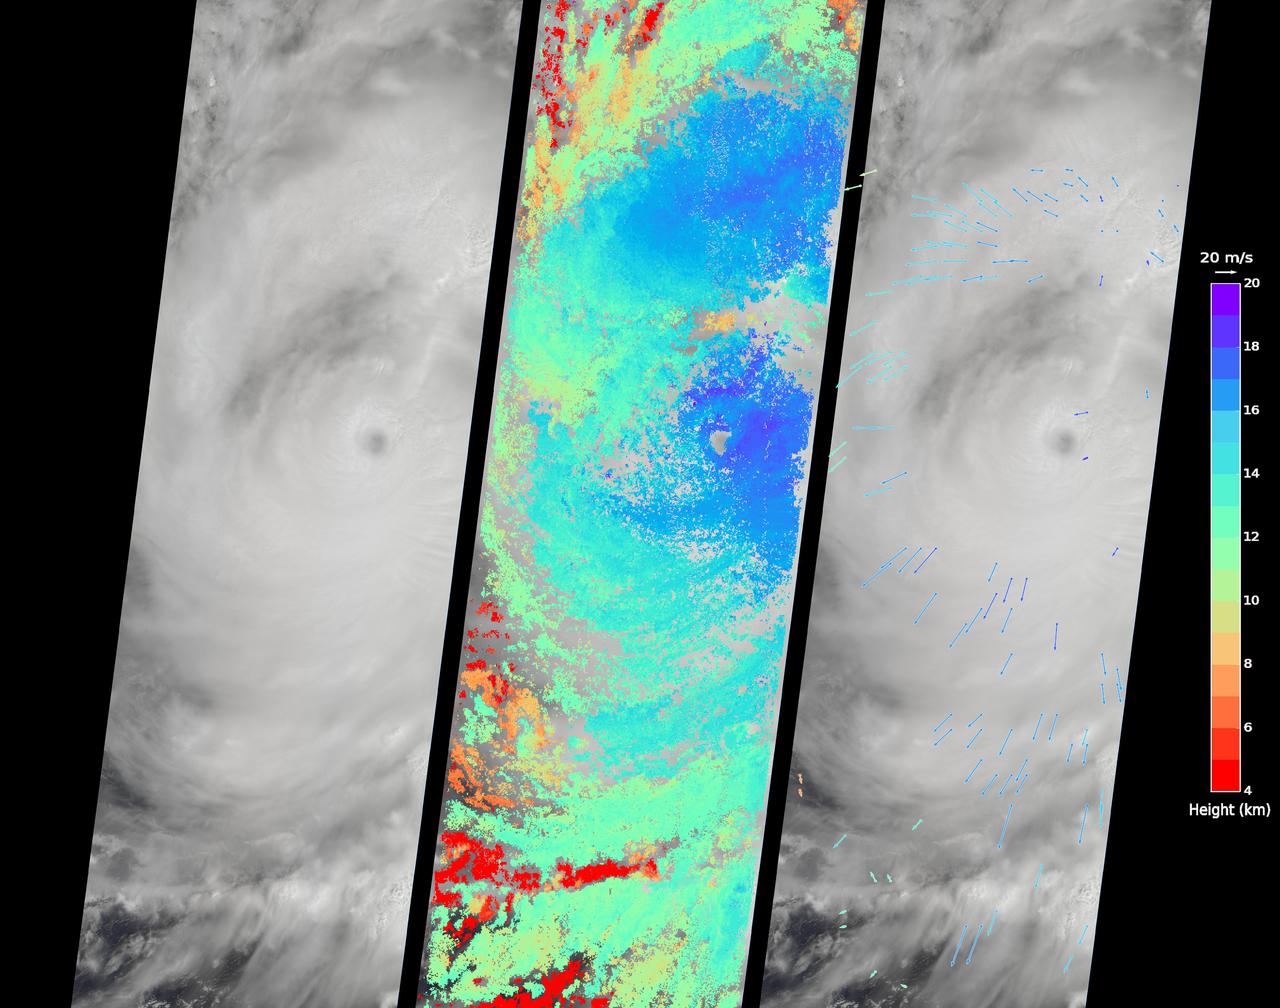
On Sept. 14, 2016, the eye of Super Typhoon Meranti passed just south of Taiwan. The enormous storm, classified as a Category 5 typhoon at the time, still caused much disruption on the island. Nearly 500,000 homes lost power, schools were closed, and most flights were cancelled. Maximum wind speeds were 180 miles per hour (290 kilometers per hour) as the storm passed, and more than 25 inches (64 centimeters) of rain fell on some areas of the country. However, the storm did not pass over Taiwan's mountainous landscape, which would have weakened it. That means it will remain strong as it heads toward mainland China, unlike Super Typhoon Nepartak in July, which weakened from a Category 5 typhoon to a tropical storm after crossing Taiwan. Meranti is currently maintaining Category 4 strength and is expected to make landfall near Shantou, Guangdong province, on Thursday, September 15. The coast of China is more vulnerable to storm surges than Taiwan due to shallower coastal waters and recent rainfall. There is risk of substantial flooding. On Sept. 14, at 10:45 AM local time, the Multi-angle Imaging SpectroRadiometer (MISR) instrument aboard NASA's Terra satellite passed directly over the eye of Meranti. On the left is a natural-color image from MISR's nadir-pointing camera. At this time the eye of Meranti was just off the southern tip of Taiwan, which is invisible under the clouds. The coast of China is barely visible through the clouds in the upper left portion of the image. The small eye and dense high clouds are both markers of the storm's power. MISR's nine cameras, each pointed at a different angle, can be used to determine the heights of clouds based on geometric shifts among the nine images. The middle panel shows these stereo-derived cloud top heights superimposed on the natural color image. The clouds of the central core of Typhoon Meranti have heights ranging between 16 and 20 kilometers (10 and 12.5 miles). It takes about seven minutes for all nine cameras to image the same location on the ground, and wind velocity can be calculated from the motion of the clouds over this seven-minute period. The right panel plots these wind velocities as vectors which indicate both direction and speed. The length of the arrow corresponds to the wind speed, which can be compared to the reference 20 meters per second (45 miles per hour) arrow in the key. Hurricanes and typhoons in the Northern Hemisphere rotate counterclockwise due to the Earth's rotation, but these wind vectors mainly show motion outward from the eye at the storm tops. This is due to the fact that hurricanes draw in moist air at low altitudes, which then flows upwards and outwards around the eye reversing direction. These data were acquired during Terra orbit 88865. http://photojournal.jpl.nasa.gov/catalog/PIA17309
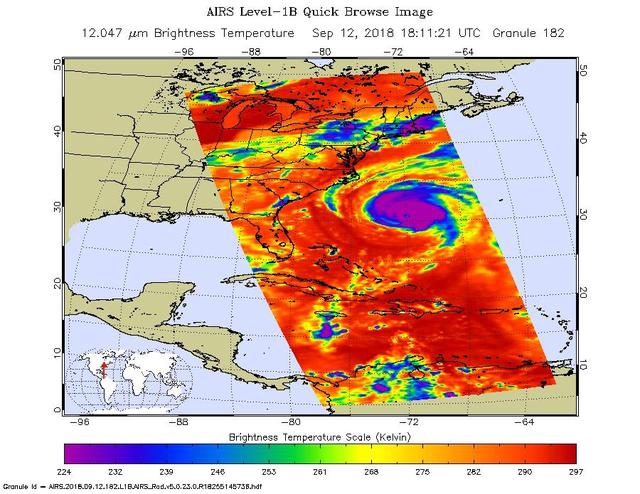
This image, taken at 1:35 pm local time on Tuesday, September 11, 2018 by the Atmospheric Infrared Sounder (AIRS) onboard NASA's Aqua satellite shows Hurricane Florence whose strong winds are expected to reach the Carolina coast late Thursday. Florence intensified from a Category 2 to a Category 4 storm in a matter of hours. As of Tuesday evening, Florence had maximum sustained winds of 140 mph (225 kph). Figure 1 shows Hurricane Florence in visible light, much as our eyes would see it. This is a classic image of a strong hurricane, with a well-defined eye near the center of a large, thick cloud shield containing bands of very thick clouds, and high, thin clouds far from the storm where air flows away from the thick rain clouds. AIRS has more than 2,000 "channels" that capture various hues of infrared, and this image represents the temperature of the cloud tops and the ocean surface (called "brightness temperature" in the image). Purple shows very cold clouds high in the atmosphere, blue and green show the warmer temperatures of lower clouds, and red shows the surface. Florence has the characteristics of a mature, powerful hurricane: an extensive, nearly symmetric ring of deep, cold rain clouds in purple; slightly shallower rain clouds in the outer perimeter seen in green; a large area of cloud-free air flowing away from the storm in red; and a well-defined eye (seen as the greenish spot near the center) where warm low clouds can be seen below. https://photojournal.jpl.nasa.gov/catalog/PIA22698
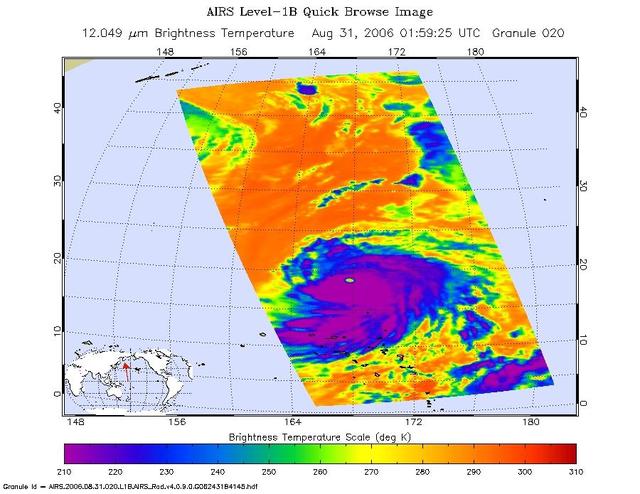
This infrared image shows Typhoon Ioke in the Western Pacific, from the Atmospheric Infrared Sounder AIRS on NASA Aqua satellite in August, 2006. Because infrared radiation does not penetrate through clouds, AIRS infrared images show either the temperature of the cloud tops or the surface of the Earth in cloud-free regions. The lowest temperatures (in purple) are associated with high, cold cloud tops that make up the top of the storm. In cloud-free areas the AIRS instrument will receive the infrared radiation from the surface of the Earth, resulting in the warmest temperatures (orange/red). http://photojournal.jpl.nasa.gov/catalog/PIA00511