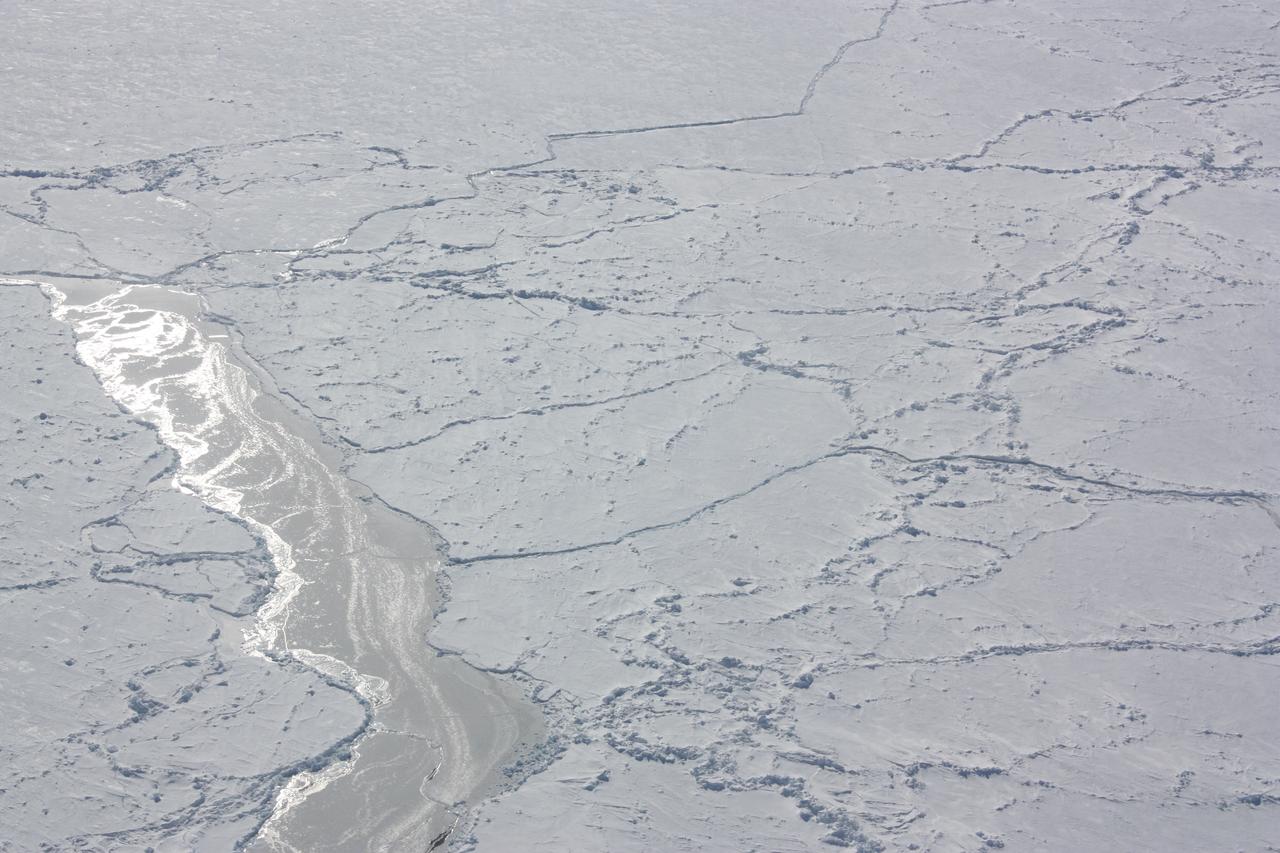
Sunlight reflecting off of ice in the Bellingshausen Sea on Oct. 19, 2012. Credit: NASA / George Hale NASA's Operation IceBridge is an airborne science mission to study Earth's polar ice. For more information about IceBridge, visit: <a href="http://www.nasa.gov/icebridge" rel="nofollow">www.nasa.gov/icebridge</a> <b><a href="http://www.nasa.gov/audience/formedia/features/MP_Photo_Guidelines.html" rel="nofollow">NASA image use policy.</a></b> <b><a href="http://www.nasa.gov/centers/goddard/home/index.html" rel="nofollow">NASA Goddard Space Flight Center</a></b> enables NASA’s mission through four scientific endeavors: Earth Science, Heliophysics, Solar System Exploration, and Astrophysics. Goddard plays a leading role in NASA’s accomplishments by contributing compelling scientific knowledge to advance the Agency’s mission. <b>Follow us on <a href="http://twitter.com/NASA_GoddardPix" rel="nofollow">Twitter</a></b> <b>Like us on <a href="http://www.facebook.com/pages/Greenbelt-MD/NASA-Goddard/395013845897?ref=tsd" rel="nofollow">Facebook</a></b> <b>Find us on <a href="http://instagrid.me/nasagoddard/?vm=grid" rel="nofollow">Instagram</a></b>
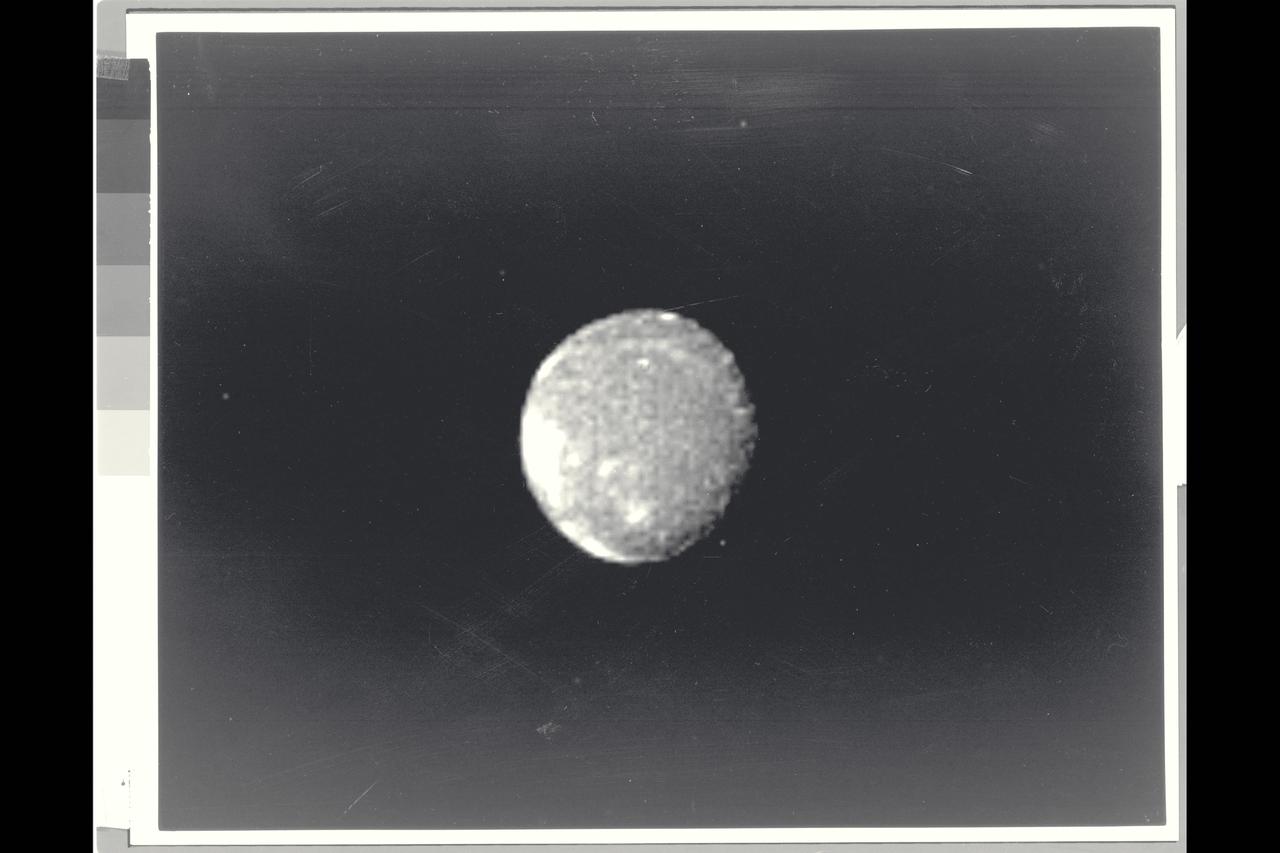
Range : 2.52 million miles (1.56 million miles) Resolution : 47km. ( 29 mi.) Closest Approach: 127,000 km. (79,000 mi.) P-29479B/W This Voyager 2 image of the brightest Uranian satellite of the five largest, Ariel, was shot through a clear filter with the narrow angle camera. Ariel is about 1,300 km. ( 800 mi. )in diameter. This image shows several distinct bright areas that reflect nearly 45 % of the incident sunlight. On average, the satellite displays reflectivity of about 25-30 %. The bright areas are probably fresh water ice, perhaps excavated by impacts. the south pole of Ariel is slightly off center of the disk in this view.
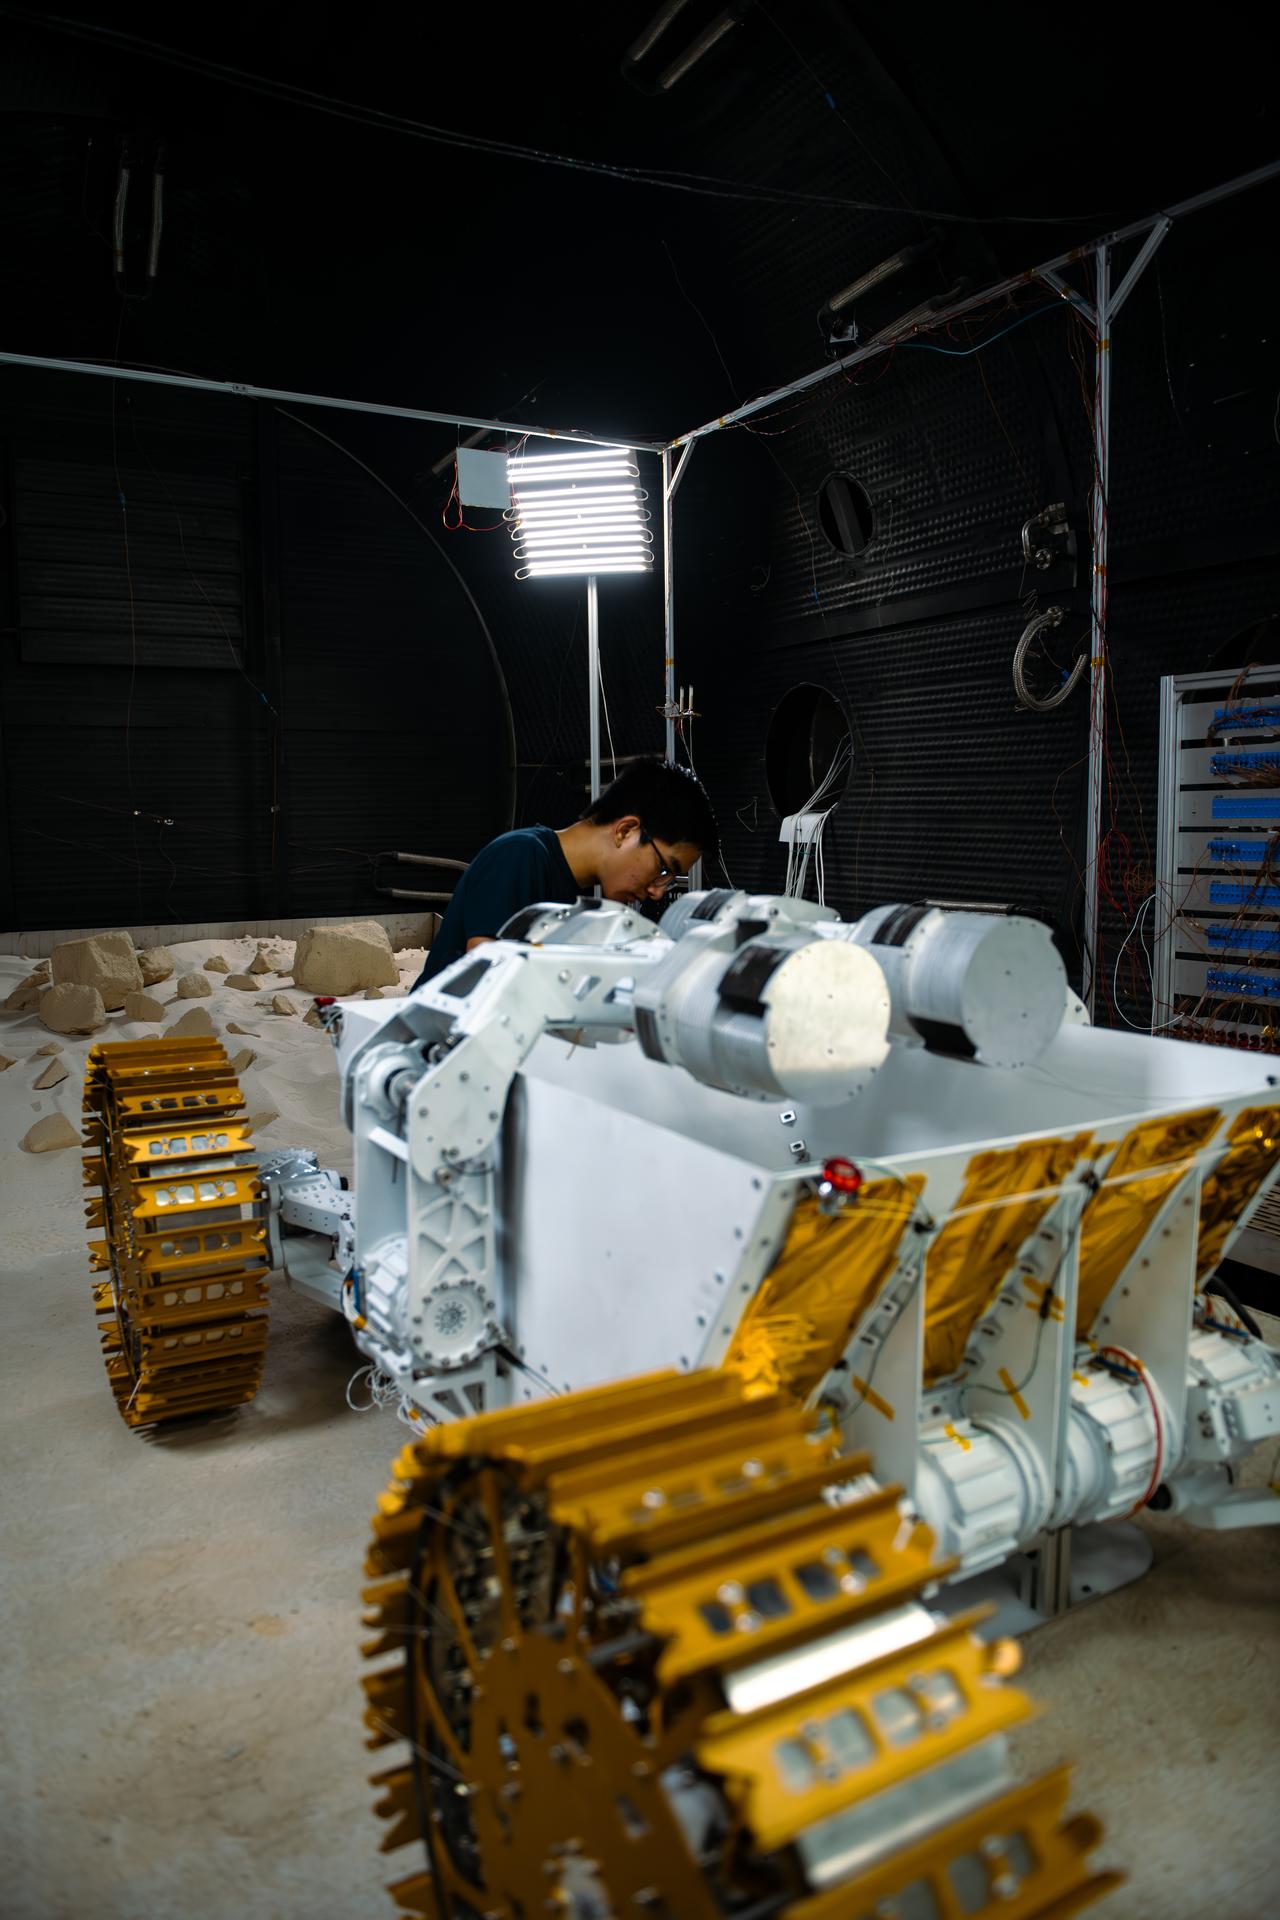
Starpath’s rover sits on a concrete slab that will be used to mimic the rugged lunar surface within a vacuum chamber at NASA’s Marshall Space Flight Center in Huntsville, Alabama, on July 30, 2025. The slab features a sandy, rocky terrain, and lamps within the chamber will turn on and off to simulate sunlight. The technology startup headquartered in Hawthorne, California, won second place overall at the agency’s Break the Ice Lunar Challenge’s live demonstration and finale in June 2024. This competition, one of NASA’s Centennial Challenges, tasked competitors to design, build, and demonstrate robotic technologies that could excavate and transport the icy, rocky dirt – otherwise known as regolith – found on the Moon. Starpath’s visit to NASA Marshall was part of their prize opportunity to test their upgraded lunar regolith excavation and transportation rover in the center’s 20-foot thermal vacuum chamber. For more information, contact NASA Marshall’s Office of Communications at 256-544-0034
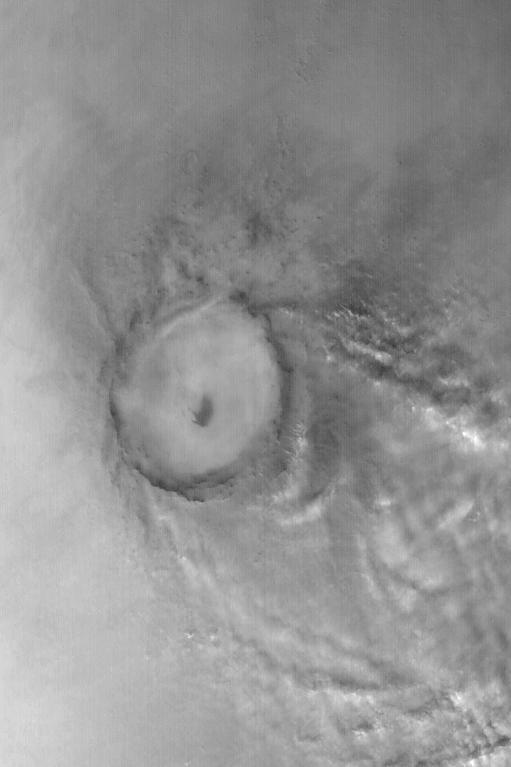
Mie Crater, a large basin formed by asteroid or comet impact in Utopia Planitia, lies at the center of this Mars Global Surveyor (MGS) Mars Orbiter Camera (MOC) red wide angle image. The crater is approximately 104 km (65 mi) across. To the east and southeast (toward the lower right) of Mie, in this 5 December 2003 view, are clouds of dust and water ice kicked up by local dust storm activity. It is mid-winter in the northern hemisphere of Mars, a time when passing storms are common on the northern plains of the red planet. Sunlight illuminates this image from the lower left; Mie Crater is located at 48.5°N, 220.3°W. Viking 2 landed west/southwest of Mie Crater, off the left edge of this image, in September 1976. http://photojournal.jpl.nasa.gov/catalog/PIA04930

NASA image acquired September 6, 2010 The Matusevich Glacier flows toward the coast of East Antarctica, pushing through a channel between the Lazarev Mountains and the northwestern tip of the Wilson Hills. Constrained by surrounding rocks, the river of ice holds together. But stresses resulting from the glacier’s movement make deep crevasses, or cracks, in the ice. After passing through the channel, the glacier has room to spread out as it floats on the ocean. The expanded area and the jostling of ocean waves prompts the ice to break apart, which it often does along existing crevasses. On September 6, 2010, the Advanced Land Imager (ALI) on NASA’s Earth Observing-1 (EO-1) satellite captured this natural-color image of the margin of Matusevich Glacier. Shown here just past the rock-lined channel, the glacier is calving large icebergs. Low-angled sunlight illuminates north-facing surfaces and casts long shadows to the south. Fast ice anchored to the shore surrounds both the glacier tongue and the icebergs it has calved. Compared to the glacier and icebergs, the fast ice is thinner with a smoother surface. Out to sea (image left), the sea ice is even thinner and moves with winds and currents. Matusevich Glacier does not drain a significant amount of ice off of the Antarctic continent, so the glacier’s advances and retreats lack global significance. Like other Antarctic glaciers, however, Matusevich helps glaciologists form a larger picture of Antarctica’s glacial health and ice sheet volume. NASA Earth Observatory image created by Jesse Allen and Robert Simmon, using EO-1 ALI data provided courtesy of the NASA EO-1 team. Caption by Michon Scott based on image interpretation by Robert Bindschadler, NASA Goddard Space Flight Center, and Walt Meier, National Snow and Ice Data Center. Instrument: EO-1 - ALI Credit: <b><a href="http://www.earthobservatory.nasa.gov/" rel="nofollow"> NASA Earth Observatory</a></b> <b><a href="http://www.nasa.gov/centers/goddard/home/index.html" rel="nofollow">NASA Goddard Space Flight Center</a></b> enables NASA’s mission through four scientific endeavors: Earth Science, Heliophysics, Solar System Exploration, and Astrophysics. Goddard plays a leading role in NASA’s accomplishments by contributing compelling scientific knowledge to advance the Agency’s mission. <b>Follow us on <a href="http://twitter.com/NASA_GoddardPix" rel="nofollow">Twitter</a></b> <b>Join us on <a href="http://www.facebook.com/pages/Greenbelt-MD/NASA-Goddard/395013845897?ref=tsd" rel="nofollow">Facebook</a></b> To download the full resolution image go to: <a href="http://earthobservatory.nasa.gov/IOTD/view.php?id=46840" rel="nofollow">earthobservatory.nasa.gov/IOTD/view.php?id=46840</a>
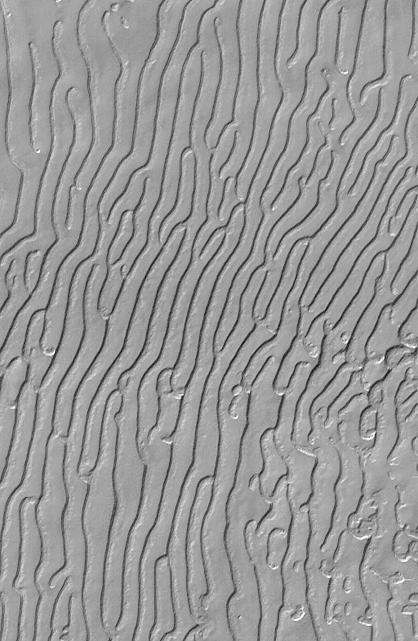
This picture is illuminated by sunlight from the upper left. Some portions of the martian south polar residual cap have long, somewhat curved troughs instead of circular pits. These appear to form in a layer of material that may be different than that in which "swiss cheese" circles and pits form, and none of these features has any analog in the north polar cap or elsewhere on Mars. This picture shows the "fingerprint" terrain as a series of long, narrow depressions considered to have formed by collapse and widening by sublimation of ice. Unlike the north polar cap, the south polar region stays cold enough in summer to retain frozen carbon dioxide. Viking Orbiter observations during the late 1970s showed that very little water vapor comes off the south polar cap during summer, indicating that any frozen water that might be there remains solid throughout the year. This Mars Global Surveyor (MGS) Mars Orbiter Camera (MOC) image was obtained in early southern spring on August 4, 1999. It shows an area 3 x 5 kilometers (1.9 x 3.1 miles) at a resolution of about 7.3 meters (24 ft) per pixel. Located near 86.0°S, 53.9°W. http://photojournal.jpl.nasa.gov/catalog/PIA02373
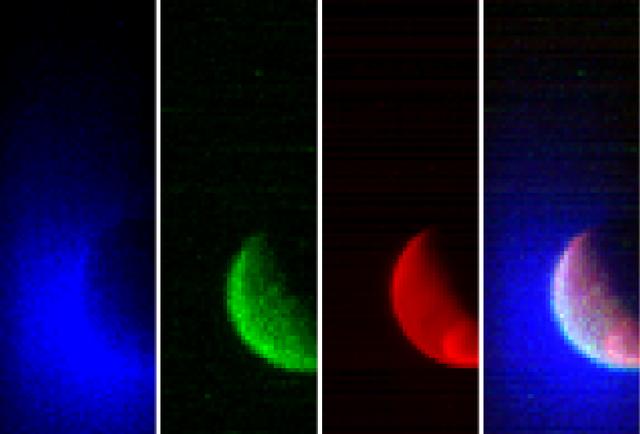
NASA’s Mars Atmosphere and Volatile Evolution (MAVEN) spacecraft has obtained its first observations of the extended upper atmosphere surrounding Mars. The Imaging Ultraviolet Spectrograph (IUVS) instrument obtained these false-color images eight hours after the successful completion of Mars orbit insertion by the spacecraft at 10:24 p.m. EDT Sunday, Sept. 21, after a 10-month journey. The image shows the planet from an altitude of 36,500 km in three ultraviolet wavelength bands. Blue shows the ultraviolet light from the sun scattered from atomic hydrogen gas in an extended cloud that goes to thousands of kilometers above the planet’s surface. Green shows a different wavelength of ultraviolet light that is primarily sunlight reflected off of atomic oxygen, showing the smaller oxygen cloud. Red shows ultraviolet sunlight reflected from the planet’s surface; the bright spot in the lower right is light reflected either from polar ice or clouds. The oxygen gas is held close to the planet by Mars’ gravity, while lighter hydrogen gas is present to higher altitudes and extends past the edges of the image. These gases derive from the breakdown of water and carbon dioxide in Mars’ atmosphere. Over the course of its one-Earth-year primary science mission, MAVEN observations like these will be used to determine the loss rate of hydrogen and oxygen from the Martian atmosphere. These observations will allow us to determine the amount of water that has escaped from the planet over time. MAVEN is the first spacecraft dedicated to exploring the tenuous upper atmosphere of Mars. Read more: <a href="http://1.usa.gov/1oj2Av3" rel="nofollow">1.usa.gov/1oj2Av3</a>
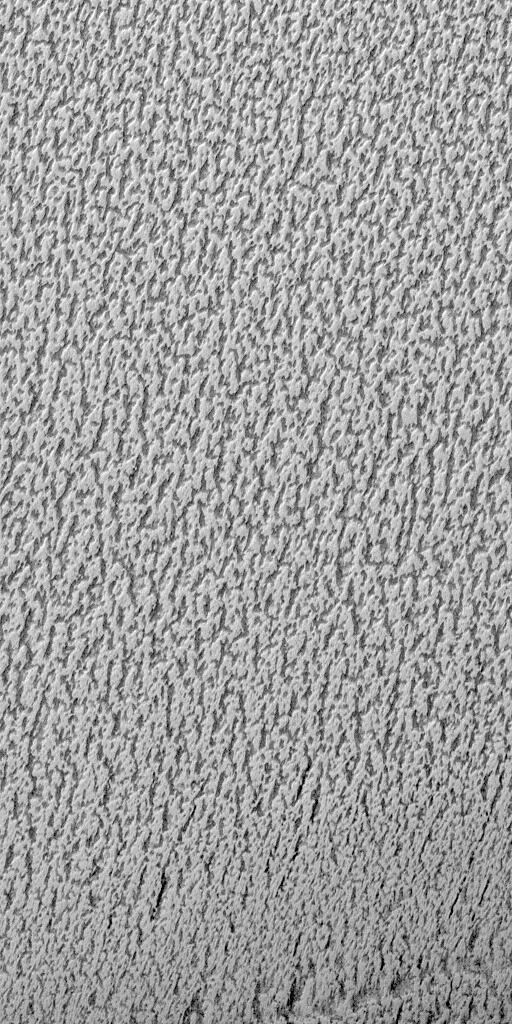
This image is illuminated by sunlight from the upper left. Martian Dairy Products? If parts of the south polar cap can look like swiss cheese (see "Martian "Swiss Cheese""), then parts of the north polar cap might as well look like some kind of cheese, too. This picture shows a cottage cheese-like texture on the surface of a part of the residual--summertime--north polar cap. The north polar cap surface is mostly covered by pits, cracks, small bumps and knobs. In this image, the cap surface appears bright and the floors of pits look dark. Based upon observations made by the Mariner 9 and Viking orbiters in the 1970s, the north polar residual cap is thought to contain mostly water ice because its summertime temperature is usually near the freezing point of water and water vapor was observed by the Vikings to be coming off the cap during summer. The south residual cap is different--its temperatures in summer remain cold enough to freeze carbon dioxide, and very little to no water vapor has been observed to come off the south cap in summer. The pits that have developed on the north polar cap surface are closely-spaced relative to the very different depressions in the south polar cap. The pits are estimated from the length of shadows cast in them to be less than about 2 meters (5.5 feet) deep. These pits probably develop slowly over thousands of years of successive spring and summer seasons. This picture was taken by the Mars Global Surveyor (MGS) Mars Orbiter Camera (MOC) during northern summer on April 5, 1999. The picture is located near 82.1°N, 329.6°W and covers an area 1.5 km wide by 3 km long (0.9 x 1.8 miles) at a resolution of 3 meters (10 ft) per pixel. http://photojournal.jpl.nasa.gov/catalog/PIA02369
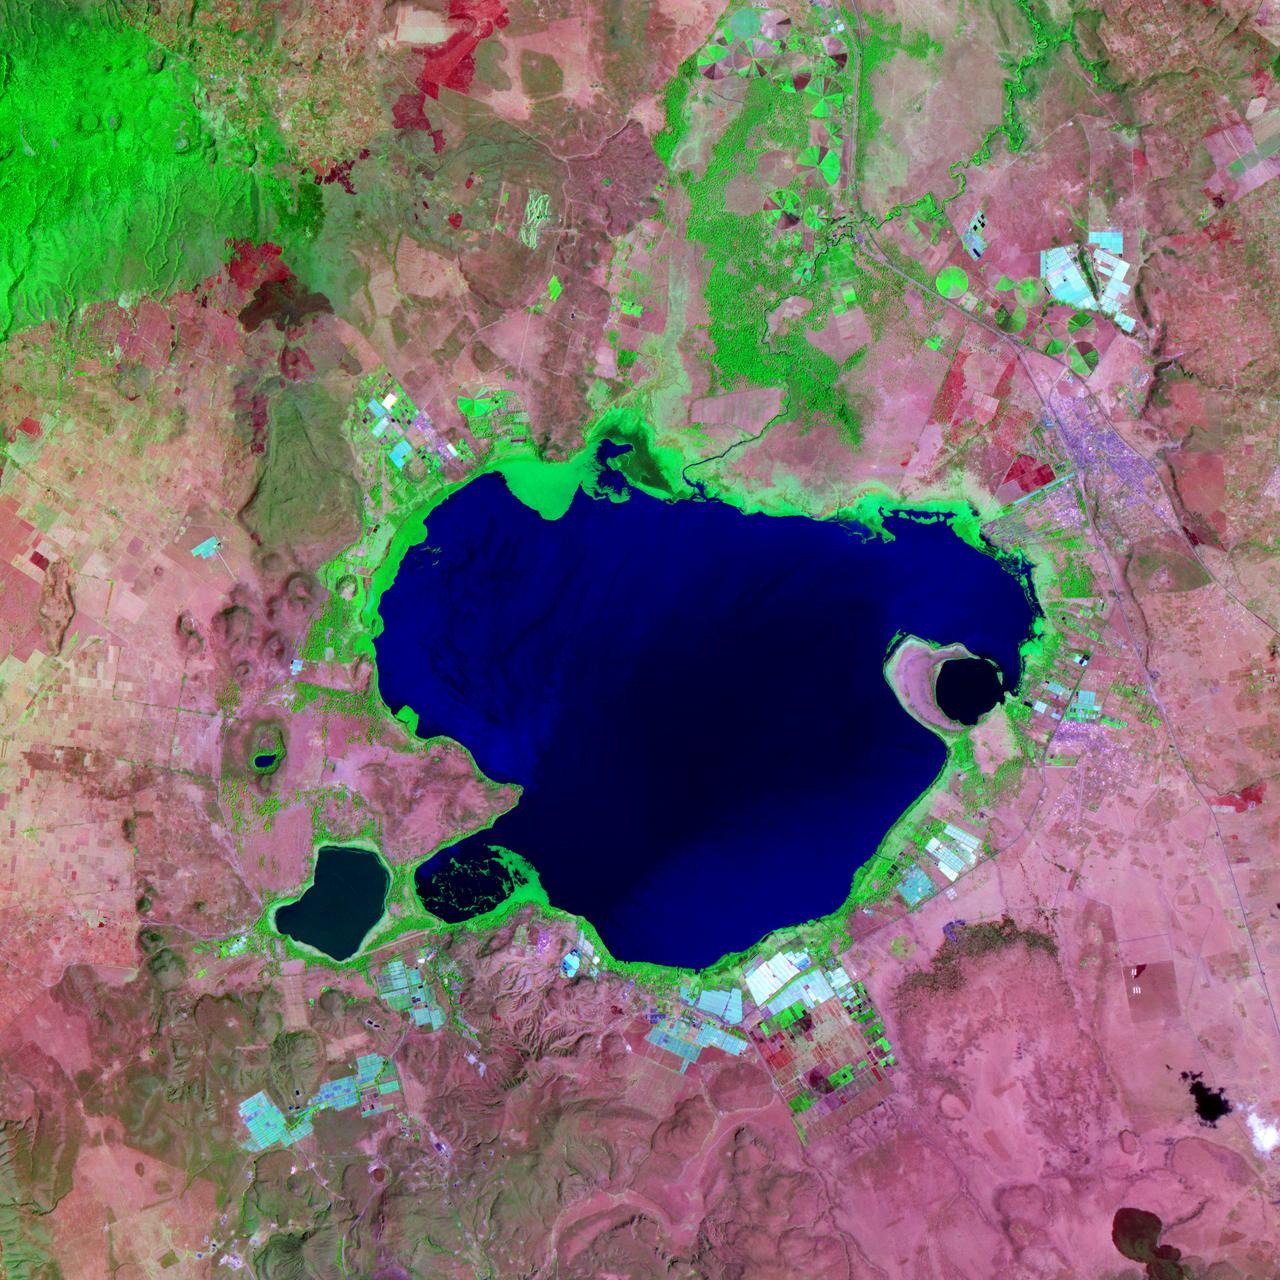
NASA satellite image acquired February 2, 2008. Outside the ground is frozen, quite possibly covered in snow and ice, and yet, stroll through a supermarket in North America or Europe in February, and you’ll be confronted with large displays of roses. We expect flowers in winter, and equatorial countries meet those expectations. A quarter of the cut flowers sold in Europe are grown in Kenya. Straddling the equator, Kenya gets steady sunlight dealt out in days that vary little in length. It’s the perfect climate for flowers year-round. The center of Kenya’s flower industry is Lake Naivasha, shown here. The Advanced Spaceborne Thermal Emission and Reflection Radiometer (ASTER) flying on NASA’s Terra satellite captured this image of Lake Naivasha on February 2, 2008. Bright white squares mix with fields of green, tan, and purple along the shores of the lake. Sunlight glints off the long rows of glass greenhouses, turning them silvery blue and white in this view from space. Fallow fields are tan and pink, while growing plants turn the ground bright green. Roses, lilies, and carnations are the most common flowers grown in the greenhouses and fields scattered around the lake. The large-scale industry shown here extends into small-scale rural farms elsewhere in Kenya, where smaller filler flowers are grown. The flowers provide an important source of income to Kenya, but the industry comes with a price. Flowers are not held to the same standards for chemical residues as food products, which are tightly regulated. Strong chemical pesticides can be used on the flowers to produce the perfect, pest-free bloom, and this could pose a health risk to workers and local wildlife, including hippos, environmental groups told the Food and Agriculture Organization of the United Nations in 2002. The chemicals may also have threatened the water quality of Lake Naivasha, one of Kenya’s few freshwater lakes. The Kenya Flower Council instituted a code of conduct establishing guidelines for pesticide that phases out the use of one of the most toxic pesticides. NASA image created by Jesse Allen, using data provided courtesy of NASA/GSFC/METI/ERSDAC/JAROS, and U.S./Japan ASTER Science Team. Caption by Holli Riebeek. Instrument: Terra - ASTER <b><a href="http://www.nasa.gov/centers/goddard/home/index.html" rel="nofollow">NASA Goddard Space Flight Center</a></b> is home to the nation's largest organization of combined scientists, engineers and technologists that build spacecraft, instruments and new technology to study the Earth, the sun, our solar system, and the universe.
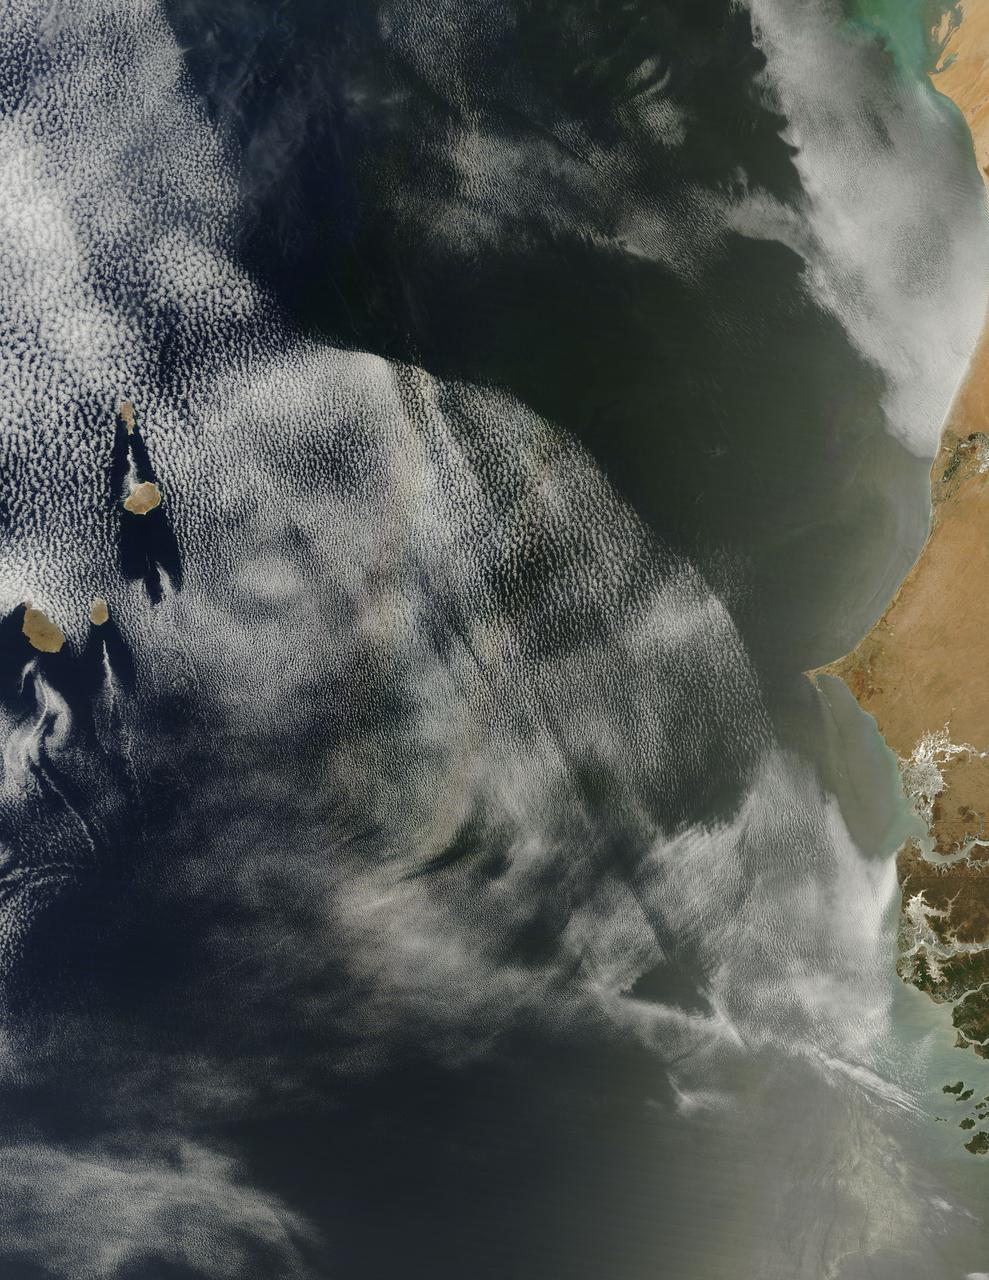
On April 23, 2013 NASA’s Terra satellite passed off the coast of West Africa, allowing the Moderate Resolution Imaging Spectroradiometer (MODIS) flying aboard to capture a curious phenomenon over the cloud deck below. The rainbow-like discoloration that can be seen streaking across the bank of marine cumulus clouds near the center of this image is known as a “glory”. A glory is caused by the scattering of sunlight by a cloud made of water droplets that are all roughly the same size, and is only produced when the light is just right. In order for a glory to be viewed, the observer’s anti-solar point must fall on the cloud deck below. In this case the observer is the Terra satellite, and the anti-solar point is where the sun is directly behind you – 180° from the MODIS line of sight. Water and ice particles in the cloud bend the light, breaking it into all its wavelengths, and the result is colorful flare, which may contain all of the colors of the rainbow. Credit: NASA/GSFC/Jeff Schmaltz/MODIS Land Rapid Response Team <b><a href="http://www.nasa.gov/audience/formedia/features/MP_Photo_Guidelines.html" rel="nofollow">NASA image use policy.</a></b> <b><a href="http://www.nasa.gov/centers/goddard/home/index.html" rel="nofollow">NASA Goddard Space Flight Center</a></b> enables NASA’s mission through four scientific endeavors: Earth Science, Heliophysics, Solar System Exploration, and Astrophysics. Goddard plays a leading role in NASA’s accomplishments by contributing compelling scientific knowledge to advance the Agency’s mission. <b>Follow us on <a href="http://twitter.com/NASA_GoddardPix" rel="nofollow">Twitter</a></b> <b>Like us on <a href="http://www.facebook.com/pages/Greenbelt-MD/NASA-Goddard/395013845897?ref=tsd" rel="nofollow">Facebook</a></b> <b>Find us on <a href="http://instagram.com/nasagoddard?vm=grid" rel="nofollow">Instagram</a></b>
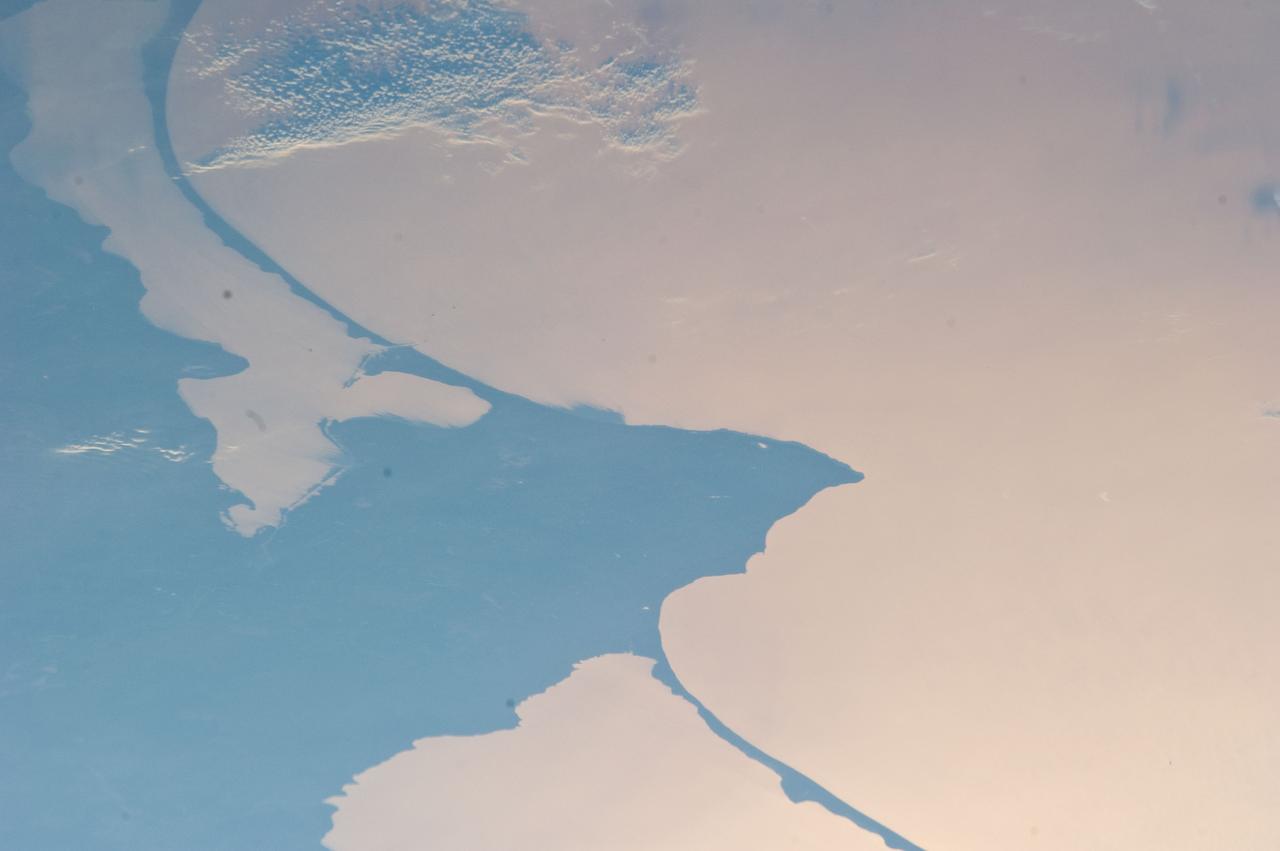
ISS028-E-024146 (2 Aug. 2011) --- Kaliningrad and Baltic Sea, Russia are featured in this image photographed by an Expedition 28 crew member on the International Space Station. This striking photograph reveals detail of the two great lagoons to the north and south of Kaliningrad, each protected from the open waters of the Baltic Sea by the thin perfect curves of current-generated sand spits. A broad arm of agricultural country separates the freshwater lagoons?known as Kurshsky Bay (or the Curonian Lagoon further north in Lithuania, just outside the top of the image) and the Vistula Lagoon. From the crew member perspective in low Earth orbit, land surfaces usually appear brighter than water, which normally appears darker and often black. Reflected sunlight, or sunglint, inverts this pattern. The reflected light in this image is a pink or coppery hue, indicating the likely existence of smog in the air since smog particles enhance the red part of the light spectrum. Camera settings used to acquire sunglint images result in high contrast that reveals excellent detail of coastlines and surface features of waterbodies, but masks land surface detail. The thin, 50 kilometer-long barge canal leading from the Baltic Sea to Kaliningrad is visible but the great port of Kaliningrad itself is not. Other human patterns on this intensively developed landscape such as towns, highways and farm boundaries are likewise masked in the image. The area has a long human history. The growth of the Vistula spit finally cut off the north Polish city of Elblag (just outside the bottom of the image) from the Baltic Sea in the 13th century. To reconnect Elblag directly with the Baltic Sea, the EU is considering funding the digging of another canal through the spit at lower right, despite ecological concerns. Kaliningrad was heavily damaged during WWII and then annexed by Russia and cleared of its German population. As the only Russian port on the Baltic Sea to be ice-free year-round, Kaliningrad then gained importance strategically as home of the Baltic Fleet.
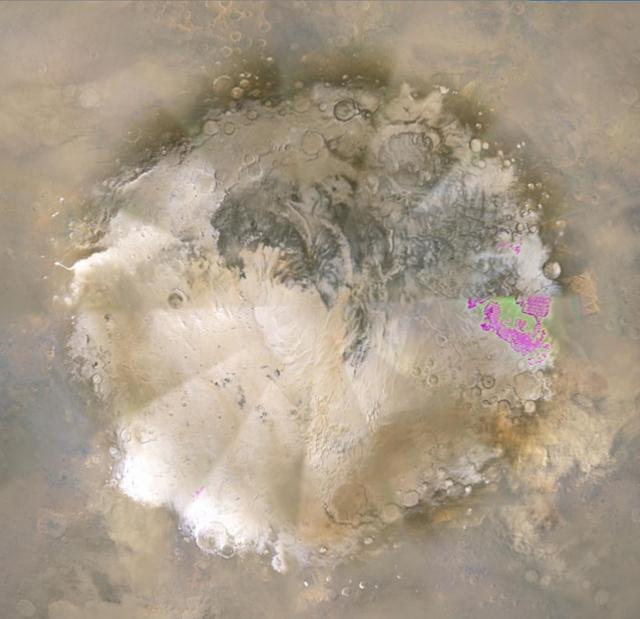
This image shows the southern high-latitudes region of Mars from March 19 through April 14, 2009, a period when regional dust storms occurred along the retreating edge of carbon-dioxide frost in the seasonal south polar cap. Compared with a full-hemisphere view (see PIA11987), this view shows more details of where the dust clouds formed and how they moved around the planet. The movie combines hundreds of images from the Mars Color Imager (MARCI) camera on NASA's Mars Reconnaissance Orbiter. In viewing the movie, it helps to understand some of the artifacts produced by the nature of MARCI images when seen in animation. MARCI acquires images in swaths from pole-to-pole during the dayside portion of each orbit. The camera can cover the entire planet in just over 12 orbits, and takes about 1 day to accumulate this coverage. The indiviual swaths are assembled into a mosaic, and that mosaic is shown here wrapped onto a sphere. The blurry portions of the mosaic, seen to be "pinwheeling" around the planet in the movie, are the portions of adjacent images viewing obliquely through the hazy atmosphsere. Portions with sharper-looking details are the central part of an image, viewing more directly downward through less atmosphere than the obliquely viewed portions. MARCI has a 180-degree field of view, and Mars fills about 78 percent of that field of view when the camera is pointed down at the planet. However, the Mars Reconnaissance Orbiter often is pointed to one side or the other off its orbital track in order to acquire targeted observations by the higher-resolution imaging systems on the spacecraft. When such rolls exceed about 20 degrees, gaps occur in the mosaic of MARCI swaths. Also, dark gaps appear when data are missing, either because of irrecoverable data drops, or because not all the data have yet been transmitted from the spacecraft. It isn't easy to see the actual dust motion in the atmosphere in these images, owing to the apparent motion of these artifacts. However, by concentrating on specific surface features (craters, prominent ice deposits, etc.) and looking for the brownish clouds of dust, it is possible to see where the storms start and how they move around the planet. In additon to tracking the storms, it is also interesting to watch how the seasonal cap shrinks from the beginning to the end of the animation. This shrinkage results from subliming of the carbon-dioxide frost from the surface as the frost absorbs southern hemisphere mid-spring sunlight. The temperature contrast between the warm sunlit ground just north of the cap's edge and the cold carbon-dioxide frost generates strong winds, enhanced by the excess carbon dioxide subliming off the cap. These winds create the conditions that lead to the dust storms. http://photojournal.jpl.nasa.gov/catalog/PIA11988
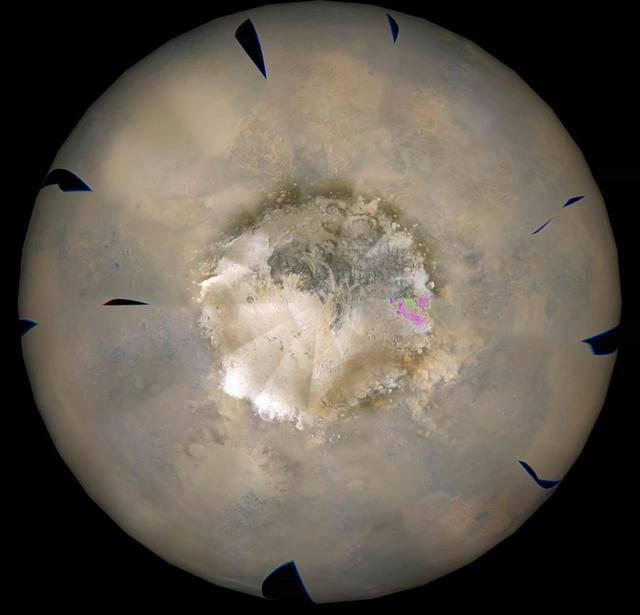
This image is from a movie from NASA Mars Reconnaissance Orbiter showing the southern high-latitudes region of Mars from Mar. 19-Apr. 14, 2009, a period when regional dust storms occurred along the retreating edge of carbon-dioxide frost in the seasonal south polar cap. The movie combines hundreds of images from the Mars Color Imager (MARCI) camera on NASA's Mars Reconnaissance Orbiter. In viewing the movie, it helps to understand some of the artifacts produced by the nature of MARCI images when seen in animation. MARCI acquires images in swaths from pole-to-pole during the dayside portion of each orbit. The camera can cover the entire planet in just over 12 orbits, and takes about 1 day to accumulate this coverage. The indiviual swaths are assembled into a mosaic, and that mosaic is shown here wrapped onto a sphere. The blurry portions of the mosaic, seen to be "pinwheeling" around the planet in the movie, are the portions of adjacent images viewing obliquely through the hazy atmosphsere. Portions with sharper-looking details are the central part of an image, viewing more directly downward through less atmosphere than the obliquely viewed portions. MARCI has a 180-degree field of view, and Mars fills about 78 percent of that field of view when the camera is pointed down at the planet. However, the Mars Reconnaissance Orbiter often is pointed to one side or the other off its orbital track in order to acquire targeted observations by the higher-resolution imaging systems on the spacecraft. When such rolls exceed about 20 degrees, gaps occur in the mosaic of MARCI swaths. Also, dark gaps appear when data are missing, either because of irrecoverable data drops, or because not all the data have yet been transmitted from the spacecraft. It isn't easy to see the actual dust motion in the atmosphere in these images, owing to the apparent motion of these artifacts. However, by concentrating on specific surface features (craters, prominent ice deposits, etc.) and looking for the brownish clouds of dust, it is possible to see where the storms start and how they move around the planet. In additon to tracking the storms, it is also interesting to watch how the seasonal cap shrinks from the beginning to the end of the animation. This shrinkage results from subliming of the carbon-dioxide frost from the surface as the frost absorbs southern hemisphere mid-spring sunlight. The temperature contrast between the warm sunlit ground just north of the cap's edge and the cold carbon-dioxide frost generates strong winds, enhanced by the excess carbon dioxide subliming off the cap. These winds create the conditions that lead to the dust storms. http://photojournal.jpl.nasa.gov/catalog/PIA11987