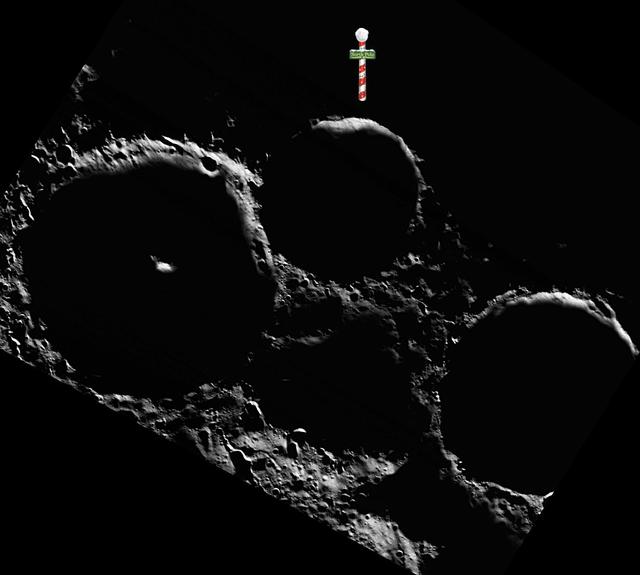
North Pole Tidings
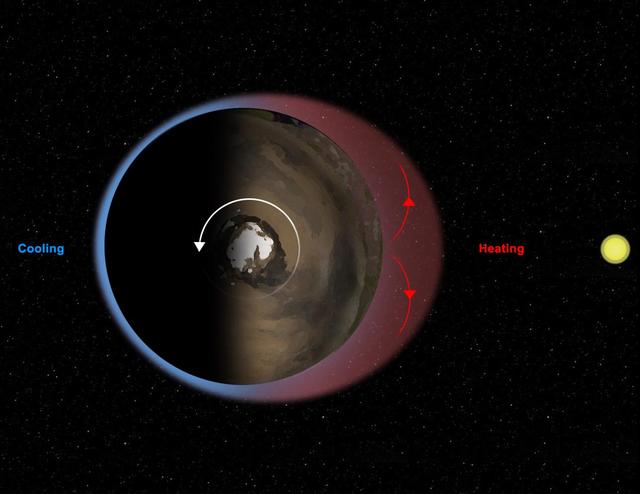
This diagram illustrates Mars thermal tides, a weather phenomenon responsible for large, daily variations in pressure at the Martian surface.
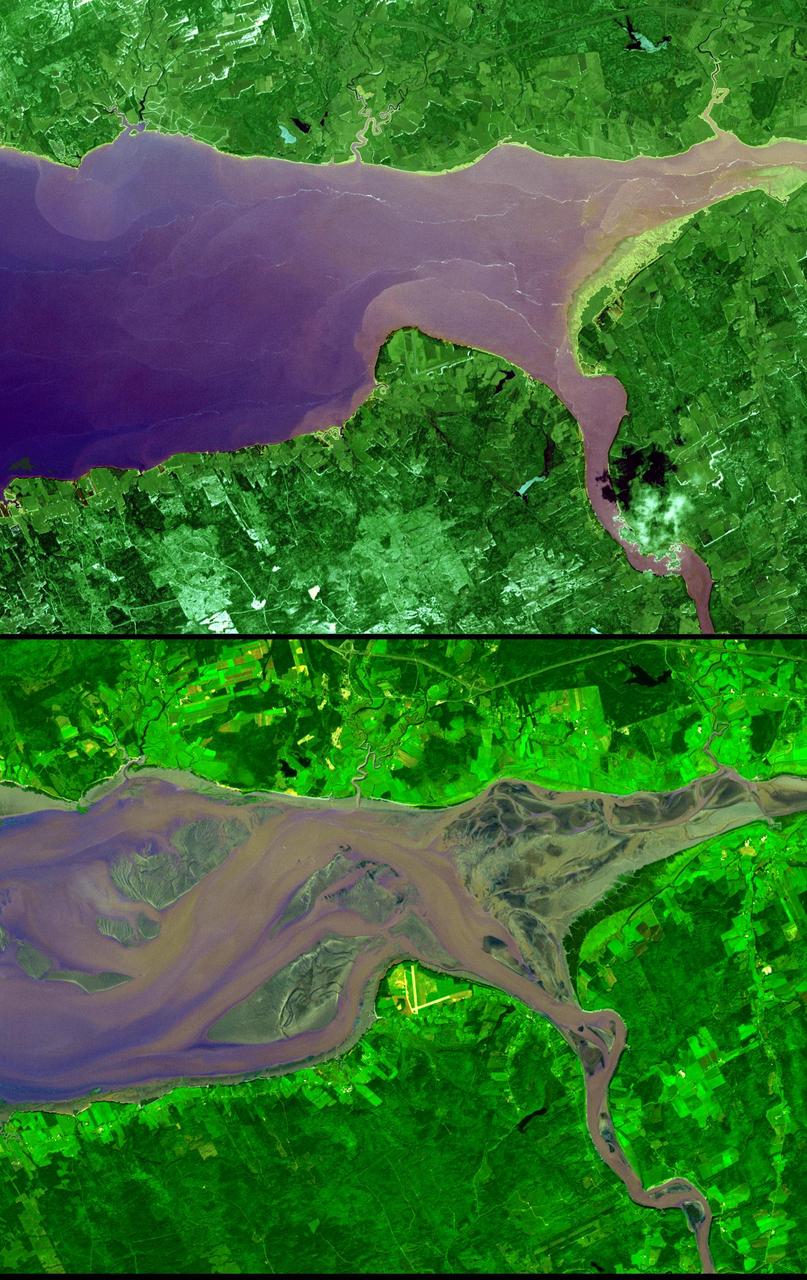
The highest tides on Earth occur in the Minas Basin, the eastern extremity of the Bay of Fundy, Nova Scotia, Canada. This image was acquired by NASA Terra spacecraft.

jsc2021e064546 (11/30/2021) --- Jessica Zinna, Tide Scientist at P&G, prepares a load of laundry that will be washed in Tide’s laundry detergent solution for P&G Telescience Investigation of Detergent Experiments (PGTIDE). The detergent will be on board SpaceX CRS-24. Following the signing of a Space Act Agreement with NASA, Tide is developing a detergent solution for space that will aid in planned space travel such as the Artemis Moon missions and a crewed roundtrip Mars mission. Image courtesy of P&G.
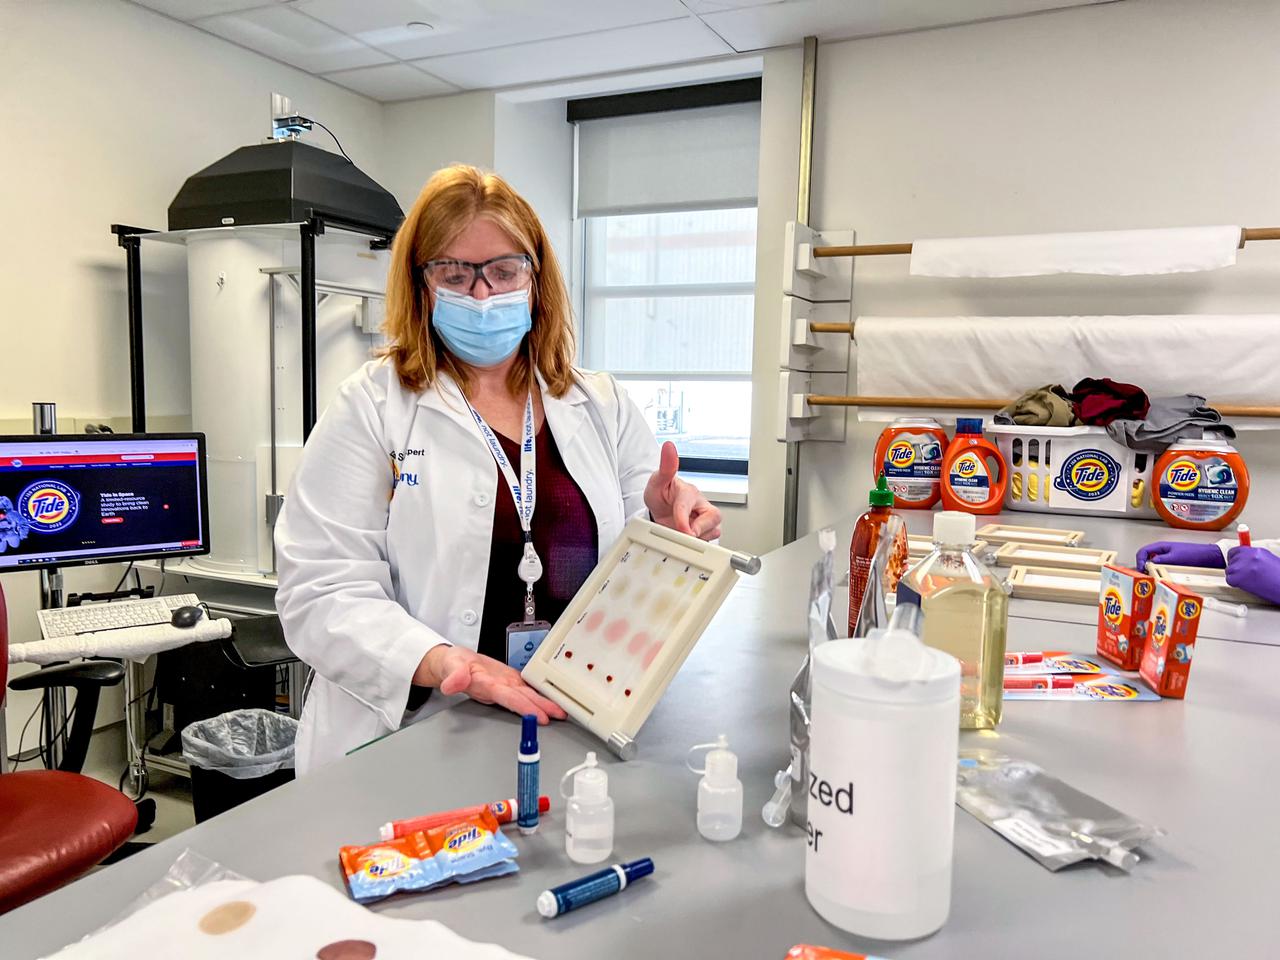
jsc2021e064548 ()11/30/2021) --- In support of P&G Telescience Investigation of Detergent Experiments (PGTIDE), Kristi Niehaus, Tide Scientist, Strategic Innovation & Technology at P&G, displays a stain set that will be used to test Tide detergent solutions on board the International Space Station National Labs in 2022 P&G Telescience Investigation of Detergent Experiments (PGTIDE). Following the signing of a Space Act Agreement with NASA, Tide is developing a detergent solution for space that will aid in planned space travel such as the Artemis Moon missions and a crewed roundtrip Mars mission. Image courtesy of P&G.
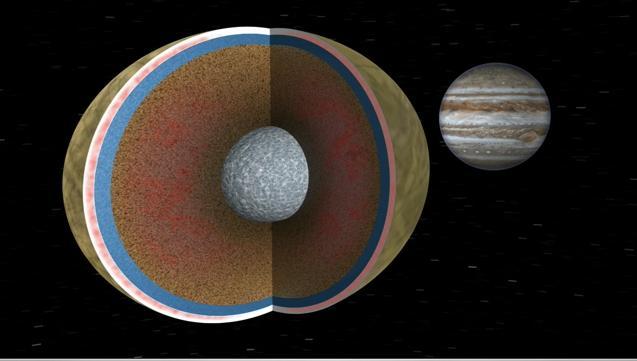
In this image, Europa is seen in a cutaway view through two cycles of its 3.5 day orbit about the giant planet Jupiter. Like Earth, Europa is thought to have an iron core, a rocky mantle and a surface ocean of salty water. Animation available at the Photo
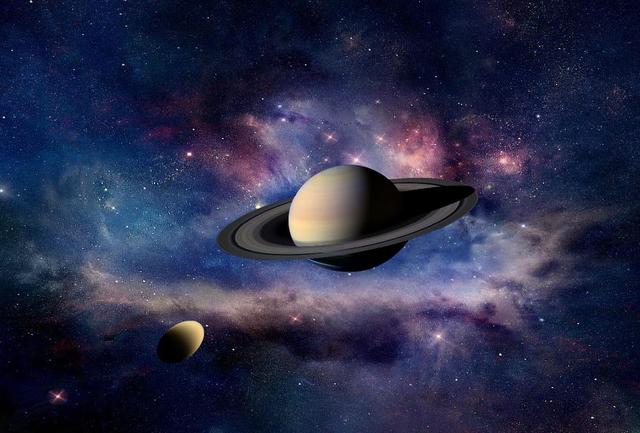
This artist concept shows tides on Titan raised by Saturn gravity, as detected by NASA Cassini spacecraft. Saturn gravitational pull on Titan, its largest moon, varies as Titan orbits along an elliptical path around the planet every 16 days.
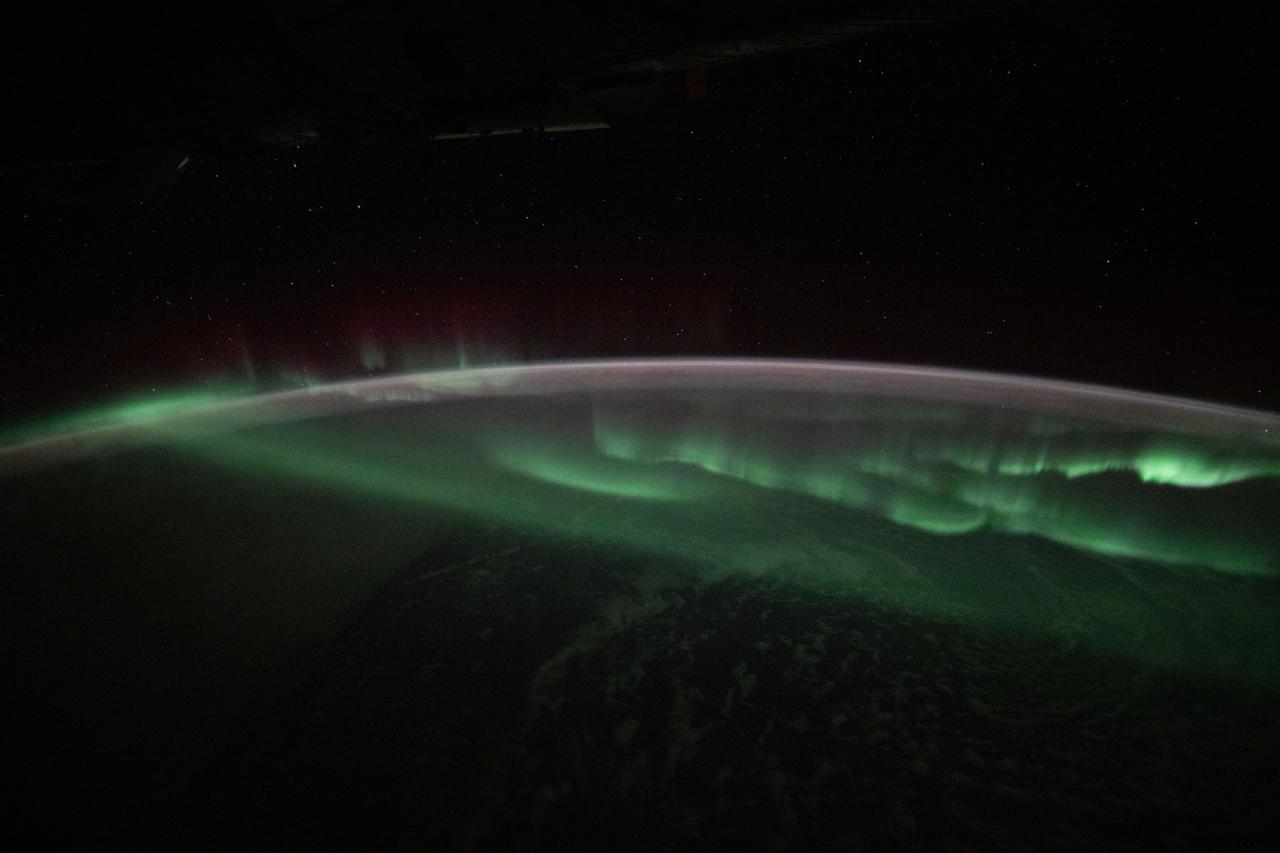
iss073e0426077 (July 26, 2025) --- The aurora australis appears to lap over the Earth like a tide washing ashore in this photograph taken at approximately 3:45 a.m. local time from the International Space Station as it orbited 269 miles above the Indian Ocean southwest of Australia.
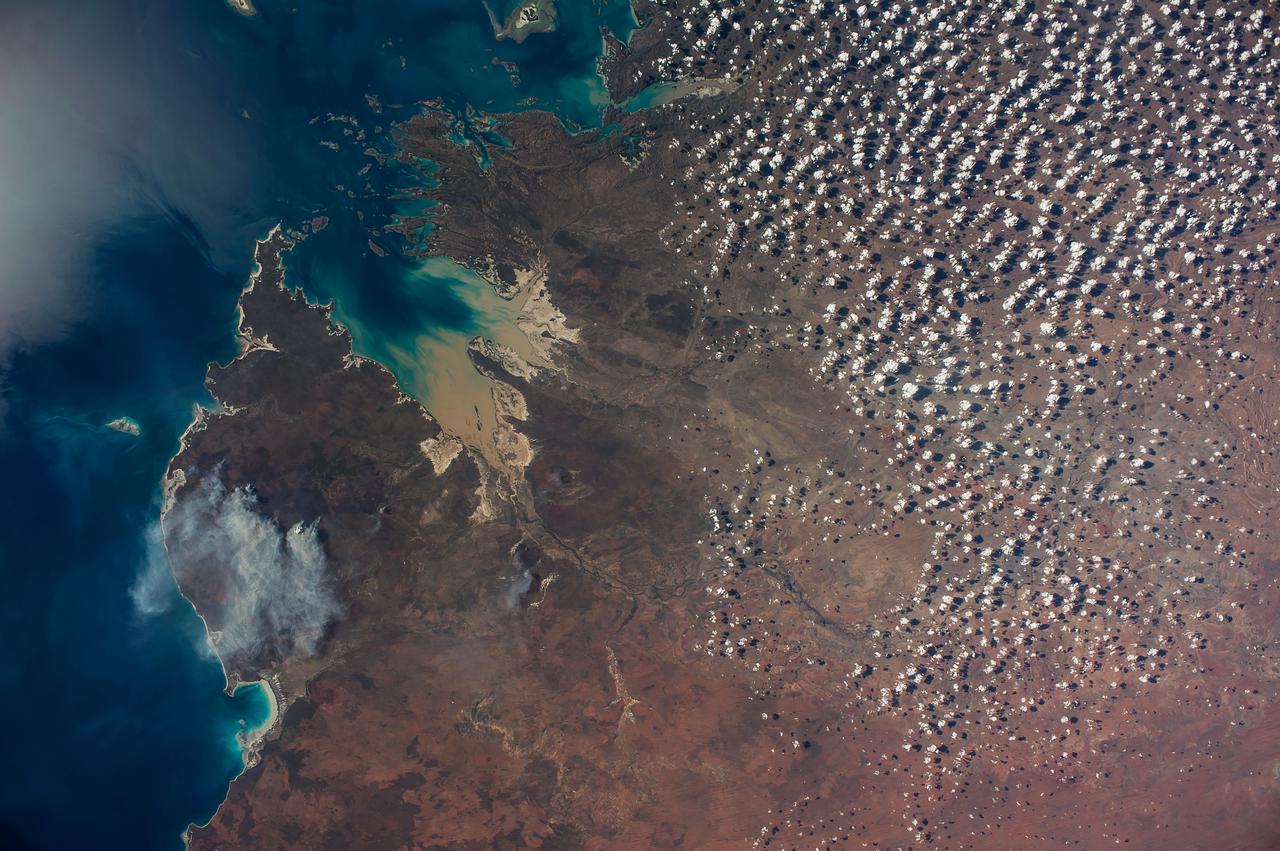
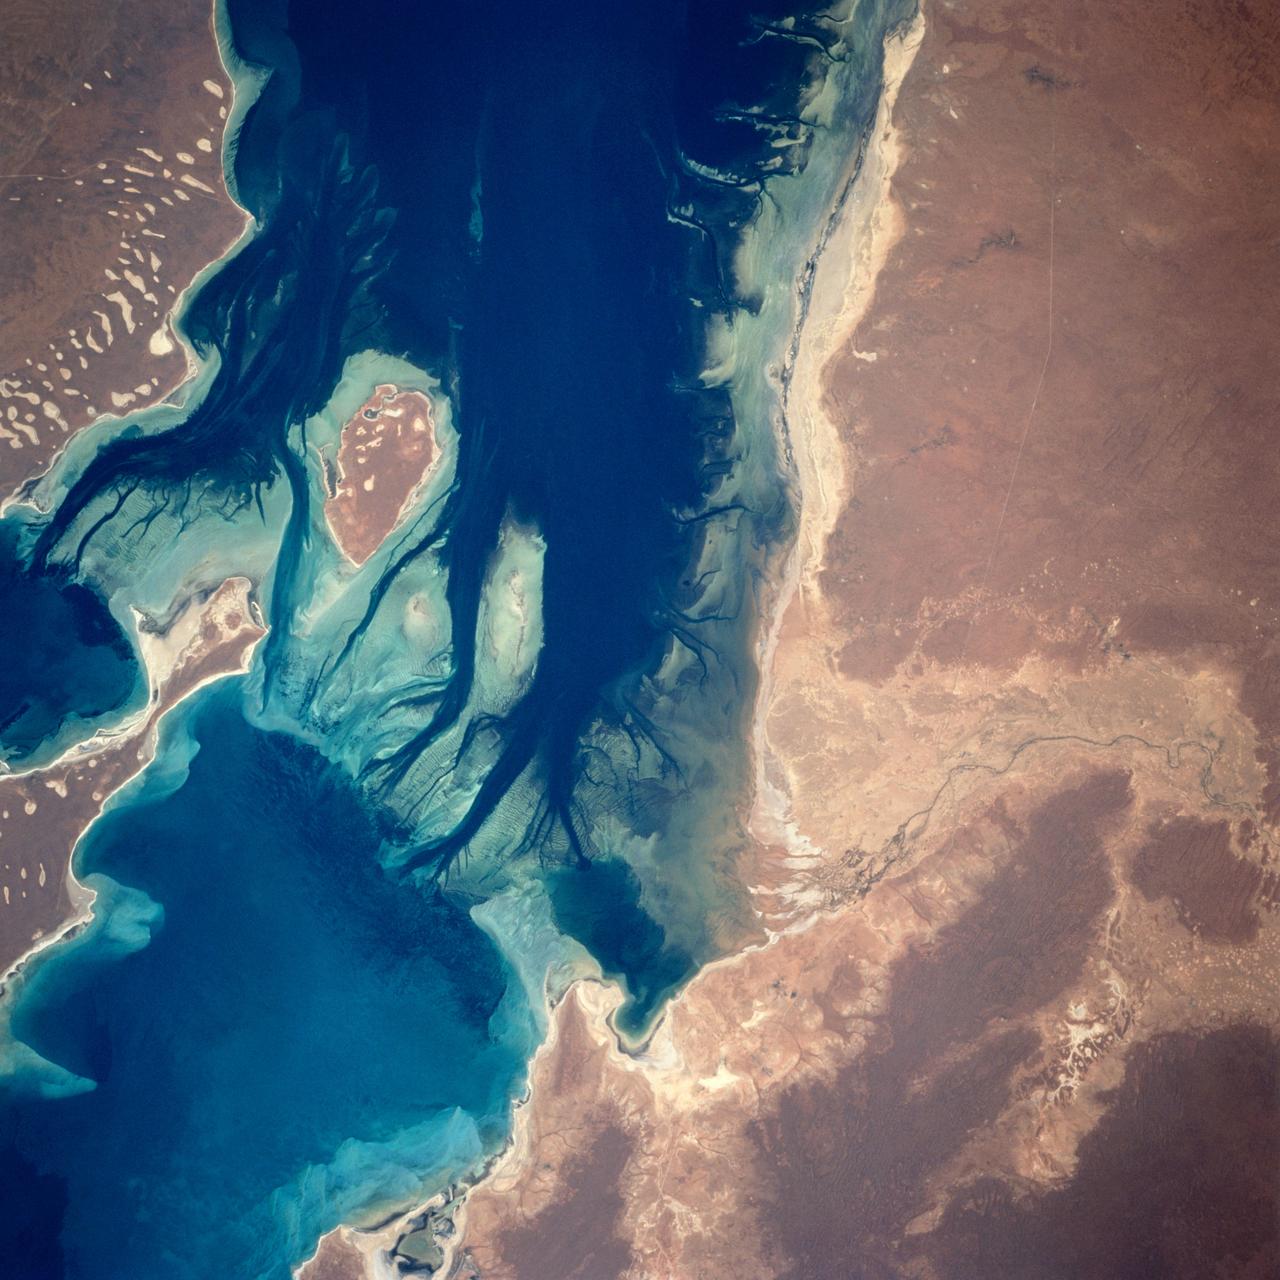
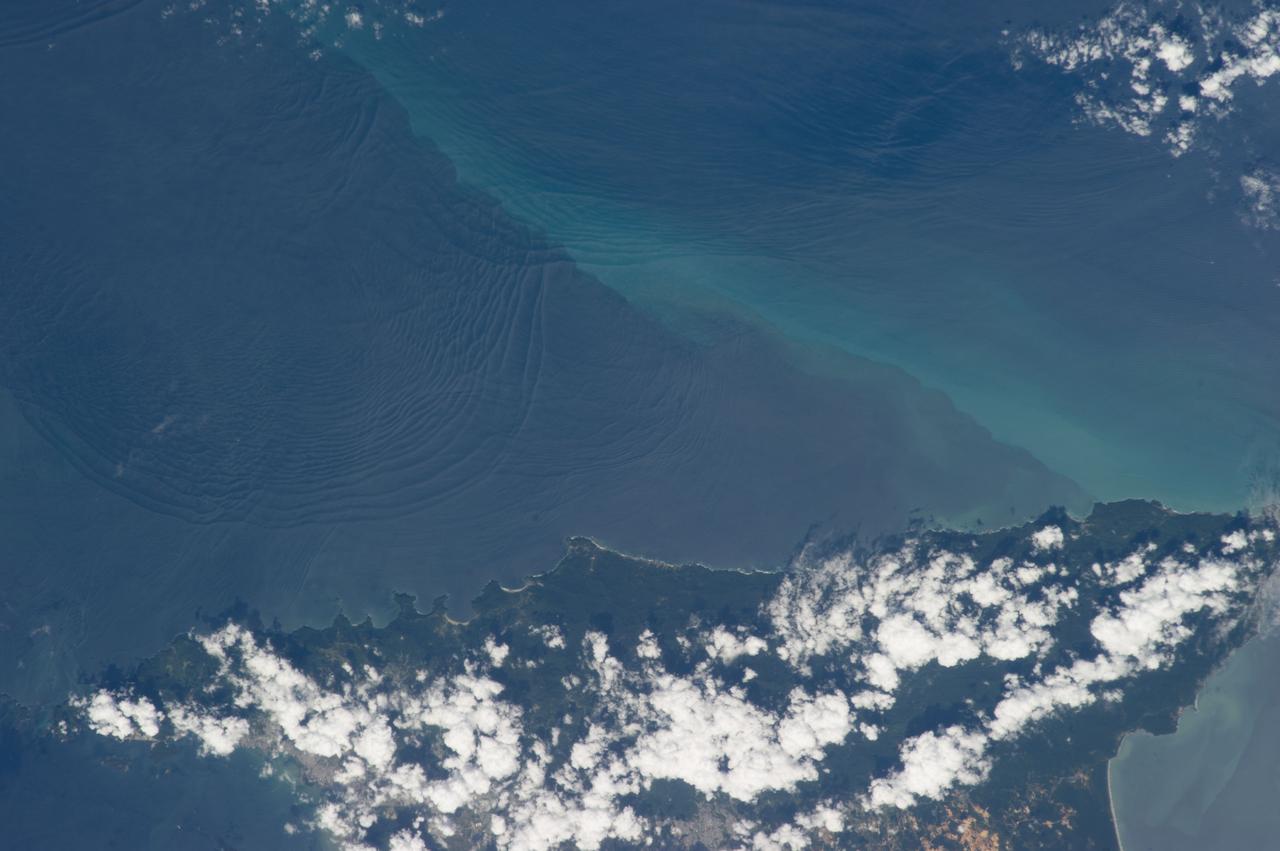
ISS040-E-089959 (8 Aug. 2014) --- King Sound on the northwest coast of Australia is featured in this image photographed by an Expedition 40 crew member on the International Space Station. The Fitzroy River, one of Australia's largest, empties into the Sound, a large gulf in Western Australia (approximately 120 kilometers long). King Sound has the highest tides in Australia, in the range of 11-12 meters, the second highest in the world after the Bay of Fundy on the east coast of North America. The strong brown smudge at the head of the Sound contrasts with the clearer blue water along the rest of the coast. This is mud stirred up by the tides and also supplied by the Fitzroy River. The bright reflection point of the sun obscures the blue water of the Indian Ocean (top left). Just to the west of the Sound, thick plumes of wildfire smoke, driven by northeast winds, obscure the coastline. A wide field of “popcorn cumulus” clouds (right) is a common effect of daily heating of the ground surface.
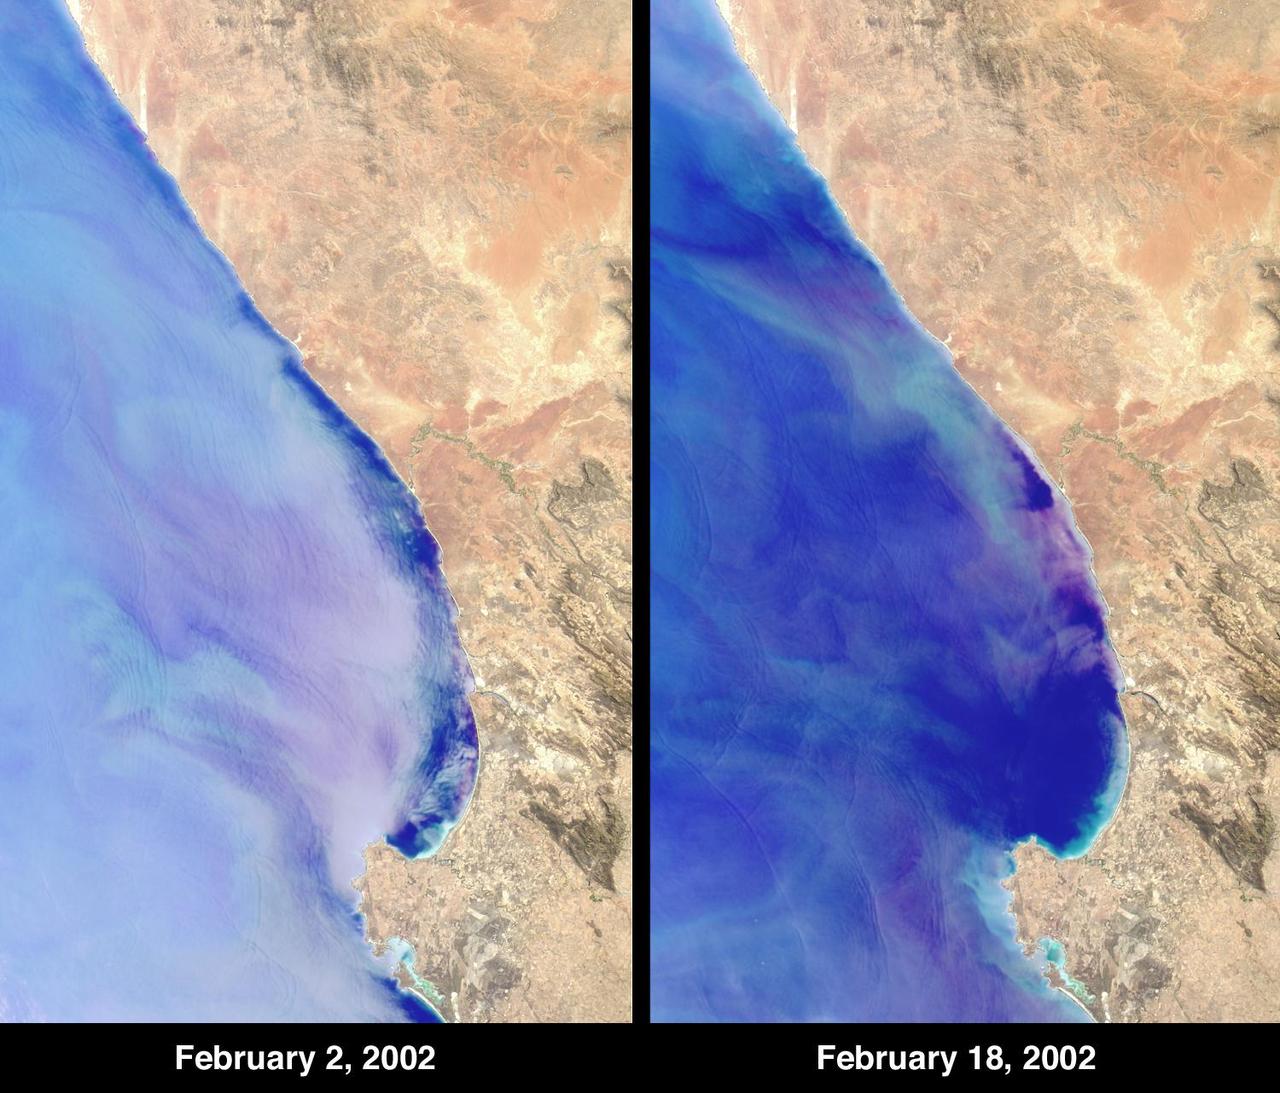
At Elands Bay in South Africa Western Cape province, about 1000 tons of rock lobsters beached themselves during February 2002 when NASA Terra satellite acquired these images.

STS060-88-070 (3-11 Feb 1994) --- This view shows sunglint in the Strait of Gibralter. In this photograph a high pressure atmospheric system over the Iberian Peninsula has set the conditions for seeing a plankton bloom along the Moroccan coast in the Alboran Sea (Western Mediterranean) coastal counter current as well as illumining the influence of winds in the sunglint pattern near the Strait of Gibraltar. Where the water is ruffled from a wind gust, such as off Cadiz, Spain, the surface is less reflective and thus appears dark. A combination of the effects of the tide and the surface winds through the Strait of Gibraltar have created a unique sunglint pattern at the entrance of the Mediterranean. The Atlantic Ocean waters are flowing with the tide through the Strait of Gibraltar into the Mediterranean Sea and are probably smoothing out some of the smaller waves at the surface. The incoming tide generates internal waves as can be faintly seen in this photograph. The incoming relatively cooler, less dense Atlantic water flows over the warm, more saline Mediterranean water. As the tide moves into the Strait of Gibraltar it encounters the Camarinal Sill, which is like a cliff under the water, south of Camarinal Point, Spain. Internal waves are generated at this sill and they travel along the density boundary between the Atlantic water and the Mediterranean water masses. There is little evidence of the internal waves at the surface of the ocean. We can see them in spacecraft photography because of the sunglint which reflects off the different water layers in differential patterns. The internal waves also smooth out some of the bands of capillary waves at the surface. That is, the sun reflects more brightly from these smooth areas, showing the pattern of the underwater waves more prominently than do the surface waves. The Bay of Cadiz on the southwest coast of Spain, the Rock of Gibraltar, and the Moroccan coast are also beautifully illustrated in this photography. The focus for scientists, however, remains the high clarity and spatial resolution given by sunglint studies to physical phenomena in the ocean.
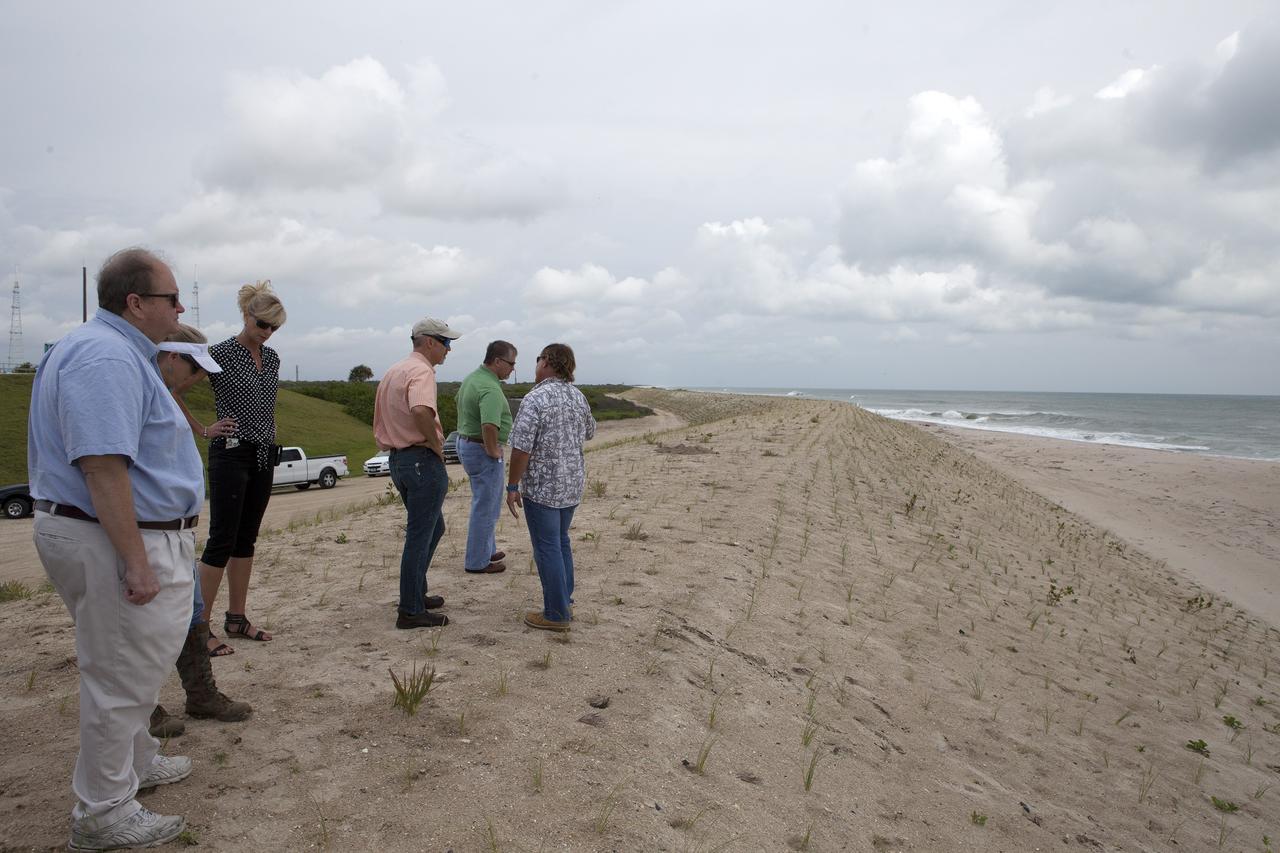
CAPE CANAVERAL, Fla. -- At the Kennedy Space Center in Florida, Burton Summerfield, senior advisor for Institutional Management in the office of the associate director of Kennedy, far left, and others survey restored sand dunes along a 1.2-mile stretch of shoreline near Launch Pads 39A and B. Constant pounding from tropical storms, such as Hurricane Sandy in October of 2012, other weather systems and higher than usual tides, destroyed sand dunes protecting infrastructure at the spaceport. Photo credit: NASA/Dan Casper
Barra Island Eoligarry Airport is located in the Outer Hebrides, Scotland, U.K. The airport is the only beach runway on the earth, relying on low tide to be open for take-offs and landings. Opened in 1936, there are now two daily flights between Barra and Glasgow. The image was acquired august 24, 2021, covers an area of 15 by 19.5 km, and is located at 57 degrees north, 7.45 degrees west. https://photojournal.jpl.nasa.gov/catalog/PIA26502
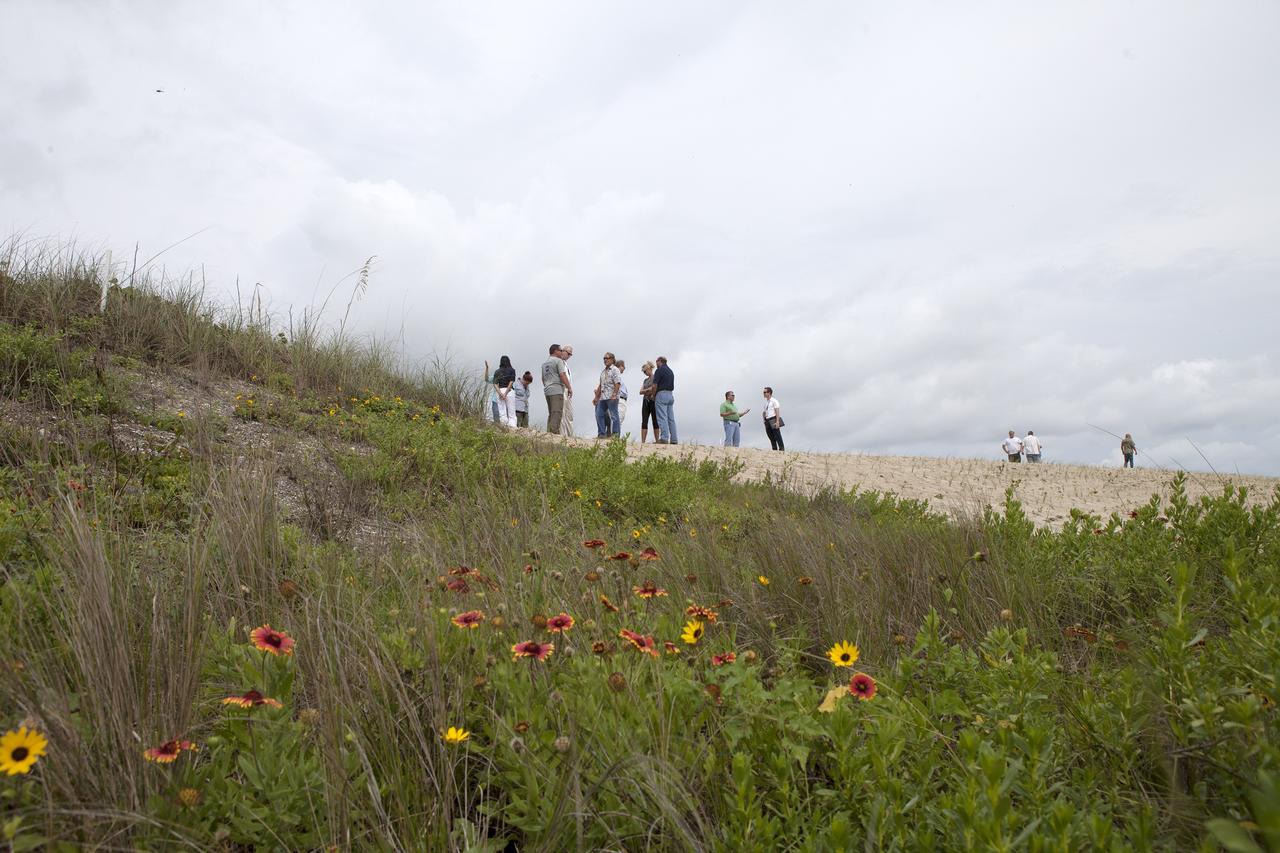
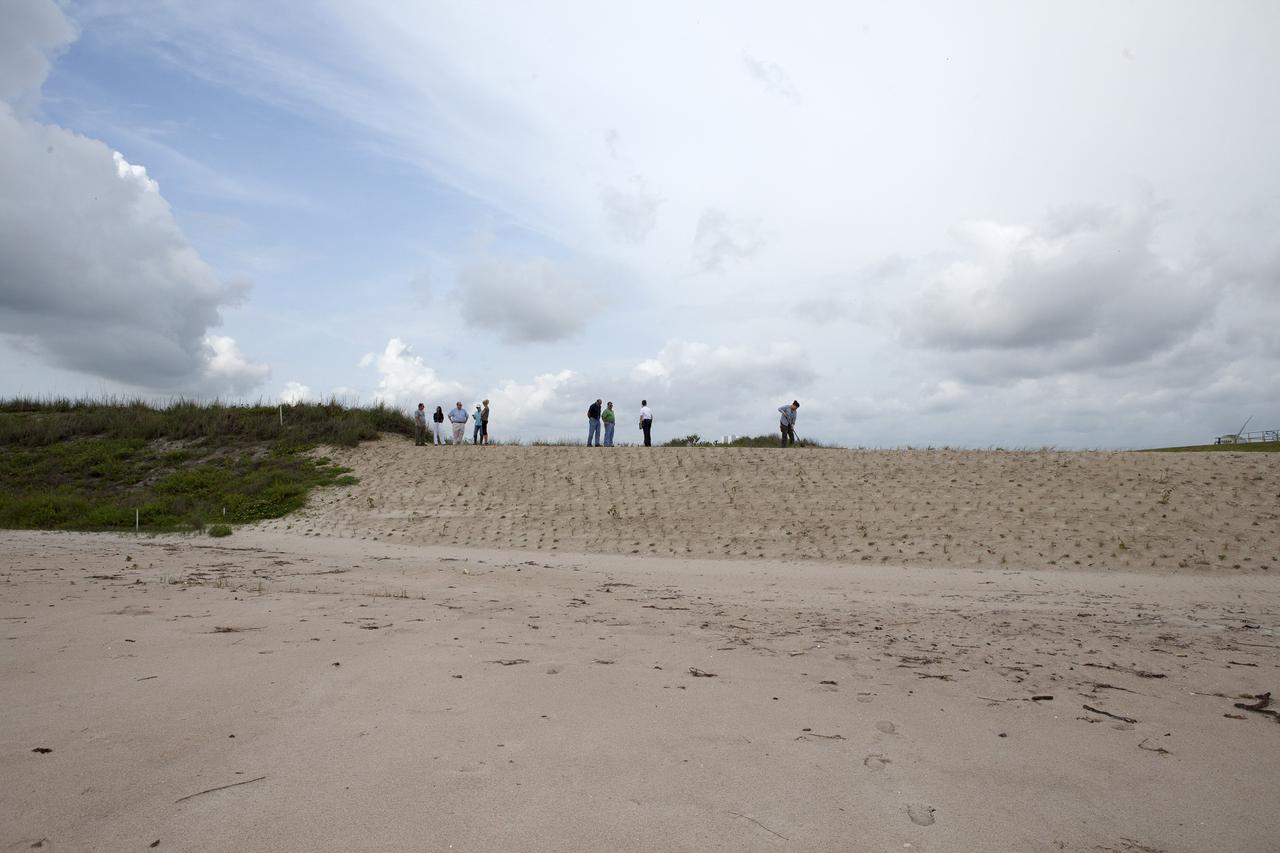
CAPE CANAVERAL, Fla. -- At the Kennedy Space Center in Florida, guests survey restored sand dunes along a 1.2-mile stretch of shoreline near Launch Pads 39A and B. Constant pounding from tropical storms, such as Hurricane Sandy in October of 2012, other weather systems and higher than usual tides, destroyed sand dunes protecting infrastructure at the spaceport. Photo credit: NASA/Dan Casper
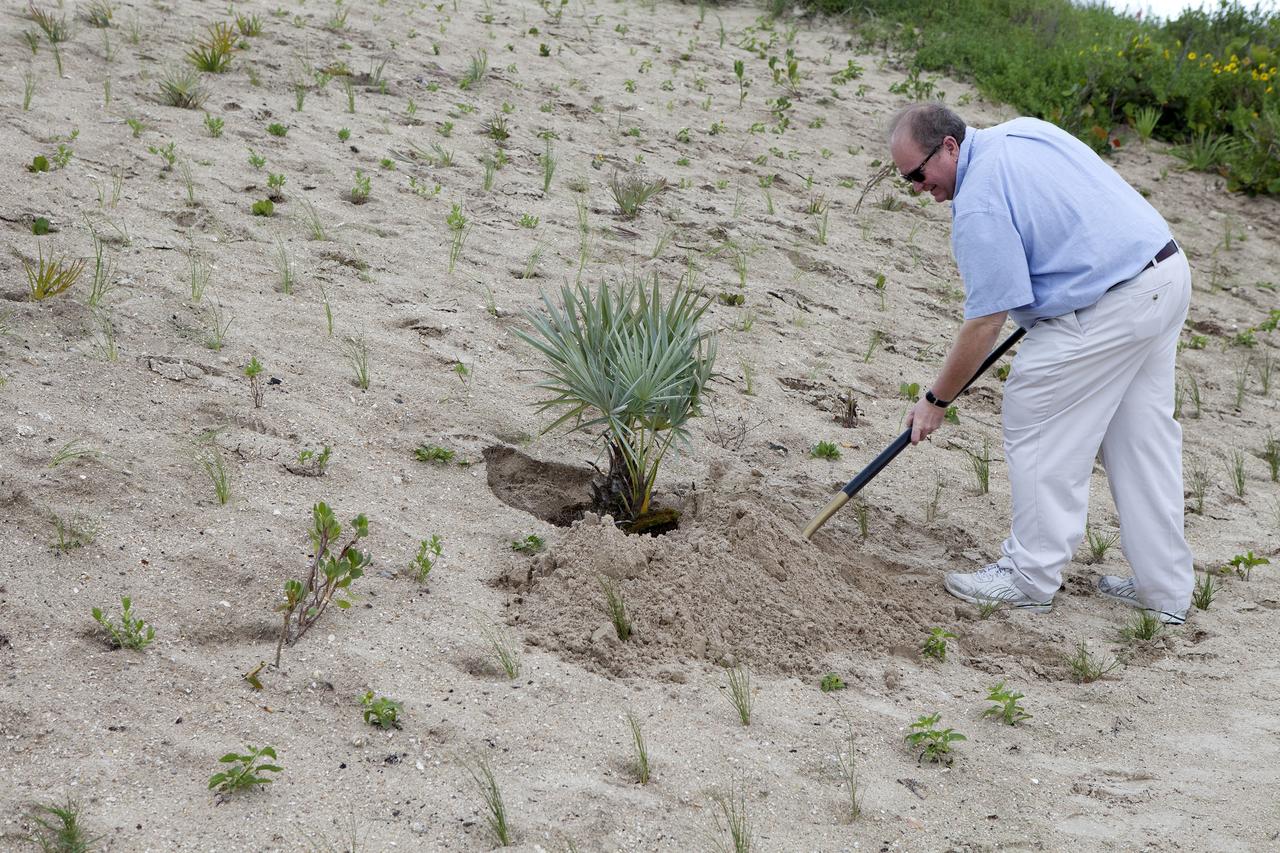
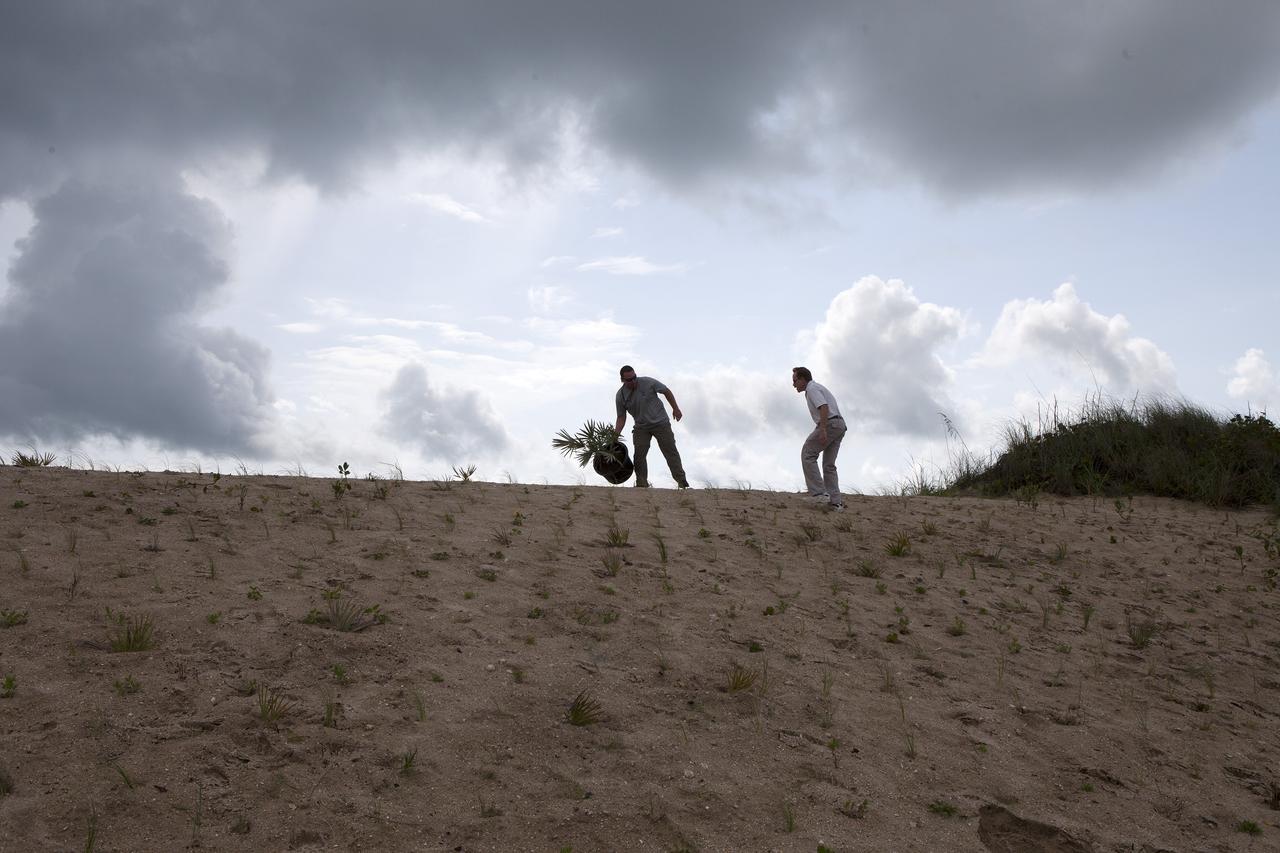
CAPE CANAVERAL, Fla. -- At the Kennedy Space Center in Florida, Burton Summerfield, senior advisor for Institutional Management in the office of the associate director at Kennedy, plants the final shrub that is among 180,000 planted on a new 1.2-mile stretch of shoreline near Launch Pads 39A and B. Constant pounding from tropical storms, such as Hurricane Sandy in October of 2012, other weather systems and higher than usual tides, destroyed sand dunes protecting infrastructure at the spaceport. Photo credit: NASA/Dan Casper
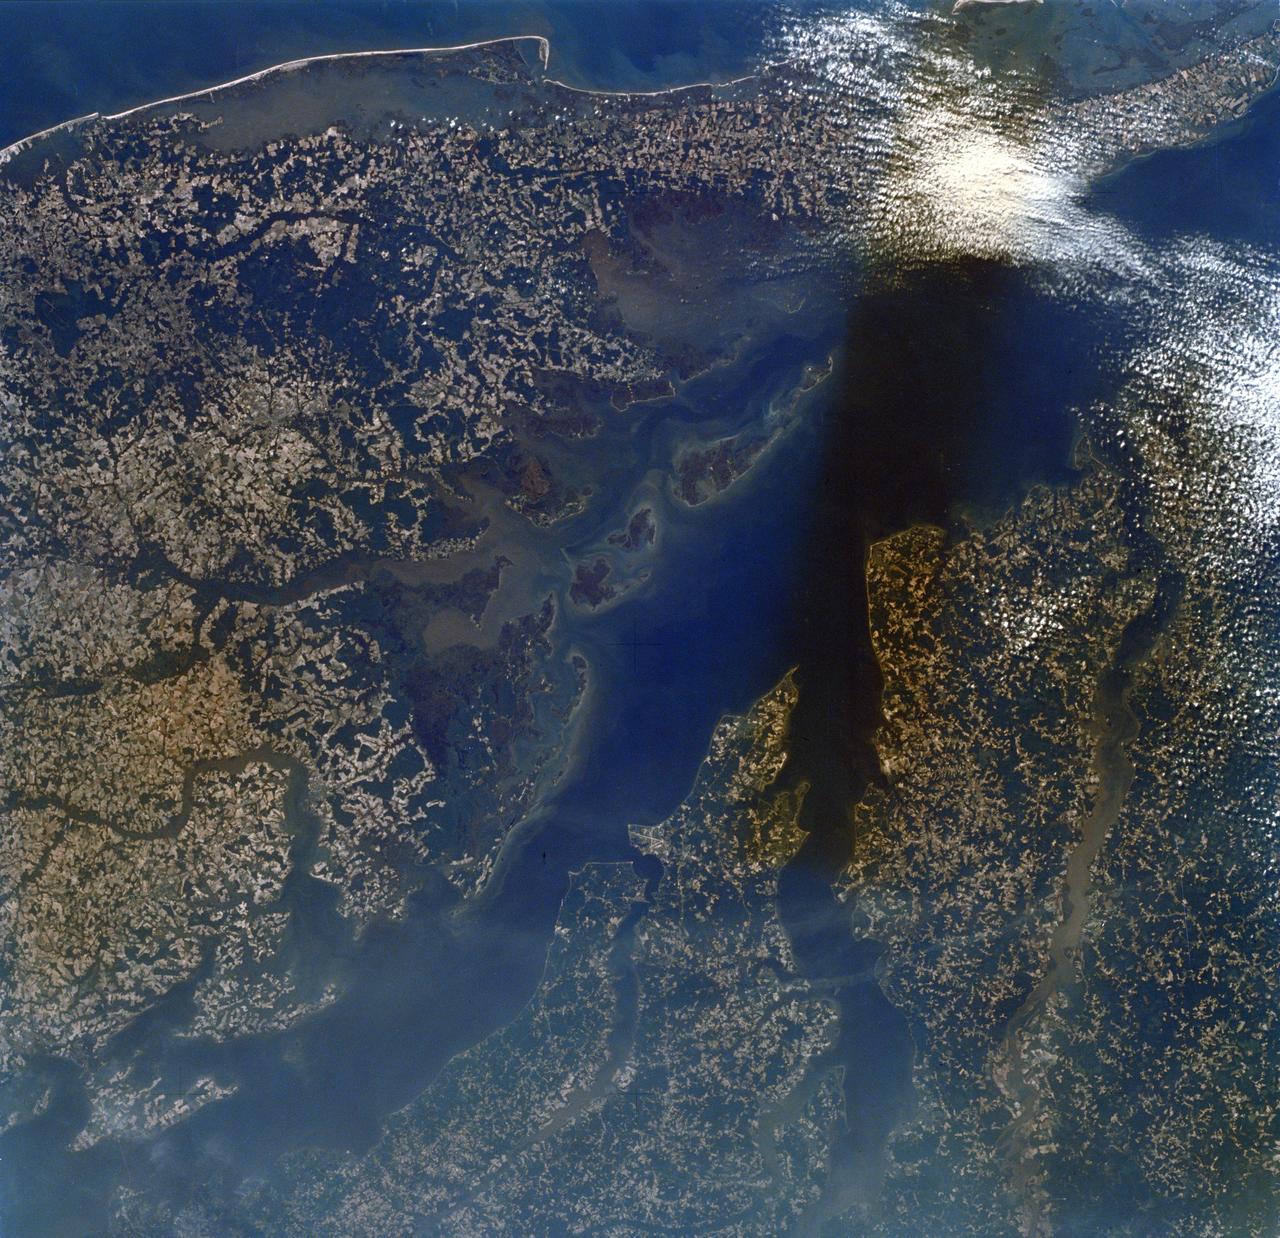
SL2-16-174 (22 June 1973) --- Norfolk and the lower Chesapeake Bay, VA (37.5N, 75.5W) at the interface of the Atlantic Ocean can be seen to be a mixture of complex currents. Outgoing tides from the bay generate considerable turbulence as they encounter coastal currents and can be observed by the sediment plumes stirred up as a result of current dynamics. Smooth flowing water has less sediment and appears darker. Turbulent water has lots of sediment and appears lighter in color. Photo credit: NASA
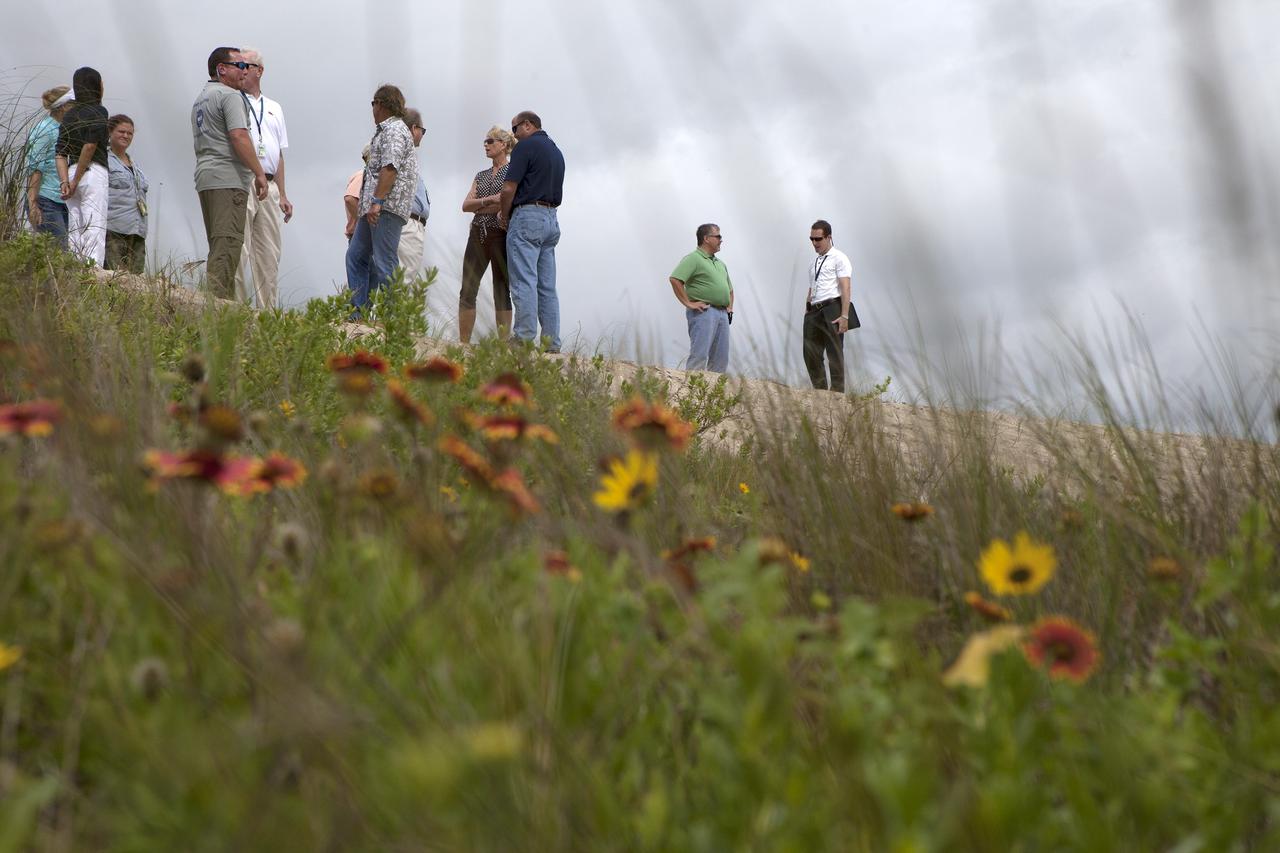
CAPE CANAVERAL, Fla. -- At the Kennedy Space Center in Florida, guests survey restored sand dunes along a 1.2-mile stretch of shoreline near Launch Pads 39A and B. Constant pounding from tropical storms, such as Hurricane Sandy in October of 2012, other weather systems and higher than usual tides, destroyed sand dunes protecting infrastructure at the spaceport. Photo credit: NASA/Dan Casper
CAPE CANAVERAL, Fla. -- At the Kennedy Space Center in Florida, guests survey restored sand dunes along a 1.2-mile stretch of shoreline near Launch Pads 39A and B. Constant pounding from tropical storms, such as Hurricane Sandy in October of 2012, other weather systems and higher than usual tides, destroyed sand dunes protecting infrastructure at the spaceport. Photo credit: NASA/Dan Casper
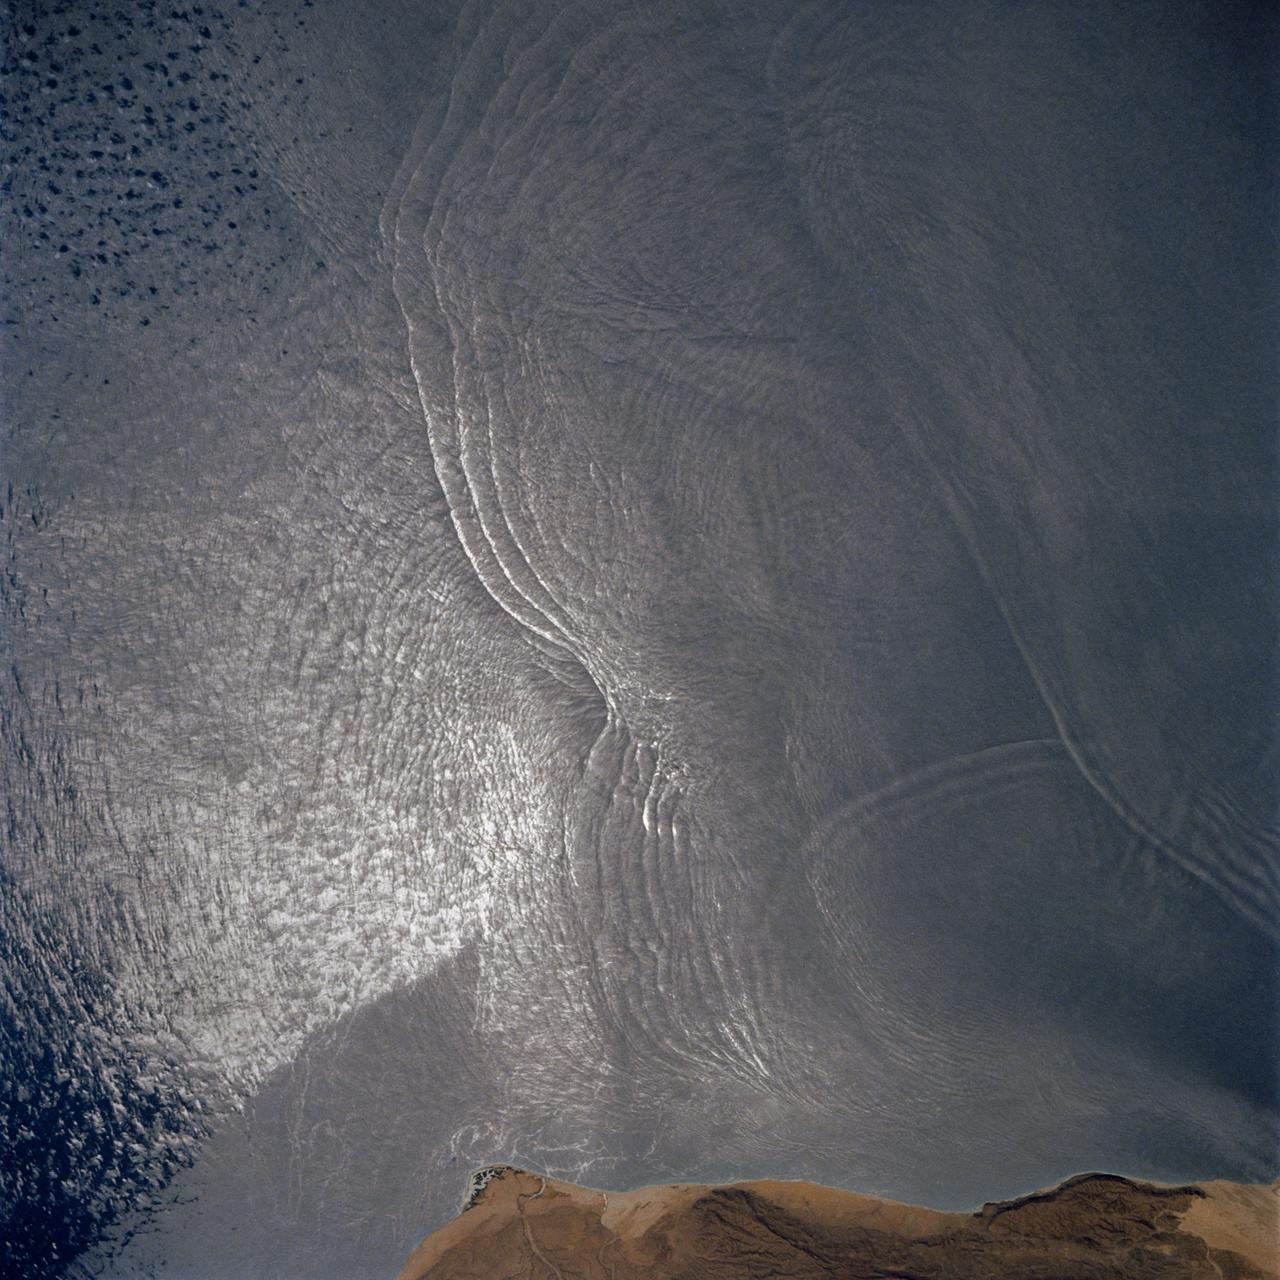
The arculate fronts of these apparently converging internal waves off the northeast coast of Somalia (11.5N, 51.5E) probably were produced by interaction with two parallel submarine canyons off the Horn of Africa. Internal waves are packets of tidally generated waves traveling within the ocean at varying depths and are not detectable by any surface disturbance.
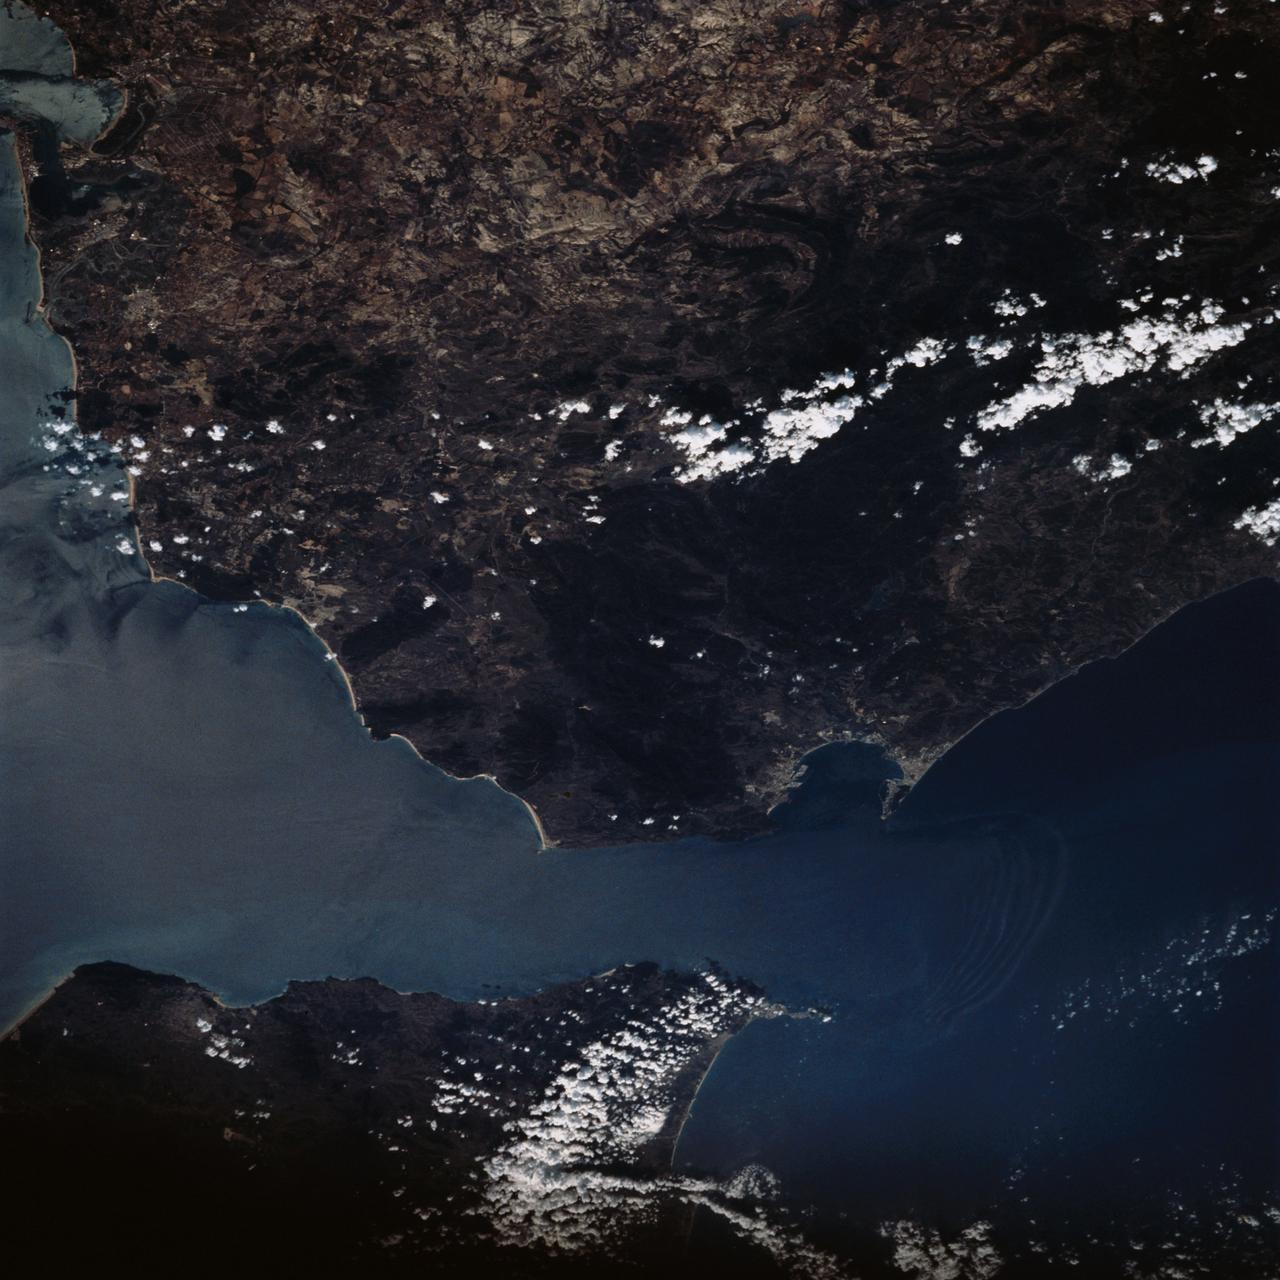
STS058-73-009 (18 Oct-1 Nov 1993) --- Atlantic water flowing with the tide through the Strait of Gibraltar into the Mediterranean generates internal waves as depicted in this photo. The incoming cool, less dense Atlantic water flows over the warm, more saline Mediterranean water. As the tide moves into the Strait of Gibraltar it encounters the Camarinal Sill, which is like a cliff under water, south of Camarinal Point, Spain. Internal waves are generated at the Sill and travel along the density boundary between the Atlantic water and the Mediterranean water. Internal waves have very little effect on the sea surface, except for gentle slopes and slight differences in roughness. We can see them in the Space Shuttle photos because of sunglint which reflects off the water. Internal waves smooth out some of the capillary waves at the surface in bands. The sun reflects more brightly from these smooth areas showing us the pattern of the underwater waves. The Bay of Cadiz on the southwest coast of Spain, the Rock of Gibraltar, and the Moroccan coast are also visible in this photo.
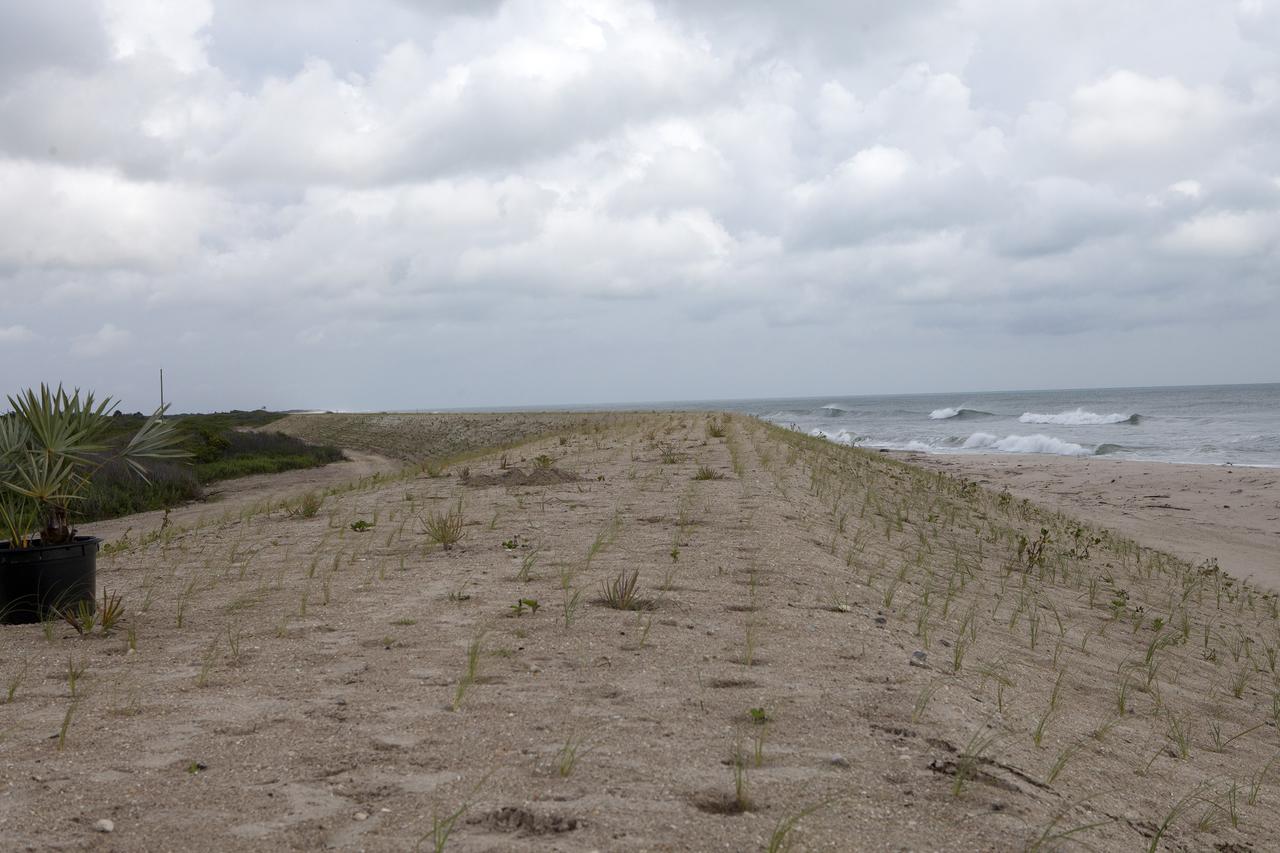
CAPE CANAVERAL, Fla. -- At the Kennedy Space Center in Florida, the sand dunes along a 1.2 mile stretch of shoreline near Launch Pads 39A and B were restored during a six-month effort using 90,000 cubic yards of sand. To help prevent future erosion, 180,000 shrubs, including grasses, sunflowers, vines, sea grapes and palmettos were planted. Constant pounding from tropical storms, such as Hurricane Sandy in October of 2012, other weather systems and higher than usual tides, destroyed sand dunes protecting infrastructure at the spaceport. Photo credit: NASA/Dan Casper
CAPE CANAVERAL, Fla. -- At the Kennedy Space Center in Florida, sand dunes have been restored along a 1.2 mile stretch of shoreline near Launch Pads 39A and B. As part of a six-month effort to help prevent further erosion, 180,000 shrubs, including grasses, sunflowers, vines, sea grapes and palmettos were planted. Constant pounding from tropical storms, such as Hurricane Sandy in October of 2012, other weather systems and higher than usual tides, destroyed sand dunes protecting infrastructure at the spaceport. Photo credit: NASA/Dan Casper
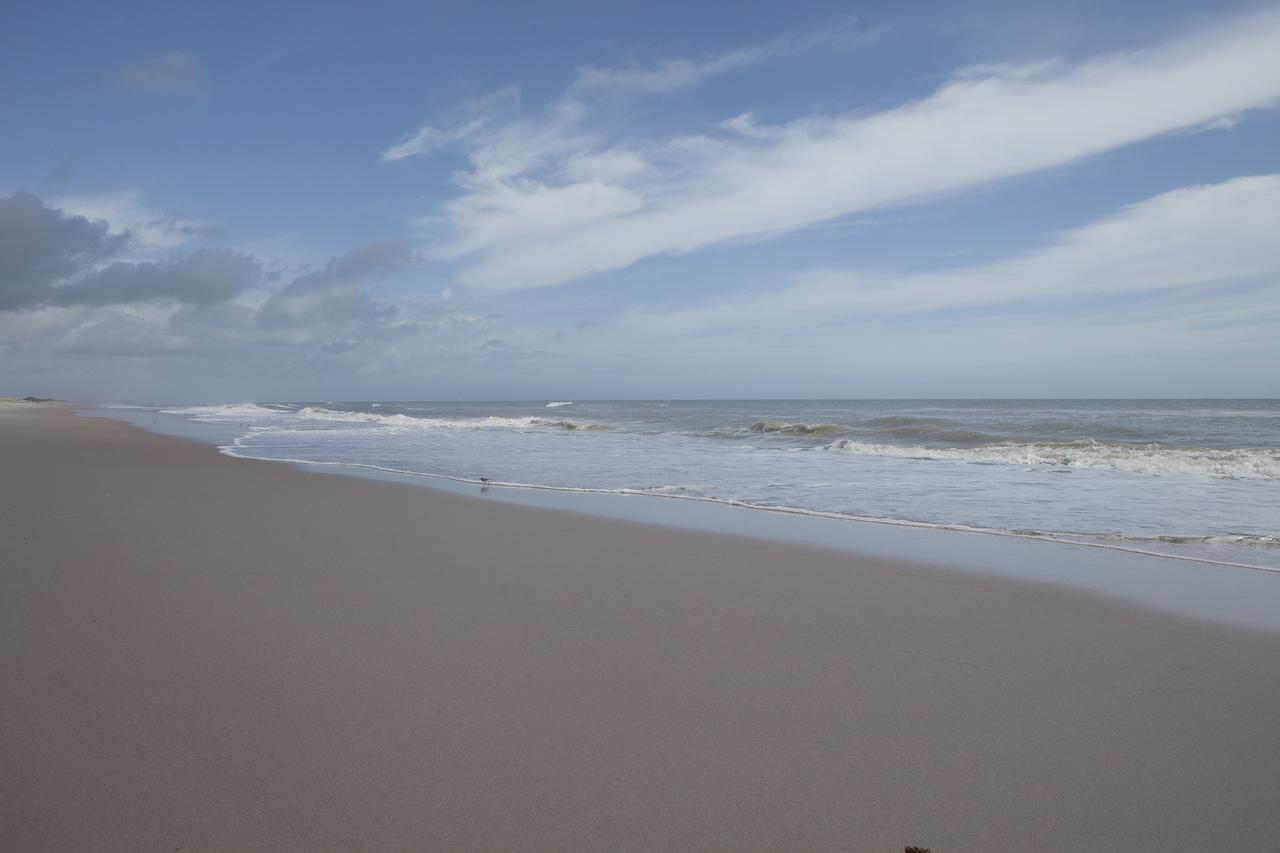
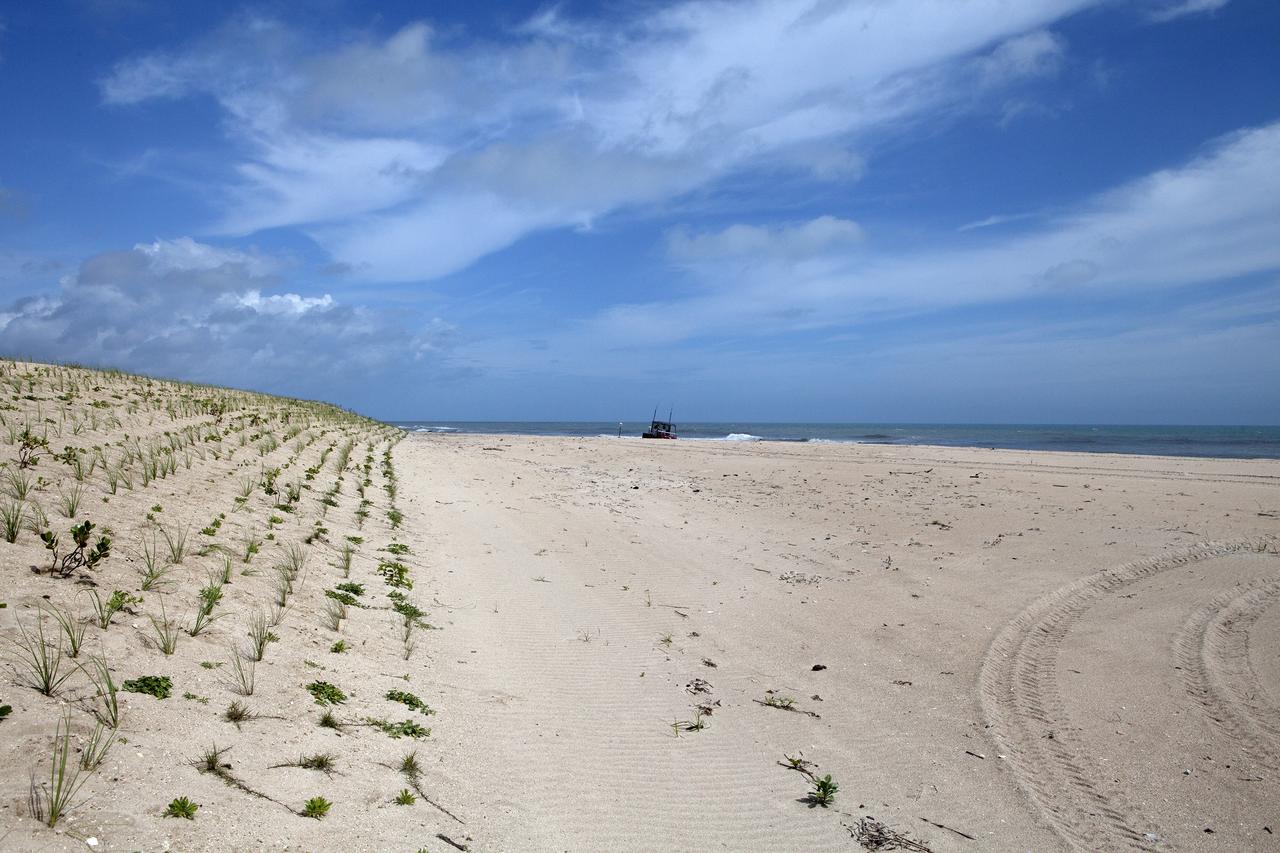
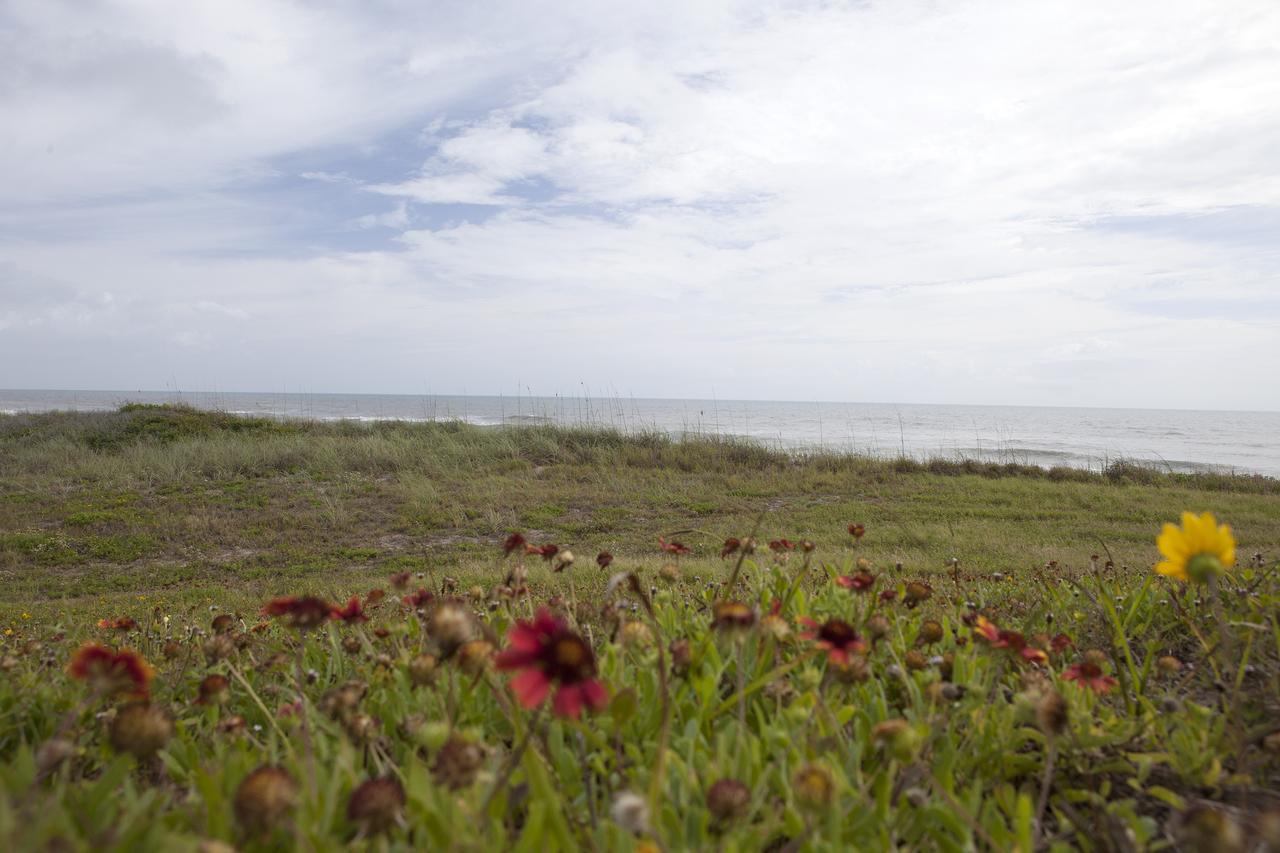
CAPE CANAVERAL, Fla. -- At the Kennedy Space Center in Florida, the Atlantic Ocean surf is seen adjacent to sand dunes restored along a 1.2 mile stretch of shoreline near Launch Pads 39A and B. As part of a six-month effort to help prevent further erosion, 180,000 shrubs, including grasses, sunflowers, vines, sea grapes and palmettos were planted. Constant pounding from tropical storms, such as Hurricane Sandy in October of 2012, other weather systems and higher than usual tides, destroyed sand dunes protecting infrastructure at the spaceport. Photo credit: NASA/Dan Casper
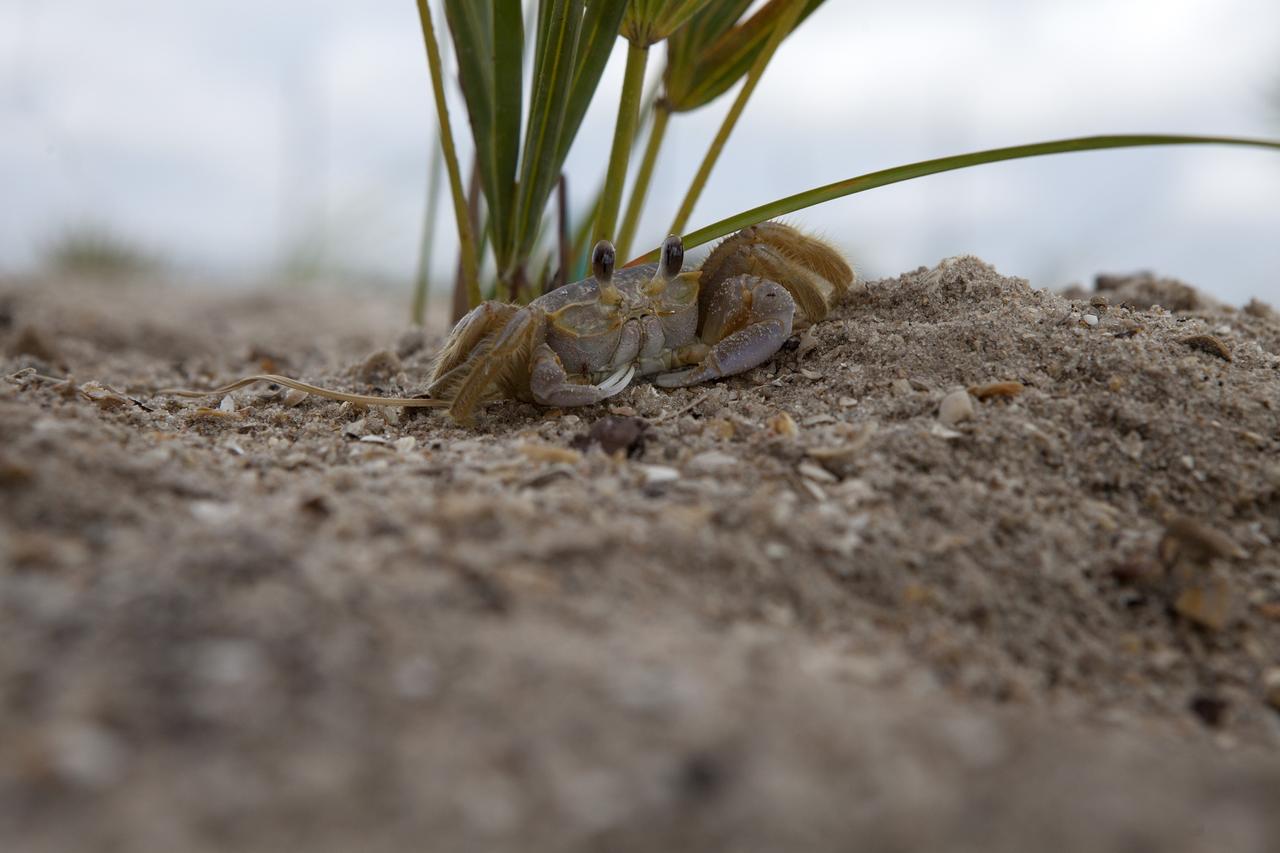
CAPE CANAVERAL, Fla. -- At the Kennedy Space Center in Florida, a small crab sits atop a restored sand dune along a 1.2 mile stretch of shoreline near Launch Pads 39A and B. As part of a six-month effort to help prevent further erosion, 180,000 shrubs, including grasses, sunflowers, vines, sea grapes and palmettos were planted. Constant pounding from tropical storms, such as Hurricane Sandy in October of 2012, other weather systems and higher than usual tides, destroyed sand dunes protecting infrastructure at the spaceport. Photo credit: NASA/Dan Casper
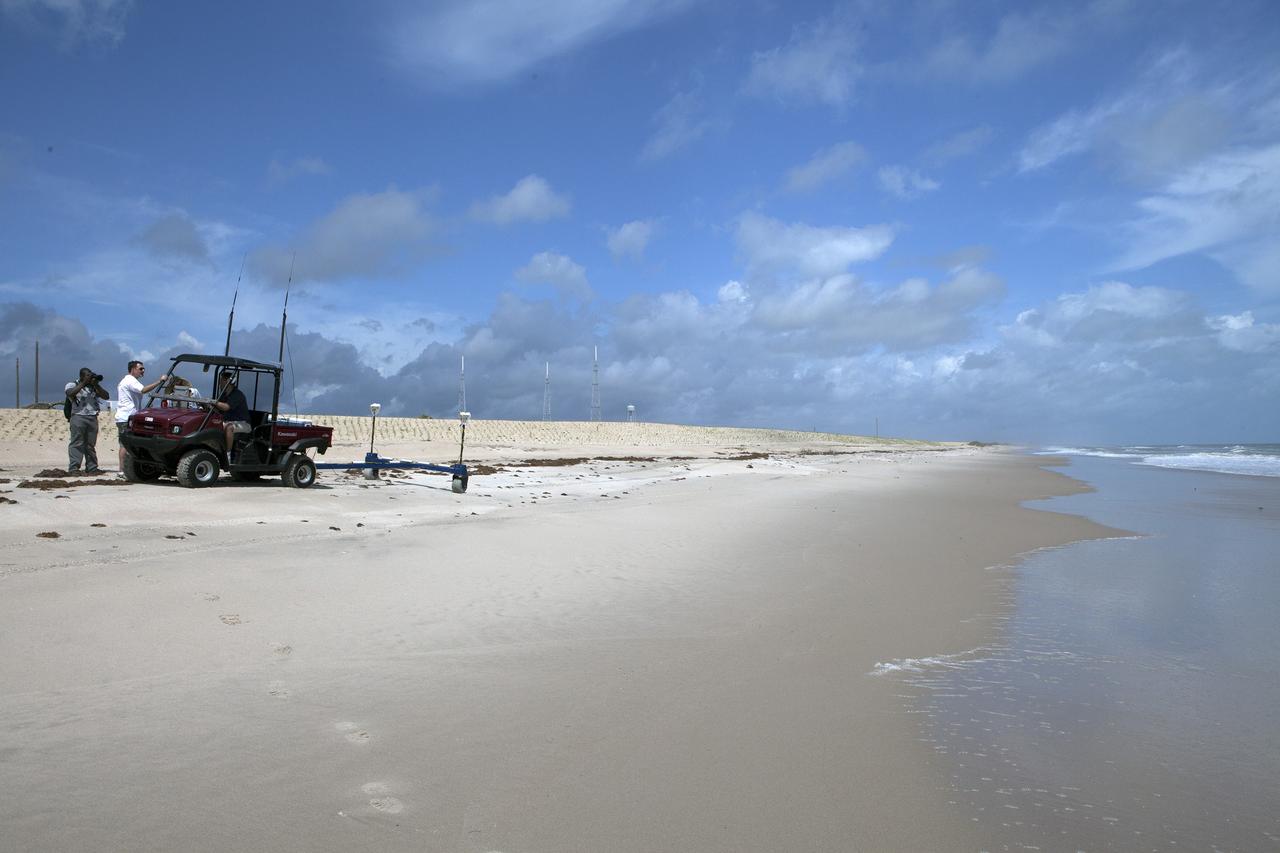
CAPE CANAVERAL, Fla. -- At the Kennedy Space Center in Florida, University of Florida geologists and NASA biologists use an all-terrain vehicle to survey sand dunes that have been restored along a 1.2 mile stretch of shoreline near Launch Pads 39A and B. As part of a six-month effort to help prevent further erosion, 180,000 shrubs, including grasses, sunflowers, vines, sea grapes and palmettos were planted. Constant pounding from tropical storms, such as Hurricane Sandy in October of 2012, other weather systems and higher than usual tides, destroyed sand dunes protecting infrastructure at the spaceport. Photo credit: NASA/Dan Casper
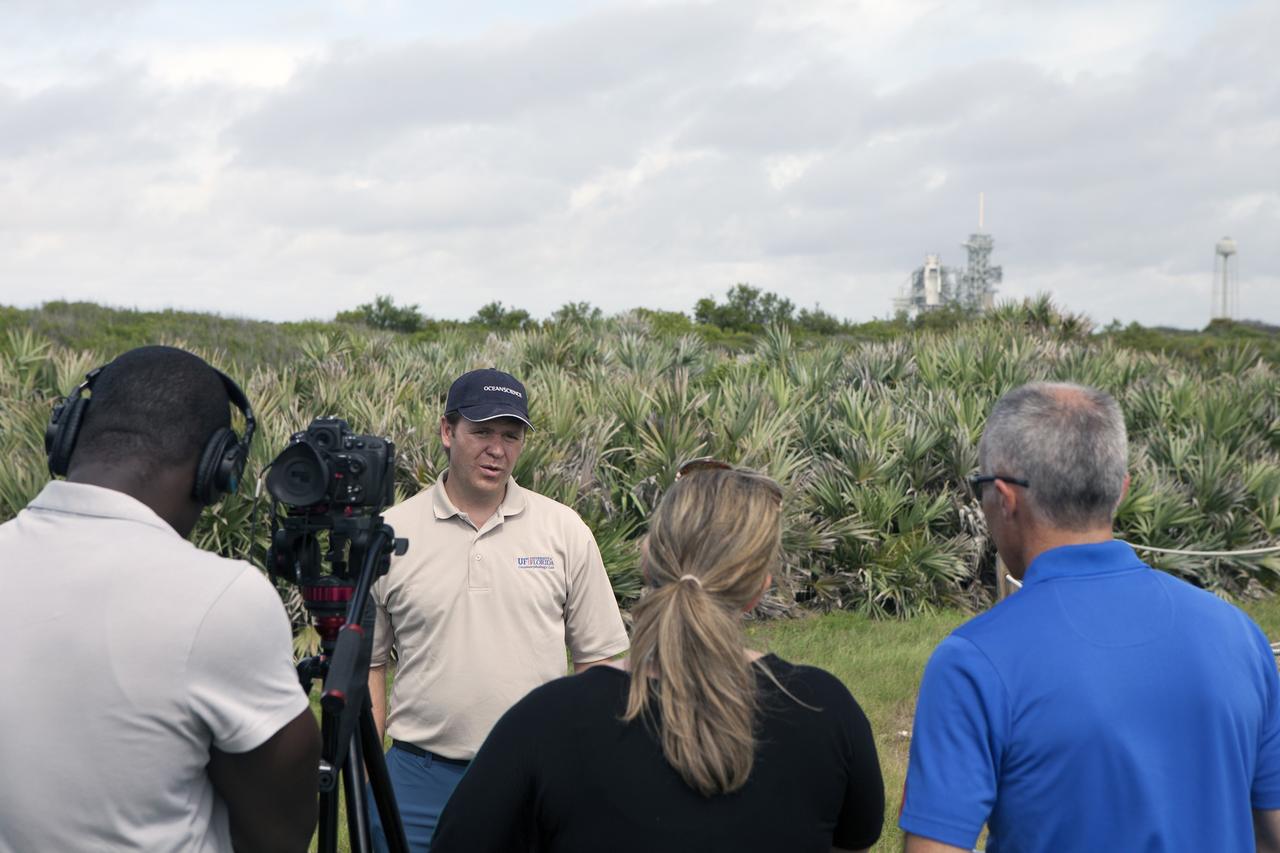
CAPE CANAVERAL, Fla. -- University of Florida geologist, Pete Adams, discusses a six-month effort to restore the sand dunes along a 1.2 mile stretch of shoreline near Launch Pads 39A and B at the Kennedy Space Center in Florida. Experts from University of Florida are working with NASA scientists to better understand beach erosion. Constant pounding from tropical storms, such as Hurricane Sandy in October of 2012, other weather systems and higher than usual tides, destroyed sand dunes protecting infrastructure at the spaceport. Photo credit: NASA/Dan Casper
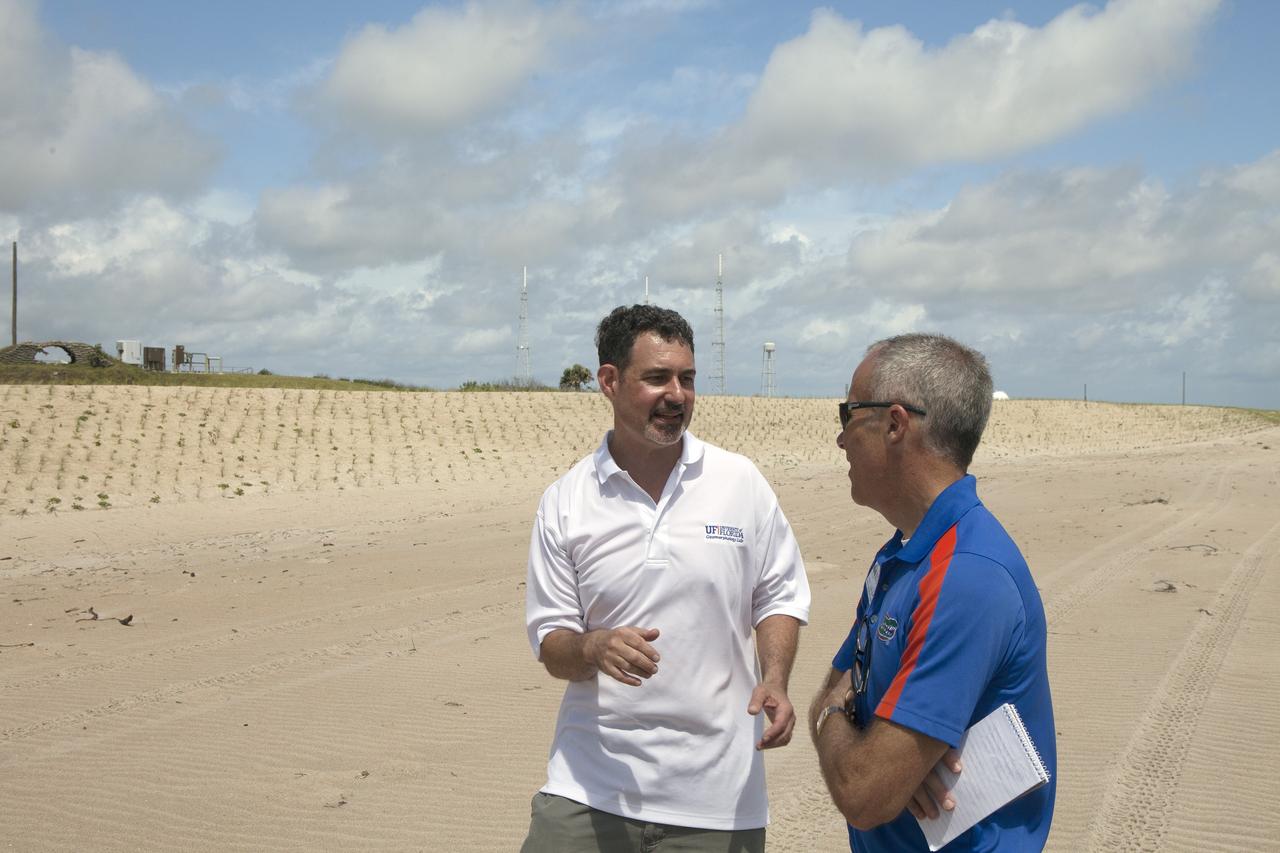
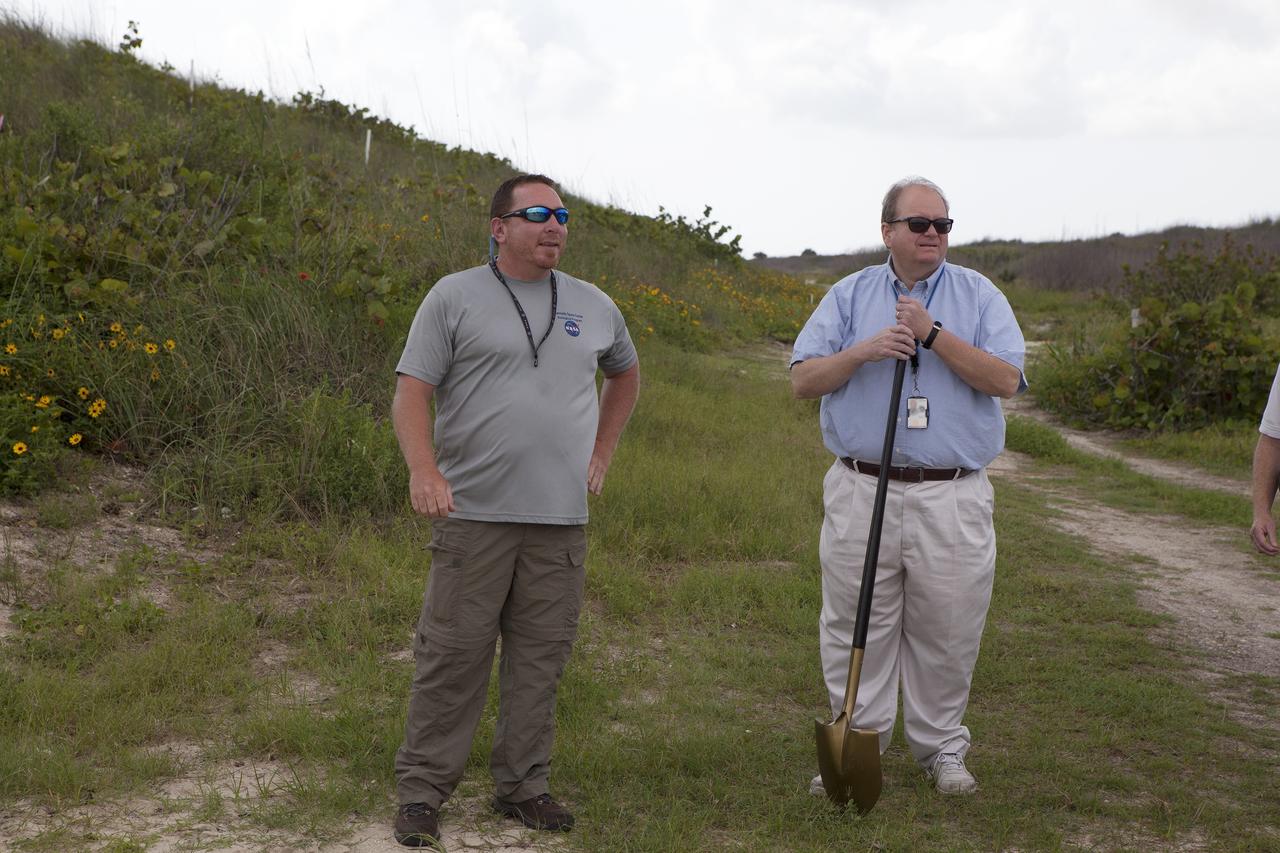
CAPE CANAVERAL, Fla. -- University of Florida geologist, John Jaeger, left, and Steve Orlando, senior director Media Relations at the University, discuss a six-month effort to restore the sand dunes along a 1.2 mile stretch of shoreline near Launch Pads 39A and B at the Kennedy Space Center in Florida. Experts from University of Florida are working with NASA scientists to better understand beach erosion. Constant pounding from tropical storms, such as Hurricane Sandy in October of 2012, other weather systems and higher than usual tides, destroyed sand dunes protecting infrastructure at the spaceport. Photo credit: NASA/Dan Casper
CAPE CANAVERAL, Fla. -- At the Kennedy Space Center in Florida, the sand dunes along a 1.2 mile stretch of shoreline near Launch Pads 39A and B were restored during a six-month effort using 90,000 cubic yards of sand. To help prevent erosion, 180,000 shrubs, including grasses, sunflowers, vines, sea grapes and palmettos were planted. Constant pounding from tropical storms, such as Hurricane Sandy in October of 2012, other weather systems and higher than usual tides, destroyed sand dunes protecting infrastructure at the spaceport. Photo credit: NASA/Dan Casper
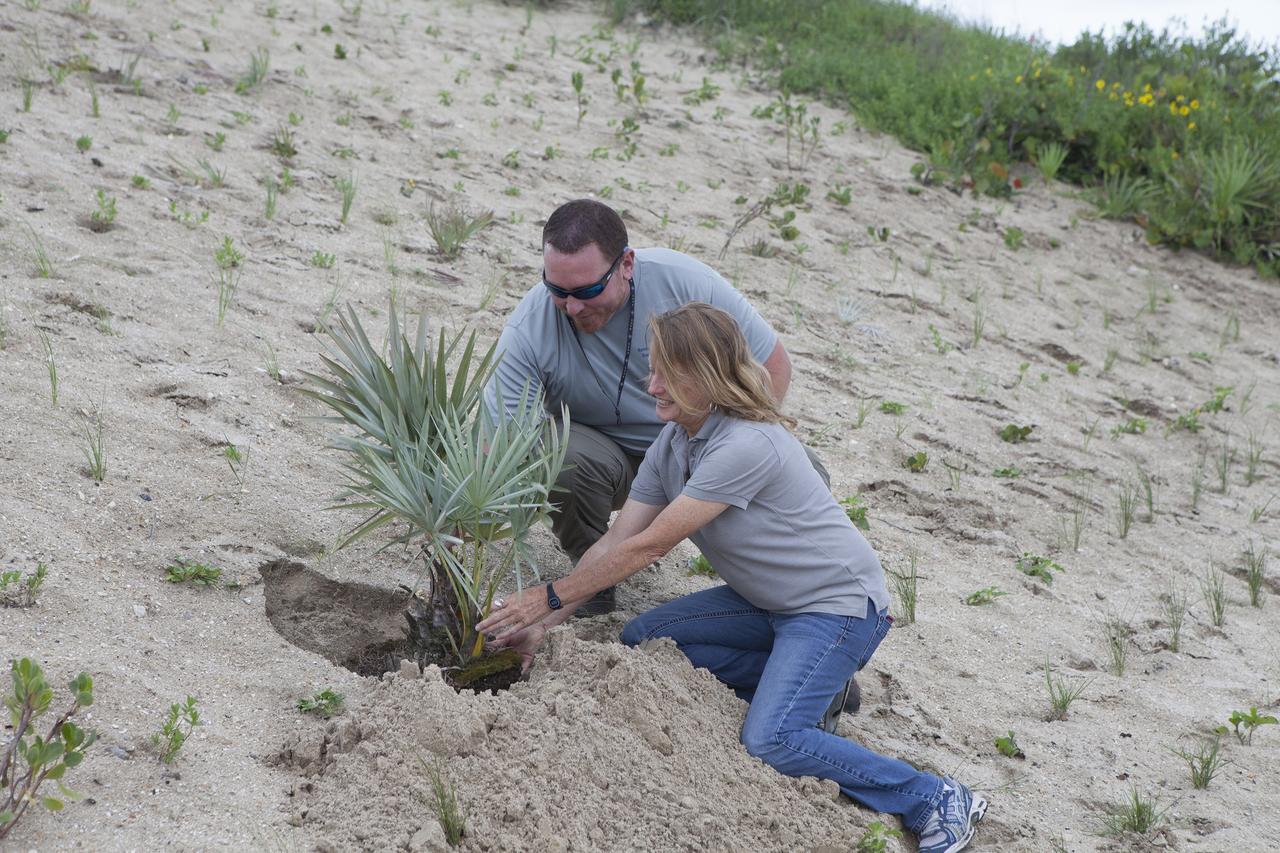
CAPE CANAVERAL, Fla. -- At the Kennedy Space Center in Florida, Don Dankert, a biological scientist in the NASA Environmental Management Branch of Center Operations, left, and Becky Bolt, a wildlife ecologist with InoMedic Health Applications Inc, plant the final shrub that is among 180,000 planted on a new 1.2-mile stretch of shoreline near Launch Pads 39A and B. Constant pounding from tropical storms, such as Hurricane Sandy in October of 2012, other weather systems and higher than usual tides, destroyed sand dunes protecting infrastructure at the spaceport. Photo credit: NASA/Dan Casper
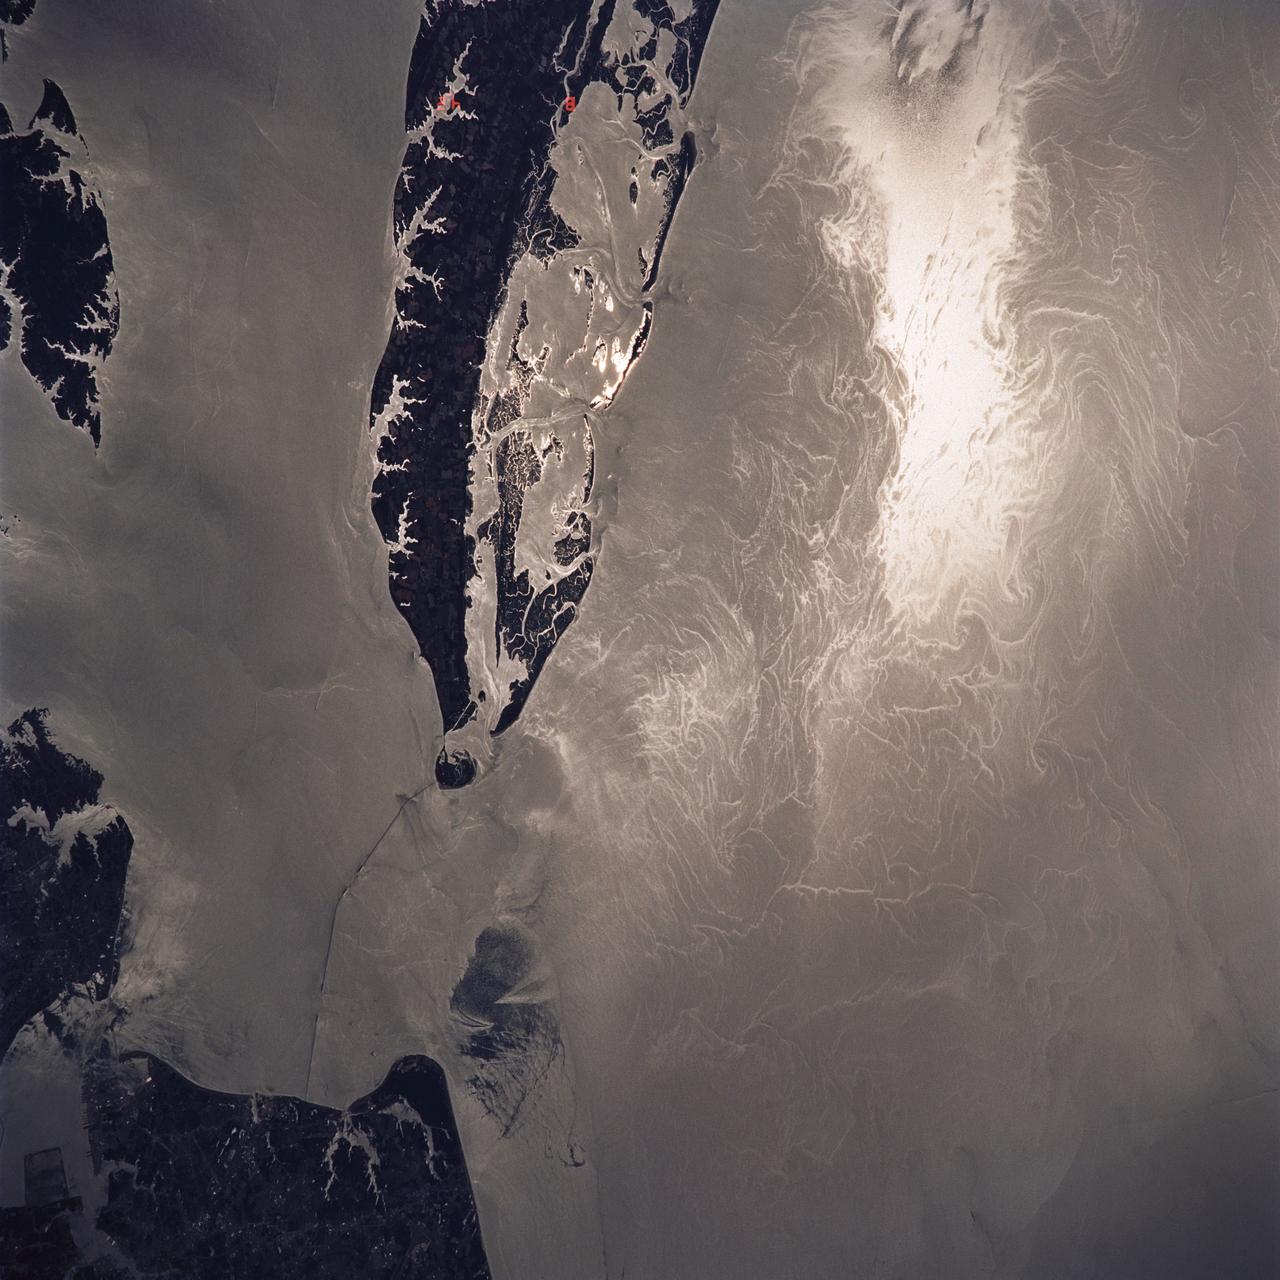
A nearly vertical view of Disappointment Reach and surroundings. Ripple-like patterns extending at right angles to the tidal flow can be discerned on shoals. Relict sand dune patterns, crests unvegetated, are evident on the western side of the estuary. Red mud brought down the Mooramel River on the east side of the estuary does extend into the shallow water of the inter-tidal lagoons. Most of the light-colored water along the coast, represents shoals of lime sediment. Patterns of sediment distribution by tides, waves, streams, and wind combine to create a complex and colorful scene.
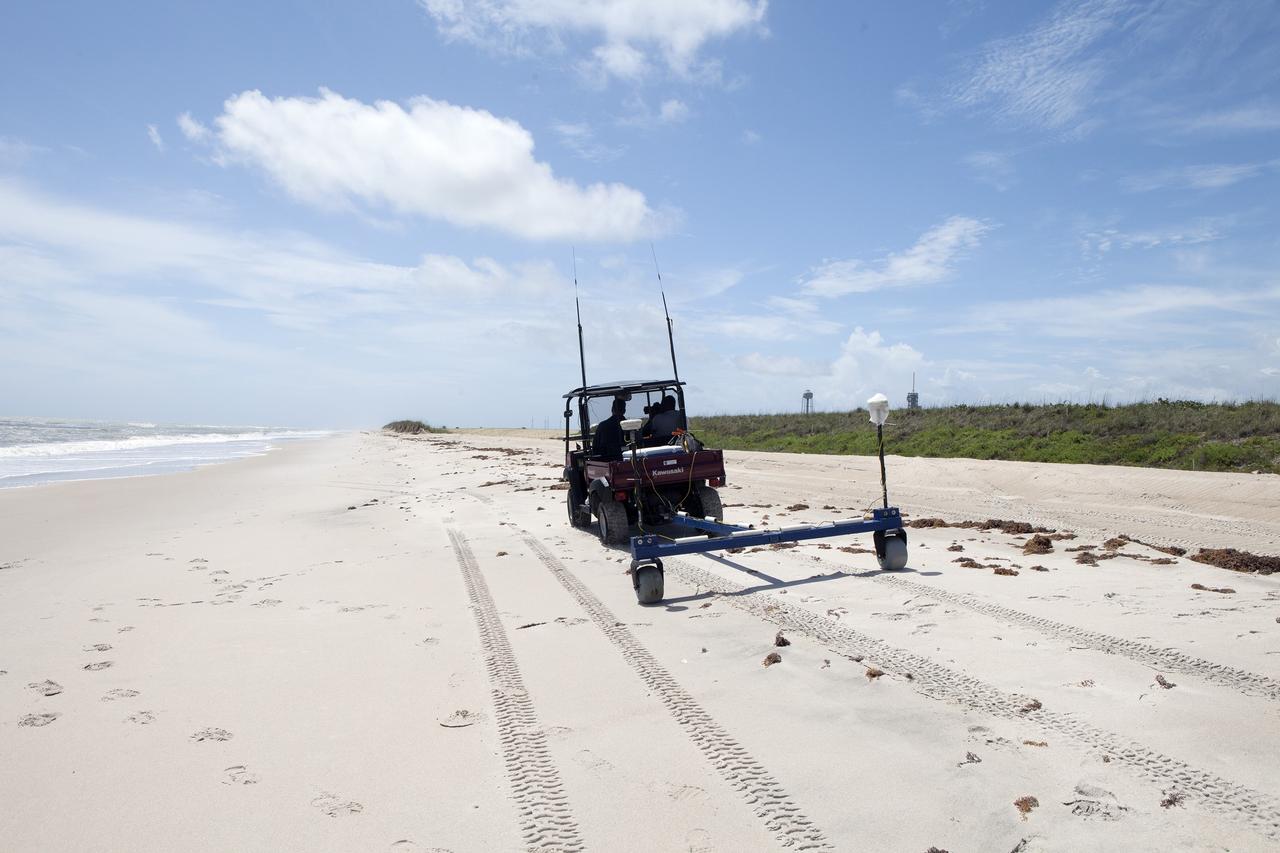
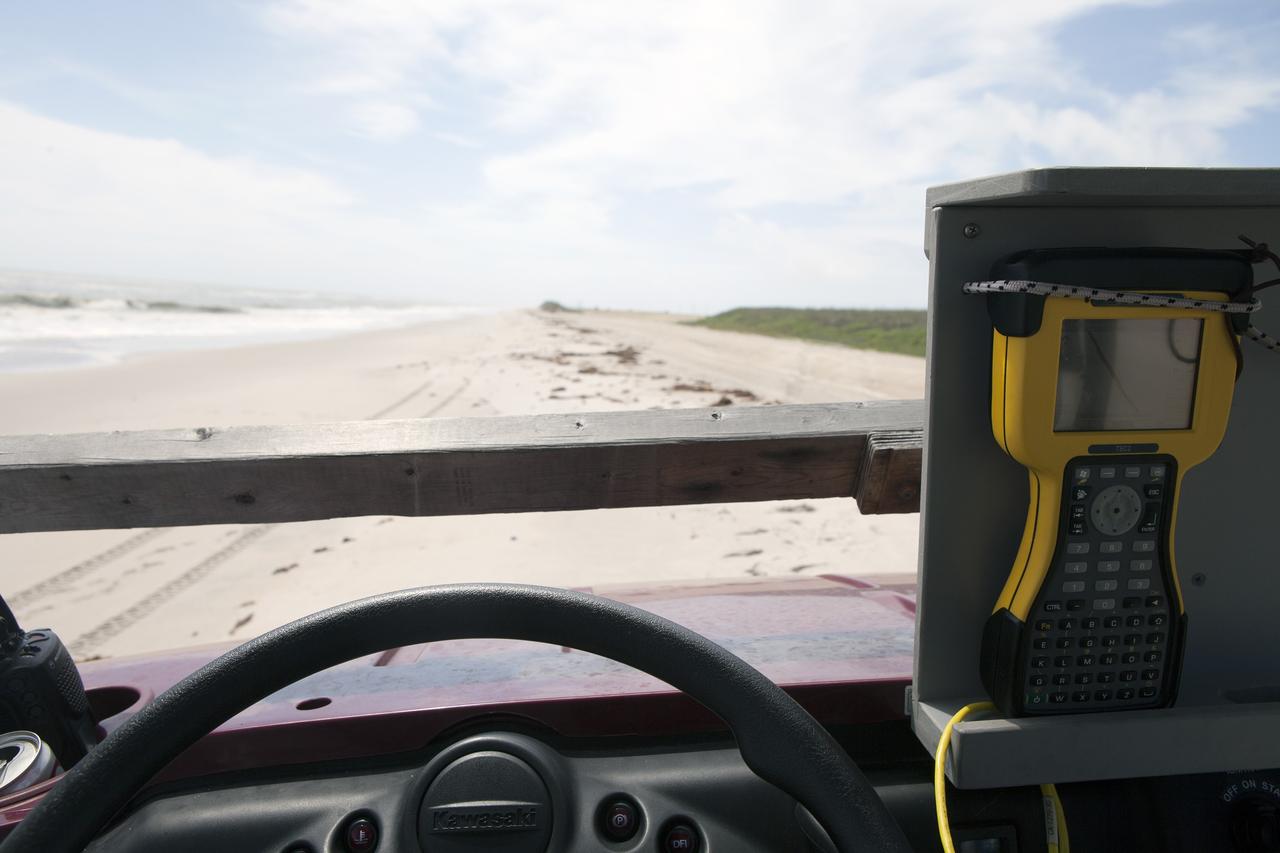
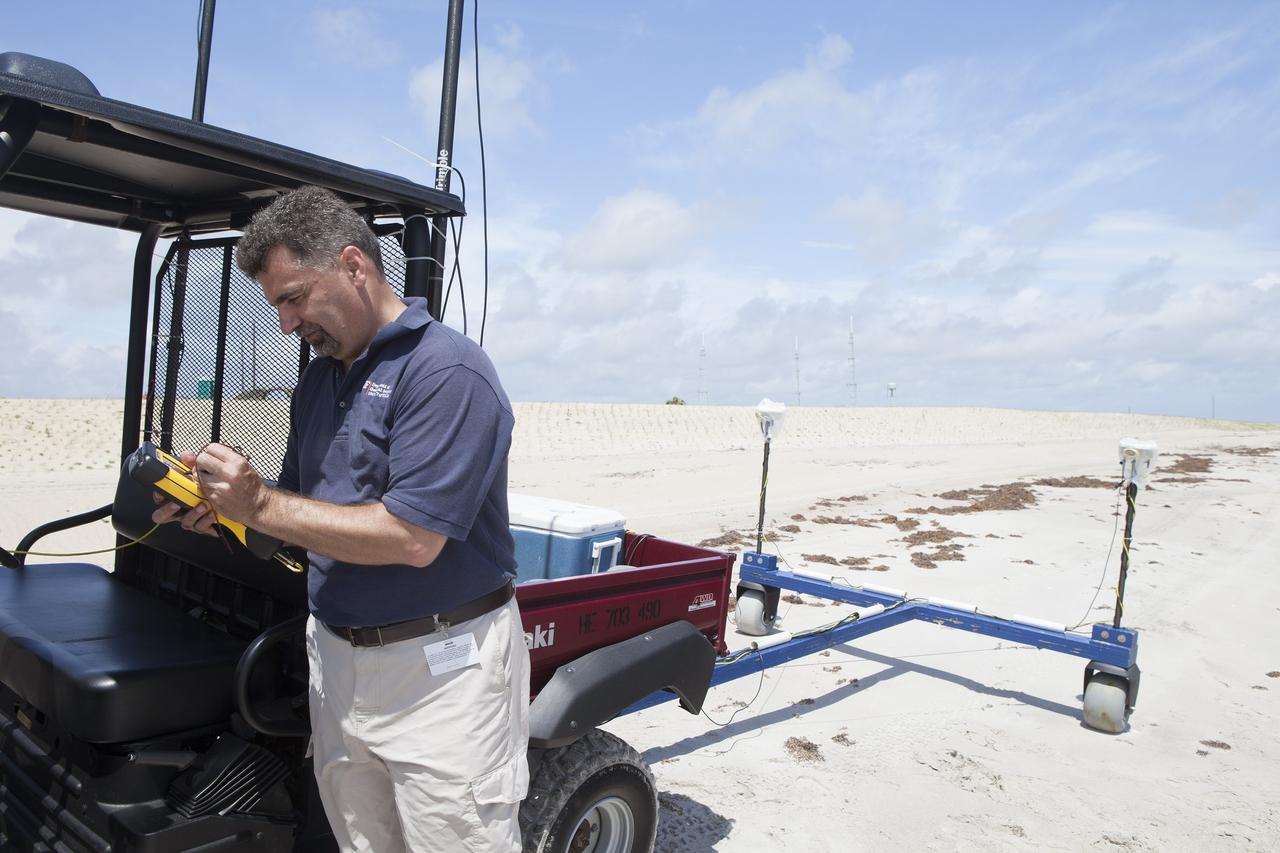
CAPE CANAVERAL, Fla. -- Rich MacKenzie, who earned a doctorate in geological sciences at the University of Florida, collects Global Positioning System survey measurements along a restored 1.2 mile stretch of shoreline near Launch Pads 39A and B. Experts from University of Florida are working with NASA scientists to better understand beach erosion. Constant pounding from tropical storms, such as Hurricane Sandy in October of 2012, other weather systems and higher than usual tides, destroyed sand dunes protecting infrastructure at the spaceport. Photo credit: NASA/Dan Casper
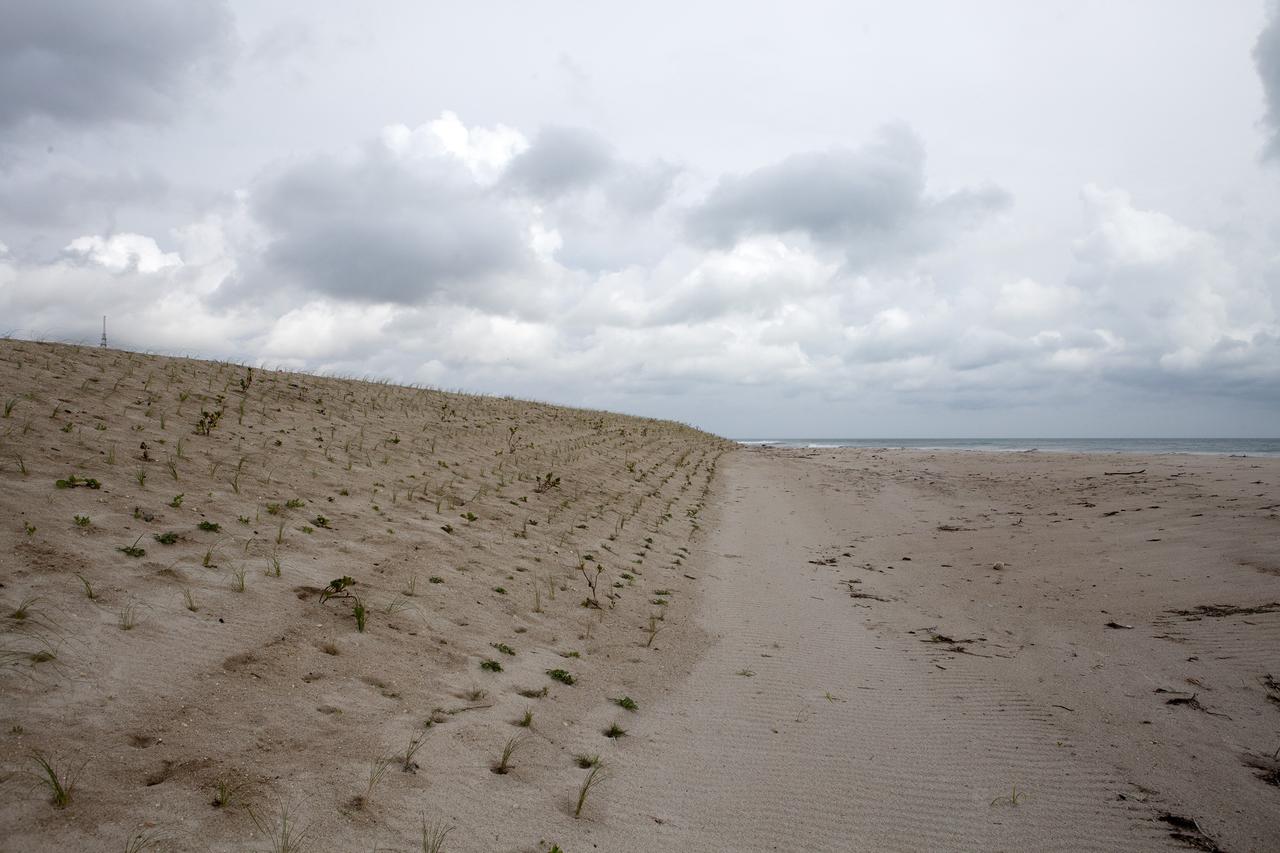
CAPE CANAVERAL, Fla. -- At the Kennedy Space Center in Florida, the sand dunes along a 1.2 mile stretch of shoreline near Launch Pads 39A and B were restored during a six-month effort using 90,000 cubic yards of sand. To help prevent erosion, 180,000 shrubs, including grasses, sunflowers, vines, sea grapes and palmettos were planted. Constant pounding from tropical storms, such as Hurricane Sandy in October of 2012, other weather systems and higher than usual tides, destroyed sand dunes protecting infrastructure at the spaceport. Photo credit: NASA/Dan Casper

This composite image of southern Africa and the surrounding oceans was captured by six orbits of the NASA/NOAA Suomi National Polar-orbiting Partnership spacecraft on April 9, 2015, by the Visible Infrared Imaging Radiometer Suite (VIIRS) instrument. Tropical Cyclone Joalane can be seen over the Indian Ocean. Winds, tides and density differences constantly stir the oceans while phytoplankton continually grow and die. Orbiting radiometers such as VIIRS allows scientists to track this variability over time and contribute to better understanding of ocean processes that are beneficial to human survival on Earth. The image was created by the Ocean Biology Processing Group at NASA's Goddard Space Flight Center in Greenbelt, Maryland.
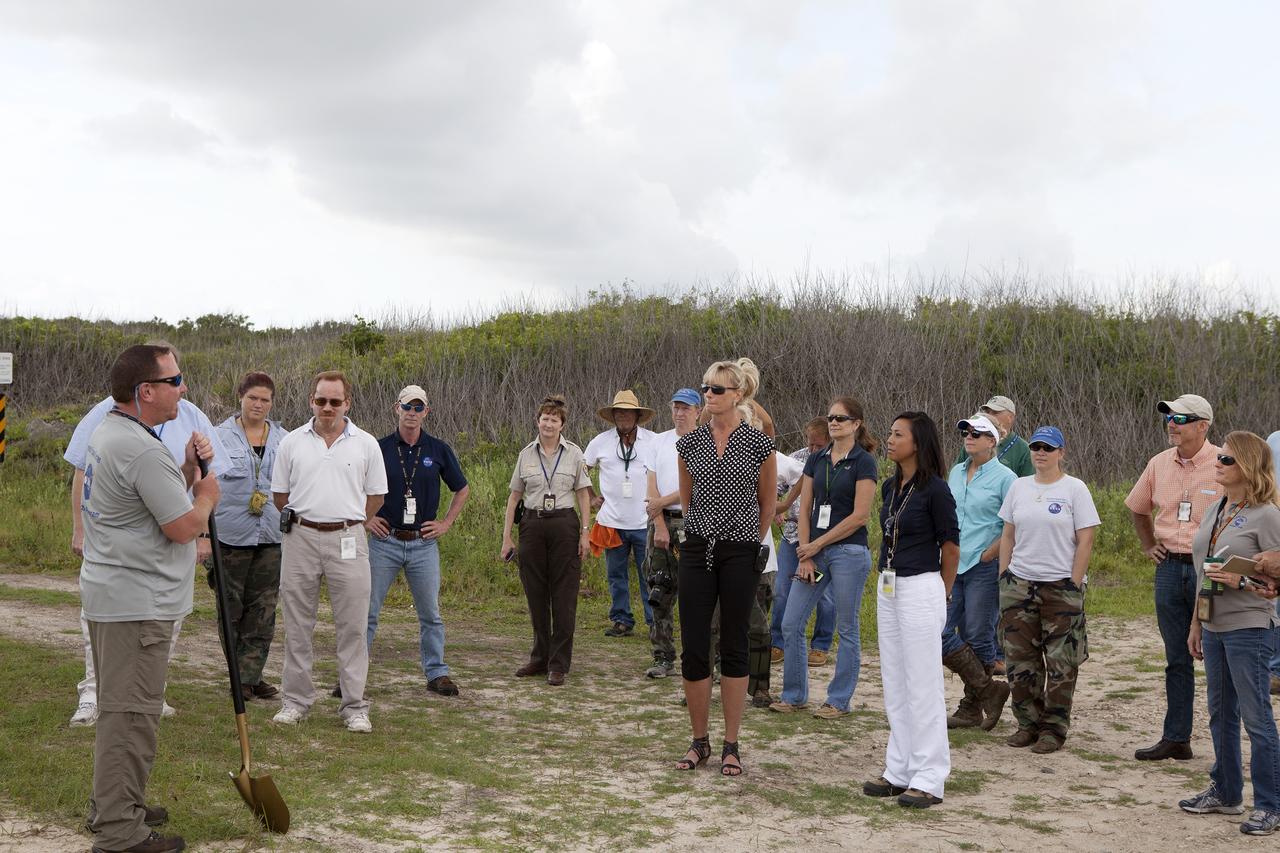
CAPE CANAVERAL, Fla. -- At the Kennedy Space Center in Florida, Don Dankert, a biological scientist in the NASA Environmental Management Branch of Center Operations, far left, speaks to guests during ceremonies to commemorate the completion of a six-month effort to restore 1.2 mile stretch of shoreline near Launch Pads 39A and B. To help prevent erosion, 180,000 shrubs, including grasses, sunflowers, vines, sea grapes and palmettos also were planted on the new dunes. Constant pounding from tropical storms, such as Hurricane Sandy in October of 2012, other weather systems and higher than usual tides, destroyed sand dunes protecting infrastructure at the spaceport. Photo credit: NASA/Dan Casper
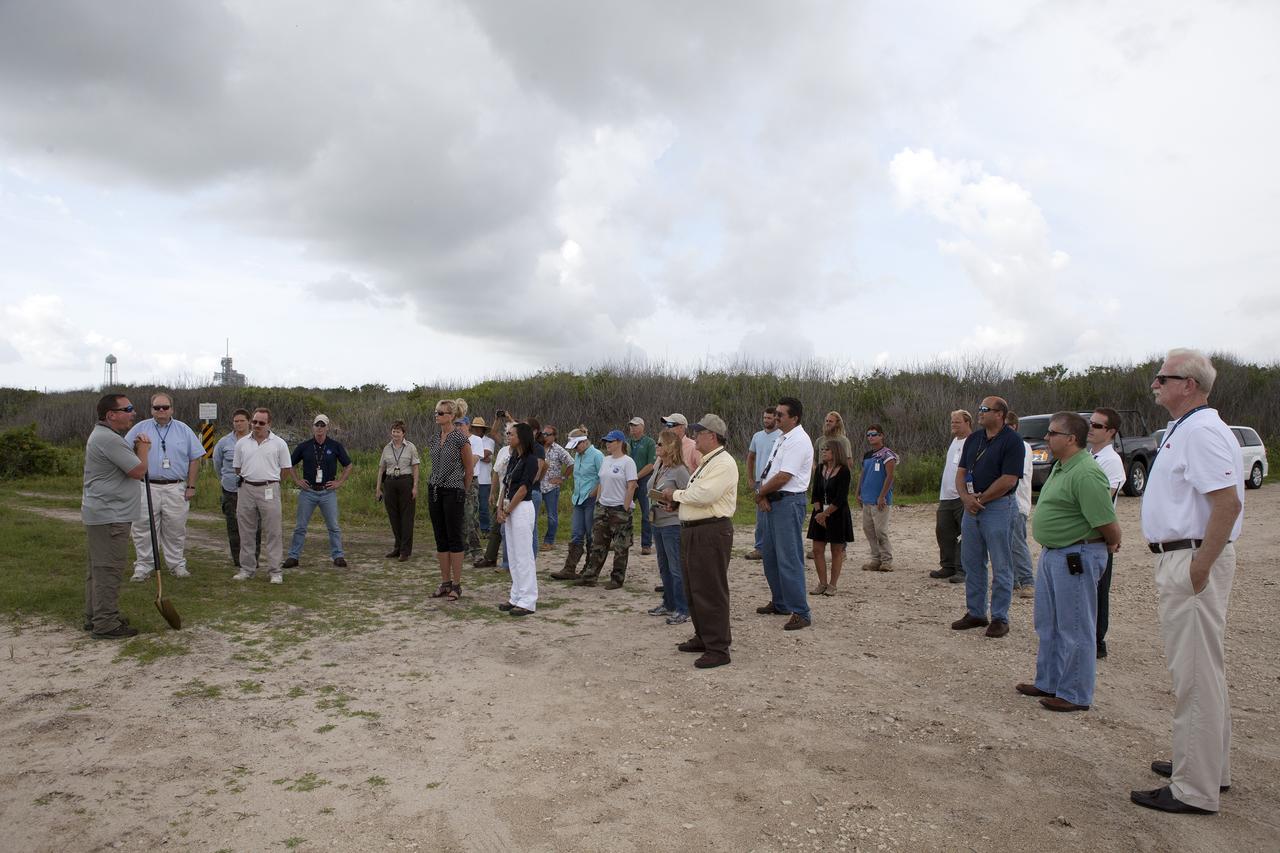
CAPE CANAVERAL, Fla. -- At the Kennedy Space Center in Florida, Don Dankert, a biological scientist in the NASA Environmental Management Branch of Center Operations, far left, speaks to guests during ceremonies to commemorate the completion of a six-month effort to restore 1.2 mile stretch of shoreline near Launch Pads 39A and B. To help prevent erosion, 180,000 shrubs, including grasses, sunflowers, vines, sea grapes and palmettos also were planted on the new dunes. Constant pounding from tropical storms, such as Hurricane Sandy in October of 2012, other weather systems and higher than usual tides, destroyed sand dunes protecting infrastructure at the spaceport. Photo credit: NASA/Dan Casper
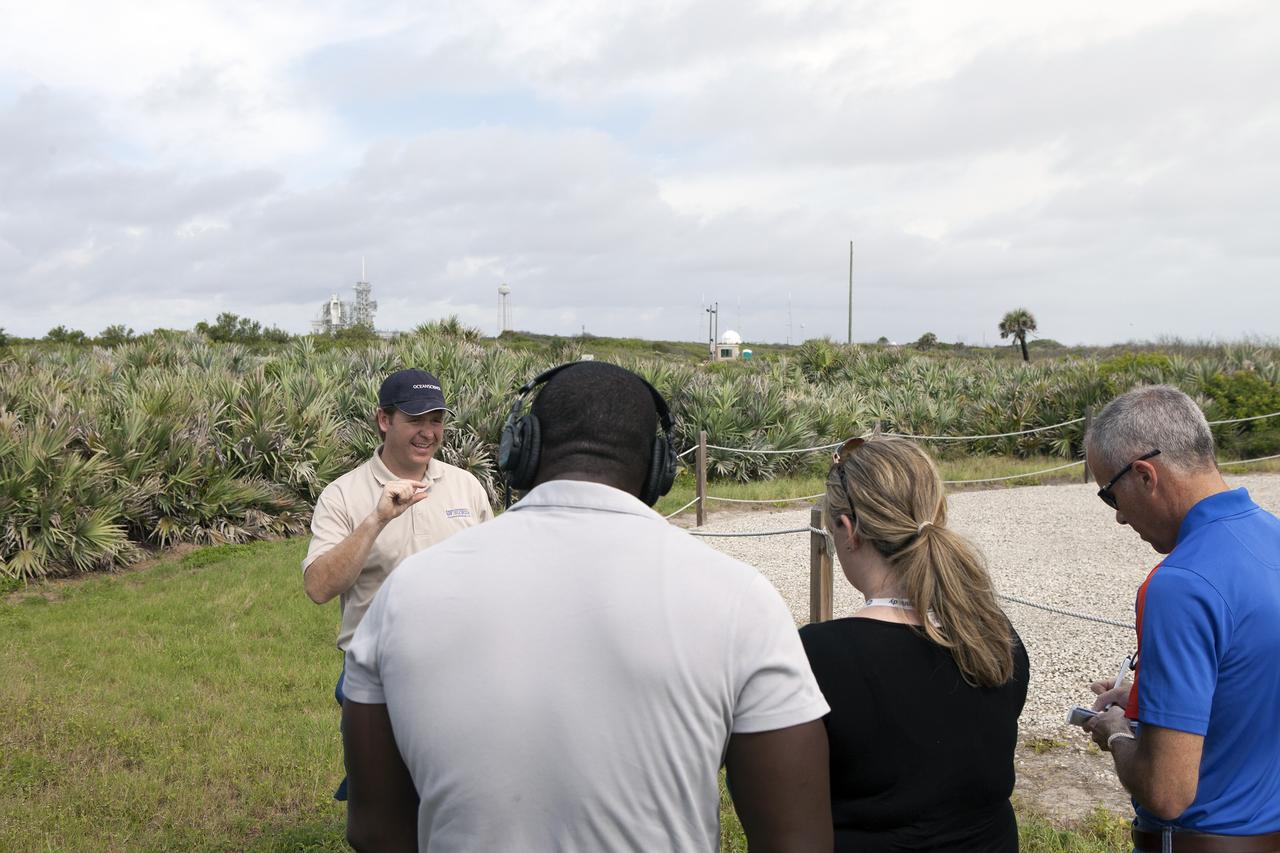
CAPE CANAVERAL, Fla. -- University of Florida geologist, Pete Adams, discusses a six-month effort to restore the sand dunes along a 1.2 mile stretch of shoreline near Launch Pads 39A and B at the Kennedy Space Center in Florida. Experts from University of Florida are working with NASA scientists to better understand beach erosion. Constant pounding from tropical storms, such as Hurricane Sandy in October of 2012, other weather systems and higher than usual tides, destroyed sand dunes protecting infrastructure at the spaceport. Photo credit: NASA/Dan Casper
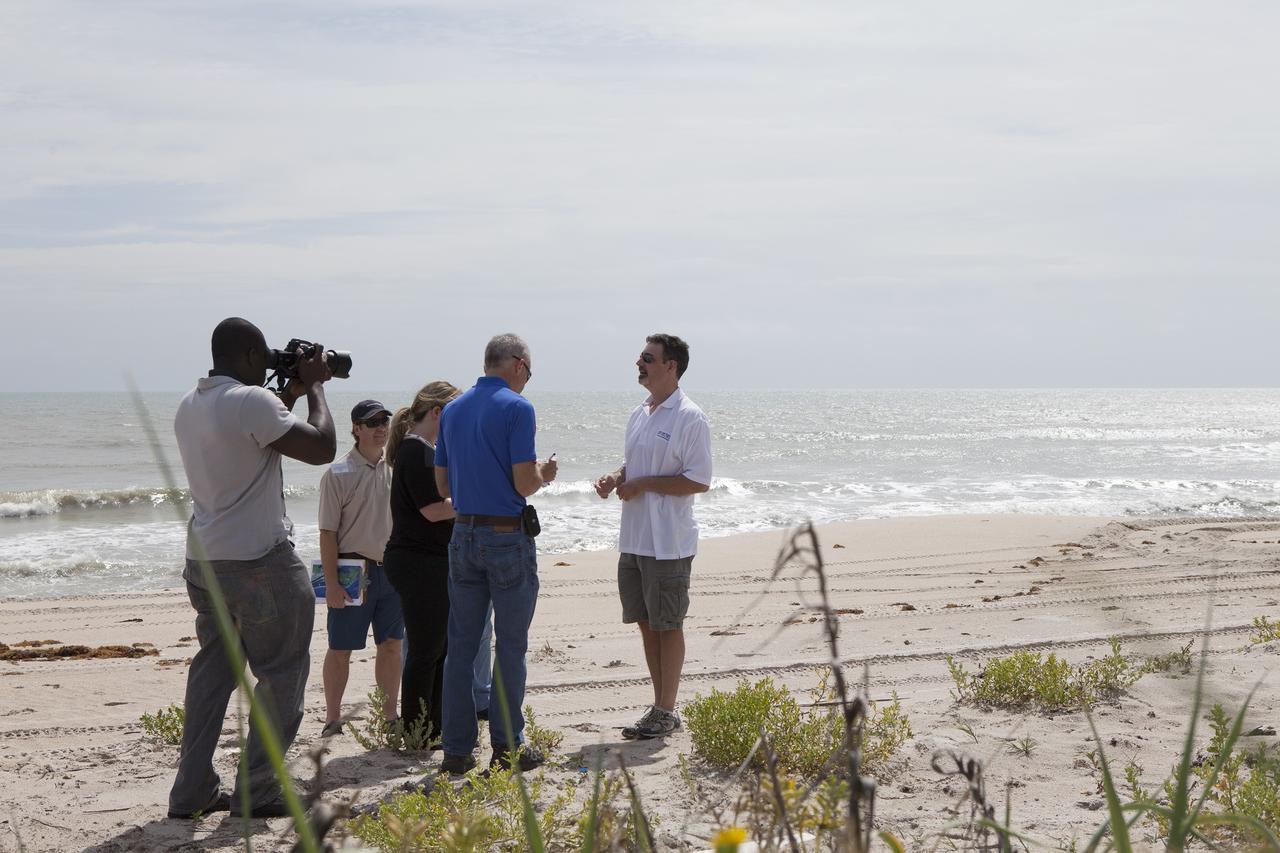
CAPE CANAVERAL, Fla. -- University of Florida geologist, John Jaeger, discusses a six-month effort to restore the sand dunes along a 1.2 mile stretch of shoreline near Launch Pads 39A and B at the Kennedy Space Center in Florida. Experts from University of Florida are working with NASA scientists to better understand beach erosion. Constant pounding from tropical storms, such as Hurricane Sandy in October of 2012, other weather systems and higher than usual tides, destroyed sand dunes protecting infrastructure at the spaceport. Photo credit: NASA/Dan Casper

CAPE CANAVERAL, Fla. -- At the Kennedy Space Center in Florida, sand dunes have been restored along a 1.2 mile stretch of shoreline near Launch Pads 39A and B. As part of a six-month effort to help prevent further erosion, 180,000 shrubs, including grasses, sunflowers, vines, sea grapes and palmettos were planted. Constant pounding from tropical storms, such as Hurricane Sandy in October of 2012, other weather systems and higher than usual tides, destroyed sand dunes protecting infrastructure at the spaceport. Photo credit: NASA/Dan Casper
CAPE CANAVERAL, Fla. -- At the Kennedy Space Center in Florida, University of Florida geologists and NASA biologists use an all-terrain vehicle to survey sand dunes that have been restored along a 1.2 mile stretch of shoreline near Launch Pads 39A and B. As part of a six-month effort to help prevent further erosion, 180,000 shrubs, including grasses, sunflowers, vines, sea grapes and palmettos were planted. Constant pounding from tropical storms, such as Hurricane Sandy in October of 2012, other weather systems and higher than usual tides, destroyed sand dunes protecting infrastructure at the spaceport. Photo credit: NASA/Dan Casper
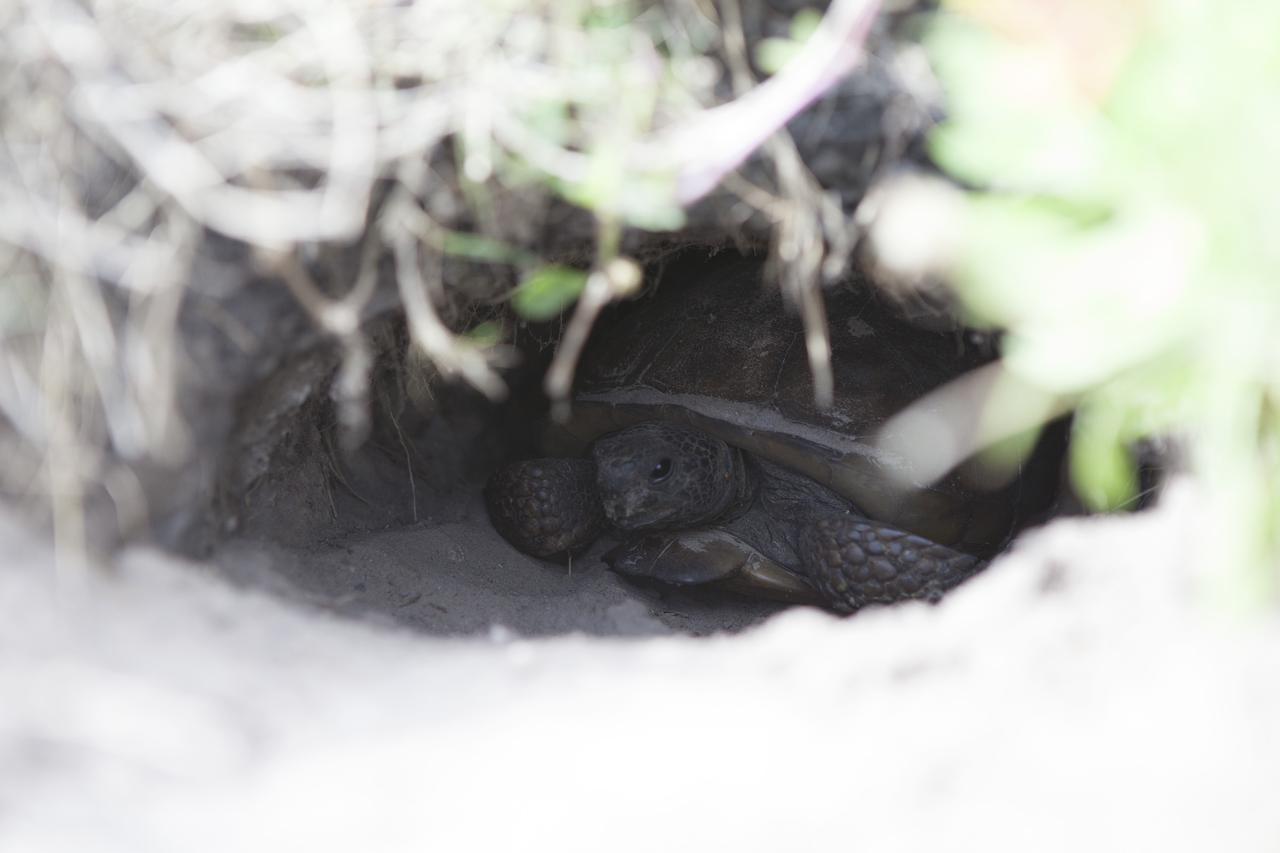
CAPE CANAVERAL, Fla. -- At the Kennedy Space Center in Florida, a turtle has burrowed into a restored sand dune along a 1.2 mile stretch of shoreline near Launch Pads 39A and B. As part of a six-month effort to help prevent further erosion, 180,000 shrubs, including grasses, sunflowers, vines, sea grapes and palmettos were planted. Constant pounding from tropical storms, such as Hurricane Sandy in October of 2012, other weather systems and higher than usual tides, destroyed sand dunes protecting infrastructure at the spaceport. Photo credit: NASA/Dan Casper
CAPE CANAVERAL, Fla. -- At the Kennedy Space Center in Florida, University of Florida geologists and NASA biologists use an all-terrain vehicle to survey sand dunes that have been restored along a 1.2 mile stretch of shoreline near Launch Pads 39A and B. As part of a six-month effort to help prevent further erosion, 180,000 shrubs, including grasses, sunflowers, vines, sea grapes and palmettos were planted. Constant pounding from tropical storms, such as Hurricane Sandy in October of 2012, other weather systems and higher than usual tides, destroyed sand dunes protecting infrastructure at the spaceport. Photo credit: NASA/Dan Casper
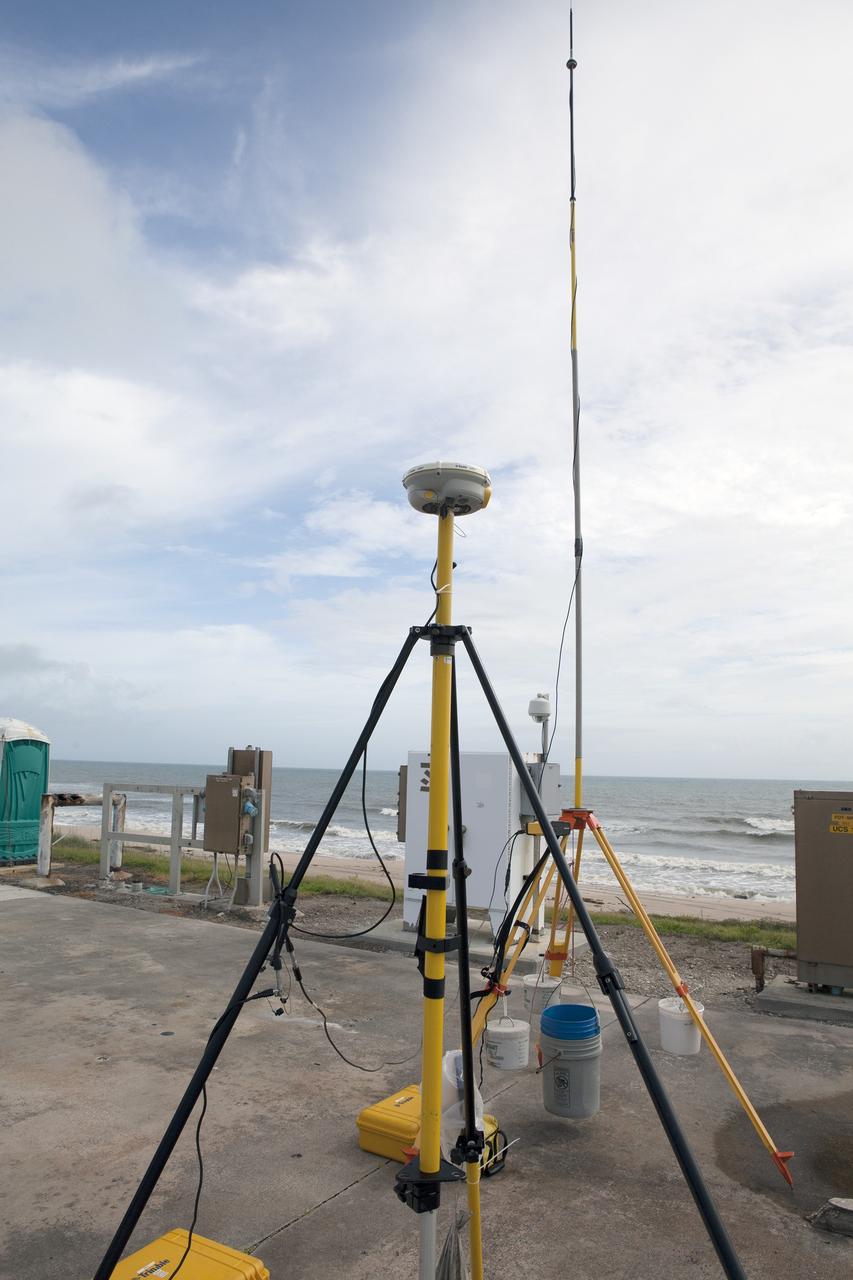
CAPE CANAVERAL, Fla. -- At the Kennedy Space Center in Florida, the sand dunes along a 1.2 mile stretch of shoreline near Launch Pads 39A and B were restored during a six-month effort. In a joint effort with NASA, University of Florida geologists are using weather instrumentation to study the shores of the center to better understand beach erosion. Constant pounding from tropical storms, such as Hurricane Sandy in October of 2012, other weather systems and higher than usual tides, destroyed sand dunes protecting infrastructure at the spaceport. Photo credit: NASA/Dan Casper
CAPE CANAVERAL, Fla. -- At the Kennedy Space Center in Florida, Don Dankert, a biological scientist in the NASA Environmental Management Branch of Center Operations, left, and Glenn Semmel, chief of the Environmental Management Branch of Center Operations retrieve the final shrub that is among 180,000 planted on a new 1.2-mile stretch of shoreline near Launch Pads 39A and B. Constant pounding from tropical storms, such as Hurricane Sandy in October of 2012, other weather systems and higher than usual tides, destroyed sand dunes protecting infrastructure at the spaceport. Photo credit: NASA/Dan Casper
CAPE CANAVERAL, Fla. -- At the Kennedy Space Center in Florida, Don Dankert, a biological scientist in the NASA Environmental Management Branch of Center Operations, left, and Burton Summerfield, senior advisor for Institutional Management in the office of the associate director of Kennedy speak to guests during ceremonies to commemorate the completion of a six-month effort to restore 1.2 mile stretch of shoreline near Launch Pads 39A and B. To help prevent erosion, 180,000 shrubs, including grasses, sunflowers, vines, sea grapes and palmettos also were planted on the new dunes. Constant pounding from tropical storms, such as Hurricane Sandy in October of 2012, other weather systems and higher than usual tides, destroyed sand dunes protecting infrastructure at the spaceport. Photo credit: NASA/Dan Casper
STS040-614-047 (5-14 June 1991) --- This image is of the Norfolk, Virginia -- Southern Delmarva Peninsula Southern Chesapeake Bay Area as seen in sunlight. The exposure is adjusted to emphasize the water patterns present. The outgoing tide generates considerable turbulence as it passes through the mouth of the bay. This is displayed by differences in reflective properties of the water surface due to differences in slope and turbidity. Ship wakes and the wakes of subsurface structures are seen clearly. The bridge tunnel system linking Norfolk with the peninsula and its effect on the system is quite apparent. Sunglint images over land areas were also acquired which emphasize land-water boundaries as demonstrated here in the small Delmarva inlets as a tool for wetland mapping, and river, lake and even pond description. During the first few days of the STS-40 mission the Eastern Seaboard of the United States was free of clouds and haze providing excellent photography of many of the major cities and the countryside of that area as well as the Gulf Stream.
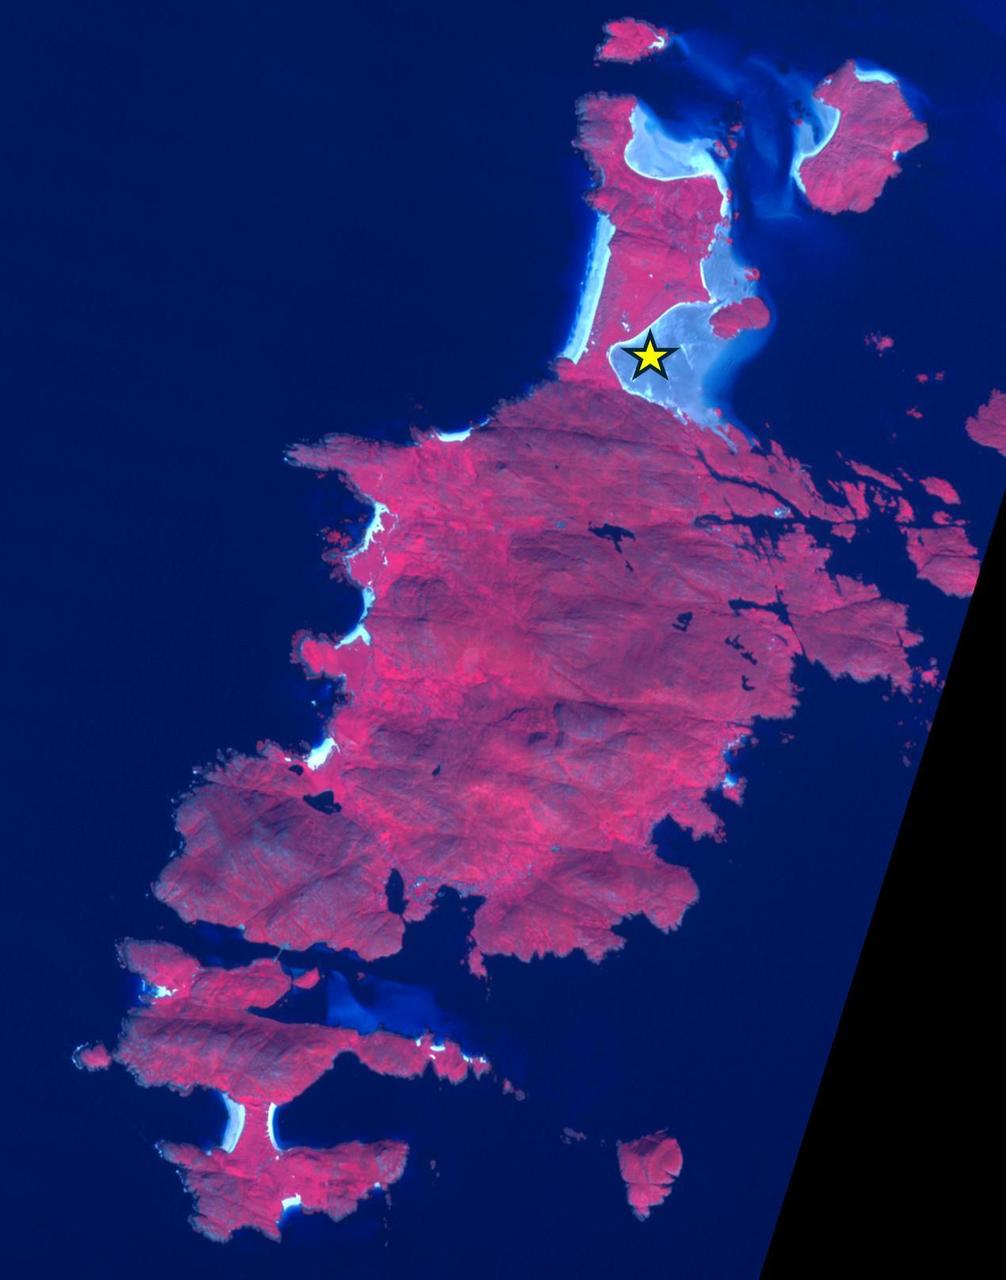
Chausey is a group of small islands and islets off the coast of Normandy and is part of the French Channel Islands. Chausey bounced back and forth between England and France for 800 years before finally officially belonging to France in the 19th century. The archipelago comprises 365 islands at low tide (2019 image), compared to only 52 islands at high tide (2018 image). The images were acquired July 7, 2018 and September 10, 2019, cover an area of 6.7 by 10.5 km, and are located at 48.9 degrees north, 1.8 degrees west. With its 14 spectral bands from the visible to the thermal infrared wavelength region and its high spatial resolution of about 50 to 300 feet (15 to 90 meters), ASTER images Earth to map and monitor the changing surface of our planet. ASTER is one of five Earth-observing instruments launched Dec. 18, 1999, on Terra. The instrument was built by Japan's Ministry of Economy, Trade and Industry. A joint U.S./Japan science team is responsible for validation and calibration of the instrument and data products. The broad spectral coverage and high spectral resolution of ASTER provides scientists in numerous disciplines with critical information for surface mapping and monitoring of dynamic conditions and temporal change. Example applications are monitoring glacial advances and retreats; monitoring potentially active volcanoes; identifying crop stress; determining cloud morphology and physical properties; wetlands evaluation; thermal pollution monitoring; coral reef degradation; surface temperature mapping of soils and geology; and measuring surface heat balance. https://photojournal.jpl.nasa.gov/catalog/PIA25800
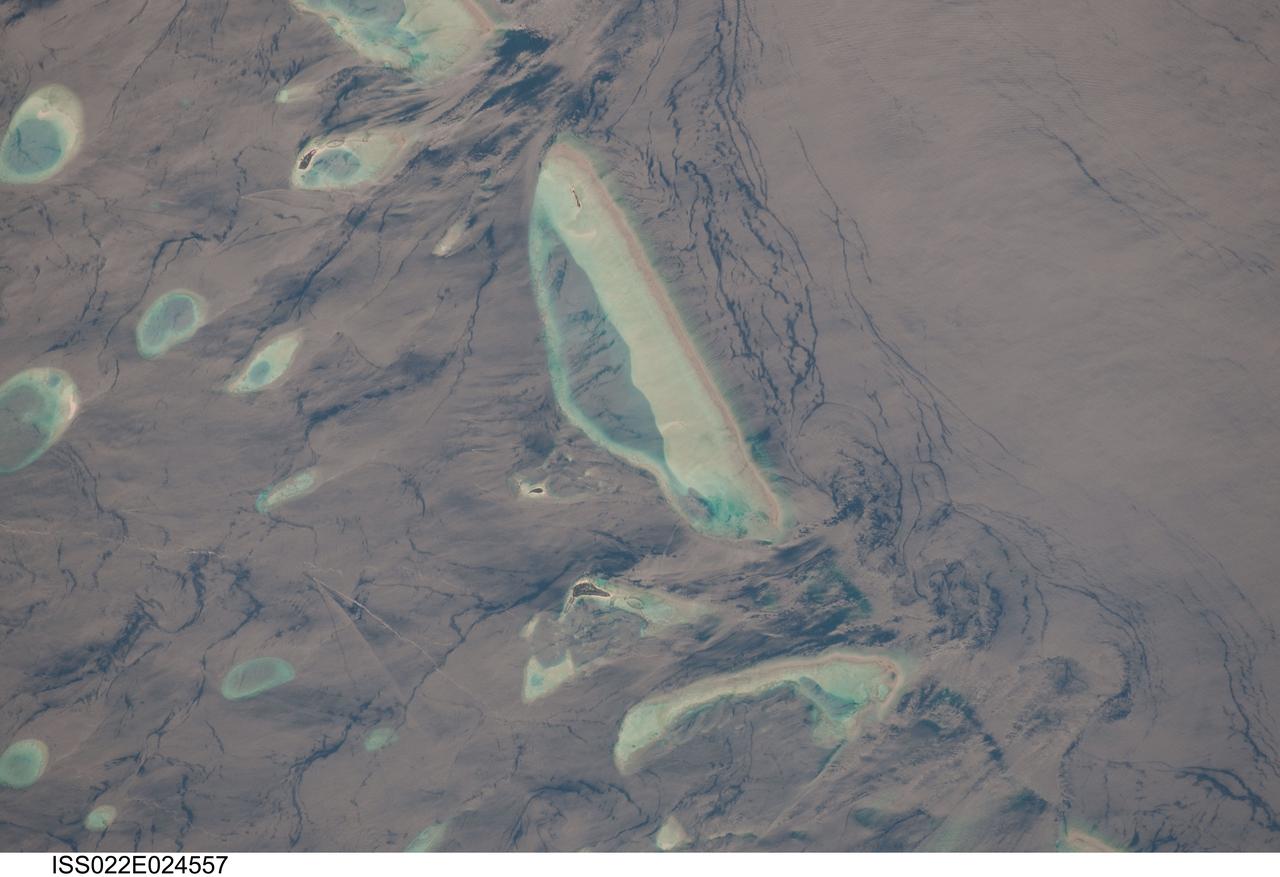
ISS022-E-024557 (12 Jan. 2010) --- Male Atoll and Maldive Islands in the Indian Ocean are featured in this image photographed by an Expedition 22 crew member on the International Space Station. This detailed photograph features one of the numerous atolls in the Maldive Island chain. The Maldives are an island nation, comprised of twenty-six atolls that stretch in a north-to-south chain for almost 900 kilometers southwest of the Indian subcontinent. The silvery, almost pink sheen on the normally blue water of the equatorial Indian Ocean is the result of sunglint. Sunglint occurs when sunlight is reflected off of a water surface directly back towards the observer ? in this case a crew member on the space station. Full sunglint in images typically results in bright silver to white coloration of the water surface. Sunglint images can have different hues depending on the roughness of the water surface and atmospheric conditions. They also can reveal numerous details of water circulation which are otherwise invisible. This image was taken during the Indian Ocean Northeast monsoon season - predominant winds in this area create sinuous surface water patterns on the leeward side, and between, the islets (left). A south-flowing current flows in the deeper water through the Maldives most of the year (right), with fan-shaped surface currents formed by local tides pulsing in and out of the shallow water near the islands (top and bottom). The largest island seen here (center) is 6 kilometers long, and is one of the outer ring of larger islands that make up the 70 kilometers-long, oval-shaped Male Atoll. Shores facing deeper water have well-defined beaches. Numerous small, elliptical coral reef islets are protected within the ring of shallow water to the northeast (left). These islets are mostly awash at high tide, with dry ground appearing in tiny patches only. A small boat was navigating between the islets at the time the image was taken as indicated by its v-shaped wake at bottom left. Images like these illustrate why the Republic of Maldives is one of the most outspoken countries in stressing the dangers of rising sea levels.
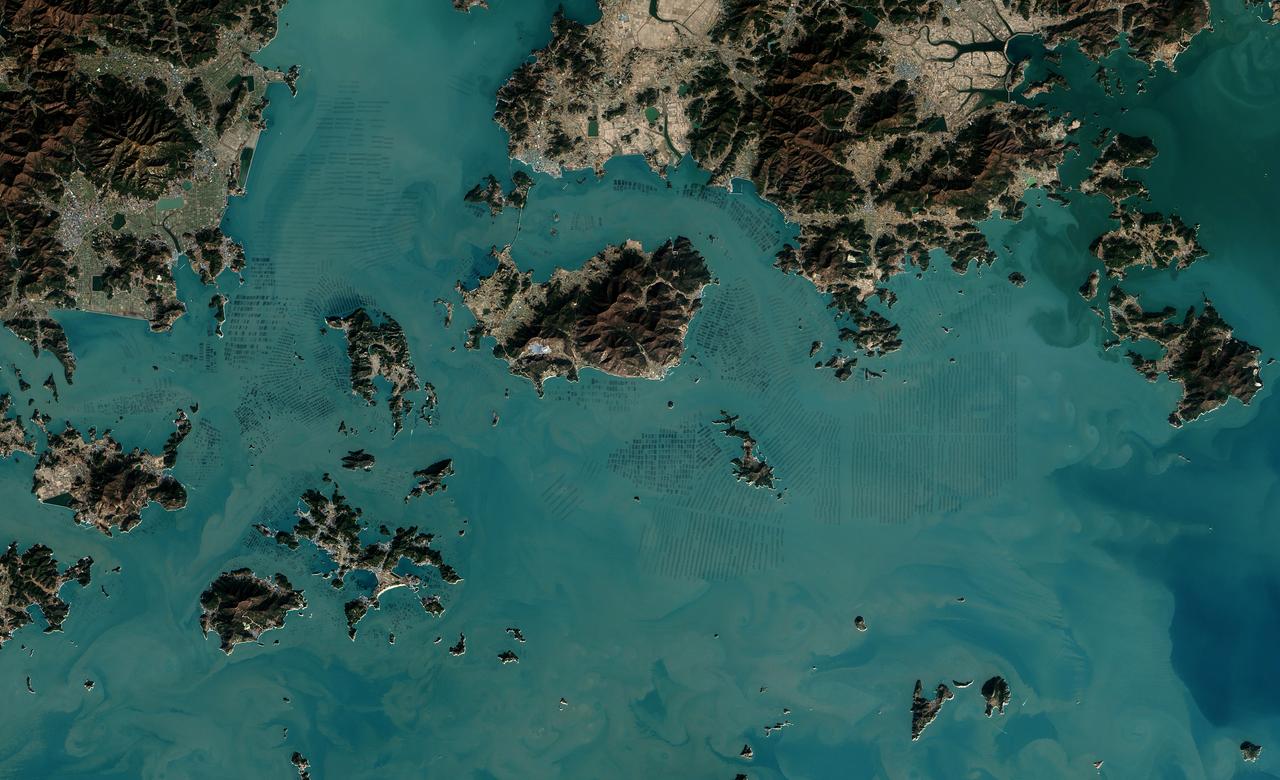
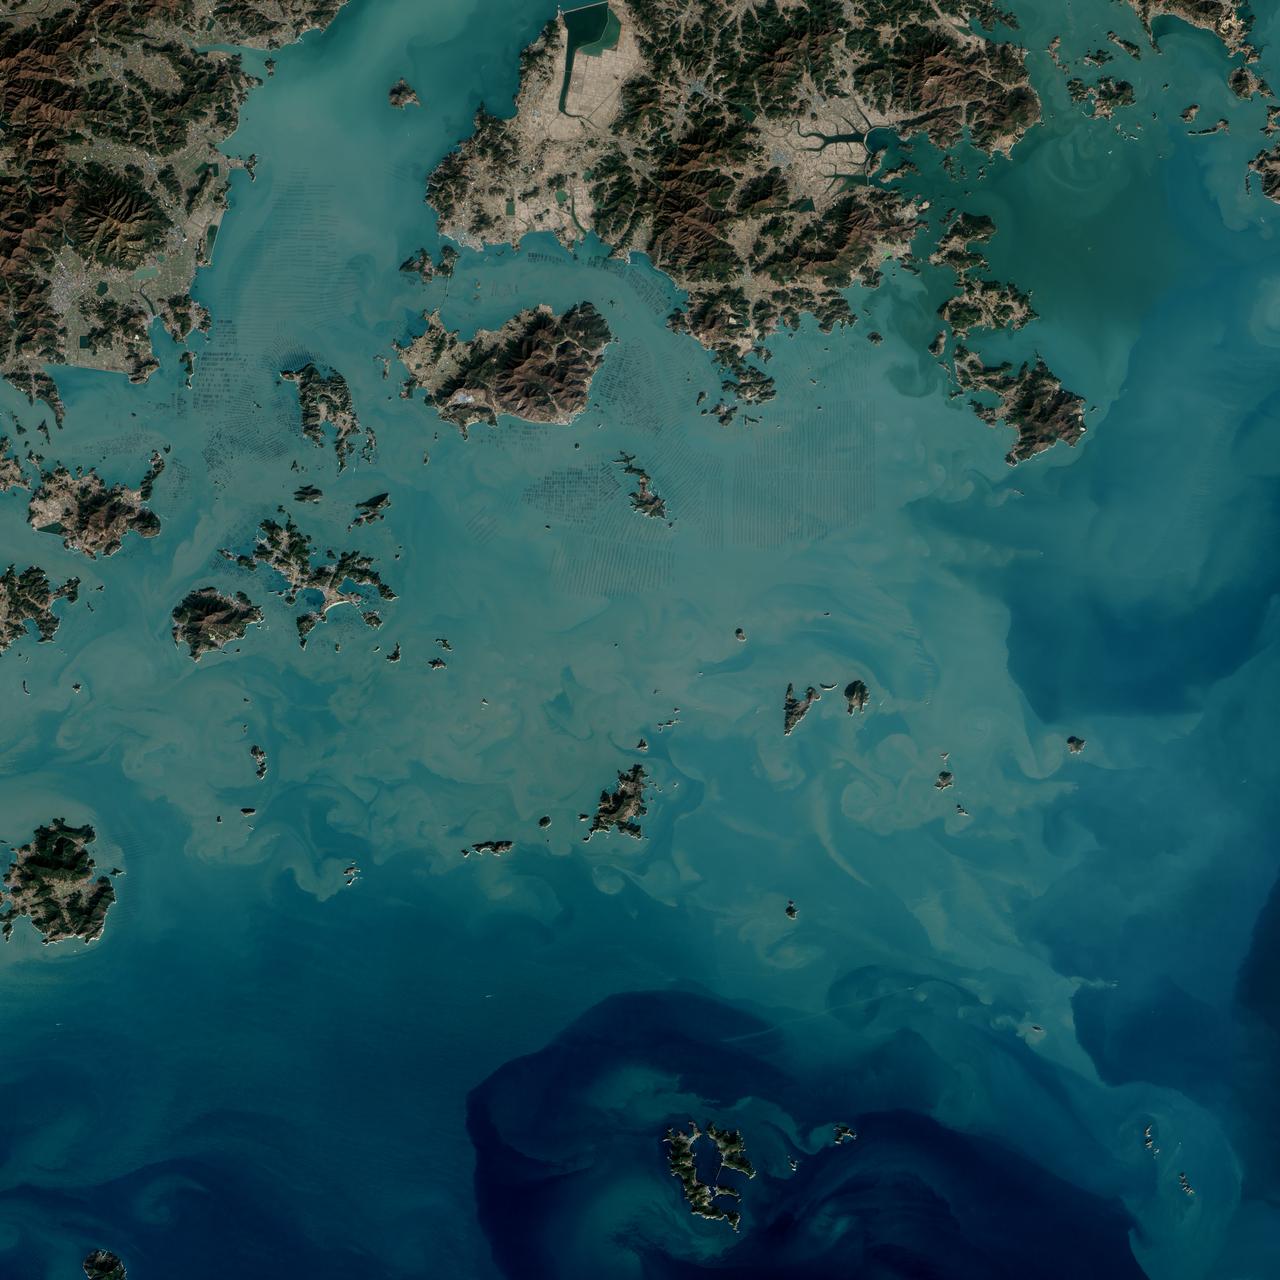
The dark squares that make up the checkerboard pattern in this image are fields of a sort—fields of seaweed. Along the south coast of South Korea, seaweed is often grown on ropes, which are held near the surface with buoys. This technique ensures that the seaweed stays close enough to the surface to get enough light during high tide but doesn’t scrape against the bottom during low tide. The Operational Land Imager (OLI) on Landsat 8 acquired this image of seaweed cultivation in the shallow waters around Sisan Island on January 31, 2014. Home to a thriving aquaculture industry, the south coast of South Korea produces about 90 percent of the country’s seaweed crop. The waters around Sisan are not the only place where aquaculture is common. View the large image to see how ubiquitous seaweed aquaculture is along the coast in Jeollanam-do, the southernmost province on the Korean peninsula. Two main types of seaweed are cultivated in South Korea: Undaria (known as miyeok in Korean, wakame in Japanese) and Pyropia (gim in Korean, nori in Japanese). Both types are used generously in traditional Korean, Japanese, and Chinese food. Since 1970, farmed seaweed production has increased by approximately 8 percent per year. Today, about 90 percent of all the seaweed that humans consume globally is farmed. That may be good for the environment. In comparison to other types of food production, seaweed farming has a light environmental footprint because it does not require fresh water or fertilizer. NASA Earth Observatory image by Jesse Allen, using Landsat data from the U.S. Geological Survey. Caption by Adam Voiland. Credit: <b><a href="http://www.earthobservatory.nasa.gov/" rel="nofollow"> NASA Earth Observatory</a></b> <b><a href="http://www.nasa.gov/audience/formedia/features/MP_Photo_Guidelines.html" rel="nofollow">NASA image use policy.</a></b> <b><a href="http://www.nasa.gov/centers/goddard/home/index.html" rel="nofollow">NASA Goddard Space Flight Center</a></b> enables NASA’s mission through four scientific endeavors: Earth Science, Heliophysics, Solar System Exploration, and Astrophysics. Goddard plays a leading role in NASA’s accomplishments by contributing compelling scientific knowledge to advance the Agency’s mission. <b>Follow us on <a href="http://twitter.com/NASAGoddardPix" rel="nofollow">Twitter</a></b> <b>Like us on <a href="http://www.facebook.com/pages/Greenbelt-MD/NASA-Goddard/395013845897?ref=tsd" rel="nofollow">Facebook</a></b> <b>Find us on <a href="http://instagrid.me/nasagoddard/?vm=grid" rel="nofollow">Instagram</a></b>
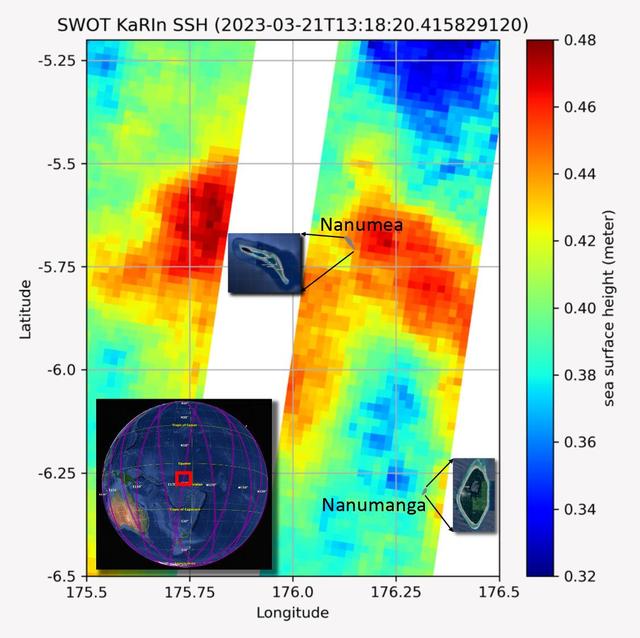
The recently launched Surface Water and Ocean Topography (SWOT) mission collected data on sea levels around two of the inhabited islands of Tuvalu, a nation in the South Pacific Ocean that has been threatened with sea level rise that substantially exceeds the global average. The image shows two areas of red that indicate higher than normal sea levels around two of Tuvalu's inhabited islands, Nanumanga and Nanumea. The higher sea levels were likely caused by internal tides or circular currents called eddies. The SWOT data illuminates for the first time these small ocean features that, when they occur on top of rising sea levels, can lead to episodic flooding along coastlines. The Tuvalu data was collected March 21, 2023. Rising seas are a direct consequence of climate change. On a global scale, the combination of warming ocean waters and ice melt from glaciers and ice sheets is leading to sea level rise that is occurring at an ever-increasing rate. The current rate of rise is more than 0.15 inches (4 millimeters) per year, an increase from 0.08 inches (2 millimeters) per year in 1993. This seemingly small increase holds great significance for coastal communities that have seen more than a century of persistent sea level rise. The gap between the average high tide and flooding conditions has narrowed, and coastal impacts driven by sea level rise have increased in frequency and severity in recent years. This is particularly true for low-lying island nations like Tuvalu, located about 620 miles (1,000 kilometers) north of Fiji. Sea level rise does not occur at the same rate everywhere across the globe, and can be exacerbated by natural ocean fluctuations that occur over time periods from years to decades. For Tuvalu, the amount of sea level rise has been substantially higher than the global average over the past three decades. The amount of rise, when coupled with Tuvalu's low land elevations, places the country increasingly under threat. In the near term, sea level rise will combine with naturally occurring ocean variability and storms to exacerbate events like coastal flooding. Monitoring and understanding sea level change is critical for Tuvalu and other low-lying island nations. Launched on Dec. 16, 2022, from Vandenberg Space Force Base in central California, SWOT collected the Tuvalu sea level data during a period of commissioning, calibration, and validation. Engineers are checking out the performance of the satellite's systems and science instruments before the planned start of science operations in summer 2023. https://photojournal.jpl.nasa.gov/catalog/PIA25777
The dark squares that make up the checkerboard pattern in this image are fields of a sort—fields of seaweed. Along the south coast of South Korea, seaweed is often grown on ropes, which are held near the surface with buoys. This technique ensures that the seaweed stays close enough to the surface to get enough light during high tide but doesn’t scrape against the bottom during low tide. The Operational Land Imager (OLI) on Landsat 8 acquired this image of seaweed cultivation in the shallow waters around Sisan Island on January 31, 2014. Home to a thriving aquaculture industry, the south coast of South Korea produces about 90 percent of the country’s seaweed crop. The waters around Sisan are not the only place where aquaculture is common. View the large image to see how ubiquitous seaweed aquaculture is along the coast in Jeollanam-do, the southernmost province on the Korean peninsula. Two main types of seaweed are cultivated in South Korea: Undaria (known as miyeok in Korean, wakame in Japanese) and Pyropia (gim in Korean, nori in Japanese). Both types are used generously in traditional Korean, Japanese, and Chinese food. Since 1970, farmed seaweed production has increased by approximately 8 percent per year. Today, about 90 percent of all the seaweed that humans consume globally is farmed. That may be good for the environment. In comparison to other types of food production, seaweed farming has a light environmental footprint because it does not require fresh water or fertilizer. NASA Earth Observatory image by Jesse Allen, using Landsat data from the U.S. Geological Survey. Caption by Adam Voiland. Credit: <b><a href="http://www.earthobservatory.nasa.gov/" rel="nofollow"> NASA Earth Observatory</a></b> <b><a href="http://www.nasa.gov/audience/formedia/features/MP_Photo_Guidelines.html" rel="nofollow">NASA image use policy.</a></b> <b><a href="http://www.nasa.gov/centers/goddard/home/index.html" rel="nofollow">NASA Goddard Space Flight Center</a></b> enables NASA’s mission through four scientific endeavors: Earth Science, Heliophysics, Solar System Exploration, and Astrophysics. Goddard plays a leading role in NASA’s accomplishments by contributing compelling scientific knowledge to advance the Agency’s mission. <b>Follow us on <a href="http://twitter.com/NASAGoddardPix" rel="nofollow">Twitter</a></b> <b>Like us on <a href="http://www.facebook.com/pages/Greenbelt-MD/NASA-Goddard/395013845897?ref=tsd" rel="nofollow">Facebook</a></b> <b>Find us on <a href="http://instagrid.me/nasagoddard/?vm=grid" rel="nofollow">Instagram</a></b>
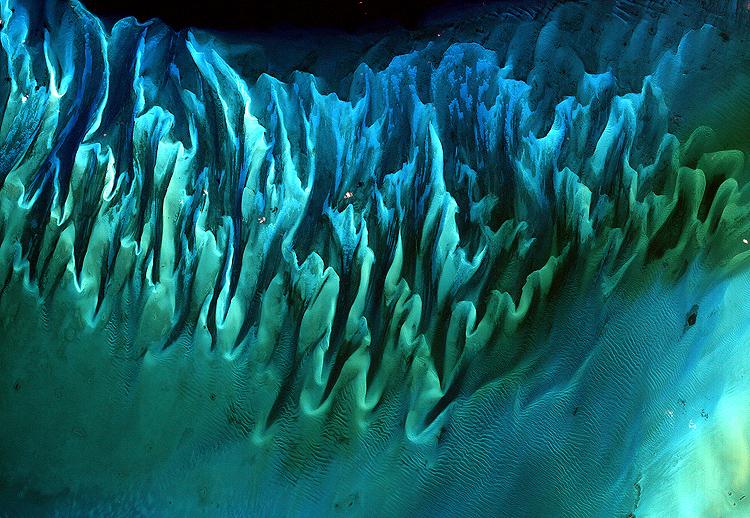
NASA image acquired January 17, 2001 Though the above image may resemble a new age painting straight out of an art gallery in Venice Beach, California, it is in fact a satellite image of the sands and seaweed in the Bahamas. The image was taken by the Enhanced Thematic Mapper plus (ETM+) instrument aboard the Landsat 7 satellite. Tides and ocean currents in the Bahamas sculpted the sand and seaweed beds into these multicolored, fluted patterns in much the same way that winds sculpted the vast sand dunes in the Sahara Desert. Image courtesy Serge Andrefouet, University of South Florida Instrument: Landsat 7 - ETM+ Credit: NASA/GSFC/Landsat <b><a href="http://www.nasa.gov/centers/goddard/home/index.html" rel="nofollow">NASA Goddard Space Flight Center</a></b> enables NASA’s mission through four scientific endeavors: Earth Science, Heliophysics, Solar System Exploration, and Astrophysics. Goddard plays a leading role in NASA’s accomplishments by contributing compelling scientific knowledge to advance the Agency’s mission. <b>Follow us on <a href="http://twitter.com/NASA_GoddardPix" rel="nofollow">Twitter</a></b> <b>Join us on <a href="http://www.facebook.com/pages/Greenbelt-MD/NASA-Goddard/395013845897?ref=tsd" rel="nofollow">Facebook</a></b>
ISS032-E-008976 (15 July 2012) --- Saharan dust reaching the Americas is featured in this image photographed by an Expedition 32 crew member on the International Space Station. Weather satellites frequently document major dust palls blowing from the Sahara Desert westward from Africa out into the tropical Atlantic Ocean. Space station crew members frequently see these Saharan dust masses as very widespread atmospheric haze. Dust palls blowing from Africa can be transported right across the Atlantic Ocean. It takes about a week to reach either North America (in northern hemisphere summer) or South America (in northern hemisphere winter). This puts the Caribbean basin on the receiving end of many of these events. Recently, researchers have linked Saharan dust to coral disease, allergic reactions in humans, and red tides. The margin of the hazy air in this image reaches as far as Haiti (top center) and the nearby Turks and Caicos Islands (top left) ? but the eastern tip of Cuba in the foreground remains in the clear air.
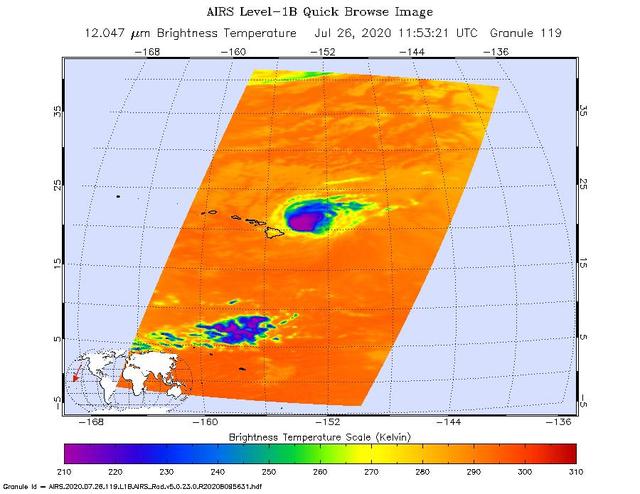
NASA's Atmospheric Infrared Sounder (AIRS) was monitoring Hurricane Douglas as it took aim at the Hawaiian Islands on July 26. Perched on NASA's Aqua satellite, AIRS is an instrument that studies Earth's weather and climate. As of 11 a.m. local time, Douglas was sweeping toward Hawaii with the potential to directly hit portions of the islands, from Maui to Kauai, in the late afternoon or evening. The purple areas in the AIRS image — taken at 1:53 a.m. local time on July 26 — indicate very cold clouds high in the atmosphere generally linked to heavy rainfall. Warmer clouds closer to Earth's surface show up as green and blue, and orange areas indicate cloud-free parts of the sky. The Category 1 hurricane was packing maximum sustained winds of 85 mph (140 kph) on the morning of July 26. Douglas' storm surge is forecast to push water levels as high as 3 feet (0.9 meters) above normal tides. The storm could dump as much as 15 inches (38 centimeters) of rain onto isolated parts of the Hawaiian Islands. https://photojournal.jpl.nasa.gov/catalog/PIA23785
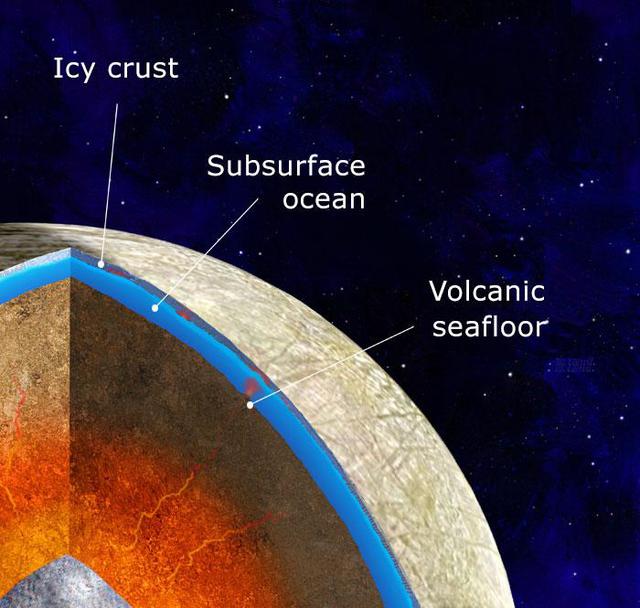
This illustration depicts scientists' findings about what the interior of Jupiter's moon Europa may look like: an iron core, surrounded by a rocky mantle believed to be in direct contact with a vast, internal ocean. New research and computer modeling show that volcanic activity may have occurred on the seafloor of Jupiter's moon Europa in the recent past – and may still be happening. The new work shows how internal heat produced by tides—warping of Europa's shape as it changes distance from Jupiter during its orbit—could partially melt its rocky layer, a process that could feed volcanoes on the ocean floor. The recent modeling of how this internal heat is produced and transferred is the most detailed and thorough examination of the effect this heating has on the moon. NASA scientists will have the opportunity to put the new predictions to the test when the agency's Europa Clipper spacecraft (aiming for a 2024 launch) reaches its target. Europa Clipper will orbit Jupiter and perform dozens of close flybys of Europa to map the moon and investigate its composition. The mission's goal is to explore whether the moon's global ocean has conditions suitable for life. https://photojournal.jpl.nasa.gov/catalog/PIA24477
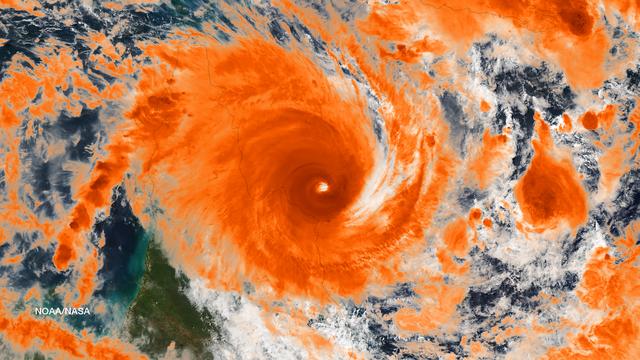
Residents of the northeast coast of Queensland, Australia are facing high winds, dangerous tides and very heavy rain between Cape Melville and Cooktown. These hazards will migrate southward for the next few days as the center of the storm remains close to the coast. This image was taken by the Suomi NPP satellite's VIIRS instrument around 0335Z on April11, 2014. Credit: NASA/NOAA via <b><a href="www.nnvl.noaa.gov/" rel="nofollow"> NOAA Environmental Visualization Laboratory</a></b> <b><a href="http://www.nasa.gov/audience/formedia/features/MP_Photo_Guidelines.html" rel="nofollow">NASA image use policy.</a></b> <b><a href="http://www.nasa.gov/centers/goddard/home/index.html" rel="nofollow">NASA Goddard Space Flight Center</a></b> enables NASA’s mission through four scientific endeavors: Earth Science, Heliophysics, Solar System Exploration, and Astrophysics. Goddard plays a leading role in NASA’s accomplishments by contributing compelling scientific knowledge to advance the Agency’s mission. <b>Follow us on <a href="http://twitter.com/NASAGoddardPix" rel="nofollow">Twitter</a></b> <b>Like us on <a href="http://www.facebook.com/pages/Greenbelt-MD/NASA-Goddard/395013845897?ref=tsd" rel="nofollow">Facebook</a></b> <b>Find us on <a href="http://instagram.com/nasagoddard?vm=grid" rel="nofollow">Instagram</a></b>
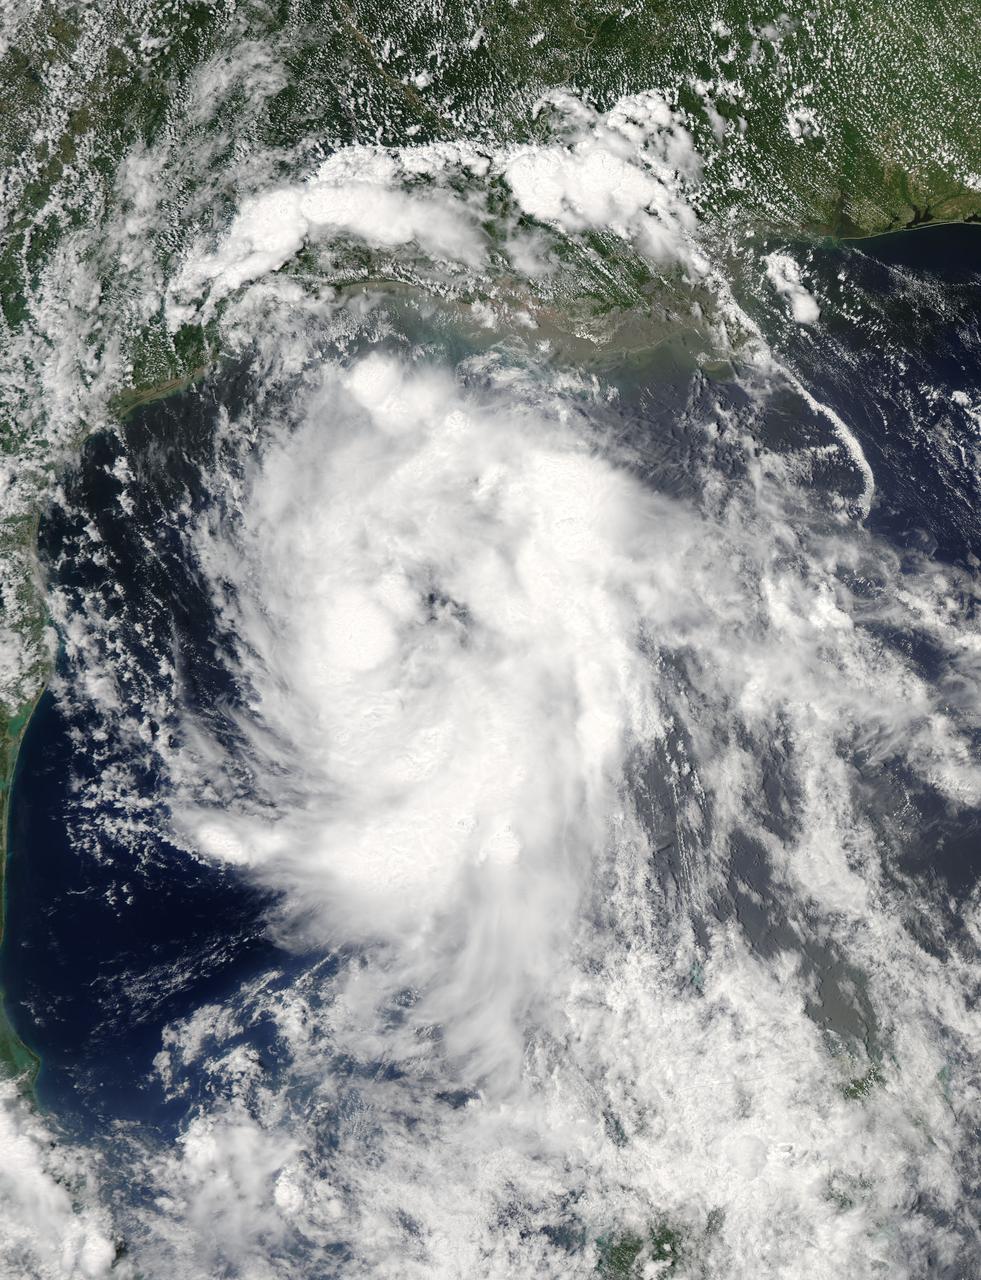
On June 15 at 19:15 UTC (3:15 p.m. EDT) the MODIS instrument aboard NASA's Aqua satellite captured a visible image of Tropical Storm Bill approaching Texas and Louisiana. Powerful thunderstorms circled the center in fragmented bands. At 11 a.m. CDT on June 16, a Tropical Storm Warning was in effect from Baffin Bay to High Island Texas as Bill was making landfall. The National Hurricane Center noted that Bill is expected to produce total rain accumulations of 4 to 8 inches over eastern Texas and eastern Oklahoma and 2 to 4 inches over western Arkansas and southern Missouri, with possible isolated maximum amounts of 12 inches in eastern Texas. In eastern Texas and far western Louisiana today and tonight, isolated tornadoes are also possible, as with any landfalling tropical storm. Tropical storm conditions are expected to continue into the evening in the warning area. Along the coasts, the combination of a storm surge and the tide will cause normally dry areas near the coast to be flooded by rising waters. The water could reach the following heights above ground if the peak surge occurs at the time of high tide. The NHC noted that the Upper Texas coast could experience 2 to 4 feet, and the western Louisiana coast between 1 to 2 feet. At 10 a.m. CDT (1500 UTC), the center of Tropical Storm Bill was located near latitude 28.2 North, longitude 96.4 West. Bill was moving toward the northwest near 10 mph (17 kph) and that general motion is expected to continue today. The latest minimum central pressure reported by an Air Force Reserve Hurricane Hunter aircraft was 997 millibars. Reports from an Air Force Reserve reconnaissance aircraft indicate that maximum sustained winds remain near 60 mph (95 kph) with higher gusts. Unlike Carlos, Bill is not a compact storm. Tropical-storm-force winds extend outward up to 150 miles (240 km) from the center. Between 9 and 10 a.m. CDT, an automated observing station at Port O'Connor also reported a sustained wind of 44 mph (70 kph) and a gust to 53 mph (85 kph). For updated forecasts, watches and warnings, visit the National Hurricane Center webpage at <a href="http://www.nhc.noaa.gov" rel="nofollow">www.nhc.noaa.gov</a>. For local forecasts and advisories, visit: <a href="http://www.weather.gov" rel="nofollow">www.weather.gov</a>. Bill is forecast to continue moving inland and is expected to be a tropical depression by Wednesday, June 17, west of Dallas. The remnants of Bill are forecast to move into the Midwest later in the week. Credit: NASA/GSFC/Jeff Schmaltz/MODIS Land Rapid Response Team <b><a href="http://www.nasa.gov/audience/formedia/features/MP_Photo_Guidelines.html" rel="nofollow">NASA image use policy.</a></b> <b><a href="http://www.nasa.gov/centers/goddard/home/index.html" rel="nofollow">NASA Goddard Space Flight Center</a></b> enables NASA’s mission through four scientific endeavors: Earth Science, Heliophysics, Solar System Exploration, and Astrophysics. Goddard plays a leading role in NASA’s accomplishments by contributing compelling scientific knowledge to advance the Agency’s mission. <b>Follow us on <a href="http://twitter.com/NASAGoddardPix" rel="nofollow">Twitter</a></b> <b>Like us on <a href="http://www.facebook.com/pages/Greenbelt-MD/NASA-Goddard/395013845897?ref=tsd" rel="nofollow">Facebook</a></b> <b>Find us on <a href="http://instagrid.me/nasagoddard/?vm=grid" rel="nofollow">Instagram</a></b>
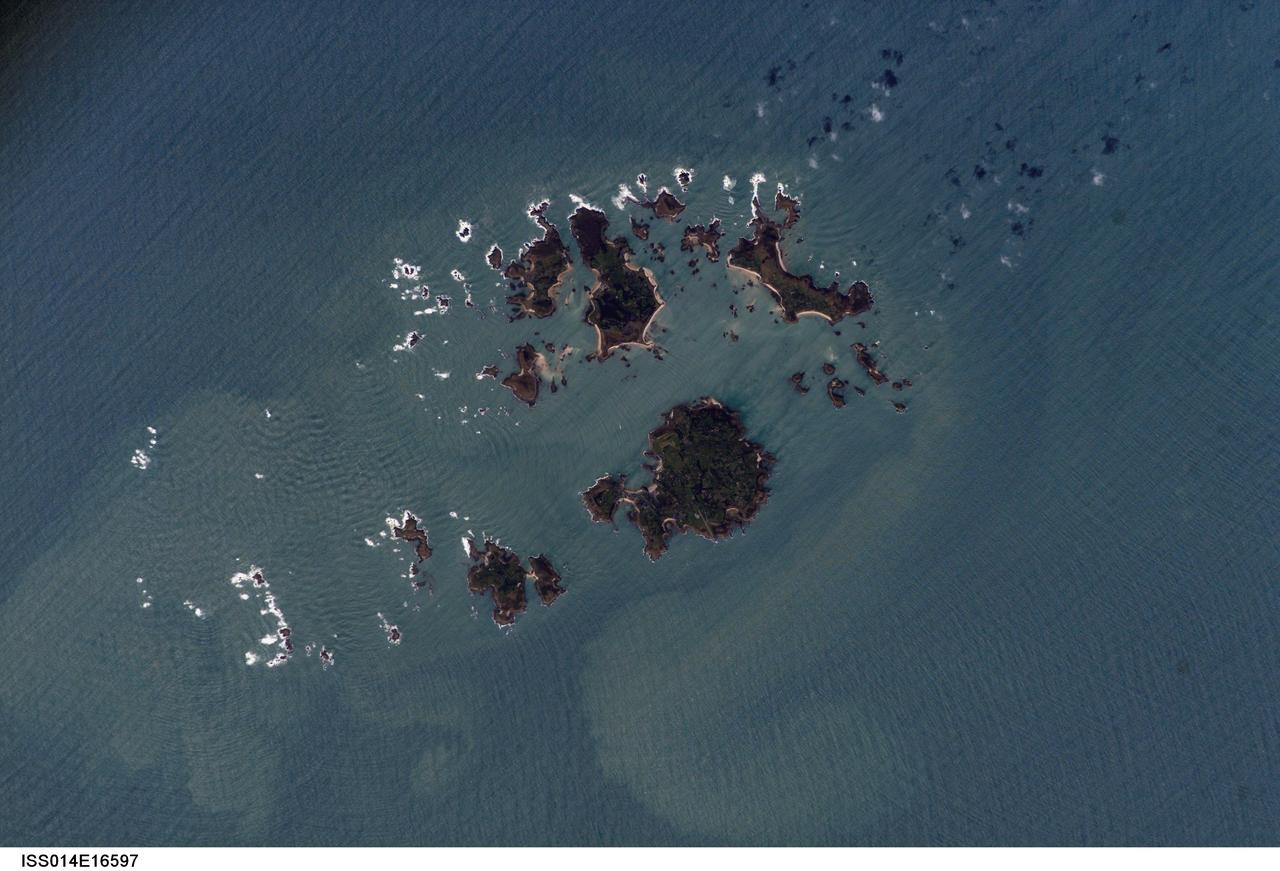
ISS014-E-16597 (10 March 2007) --- Isles of Scilly, United Kingdom is featured in this image photographed by an Expedition 14 crewmember on the International Space Station. The Isles of Scilly, an archipelago of approximately 150 islands, is located some 44 kilometers southwest of the westernmost point of England (Land's End). According to scientists, the islands are an erosional remnant of an ancient granite intrusion, and are notable because they have been inhabited for over 4000 years. Historical and geological evidence cited by NASA scientists on the Isles indicates that many of the islands were larger and/or connected in the recent past--this could be due to local subsidence, rising sea levels, or a combination of both factors. Even today, it is possible to walk between certain islands during low tides. The Isles have been designated a United Kingdom Area of Outstanding Natural Beauty due to their unique landscape, ecology, and historical significance. The potential effect of rising sea level on the Isles is a primary concern for both long-term ecosystem health and human habitability. This image illustrates the geographic configuration of the archipelago, and its effect on ocean wave patterns. Long linear swells oriented northeast-southwest and moving to the southeast (from upper left to lower right) are diffracted (bent) as they approach the coastlines and small shoals of the Isles. The wave diffraction forms complex interacting surface patterns--this is most clearly visible southwest of St. Mary's island (left). The dominant ocean wave pattern resumes to the southeast of St. Mary's, but with an additional northwest-southeast oriented pattern superimposed, possibly due to winds originating in the English channel to the east (not shown). Suspended, tan-colored sediments visible within and around the archipelago are locally derived from continuing wave erosion of the granite forming the islands and remobilization of beach sands. Bright white areas in the photograph are waves breaking on shoals.
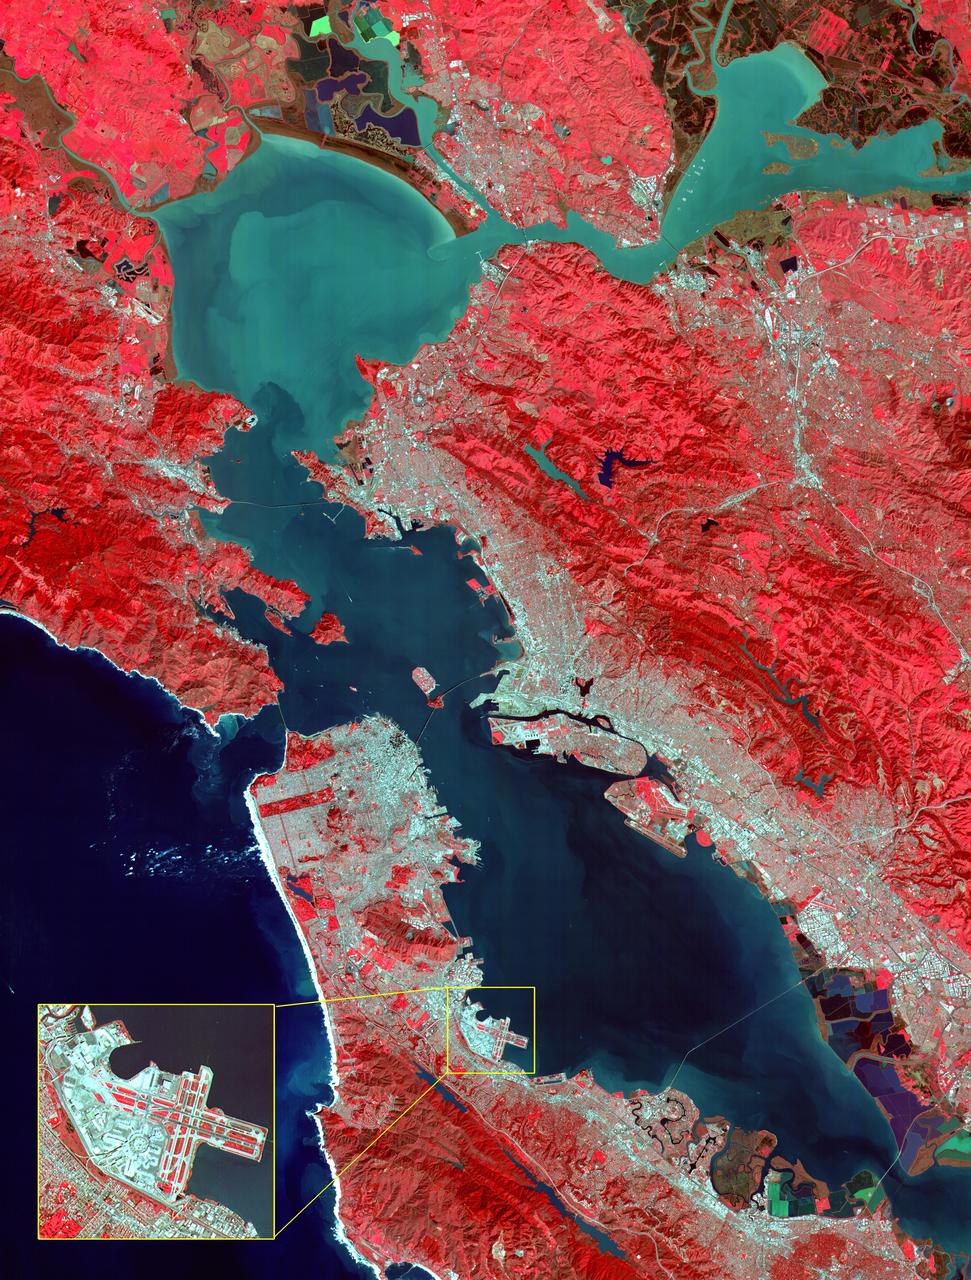
This image of the San Francisco Bay region was acquired on March 3, 2000 by the Advanced Spaceborne Thermal Emission and Reflection Radiometer (ASTER) on NASA's Terra satellite. With its 14 spectral bands from the visible to the thermal infrared wavelength region, and its high spatial resolution of 15 to 90 meters about 50 to 300 feet ), ASTER will image Earth for the next 6 years to map and monitor the changing surface of our planet. Image: This image covers an area 60 kilometers (37 miles) wide and 75 kilometers (47 miles) long in three bands of the reflected visible and infrared wavelength region. The combination of bands portrays vegetation in red, and urban areas in gray. Sediment in the Suisun Bay, San Pablo Bay, San Francisco Bay, and the Pacific Ocean shows up as lighter shades of blue. Along the west coast of the San Francisco Peninsula, strong surf can be seen as a white fringe along the shoreline. A powerful rip tide is visible extending westward from Daly City into the Pacific Ocean. In the lower right corner, the wetlands of the South San Francisco Bay National Wildlife Refuge appear as large dark blue and brown polygons. The high spatial resolution of ASTER allows fine detail to be observed in the scene. The main bridges of the area (San Mateo, San Francisco-Oakland Bay, Golden Gate, Richmond-San Rafael, Benicia-Martinez, and Carquinez) are easily picked out, connecting the different communities in the Bay area. Shadows of the towers along the Bay Bridge can be seen over the adjacent bay water. With enlargement the entire road network can be easily mapped; individual buildings are visible, including the shadows of the high-rises in downtown San Francisco. Inset: This enlargement of the San Francisco Airport highlights the high spatial resolution of ASTER. With further enlargement and careful examination, airplanes can be seen at the terminals. http://photojournal.jpl.nasa.gov/catalog/PIA02606
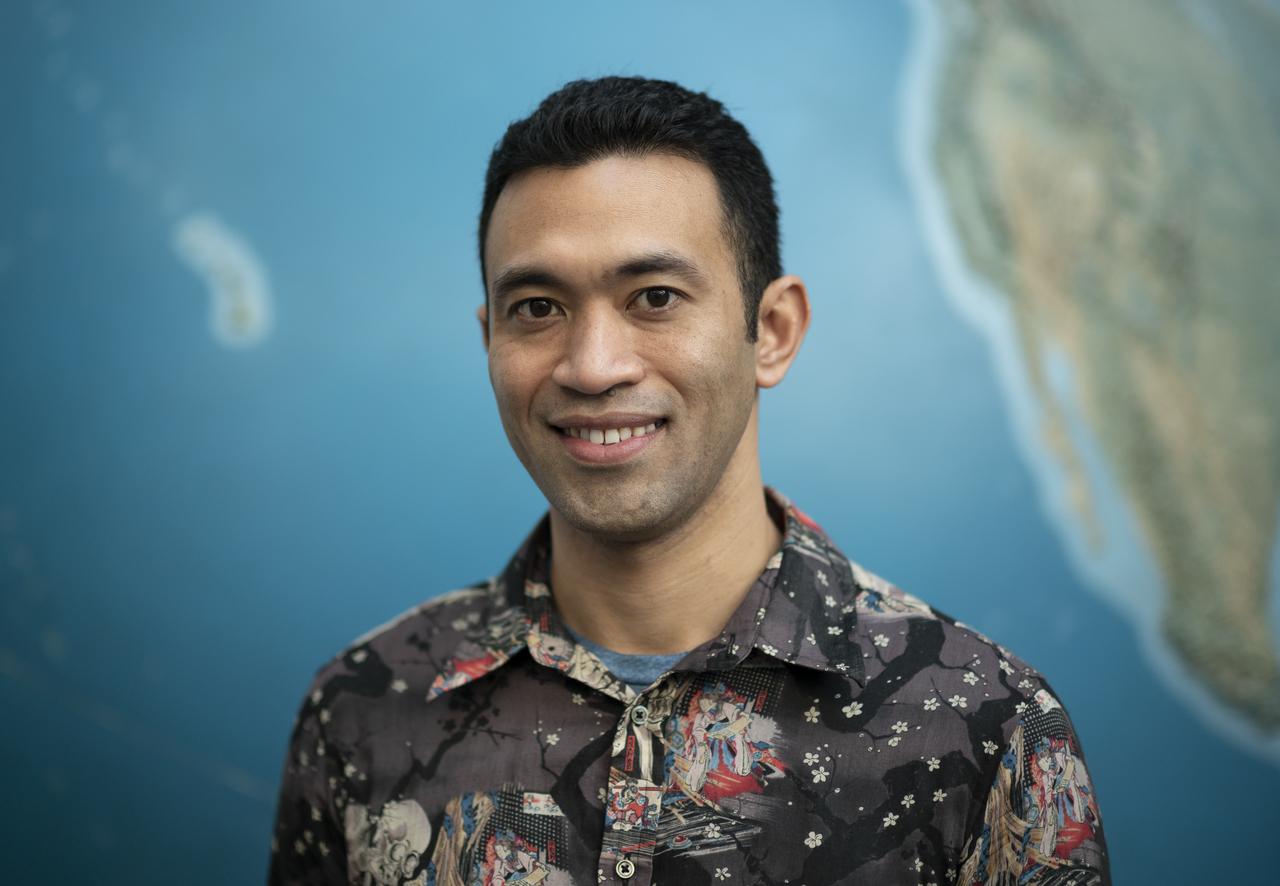
“Back home there’s a place called Mākua beach. It’s where I spent so much of my childhood. My grandfather had a little beachside camp area, and every day after school my dad and I would drive to the camp and visit my grandfather, and we’d go out fishing either on a rubber tube or a small fishing boat. There are so many memories of being with my dad and my grandfather and all of my calabash uncles there. My grandmother and my grandfather were both strongly connected to the beach. They actually both passed away on the beach, so that place has a special place in my heart. It’s a beautiful, beautiful quiet little pocket of sand and water, and every time I go back, I think of them and all of those memories. “The Hawaiians have been there for a thousand-plus years. And I have written documents that show my grandfather’s great-grandfather had an association with the area. It was a letter he wrote to a commission voicing his support for Native Hawaiian land rights in the valley. I love to go back every time I go home. Sometimes when it’s low tide, you can even find petroglyphs engraved on the rocks. There’s always something new to discover. “I know fishing is not as plentiful as it was before because of overfishing and likely other factors. Climate change is impacting a lot of coastal areas not just in Hawaii but also around the world, from erosion to coral bleaching. It’s powerful that we continue to learn how everyone and everything on Earth is interconnected. It’s what Native Hawaiians have long understood through our cosmology and approach to resource management. “That’s what makes communicating Earth science meaningful for me—knowing that indigenous Hawaiian wisdom and NASA research both point to the responsible management of and respect for the environment.” Samson Reiny, editor and senior outreach coordinator at NASA Earth Science News, Friday, Feb. 21, 2020, at NASA's Goddard Space Flight Center in Greenbelt, Md. Photo Credit: (NASA/Joel Kowsky)
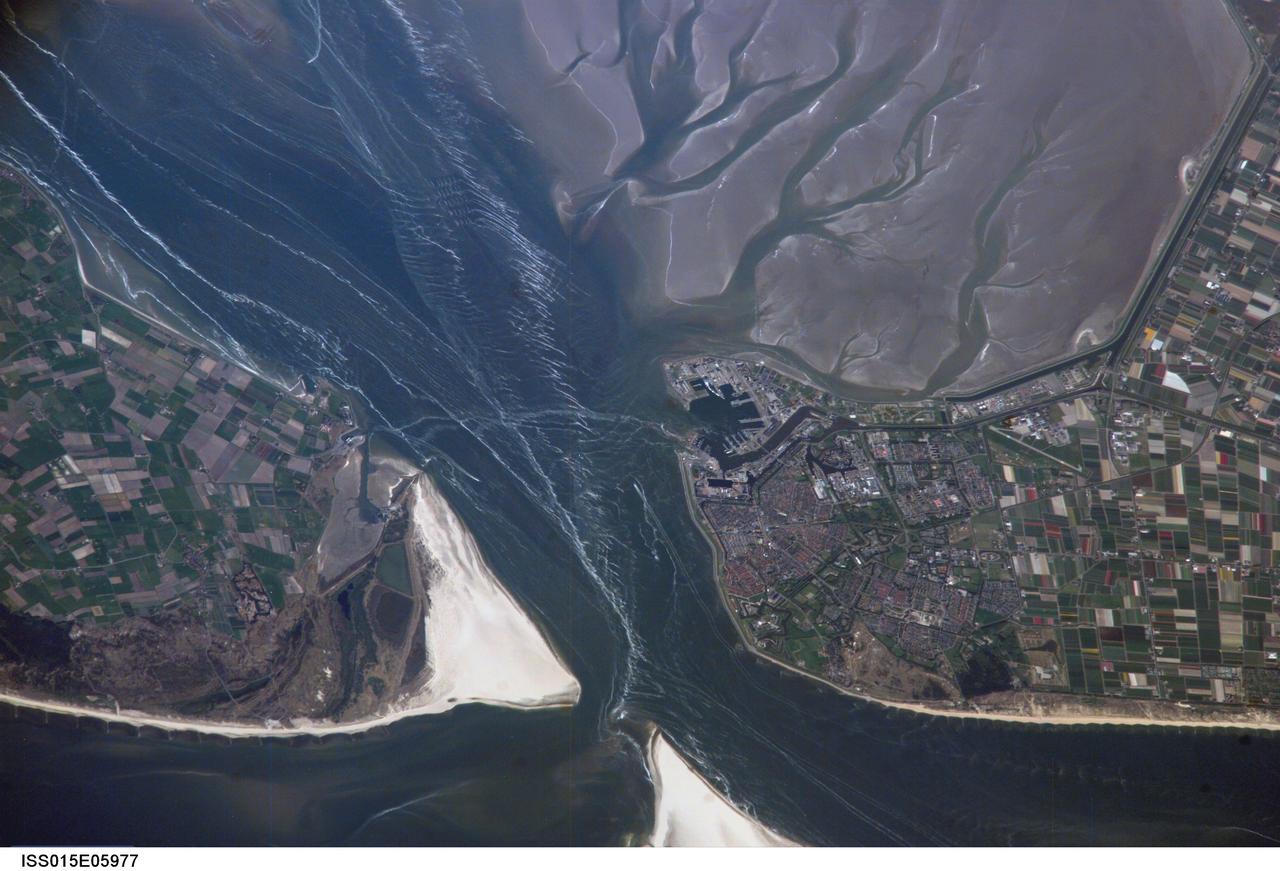
ISS015-E-05977 (1 May 2007) --- Den Helder, Netherlands is featured in this image photographed by an Expedition 15 crewmember on the International Space Station. The city and harbor of Den Helder in the northern Netherlands has been the home port of the Dutch Royal Navy for over 175 years. Its favorable location provides access to the North Sea, and has made it an important commercial shipping port in addition to its strategic role. Bright red agricultural fields to the south of Den Helder indicate another noteworthy aspect of the region--commercial farming of tulips and hyacinth. This image is an oblique view--the camera is oriented at an angle relative to "straight down"--of the Den Helder region taken from the space station, which was located to the southeast, near Dulmen, Germany (approximately 225 kilometers away in terms of ground distance) when the image was acquired. In addition to the manmade structures of the Den Helder urban area (reddish gray to gray street grids) and dockyards to the east of the city, several striking geomorphic features are visible. The extensive gray mudflats, with their prominent branching pattern (top right), indicate that this image was acquired at low tide, and suggest the general low elevation of the region. Parallel wave patterns along the mudflats and in the Marsdiep strait are formed as water interacts with the sea bottom between Den Helder and Texel Island during tidal flow. Some ship wakes are also visible. According to scientists, the bright white-gray triangular region at the southern tip of Texel Island (bottom center) is a dune field, consisting mainly of eolian (windborne) sands deposited during the last Ice Age. Subsequent sea level rise and shoreline processes have mobilized and re-deposited these sands into their current configuration -- including a new dune field island to the southwest of Texel (bottom center).

Some 290 million years ago, a star much like the sun wandered too close to the central black hole of its galaxy. Intense tides tore the star apart, which produced an eruption of optical, ultraviolet and X-ray light that first reached Earth in 2014. Now, a team of scientists using observations from NASA's Swift satellite have mapped out how and where these different wavelengths were produced in the event, named ASASSN-14li, as the shattered star's debris circled the black hole. "We discovered brightness changes in X-rays that occurred about a month after similar changes were observed in visible and UV light," said Dheeraj Pasham, an astrophysicist at the Massachusetts Institute of Technology (MIT) in Cambridge, Massachusetts, and the lead researcher of the study. "We think this means the optical and UV emission arose far from the black hole, where elliptical streams of orbiting matter crashed into each other." Read more: <a href="https://go.nasa.gov/2nLmSoa" rel="nofollow">go.nasa.gov/2nLmSoa</a> <b><a href="http://www.nasa.gov/audience/formedia/features/MP_Photo_Guidelines.html" rel="nofollow">NASA image use policy.</a></b> <b><a href="http://www.nasa.gov/centers/goddard/home/index.html" rel="nofollow">NASA Goddard Space Flight Center</a></b> enables NASA’s mission through four scientific endeavors: Earth Science, Heliophysics, Solar System Exploration, and Astrophysics. Goddard plays a leading role in NASA’s accomplishments by contributing compelling scientific knowledge to advance the Agency’s mission. <b>Follow us on <a href="http://twitter.com/NASAGoddardPix" rel="nofollow">Twitter</a></b> <b>Like us on <a href="http://www.facebook.com/pages/Greenbelt-MD/NASA-Goddard/395013845897?ref=tsd" rel="nofollow">Facebook</a></b> <b>Find us on <a href="http://instagrid.me/nasagoddard/?vm=grid" rel="nofollow">Instagram</a></b>
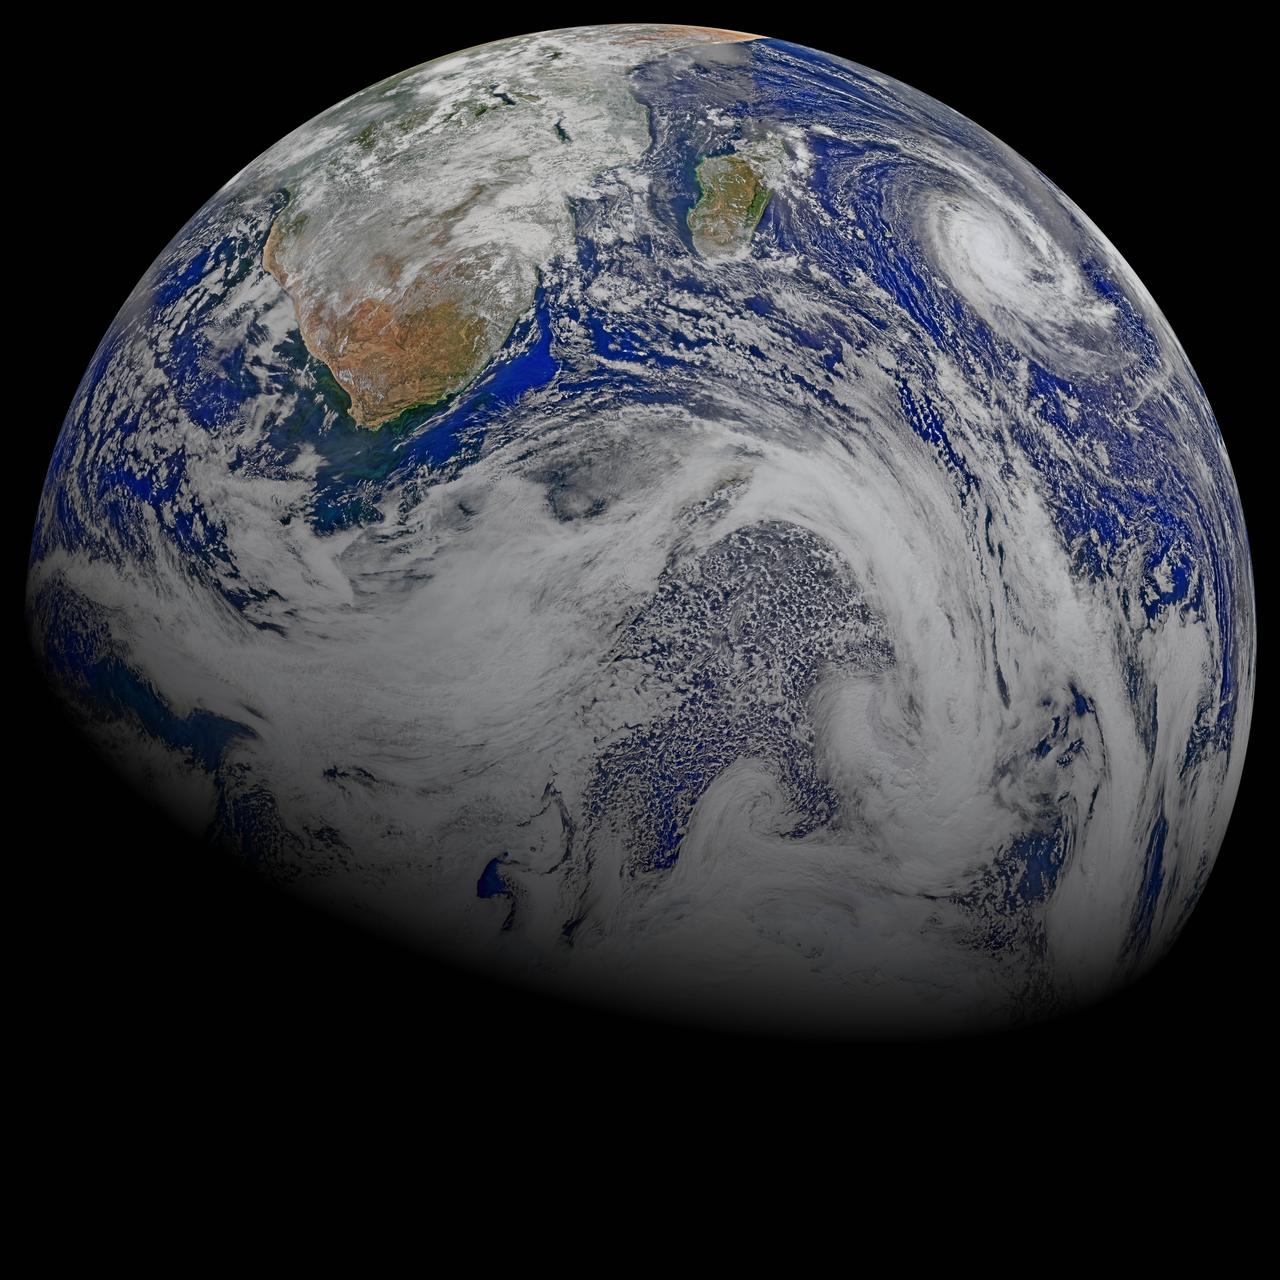
This composite image of southern Africa and the surrounding oceans was captured by six orbits of the NASA/NOAA Suomi National Polar-orbiting Partnership spacecraft on April 9, 2015, by the Visible Infrared Imaging Radiometer Suite (VIIRS) instrument. Tropical Cyclone Joalane can be seen over the Indian Ocean. Winds, tides and density differences constantly stir the oceans while phytoplankton continually grow and die. Orbiting radiometers such as VIIRS allows scientists to track this variability over time and contribute to better understanding of ocean processes that are beneficial to human survival on Earth. The image was created by the Ocean Biology Processing Group at NASA's Goddard Space Flight Center in Greenbelt, Maryland. For more information, please visit: <a href="http://oceancolor.gsfc.nasa.gov/" rel="nofollow">oceancolor.gsfc.nasa.gov/</a> and <a href="http://www.nasa.gov/npp" rel="nofollow">www.nasa.gov/npp</a> Image Credit: Ocean Biology Processing Group at NASA's Goddard Space Flight Center <b><a href="http://www.nasa.gov/audience/formedia/features/MP_Photo_Guidelines.html" rel="nofollow">NASA image use policy.</a></b> <b><a href="http://www.nasa.gov/centers/goddard/home/index.html" rel="nofollow">NASA Goddard Space Flight Center</a></b> enables NASA’s mission through four scientific endeavors: Earth Science, Heliophysics, Solar System Exploration, and Astrophysics. Goddard plays a leading role in NASA’s accomplishments by contributing compelling scientific knowledge to advance the Agency’s mission. <b>Follow us on <a href="http://twitter.com/NASAGoddardPix" rel="nofollow">Twitter</a></b> <b>Like us on <a href="http://www.facebook.com/pages/Greenbelt-MD/NASA-Goddard/395013845897?ref=tsd" rel="nofollow">Facebook</a></b> <b>Find us on <a href="http://instagrid.me/nasagoddard/?vm=grid" rel="nofollow">Instagram</a></b>
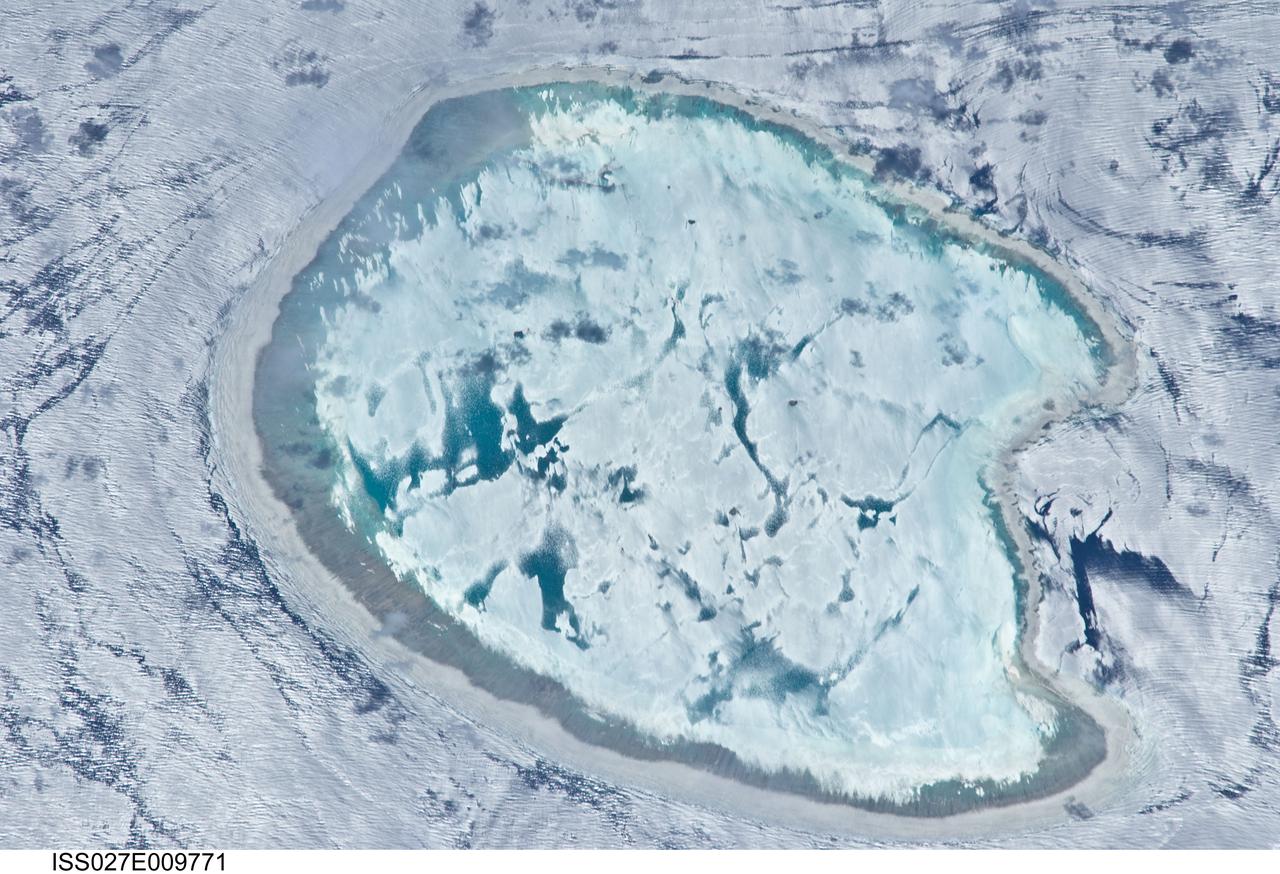
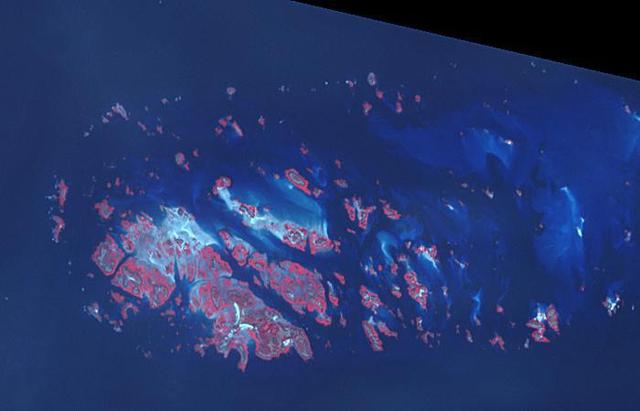
ISS027-E-009771 (2 April 2011) --- Bassas da India is featured in this image photographed by an Expedition 27 crew member on the International Space Station. The vantage point of crew members onboard the space station provides many dramatic views of Earth?s surface. This detailed photograph of the Bassas da India, an uninhabited atoll in the Indian Ocean (between the Mozambique coast of Africa and the island of Madagascar) has an almost surreal quality due to varying degrees of sunglint. Sunglint is an optical phenomena caused by light reflecting off of a water surface directly back towards the observer. Variations in the roughness of the water surface?presence or absence of waves due to wind and water currents?will cause differences in the intensity of the sunglint. The presence of other materials, such as oils or surfactants, can also change the properties of the water surface. Here the presence of currents is highlighted as darker patches or streaks (left and upper right). In contrast, shallow water in the lagoon (center) presents a more uniform, mirror-like appearance in sunglint suggesting that there are no subsurface currents present. Wave crests visible around the atoll are likely the result of both surface winds and subsurface currents. The Bassas da India atoll is part of the French Southern and Antarctic Lands. It is uninhabited due to its complete submergence during high tide ? there is no vegetation established on the atoll for the same reason. The atoll is approximately 10 kilometers in diameter, and covers an area (including the lagoon) of approximately 80 square kilometers.
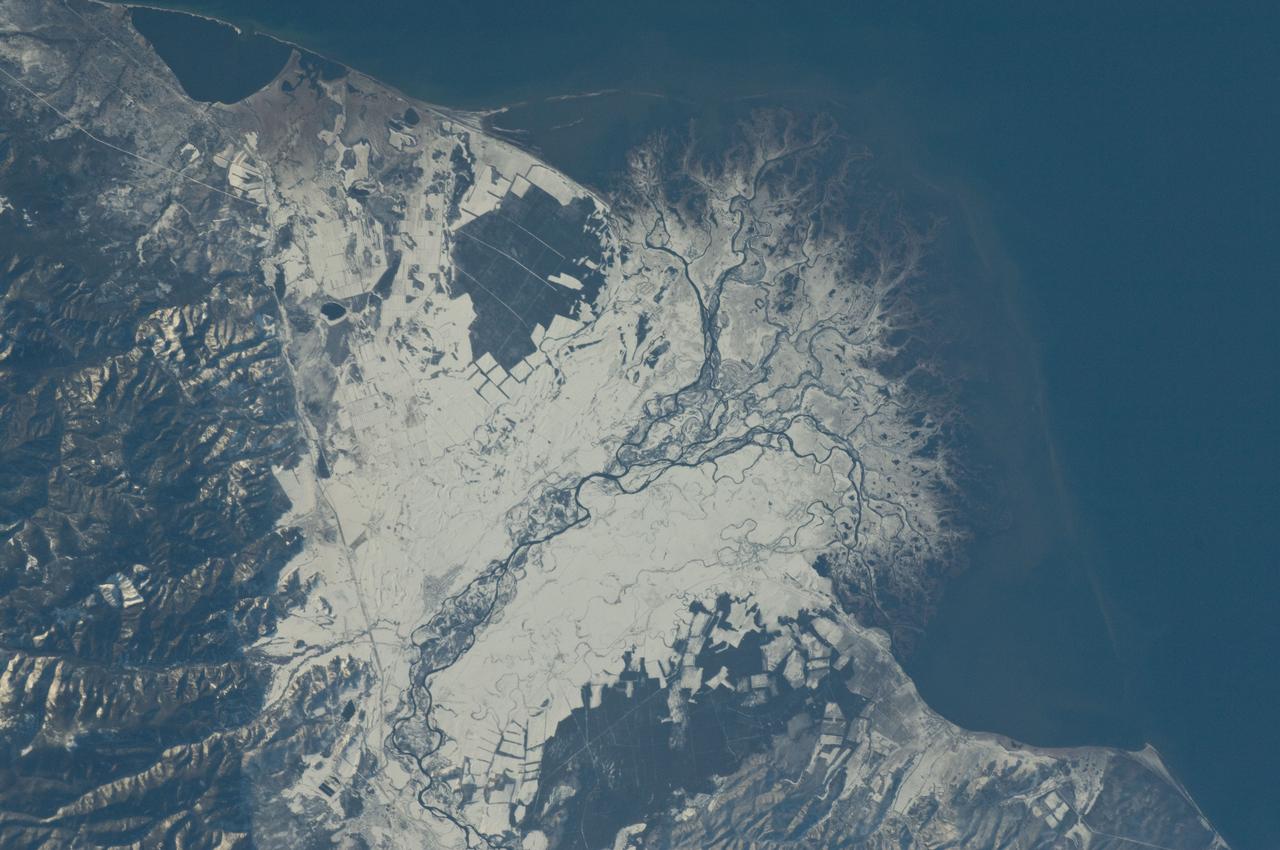
ISS029-E-037915 (3 Nov. 2011) --- Snowfall on the Selenga River Delta, Russian Federation is featured in this image photographed by an Expedition 29 crew member on the International Space Station. This photograph illustrates the Selenga River Delta built out into Lake Baikal in Russia. The Selenga River delta (center) is lobate in form, with an intricate network of distributary channels and levees surrounded by marshlands building out into Lake Baikal. This suggests that development of the delta is governed by the sediment load carried by the river, and any modifications of form due to lake tides or waves are relatively minor. Further out, dark brown depositional bars are visible forming a rough arc marking the edge of the delta. Snow cover on the river floodplain highlights numerous secondary channels, as well as channels previously occupied by the river but now abandoned. The regular outlines of agricultural fields to the southwest and northeast of the river are also highlighted by the snow cover. Lake Baikal is a World Heritage Site. The Selenga River is the major contributor of water to Lake Baikal; it occupies approximately 82 per cent of the watershed area for the lake. The wetlands of the Selenga River delta are designated as a RAMSAR site and provide valuable habitat for more than 170 species of birds, including many that are migrating. Like Baikal, the Selenga Delta is home to unique ecosystems, including more than 70 rare or endangered species of plants and animals. Waters of the Selenga River serve many (and differing) uses in both Mongolia and Russia, including support of agriculture, provision of drinking water, light industry, mining, recreation, and tourism. These uses also contribute to degradation of the river water quality, downstream availability of water, and ecological impacts. For example, a pulp and paper plant in the city of Selenginsk (lower left) has been tied to high levels of pollution in the river. International efforts to integrate management of the Selenga River basin for both ecological and economic sustainability are ongoing.
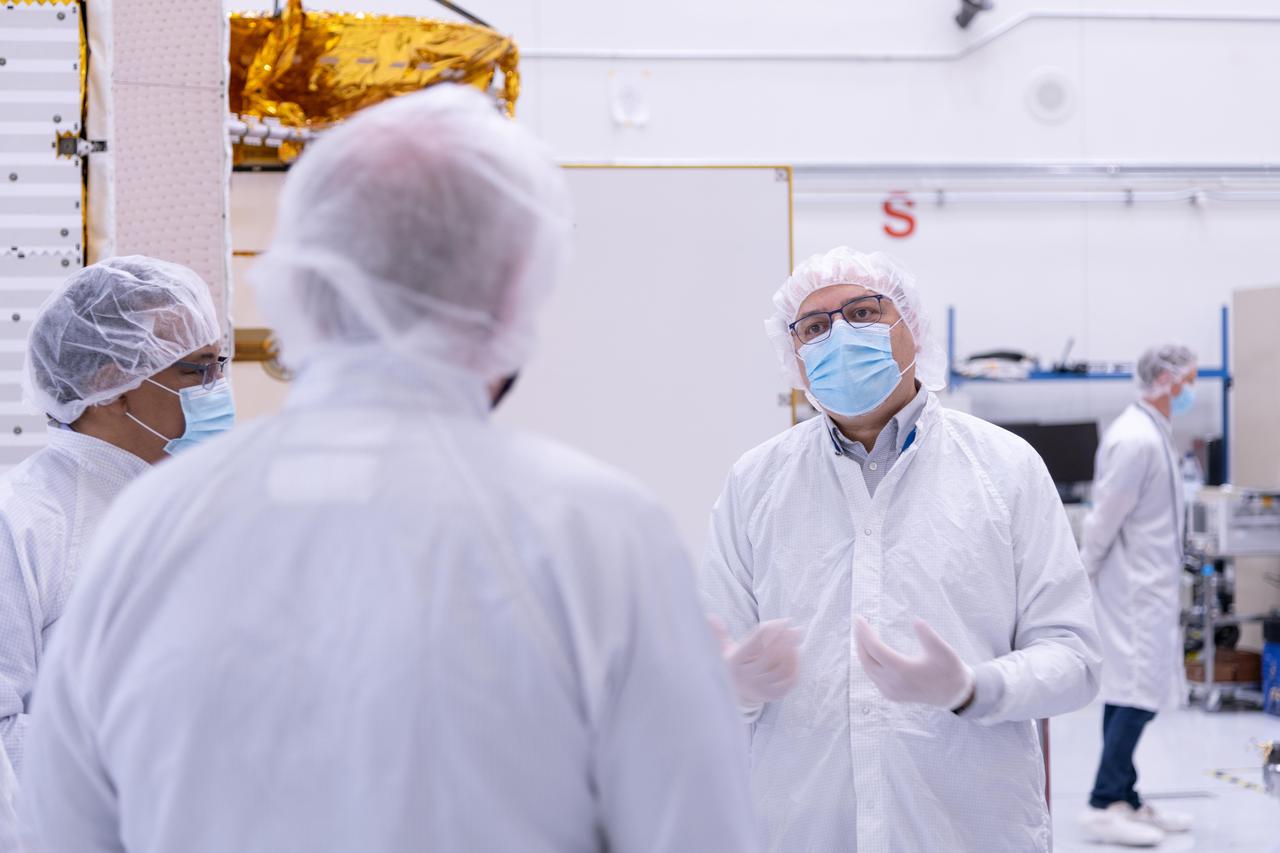
The new international satellite mission called Surface Water and Ocean Topography (SWOT) — slated for launch in late 2022 — will measure the height of Earth's surface water. The data the spacecraft will collect will help researchers understand and track the volume and location of water around the world. The satellite will assist with monitoring changes in floodplains and wetlands, measuring how much fresh water flows into and out of lakes and rivers and back to the ocean, and tracking regional shifts in sea level at scales never seen before. The satellite will also provide information on small-scale ocean currents that will support real-time marine operations affected by tides, currents, storm surge, sediment transport, and water quality issues. The payload is taking shape in a clean room at NASA's Jet Propulsion Laboratory in Southern California before being shipped to France. There, technicians and engineers from the French space agency Centre National d'Etudes Spatial (CNES), their prime contractor Thales Alenia Space, and JPL will complete the build and prepare the satellite for shipment to its California launch site at Vandenberg Air Force Base. JPL project manager Parag Vaze (pronounced vah-zay) is central to ensuring the handoff to his CNES counterpart Thierry Lafon goes smoothly. SWOT is being jointly developed by NASA and CNES, with contributions from the Canadian Space Agency (CSA) and United Kingdom Space Agency (UKSA). JPL, which is managed for NASA by Caltech in Pasadena, California, leads the U.S. component of the project. For the flight system, NASA is providing the Ka-band Radar Interferometer (KaRIn) instrument, a GPS science receiver, a laser retroreflector, and a two-beam microwave radiometer. CNES is providing the Doppler Orbitography and Radioposition Integrated by Satellite (DORIS) system, nadir altimeter, and the KaRIn RF subsystem (with support from the UKSA). CSA is providing the KaRIn high-power transmitter assembly. NASA is providing associated launch services. https://photojournal.jpl.nasa.gov/catalog/PIA24531
ISS034-E-032377 (18 Jan. 2013) --- Internal waves off Northern Trinidad are featured in this image photographed by an Expedition 34 crew member on the International Space Station. This photograph shows the north coast of the island of Trinidad in the southeastern Caribbean Sea, where heating of the land is setting off the growth of cumulus clouds. The light blue northwest-southeast trending plume at center is sediment from one of the rivers that flows into the sea here. Adjacent to, and appearing to cross the sediment plume, a series of subtle interacting arcs can be seen in the sea. These are known as internal waves which are the surface manifestation of slow waves moving tens of meters beneath the sea surface. These produce enough of an effect on the sea surface to be seen from space, but only where they are enhanced due to reflection of sunlight, or sunglint, back towards the space station. The image shows at least three sets of internal waves interacting. The most prominent set (top left) shows a “packet” of several waves moving from the northwest due to the tidal flow towards the north coast of Trinidad. Two less prominent, younger sets can be seen further out to sea. A very broad set enters the view from the north and northeast, and interacts at top center with the first set. All the internal waves are probably caused by the shelf break near Tobago (outside the image to top right). The shelf break is the step between shallow seas (around continents and islands) and the deep ocean. It is the line at which tides usually start to generate internal waves. The sediment plume at center is embedded in the Equatorial Current (also known as the Guyana Current) and is transporting material to the northwest—in almost the opposite direction to the movement of the internal waves. The current flows strongly from east to west around Trinidad, all the way from equatorial Africa, driven by year-round easterly winds. Seafarers in the vicinity of Trinidad are warned that the current, and its local reverse eddies, make navigation of smaller craft in these waters complicated and sometimes dangerous.

This supercomputer simulation shows one of the most violent events in the universe: a pair of neutron stars colliding, merging and forming a black hole. A neutron star is the compressed core left behind when a star born with between eight and 30 times the sun's mass explodes as a supernova. Neutron stars pack about 1.5 times the mass of the sun — equivalent to about half a million Earths — into a ball just 12 miles (20 km) across. As the simulation begins, we view an unequally matched pair of neutron stars weighing 1.4 and 1.7 solar masses. They are separated by only about 11 miles, slightly less distance than their own diameters. Redder colors show regions of progressively lower density. As the stars spiral toward each other, intense tides begin to deform them, possibly cracking their crusts. Neutron stars possess incredible density, but their surfaces are comparatively thin, with densities about a million times greater than gold. Their interiors crush matter to a much greater degree densities rise by 100 million times in their centers. To begin to imagine such mind-boggling densities, consider that a cubic centimeter of neutron star matter outweighs Mount Everest. By 7 milliseconds, tidal forces overwhelm and shatter the lesser star. Its superdense contents erupt into the system and curl a spiral arm of incredibly hot material. At 13 milliseconds, the more massive star has accumulated too much mass to support it against gravity and collapses, and a new black hole is born. The black hole's event horizon — its point of no return — is shown by the gray sphere. While most of the matter from both neutron stars will fall into the black hole, some of the less dense, faster moving matter manages to orbit around it, quickly forming a large and rapidly rotating torus. This torus extends for about 124 miles (200 km) and contains the equivalent of 1/5th the mass of our sun. Scientists think neutron star mergers like this produce short gamma-ray bursts (GRBs). Short GRBs last less than two seconds yet unleash as much energy as all the stars in our galaxy produce over one year. The rapidly fading afterglow of these explosions presents a challenge to astronomers. A key element in understanding GRBs is getting instruments on large ground-based telescopes to capture afterglows as soon as possible after the burst. The rapid notification and accurate positions provided by NASA's Swift mission creates a vibrant synergy with ground-based observatories that has led to dramatically improved understanding of GRBs, especially for short bursts. This video is public domain and can be downloaded at: : <a href="http://svs.gsfc.nasa.gov/goto?11530" rel="nofollow">svs.gsfc.nasa.gov/goto?11530</a>

Tidal disruption event Every galaxy has a black hole at its center. Usually they are quiet, without gas accretions, like the one in our Milky Way. But if a star creeps too close to the black hole, the gravitational tides can rip away the star’s gaseous matter. Like water spinning around a drain, the gas swirls into a disk around the black hole at such speeds that it heats to millions of degrees. As an inner ring of gas spins into the black hole, gas particles shoot outward from the black hole’s polar regions. Like bullets shot from a rifle, they zoom through the jets at velocities close to the speed of light. Astronomers using NASA’s Hubble Space Telescope observed correlations between supermassive black holes and an event similar to tidal disruption, pictured above in the Centaurus A galaxy. Certain galaxies have shining centers, illuminated by heated gas circling around a supermassive black hole. Matter escapes where it can, forming two jets of plasma moving near the speed of light. To learn more about the relationship between galaxies and the black holes at their cores, go to NASA’s Hubble Space Telescope: <a href="http://www.nasa.gov/mission_pages/hubble/main/" rel="nofollow">www.nasa.gov/mission_pages/hubble/main/</a> -------------------------------- Original caption: A team of astronomers using the Hubble Space Telescope found an unambiguous link between the presence of supermassive black holes that power high-speed, radio-signal-emitting jets and the merger history of their host galaxies. Almost all galaxies with the jets were found to be merging with another galaxy, or to have done so recently. Credit: NASA/ESA/STScI <b><a href="http://www.nasa.gov/audience/formedia/features/MP_Photo_Guidelines.html" rel="nofollow">NASA image use policy.</a></b> <b><a href="http://www.nasa.gov/centers/goddard/home/index.html" rel="nofollow">NASA Goddard Space Flight Center</a></b> enables NASA’s mission through four scientific endeavors: Earth Science, Heliophysics, Solar System Exploration, and Astrophysics. Goddard plays a leading role in NASA’s accomplishments by contributing compelling scientific knowledge to advance the Agency’s mission. <b>Follow us on <a href="http://twitter.com/NASAGoddardPix" rel="nofollow">Twitter</a></b> <b>Like us on <a href="http://www.facebook.com/pages/Greenbelt-MD/NASA-Goddard/395013845897?ref=tsd" rel="nofollow">Facebook</a></b> <b>Find us on <a href="http://instagrid.me/nasagoddard/?vm=grid" rel="nofollow">Instagram</a></b>
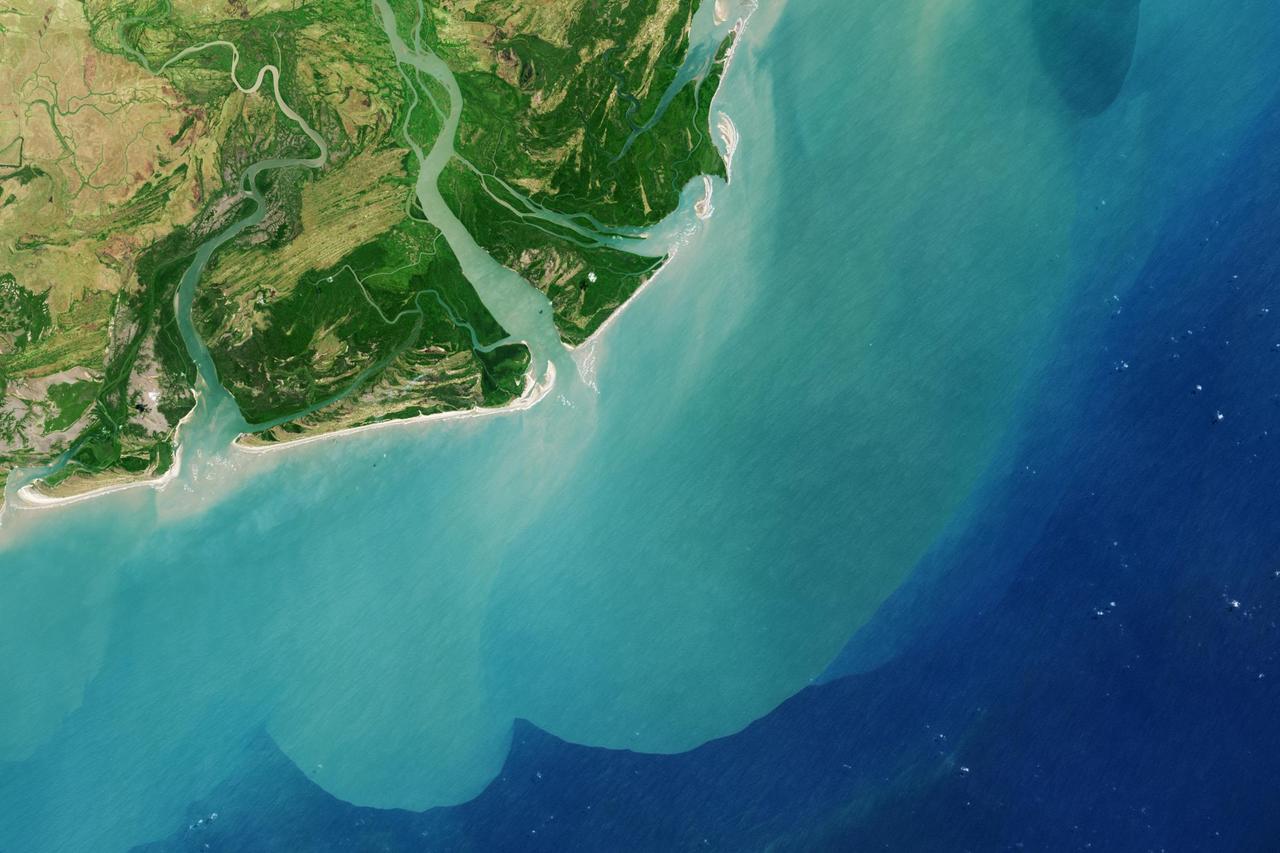
It drains a watershed that spans eight countries and nearly 1.6 million square kilometers 600,000 square miles. The Zambezi also Zambeze is the fourth largest river in Africa, and the largest east-flowing waterway. The Operational Land Imager on the Landsat 8 satellite acquired this natural-color image of the Zambezi Delta on August 29, 2013. Sandbars and barrier spits stretch across the mouths of the delta, and suspended sediment extends tens of kilometers out into the sea. The sandy outflow turns the coastal waters to a milky blue-green compared to the deep blue of open water in the Indian Ocean. The Zambezi Delta includes 230 kilometers of coastline fronting 18,000 square kilometers (7,00 square miles) of swamps, floodplains, and even savannahs (inland). The area has long been prized by subsistence fishermen and farmers, who find fertile ground for crops like sugar and fertile waters for prawns and fish. Two species of endangered cranes and one of the largest concentration of buffalo in Africa -- among many other species of wildlife -- have found a haven in this internationally recognized wetland. However, the past six decades have brought great changes to the Zambezi Delta, which used to pour more water and sediment off of the continent. Hydropower dams upstream-most prominently, the Kariba and the Cahora Bassa-greatly reduce river flows during the wet season; they also trap sediments that would otherwise flow downstream. The result has been less water reaching the delta and the floodplains, which rely on pulses of nutrients and sediments from annual (and mostly benign) natural flooding. The change in the flow of the river affects freshwater availability and quality in the delta. Strong flows push fresh water further out into the sea and naturally keep most of a delta full of fresh (or mostly fresh) water. When that fresh flow eases, the wetlands become drier and more prone to fire. Salt water from the Indian Ocean also can penetrate further into the marsh, upsetting the ecological balance for aquatic plant and animal species. Researchers have found that the freshwater table in the delta has dropped as much as five meters in the 50 years since dams were placed on the river. Less river flow also affects the shape and extent of the delta. Today there is less sediment replenishing the marshes and beaches as they are scoured by ocean waves and tides. "What strikes me in this image is the suspended sediment offshore," said Liviu Giosan, a delta geologist at the Woods Hole Oceanographic Institution. "Sediment appears to be transferred from the delta offshore in plumes that not only originate in active river mouths but also from deactivated former mouths, now tidal channels. This shows the power of tidal scouring contributing to the slow but relentless erosion of the delta." http://photojournal.jpl.nasa.gov/catalog/PIA18155

Simulation frames from this NASA Goddard neutron star merger animation: <a href="http://bit.ly/1jolBYY" rel="nofollow">bit.ly/1jolBYY</a> Credit: NASA's Goddard Space Flight Center This supercomputer simulation shows one of the most violent events in the universe: a pair of neutron stars colliding, merging and forming a black hole. A neutron star is the compressed core left behind when a star born with between eight and 30 times the sun's mass explodes as a supernova. Neutron stars pack about 1.5 times the mass of the sun — equivalent to about half a million Earths — into a ball just 12 miles (20 km) across. As the simulation begins, we view an unequally matched pair of neutron stars weighing 1.4 and 1.7 solar masses. They are separated by only about 11 miles, slightly less distance than their own diameters. Redder colors show regions of progressively lower density. As the stars spiral toward each other, intense tides begin to deform them, possibly cracking their crusts. Neutron stars possess incredible density, but their surfaces are comparatively thin, with densities about a million times greater than gold. Their interiors crush matter to a much greater degree densities rise by 100 million times in their centers. To begin to imagine such mind-boggling densities, consider that a cubic centimeter of neutron star matter outweighs Mount Everest. By 7 milliseconds, tidal forces overwhelm and shatter the lesser star. Its superdense contents erupt into the system and curl a spiral arm of incredibly hot material. At 13 milliseconds, the more massive star has accumulated too much mass to support it against gravity and collapses, and a new black hole is born. The black hole's event horizon — its point of no return — is shown by the gray sphere. While most of the matter from both neutron stars will fall into the black hole, some of the less dense, faster moving matter manages to orbit around it, quickly forming a large and rapidly rotating torus. This torus extends for about 124 miles (200 km) and contains the equivalent of 1/5th the mass of our sun. Scientists think neutron star mergers like this produce short gamma-ray bursts (GRBs). Short GRBs last less than two seconds yet unleash as much energy as all the stars in our galaxy produce over one year. The rapidly fading afterglow of these explosions presents a challenge to astronomers. A key element in understanding GRBs is getting instruments on large ground-based telescopes to capture afterglows as soon as possible after the burst. The rapid notification and accurate positions provided by NASA's Swift mission creates a vibrant synergy with ground-based observatories that has led to dramatically improved understanding of GRBs, especially for short bursts. This video is public domain and can be downloaded at: <a href="http://svs.gsfc.nasa.gov/vis/a010000/a011500/a011530/index.html" rel="nofollow">svs.gsfc.nasa.gov/vis/a010000/a011500/a011530/index.html</a> <b><a href="http://www.nasa.gov/audience/formedia/features/MP_Photo_Guidelines.html" rel="nofollow">NASA image use policy.</a></b> <b><a href="http://www.nasa.gov/centers/goddard/home/index.html" rel="nofollow">NASA Goddard Space Flight Center</a></b> enables NASA’s mission through four scientific endeavors: Earth Science, Heliophysics, Solar System Exploration, and Astrophysics. Goddard plays a leading role in NASA’s accomplishments by contributing compelling scientific knowledge to advance the Agency’s mission. <b>Follow us on <a href="http://twitter.com/NASAGoddardPix" rel="nofollow">Twitter</a></b> <b>Like us on <a href="http://www.facebook.com/pages/Greenbelt-MD/NASA-Goddard/395013845897?ref=tsd" rel="nofollow">Facebook</a></b> <b>Find us on <a href="http://instagram.com/nasagoddard?vm=grid" rel="nofollow">Instagram</a></b>

Simulation frames from this NASA Goddard neutron star merger animation: <a href="http://bit.ly/1jolBYY" rel="nofollow">bit.ly/1jolBYY</a> Credit: NASA's Goddard Space Flight Center This supercomputer simulation shows one of the most violent events in the universe: a pair of neutron stars colliding, merging and forming a black hole. A neutron star is the compressed core left behind when a star born with between eight and 30 times the sun's mass explodes as a supernova. Neutron stars pack about 1.5 times the mass of the sun — equivalent to about half a million Earths — into a ball just 12 miles (20 km) across. As the simulation begins, we view an unequally matched pair of neutron stars weighing 1.4 and 1.7 solar masses. They are separated by only about 11 miles, slightly less distance than their own diameters. Redder colors show regions of progressively lower density. As the stars spiral toward each other, intense tides begin to deform them, possibly cracking their crusts. Neutron stars possess incredible density, but their surfaces are comparatively thin, with densities about a million times greater than gold. Their interiors crush matter to a much greater degree densities rise by 100 million times in their centers. To begin to imagine such mind-boggling densities, consider that a cubic centimeter of neutron star matter outweighs Mount Everest. By 7 milliseconds, tidal forces overwhelm and shatter the lesser star. Its superdense contents erupt into the system and curl a spiral arm of incredibly hot material. At 13 milliseconds, the more massive star has accumulated too much mass to support it against gravity and collapses, and a new black hole is born. The black hole's event horizon — its point of no return — is shown by the gray sphere. While most of the matter from both neutron stars will fall into the black hole, some of the less dense, faster moving matter manages to orbit around it, quickly forming a large and rapidly rotating torus. This torus extends for about 124 miles (200 km) and contains the equivalent of 1/5th the mass of our sun. Scientists think neutron star mergers like this produce short gamma-ray bursts (GRBs). Short GRBs last less than two seconds yet unleash as much energy as all the stars in our galaxy produce over one year. The rapidly fading afterglow of these explosions presents a challenge to astronomers. A key element in understanding GRBs is getting instruments on large ground-based telescopes to capture afterglows as soon as possible after the burst. The rapid notification and accurate positions provided by NASA's Swift mission creates a vibrant synergy with ground-based observatories that has led to dramatically improved understanding of GRBs, especially for short bursts. This video is public domain and can be downloaded at: <a href="http://svs.gsfc.nasa.gov/vis/a010000/a011500/a011530/index.html" rel="nofollow">svs.gsfc.nasa.gov/vis/a010000/a011500/a011530/index.html</a> <b><a href="http://www.nasa.gov/audience/formedia/features/MP_Photo_Guidelines.html" rel="nofollow">NASA image use policy.</a></b> <b><a href="http://www.nasa.gov/centers/goddard/home/index.html" rel="nofollow">NASA Goddard Space Flight Center</a></b> enables NASA’s mission through four scientific endeavors: Earth Science, Heliophysics, Solar System Exploration, and Astrophysics. Goddard plays a leading role in NASA’s accomplishments by contributing compelling scientific knowledge to advance the Agency’s mission. <b>Follow us on <a href="http://twitter.com/NASAGoddardPix" rel="nofollow">Twitter</a></b> <b>Like us on <a href="http://www.facebook.com/pages/Greenbelt-MD/NASA-Goddard/395013845897?ref=tsd" rel="nofollow">Facebook</a></b> <b>Find us on <a href="http://instagram.com/nasagoddard?vm=grid" rel="nofollow">Instagram</a></b>
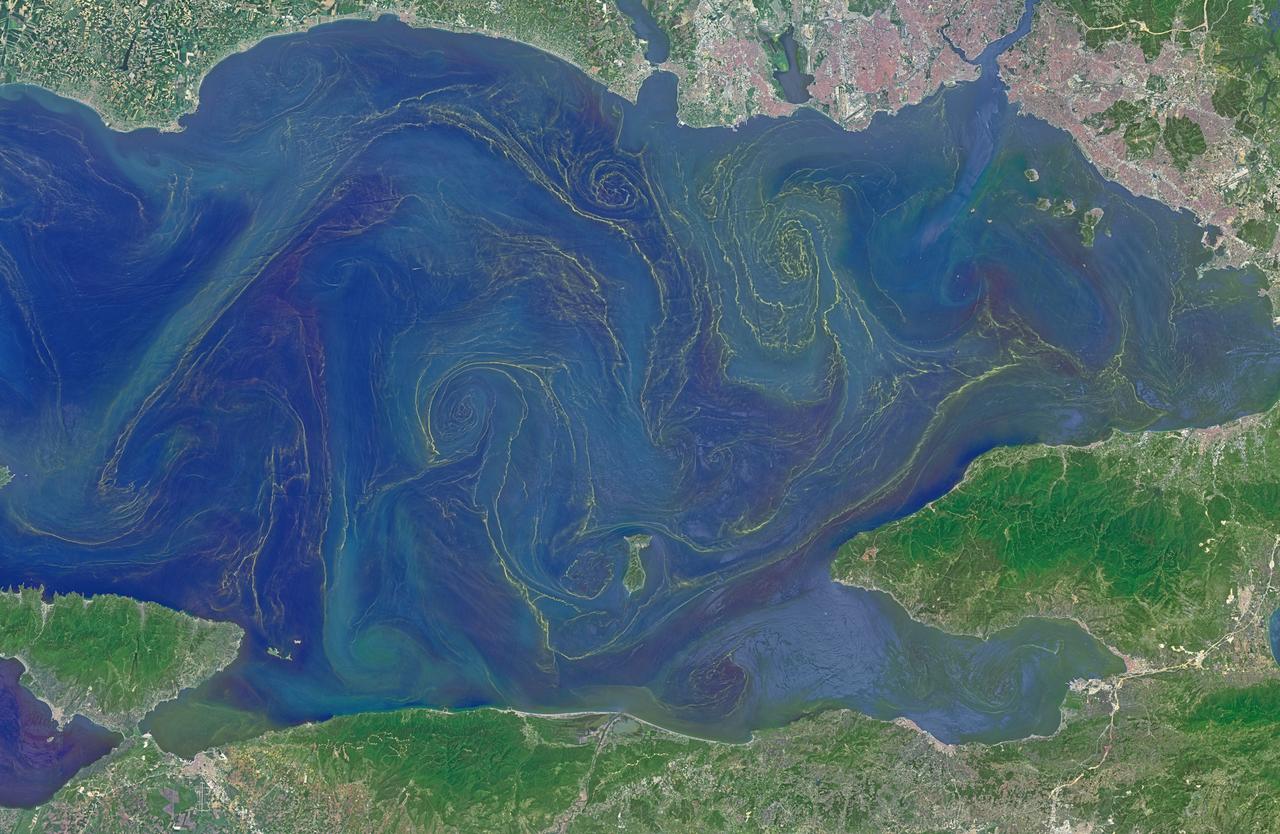
Situated between the Black Sea and the Aegean Sea, the Sea of Marmara is full of a rich soup of nutrients and life and surrounded by a rich history of civilization. Like the Black Sea to its northeast, the Marmara has an unusual layered structure with fresher water near the surface and much saltier water near the bottom. That fresh surface is fed by exchanges with the Black Sea and by flows from the Susurluk, Biga, and Gonen Rivers. The fresh water (just two thirds the salinity of the ocean) makes it easier for floating, plant-like organisms—phytoplankton—to grow, as does the abundance of nutrients pouring into the seas from European and Turkish rivers. The Operational Land Imager on the Landsat 8 satellite captured this image of a phytoplankton bloom in the Sea of Marmara on May 17, 2015. The sea is surrounded on all sides by the nation of Turkey. The swirling shapes on the water are phytoplankton, with the yellow-green and red-purple filaments likely (but not necessarily) representing different species. Those wavy colored lines not only show where the densest concentrations of plankton are floating, but also reveal the eddies and currents within the small sea. Waters rushing in through the narrow Bosphorous Strait (at Istanbul) and Dardanelles Strait (off the left side of the image), as well as a jagged coastline and tectonically fractured seafloor on this edge of the Asian and European continents, all conspire to create intricate mixing patterns. If you download the large image and open it in full resolution, you also can see ship tracks crossing the bloom lines. “I often see features in imagery and wonder: what could be causing that?” said Norman Kuring, an ocean color specialist at NASA Goddard. “Remote sensing is great for the big picture, but it still needs data from the surface for validation and interpretation.” According to scientists Baris Salihoglu of Turkey’s Institute of Marine Sciences and Ahsen Yuksek of Istanbul University, the blooms in the satellite image are mostly Prorocentrum micans and Noctiluca scintillans. They recently sampled the waters of the Marmara and found that Prorocentrum bloomed first, though Noctiluca eventually dominated. According to Ajit Subramaniam of the Lamont Doherty Earth Observatory, both species are dinoflagellates, known to discolor the water (red tides). Neither is directly toxic to humans, but they can kill marine life by becoming caught in fish gills, depleting the sea of oxygen, or excreting ammonia into the water. “Noctiluca is phagotrophic—a really interesting beast since it eats other phytoplankton that can then change its color,” Subramaniam noted. “It switches from being photosynthetic to becoming heterotrophic.” The Moderate Resolution Imaging Spectroradiometer (MODIS) on NASA’s Terra satellite captured wider views of bloom events in the Sea of Marmara on on May 23 and May 25. Credit: <b><a href="http://www.earthobservatory.nasa.gov/" rel="nofollow"> NASA Earth Observatory</a></b> Read more: <a href="http://earthobservatory.nasa.gov/IOTD/view.php?id=85947" rel="nofollow">earthobservatory.nasa.gov/IOTD/view.php?id=85947</a> <b><a href="http://www.nasa.gov/audience/formedia/features/MP_Photo_Guidelines.html" rel="nofollow">NASA image use policy.</a></b> <b><a href="http://www.nasa.gov/centers/goddard/home/index.html" rel="nofollow">NASA Goddard Space Flight Center</a></b> enables NASA’s mission through four scientific endeavors: Earth Science, Heliophysics, Solar System Exploration, and Astrophysics. Goddard plays a leading role in NASA’s accomplishments by contributing compelling scientific knowledge to advance the Agency’s mission. <b>Follow us on <a href="http://twitter.com/NASAGoddardPix" rel="nofollow">Twitter</a></b> <b>Like us on <a href="http://www.facebook.com/pages/Greenbelt-MD/NASA-Goddard/395013845897?ref=tsd" rel="nofollow">Facebook</a></b> <b>Find us on <a href="http://instagrid.me/nasagoddard/?vm=grid" rel="nofollow">Instagram</a></b>

An oil slick in the Gulf of Mexico following Hurricane Ida – a high-end Category 4 when it made landfall near Port Fourchon, Louisiana, on Aug. 29, 2021 – appears as a green trail in the inset false-color graphic provided by NASA's Delta-X project, while the surrounding seawater appears orange. The National Oceanic and Atmospheric Administration (NOAA) regularly monitors U.S. coastal waters for potential spills and noticed slicks that appeared just off the coast after the hurricane. They were able to use this information from Delta-X to corroborate other data they had about oil slicks in the area (satellite image in the second inset picture). The blue-green swath crossing from the Gulf of Mexico over the Louisiana coast denotes the flight path of the Delta-X radar instrument on Sept. 1, just before 11:30 a.m. CDT. Charged with studying the Mississippi River Delta, Delta-X was gearing up to collect data on Louisiana's coastal wetlands when Hurricane Ida barreled ashore in late August. The storm damaged buildings and infrastructure alike, resulting in power outages, flooding, and oil slicks in the Gulf of Mexico. Oil tends to smooth out the bumps on the ocean's surface, which results in a distinct radar signal that the Delta-X mission was able to pick out of their data. Delta-X added flight paths to their planned schedule – with the support of NASA's Applied Science Disaster Program – in order to collect information over the gulf in areas of interest to NOAA. Delta-X is studying two wetlands – the Atchafalaya and Terrebonne Basins – by land, boat, and air to quantify water and sediment flow as well as vegetation growth. While the Atchafalaya Basin has been gaining land through sediment accumulation, Terrebonne Basin, which is right next to the Atchafalaya, has been rapidly losing land. The data collected by the project will be applied to models used to forecast which areas of the delta are likely to gain or lose land under various sea level rise, river flow, and watershed management scenarios. The mission uses several instruments to collect its data. Affixed to the bottom of a Gulfstream-III airplane, one of those instruments, the all-weather Uninhabited Aerial Vehicle Synthetic Aperture Radar (UAVSAR), bounces radar signals off of Earth's surface, forming a kind of image of a particular area. Repeated images of the same regions, captured at different times, enable researchers to detect changes in those areas, such as fluctuating water levels beneath the vegetation as the tides move in and out of these wetlands. In addition to radar measurements, teams from Caltech, Louisiana State University, Florida International University, and other collaborating institutions gather water and vegetation samples – among other data – by boat, other airborne sensors, and from instruments on the ground. Funded by NASA's Earth Venture Suborbital (EVS-3) program, Delta-X is managed by the agency's Jet Propulsion Laboratory. Caltech in Pasadena, California, manages JPL for NASA. Fall 2021 was Delta-X's last scheduled field campaign, although the five-year mission will run through the end of 2023. https://photojournal.jpl.nasa.gov/catalog/PIA24540

Simulation frames from this NASA Goddard neutron star merger animation: <a href="http://bit.ly/1jolBYY" rel="nofollow">bit.ly/1jolBYY</a> Credit: NASA's Goddard Space Flight Center This supercomputer simulation shows one of the most violent events in the universe: a pair of neutron stars colliding, merging and forming a black hole. A neutron star is the compressed core left behind when a star born with between eight and 30 times the sun's mass explodes as a supernova. Neutron stars pack about 1.5 times the mass of the sun — equivalent to about half a million Earths — into a ball just 12 miles (20 km) across. As the simulation begins, we view an unequally matched pair of neutron stars weighing 1.4 and 1.7 solar masses. They are separated by only about 11 miles, slightly less distance than their own diameters. Redder colors show regions of progressively lower density. As the stars spiral toward each other, intense tides begin to deform them, possibly cracking their crusts. Neutron stars possess incredible density, but their surfaces are comparatively thin, with densities about a million times greater than gold. Their interiors crush matter to a much greater degree densities rise by 100 million times in their centers. To begin to imagine such mind-boggling densities, consider that a cubic centimeter of neutron star matter outweighs Mount Everest. By 7 milliseconds, tidal forces overwhelm and shatter the lesser star. Its superdense contents erupt into the system and curl a spiral arm of incredibly hot material. At 13 milliseconds, the more massive star has accumulated too much mass to support it against gravity and collapses, and a new black hole is born. The black hole's event horizon — its point of no return — is shown by the gray sphere. While most of the matter from both neutron stars will fall into the black hole, some of the less dense, faster moving matter manages to orbit around it, quickly forming a large and rapidly rotating torus. This torus extends for about 124 miles (200 km) and contains the equivalent of 1/5th the mass of our sun. Scientists think neutron star mergers like this produce short gamma-ray bursts (GRBs). Short GRBs last less than two seconds yet unleash as much energy as all the stars in our galaxy produce over one year. The rapidly fading afterglow of these explosions presents a challenge to astronomers. A key element in understanding GRBs is getting instruments on large ground-based telescopes to capture afterglows as soon as possible after the burst. The rapid notification and accurate positions provided by NASA's Swift mission creates a vibrant synergy with ground-based observatories that has led to dramatically improved understanding of GRBs, especially for short bursts. This video is public domain and can be downloaded at: <a href="http://svs.gsfc.nasa.gov/vis/a010000/a011500/a011530/index.html" rel="nofollow">svs.gsfc.nasa.gov/vis/a010000/a011500/a011530/index.html</a> <b><a href="http://www.nasa.gov/audience/formedia/features/MP_Photo_Guidelines.html" rel="nofollow">NASA image use policy.</a></b> <b><a href="http://www.nasa.gov/centers/goddard/home/index.html" rel="nofollow">NASA Goddard Space Flight Center</a></b> enables NASA’s mission through four scientific endeavors: Earth Science, Heliophysics, Solar System Exploration, and Astrophysics. Goddard plays a leading role in NASA’s accomplishments by contributing compelling scientific knowledge to advance the Agency’s mission. <b>Follow us on <a href="http://twitter.com/NASAGoddardPix" rel="nofollow">Twitter</a></b> <b>Like us on <a href="http://www.facebook.com/pages/Greenbelt-MD/NASA-Goddard/395013845897?ref=tsd" rel="nofollow">Facebook</a></b> <b>Find us on <a href="http://instagram.com/nasagoddard?vm=grid" rel="nofollow">Instagram</a></b>

Simulation frames from this NASA Goddard neutron star merger animation: <a href="http://bit.ly/1jolBYY" rel="nofollow">bit.ly/1jolBYY</a> Credit: NASA's Goddard Space Flight Center This supercomputer simulation shows one of the most violent events in the universe: a pair of neutron stars colliding, merging and forming a black hole. A neutron star is the compressed core left behind when a star born with between eight and 30 times the sun's mass explodes as a supernova. Neutron stars pack about 1.5 times the mass of the sun — equivalent to about half a million Earths — into a ball just 12 miles (20 km) across. As the simulation begins, we view an unequally matched pair of neutron stars weighing 1.4 and 1.7 solar masses. They are separated by only about 11 miles, slightly less distance than their own diameters. Redder colors show regions of progressively lower density. As the stars spiral toward each other, intense tides begin to deform them, possibly cracking their crusts. Neutron stars possess incredible density, but their surfaces are comparatively thin, with densities about a million times greater than gold. Their interiors crush matter to a much greater degree densities rise by 100 million times in their centers. To begin to imagine such mind-boggling densities, consider that a cubic centimeter of neutron star matter outweighs Mount Everest. By 7 milliseconds, tidal forces overwhelm and shatter the lesser star. Its superdense contents erupt into the system and curl a spiral arm of incredibly hot material. At 13 milliseconds, the more massive star has accumulated too much mass to support it against gravity and collapses, and a new black hole is born. The black hole's event horizon — its point of no return — is shown by the gray sphere. While most of the matter from both neutron stars will fall into the black hole, some of the less dense, faster moving matter manages to orbit around it, quickly forming a large and rapidly rotating torus. This torus extends for about 124 miles (200 km) and contains the equivalent of 1/5th the mass of our sun. Scientists think neutron star mergers like this produce short gamma-ray bursts (GRBs). Short GRBs last less than two seconds yet unleash as much energy as all the stars in our galaxy produce over one year. The rapidly fading afterglow of these explosions presents a challenge to astronomers. A key element in understanding GRBs is getting instruments on large ground-based telescopes to capture afterglows as soon as possible after the burst. The rapid notification and accurate positions provided by NASA's Swift mission creates a vibrant synergy with ground-based observatories that has led to dramatically improved understanding of GRBs, especially for short bursts. This video is public domain and can be downloaded at: <a href="http://svs.gsfc.nasa.gov/vis/a010000/a011500/a011530/index.html" rel="nofollow">svs.gsfc.nasa.gov/vis/a010000/a011500/a011530/index.html</a> <b><a href="http://www.nasa.gov/audience/formedia/features/MP_Photo_Guidelines.html" rel="nofollow">NASA image use policy.</a></b> <b><a href="http://www.nasa.gov/centers/goddard/home/index.html" rel="nofollow">NASA Goddard Space Flight Center</a></b> enables NASA’s mission through four scientific endeavors: Earth Science, Heliophysics, Solar System Exploration, and Astrophysics. Goddard plays a leading role in NASA’s accomplishments by contributing compelling scientific knowledge to advance the Agency’s mission. <b>Follow us on <a href="http://twitter.com/NASAGoddardPix" rel="nofollow">Twitter</a></b> <b>Like us on <a href="http://www.facebook.com/pages/Greenbelt-MD/NASA-Goddard/395013845897?ref=tsd" rel="nofollow">Facebook</a></b> <b>Find us on <a href="http://instagram.com/nasagoddard?vm=grid" rel="nofollow">Instagram</a></b>

Simulation frames from this NASA Goddard neutron star merger animation: <a href="http://bit.ly/1jolBYY" rel="nofollow">bit.ly/1jolBYY</a> Credit: NASA's Goddard Space Flight Center This supercomputer simulation shows one of the most violent events in the universe: a pair of neutron stars colliding, merging and forming a black hole. A neutron star is the compressed core left behind when a star born with between eight and 30 times the sun's mass explodes as a supernova. Neutron stars pack about 1.5 times the mass of the sun — equivalent to about half a million Earths — into a ball just 12 miles (20 km) across. As the simulation begins, we view an unequally matched pair of neutron stars weighing 1.4 and 1.7 solar masses. They are separated by only about 11 miles, slightly less distance than their own diameters. Redder colors show regions of progressively lower density. As the stars spiral toward each other, intense tides begin to deform them, possibly cracking their crusts. Neutron stars possess incredible density, but their surfaces are comparatively thin, with densities about a million times greater than gold. Their interiors crush matter to a much greater degree densities rise by 100 million times in their centers. To begin to imagine such mind-boggling densities, consider that a cubic centimeter of neutron star matter outweighs Mount Everest. By 7 milliseconds, tidal forces overwhelm and shatter the lesser star. Its superdense contents erupt into the system and curl a spiral arm of incredibly hot material. At 13 milliseconds, the more massive star has accumulated too much mass to support it against gravity and collapses, and a new black hole is born. The black hole's event horizon — its point of no return — is shown by the gray sphere. While most of the matter from both neutron stars will fall into the black hole, some of the less dense, faster moving matter manages to orbit around it, quickly forming a large and rapidly rotating torus. This torus extends for about 124 miles (200 km) and contains the equivalent of 1/5th the mass of our sun. Scientists think neutron star mergers like this produce short gamma-ray bursts (GRBs). Short GRBs last less than two seconds yet unleash as much energy as all the stars in our galaxy produce over one year. The rapidly fading afterglow of these explosions presents a challenge to astronomers. A key element in understanding GRBs is getting instruments on large ground-based telescopes to capture afterglows as soon as possible after the burst. The rapid notification and accurate positions provided by NASA's Swift mission creates a vibrant synergy with ground-based observatories that has led to dramatically improved understanding of GRBs, especially for short bursts. This video is public domain and can be downloaded at: <a href="http://svs.gsfc.nasa.gov/vis/a010000/a011500/a011530/index.html" rel="nofollow">svs.gsfc.nasa.gov/vis/a010000/a011500/a011530/index.html</a> <b><a href="http://www.nasa.gov/audience/formedia/features/MP_Photo_Guidelines.html" rel="nofollow">NASA image use policy.</a></b> <b><a href="http://www.nasa.gov/centers/goddard/home/index.html" rel="nofollow">NASA Goddard Space Flight Center</a></b> enables NASA’s mission through four scientific endeavors: Earth Science, Heliophysics, Solar System Exploration, and Astrophysics. Goddard plays a leading role in NASA’s accomplishments by contributing compelling scientific knowledge to advance the Agency’s mission. <b>Follow us on <a href="http://twitter.com/NASAGoddardPix" rel="nofollow">Twitter</a></b> <b>Like us on <a href="http://www.facebook.com/pages/Greenbelt-MD/NASA-Goddard/395013845897?ref=tsd" rel="nofollow">Facebook</a></b> <b>Find us on <a href="http://instagram.com/nasagoddard?vm=grid" rel="nofollow">Instagram</a></b>

Image release date September 22, 2010 To view a video of this image go here: <a href="http://www.flickr.com/photos/gsfc/5014452203">www.flickr.com/photos/gsfc/5014452203</a> Caption: A spectacular new NASA/ESA Hubble Space Telescope image reveals the heart of the Lagoon Nebula. Seen as a massive cloud of glowing dust and gas, bombarded by the energetic radiation of new stars, this placid name hides a dramatic reality. The Advanced Camera for Surveys (ACS) on the NASA/ESA Hubble Space Telescope has captured a dramatic view of gas and dust sculpted by intense radiation from hot young stars deep in the heart of the Lagoon Nebula (Messier 8). This spectacular object is named after the wide, lagoon-shaped dust lane that crosses the glowing gas of the nebula. This structure is prominent in wide-field images, but cannot be seen in this close-up. However the strange billowing shapes and sandy texture visible in this image make the Lagoon Nebula’s watery name eerily appropriate from this viewpoint too. Located four to five thousand light-years away, in the constellation of Sagittarius (the Archer), Messier 8 is a huge region of star birth that stretches across one hundred light-years. Clouds of hydrogen gas are slowly collapsing to form new stars, whose bright ultraviolet rays then light up the surrounding gas in a distinctive shade of red. The wispy tendrils and beach-like features of the nebula are not caused by the ebb and flow of tides, but rather by ultraviolet radiation’s ability to erode and disperse the gas and dust into the distinctive shapes that we see. In recent years astronomers probing the secrets of the Lagoon Nebula have found the first unambiguous proof that star formation by accretion of matter from the gas cloud is ongoing in this region. Young stars that are still surrounded by an accretion disc occasionally shoot out long tendrils of matter from their poles. Several examples of these jets, known as Herbig-Haro objects, have been found in this nebula in the last five years, providing strong support for astronomers’ theories about star formation in such hydrogen-rich regions. The Lagoon Nebula is faintly visible to the naked eye on dark nights as a small patch of grey in the heart of the Milky Way. Without a telescope, the nebula looks underwhelming because human eyes are unable to distinguish clearly between colours at low light levels. Charles Messier, the 18th century French astronomer, observed the nebula and included it in his famous astronomical catalogue, from which the nebula’s alternative name comes. But his relatively small refracting telescope would only have hinted at the dramatic structures and colours now visible thanks to Hubble. The Hubble Space Telescope is a project of international cooperation between ESA and NASA. Image credit: NASA, ESA <b><a href="http://www.nasa.gov/audience/formedia/features/MP_Photo_Guidelines.html" rel="nofollow">NASA image use policy.</a></b> <b><a href="http://www.nasa.gov/centers/goddard/home/index.html" rel="nofollow">NASA Goddard Space Flight Center</a></b> enables NASA’s mission through four scientific endeavors: Earth Science, Heliophysics, Solar System Exploration, and Astrophysics. Goddard plays a leading role in NASA’s accomplishments by contributing compelling scientific knowledge to advance the Agency’s mission. <b>Follow us on <a href="http://twitter.com/NASAGoddardPix" rel="nofollow">Twitter</a></b> <b>Like us on <a href="http://www.facebook.com/pages/Greenbelt-MD/NASA-Goddard/395013845897?ref=tsd" rel="nofollow">Facebook</a></b> <b>Find us on <a href="http://instagram.com/nasagoddard?vm=grid" rel="nofollow">Instagram</a></b> To learn more about the Hubble Space Telescope go here: <a href="http://www.nasa.gov/mission_pages/hubble/main/index.html" rel="nofollow">www.nasa.gov/mission_pages/hubble/main/index.html</a>