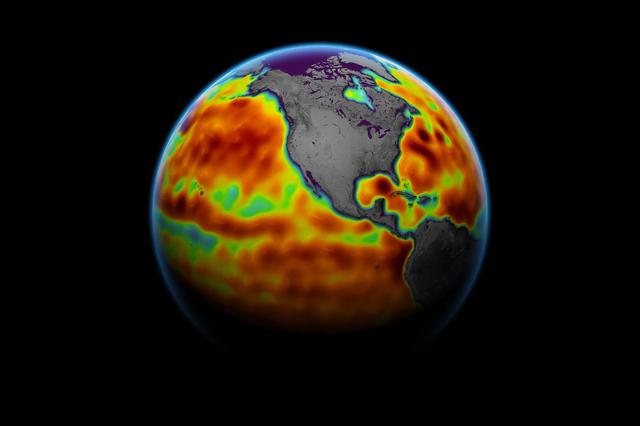
This image of the Pacific Ocean was produced using sea-surface height measurements taken by NASA U.S.-French TOPEX/Poseidon satellite.

This image of the Pacific Ocean was produced using sea surface height measurements taken by NASA U.S.-French TOPEX/Poseidon satellite.
This image of the Pacific Ocean was produced using sea surface height measurements taken by NASA U.S.-French TOPEX/Poseidon satellite.

This image of the Pacific Ocean was produced using sea surface height measurements taken by NASA U.S.-French TOPEX/Poseidon satellite.
This image of the Pacific Ocean was produced using sea-surface height measurements taken by NASA U.S.-French TOPEX/Poseidon satellite.
This image of the Pacific Ocean was produced using sea-surface height measurements taken by NASA U.S.-French TOPEX/Poseidon satellite.
This image of the Pacific Ocean was produced using sea surface height measurements taken by NASA U.S./French TOPEX/Poseidon satellite.
This image of the Pacific Ocean was produced using sea-surface height measurements taken by NASA U.S.-French TOPEX/Poseidon satellite.
This image of the Pacific Ocean was produced using sea-surface height measurements taken by NASA U.S.-French TOPEX/Poseidon satellite.
This image of the Pacific Ocean was produced using sea-surface height measurements taken by NASA U.S.-French TOPEX/Poseidon satellite.
This image of the Pacific Ocean was produced using sea surface height measurements taken by NASA U.S./French TOPEX/POSEIDON satellite.
This image of the Pacific Ocean was produced using sea-surface height measurements taken by NASA U.S.-French TOPEX/Poseidon satellite.
This image of the Pacific Ocean was produced using sea surface height measurements taken by NASA U.S.-French TOPEX/Poseidon satellite.
This image of the Pacific Ocean was produced using sea surface height measurements taken by NASA U.S.-French TOPEX/Poseidon satellite.
This image of the Pacific Ocean was produced using sea surface height measurements taken by NASA U.S./French TOPEX/POSEIDON satellite.
This image of the Pacific Ocean was produced using sea surface height measurements taken by NASA U.S./French TOPEX/POSEIDON satellite.
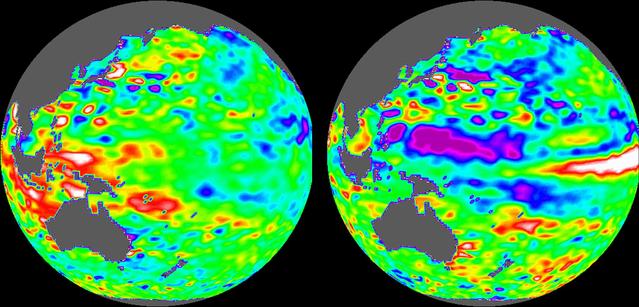
These images of the Pacific Ocean near Indonesia were produced using sea surface height measurements taken by NASA U.S.-French TOPEX/Poseidon satellite.
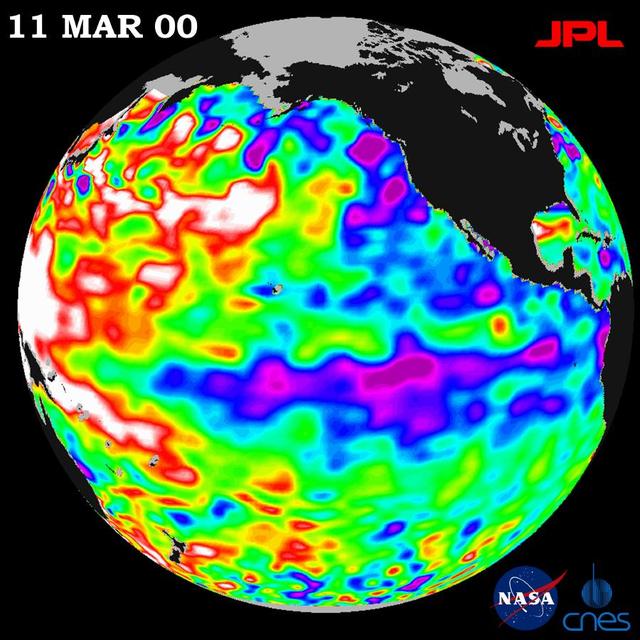
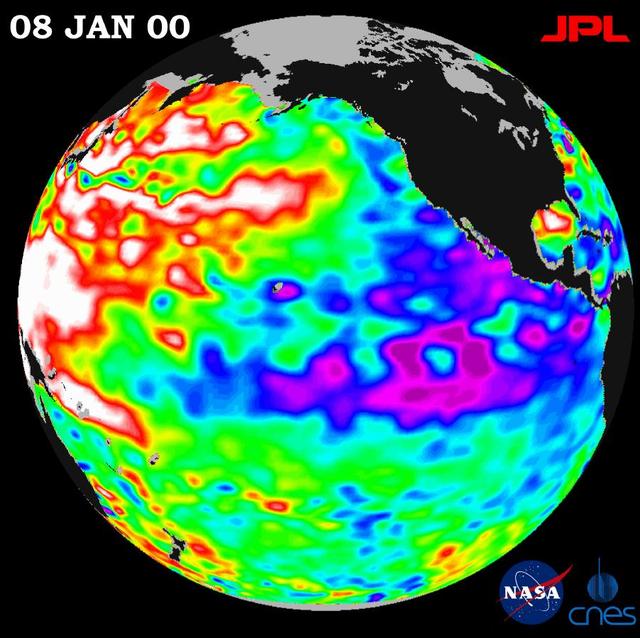
NASA TOPEX/Poseidon data, collected over a 10-day sampling cycle from March 1 to 11, 2000, showed a La Niña condition.
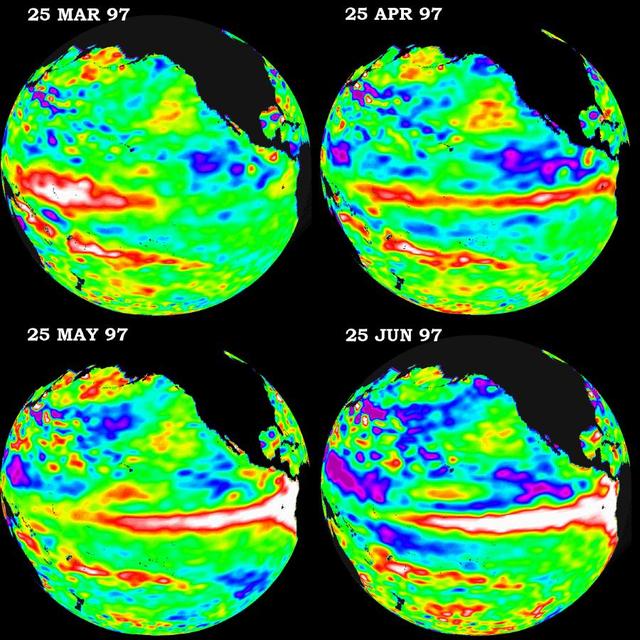
These four views of the Pacific Ocean were produced using sea surface height measurements taken by NASA U.S./French TOPEX/POSEIDON satellite.
Like fall and winter of 2000, this year NASA Topex/Poseidon satellite data shows that the Pacific ocean continues to be dominated by the strong Pacific Decadal Oscillation, which is larger than the El Niño/La Niña pattern.

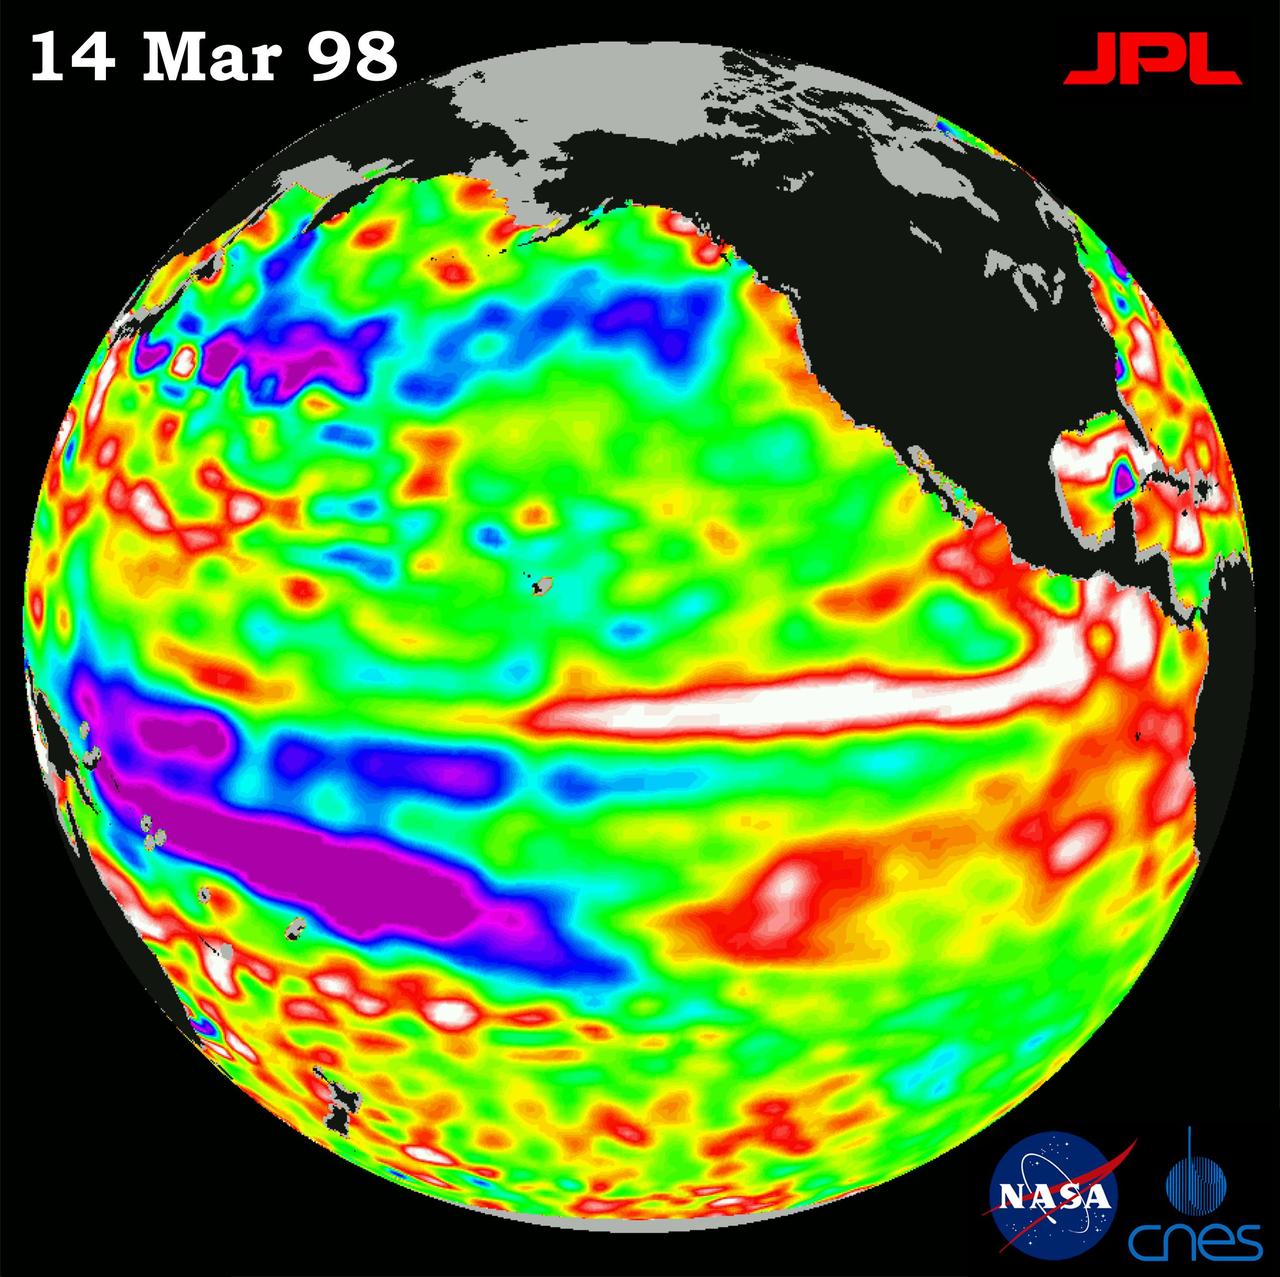
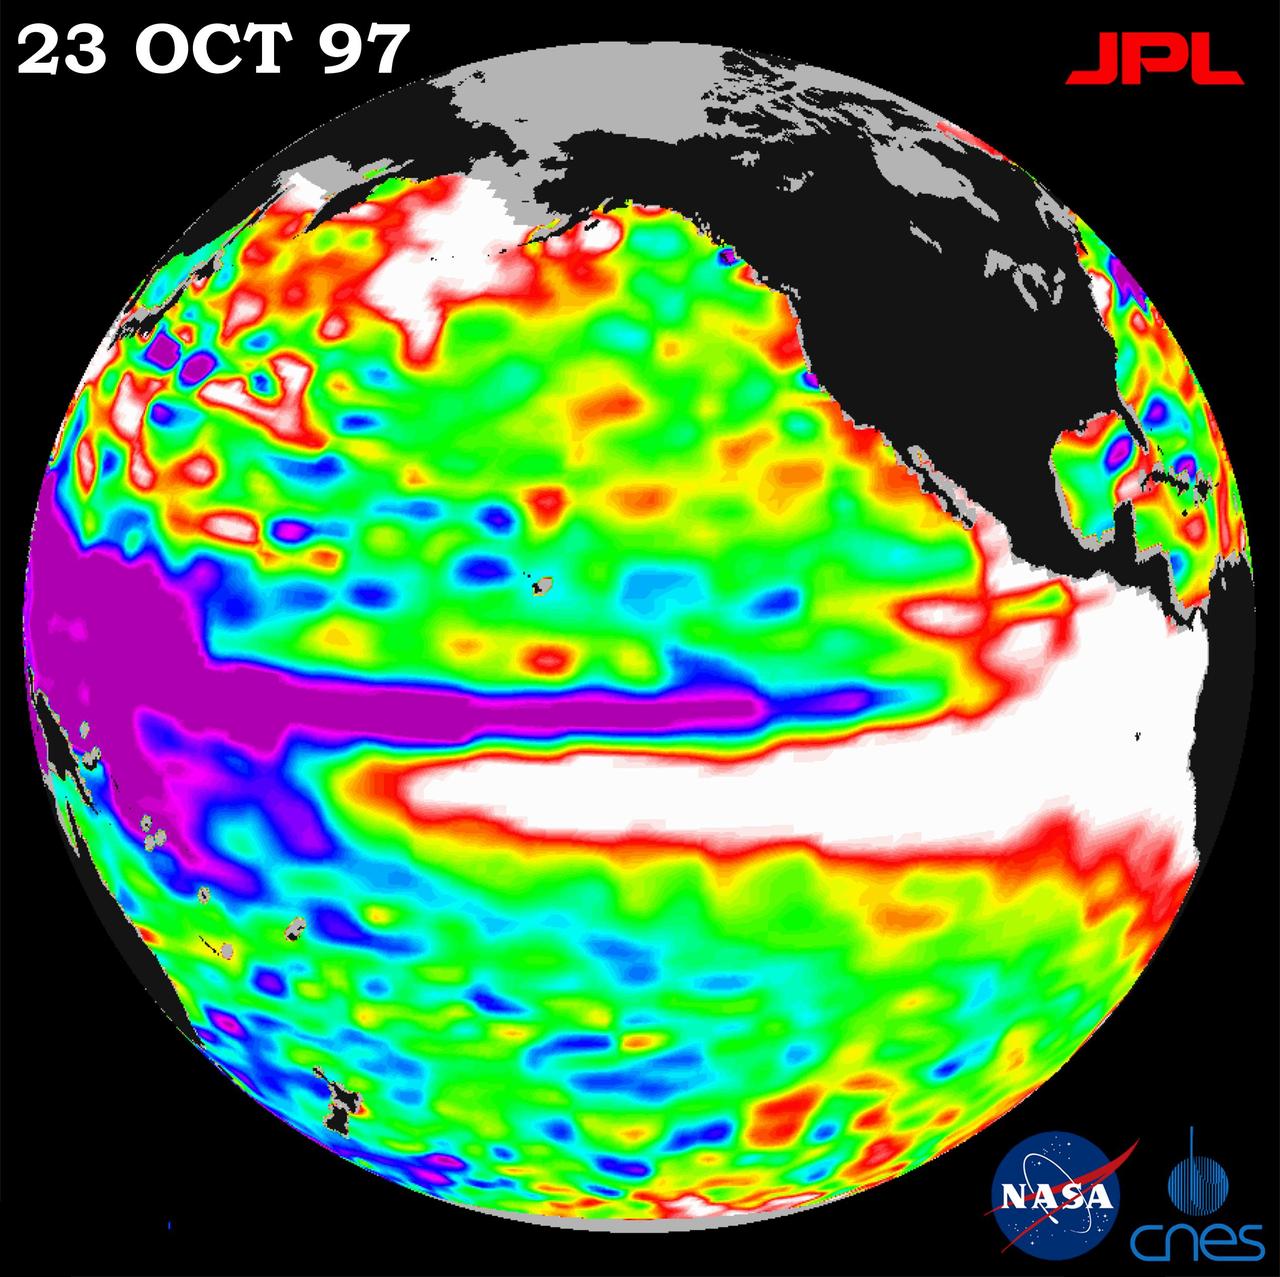
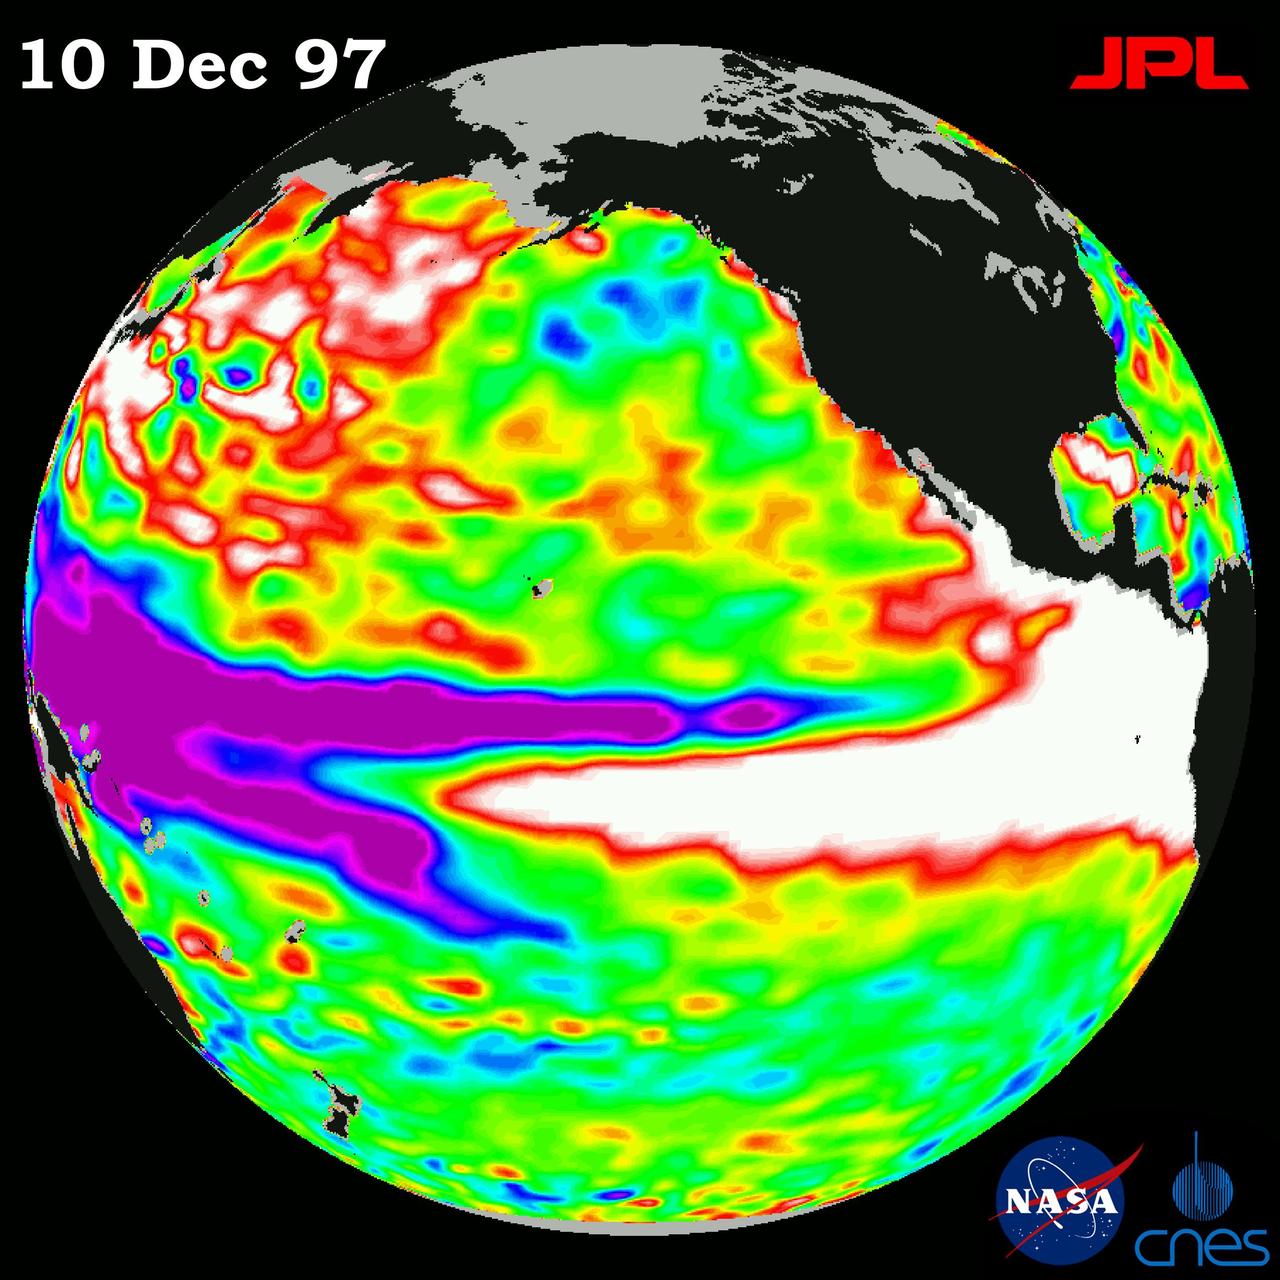
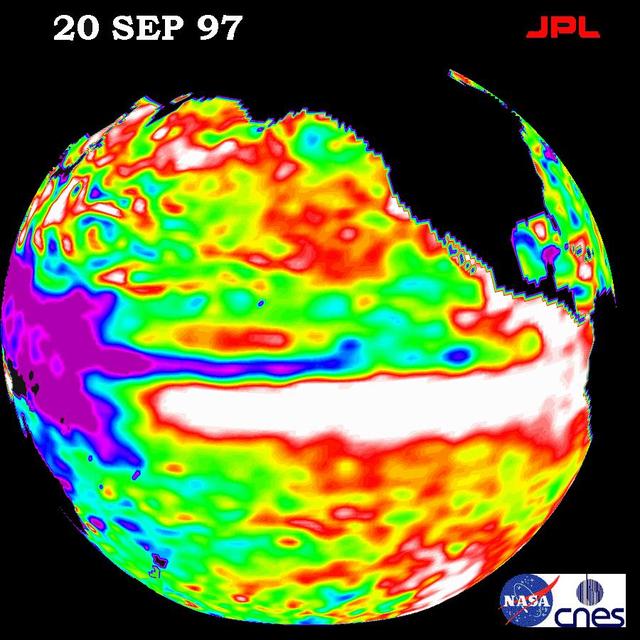
This image of the Pacific Ocean was produced using sea surface height measurements taken by the U.S./French TOPEX/Poseidon satellite. The image shows sea surface height relative to normal ocean conditions on Nov. 10, 1997.
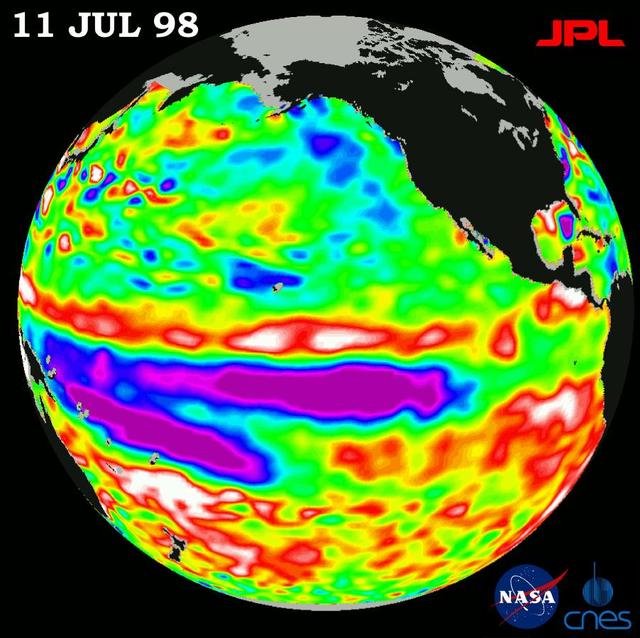
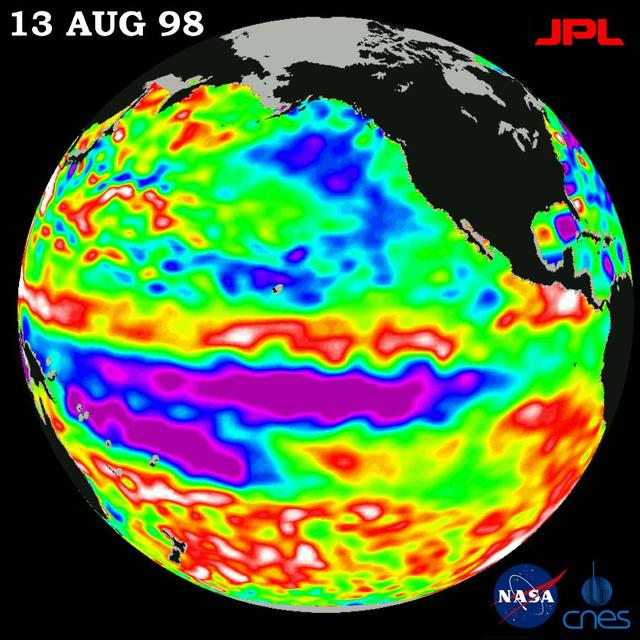
Height measurements taken by NASA U.S.-French TOPEX/Poseidon satellite. The image shows sea surface height relative to normal ocean conditions on July 11, 1998; sea surface height is an indicator of the heat content of the ocean.
The cold pool of water in the Pacific known as La Nina is beginning to fade, but ocean conditions have not returned to normal, according to scientists studying images from the U.S.-French TOPEX/Poseidon satellite. http://photojournal.jpl.nasa.gov/catalog/PIA00031
After three years of El Niño and La Niña, the Pacific is finally calming down in the tropics but still shows signs of being abnormal elsewhere, according to the satellite data from NASA U.S.-French TOPEX/Poseidon mission.
A repeat of last year mild La Niña conditions -- with a stormy winter in the Pacific Northwest and a dry winter in the southwestern United States -- will be the likely outcome of sea-surface heights observed by NASA TOPEX/Poseidon satellite.
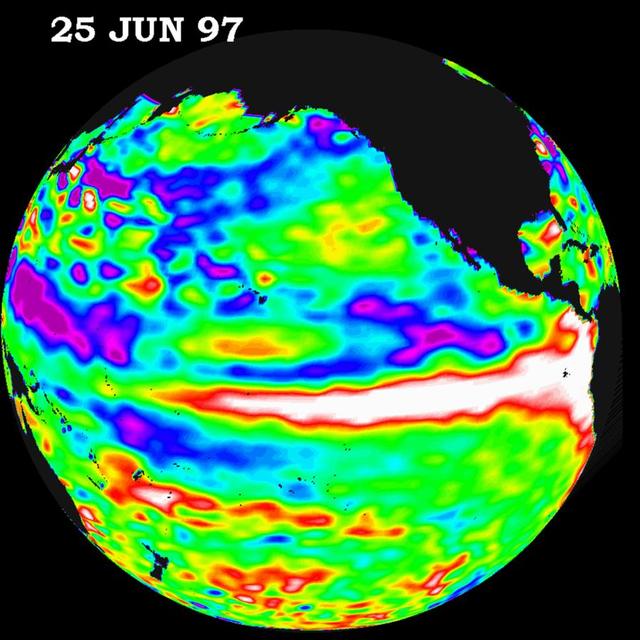
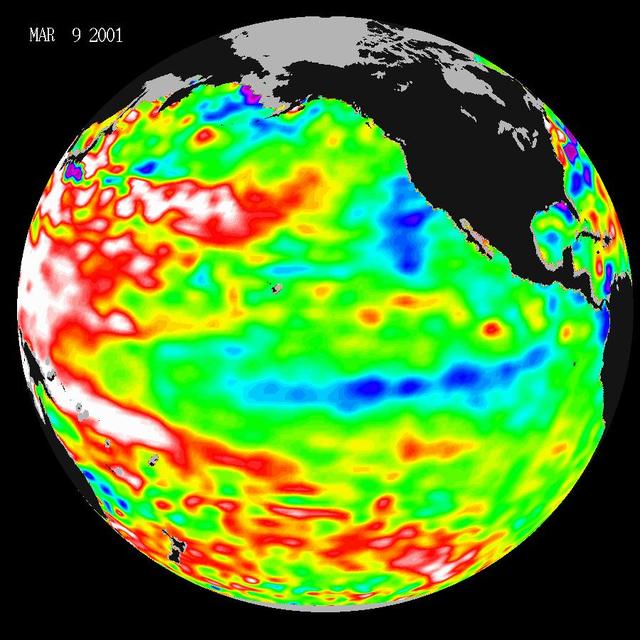
The Pacific Ocean doesnt show signs of anything that looks like the whopper El Niño of 1997-1998, according to the latest information from NASA U.S.-French ocean-observing satellite Topex/Poseidon.
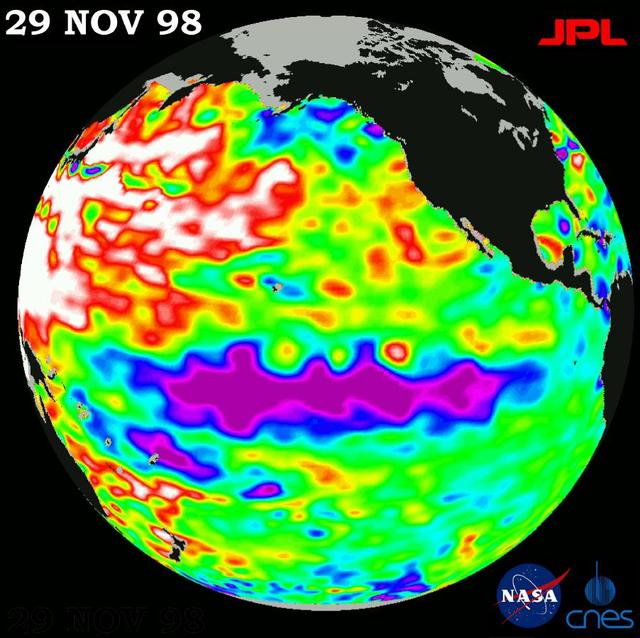
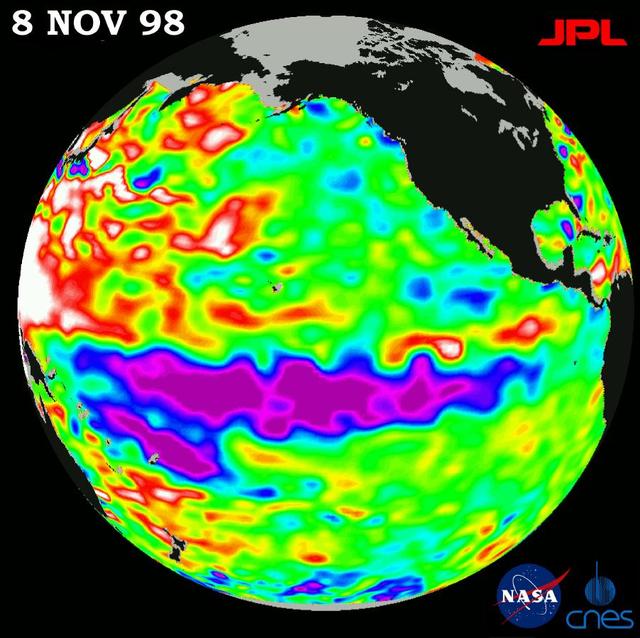
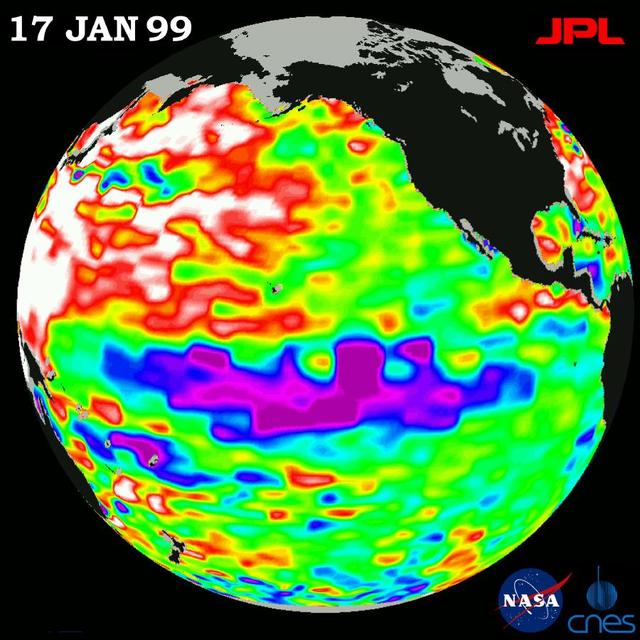
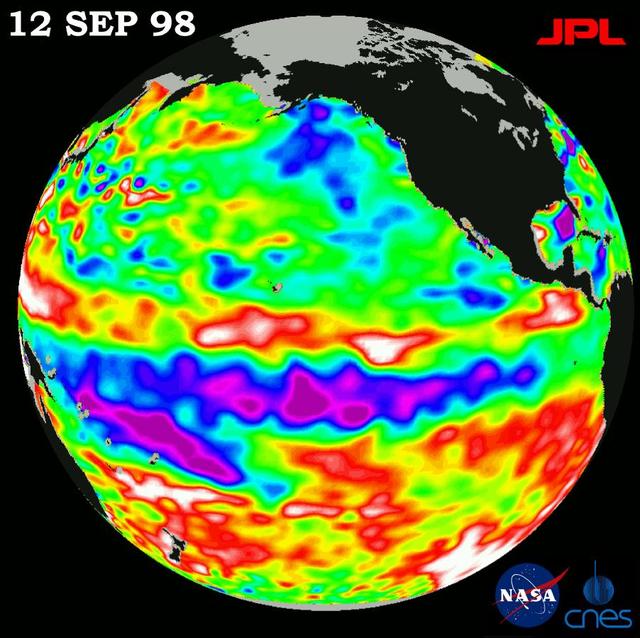
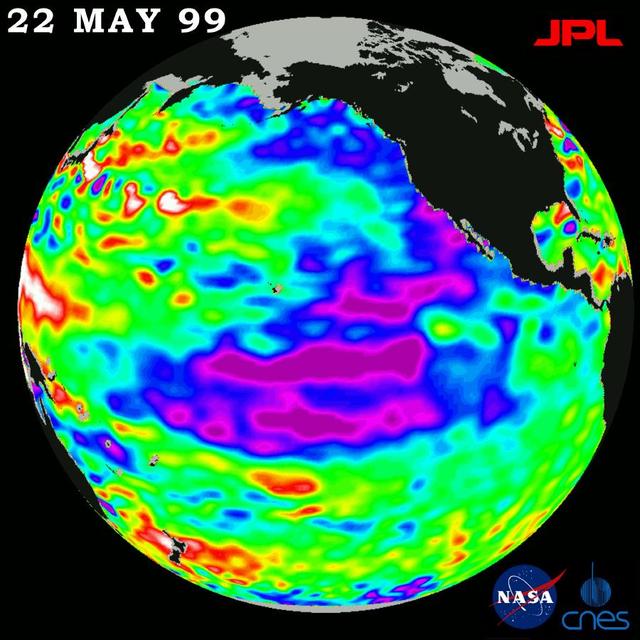
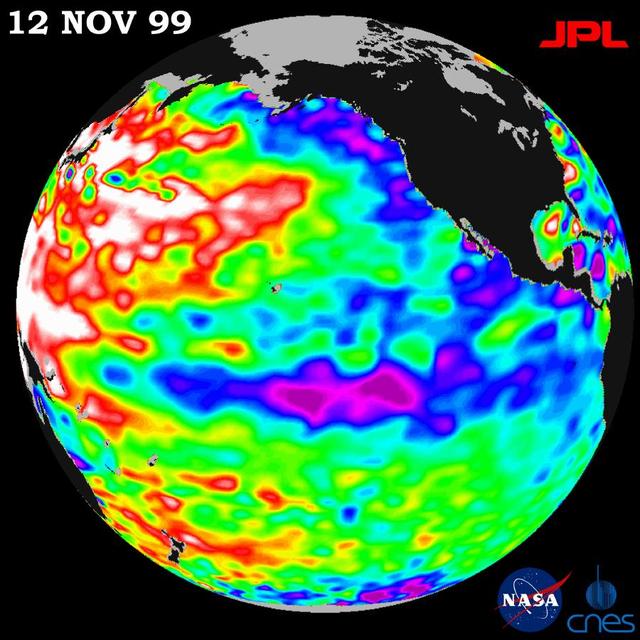
The cold pool of water in the Pacific known as La Niña still persists, although it is slowly weakening, according to scientists studying new data from NASA U.S.-French TOPEX/Poseidon satellite.
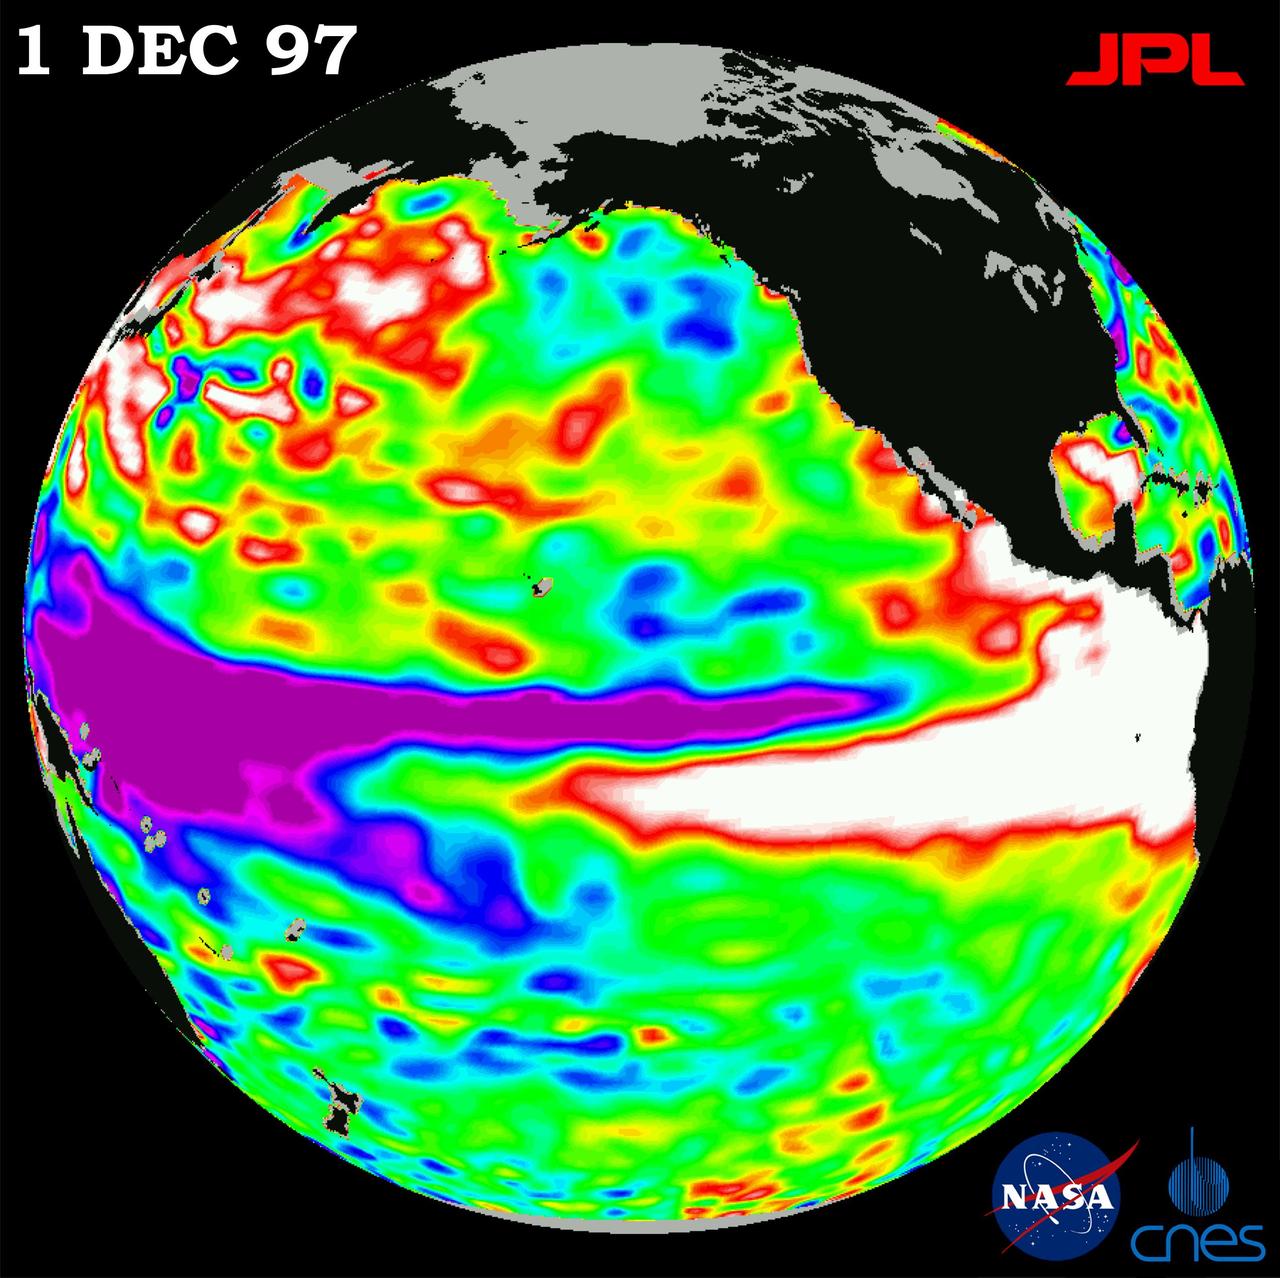
This image of the Pacific Ocean was produced using sea surface height measurements taken by NASA U.S./French TOPEX/Poseidon satellite. The image shows sea surface height relative to normal ocean conditions on Dec. 1, 1997.
New sea surface height measurements from NASA TOPEX/Poseidon satellite show that the sea level and temperature of the entire Pacific is out of balance, including a large area of abnormally cool water along the west coast of North America.
After dominating the tropical Pacific Ocean for more than two years, the 1998-2000 La Niña cool pool is continuing its slow fade and seems to be retiring from the climate stage, according to satellite data from NASA U.S.-French TOPEX/Poseidon mission.
Unusually warm ocean temperatures off Asia and cool waters in the eastern and equatorial Pacific are signaling La Niña mild return, according to the latest sea-surface heights observed by the joint NASA-French space agency TOPEX/Poseidon satellite.
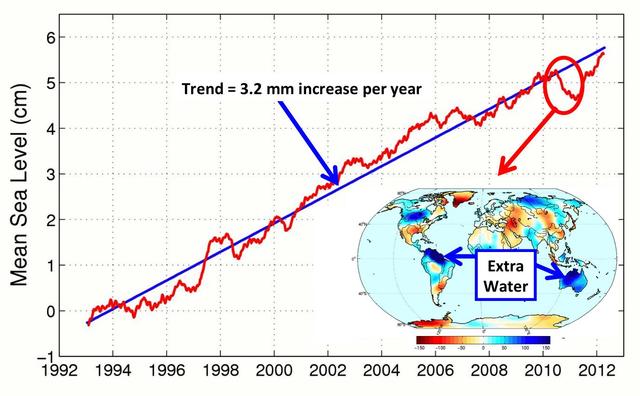
This figure shows changes in global mean sea level as measured by satellite altimetry NASA/CNES Topex/Poseidon and Jason-1; and NASA/CNES/NOAA/EUMETSAT Jason-2 between 1992 to 2012.
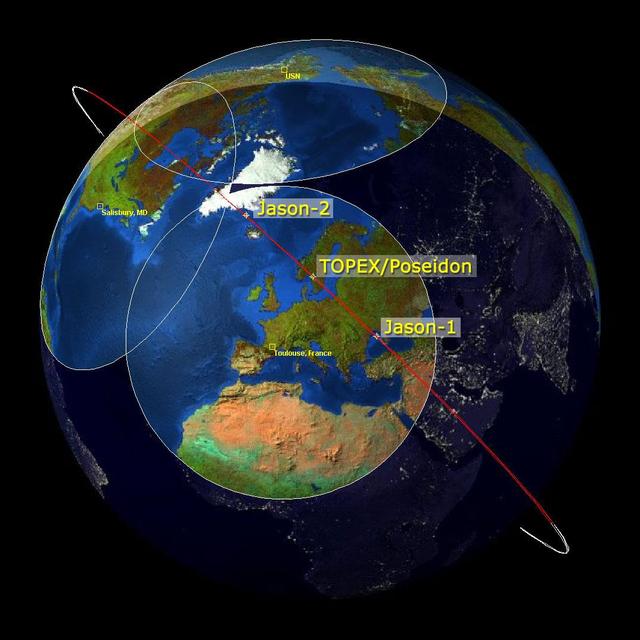
This image is a family portrait of Topex/Poseidon, Jason-1 and Ocean Surface Topography Mission/Jason-2 OSTM/Jason-2, NASA satellites that have measured global sea surface heights since 1992.
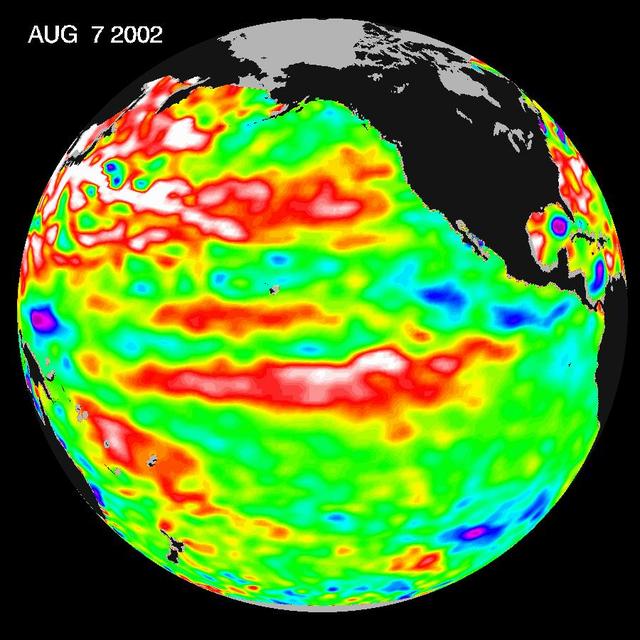
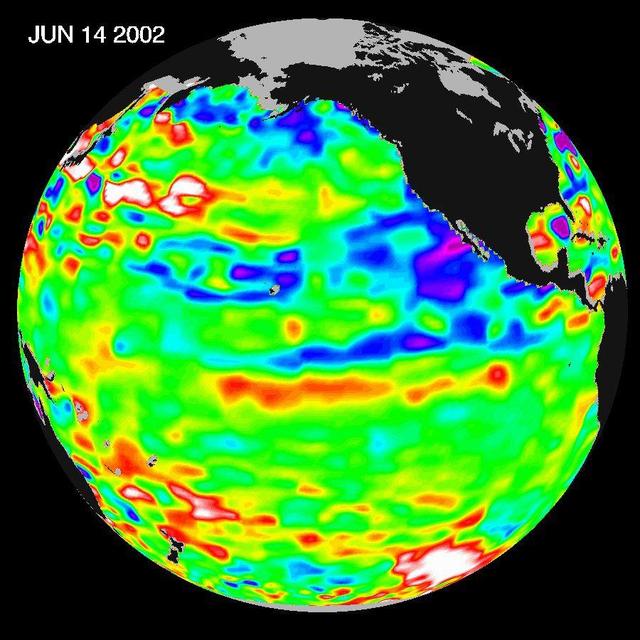
This Topex/Poseidon image of sea-surface heights was taken during a 10-day collection cycle ending August 7, 2002. Sea-surface heights are a measure of how much heat is stored in the ocean below to influence future planetary climate events. Since May 2001, there have been a series of warm Kelvin waves--eastward-moving ocean waves that cross the equatorial Pacific in about two months. A sizable one arrived at the South American coast last February, raising the ocean temperature by 2 degrees Celsius (3.6 degrees Fahrenheit) and triggering the National Oceanic and Atmospheric Administration's forecast for a mild El Niño in 2002. There was another wave in June, followed by the current large pool of warm water in the tropical Pacific that is now moving toward the coast of South America at a speed of 215 kilometers (134 miles) a day and will arrive there in three to four weeks, raising ocean temperatures. Scientists will continue to monitor the Pacific closely for further signs of El Niño formation and intensity. http://photojournal.jpl.nasa.gov/catalog/PIA03855
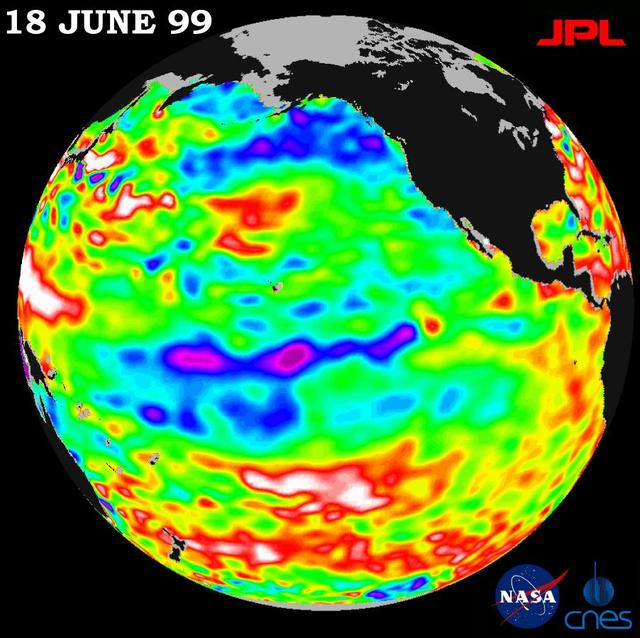
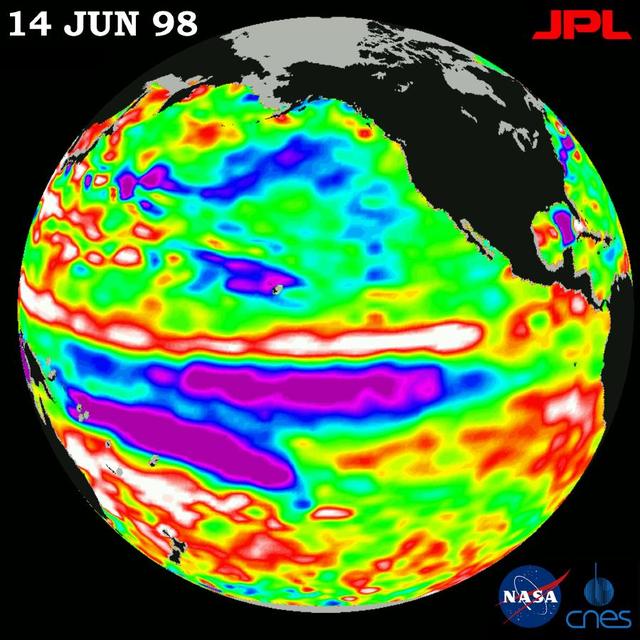
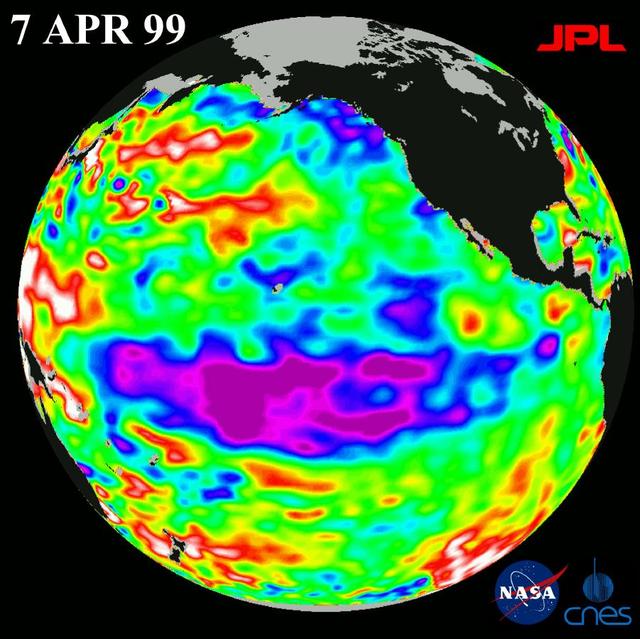
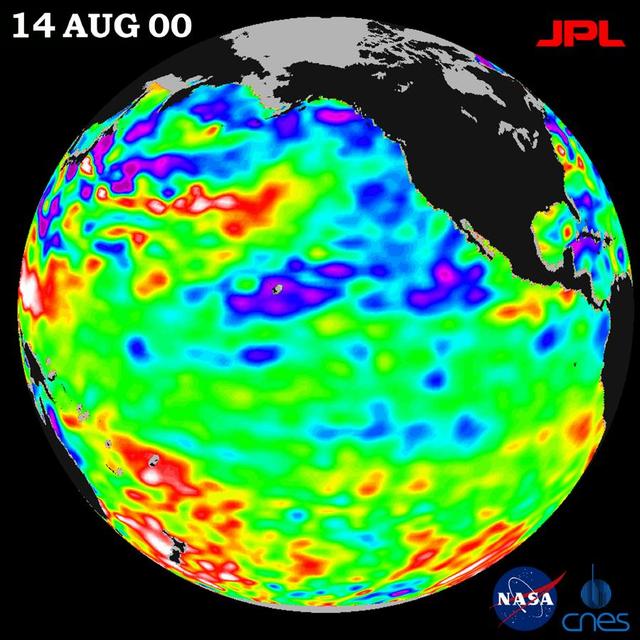
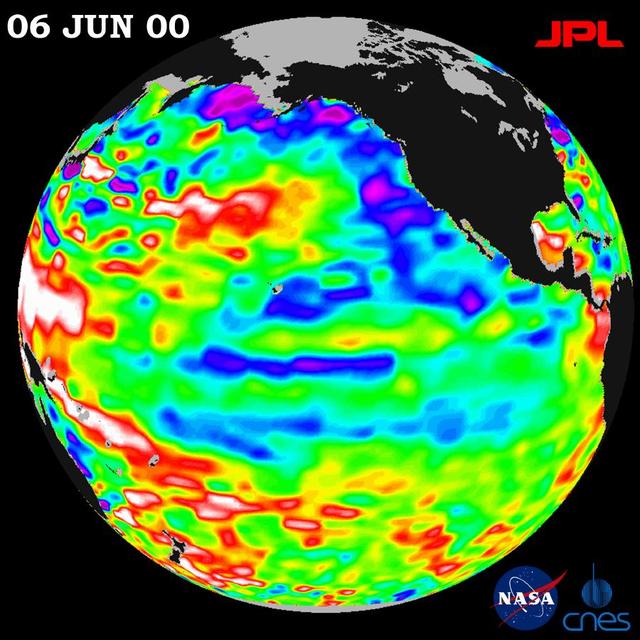
Lingering just a month ago in the eastern Pacific Ocean, the La Niña phenomenon, with its large volume of chilly water, barely has a pulse this month, according to new satellite data from NASA U.S.-French TOPEX/Poseidon mission. The data, taken during a 10-day cycle of data collection ending June 18, show that the equatorial Pacific Ocean is warming up and returning to normal (green) as La Niña all but vanishes. The warming trend is most apparent in the equatorial Pacific Ocean, where only a few patches of cooler, low sea levels (seen in blue and purple) remain. The blue areas are between 5 and 13 centimeters (2 and 5 inches) below normal, whereas the purple areas range from 14 to 18 centimeters (6 to 7 inches) below normal. Like its counterpart, El Niño, a La Niña condition will influence global climate and weather until it has completely subsided. As summer begins in the northern hemisphere, lower-than-normal sea surface levels and cool ocean temperatures persist in the northeastern Gulf of Alaska and along the western coast of North America. In contrast, the trend is the opposite over most of the Pacific, where above-normal sea surface heights and warmer ocean temperatures (indicated by the red and white areas) appear to be increasing and dominating the overall Pacific Ocean. Red areas are about 10 centimeters (4 inches) above normal; white areas show the sea surface height is between 14 and 32 centimeters (6 and 13 inches) above normal. Scientists are not ready to administer last rites to La Niña, though. In the last 12 months, the pool of unusually cold water in the Pacific has shrunk (warmed) several times before cooling (expanding) again. This summer's altimeter data will help them determine whether La Niña has truly dissipated or whether they will see another resurgence of cool water in the Pacific. http://photojournal.jpl.nasa.gov/catalog/PIA01586
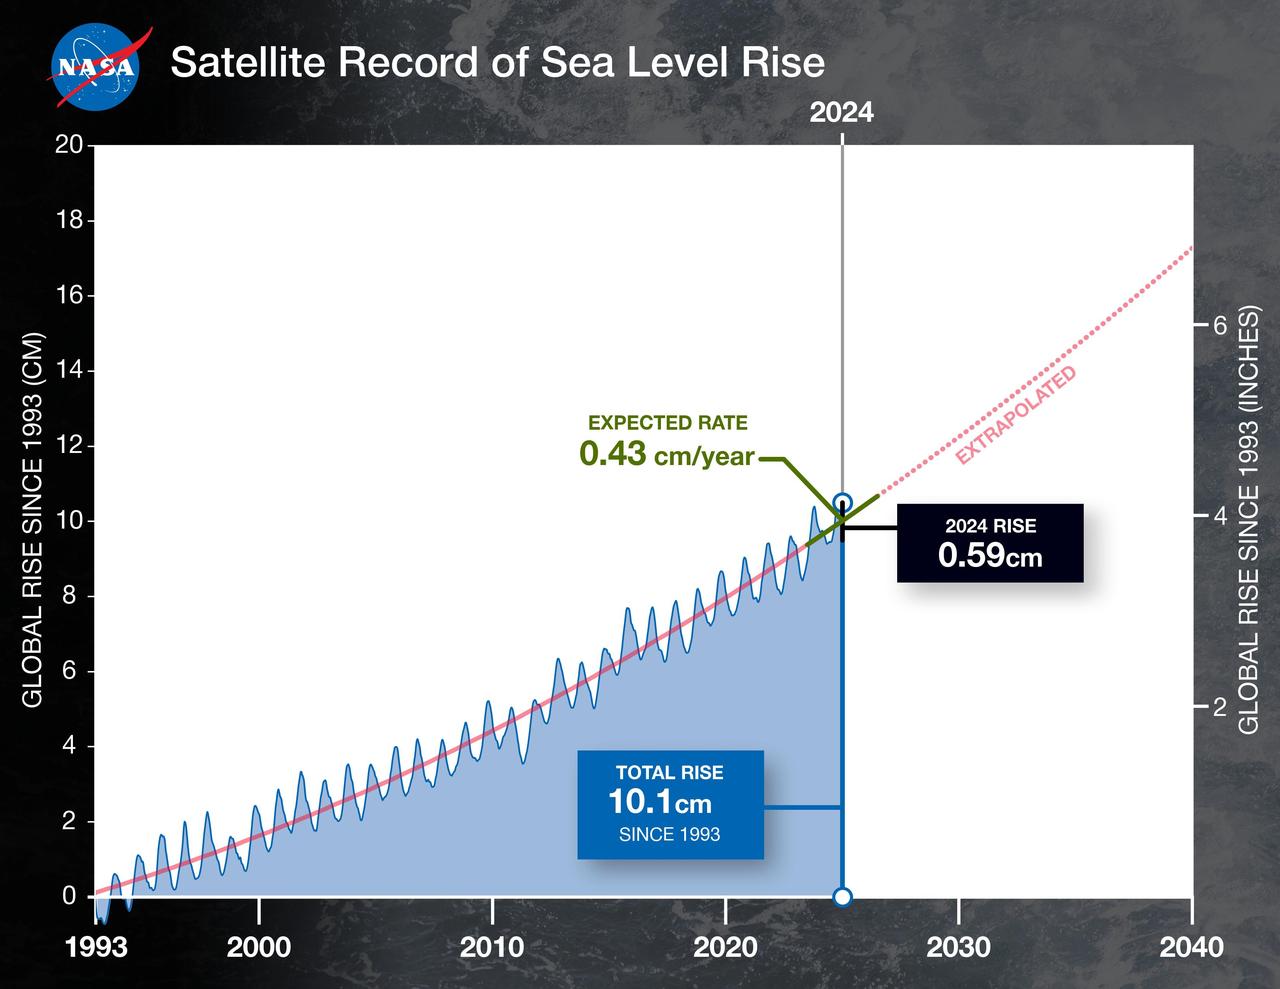
This graph shows the rise in global mean sea level from 1993 to 2024 based on data from a series of five international satellites. The solid red line indicates the trajectory of this increase, which has more than doubled over the three decades. The dotted red line projects future sea level rise. Global sea level rose faster than expected in 2024 due mostly to ocean water expanding as it warms, or thermal expansion. According to a NASA-led analysis, last year's rate of rise was 0.23 inches (0.59 centimeters) per year, compared to the expected rate of 0.17 inches (0.43 centimeters) per year. In recent years, about two-thirds of sea level rise was due to the addition of water from land into the ocean by melting ice sheets and glaciers. About a third came from thermal expansion of seawater. But in 2024, those contributions flipped, with two-thirds of sea level rise coming from thermal expansion. This NASA-led analysis is based on a sea level dataset featuring more than 30 years of satellite observations, starting with the U.S.-French TOPEX/Poseidon mission, which launched in 1992. The Sentinel-6 Michael Freilich mission, which launched in November 2020, is the latest in the series of satellites that have contributed to this sea level record. https://photojournal.jpl.nasa.gov/catalog/PIA26189

This graph shows the rise in global mean sea level from 1993 to 2023 based on data from a series of five international satellites. The solid red line indicates the trajectory of this increase, which has more than doubled over the three decades. The dotted red line projects future sea level rise. The relatively large jump in sea level from 2022 to 2023, a rise of about 0.3 inches (0.76 centimeters), is due mostly to a warming climate and the development of a strong El Niño. The 2022-2023 rise is equivalent to draining a quarter of Lake Superior into the ocean over the course of a year. This NASA-led analysis is based on a sea level data set featuring more than 30 years of satellite observations, starting with the U.S.-French TOPEX/Poseidon mission, which launched in 1992. The Sentinel-6 Michael Freilich mission, which launched in November 2020, is the latest in the series of satellites that have contributed to this sea level record. https://photojournal.jpl.nasa.gov/catalog/PIA26183
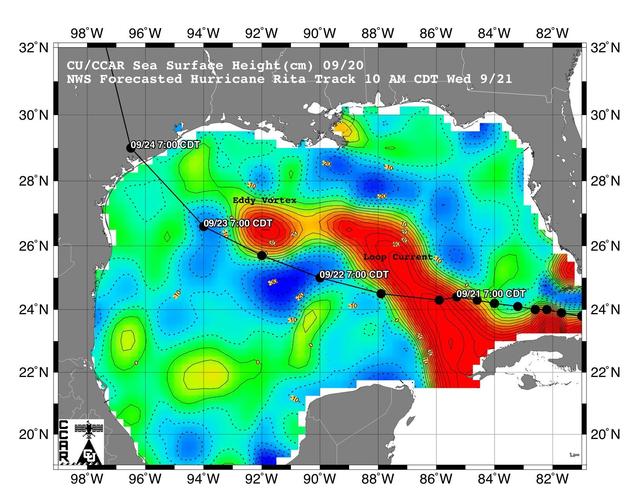
This sea surface height map of the Gulf of Mexico, with the Florida peninsula on the right and the Texas-Mexico Gulf Coast on the left, is based on altimeter data from four satellites including NASA’s Topex/Poseidon and Jason.
The North Pacific Ocean continues to run hot and cold, with abnormally low sea levels and cool waters in the northeastern Pacific contrasting with unusually high sea levels and warm waters in the northwestern Pacific.
Data taken during a 10-day collection cycle ending March 9, 2001, show that above-normal sea-surface heights and warmer ocean temp. red and white areas still blanket the far-western tropical Pacific and much of the north and south mid-Pacific.
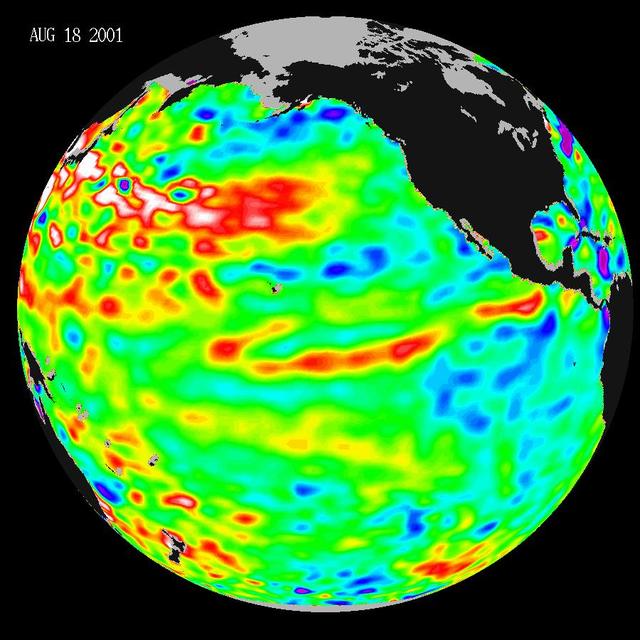
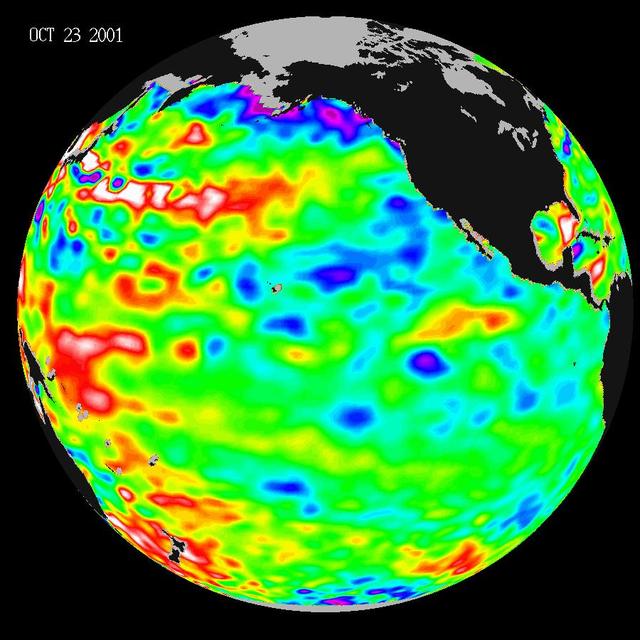
These data, taken during a 10-day collection cycle ending August 18, 2001, show that above-normal sea-surface heights and warmer ocean temperatures still blanket the far-western tropical Pacific and much of the north and south mid-Pacific.
A giant horseshoe pattern of higher than normal sea-surface heights developing over the last year is beginning to dominate the entire western Pacific and Asiatic oceans.
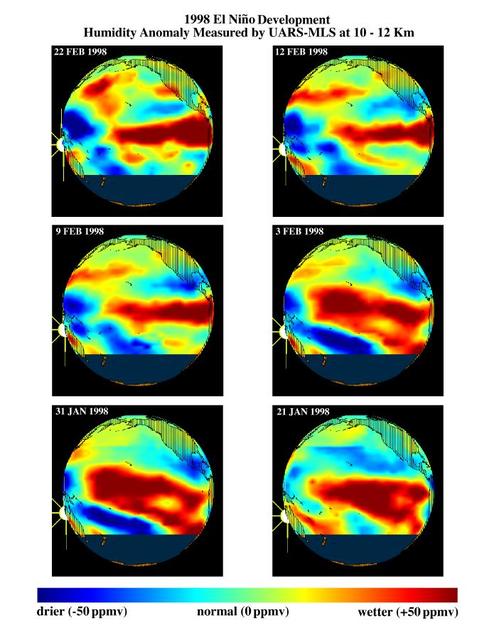
This series of six images shows the evolution of atmospheric water vapor over the Pacific Ocean during the 1998 El Ni?o condition.
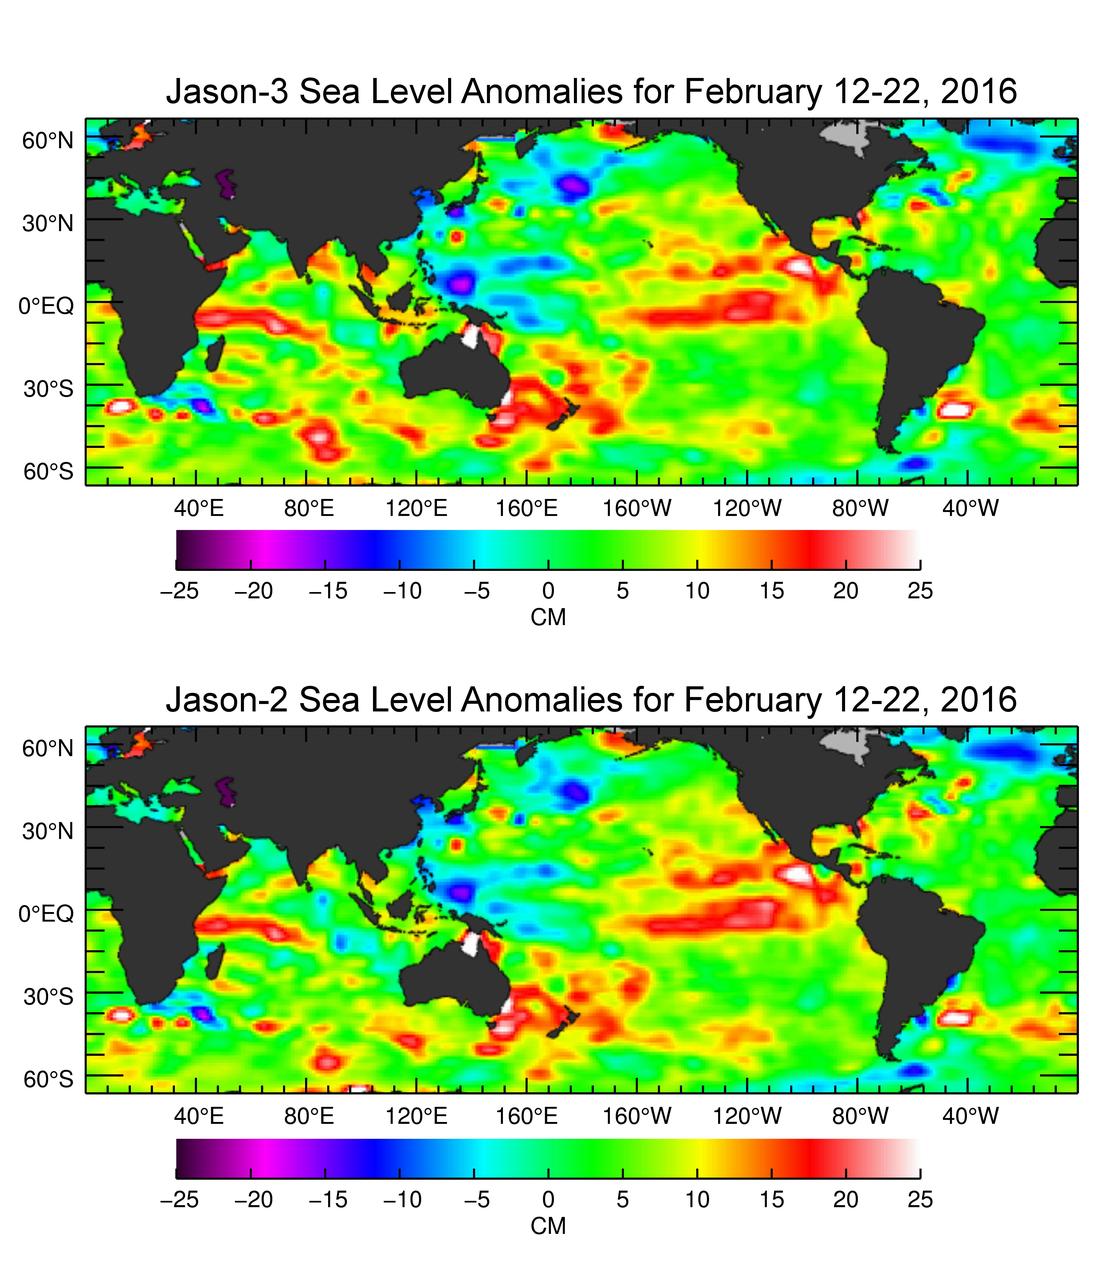
The U.S./European Jason-3 satellite has produced its first map of sea surface height, which corresponds well to data from its predecessor, Jason-2. Higher-than-normal sea levels are red; lower-than-normal sea levels are blue. El Niño is visible as the red blob in the eastern equatorial Pacific. Extending the timeline of ocean surface topography measurements begun by the Topex/Poseidon and Jason 1 and 2 satellites, Jason 3 will make highly detailed measurements of sea-level on Earth to gain insight into ocean circulation and climate change. http://photojournal.jpl.nasa.gov/catalog/PIA20532
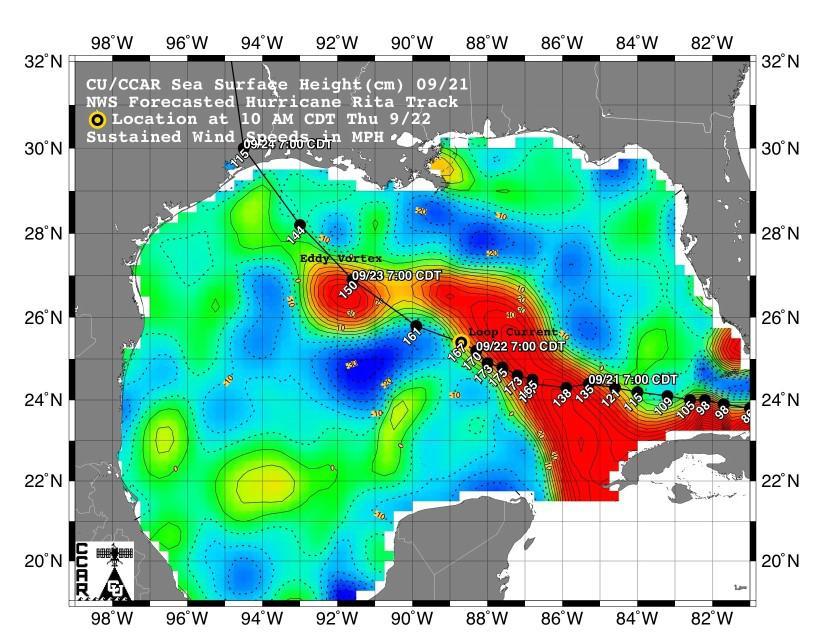
This sea surface height map of the Gulf of Mexico, with the Florida peninsula on the right and the Texas-Mexico Gulf Coast on the left, is based on altimeter data from four satellites including NASA’s Topex/Poseidon and Jason. Red indicates a strong circulation of much warmer waters, which can feed energy to a hurricane. This area stands 35 to 60 centimeters (about 13 to 23 inches) higher than the surrounding waters of the Gulf. The actual track of a hurricane is primarily dependent upon steering winds, which are forecasted through the use of atmospheric models. However, the interaction of the hurricane with the upper ocean is the primary source of energy for the storm. Hurricane intensity is therefore greatly affected by the upper ocean temperature structure and can exhibit explosive growth over warm ocean currents and eddies. Eddies are currents of water that run contrary to the direction of the main current. According to the forecasted track through the Gulf of Mexico, Hurricane Rita will continue crossing the warm waters of a Gulf of Mexico circulation feature called the Loop Current and then pass near a warm-water eddy called the Eddy Vortex, located in the north central Gulf, south of Louisiana. http://photojournal.jpl.nasa.gov/catalog/PIA06427
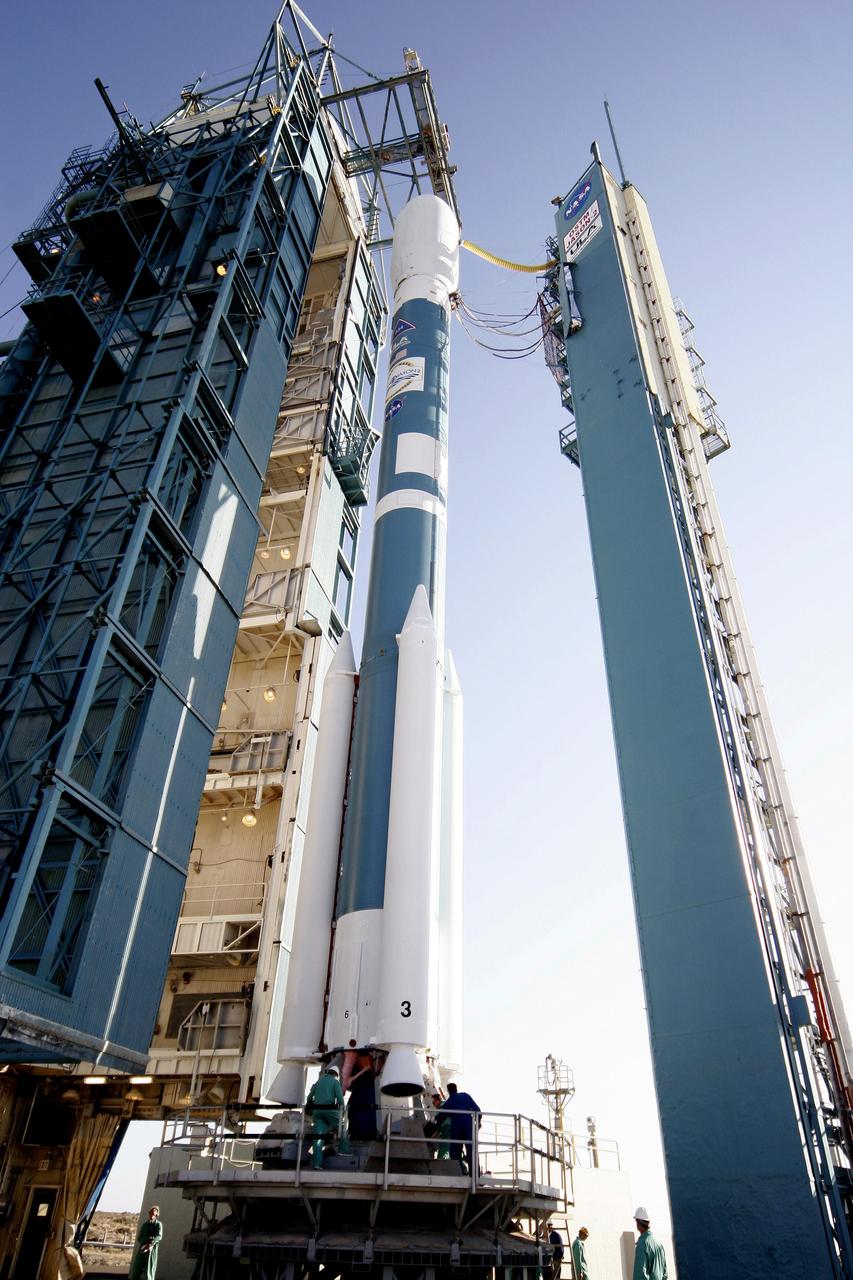
PASADENA, Calif. – A Delta II rocket carrying the Ocean Surface Topography Mission/Jason 2 satellite, is prepared for launch at Space Launch Complex 2 at Vandenberg Air Force Base, Calif. The OSTM/Jason 2 satellite will embark on a globe-circling voyage to continue charting sea level, a vital indicator of global climate change. The mission will return a vast amount of new data that will improve weather, climate and ocean forecasts. OSTM/Jason 2's expected lifetime of at least three years will extend into the next decade the continuous record of these data started in 1992 by NASA and the French space agency Centre National d'Etudes Spatiales, or CNES, with the TOPEX/Poseidon mission. The data collection was continued by the two agencies on Jason 1 in 2001. Photo credit: Carleton Bailie photograph for United Launch Alliance

VANDENBERG AIR FORCE BASE, Calif. -- A Delta II rocket appears to erupt from the undulating clouds of smoke below as it launches with the joint NASA/French Space Agency oceanography satellite Jason 1 and Thermosphere Ionosphere Mesosphere Energetics and Dynamics satellite aboard. Liftoff from Launch Complex 2W occurred at 7:07 a.m. PST (10:07 a.m. EST or 15:07 GMT). Jason 1 joins the orbiting Topex/Poseidon satellite to continue observations of the global climate interaction occurring between the sea and the atmosphere as a result of stored solar energy. Instruments on Jason 1 will map variations in ocean surface topography to monitor world ocean circulation, study interactions of the oceans and atmosphere, improve climate predictions and observe events like El Nino. The mission is expected to last three years. The TIMED satellite will study a little-known region above the atmosphere, some 40 to 110 miles from the Earth's surface. Studying this region has been nearly impossible until now because conventional airplanes and balloons cannot reach this high altitude, and it is too low for direct satellite measurements

VANDENBERG AIR FORCE BASE, Calif. -- A Delta II rocket launches successfully with the joint NASA/French Space Agency oceanography satellite Jason 1 and Thermosphere Ionosphere Mesosphere Energetics and Dynamics satellite aboard. Liftoff from Launch Complex 2W occurred at 7:07 a.m. PST (10:07 a.m. EST or 15:07 GMT). Jason 1 joins the orbiting Topex/Poseidon satellite to continue observations of the global climate interaction occurring between the sea and the atmosphere as a result of stored solar energy. Instruments on Jason 1 will map variations in ocean surface topography to monitor world ocean circulation, study interactions of the oceans and atmosphere, improve climate predictions and observe events like El Nino. The mission is expected to last three years. The TIMED satellite will study a little-known region above the atmosphere, some 40 to 110 miles from the Earth's surface. Studying this region has been nearly impossible until now because conventional airplanes and balloons cannot reach this high altitude, and it is too low for direct satellite measurements
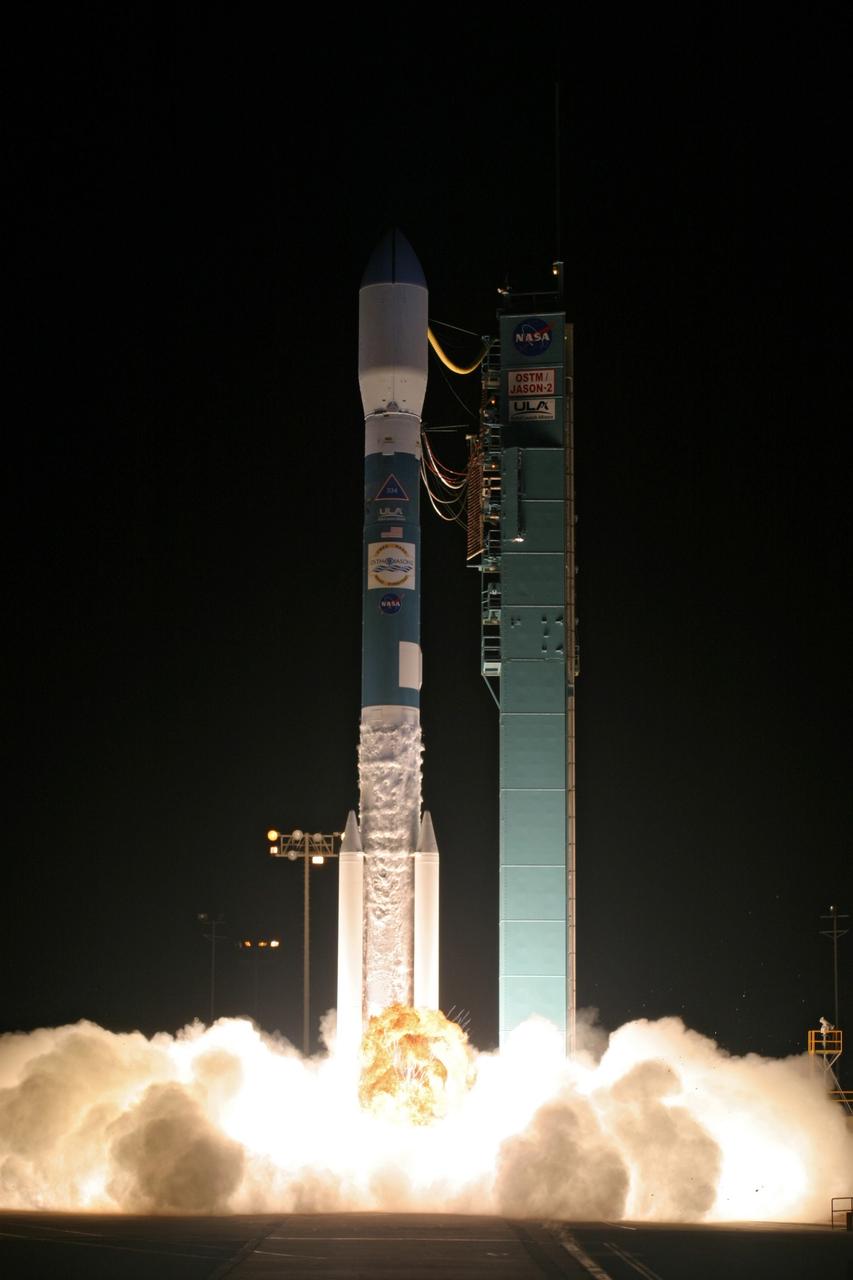
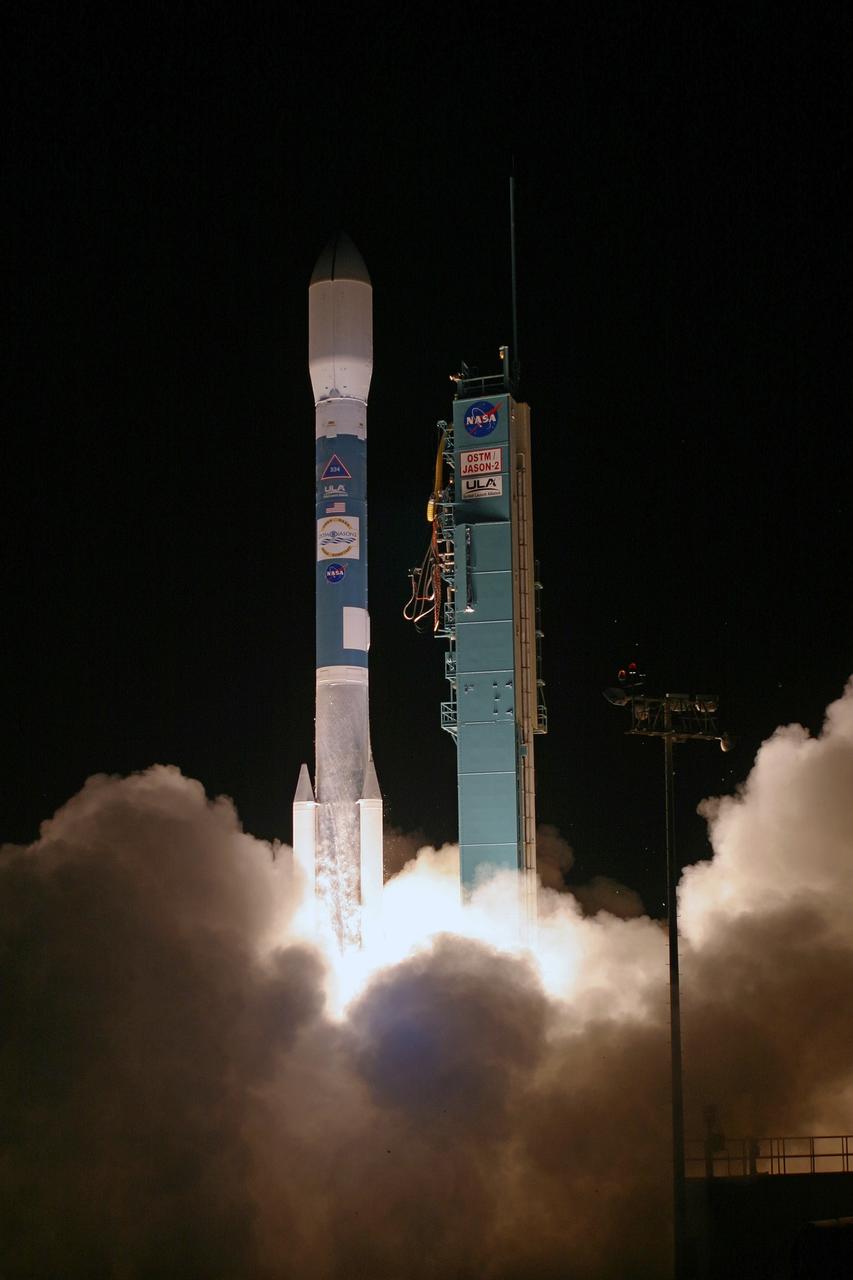
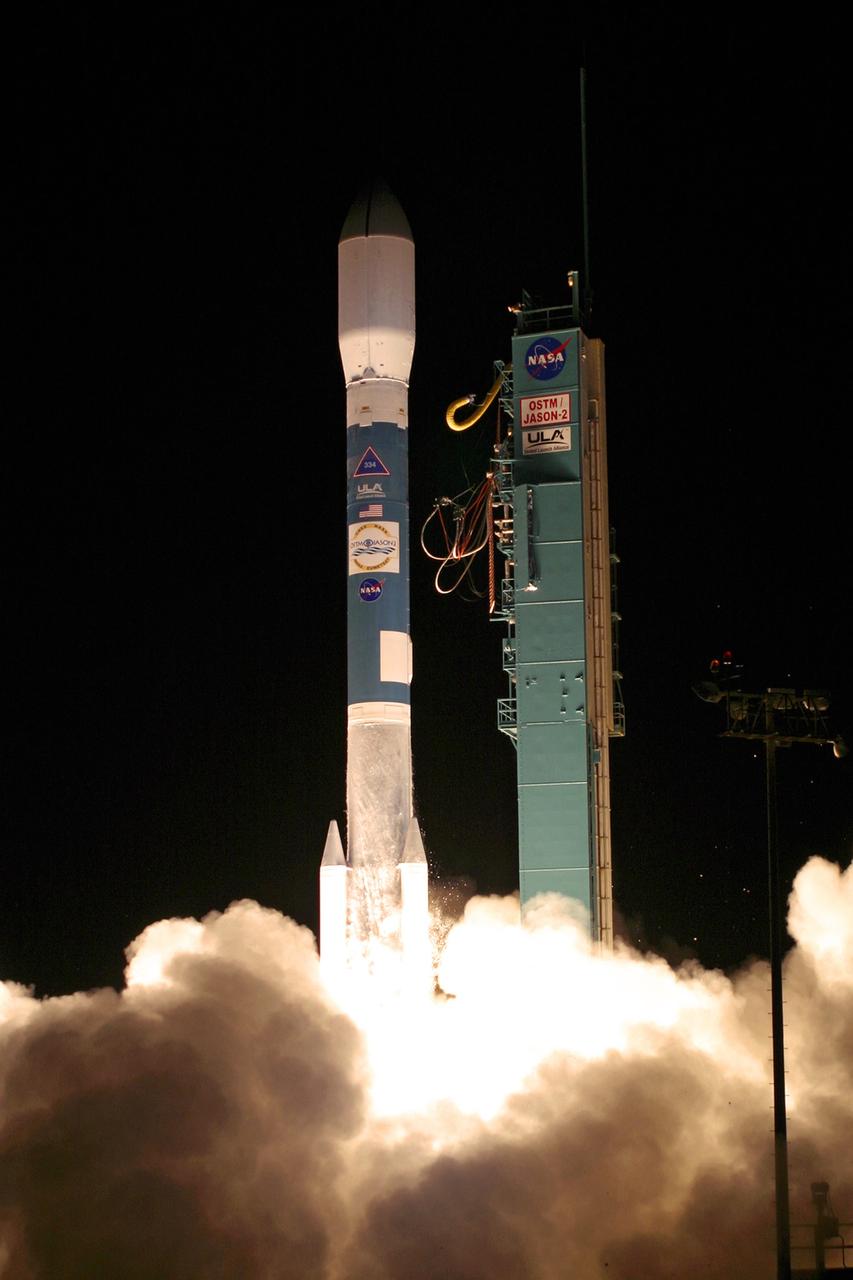
VANDENBERG AIR FORCE BASE, Calif. – Fiery clouds floating over the launch pad signal the liftoff of the Delta II rocket carrying the Ocean Surface Topography Mission, or OSTM/Jason 2, spacecraft. The OSTM/Jason 2 satellite will embark on a globe-circling voyage to continue charting sea level, a vital indicator of global climate change. The mission will return a vast amount of new data that will improve weather, climate and ocean forecasts. OSTM/Jason 2's expected lifetime of at least three years will extend into the next decade the continuous record of these data started in 1992 by NASA and the French space agency Centre National d'Etudes Spatiales, or CNES, with the TOPEX/Poseidon mission. The data collection was continued by the two agencies on Jason-1 in 2001. The launch window extends from 12:46 a.m. to 12:55 a.m. PDT. The satellite will be placed in an 830-mile-high orbit at an inclination of 66 degrees after separating from the Delta II 55 minutes after liftoff. Photo credit: Photograph by Carleton Bailie for United Launch Alliance
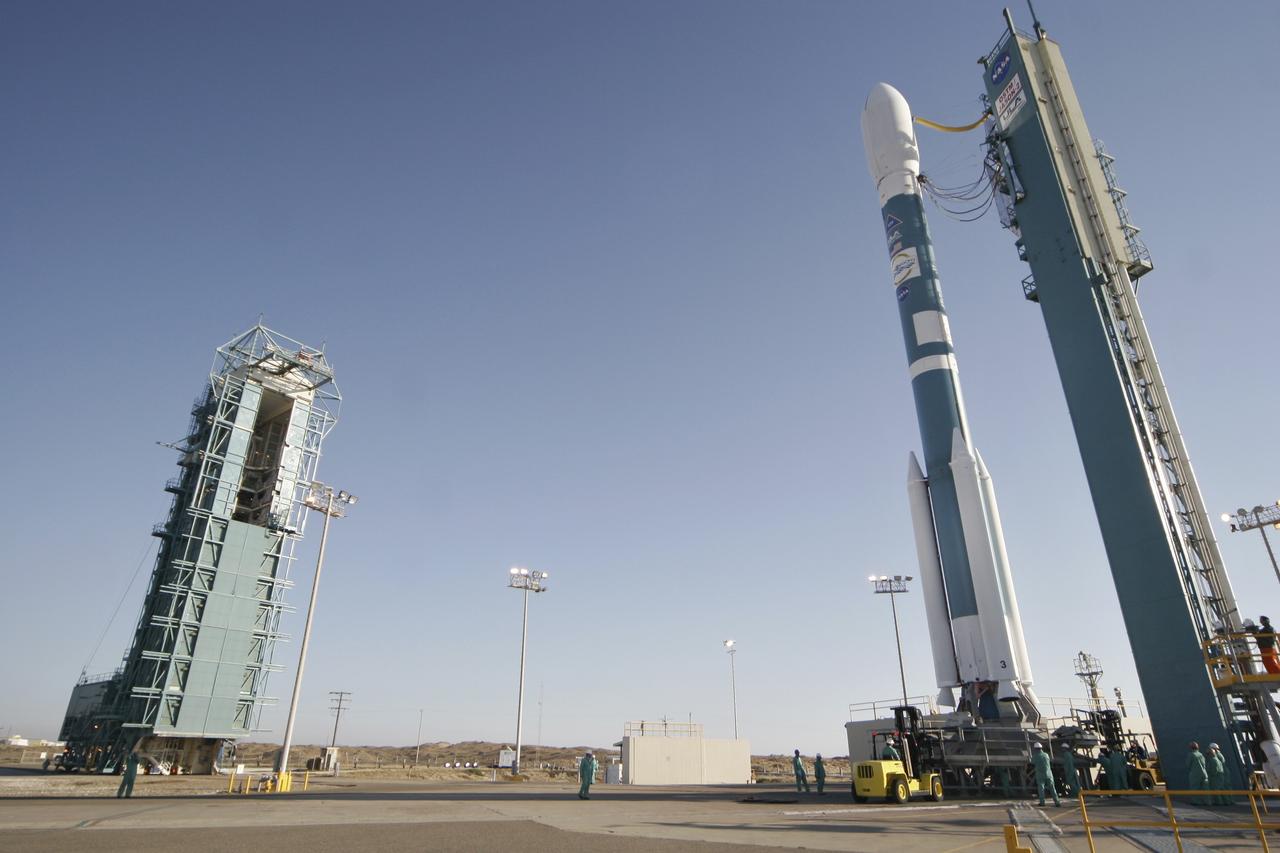
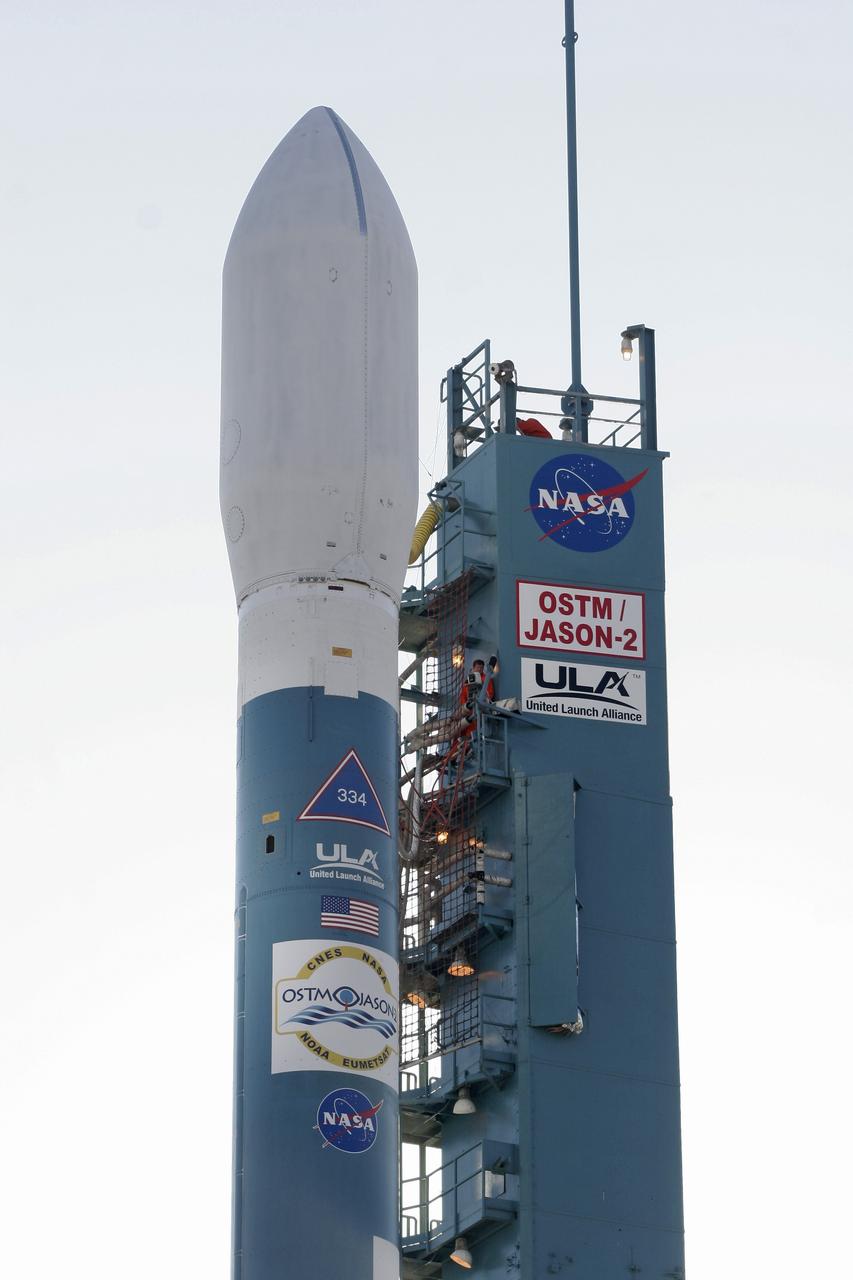
VANDENBERG AIR FORCE BASE, Calif. – The Delta II rocket with the Ocean Surface Topography Mission, or OSTM/Jason 2, aboard is poised for launch on Space Launch Complex 2 after rollback of the mobile service tower (at left). The OSTM/Jason 2 satellite will embark on a globe-circling voyage to continue charting sea level, a vital indicator of global climate change. The mission will return a vast amount of new data that will improve weather, climate and ocean forecasts. OSTM/Jason 2's expected lifetime of at least three years will extend into the next decade the continuous record of these data started in 1992 by NASA and the French space agency Centre National d'Etudes Spatiales, or CNES, with the TOPEX/Poseidon mission. The data collection was continued by the two agencies on Jason-1 in 2001. The launch window extends from 12:46 a.m. to 12:55 a.m. PDT. The satellite will be placed in an 830-mile-high orbit at an inclination of 66 degrees after separating from the Delta II 55 minutes after liftoff. Photo credit: Photograph by Carleton Bailie for United Launch Alliance
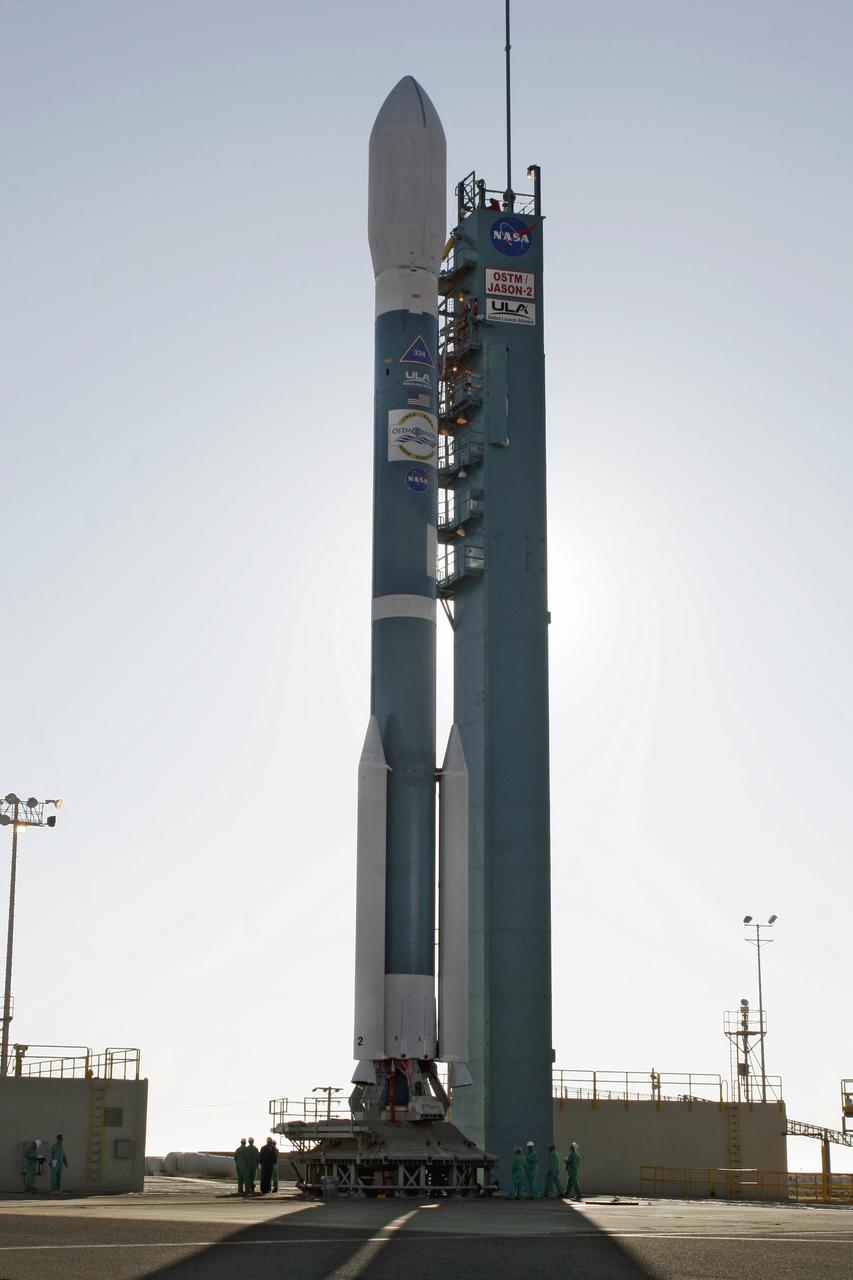
VANDENBERG AIR FORCE BASE, Calif. – The Delta II rocket with the Ocean Surface Topography Mission, or OSTM/Jason 2, aboard is poised for launch on Space Launch Complex 2 after rollback of the mobile service tower. The OSTM/Jason 2 satellite will embark on a globe-circling voyage to continue charting sea level, a vital indicator of global climate change. The mission will return a vast amount of new data that will improve weather, climate and ocean forecasts. OSTM/Jason 2's expected lifetime of at least three years will extend into the next decade the continuous record of these data started in 1992 by NASA and the French space agency Centre National d'Etudes Spatiales, or CNES, with the TOPEX/Poseidon mission. The data collection was continued by the two agencies on Jason-1 in 2001. The launch window extends from 12:46 a.m. to 12:55 a.m. PDT. The satellite will be placed in an 830-mile-high orbit at an inclination of 66 degrees after separating from the Delta II 55 minutes after liftoff. Photo credit: Photograph by Carleton Bailie for United Launch Alliance
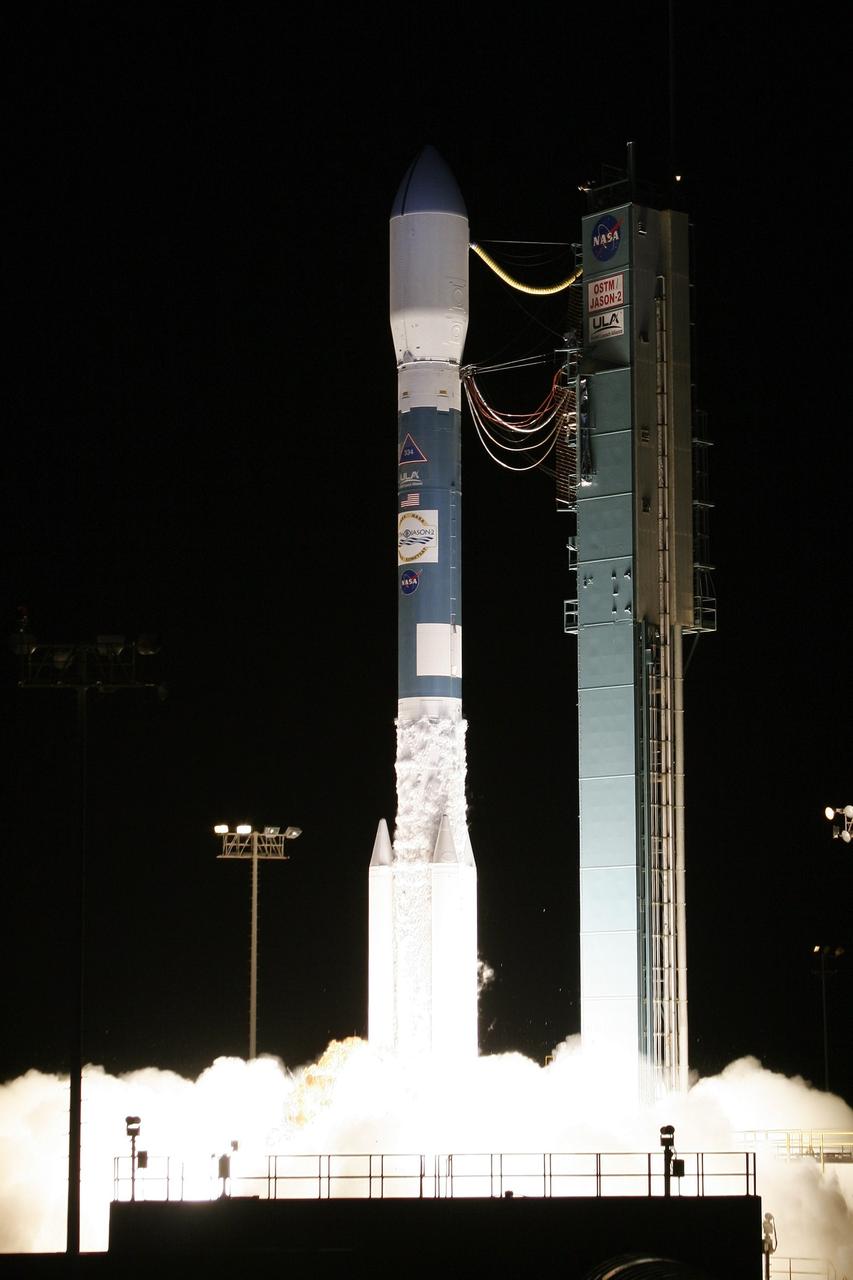
VANDENBERG AIR FORCE BASE, Calif. – Fiery clouds light up Space Launch Complex-2 at the liftoff of the Delta II rocket carrying the Ocean Surface Topography Mission, or OSTM/Jason 2, spacecraft. The OSTM/Jason 2 satellite will embark on a globe-circling voyage to continue charting sea level, a vital indicator of global climate change. The mission will return a vast amount of new data that will improve weather, climate and ocean forecasts. OSTM/Jason 2's expected lifetime of at least three years will extend into the next decade the continuous record of these data started in 1992 by NASA and the French space agency Centre National d'Etudes Spatiales, or CNES, with the TOPEX/Poseidon mission. The data collection was continued by the two agencies on Jason-1 in 2001. The launch window extends from 12:46 a.m. to 12:55 a.m. PDT. The satellite will be placed in an 830-mile-high orbit at an inclination of 66 degrees after separating from the Delta II 55 minutes after liftoff. Photo credit: Photograph by Carleton Bailie for United Launch Alliance
VANDENBERG AIR FORCE BASE, Calif. – Fiery clouds floating over the launch pad on Space Launch Complex-2 signal the liftoff of the Delta II rocket carrying the Ocean Surface Topography Mission, or OSTM/Jason 2, spacecraft. The OSTM/Jason 2 satellite will embark on a globe-circling voyage to continue charting sea level, a vital indicator of global climate change. The mission will return a vast amount of new data that will improve weather, climate and ocean forecasts. OSTM/Jason 2's expected lifetime of at least three years will extend into the next decade the continuous record of these data started in 1992 by NASA and the French space agency Centre National d'Etudes Spatiales, or CNES, with the TOPEX/Poseidon mission. The data collection was continued by the two agencies on Jason-1 in 2001. The launch window extends from 12:46 a.m. to 12:55 a.m. PDT. The satellite will be placed in an 830-mile-high orbit at an inclination of 66 degrees after separating from the Delta II 55 minutes after liftoff. Photo credit: Photograph by Carleton Bailie for United Launch Alliance
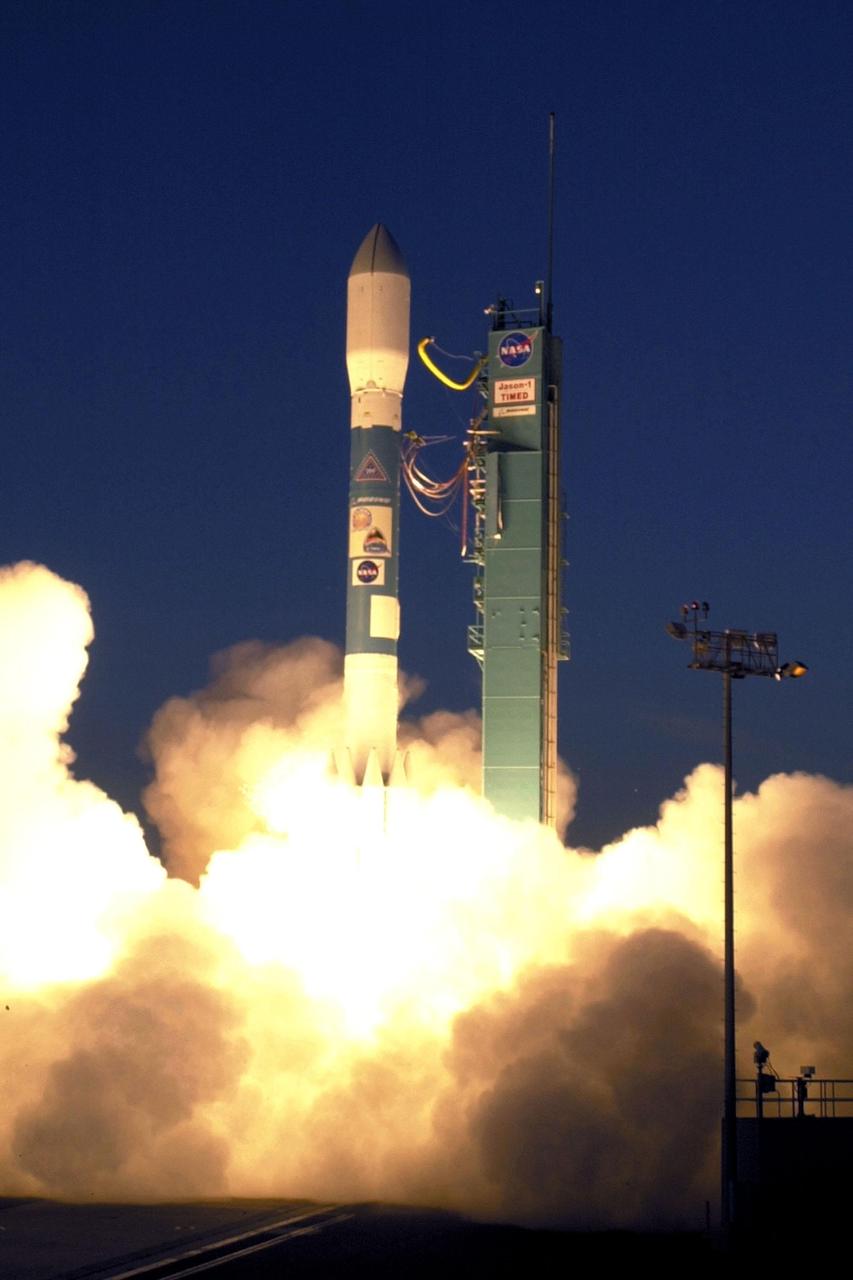
VANDENBERG AIR FORCE BASE, Calif.. -- A Delta rocket leaps off Launch Complex 2W carrying the joint NASA/French Space Agency oceanography satellite Jason 1 and Thermosphere Ionosphere Mesosphere Energetics and Dynamics satellite aboard. Liftoff occurred at 7:07 a.m. PST (10:07 a.m. EST or 15:07 GMT). Jason 1 joins the orbiting Topex/Poseidon satellite to continue observations of the global climate interaction occurring between the sea and the atmosphere as a result of stored solar energy. Instruments on Jason 1 will map variations in ocean surface topography to monitor world ocean circulation, study interactions of the oceans and atmosphere, improve climate predictions and observe events like El Nino. The mission is expected to last three years. The TIMED satellite will study a little-known region above the atmosphere, some 40 to 110 miles from the Earth's surface. Studying this region has been nearly impossible until now because conventional airplanes and balloons cannot reach this high altitude, and it is too low for direct satellite measurements
VANDENBERG AIR FORCE BASE, Calif. – The Delta II rocket with the Ocean Surface Topography Mission, or OSTM/Jason 2, aboard is poised for launch on Space Launch Complex 2 after rollback of the mobile service tower. The OSTM/Jason 2 satellite will embark on a globe-circling voyage to continue charting sea level, a vital indicator of global climate change. The mission will return a vast amount of new data that will improve weather, climate and ocean forecasts. OSTM/Jason 2's expected lifetime of at least three years will extend into the next decade the continuous record of these data started in 1992 by NASA and the French space agency Centre National d'Etudes Spatiales, or CNES, with the TOPEX/Poseidon mission. The data collection was continued by the two agencies on Jason-1 in 2001. The launch window extends from 12:46 a.m. to 12:55 a.m. PDT. The satellite will be placed in an 830-mile-high orbit at an inclination of 66 degrees after separating from the Delta II 55 minutes after liftoff. Photo credit: Photograph by Carleton Bailie for United Launch Alliance
VANDENBERG AIR FORCE BASE, Calif. – Clouds of smoke and steam rise around the Delta II rocket as it lifts off Space Launch Complex-2 with the Ocean Surface Topography Mission, or OSTM/Jason 2, spacecraft aboard. The OSTM/Jason 2 satellite will embark on a globe-circling voyage to continue charting sea level, a vital indicator of global climate change. The mission will return a vast amount of new data that will improve weather, climate and ocean forecasts. OSTM/Jason 2's expected lifetime of at least three years will extend into the next decade the continuous record of these data started in 1992 by NASA and the French space agency Centre National d'Etudes Spatiales, or CNES, with the TOPEX/Poseidon mission. The data collection was continued by the two agencies on Jason-1 in 2001. The launch window extends from 12:46 a.m. to 12:55 a.m. PDT. The satellite will be placed in an 830-mile-high orbit at an inclination of 66 degrees after separating from the Delta II 55 minutes after liftoff. Photo credit: Photograph by Carleton Bailie for United Launch Alliance
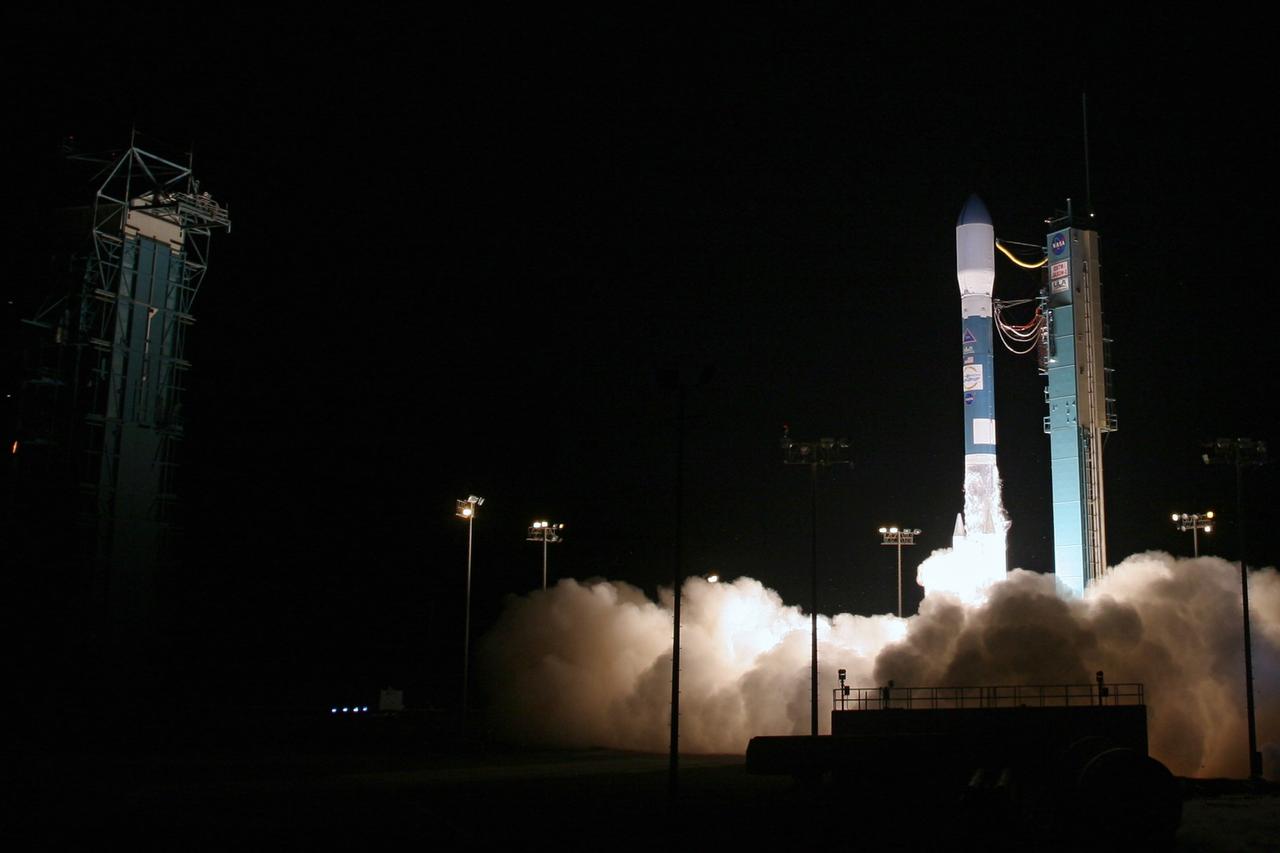
VANDENBERG AIR FORCE BASE, Calif. – Clouds of smoke and steam rise spread across the launch pad on Space Launch Complex-2 as the Delta II rocket lifts off with the Ocean Surface Topography Mission, or OSTM/Jason 2, spacecraft aboard. The OSTM/Jason 2 satellite will embark on a globe-circling voyage to continue charting sea level, a vital indicator of global climate change. The mission will return a vast amount of new data that will improve weather, climate and ocean forecasts. OSTM/Jason 2's expected lifetime of at least three years will extend into the next decade the continuous record of these data started in 1992 by NASA and the French space agency Centre National d'Etudes Spatiales, or CNES, with the TOPEX/Poseidon mission. The data collection was continued by the two agencies on Jason-1 in 2001. The launch window extends from 12:46 a.m. to 12:55 a.m. PDT. The satellite will be placed in an 830-mile-high orbit at an inclination of 66 degrees after separating from the Delta II 55 minutes after liftoff. Photo credit: Photograph by Carleton Bailie for United Launch Alliance

VANDENBERG AIR FORCE BASE, Calif. – The Delta II rocket with the Ocean Surface Topography Mission, or OSTM/Jason 2, aboard is poised for launch on Space Launch Complex 2 after rollback of the mobile service tower. The OSTM/Jason 2 satellite will embark on a globe-circling voyage to continue charting sea level, a vital indicator of global climate change. The mission will return a vast amount of new data that will improve weather, climate and ocean forecasts. OSTM/Jason 2's expected lifetime of at least three years will extend into the next decade the continuous record of these data started in 1992 by NASA and the French space agency Centre National d'Etudes Spatiales, or CNES, with the TOPEX/Poseidon mission. The data collection was continued by the two agencies on Jason-1 in 2001. The launch window extends from 12:46 a.m. to 12:55 a.m. PDT. The satellite will be placed in an 830-mile-high orbit at an inclination of 66 degrees after separating from the Delta II 55 minutes after liftoff. Photo credit: Photograph by Carleton Bailie for United Launch Alliance
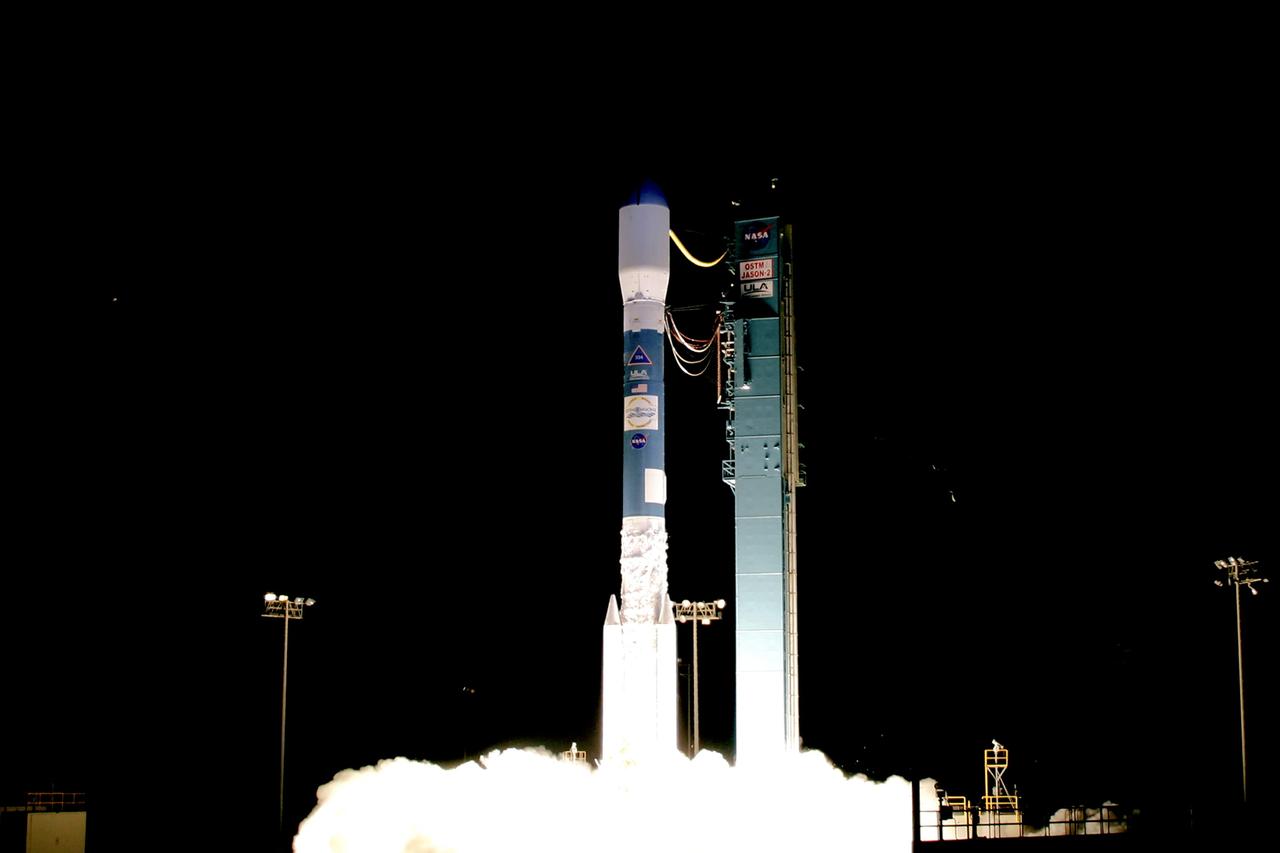
PASADENA, Calif. – The NASA-French space agency Ocean Surface Topography Mission/Jason 2 satellite launched aboard a Delta II rocket from Space Launch Complex 2 at Vandenberg Air Force Base, Calif., at 12:46 a.m. PDT. Fifty-five minutes later, OSTM/Jason 2 separated from the rocket’s second stage, and then, unfurled its twin sets of solar arrays. The OSTM/Jason 2 satellite will embark on a globe-circling voyage to continue charting sea level, a vital indicator of global climate change. The mission will return a vast amount of new data that will improve weather, climate and ocean forecasts. OSTM/Jason 2's expected lifetime of at least three years will extend into the next decade the continuous record of these data started in 1992 by NASA and the French space agency Centre National d'Etudes Spatiales, or CNES, with the TOPEX/Poseidon mission. The data collection was continued by the two agencies on Jason 1 in 2001. Photo credit: Carleton Bailie photograph for United Launch Alliance

Over the past 30 years, global average sea level has risen a total of 3.6 inches (9.1 centimeters), as indicated in this graphic, which is based on sea level measurements (in blue) from five successive satellites starting with the U.S.-French TOPEX/Poseidon mission in 1993. The solid red line shows the trajectory of sea level rise from 1993 to 2022, while the dotted red line shows the increase sea level into the future. Researchers can take the solid red line and calculate the rate of sea level rise, which was 0.08 inches (0.20 centimeters) per year in 1993 and doubled to 0.17 inches (0.44 centimeters) per year by 2022. The dotted red line shows that by 2040, sea levels may rise by an additional 3.66 inches (9.3 cm) above 2022 levels. The trajectory shown in the solid and dotted red line is based on work by the NASA Sea Level Change Team and the Ocean Surface Topography Science Team. https://photojournal.jpl.nasa.gov/catalog/PIA25775
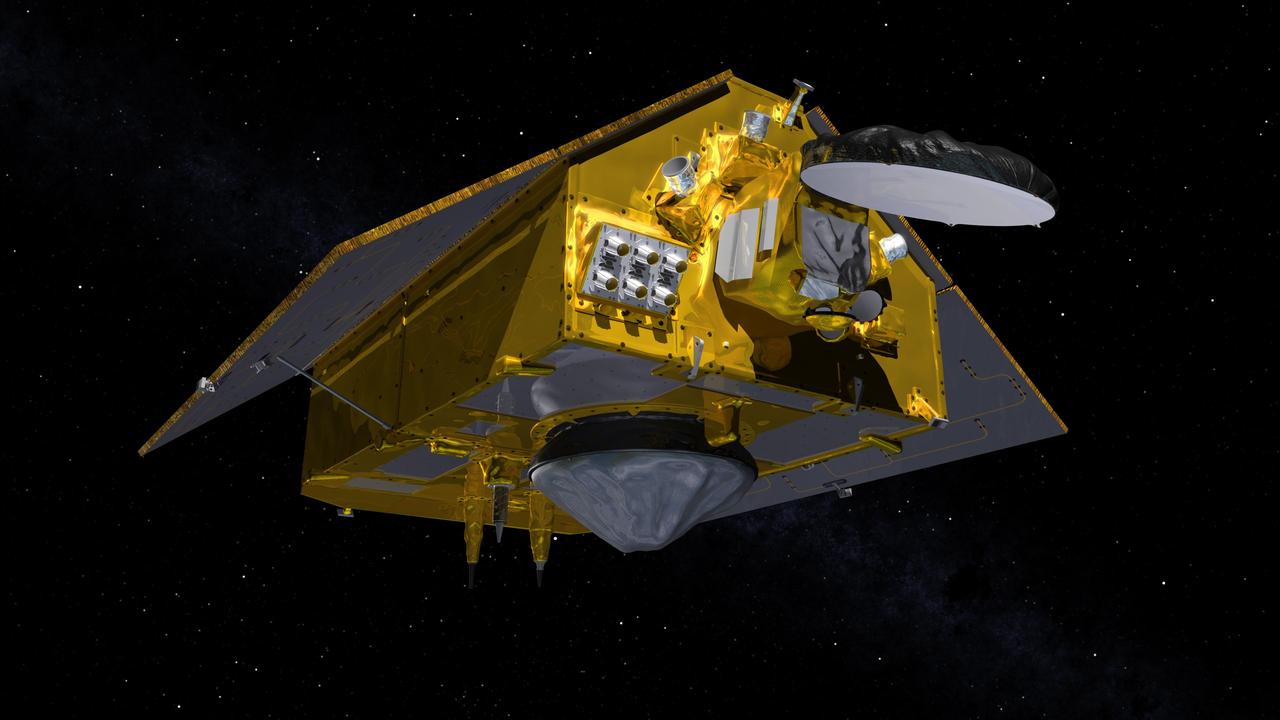
This illustration shows the front of the Sentinel-6 Michael Freilich spacecraft in orbit above Earth with its deployable solar panels extended. As the world's latest ocean-monitoring satellite, it is launching on Nov. 10, 2020, to collect the most accurate data yet on global sea level and how our oceans are rising in response to climate change. The mission will also collect precise data of atmospheric temperature and humidity that will help improve weather forecasts and climate models. The conelike instrument on the bottom (Earth-facing side) of the spacecraft is the satellite's Poseidon-4 radar altimeter. The disklike instrument at the front of the spacecraft is the Advanced Microwave Radiometer (AMR-C). Both instruments will be used together to measure ocean surface height. The gray rectangle with six cones attached at the front-left of the spacecraft is part of the Global Navigation Satellite System - Radio Occultation (GNSS-RO) instrument. Sentinel-6 Michael Freilich extends the near-30-year record of satellite measurements of sea level initiated by the U.S.-European TOPEX/Poseidon mission in 1992 and that continued with the Jason-1, 2, and 3 series of sea level observation satellites. Launched in 2016, Jason-3 is currently providing data. The satellite is named after Dr. Michael Freilich, the former director of NASA's Earth Science Division and an instrumental figure in advancing ocean observations from space. Sentinel-6 Michael Freilich is one of two identical spacecraft that compose the Sentinel-6/Jason-CS (Continuity of Service) mission developed in partnership with ESA (the European Space Agency). Other partners include the National Oceanic and Atmospheric Administration (NOAA), the intergovernmental European Organisation for the Exploitation of Meteorological Satellites (EUMETSAT), and France's National Centre for Space Studies (CNES). ESA is developing the new Sentinel family of missions to support the operational needs of the European Union's Copernicus program, the EU's Earth observation program managed by the European Commission. The spacecraft's twin, Sentinel-6B, will launch in 2025. https://photojournal.jpl.nasa.gov/catalog/PIA24106
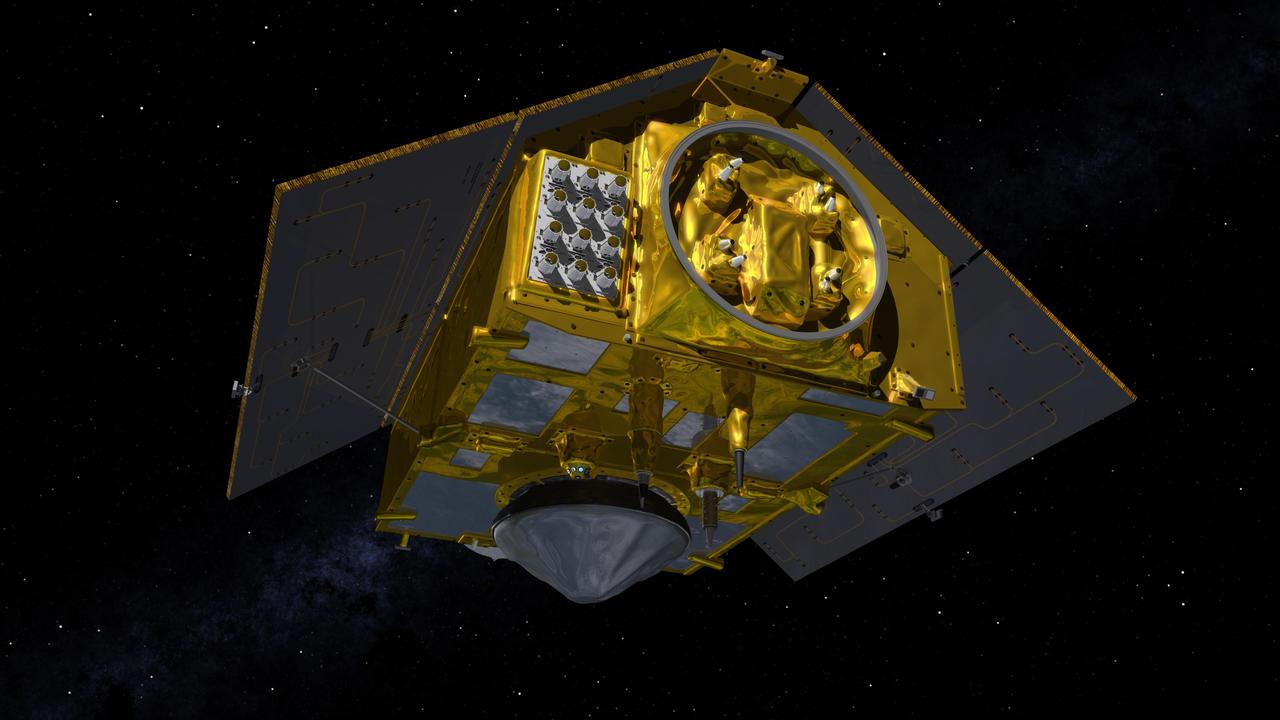
This illustration shows the rear of the Sentinel-6 Michael Freilich spacecraft in orbit above Earth with its deployable solar panels extended. As the world's latest ocean-monitoring satellite, it is launching on Nov. 10, 2020, to collect the most accurate data yet on global sea level and how our oceans are rising in response to climate change. The mission will also collect precise data of atmospheric temperature and humidity that will help improve weather forecasts and climate models. The conelike instrument on the bottom (Earth-facing side) of the spacecraft is the satellite's Poseidon-4 radar altimeter. When used with the Advanced Microwave Radiometer (AMR-C) attached to the front of the spacecraft, both instruments will be used to make precise measurements of sea surface height. The gray rectangle with 12 cones attached at the rear-left of the spacecraft is part of the Global Navigation Satellite System - Radio Occultation (GNSS-RO) instrument. Sentinel-6 Michael Freilich extends the near-30-year record of satellite measurements of sea level initiated by the U.S.-European TOPEX/Poseidon mission in 1992 and that continued with the Jason-1, 2, and 3 series of sea level observation satellites. Launched in 2016, Jason-3 is currently providing data. The satellite is named after Dr. Michael Freilich, the former director of NASA's Earth Science Division and an instrumental figure in advancing ocean observations from space. Sentinel-6 Michael Freilich is one of two identical spacecraft that compose the Sentinel-6/Jason-CS (Continuity of Service) mission developed in partnership with ESA (the European Space Agency). Other partners include the National Oceanic and Atmospheric Administration (NOAA), the intergovernmental European Organisation for the Exploitation of Meteorological Satellites (EUMETSAT), and France's National Centre for Space Studies (CNES). ESA is developing the new Sentinel family of missions to support the operational needs of the European Union's Copernicus program, the EU's Earth observation program managed by the European Commission. The spacecraft's twin, Sentinel-6B, will launch in 2025. https://photojournal.jpl.nasa.gov/catalog/PIA24107
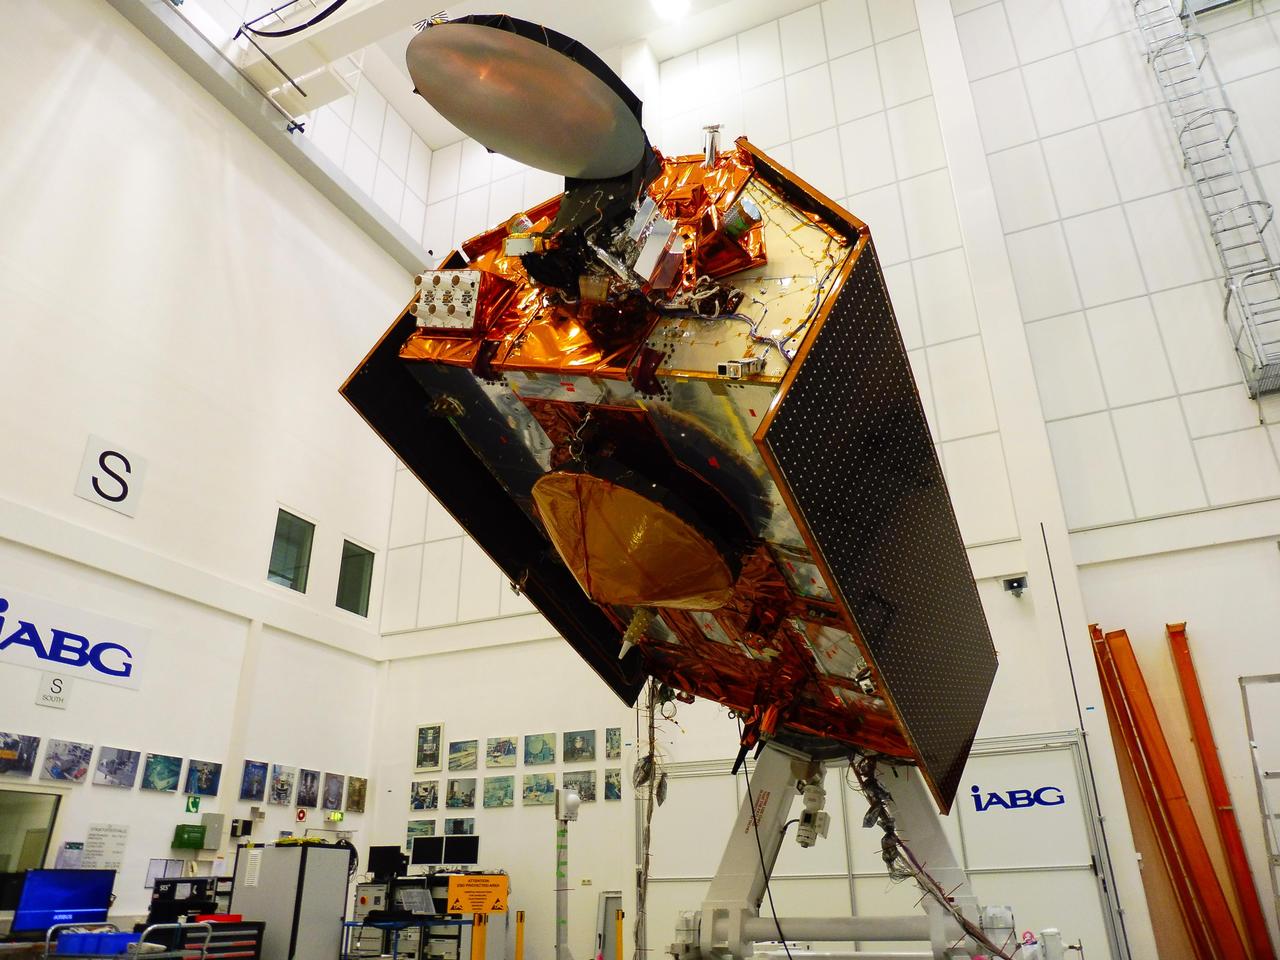
The Sentinel-6A spacecraft sits in its clean room in Germany's IABG space test center. The satellite is being prepared for a scheduled launch in November 2020 from Vandenberg Air Force Base in California. The spacecraft is part of Sentinel-6/Jason-CS, a 10-year mission by U.S and European agencies that will continue to study rising sea levels. The mission consists of two identical satellites, Sentinel-6A and Sentinel-6B, launching five years apart and follows in the footsteps of four other joint U.S.-European satellite missions — TOPEX/Poseidon and Jason-1, Ocean Surface Topography/Jason-2, and Jason-3 — that over the past three decades have documented Earth's oceans rising by an average of 0.1 inches (3 millimeters) per year. Sentinel-6/Jason-CS will study not just sea level change but also changes in ocean circulation, climate variability such as El Niño and La Niña, and weather patterns, including hurricanes and storms. It is being jointly developed by the European Space Agency (ESA), the European Organisation for the Exploitation of Meteorological Satellite (EUMETSAT), NASA and the National Oceanic and Atmospheric Administration (NOAA) with funding support from the European Commission and support from France's National Centre for Space Studies (CNES). NASA's contributions to the Sentinel-6 mission are science instrument payloads for the two Sentinel-6 satellites, launch services for those satellites, ground systems supporting the science instruments operations and support for the international Ocean Surface Topography Science Team. https://photojournal.jpl.nasa.gov/catalog/PIA23549
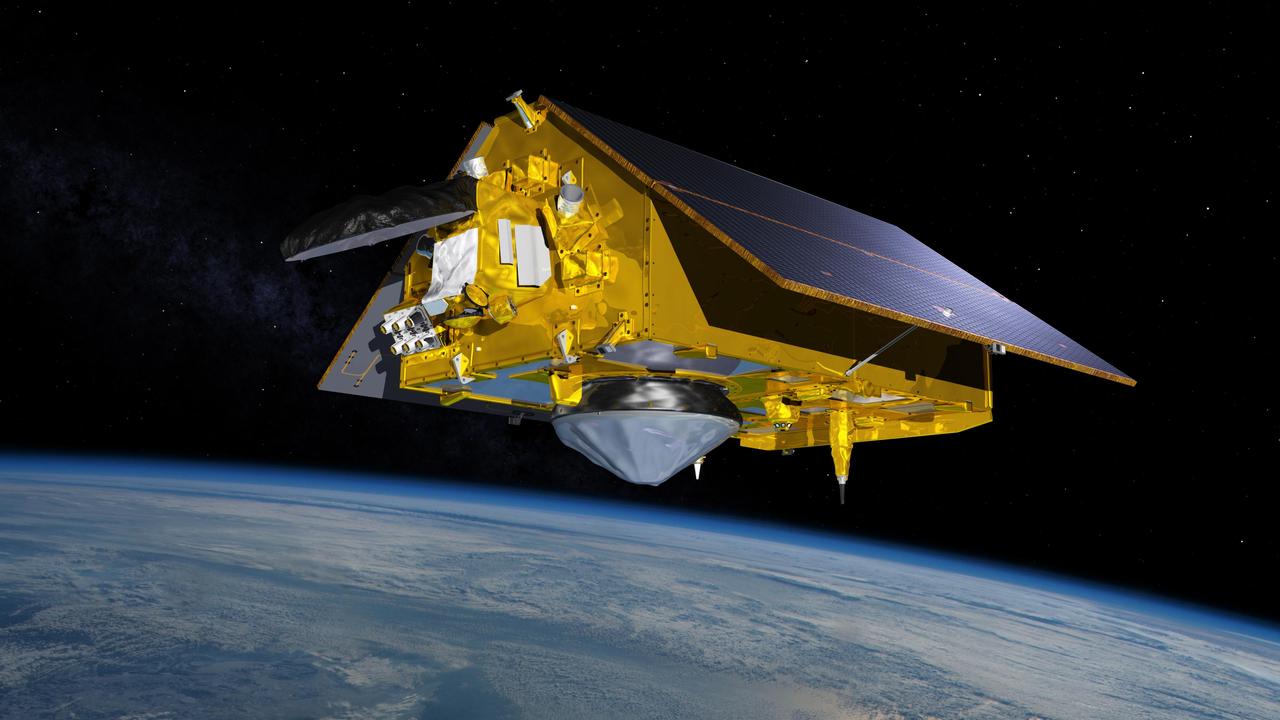
This illustration shows the Sentinel-6 Michael Freilich spacecraft in orbit above Earth with its deployable solar panels extended. As the world's latest ocean-monitoring satellite, it will collect the most accurate data yet on global sea level and how our oceans are rising in response to climate change. The mission will also collect precise data of atmospheric temperature and humidity that will help improve weather forecasts and climate models. Sentinel-6 Michael Freilich extends the near-30-year record of satellite measurements of sea level that was initiated by the U.S.-European TOPEX/Poseidon mission in 1992 and continued with the Jason-1, 2, and 3 series of sea level observation satellites. Launched in 2016, Jason-3 is currently providing data. The satellite is named after Dr. Michael Freilich, the former director of NASA's Earth Science Division and an instrumental figure in advancing ocean observations from space. Sentinel-6 Michael Freilich is one of two identical spacecraft that compose the Sentinel-6/Jason-CS (Continuity of Service) mission developed in partnership with ESA (the European Space Agency). Other partners include the National Oceanic and Atmospheric Administration (NOAA), the intergovernmental European Organisation for the Exploitation of Meteorological Satellites (EUMETSAT), and France's National Centre for Space Studies (CNES). ESA is developing the new Sentinel family of missions to support the operational needs of the European Union's Copernicus program, the EU's Earth observation program managed by the European Commission. The spacecraft's twin, Sentinel-6B, will launch in 2025. https://photojournal.jpl.nasa.gov/catalog/PIA24105
This map shows sea level measured by the Sentinel-6 Michael Freilich satellite from June 5 to15. Red areas are regions where sea level is higher than normal, and blue areas indicate areas where it's lower than normal. The measurements are part of a set of data streams that become available to the public hours to a couple of days after the satellite collects them. The difference in when the products become available balances accuracy with delivery timeliness for tasks like forecasting the weather or helping to monitor the formation of hurricanes. The satellite, named after former NASA Earth Science Division Director Michael Freilich, collects its measurements for about 90% of the world's oceans. The spacecraft is one of two satellites that compose the Copernicus Sentinel-6/Jason-CS (Continuity of Service) mission. The second satellite, Sentinel-6B, is slated for launch in 2025. Together, they are the latest in a series of spacecraft starting with TOPEX/Poseidon in 1992 and continuing with the Jason series of satellites that have been gathering precise ocean height measurements for nearly 30 years. Shortly after launch in Nov. 2020, Sentinel-6 Michael Freilich moved into position, trailing the current reference sea level satellite Jason-3 by 30 seconds. Scientists and engineers then spent time cross-calibrating the data collected by both satellites to ensure the continuity of measurements between the two. Once assured of the data quality, Sentinel-6 Michael Freilich will then become the primary sea level satellite. https://photojournal.jpl.nasa.gov/catalog/PIA24533

This animation, created in 2012, shows the increasing clarity and detail of measurements of sea height made by successive satellite altimeters launched by NASA and other agencies over the past four decades, concluding with data at the resolution possible with the Surface Water and Ocean Topography (SWOT) satellite, expected to launch in December 2022. Each new spacecraft has been able to obtain higher-resolution observations than its predecessors. Sea height is key to understanding how much, and how fast, the oceans are rising in a warming climate. The animation starts with Seasat, launched in 1978 as one of the NASA's earliest Earth-observing satellites, then moves to Geosat, a U.S. Navy spacecraft launched in 1985, and on to ERS-1, TOPEX/Poseidon, ERS-2, Jason-1, Envisat, and Jason-2. Since the end of the time period shown in the animation, subsequent satellites have continued measuring sea height, creating an ongoing, decadeslong record. In March 2022, Sentinel-6 Michael Freilich, a joint U.S.-European mission, became the official reference satellite for global sea level measurements. SWOT will be latest spacecraft to observe ocean heights from Earth orbit. Its measurements will provide unprecedented insights into the activity of small-scale currents and their impact on climate change. Researchers believe small-scale currents, which are less than 60 miles (100 kilometers) in size, have a significant influence on the ocean's ability to absorb atmospheric heat and carbon and thereby moderate global temperature change. To measure these currents, SWOT will employ the Ka-band Radar Interferometer (KaRIn), a new technology developed at NASA's Jet Propulsion Laboratory in Southern California that will offer even greater spatial resolution than previous instruments that studied the ocean. SWOT will survey the water in Earth's lakes, rivers, reservoirs, and the ocean. The satellite will cover the planet's surface twice every 21 days and has a prime mission of three years. It was jointly developed by NASA and France's Centre National d'Études Spatiales (CNES), with contributions from the Canadian Space Agency (CSA) and the UK Space Agency. JPL, a division of Caltech in Southern California, manages the U.S. portion of the mission for NASA. Animation available at https://photojournal.jpl.nasa.gov/catalog/PIA25561

VANDENBERG AIR FORCE BASE, Calif. – A prelaunch news conference is held on North Vandenberg Air Force Base to present the latest information about the Ocean Surface Topography Mission, or OSTM/Jason 2. Seated from left are the moderator George Diller; Steve Neeck, OSTM/Jason 2 program executive; Omar Baez, NASA launch director at NASA's Kennedy Space Center; Kris Walsh, director of NASA and commercial programs for, United Launch Alliance; Parag Vaze, OSTM/Jason 2 project manager at the NASA's Jet Propulsion Laboratory; and Capt. Andrew M. Frey, launch weather officer with the 30th Weather Squadron. The OSTM/Jason 2 satellite will embark on a globe-circling voyage to continue charting sea level, a vital indicator of global climate change. The mission will return a vast amount of new data that will improve weather, climate and ocean forecasts. OSTM/Jason 2's expected lifetime of at least three years will extend into the next decade the continuous record of these data started in 1992 by NASA and the French space agency Centre National d'Etudes Spatiales, or CNES, with the TOPEX/Poseidon mission. The data collection was continued by the two agencies on Jason-1 in 2001. The launch window extends from 12:46 a.m. to 12:55 a.m. PDT. The satellite will be placed in an 830-mile-high orbit at an inclination of 66 degrees after separating from the Delta II 55 minutes after liftoff. Photo credit: Photograph by Carleton Bailie for United Launch Alliance
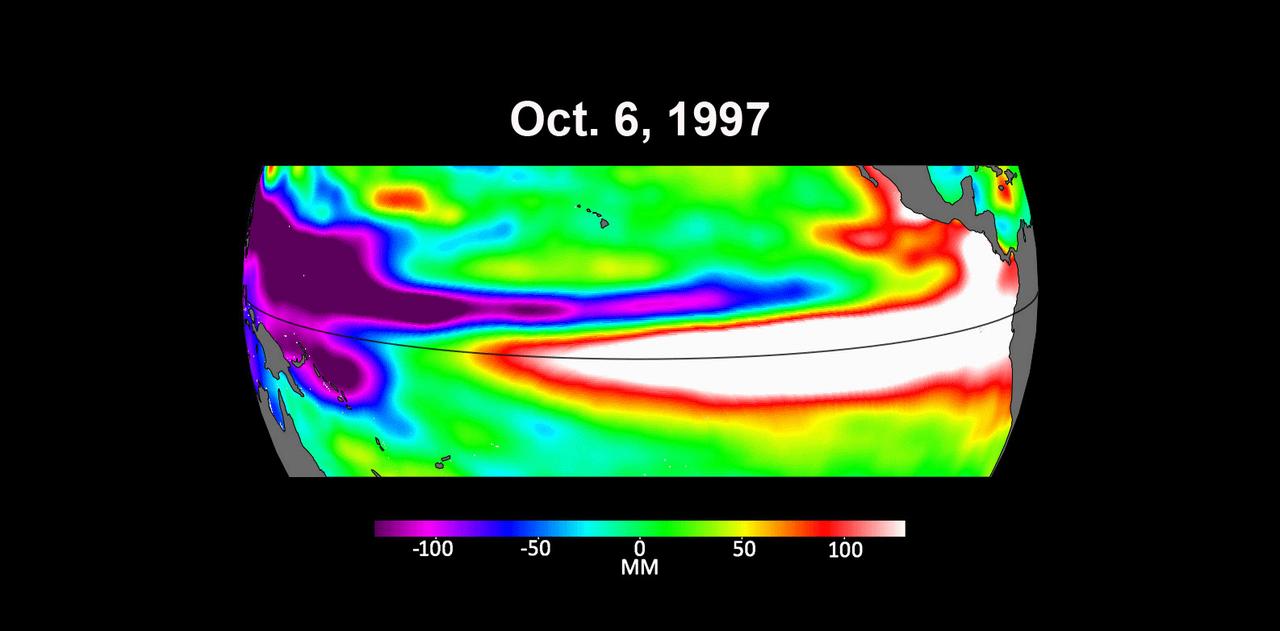
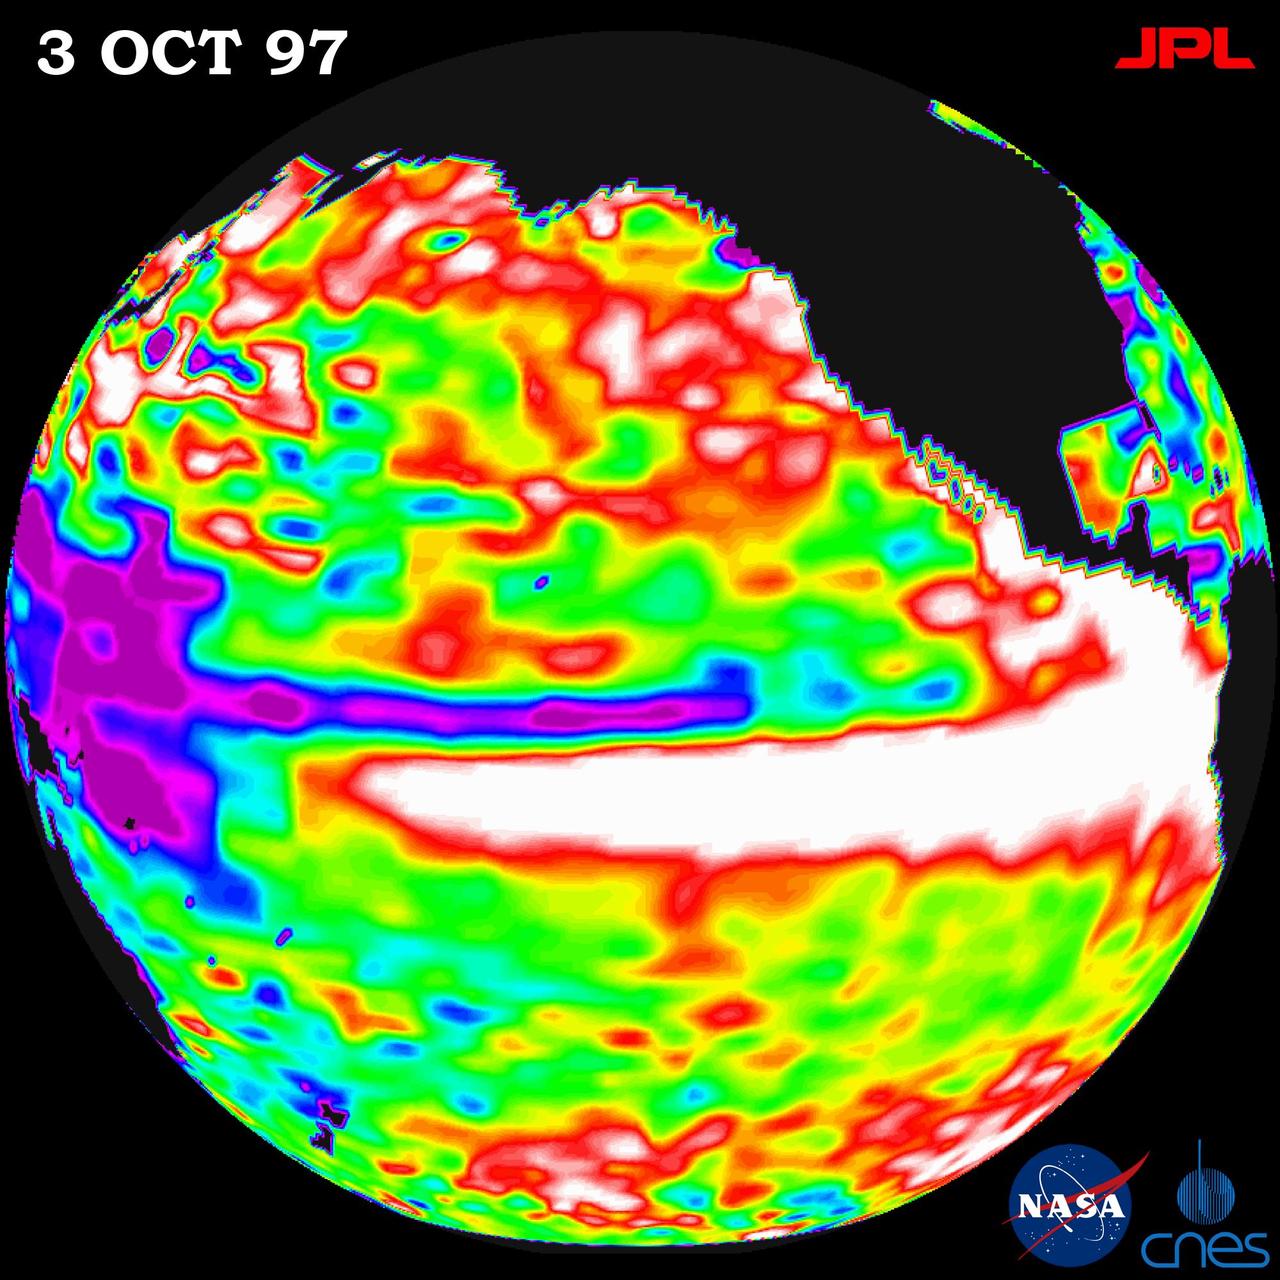
These three maps based on satellite data show sea levels in the Pacific Ocean during developing El Niño events in early October of 1997, 2015, and 2023. Higher-than-average ocean heights are shown in red and white, while lower-than-average heights are blue and purple. The two earlier maps represent the two extreme El Niño events from the past 30 years – the first from 1997 to 1998 and the second from 2015 to 2016. Both caused shifts in global air and ocean temperatures, atmospheric wind and rainfall patterns, and sea level. El Niños are characterized by higher-than-normal sea levels and warmer-than-average ocean temperatures along the equatorial Pacific. Water expands as it warms, so sea levels tend to be higher in places with warmer water. These temperature and sea level conditions can then propagate poleward along the western coasts of the Americas. El Niños can bring wetter conditions to the U.S. Southwest and drought to regions in the western Pacific, including Indonesia. Not all El Niño events are created equal, however, and their impacts vary widely. Satellites like the U.S.-European Sentinel-6 Michael Freilich, which captured the 2023 data, help anticipate those impacts on a global scale by tracking changes in sea surface height in the Pacific Ocean. The TOPEX/Poseidon satellite collected the 1997 data while Jason-2 collected data for the 2015 event. This year's El Niño is still developing, but researchers are looking to the recent past for clues as to how it is shaping up. By October 1997 and 2015, large areas of the central and eastern Pacific had sea levels more than 7 inches (18 centimeters) higher than normal. This year, sea levels are about 2 or 3 inches (5 to 8 centimeters) higher than normal and are elevated over a smaller area compared to the 1997 and 2015 events. Both of the past El Niños reached peak strength in late November or early December, so this year's event may still intensify. Launched in November 2020, Sentinel-6 Michael Freilich is named after former NASA Earth Science Division Director Michael Freilich. The satellite is one of two that compose the Copernicus Sentinel-6/Jason-CS (Continuity of Service) mission. Animation available at https://photojournal.jpl.nasa.gov/catalog/PIA26099