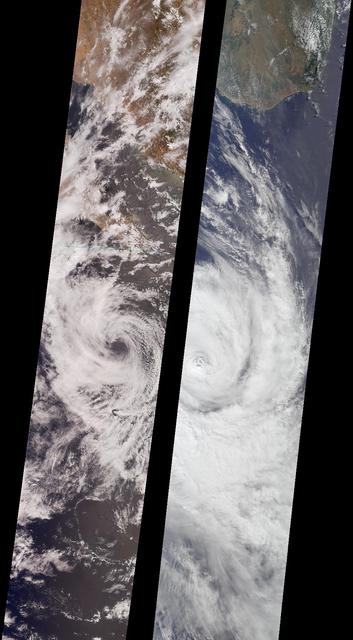
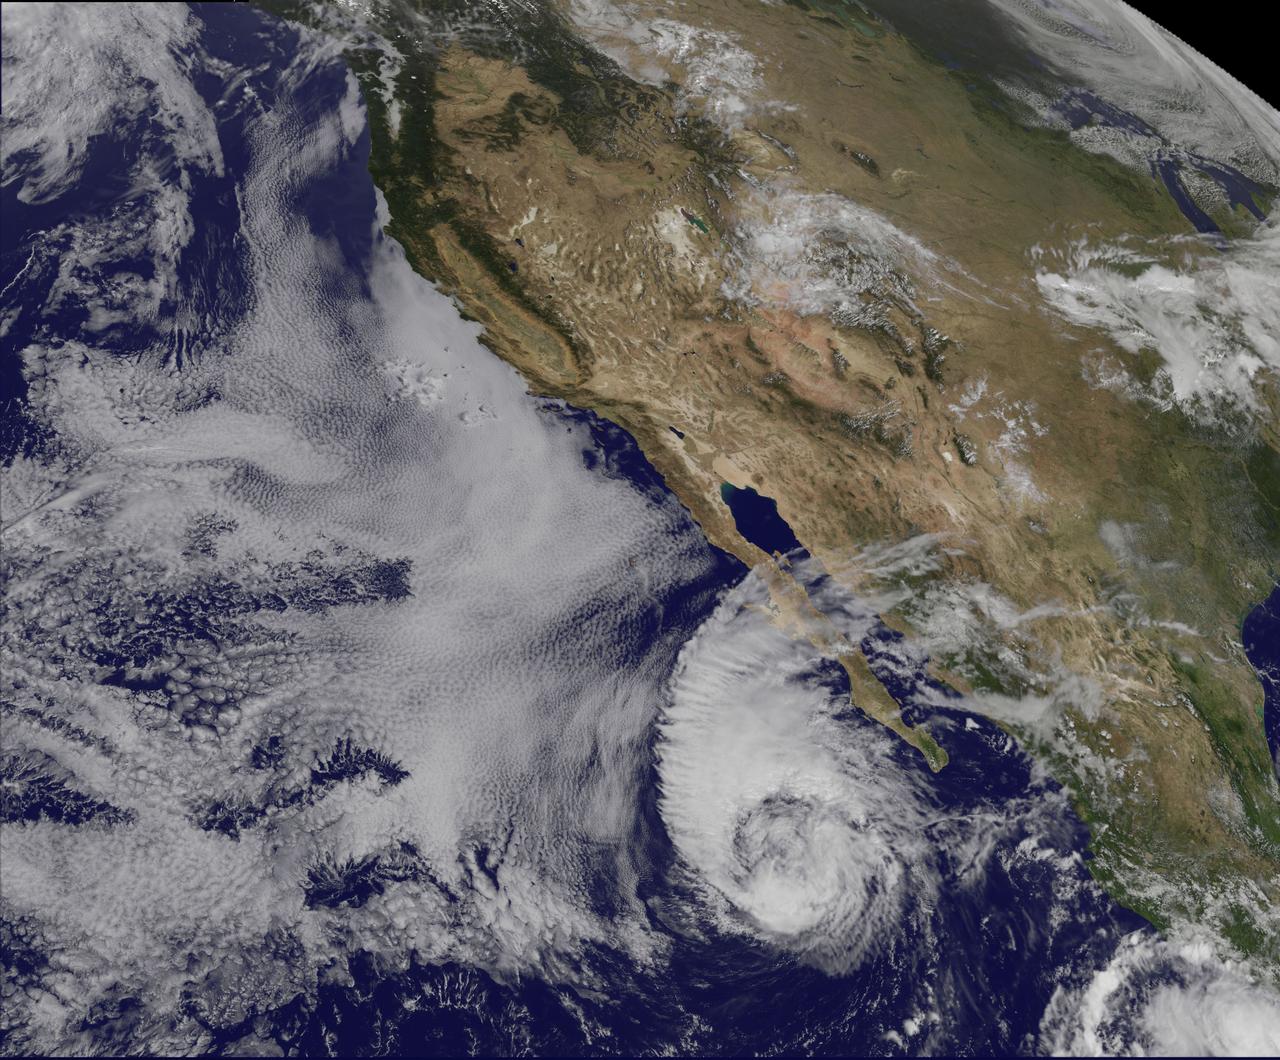
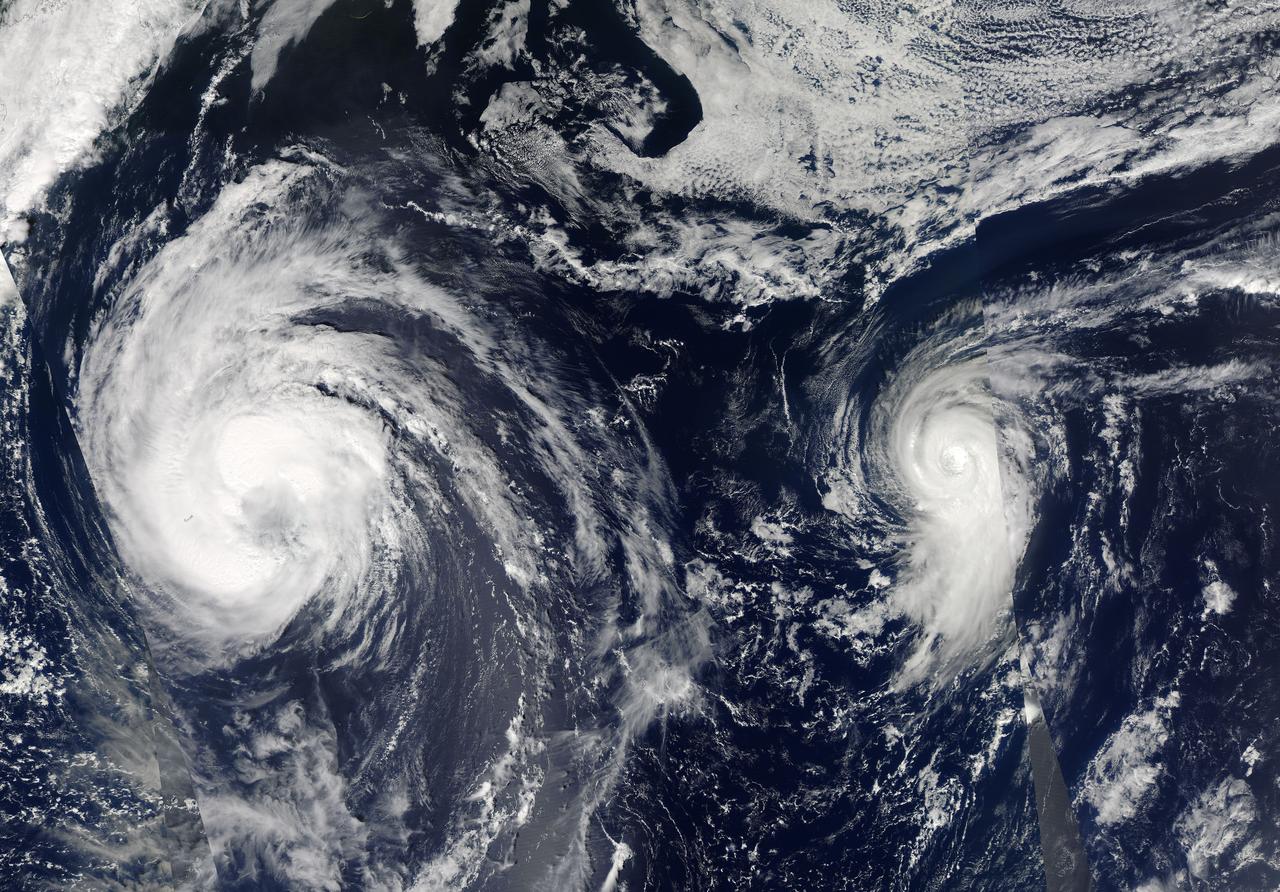
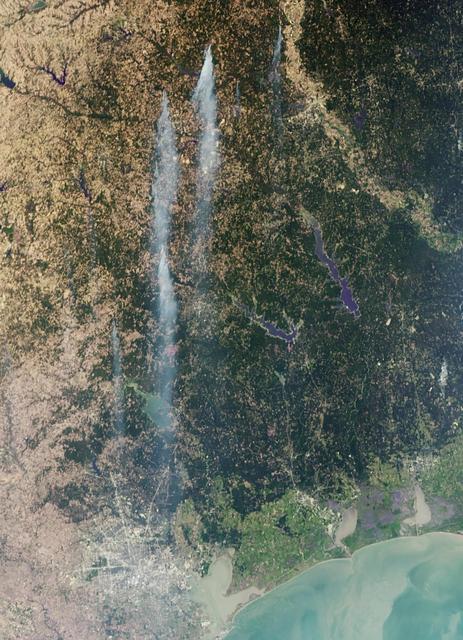
Like dancers pirouetting in opposite directions, the rotational patterns of two different tropical storms are contrasted in this pair of MISR nadir-camera images. The left-hand image is of Tropical Storm Bud, acquired on June 17, 2000 (Terra orbit 2656) as the storm was dissipating. Bud was situated in the eastern Pacific Ocean between Socorro Island and the southern tip of Baja California. South of the storm's center is a vortex pattern caused by obstruction of the prevailing flow by tiny Socorro Island. Sonora, Mexico and Baja California are visible at the top of the image. The right-hand image is of Tropical Cyclone Dera, acquired on March 12, 2001 (Terra orbit 6552). Dera was located in the Indian Ocean, south of Madagascar. The southern end of this large island is visible in the top portion of this image. Northern hemisphere tropical storms, like Bud, rotate in a counterclockwise direction, whereas those in the southern hemisphere, such as Dera, rotate clockwise. The opposite spins are a consequence of Earth's rotation. Each image covers a swath approximately 380 kilometers wide. http://photojournal.jpl.nasa.gov/catalog/PIA03400
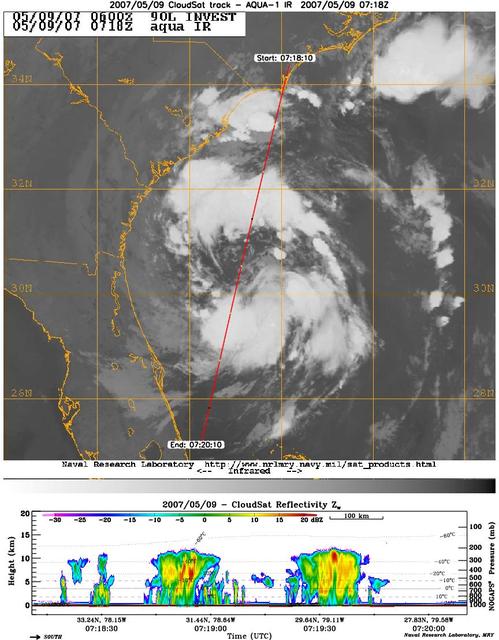
CloudSat's Cloud Profiling Radar captured a profile across Tropical Storm Andrea on Wednesday, May 9, 2007, near the South Carolina/Georgia/Florida Atlantic coast. The upper image shows an infrared view of Tropical Storm Andrea from the Moderate Resolution Imaging Spectroradiometer instrument on NASA's Aqua satellite, with CloudSat's ground track shown as a red line. The lower image is the vertical cross section of radar reflectivity along this path, where the colors indicate the intensity of the reflected radar energy. CloudSat orbits approximately one minute behind Aqua in a satellite formation known as the A-Train. http://photojournal.jpl.nasa.gov/catalog/PIA09379
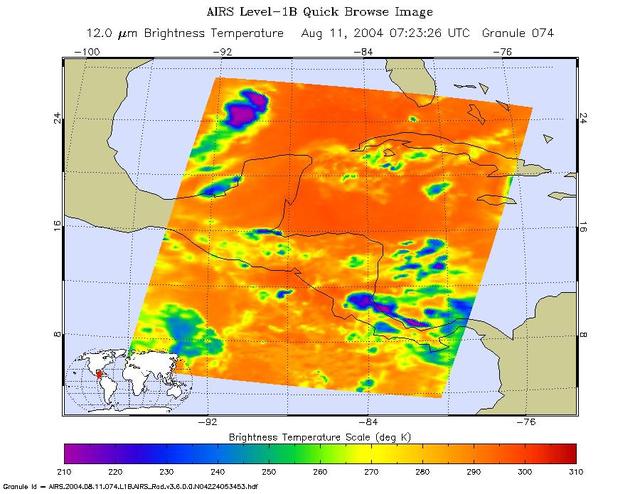
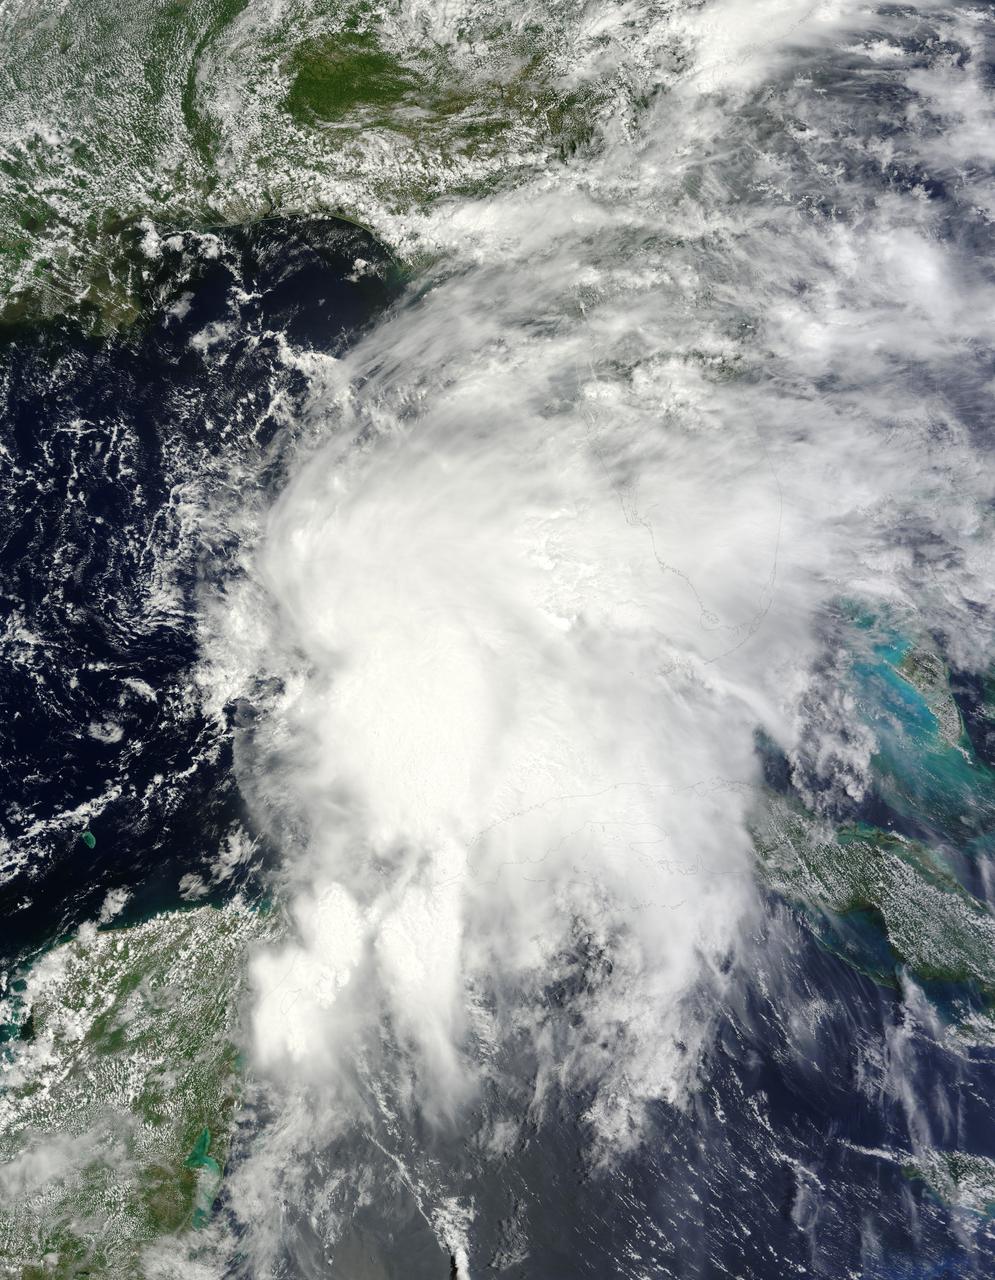
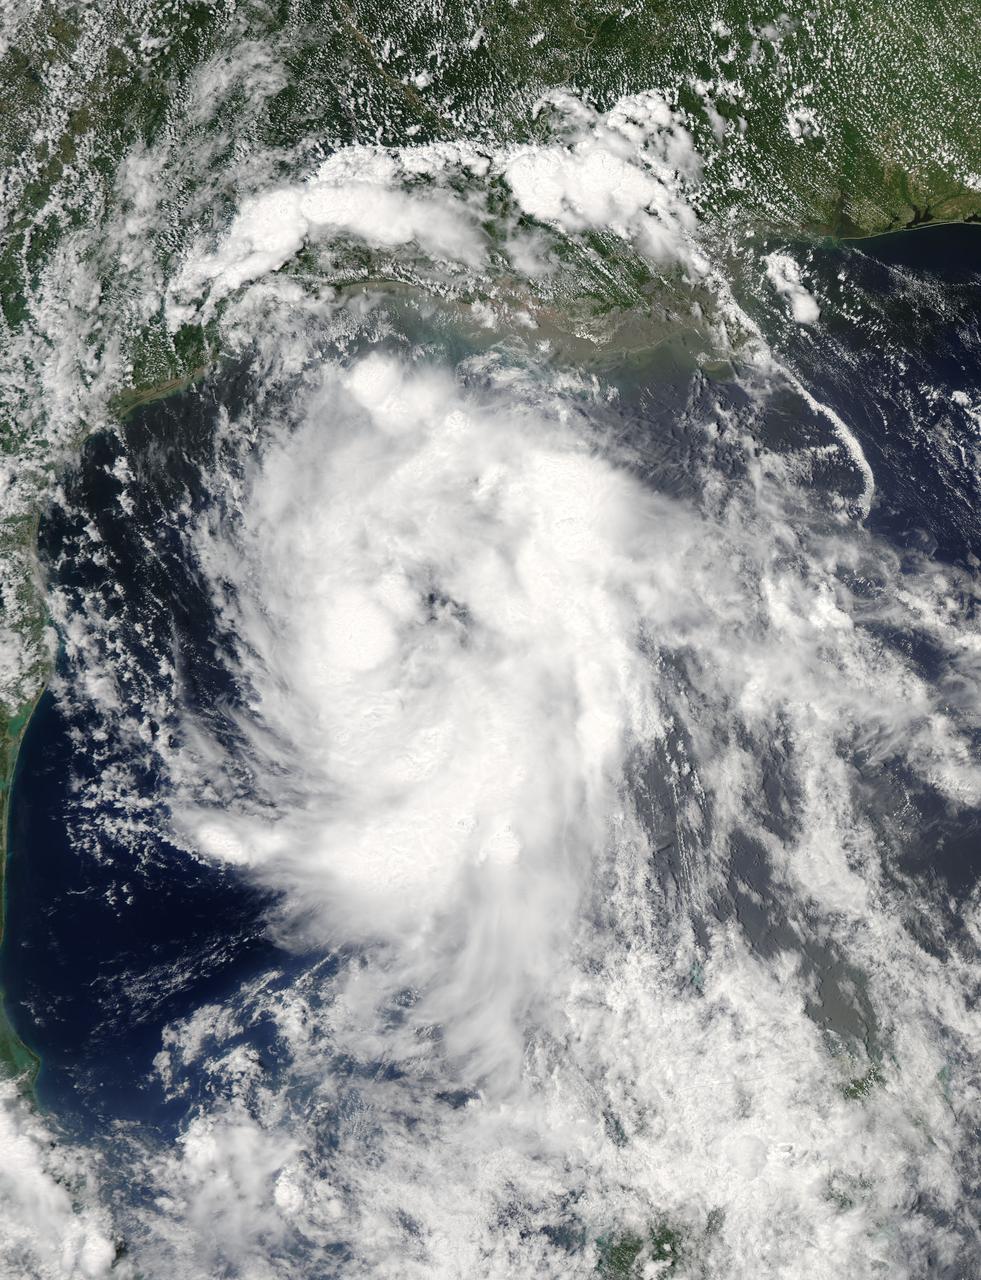
Tropical storm Bonnie, Gulf of Mexico, captured on August 11 at 1:30am CDT. Located in the Gulf of Mexico, the center of the storm is positioned about 280 miles south-southwest of the mouth of the Mississippi River. Bonnie is a small tropical storm with wind speeds sustained at 45 mph and extending 30 miles from the storm center. It is moving northward at 5 mph. http://photojournal.jpl.nasa.gov/catalog/PIA00441
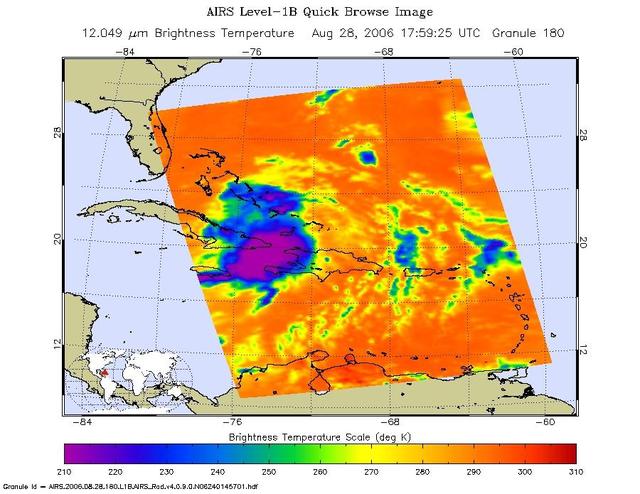
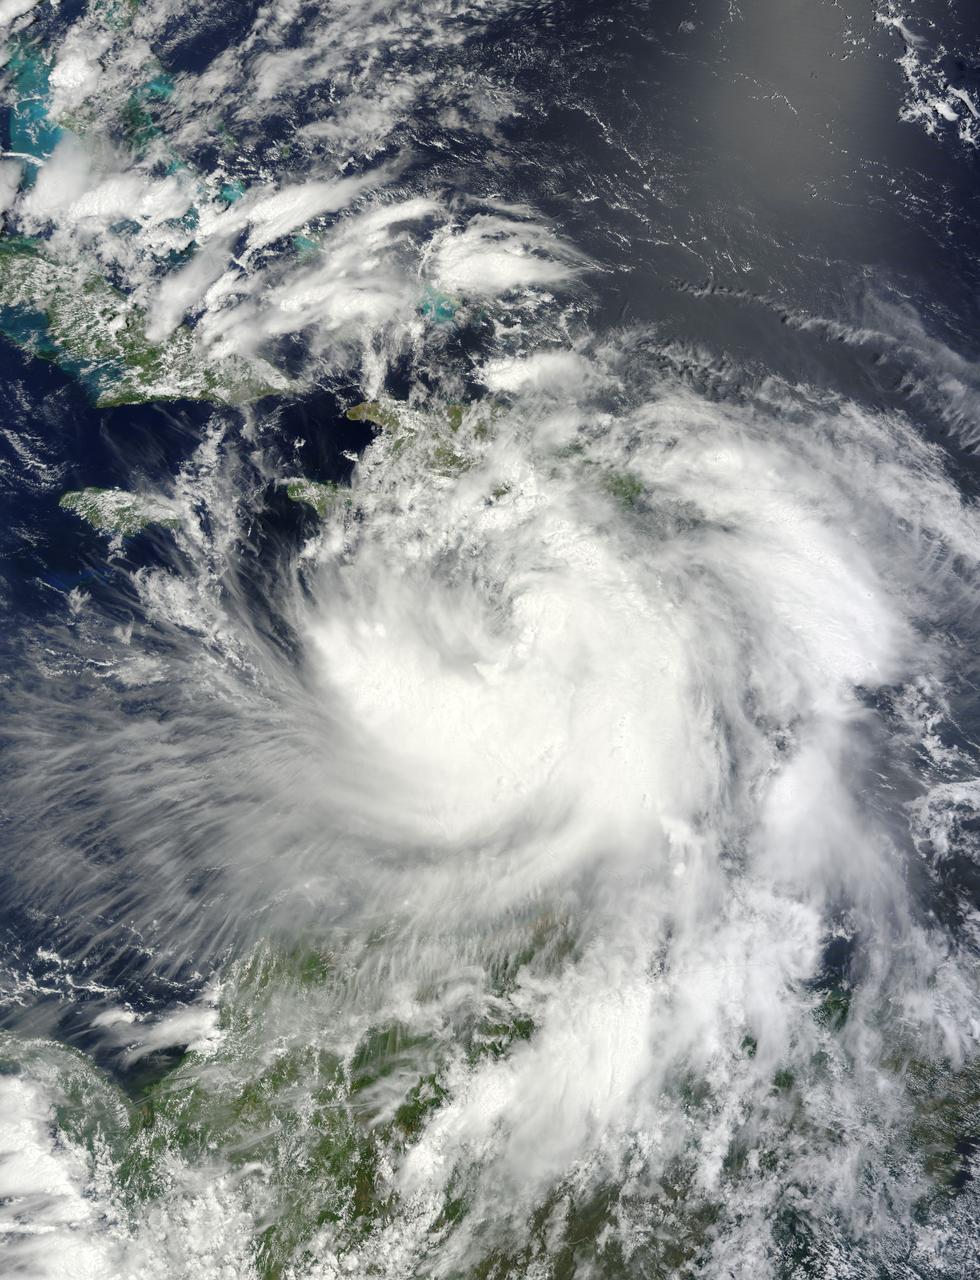
This infrared image shows Tropical Storm Ernesto over Cuba, from the Atmospheric Infrared Sounder AIRS on NASA Aqua satellite in August, 2006. Because infrared radiation does not penetrate through clouds, AIRS infrared images show either the temperature of the cloud tops or the surface of the Earth in cloud-free regions. The lowest temperatures (in purple) are associated with high, cold cloud tops that make up the top of the storm. In cloud-free areas the AIRS instrument will receive the infrared radiation from the surface of the Earth, resulting in the warmest temperatures (orange/red). http://photojournal.jpl.nasa.gov/catalog/PIA00510
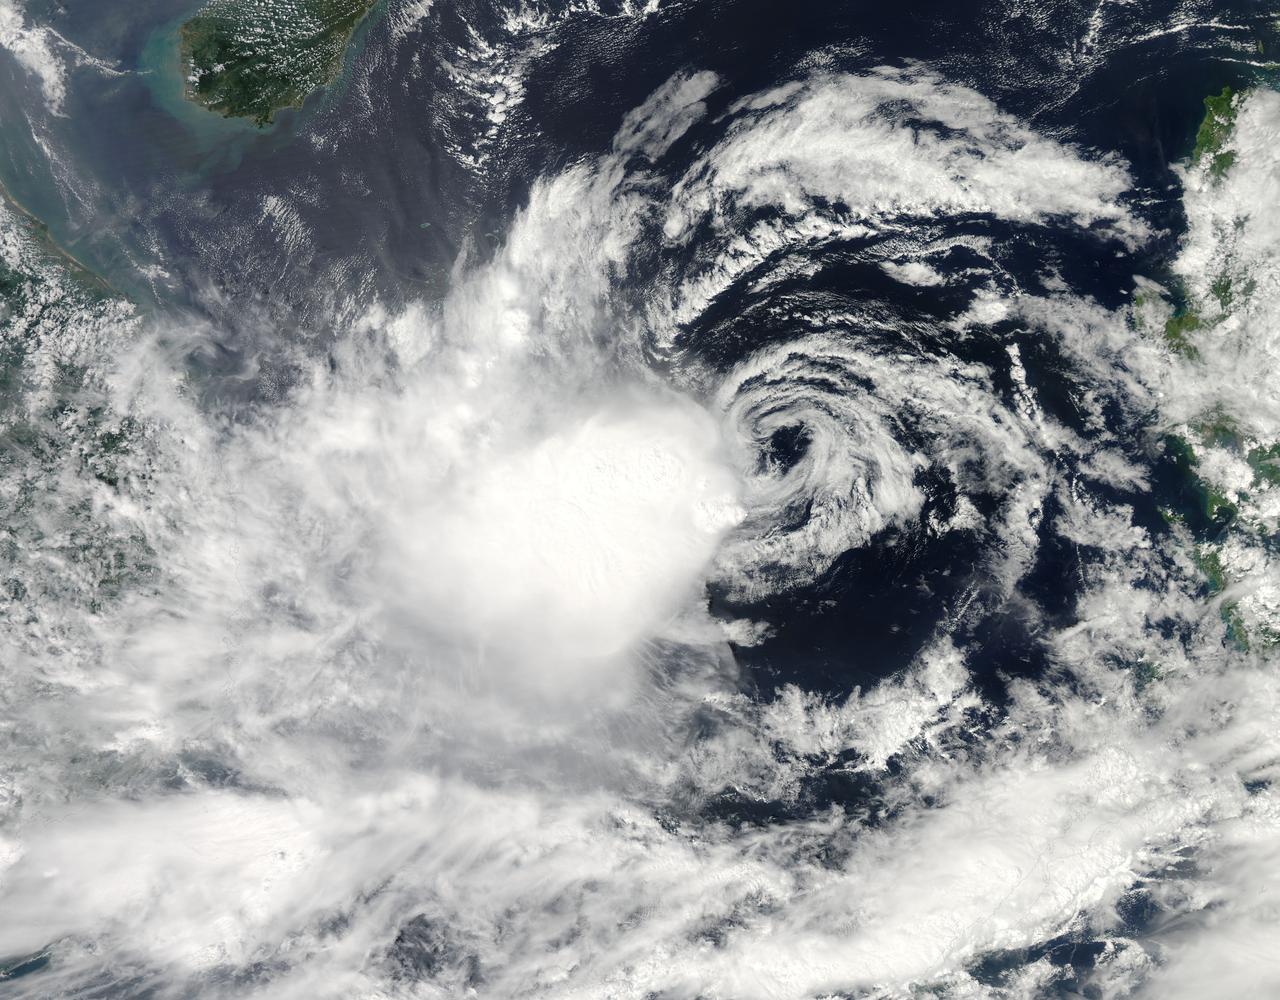
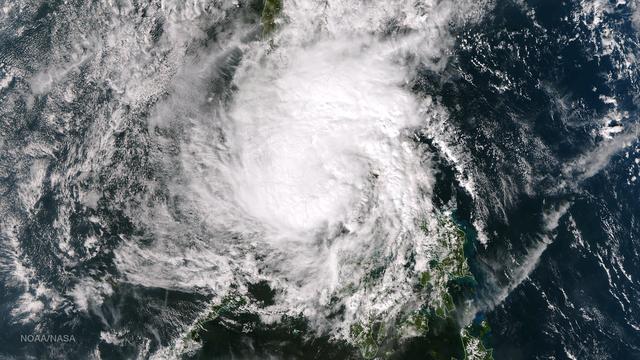
It is easy to see the effect of the strong northeasterly wind shear battering Tropical Storm Gaemi in satellite imagery from NASA. This true-color image acquired on Oct. 5 shows a large oval-shaped area of showers and thunderstorms associated with the storm, southwest of the exposed center of circulation. NASA's Aqua satellite passed over Tropical Storm Gaemi as it was approaching Vietnam on Oct. 5, 2012 at 0550 UTC (1:50 a.m. EDT). A true-color image of the storm was captured by the Moderate Resolution Imaging Spectroradiometer (MODIS) instrument and shows bulk of showers and thunderstorms were clearly to the southwest of the center. The circulation center appears as a ring of concentric bands of clouds northeast of the large rounded area of clouds and showers associated with the storm. On Tuesday, October 5, 2012 at 1500 UTC (11 a.m. EDT), Tropical Storm Gaemi still had maximum sustained winds near 35 knots (40 mph/65 km/h) as it did 24 hours before. It was located 425 nautical miles (489 miles/787 km) east of Hue, Vietnam near 14.7 North latitude and 117.7 East longitude. Early on October 7, Tropical Storm Gaemi made landfall over Vietnam with wind speeds reported at 34 mph (55 mph), and bringing rainfall of more than 4 inches in some areas of Vietnam. Once ashore, the storm quickly moved inland and rapidly weakened as it headed towards Cambodia. With winds reduced, Gaemi served primarily as a rainmaker, but the rain may bring flooding and landslides to the region. Credit: NASA/GSFC/Jeff Schmaltz/MODIS Land Rapid Response Team <b><a href="http://www.nasa.gov/audience/formedia/features/MP_Photo_Guidelines.html" rel="nofollow">NASA image use policy.</a></b> <b><a href="http://www.nasa.gov/centers/goddard/home/index.html" rel="nofollow">NASA Goddard Space Flight Center</a></b> enables NASA’s mission through four scientific endeavors: Earth Science, Heliophysics, Solar System Exploration, and Astrophysics. Goddard plays a leading role in NASA’s accomplishments by contributing compelling scientific knowledge to advance the Agency’s mission. <b>Follow us on <a href="http://twitter.com/NASA_GoddardPix" rel="nofollow">Twitter</a></b> <b>Like us on <a href="http://www.facebook.com/pages/Greenbelt-MD/NASA-Goddard/395013845897?ref=tsd" rel="nofollow">Facebook</a></b> <b>Find us on <a href="http://instagrid.me/nasagoddard/?vm=grid" rel="nofollow">Instagram</a></b>
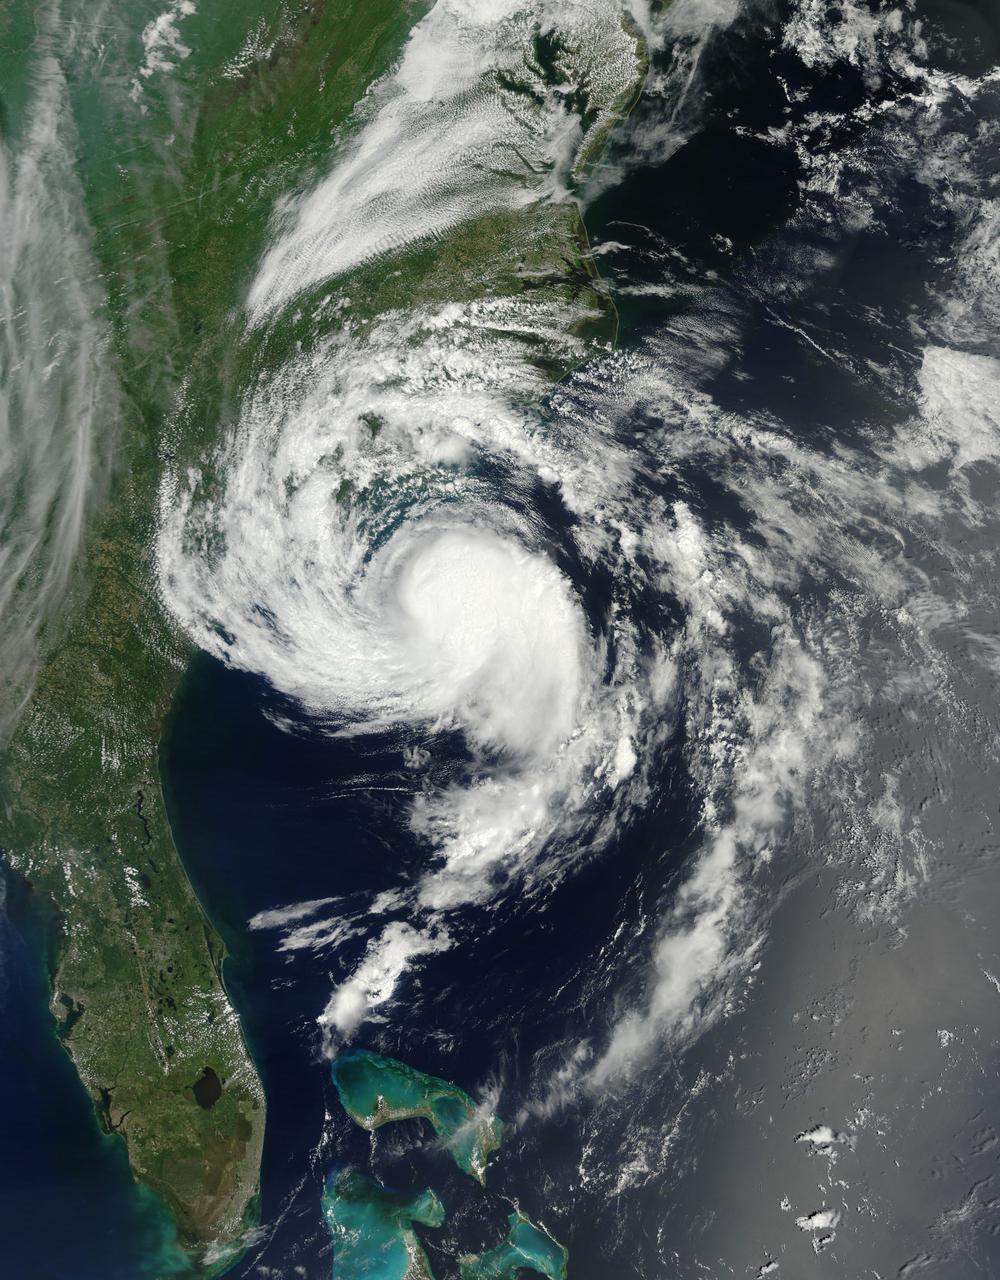
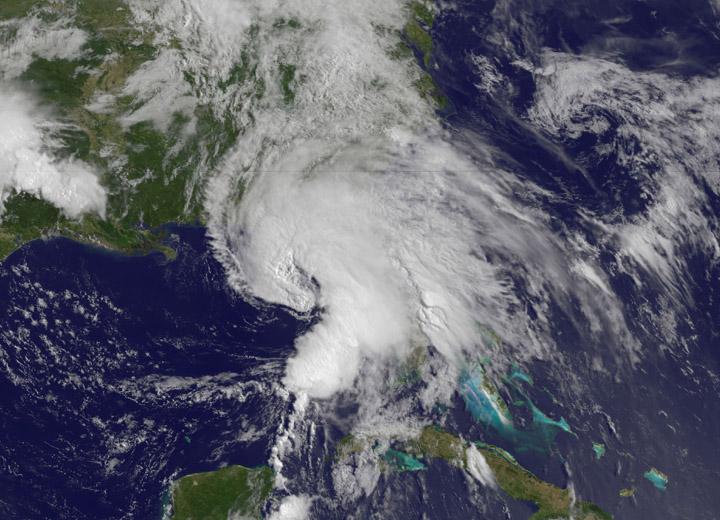
At about 6:00 a.m. EDT (10:00 UTC) on May 10, 2015, Tropical Storm Ana made landfall between Myrtle Beach and North Myrtle Beach, South Carolina. One day earlier, on the morning of May 9, the Moderate Resolution Imaging Spectroradiometer (MODIS) on NASA’s Terra satellite acquired this true-color image of the storm off the coast of the Carolinas. At the time, Ana had just evolved from a subtropical storm to a tropical storm with maximum sustained winds of 93 kilometers (58 miles) per hour. Ana’s life ashore was brief – the storm was downgraded to a tropical depression at 2:00 p.m. EDT (14:00 UTC) on May 10. During that time, parts of South Carolina and eastern North Carolina was drenched with heavy rain – some areas reported over 6 inches of rainfall – and heavy winds. A water spout was reported in Dare County, North Carolina, and the storm contributed to significant beach erosion along the coast. Credit: NASA/GSFC/Jeff Schmaltz/MODIS Land Rapid Response Team <b><a href="http://www.nasa.gov/audience/formedia/features/MP_Photo_Guidelines.html" rel="nofollow">NASA image use policy.</a></b> <b><a href="http://www.nasa.gov/centers/goddard/home/index.html" rel="nofollow">NASA Goddard Space Flight Center</a></b> enables NASA’s mission through four scientific endeavors: Earth Science, Heliophysics, Solar System Exploration, and Astrophysics. Goddard plays a leading role in NASA’s accomplishments by contributing compelling scientific knowledge to advance the Agency’s mission. <b>Follow us on <a href="http://twitter.com/NASAGoddardPix" rel="nofollow">Twitter</a></b> <b>Like us on <a href="http://www.facebook.com/pages/Greenbelt-MD/NASA-Goddard/395013845897?ref=tsd" rel="nofollow">Facebook</a></b> <b>Find us on <a href="http://instagrid.me/nasagoddard/?vm=grid" rel="nofollow">Instagram</a></b>
Tropical Storm Blas as observed by the Atmospheric Infrared Sounder AIRS onboard NASA Aqua in the year 2004. The major contribution to radiation (infrared light) that AIRS channels sense comes from different levels in the atmosphere, depending upon the channel wavelength. To create the movie, a set of AIRS channels were selected which probe the atmosphere at progressively deeper levels. If there were no clouds, the color in each frame would be nearly uniform until the Earth's surface is encountered. The tropospheric air temperature warms at a rate of 6 K (about 11 F) for each kilometer of descent toward the surface. Thus the colors would gradually change from cold to warm as the movie progresses. Clouds block the infrared radiation. Thus wherever there are clouds we can penetrate no deeper in infrared. The color remains fixed as the movie progresses, for that area of the image is "stuck" to the cloud top temperature. The coldest temperatures around 220 K (about -65 F) come from altitudes of about 10 miles. http://photojournal.jpl.nasa.gov/catalog/PIA00436
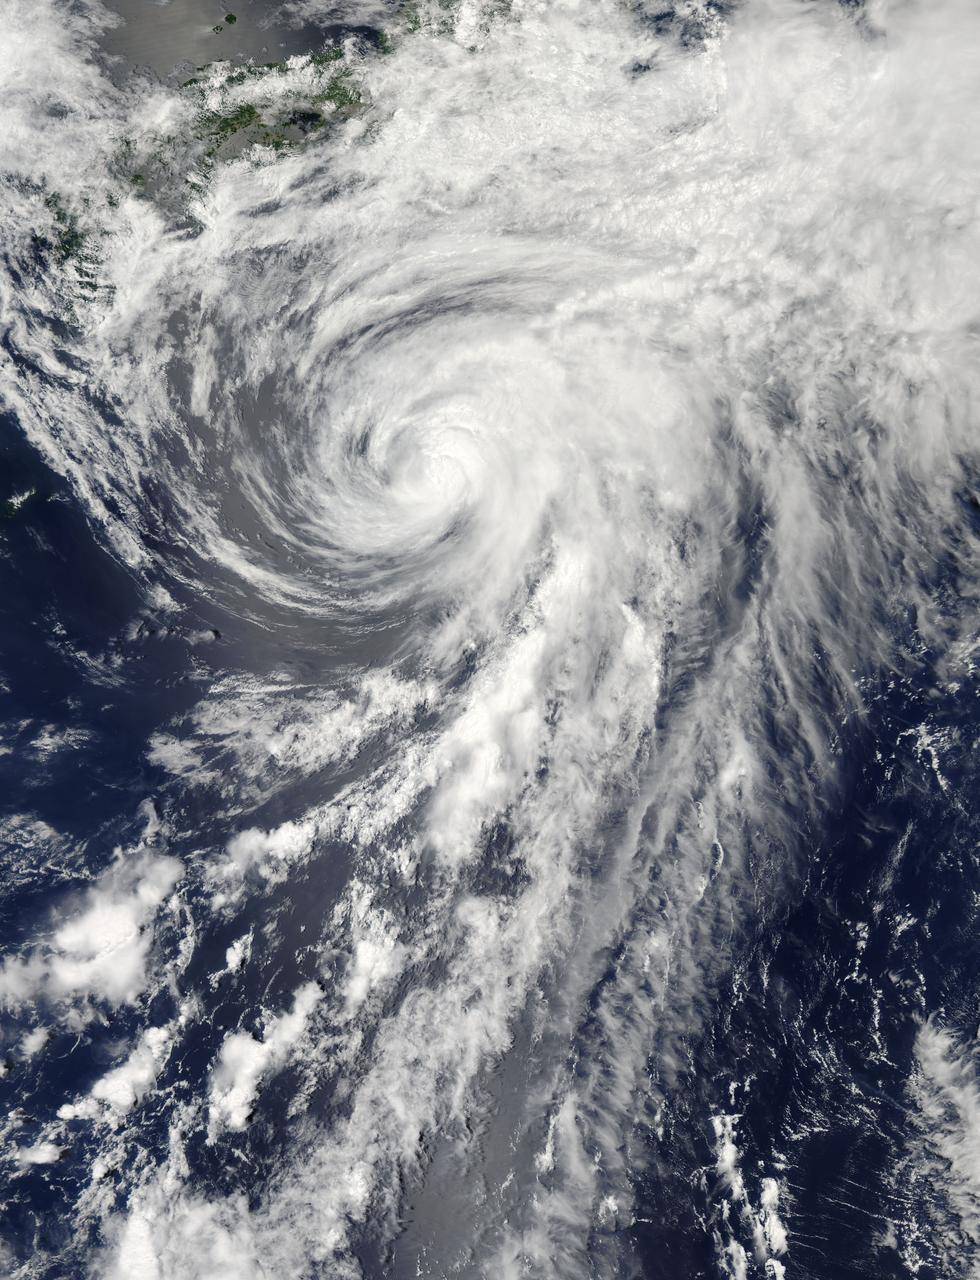
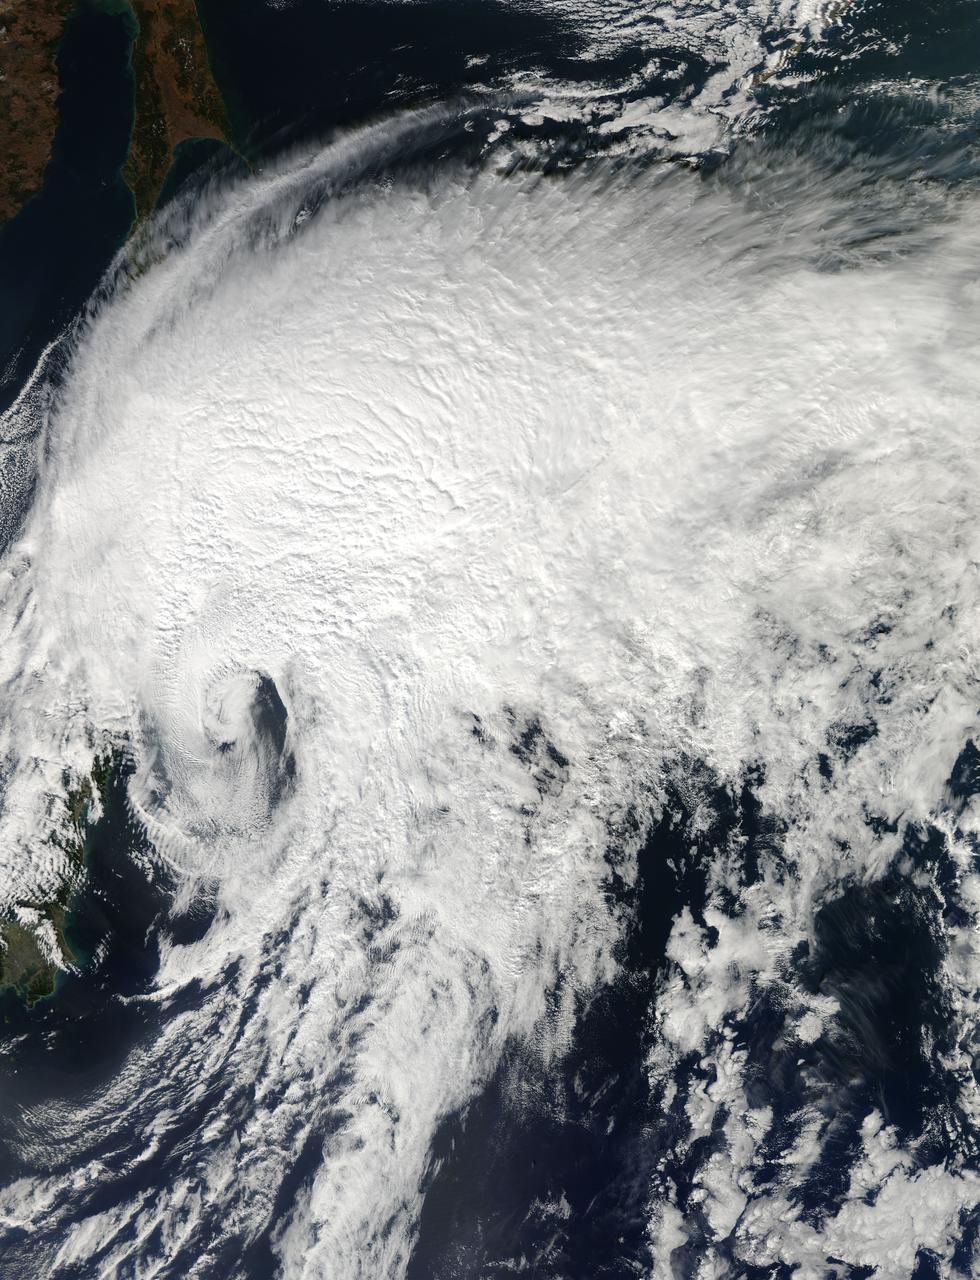
Tropical Storm Toraji Approaching Japan, 09/03/2013 at 02:10 UTC. Terra/MODIS <b><a href="http://www.nasa.gov/audience/formedia/features/MP_Photo_Guidelines.html" rel="nofollow">NASA image use policy.</a></b> <b><a href="http://www.nasa.gov/centers/goddard/home/index.html" rel="nofollow">NASA Goddard Space Flight Center</a></b> enables NASA’s mission through four scientific endeavors: Earth Science, Heliophysics, Solar System Exploration, and Astrophysics. Goddard plays a leading role in NASA’s accomplishments by contributing compelling scientific knowledge to advance the Agency’s mission. <b>Follow us on <a href="http://twitter.com/NASA_GoddardPix" rel="nofollow">Twitter</a></b> <b>Like us on <a href="http://www.facebook.com/pages/Greenbelt-MD/NASA-Goddard/395013845897?ref=tsd" rel="nofollow">Facebook</a></b> <b>Find us on <a href="http://instagram.com/nasagoddard?vm=grid" rel="nofollow">Instagram</a></b>
This NOAA GOES-East satellite animation shows the development of System 91L into Tropical Storm Andrea over the course of 3 days from June 4 to June 6, just after Andrea was officially designated a tropical storm. Credit: NASA's GOES Project --- NASA Sees Heavy Rainfall in Tropical Storm Andrea NASA’s TRMM satellite passed over Tropical Storm Andrea right after it was named, while NASA’s Terra satellite captured a visible image of the storm’s reach hours beforehand. TRMM measures rainfall from space and saw that rainfall rates in the southern part of the storm was falling at almost 5 inches per hour. NASA’s Terra satellite passed over Tropical Storm Andrea on June 5 at 16:25 UTC (12:25 p.m. EDT) and the Moderate Resolution Imaging Spectroradiometer or MODIS instrument, captured a visible image of the storm. At that time, Andrea’s clouds had already extended over more than half of Florida. At 8 p.m. EDT on Wednesday, June 5, System 91L became the first tropical storm of the Atlantic Ocean hurricane season. Tropical Storm Andrea was centered near 25.5 North and 86.5 West, about 300 miles (485 km) southwest of Tampa, Fla. At the time Andrea intensified into a tropical storm, its maximum sustained winds were near 40 mph (65 kph). Full updates can be found at NASA's Hurricane page: <a href="http://www.nasa.gov/hurricane" rel="nofollow">www.nasa.gov/hurricane</a> Rob Gutro NASA’s Goddard Space Flight Center
This visible image of Tropical Storm Miriam was captured by NOAA's GOES-15 satellite on Sept. 26, 2012 at 10:45 a.m. EDT off the coast of Baja California. The strongest thunderstorms were in a large band of thunderstorms north and northwest of the center. Miriam is banked to the north and west by an extensive field of stratocumulus clouds. Credit: NASA/NOAA GOES Project ---- Once a powerful hurricane, Miriam is now a tropical storm off the coast of Baja California, Mexico. Tropical Storm Miriam was seen in the Eastern Pacific Ocean by NOAA's GOES-15 satellite, and the visible image revealed that the strongest part of the storm was north and west of the center. NOAA's GOES-15 satellite sits in a fixed position over the western U.S. that allows it to monitor the Eastern Pacific Ocean and it captured a visible image of Tropical Storm Miriam on Sept. 26, 2012 at 10:45 a.m. EDT off the coast of Baja California. The strongest thunderstorms were north and northwest of the center in a large band, wrapping around the center of the tropical storm. Miriam is banked to the north and west by an extensive field of stratocumulus clouds Wind shear is taking its toll on Miriam. The National Hurricane Center noted there is an increasing "separation between the low- to mid-level centers of the storm (think of the storm as having multiple layers) due to 20-25 knots of southwesterly shear associated with a shortwave trough (elongated area of low pressure) rotating around the northwestern side of the storm. At 11 a.m. EDT on Sept. 26, Tropical Storm Miriam had maximum sustained winds near 65 mph (100 kph), dropping from 70 mph (100 kmh) just six hours before. It was located about 425 miles (680 km) west-southwest of the southern tip of Baja California Miriam was moving slowly at 6 mph (9 kmh) to the north-northwest and away from the coast. Miriam's minimum central pressure was near 992 millibars. A Miriam continues to pull away from Baja California, rough ocean swells will keep affecting the south and west coasts today, Sept. 26, and tomorrow, Sept. 27. By Sept. 28, Friday, the ocean swells will gradually begin to subside. Miriam is moving into a region where wind shear is forecast to increase and sea surface temperatures will fall. Those are two factors that will contribute to the weakening of the tropical storm over the next several days. Rob Gutro NASA's Goddard Space Flight Center Image: NASA GOES Project <b><a href="http://www.nasa.gov/audience/formedia/features/MP_Photo_Guidelines.html" rel="nofollow">NASA image use policy.</a></b> <b><a href="http://www.nasa.gov/centers/goddard/home/index.html" rel="nofollow">NASA Goddard Space Flight Center</a></b> enables NASA’s mission through four scientific endeavors: Earth Science, Heliophysics, Solar System Exploration, and Astrophysics. Goddard plays a leading role in NASA’s accomplishments by contributing compelling scientific knowledge to advance the Agency’s mission. <b>Follow us on <a href="http://twitter.com/NASA_GoddardPix" rel="nofollow">Twitter</a></b> <b>Like us on <a href="http://www.facebook.com/pages/Greenbelt-MD/NASA-Goddard/395013845897?ref=tsd" rel="nofollow">Facebook</a></b> <b>Find us on <a href="http://instagrid.me/nasagoddard/?vm=grid" rel="nofollow">Instagram</a></b>
NASA’s Terra satellite passed over Tropical Storm Andrea on June 5 at 16:25 UTC (12:25 p.m. EDT) and the MODIS instrument captured this visible image of the storm. Andrea’s clouds had already extended over more than half of Florida. Credit: NASA Goddard MODIS Rapid Response Team --- NASA Sees Heavy Rainfall in Tropical Storm Andrea NASA’s TRMM satellite passed over Tropical Storm Andrea right after it was named, while NASA’s Terra satellite captured a visible image of the storm’s reach hours beforehand. TRMM measures rainfall from space and saw that rainfall rates in the southern part of the storm was falling at almost 5 inches per hour. NASA’s Terra satellite passed over Tropical Storm Andrea on June 5 at 16:25 UTC (12:25 p.m. EDT) and the Moderate Resolution Imaging Spectroradiometer or MODIS instrument, captured a visible image of the storm. At that time, Andrea’s clouds had already extended over more than half of Florida. At 8 p.m. EDT on Wednesday, June 5, System 91L became the first tropical storm of the Atlantic Ocean hurricane season. Tropical Storm Andrea was centered near 25.5 North and 86.5 West, about 300 miles (485 km) southwest of Tampa, Fla. At the time Andrea intensified into a tropical storm, its maximum sustained winds were near 40 mph (65 kph). Full updates can be found at NASA's Hurricane page: <a href="http://www.nasa.gov/hurricane" rel="nofollow">www.nasa.gov/hurricane</a> Rob Gutro NASA’s Goddard Space Flight Center
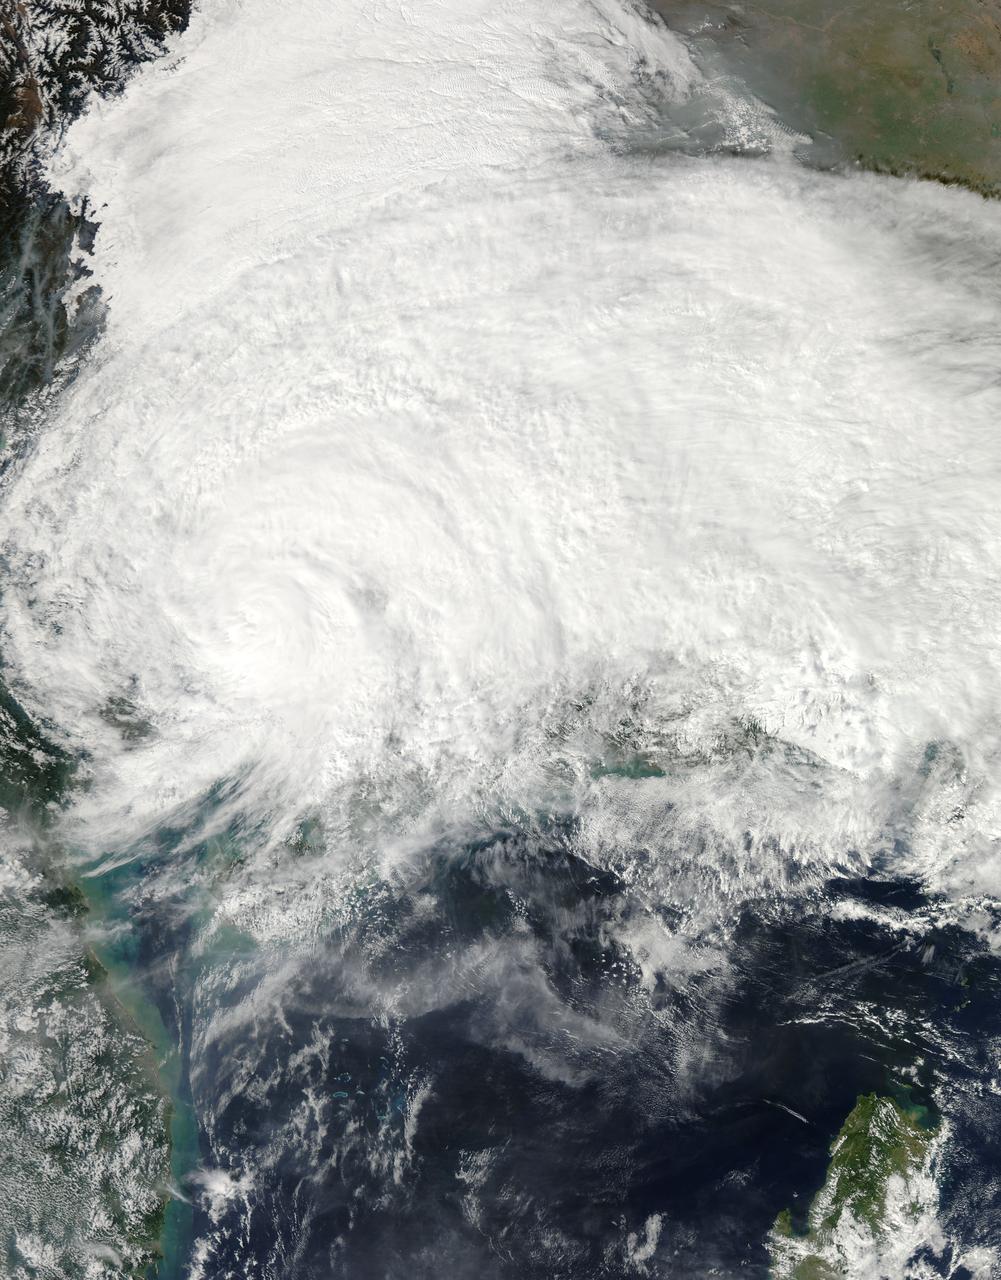
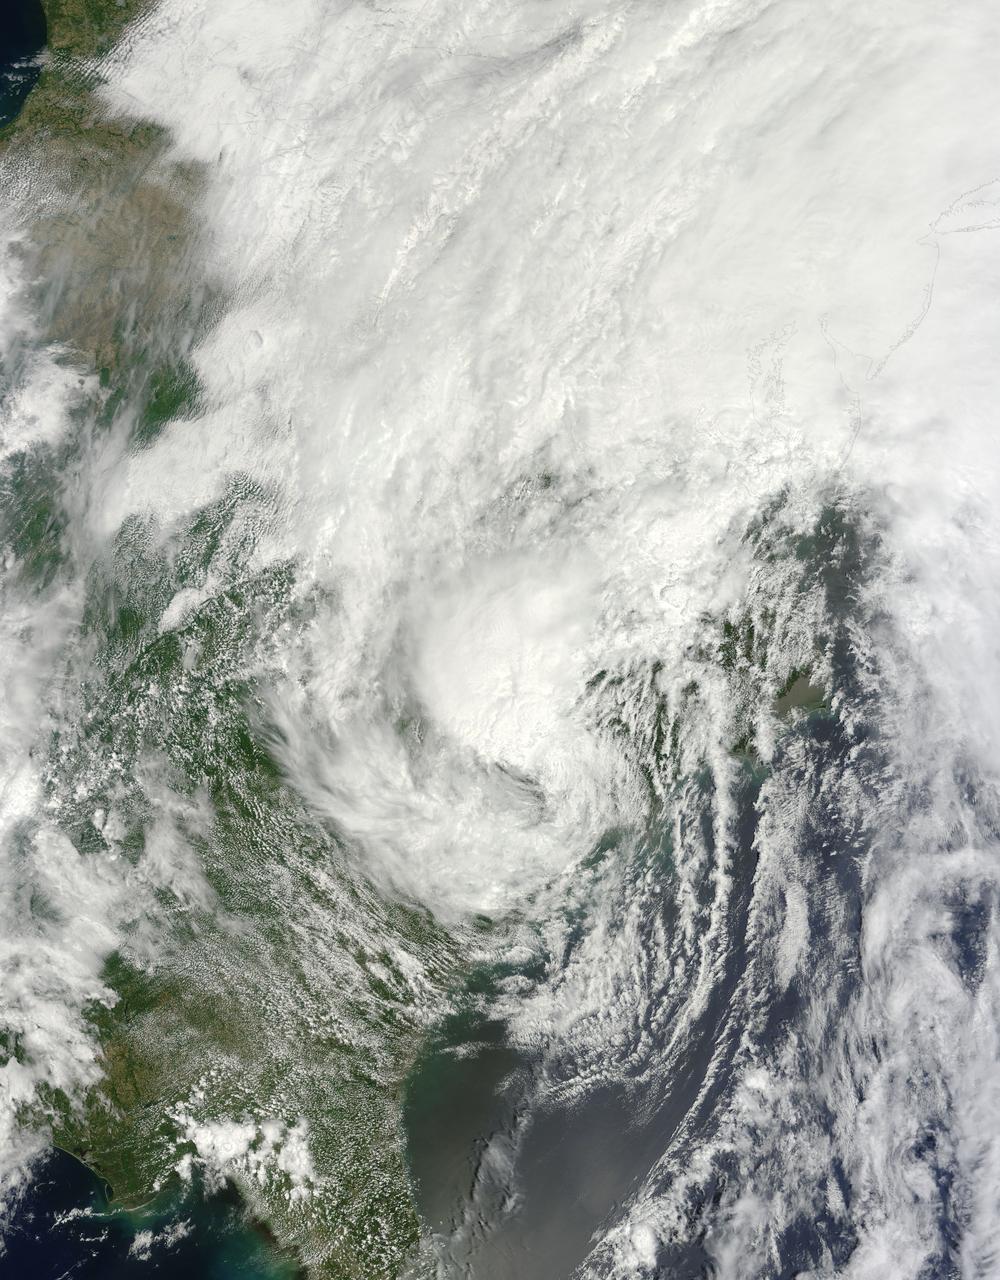
On Nov. 11 at 05:45 UTC, the MODIS instrument aboard NASA's Aqua satellite captured this image of Tropical Storm Haiyan over mainland China. Credit: NASA Goddard MODIS Rapid Response Team <b><a href="http://www.nasa.gov/audience/formedia/features/MP_Photo_Guidelines.html" rel="nofollow">NASA image use policy.</a></b> <b><a href="http://www.nasa.gov/centers/goddard/home/index.html" rel="nofollow">NASA Goddard Space Flight Center</a></b> enables NASA’s mission through four scientific endeavors: Earth Science, Heliophysics, Solar System Exploration, and Astrophysics. Goddard plays a leading role in NASA’s accomplishments by contributing compelling scientific knowledge to advance the Agency’s mission. <b>Follow us on <a href="http://twitter.com/NASA_GoddardPix" rel="nofollow">Twitter</a></b> <b>Like us on <a href="http://www.facebook.com/pages/Greenbelt-MD/NASA-Goddard/395013845897?ref=tsd" rel="nofollow">Facebook</a></b> <b>Find us on <a href="http://instagrid.me/nasagoddard/?vm=grid" rel="nofollow">Instagram</a></b>
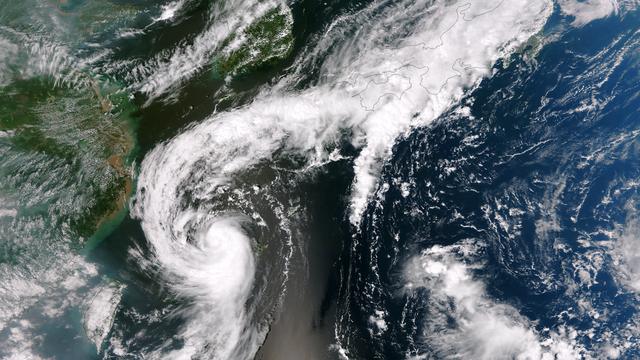
On Tuesday, June 11, 2013 Tropical Storm Yagi spun in the North Pacific Ocean just south of Japan. The Moderate Resolution Imaging Spectroradiometer (MODIS) aboard NASA’s Aqua satellite captured this beautiful true-color image of the storm on that same date at 4:10 UTC (1:10 p.m. Japan local time). The image shows a clear apostrophe-shaped cyclone, with a closed eye and somewhat elliptical shape. The clouds associated with the northern fringes of the storm draped over southeastern coastal Japan, and a long “tail” (or band) of thunderstorms fed into the center from the south. Multispectral imagery also showed tight bands of thunderstorms wrapping into the center of the storm, although the building of thunderstorms was weakening around the center. Near the same time as the image was captured, the Joint Typhoon Warning Center announced that vertical wind shear was starting to take a toll on Yagi. Northwesterly wind shear had caused the system to tilt slightly with the upper-level center displaced about 20 nautical miles east of the low-level center. Tropical Storm Yagi developed from Tropical Depression 03W in the Western North Pacific Ocean on June 6, and intensified the weekend of June 8-9, when it reached Tropical Storm status and was given the name Yagi. Also known as Dante, the storm reached the maximum wind speeds on June 10 and 11, after which it began to weaken as it moved into cooler waters. On June 14, Yagi’s remnants passed about 200 miles south of Tokyo, and brought soaking rains to the coastline of Japan’s Honshu Island. Credit: NASA/GSFC/Jeff Schmaltz/MODIS Land Rapid Response Team <b><a href="http://www.nasa.gov/audience/formedia/features/MP_Photo_Guidelines.html" rel="nofollow">NASA image use policy.</a></b> <b><a href="http://www.nasa.gov/centers/goddard/home/index.html" rel="nofollow">NASA Goddard Space Flight Center</a></b> enables NASA’s mission through four scientific endeavors: Earth Science, Heliophysics, Solar System Exploration, and Astrophysics. Goddard plays a leading role in NASA’s accomplishments by contributing compelling scientific knowledge to advance the Agency’s mission. <b>Follow us on <a href="http://twitter.com/NASA_GoddardPix" rel="nofollow">Twitter</a></b> <b>Like us on <a href="http://www.facebook.com/pages/Greenbelt-MD/NASA-Goddard/395013845897?ref=tsd" rel="nofollow">Facebook</a></b> <b>Find us on <a href="http://instagram.com/nasagoddard?vm=grid" rel="nofollow">Instagram</a></b>

STS032-80-036 (9-20 Jan. 1990) --- This oblique view of Tropical Storm Sam in the eastern Indian Ocean off the western coast of Australia was photographed with a 70mm camera by the astronauts. Tropical Storm Sam (known as Willy-Willy in Australia) was born in the eastern Indian Ocean near the islands of Timor and Sumba in Indonesia. The storm tracked southwestward attaining sustained winds in excess of 60 knots (70 miles per hour). Other than on Christmas Island and the Cocos (Keeling) Islands south of Java, and for strong swells along the western Australia coast, the storm had little impact on land areas. At the time this photograph was taken, the storm was beginning to dissipate in the south Indian Ocean. The eye of the storm is still visible near center, with the swirling bands of the storm propagating in a clockwise direction toward the center. Winds aloft have begun to shear the tops of thunderstorms associated with the storm, forming a high cirrus cloud cover over the center portions of the storm. This picture was used by the crew at their January 30, 1990 Post-Flight Press Conference (PFPC).
Tropical Storm Hagupit's low level circulation center is being obscured by its deep central convection and intensities are hard to pinpoint as the storm interacts with land. Once clear over the waters of the South China Sea Hagupit is forecast to continue weakening as it approaches the southern coast of Vietnam. This image was taken by the Suomi NPP satellite's VIIRS instrument around 0510Z on December 8, 2014. NASA/NOAA/NPP Credit: NASA/NOAA via <b><a href="www.nnvl.noaa.gov/" rel="nofollow"> NOAA Environmental Visualization Laboratory</a></b> <b><a href="http://www.nasa.gov/audience/formedia/features/MP_Photo_Guidelines.html" rel="nofollow">NASA image use policy.</a></b> <b><a href="http://www.nasa.gov/centers/goddard/home/index.html" rel="nofollow">NASA Goddard Space Flight Center</a></b> enables NASA’s mission through four scientific endeavors: Earth Science, Heliophysics, Solar System Exploration, and Astrophysics. Goddard plays a leading role in NASA’s accomplishments by contributing compelling scientific knowledge to advance the Agency’s mission. <b>Follow us on <a href="http://twitter.com/NASAGoddardPix" rel="nofollow">Twitter</a></b> <b>Like us on <a href="http://www.facebook.com/pages/Greenbelt-MD/NASA-Goddard/395013845897?ref=tsd" rel="nofollow">Facebook</a></b> <b>Find us on <a href="http://instagram.com/nasagoddard?vm=grid" rel="nofollow">Instagram</a></b>
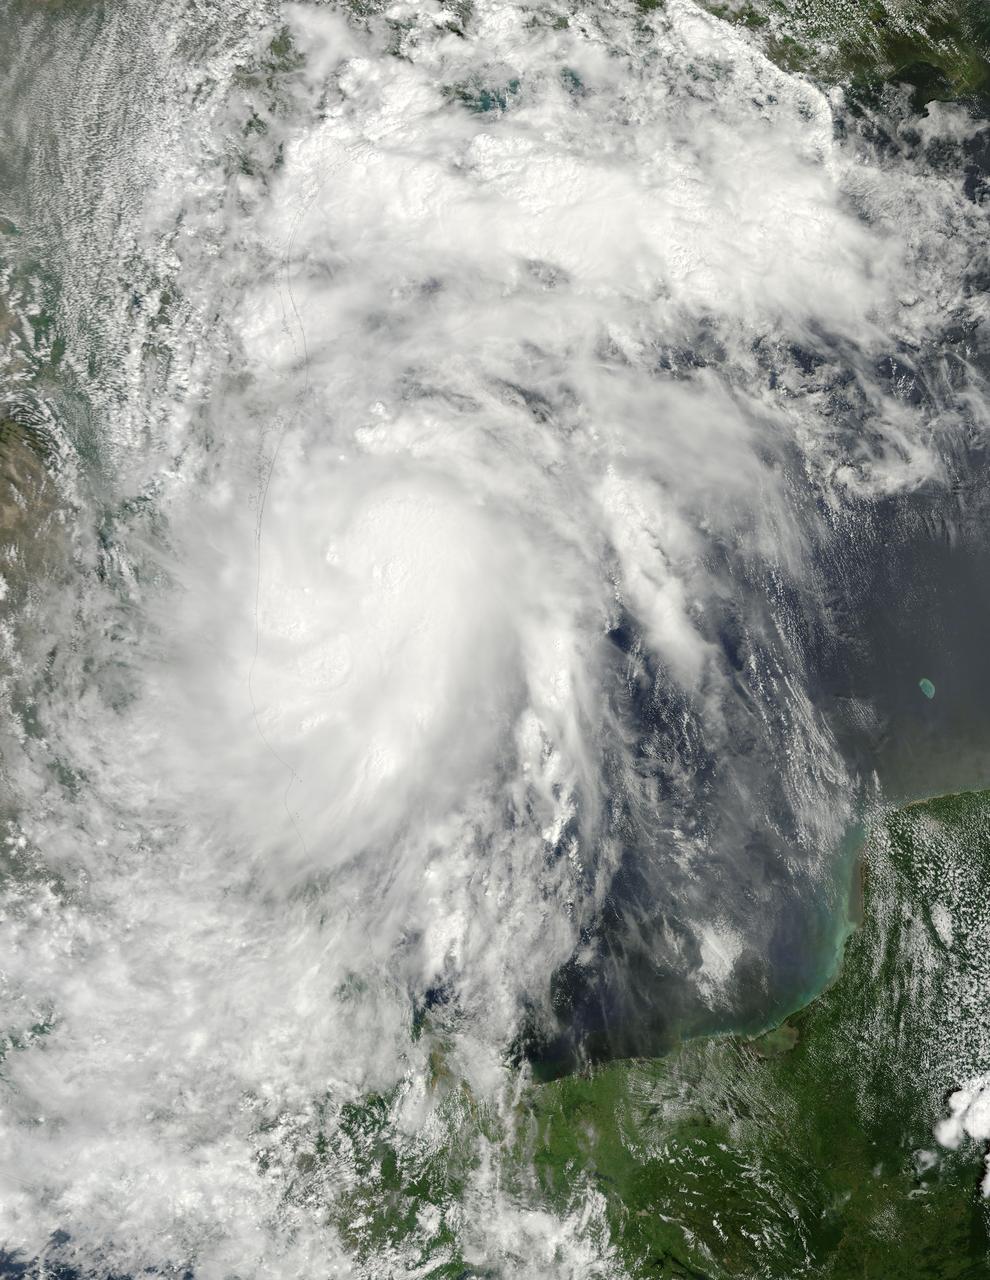
On June 15 at 19:15 UTC (3:15 p.m. EDT) the MODIS instrument aboard NASA's Aqua satellite captured a visible image of Tropical Storm Bill approaching Texas and Louisiana. Powerful thunderstorms circled the center in fragmented bands. At 11 a.m. CDT on June 16, a Tropical Storm Warning was in effect from Baffin Bay to High Island Texas as Bill was making landfall. The National Hurricane Center noted that Bill is expected to produce total rain accumulations of 4 to 8 inches over eastern Texas and eastern Oklahoma and 2 to 4 inches over western Arkansas and southern Missouri, with possible isolated maximum amounts of 12 inches in eastern Texas. In eastern Texas and far western Louisiana today and tonight, isolated tornadoes are also possible, as with any landfalling tropical storm. Tropical storm conditions are expected to continue into the evening in the warning area. Along the coasts, the combination of a storm surge and the tide will cause normally dry areas near the coast to be flooded by rising waters. The water could reach the following heights above ground if the peak surge occurs at the time of high tide. The NHC noted that the Upper Texas coast could experience 2 to 4 feet, and the western Louisiana coast between 1 to 2 feet. At 10 a.m. CDT (1500 UTC), the center of Tropical Storm Bill was located near latitude 28.2 North, longitude 96.4 West. Bill was moving toward the northwest near 10 mph (17 kph) and that general motion is expected to continue today. The latest minimum central pressure reported by an Air Force Reserve Hurricane Hunter aircraft was 997 millibars. Reports from an Air Force Reserve reconnaissance aircraft indicate that maximum sustained winds remain near 60 mph (95 kph) with higher gusts. Unlike Carlos, Bill is not a compact storm. Tropical-storm-force winds extend outward up to 150 miles (240 km) from the center. Between 9 and 10 a.m. CDT, an automated observing station at Port O'Connor also reported a sustained wind of 44 mph (70 kph) and a gust to 53 mph (85 kph). For updated forecasts, watches and warnings, visit the National Hurricane Center webpage at <a href="http://www.nhc.noaa.gov" rel="nofollow">www.nhc.noaa.gov</a>. For local forecasts and advisories, visit: <a href="http://www.weather.gov" rel="nofollow">www.weather.gov</a>. Bill is forecast to continue moving inland and is expected to be a tropical depression by Wednesday, June 17, west of Dallas. The remnants of Bill are forecast to move into the Midwest later in the week. Credit: NASA/GSFC/Jeff Schmaltz/MODIS Land Rapid Response Team <b><a href="http://www.nasa.gov/audience/formedia/features/MP_Photo_Guidelines.html" rel="nofollow">NASA image use policy.</a></b> <b><a href="http://www.nasa.gov/centers/goddard/home/index.html" rel="nofollow">NASA Goddard Space Flight Center</a></b> enables NASA’s mission through four scientific endeavors: Earth Science, Heliophysics, Solar System Exploration, and Astrophysics. Goddard plays a leading role in NASA’s accomplishments by contributing compelling scientific knowledge to advance the Agency’s mission. <b>Follow us on <a href="http://twitter.com/NASAGoddardPix" rel="nofollow">Twitter</a></b> <b>Like us on <a href="http://www.facebook.com/pages/Greenbelt-MD/NASA-Goddard/395013845897?ref=tsd" rel="nofollow">Facebook</a></b> <b>Find us on <a href="http://instagrid.me/nasagoddard/?vm=grid" rel="nofollow">Instagram</a></b>
The outflow from Tropical Storm Toraji spawned tornadoes that caused injuries and property damage in Koshigaya, Saitama Prefecture, Japan, just northeast of Tokyo, on September 2, 2013. This image was taken by the Suomi NPP satellite's VIIRS instrument around 0425Z on September 2, 2013. Credit: NASA/NOAA <b><a href="http://www.nasa.gov/audience/formedia/features/MP_Photo_Guidelines.html" rel="nofollow">NASA image use policy.</a></b> <b><a href="http://www.nasa.gov/centers/goddard/home/index.html" rel="nofollow">NASA Goddard Space Flight Center</a></b> enables NASA’s mission through four scientific endeavors: Earth Science, Heliophysics, Solar System Exploration, and Astrophysics. Goddard plays a leading role in NASA’s accomplishments by contributing compelling scientific knowledge to advance the Agency’s mission. <b>Follow us on <a href="http://twitter.com/NASA_GoddardPix" rel="nofollow">Twitter</a></b> <b>Like us on <a href="http://www.facebook.com/pages/Greenbelt-MD/NASA-Goddard/395013845897?ref=tsd" rel="nofollow">Facebook</a></b> <b>Find us on <a href="http://instagram.com/nasagoddard?vm=grid" rel="nofollow">Instagram</a></b>
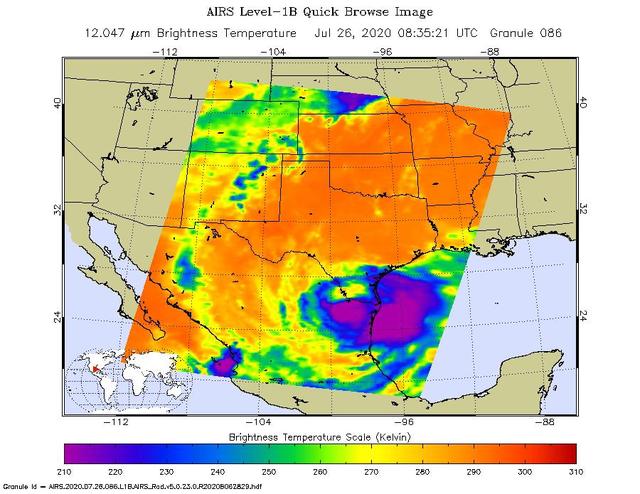
NASA's Atmospheric Infrared Sounder (AIRS) was monitoring Tropical Storm Hanna as it took aim at southern Texas on July 26. Perched on NASA's Aqua satellite, AIRS is an instrument that studies Earth's weather and climate. Hanna made landfall as a Category 1 hurricane around 5 p.m. local time over Padre Island, Texas, on July 25. Since then, the storm has lost steam, weakening to a tropical storm in the early morning hours of July 26, and then to a tropical depression by the afternoon. The purple areas in the AIRS image — taken at 1:35 a.m. local time on July 26 — show regions within the tropical storm with cold clouds high in Earth's atmosphere that tend to produce heavy rainfall. The National Hurricane Center predicts that Hanna will continue over northeastern Mexico, where it will dissipate by late in the day on July 27. https://photojournal.jpl.nasa.gov/catalog/PIA23784
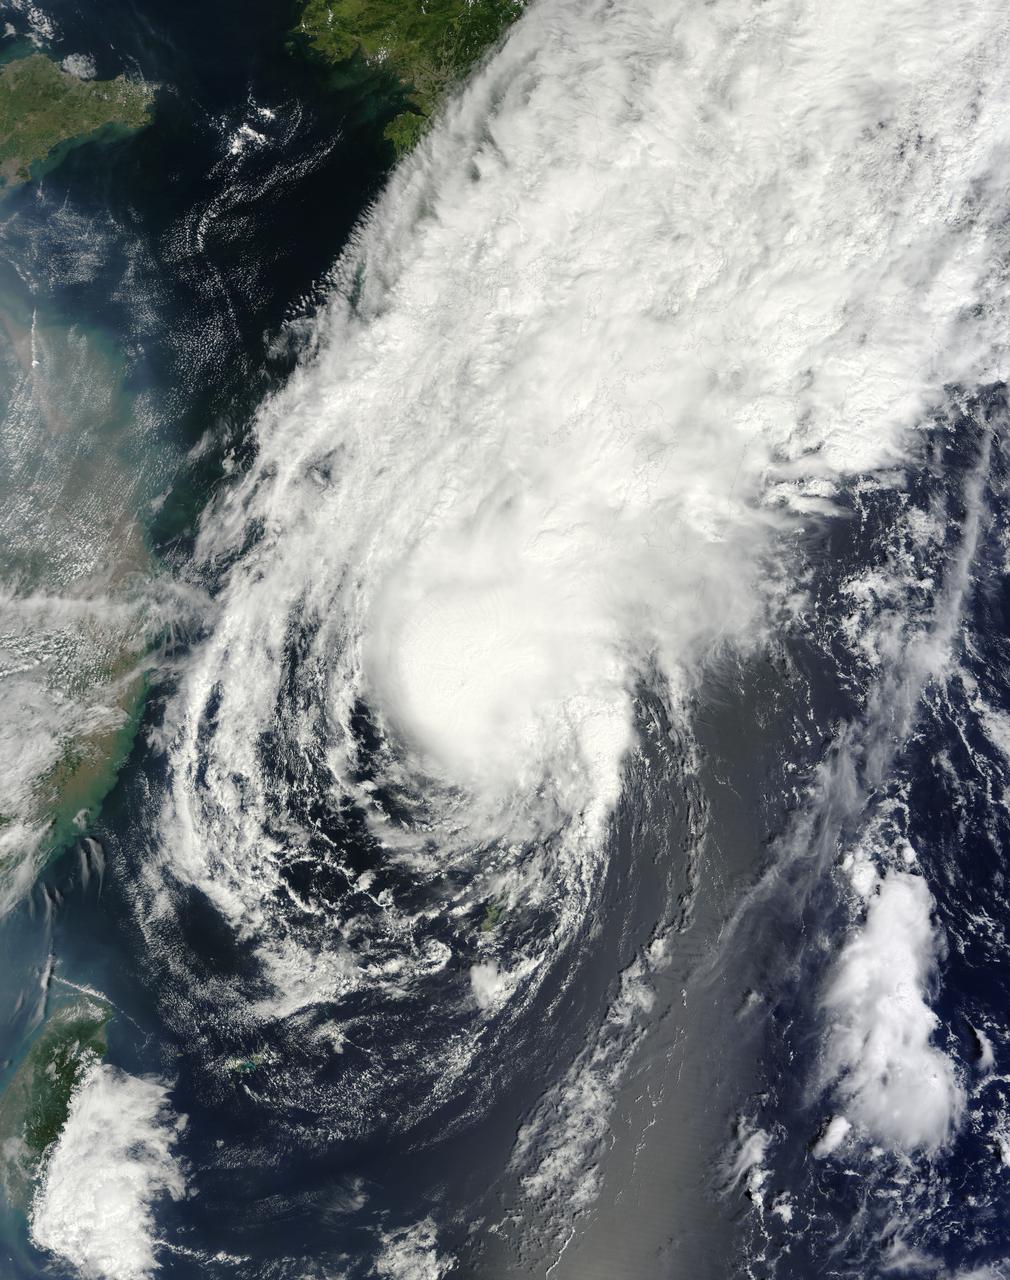
NASA image acquired August 10, 2010 Tropical Storm Dianmu blew over the East China Sea in early August 2010, traveling slowly toward the Korean Peninsula. On August 10, 2010, the U.S. Navy’s Joint Typhoon Warning Center (JTWC) reported that Dianmu had winds of 55 knots (100 kilometers per hour) with gusts up to 70 knots (130 kilometers per hour). JTWC stated that the storm was roughly 270 nautical miles (500 kilometers) south-southwest of Seoul. The Moderate Resolution Imaging Spectroradiometer (MODIS) on NASA’s Terra satellite captured this natural-color image on August 10. The storm, which sports a distinct eye, stretches primarily north-south, sending spiral clouds hundreds of kilometers southward over the East China Sea. Storm clouds skirt China’s eastern coast. NASA image by Jeff Schmaltz, MODIS Rapid Response Team at NASA GSFC. Caption by Michon Scott. Instrument: Terra - MODIS <b><a href="http://www.nasa.gov/centers/goddard/home/index.html" rel="nofollow">NASA Goddard Space Flight Center</a></b> is home to the nation's largest organization of combined scientists, engineers and technologists that build spacecraft, instruments and new technology to study the Earth, the sun, our solar system, and the universe. <b>Follow us on <a href="http://twitter.com/NASA_GoddardPix" rel="nofollow">Twitter</a></b> <b>Join us on <a href="http://www.facebook.com/pages/Greenbelt-MD/NASA-Goddard/395013845897?ref=tsd" rel="nofollow">Facebook</a><b></b></b>
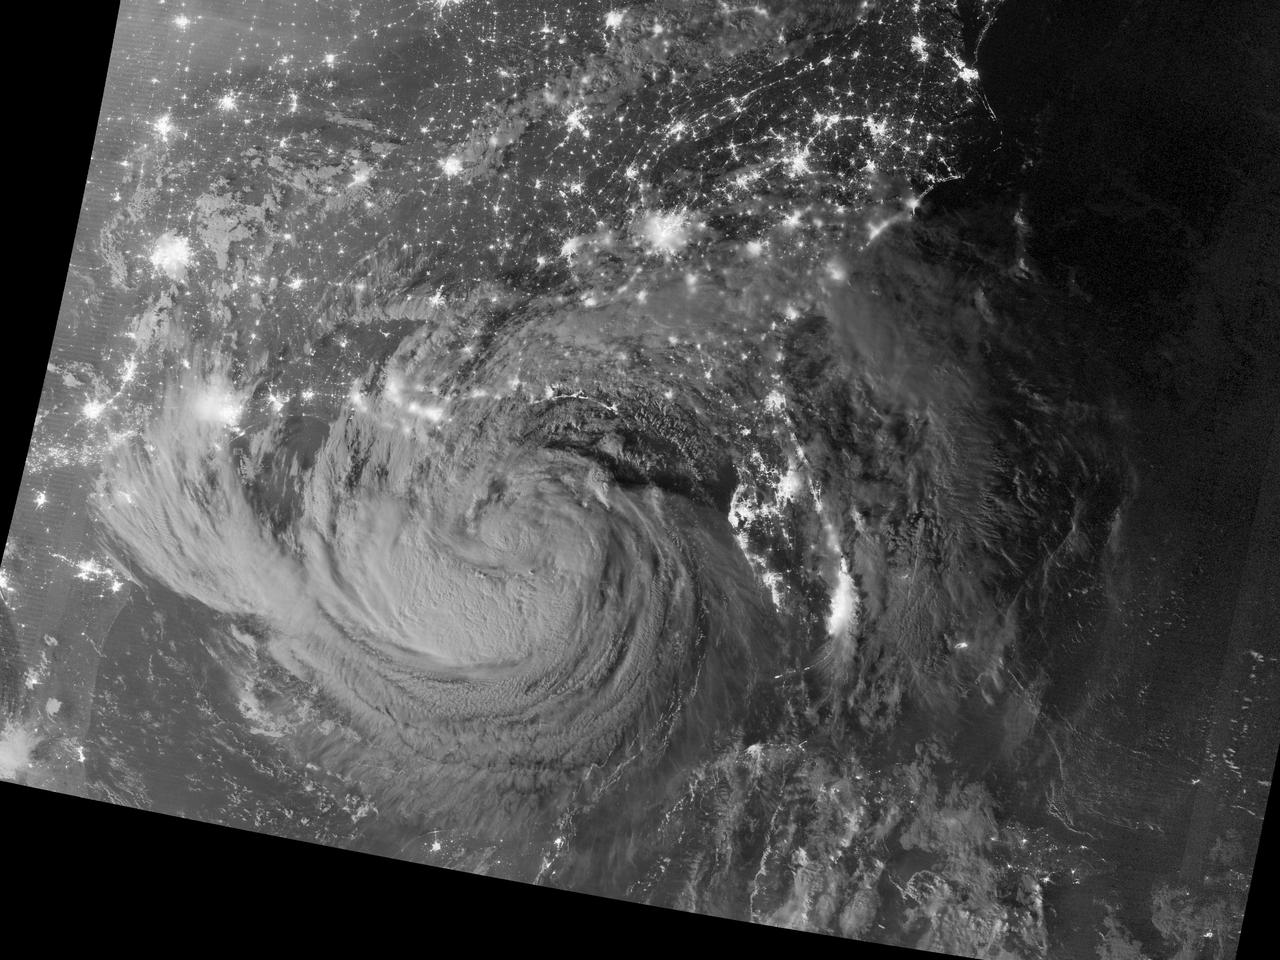
NASA image acquired August 28, 2012 Early on August 28, 2012, the Visible Infrared Imaging Radiometer Suite (VIIRS) on the Suomi-NPP satellite captured this nighttime view of Tropical Storm Isaac and the cities near the Gulf Coast of the United States. The image was acquired just after local midnight by the VIIRS “day-night band,” which detects light in a range of wavelengths from green to near-infrared and uses light intensification to enable the detection of dim signals. In this case, the clouds of Isaac were lit by moonlight. Credit: <b><a href="http://www.earthobservatory.nasa.gov/" rel="nofollow"> NASA Earth Observatory</a></b> NASA Earth Observatory image by Jesse Allen and Robert Simmon, using VIIRS Day Night Band data. Caption by Mike Carlowicz. <b><a href="http://www.nasa.gov/audience/formedia/features/MP_Photo_Guidelines.html" rel="nofollow">NASA image use policy.</a></b> <b><a href="http://www.nasa.gov/centers/goddard/home/index.html" rel="nofollow">NASA Goddard Space Flight Center</a></b> enables NASA’s mission through four scientific endeavors: Earth Science, Heliophysics, Solar System Exploration, and Astrophysics. Goddard plays a leading role in NASA’s accomplishments by contributing compelling scientific knowledge to advance the Agency’s mission. <b>Follow us on <a href="http://twitter.com/NASA_GoddardPix" rel="nofollow">Twitter</a></b> <b>Like us on <a href="http://www.facebook.com/pages/Greenbelt-MD/NASA-Goddard/395013845897?ref=tsd" rel="nofollow">Facebook</a></b> <b>Find us on <a href="http://instagrid.me/nasagoddard/?vm=grid" rel="nofollow">Instagram</a></b>
Tropical Storm Katrina is shown here as observed by NASA QuikScatsatellite on August 25, 2005, at 08:37 UTC 4:37 a.m. in Florida. At this time, the storm had 80 kilometers per hour 50 miles per hour; 43 knots sustained winds.
NASA image acquired Sept 6, 2010 at 16 :45 UTC Tropical Storm Hermine (10L) in the Gulf of Mexico Satellite: Terra Credit: NASA/GSFC/Jeff Schmaltz/MODIS Land Rapid Response Team To learn more go to: <a href="http://www.nasa.gov/mission_pages/hurricanes/archives/2010/h2010_Hermine.html" rel="nofollow">www.nasa.gov/mission_pages/hurricanes/archives/2010/h2010...</a> <b><a href="http://www.nasa.gov/centers/goddard/home/index.html" rel="nofollow">NASA Goddard Space Flight Center</a></b> is home to the nation's largest organization of combined scientists, engineers and technologists that build spacecraft, instruments and new technology to study the Earth, the sun, our solar system, and the universe. <b>Follow us on <a href="http://twitter.com/NASA_GoddardPix" rel="nofollow">Twitter</a></b> <b>Join us on <a href="http://www.facebook.com/pages/Greenbelt-MD/NASA-Goddard/395013845897?ref=tsd" rel="nofollow">Facebook</a></b>
Visible image of Tropical Storm Erin, the Atlantic Ocean 210 miles south of Galveston, Texas, August, 2007, from the Atmospheric Infrared Sounder AIRS on NASA Aqua satellite.
On Tuesday, August 30, 2005, NASA Terra spacecraft retrieved cloud-top heights and cloud-tracked wind velocities for Tropical Storm Katrina, as the center of the storm was situated over the Tennessee Valley.
NASA new CloudSat satellite captured its first tropical storm, Alberto, as it spun over the Gulf of Mexico the morning of June 12, 2006.
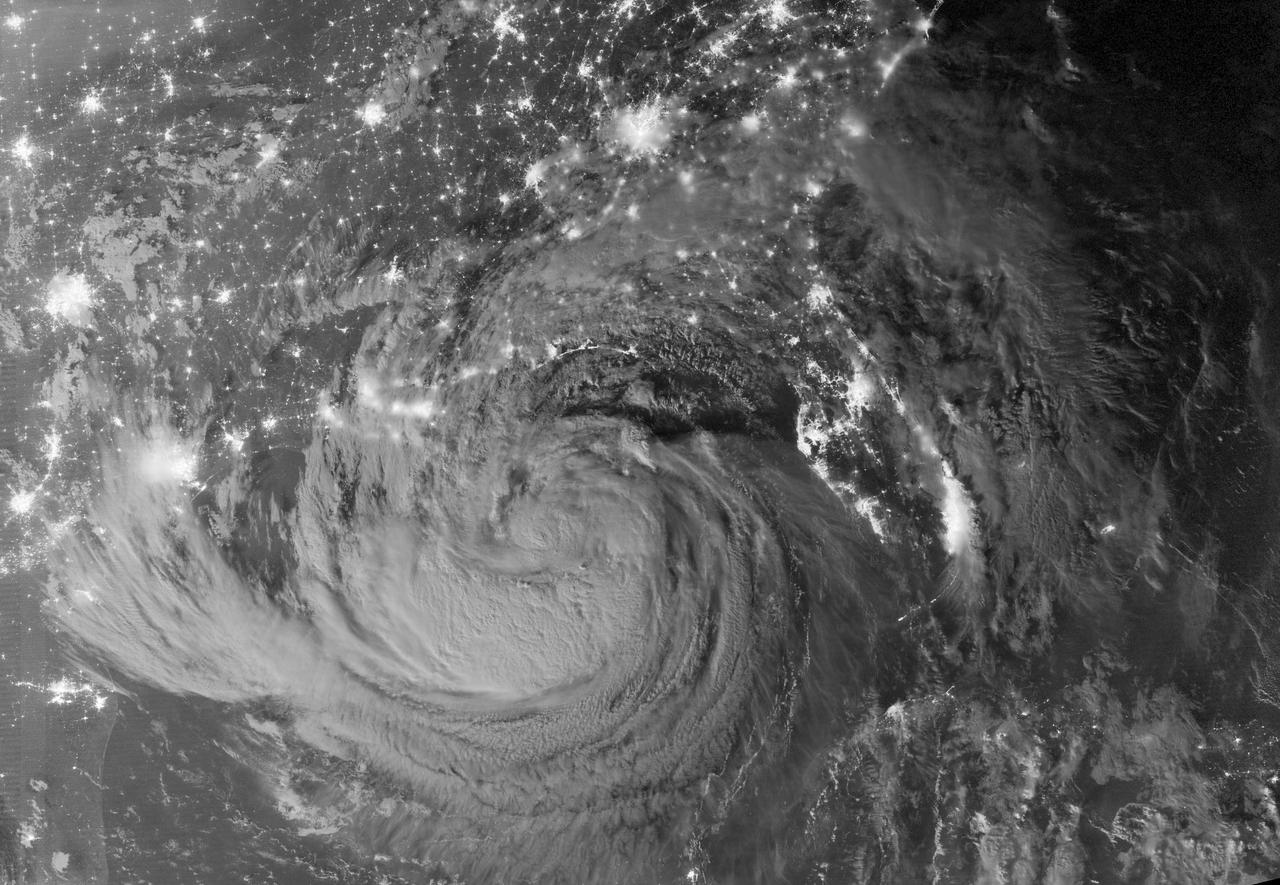
NASA image acquired August 28, 2012 Early on August 28, 2012, the Visible Infrared Imaging Radiometer Suite (VIIRS) on the Suomi-NPP satellite captured this nighttime view of Tropical Storm Isaac and the cities near the Gulf Coast of the United States. The image was acquired just after local midnight by the VIIRS “day-night band,” which detects light in a range of wavelengths from green to near-infrared and uses light intensification to enable the detection of dim signals. In this case, the clouds of Isaac were lit by moonlight. Credit: <b><a href="http://www.earthobservatory.nasa.gov/" rel="nofollow"> NASA Earth Observatory</a></b> NASA Earth Observatory image by Jesse Allen and Robert Simmon, using VIIRS Day Night Band data. <b><a href="http://www.nasa.gov/audience/formedia/features/MP_Photo_Guidelines.html" rel="nofollow">NASA image use policy.</a></b> <b><a href="http://www.nasa.gov/centers/goddard/home/index.html" rel="nofollow">NASA Goddard Space Flight Center</a></b> enables NASA’s mission through four scientific endeavors: Earth Science, Heliophysics, Solar System Exploration, and Astrophysics. Goddard plays a leading role in NASA’s accomplishments by contributing compelling scientific knowledge to advance the Agency’s mission. <b>Follow us on <a href="http://twitter.com/NASA_GoddardPix" rel="nofollow">Twitter</a></b> <b>Like us on <a href="http://www.facebook.com/pages/Greenbelt-MD/NASA-Goddard/395013845897?ref=tsd" rel="nofollow">Facebook</a></b> <b>Find us on <a href="http://instagrid.me/nasagoddard/?vm=grid" rel="nofollow">Instagram</a></b>
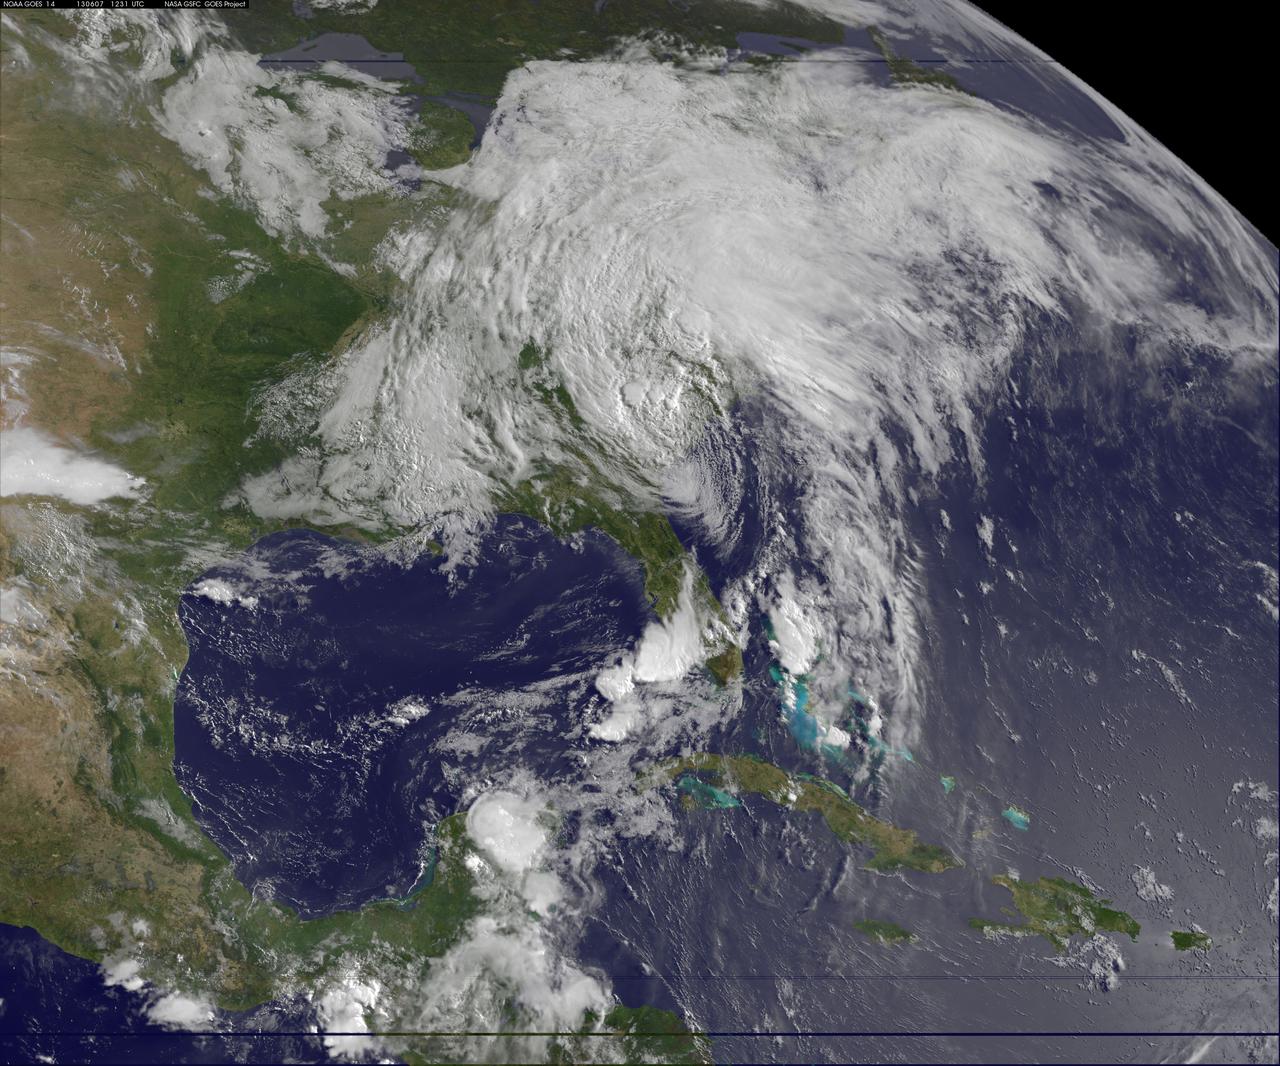
This image of tropical storm Andrea was assembled from data collected by NOAA's GOES-14 satellite at 8:31 a.m. EDT on June 7, when the storm's center was about 35 miles north-northwest of Charleston, S.C. Credit: NASA/NOAA GOES Project <b><a href="http://www.nasa.gov/audience/formedia/features/MP_Photo_Guidelines.html" rel="nofollow">NASA image use policy.</a></b> <b><a href="http://www.nasa.gov/centers/goddard/home/index.html" rel="nofollow">NASA Goddard Space Flight Center</a></b> enables NASA’s mission through four scientific endeavors: Earth Science, Heliophysics, Solar System Exploration, and Astrophysics. Goddard plays a leading role in NASA’s accomplishments by contributing compelling scientific knowledge to advance the Agency’s mission. <b>Follow us on <a href="http://twitter.com/NASA_GoddardPix" rel="nofollow">Twitter</a></b> <b>Like us on <a href="http://www.facebook.com/pages/Greenbelt-MD/NASA-Goddard/395013845897?ref=tsd" rel="nofollow">Facebook</a></b> <b>Find us on <a href="http://instagram.com/nasagoddard?vm=grid" rel="nofollow">Instagram</a></b>
This visible image of Tropical Storm Leslie and Hurricane Michael was taken by the MODIS instrument aboard both NASA's Aqua and Terra satellites on Sept. 9 at 12:50 p.m. EDT. Credit: NASA Goddard/MODIS Rapid Response Team -- Satellite images from two NASA satellites were combined to create a full picture of Tropical Storm Leslie and Hurricane Michael spinning in the Atlantic Ocean. Imagery from NASA's Aqua and Terra satellites showed Leslie now past Bermuda and Michael in the north central Atlantic, and Leslie is much larger than the smaller, more powerful Michael. Images of each storm were taken by the Moderate Resolution Imaging Spectroradiometer, or MODIS instrument that flies onboard both the Aqua and Terra satellites. Both satellites captured images of both storms on Sept. 7 and Sept. 10. The image from Sept. 7 showed a much more compact Michael with a visible eye. By Sept. 10, the eye was no longer visible in Michael and the storm appeared more elongated from south to north. To continue reading go to: <a href="http://1.usa.gov/NkUPqn" rel="nofollow">1.usa.gov/NkUPqn</a> <b><a href="http://www.nasa.gov/audience/formedia/features/MP_Photo_Guidelines.html" rel="nofollow">NASA image use policy.</a></b> <b><a href="http://www.nasa.gov/centers/goddard/home/index.html" rel="nofollow">NASA Goddard Space Flight Center</a></b> enables NASA’s mission through four scientific endeavors: Earth Science, Heliophysics, Solar System Exploration, and Astrophysics. Goddard plays a leading role in NASA’s accomplishments by contributing compelling scientific knowledge to advance the Agency’s mission. <b>Follow us on <a href="http://twitter.com/NASA_GoddardPix" rel="nofollow">Twitter</a></b> <b>Like us on <a href="http://www.facebook.com/pages/Greenbelt-MD/NASA-Goddard/395013845897?ref=tsd" rel="nofollow">Facebook</a></b> <b>Find us on <a href="http://instagrid.me/nasagoddard/?vm=grid" rel="nofollow">Instagram</a></b>
NASA Aqua spacecraft passed over Tropical Storm Don at 8:17 UTC 1:17 a.m. EDT on July 29, 2011. Texas is experiencing exceptional drought conditions; Tropical Storm Don may bring relief.
NASA's Terra satellite passed over Tropical Storm Isaac on Aug. 24 at 15:20 UTC (11:20 a.m. EDT) as it continued moving through the eastern Caribbean Sea. The MODIS instrument onboard Aqua captured this visible image. At 2 p.m. EDT on Aug. 24, Isaac's maximum sustained winds were near 60 mph (95 kmh). The National Hurricane Center noted that Isaac could strengthen later before reaching the coast of Hispaniola tonight, Aug. 24. Hispaniola is an island that contains the Dominican Republic and Haiti. Isaac is located about 135 miles (215 km) south-southeast of Port au Prince, Haiti, near latitude 16.8 north and longitude 71.4 west. Isaac is now moving toward the northwest near 14 mph (22 kmh). Isaac is expected to reach hurricane status over the weekend of Aug. 25-26 and NASA satellites will continue providing valuable temperature, rainfall, visible and infrared data. Text Credit: Rob Gutro NASA's Goddard Space Flight Center, Greenbelt, Md. <b>To read more go to: <a href="http://www.nasa.gov/mission_pages/hurricanes/archives/2012/h2012_Isaac.html" rel="nofollow">www.nasa.gov/mission_pages/hurricanes/archives/2012/h2012...</a></b> Credit: NASA Goddard MODIS Rapid Response Team <b><a href="http://www.nasa.gov/audience/formedia/features/MP_Photo_Guidelines.html" rel="nofollow">NASA image use policy.</a></b> <b><a href="http://www.nasa.gov/centers/goddard/home/index.html" rel="nofollow">NASA Goddard Space Flight Center</a></b> enables NASA’s mission through four scientific endeavors: Earth Science, Heliophysics, Solar System Exploration, and Astrophysics. Goddard plays a leading role in NASA’s accomplishments by contributing compelling scientific knowledge to advance the Agency’s mission. <b>Follow us on <a href="http://twitter.com/NASA_GoddardPix" rel="nofollow">Twitter</a></b> <b>Like us on <a href="http://www.facebook.com/pages/Greenbelt-MD/NASA-Goddard/395013845897?ref=tsd" rel="nofollow">Facebook</a></b> <b>Find us on <a href="http://instagrid.me/nasagoddard/?vm=grid" rel="nofollow">Instagram</a></b>
NASA's Aqua satellite passed over Extra-Tropical Storm Vongfong on Oct. 4 as it was moving away from Hokkaido, Japan, the northernmost of the big islands. Vongfong transitioned into an extra-tropical storm early on Oct. 4 as its core changed from warm to cold. The MODIS or Moderate Resolution Imaging Spectroradiometer instrument aboard NASA's Aqua satellite captured a visible image of Tropical Storm Vongfong over Japan on Oct. 14 at 03:15 UTC as it was southeast of the island of Hokkaido, Japan. The image showed that south of the center of circulation was almost devoid of clouds and showers, which were all pushed to the north and east of the center as a result of southwesterly wind shear. At 0300 UTC on Oct. 14, the Joint Typhoon Warning Center issued its final advisory on Tropical storm Vongfong. At that time Vongfong's center was located near 29.1 north latitude and 142.9 east longitude, about 111 nautical miles (127.7 miles/205.6 km) southeast of Misawa, Japan. Vongfong was moving to the northeast at a speedy 36 knots (41.4 mph/66.67 kph). Vongfong's maximum sustained winds were near 35 knots (40.2 mph/64.8 kph). Vongfong had transitioned into an extra-tropical system and will continue to move away from northern Japan and over the northwestern Pacific Ocean. Credit: NASA/GSFC/Jeff Schmaltz/MODIS Land Rapid Response Team <b><a href="http://www.nasa.gov/audience/formedia/features/MP_Photo_Guidelines.html" rel="nofollow">NASA image use policy.</a></b> <b><a href="http://www.nasa.gov/centers/goddard/home/index.html" rel="nofollow">NASA Goddard Space Flight Center</a></b> enables NASA’s mission through four scientific endeavors: Earth Science, Heliophysics, Solar System Exploration, and Astrophysics. Goddard plays a leading role in NASA’s accomplishments by contributing compelling scientific knowledge to advance the Agency’s mission. <b>Follow us on <a href="http://twitter.com/NASAGoddardPix" rel="nofollow">Twitter</a></b> <b>Like us on <a href="http://www.facebook.com/pages/Greenbelt-MD/NASA-Goddard/395013845897?ref=tsd" rel="nofollow">Facebook</a></b> <b>Find us on <a href="http://instagram.com/nasagoddard?vm=grid" rel="nofollow">Instagram</a></b>
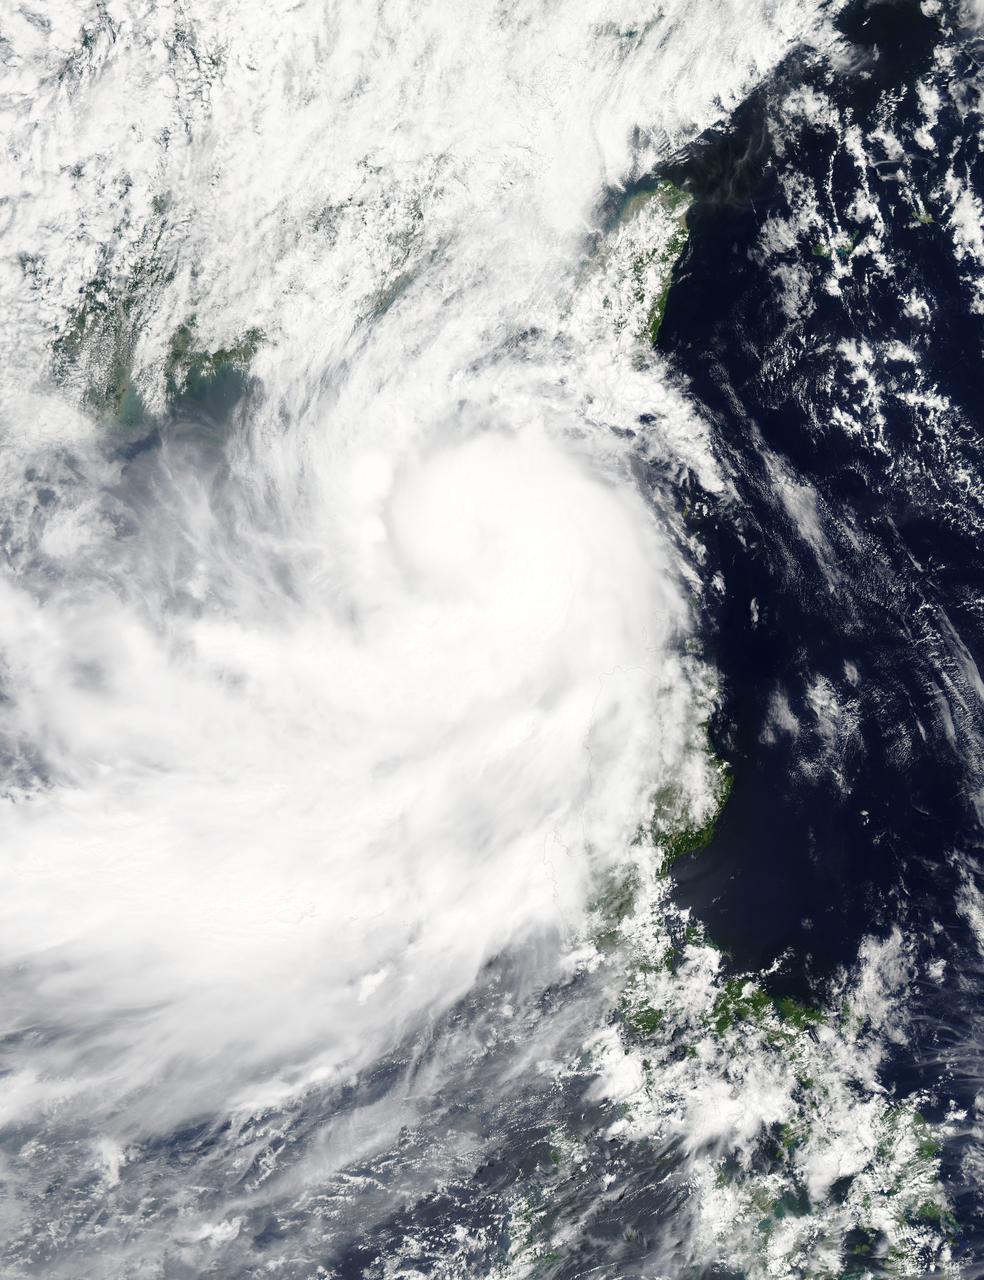
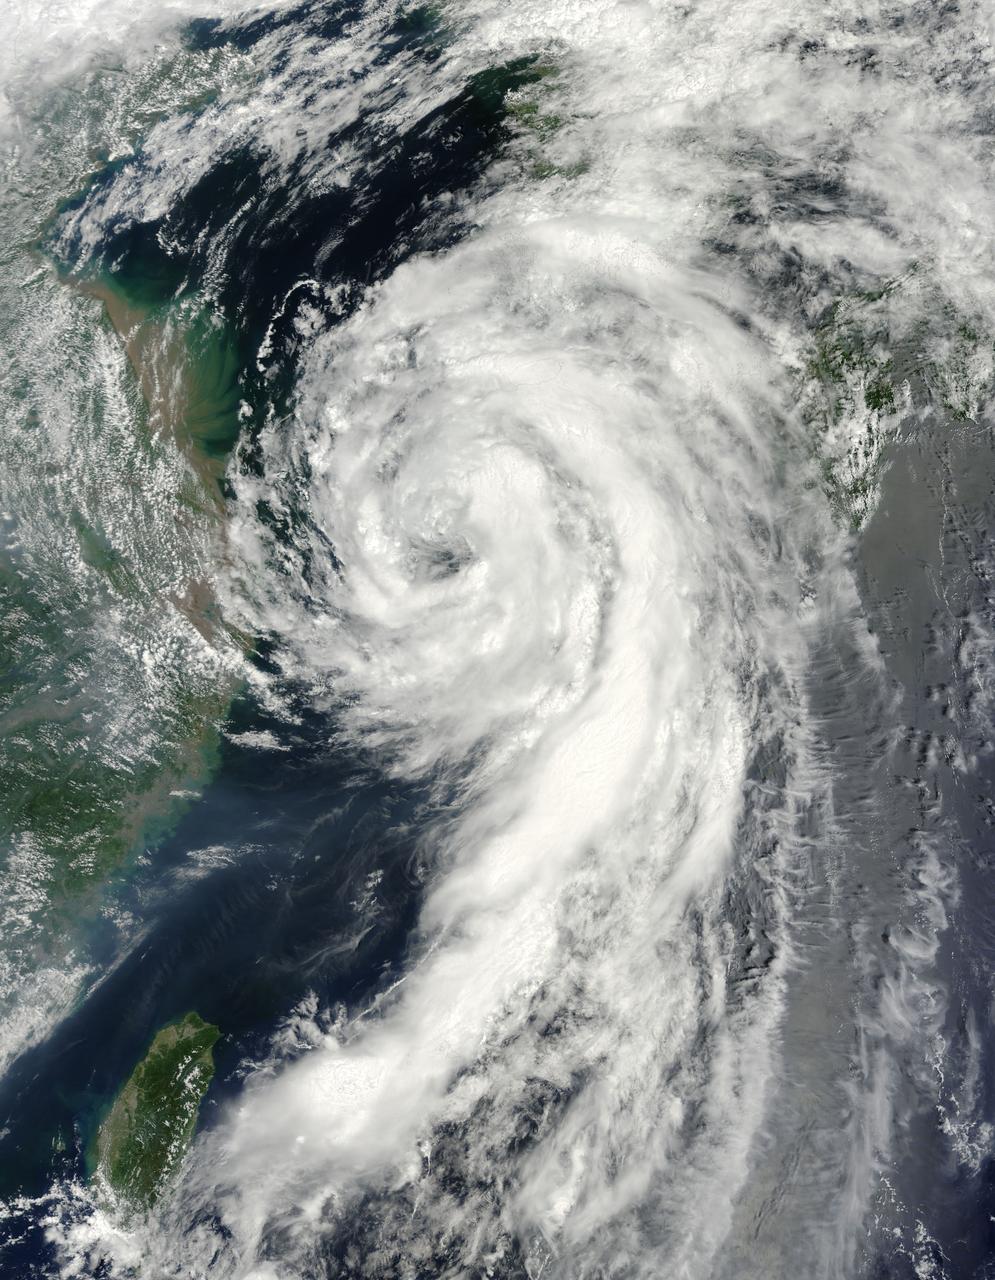
NASA's Aqua satellite captured a picture of Tropical Storm Linfa in the South China Sea on July 7 when it was between southern Taiwan and the northern Philippines. Aqua passed over Linfa on July 7 at 05:25 UTC (1:25 a.m. EDT) and the Moderate Resolution Imaging Spectroradiometer or MODIS instrument captured a visible image of the storm. Bands of thunderstorms wrapping into the center of circulation from the south, draped over western Luzon. The MODIS image showed the tight concentration of thunderstorms around Linfa's center were located over the South China Sea. Fragmented bands of thunderstorms north of the center were brushing over Southern Taiwan while clouds from another band of fragmented thunderstorms stretched northwest through the Taiwan Strait. On July 7 at 1500 UTC (11 a.m. EDT), Tropical Storm Linfa's maximum sustained winds had increased to 50 knots (57.5 mph/92.6 kph), up from 45 knots (51.7 mph/83.3 kph) six hours before. Linfa strengthened in the warm waters of the South China Sea now that its center has moved away from the northern Philippines and was no longer over land. Linfa was centered near 21.0 North latitude and 118.8 East longitude, about 277 nautical miles (319 miles/513.3 km) east-southeast of Hong Kong, China. Linfa has tracked northward at 3 knots (3.5 mph/5.5 kph). China's National Meteorological Centre has (CNMC) issued a yellow category warning of typhoon at 6:00 a.m. July 7, Beijing Time. CNMC noted that Linfa is the tenth typhoon this year and at that time it was centered about 430 km (267.2 miles) southeast of border between Fujian and Guangdong For updated warnings and watches from the China Meteorological Service, visit: <a href="http://www.cma.gov.cn/en/WeatherWarnings/" rel="nofollow">www.cma.gov.cn/en/WeatherWarnings/</a>. Linfa is moving north between Luzon and Taiwan. The Joint Typhoon Warning Center expects Linfa to strengthen to 60 knots (69 mph/111 kph) by mid-day on July 9, before weakening and then making landfall in mainland China. Credit: NASA/GSFC/Jeff Schmaltz/MODIS Land Rapid Response Team <b><a href="http://www.nasa.gov/audience/formedia/features/MP_Photo_Guidelines.html" rel="nofollow">NASA image use policy.</a></b> <b><a href="http://www.nasa.gov/centers/goddard/home/index.html" rel="nofollow">NASA Goddard Space Flight Center</a></b> enables NASA’s mission through four scientific endeavors: Earth Science, Heliophysics, Solar System Exploration, and Astrophysics. Goddard plays a leading role in NASA’s accomplishments by contributing compelling scientific knowledge to advance the Agency’s mission. <b>Follow us on <a href="http://twitter.com/NASAGoddardPix" rel="nofollow">Twitter</a></b> <b>Like us on <a href="http://www.facebook.com/pages/Greenbelt-MD/NASA-Goddard/395013845897?ref=tsd" rel="nofollow">Facebook</a></b> <b>Find us on <a href="http://instagrid.me/nasagoddard/?vm=grid" rel="nofollow">Instagram</a></b>
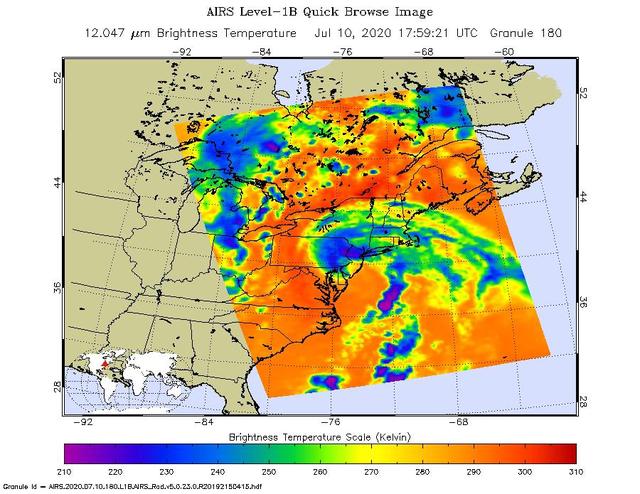
NASA's Atmospheric Infrared Sounder (AIRS) collected this image of Tropical Storm Fay over New England at around 2 p.m. local time on Friday, July 10. The center of the storm made landfall about 10 miles (15 kilometers) north-northeast of Atlantic City, New Jersey, at around 5 p.m. local time, when Fay had maximum sustained winds of around 50 mph (85 kph). In the infrared AIRS image, the purple regions indicate very cold clouds lofted high into the atmosphere by the storm. These clouds are generally linked to heavy rainfall. Warmer clouds closer to the ground show up as green and blue, while the orange areas denote mostly cloud-free parts of the sky. AIRS, together with the Advanced Microwave Sounding Unit (AMSU), measures the infrared and microwave radiation emitted from Earth to study the planet's weather and climate. Both instruments observe Earth from NASA's Aqua satellite, which launched in 2002. AIRS and AMSU work in tandem to make simultaneous observations down to Earth's surface, even in the presence of heavy clouds. With more than 2,000 channels sensing different regions of the atmosphere, the system creates a global, three-dimensional map of atmospheric temperature and humidity, cloud amounts and heights, greenhouse gas concentrations, and many other atmospheric phenomena. https://photojournal.jpl.nasa.gov/catalog/PIA23783

Radar and satellite imagery indicate that the convective organization of the cyclone has improved, and the cyclone is being upgraded based on a sustained wind report of 33 kt from Settlement Point, Grand Bahama Island earlier this morning. Low shear conditions and warm sea-surface temperatures should allow for at least steady strengthening, and the cyclone is expected to become a hurricane by 72 hours. This image was taken by GOES East at 1445Z on July 1, 2014. <b><a href="http://goes.gsfc.nasa.gov/" rel="nofollow">Credit: NOAA/NASA GOES Project</a></b> Caption: NOAA <b><a href="http://www.nasa.gov/audience/formedia/features/MP_Photo_Guidelines.html" rel="nofollow">NASA image use policy.</a></b> <b><a href="http://www.nasa.gov/centers/goddard/home/index.html" rel="nofollow">NASA Goddard Space Flight Center</a></b> enables NASA’s mission through four scientific endeavors: Earth Science, Heliophysics, Solar System Exploration, and Astrophysics. Goddard plays a leading role in NASA’s accomplishments by contributing compelling scientific knowledge to advance the Agency’s mission. <b>Follow us on <a href="http://twitter.com/NASAGoddardPix" rel="nofollow">Twitter</a></b> <b>Like us on <a href="http://www.facebook.com/pages/Greenbelt-MD/NASA-Goddard/395013845897?ref=tsd" rel="nofollow">Facebook</a></b> <b>Find us on <a href="http://instagram.com/nasagoddard?vm=grid" rel="nofollow">Instagram</a></b>
This is a satellite image from the MODIS instrument aboard NASA's Terra satellite of Tropical Storm Andrea that was captured today, June 7 at 12:10 p.m. EDT- as Andrea makes its way up the U.S. East coast. At this time, Andrea was centered over North Carolina. Credit: NASA Goddard MODIS Rapid Response Team <b><a href="http://www.nasa.gov/audience/formedia/features/MP_Photo_Guidelines.html" rel="nofollow">NASA image use policy.</a></b> <b><a href="http://www.nasa.gov/centers/goddard/home/index.html" rel="nofollow">NASA Goddard Space Flight Center</a></b> enables NASA’s mission through four scientific endeavors: Earth Science, Heliophysics, Solar System Exploration, and Astrophysics. Goddard plays a leading role in NASA’s accomplishments by contributing compelling scientific knowledge to advance the Agency’s mission. <b>Follow us on <a href="http://twitter.com/NASA_GoddardPix" rel="nofollow">Twitter</a></b> <b>Like us on <a href="http://www.facebook.com/pages/Greenbelt-MD/NASA-Goddard/395013845897?ref=tsd" rel="nofollow">Facebook</a></b> <b>Find us on <a href="http://instagram.com/nasagoddard?vm=grid" rel="nofollow">Instagram</a></b>
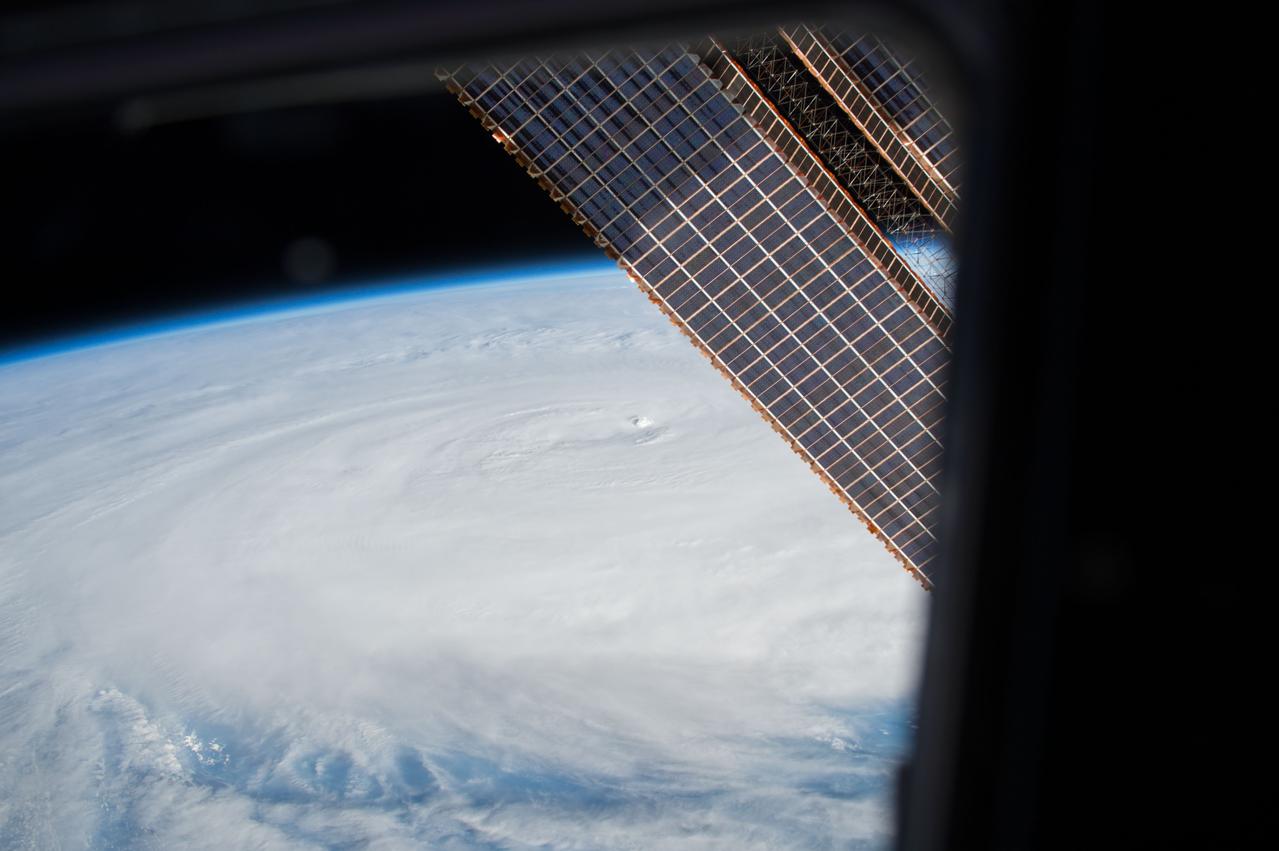
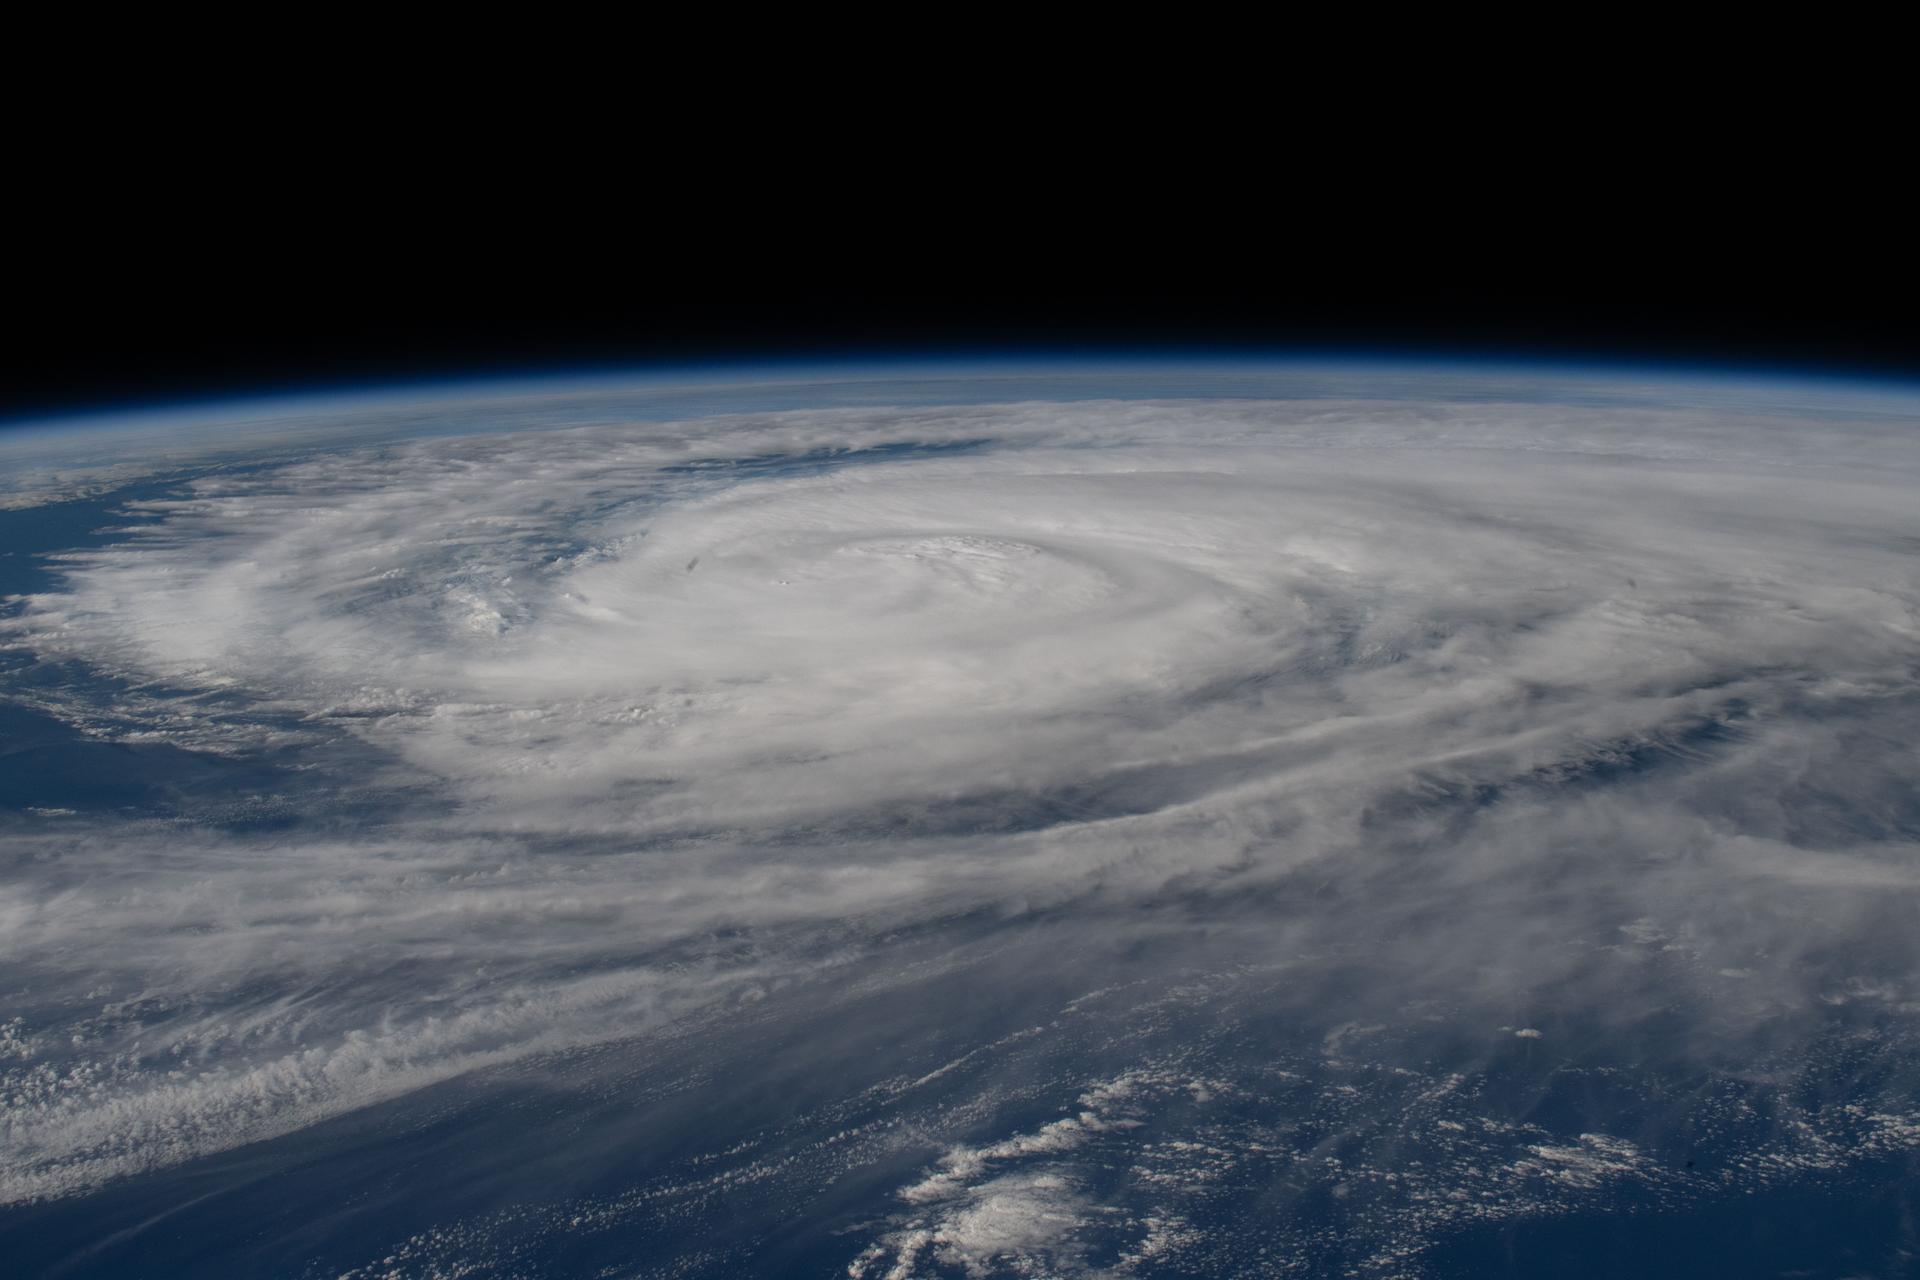
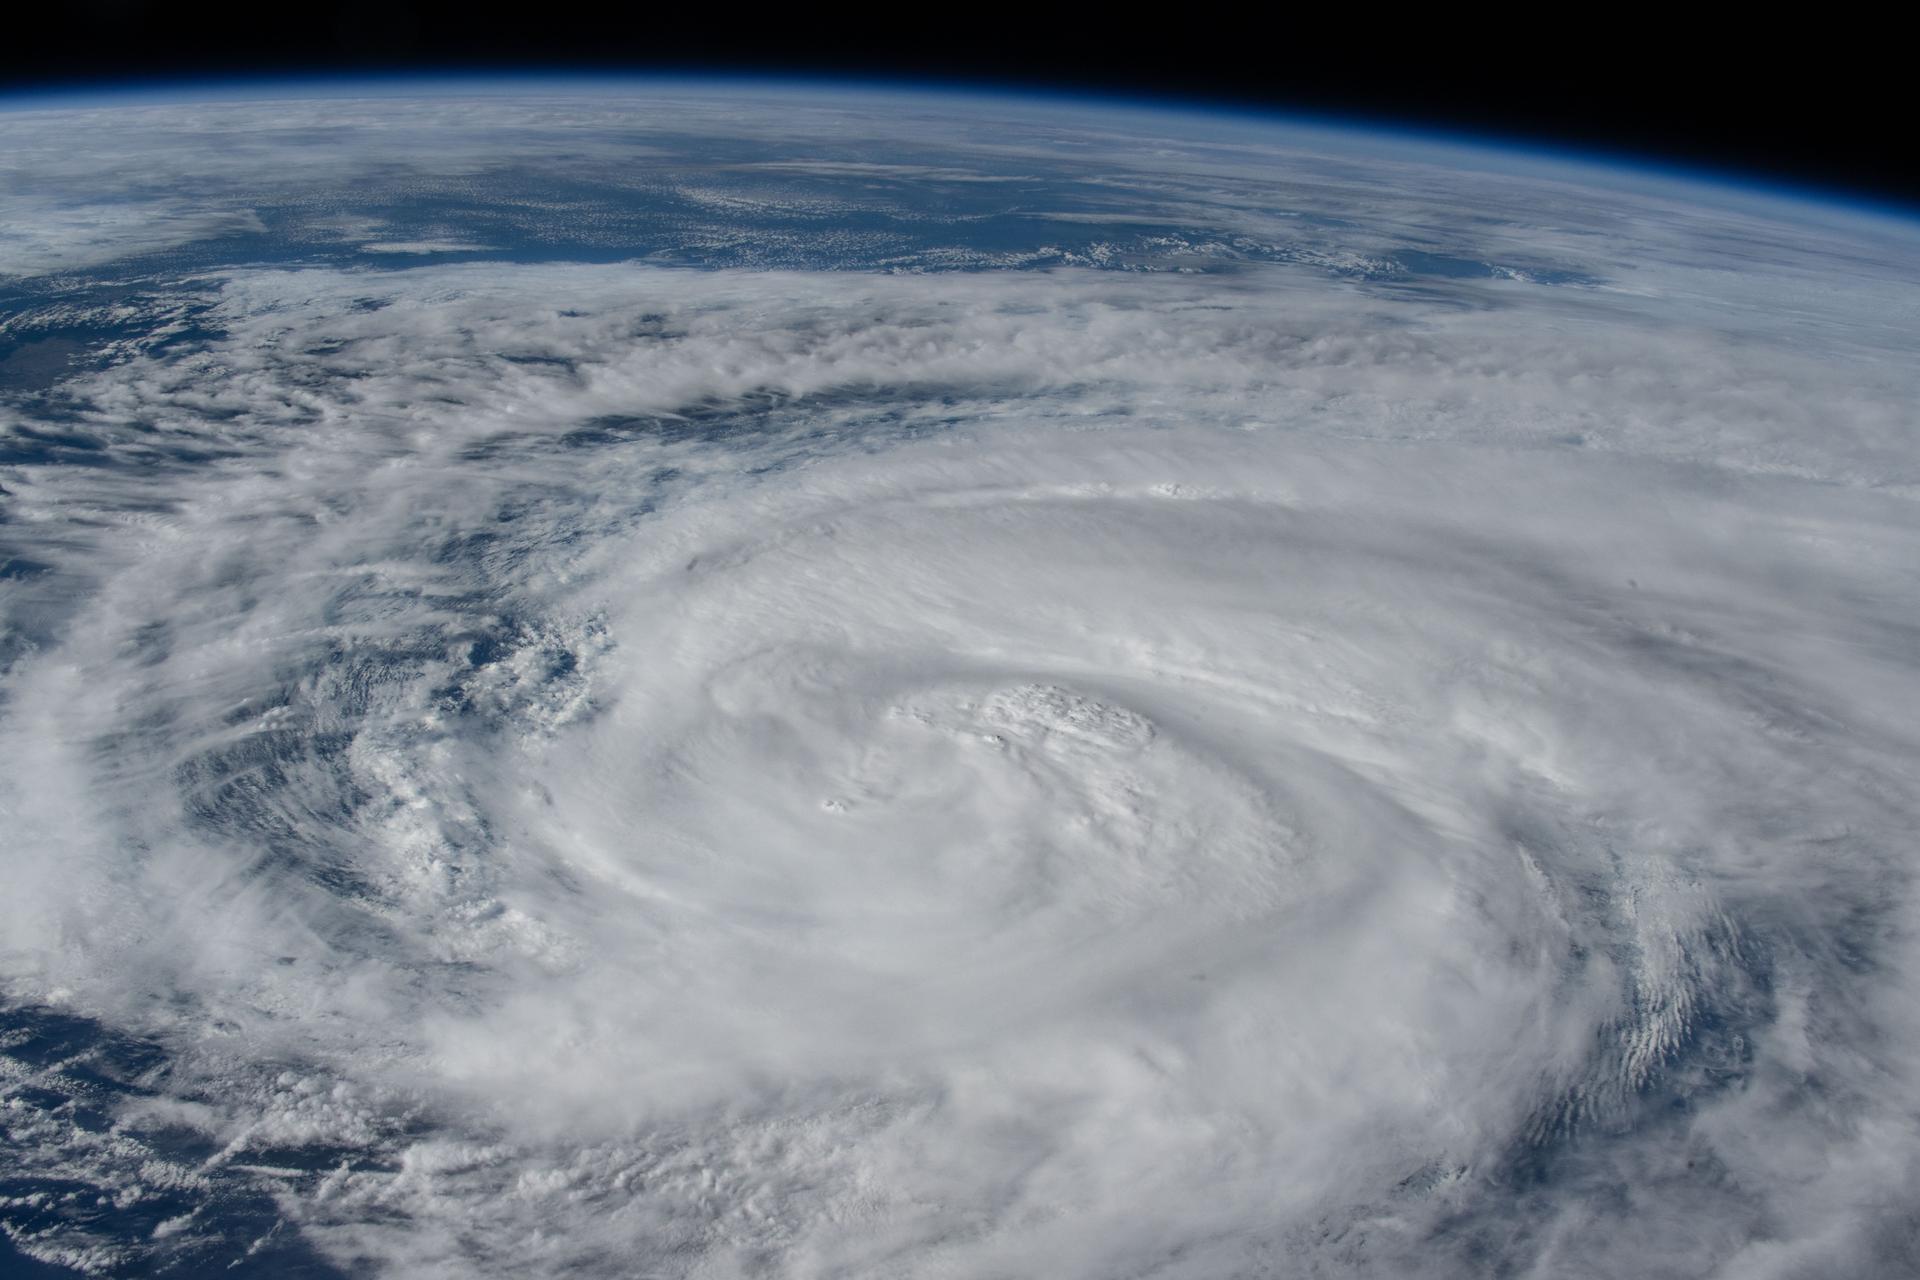
iss050e060444 (03/27/2017) --- Tropical Cyclone Debbie as photographed by crewmembers aboard the International Space Station on March 27, 2017. The large storm made landfall across the northeastern coast of Australia on March 28.
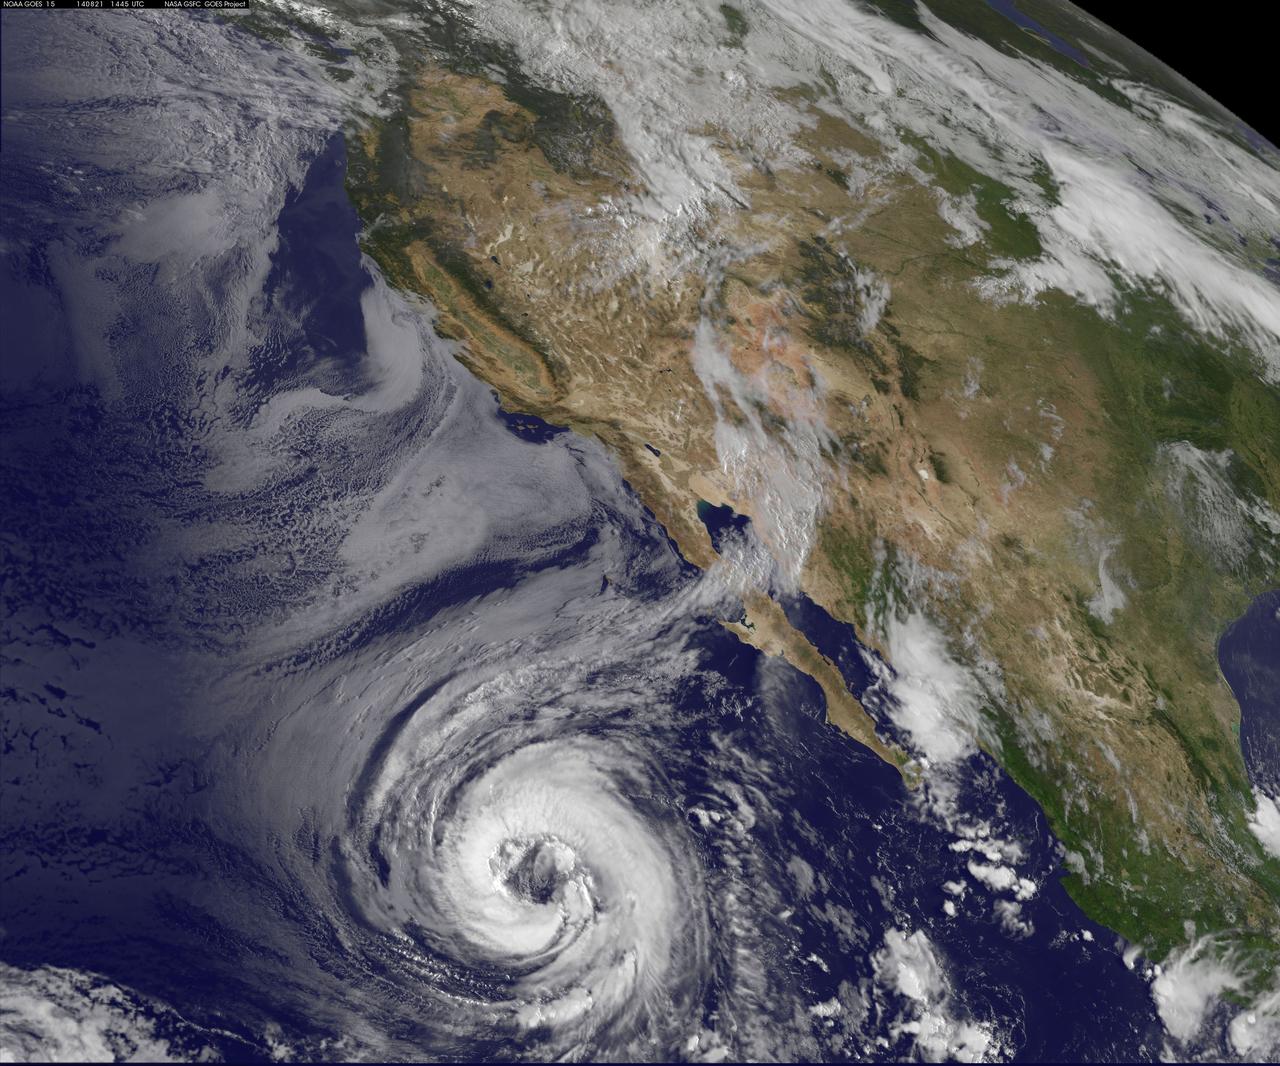
NOAA's GOES-West satellite watched as Tropical Storm Lowell strengthened into a large hurricane during the morning of August 21 and opened its eye. Hurricane force winds extend outward up to 60 miles (95 km) from the center, while tropical storm force winds extend outward up to 185 miles (295 km). The storm stretches over a greater distance. Lowell became the seventh hurricane of the Eastern Pacific Ocean season today, August 21 at 11 a.m. EDT (1500 UTC). Maximum sustained winds had increased to 75 mph (120 kph) making Lowell a Category One hurricane on the Saffir-Simpson Wind Scale. Little change in intensity is forecast by the National Hurricane Center (NHC) today, and NHC forecasters expect a slow weakening trend later today through August 22. It was centered near latitude 20.0 north and longitude 122.1 west, about 810 miles (1,300 km) west-southwest of the southern tip of Baja California, Mexico. It is moving to the northwest near 3 mph (4 kph) and is expected to move faster in that direction over the next two days. The NHC said that Lowell should begin to slowly weaken by August 22 as it moves over progressively cooler waters and into a drier and more stable air mass. Since Lowell is such a large cyclone, it will likely take longer than average to spin down. The GOES-West image of Lowell was created at the NASA/NOAA GOES Project, located at NASA's Goddard Space Flight Center in Greenbelt, Maryland. Rob Gutro NASA's Goddard Space Flight Center <b><a href="http://goes.gsfc.nasa.gov/" rel="nofollow">Credit: NOAA/NASA GOES Project</a></b> <b><a href="http://www.nasa.gov/audience/formedia/features/MP_Photo_Guidelines.html" rel="nofollow">NASA image use policy.</a></b> <b><a href="http://www.nasa.gov/centers/goddard/home/index.html" rel="nofollow">NASA Goddard Space Flight Center</a></b> enables NASA’s mission through four scientific endeavors: Earth Science, Heliophysics, Solar System Exploration, and Astrophysics. Goddard plays a leading role in NASA’s accomplishments by contributing compelling scientific knowledge to advance the Agency’s mission. <b>Follow us on <a href="http://twitter.com/NASAGoddardPix" rel="nofollow">Twitter</a></b> <b>Like us on <a href="http://www.facebook.com/pages/Greenbelt-MD/NASA-Goddard/395013845897?ref=tsd" rel="nofollow">Facebook</a></b> <b>Find us on <a href="http://instagram.com/nasagoddard?vm=grid" rel="nofollow">Instagram</a></b>
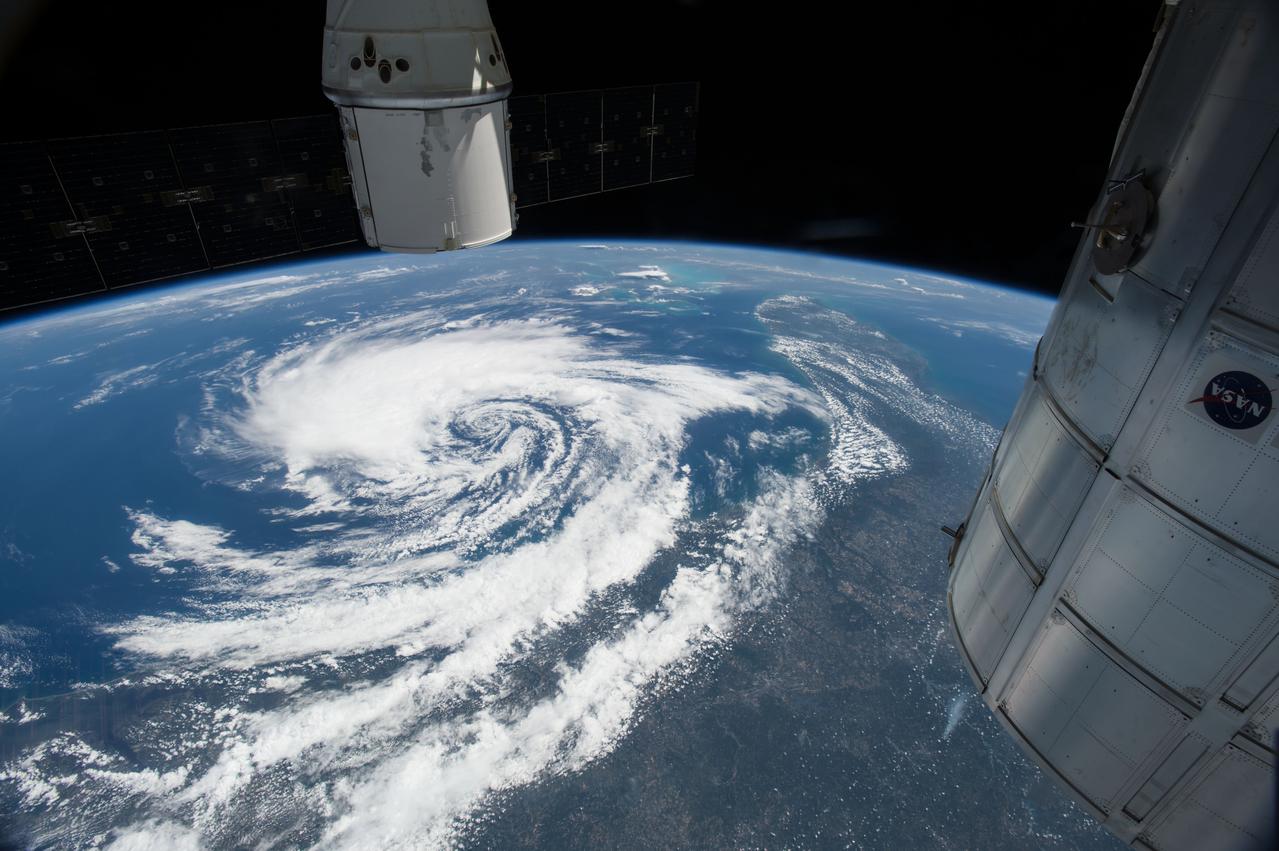
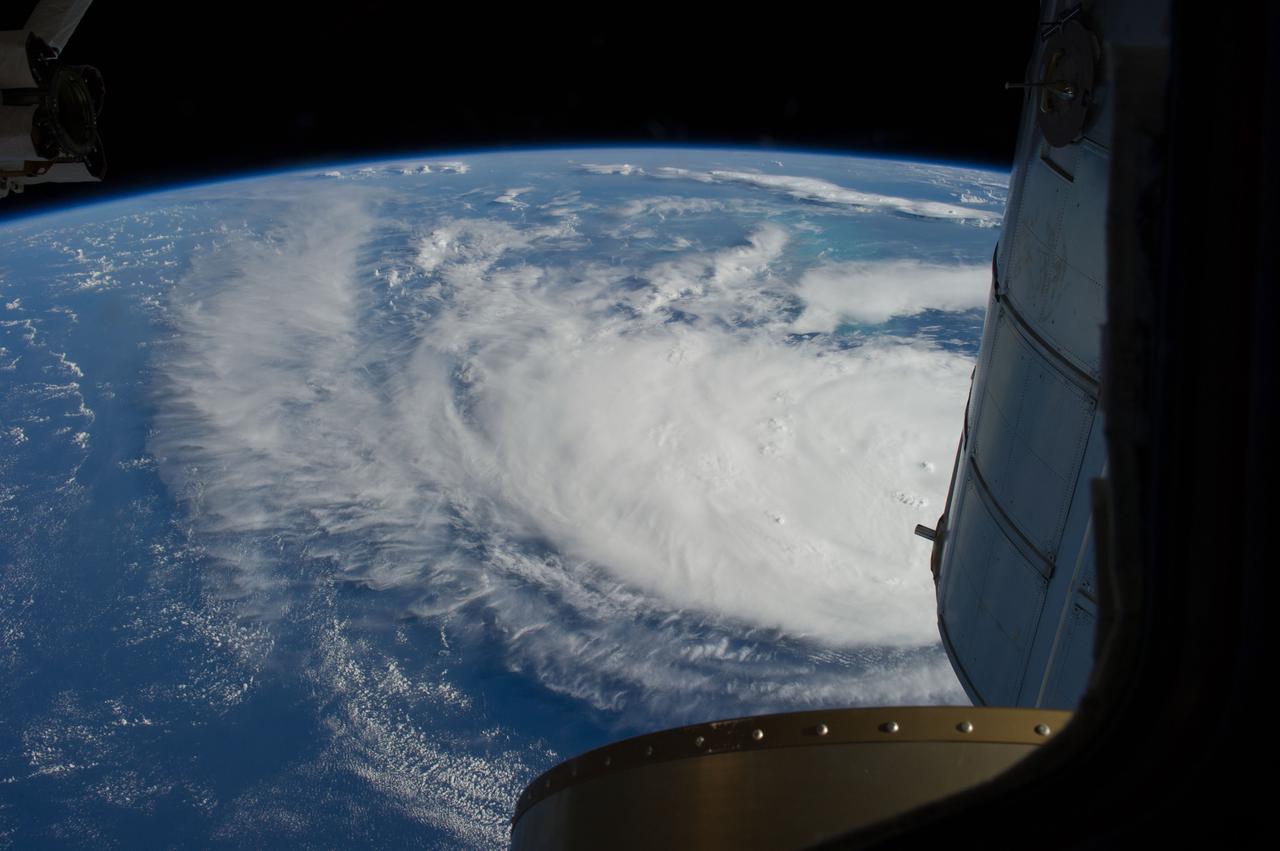
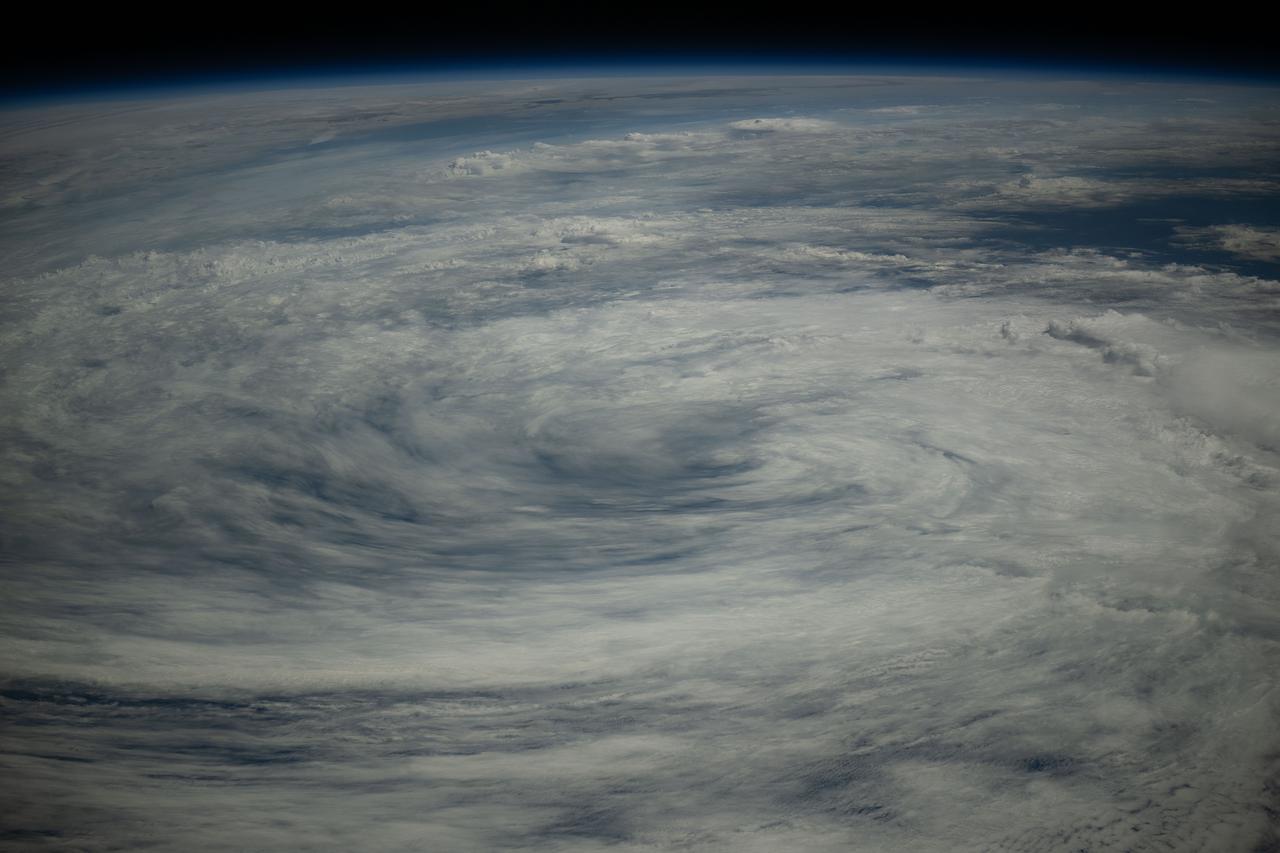
ISS043E182261 (05/08/2015) --- This image of Tropical Storm Anna taken from the International Space Station displays the view looking south-southeastward from western Virginia towards storm about 200 miles east of Savannah, Georgia, Bahamas and Florida in the distance. Expedition 43 NASA astronaut Scott Kelly and his crewmates captured many images of the Earth showing the storms progression onto the Carolina's and other east coast states.
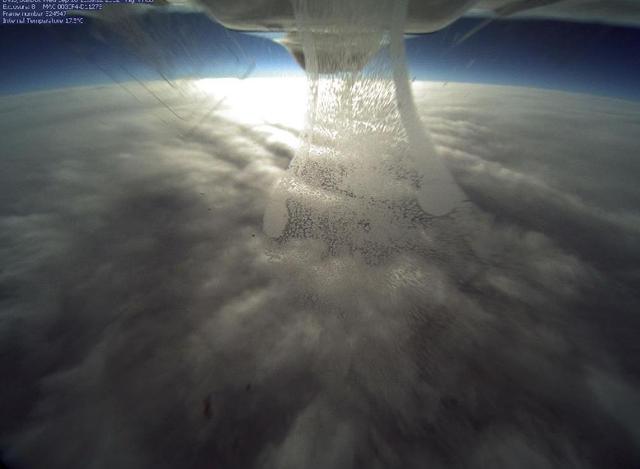
NASA's Global Hawk flew over Tropical Storm Nadine on Sept. 26, 2012 at 3 p.m. EDT and captured this photo from the camera located in the belly if the aircraft as it flew over the northern edge of the storm. Credit: NASA <b><a href="http://www.nasa.gov/audience/formedia/features/MP_Photo_Guidelines.html" rel="nofollow">NASA image use policy.</a></b> <b><a href="http://www.nasa.gov/centers/goddard/home/index.html" rel="nofollow">NASA Goddard Space Flight Center</a></b> enables NASA’s mission through four scientific endeavors: Earth Science, Heliophysics, Solar System Exploration, and Astrophysics. Goddard plays a leading role in NASA’s accomplishments by contributing compelling scientific knowledge to advance the Agency’s mission. <b>Follow us on <a href="http://twitter.com/NASA_GoddardPix" rel="nofollow">Twitter</a></b> <b>Like us on <a href="http://www.facebook.com/pages/Greenbelt-MD/NASA-Goddard/395013845897?ref=tsd" rel="nofollow">Facebook</a></b> <b>Find us on <a href="http://instagrid.me/nasagoddard/?vm=grid" rel="nofollow">Instagram</a></b>
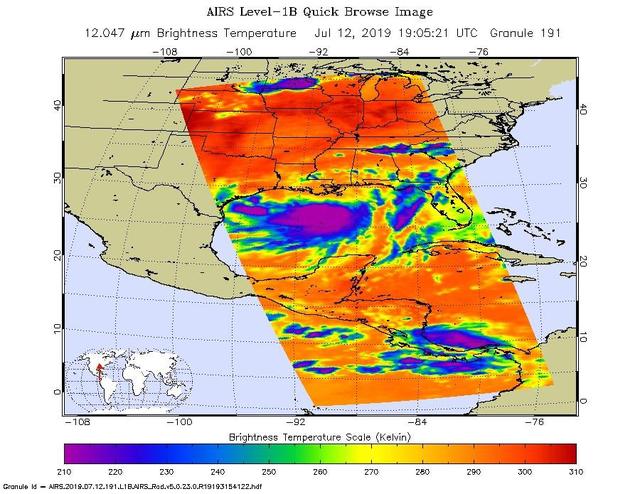
NASA's AIRS instrument imaged Tropical Storm Barry on the afternoon of July 12, 2019, a day before the storm is expected to make landfall on the Louisiana Coast. The infrared image shows very cold clouds that have been carried high into the atmosphere by deep thunderstorms in purple. These clouds are associated with heavy rainfall. Warmer areas with shallower rain clouds are shown in blue and green. And the orange and red areas represent mostly cloud-free air. https://photojournal.jpl.nasa.gov/catalog/PIA23355
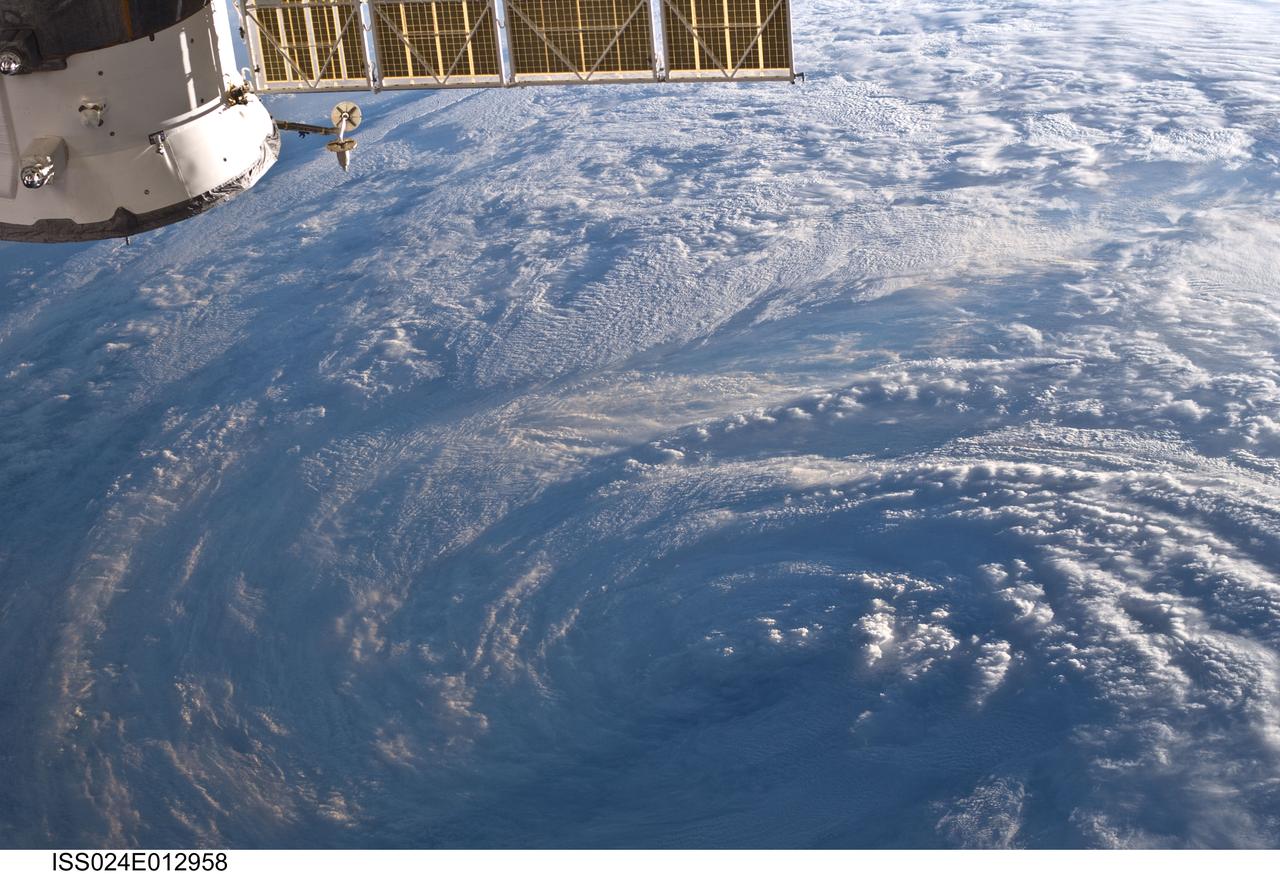
ISS024-E-012958 (30 Aug. 2010) --- Tropical Storm Danielle is featured in this Aug. 30 image photographed by an Expedition 24 crew member on the International Space Station.
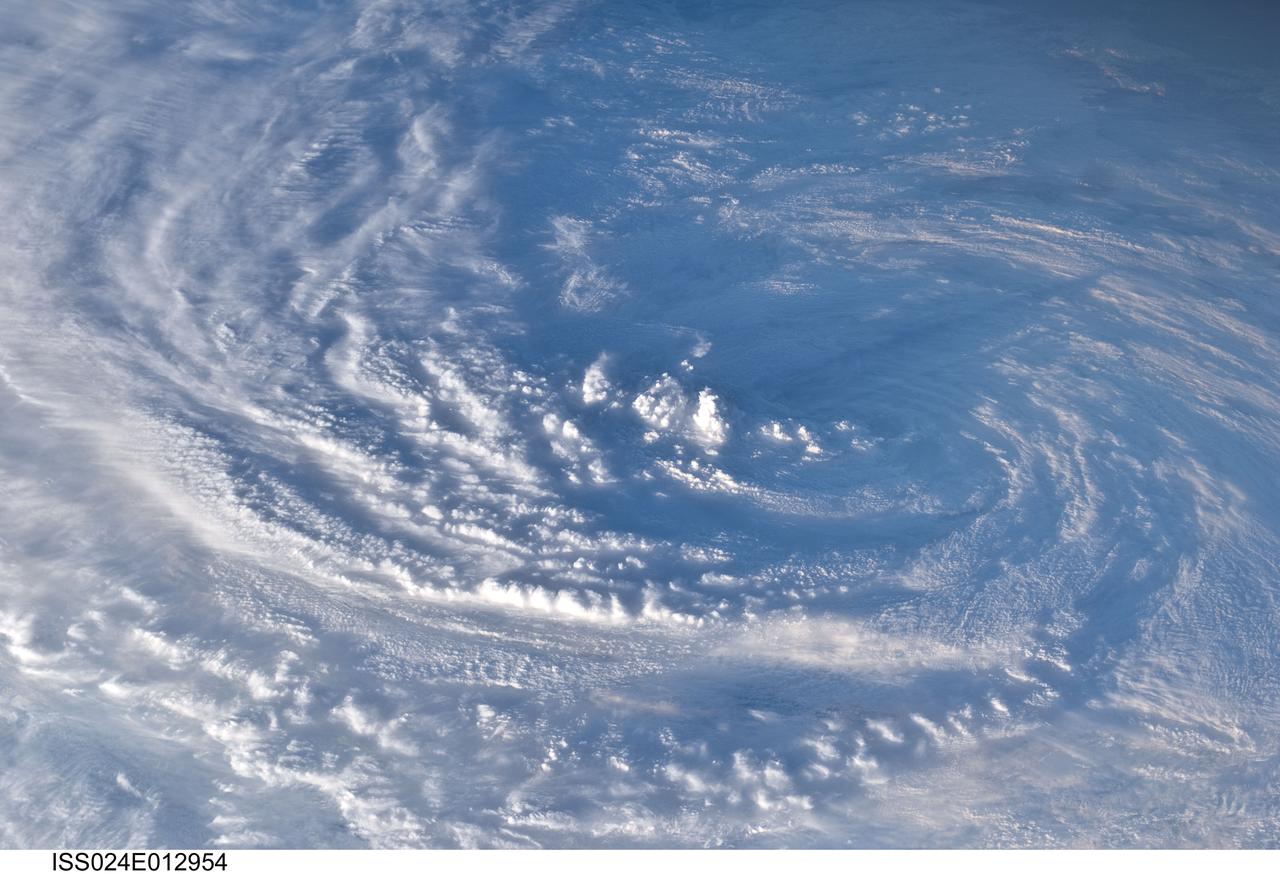
ISS024-E-012954 (30 Aug. 2010) --- Tropical Storm Danielle is featured in this Aug. 30 image photographed by an Expedition 24 crew member on the International Space Station.

ISS024-E-012926 (30 Aug. 2010) --- Tropical Storm Danielle is featured in this Aug. 30 image photographed by an Expedition 24 crew member on the International Space Station.
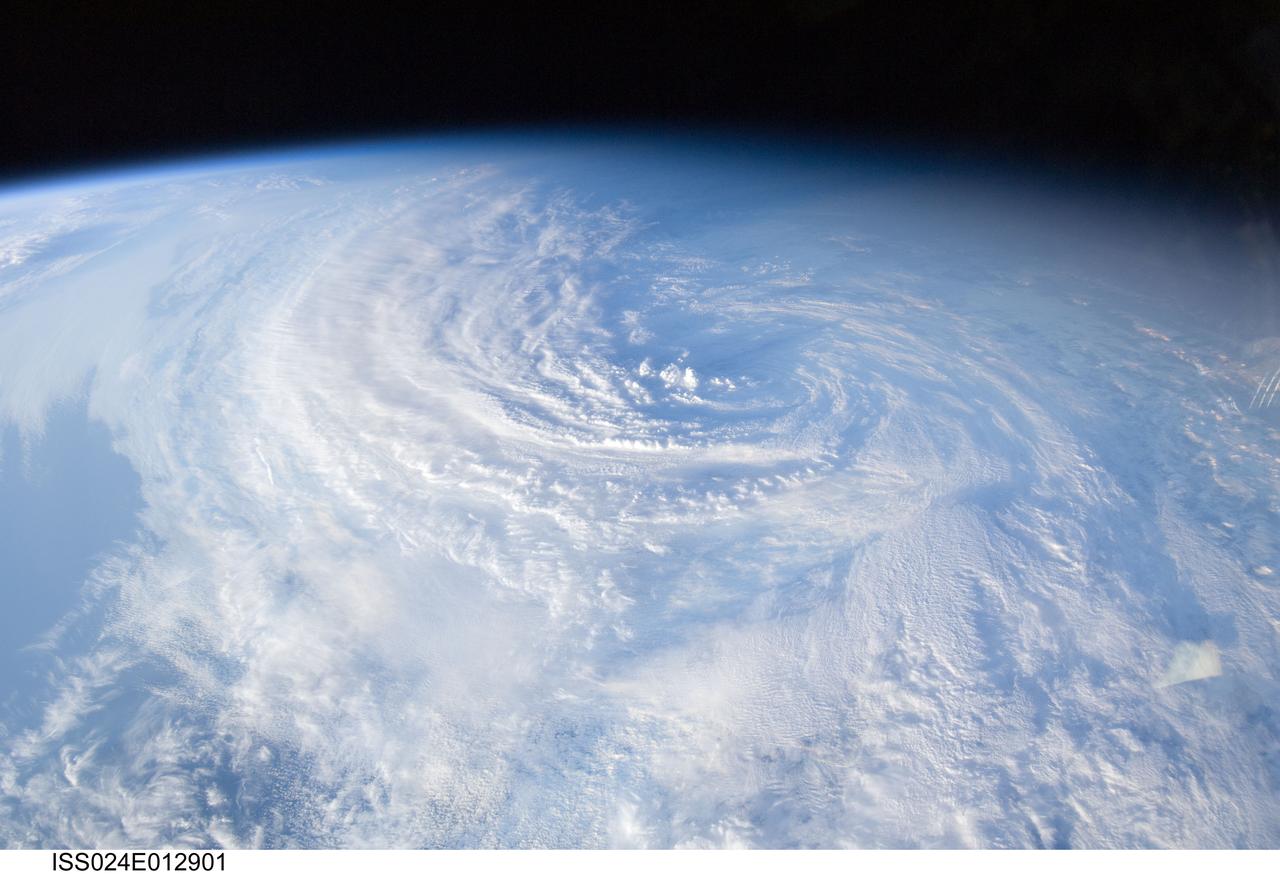
ISS024-E-012901 (30 Aug. 2010) --- Tropical Storm Danielle is featured in this Aug. 30 image photographed by an Expedition 24 crew member on the International Space Station.
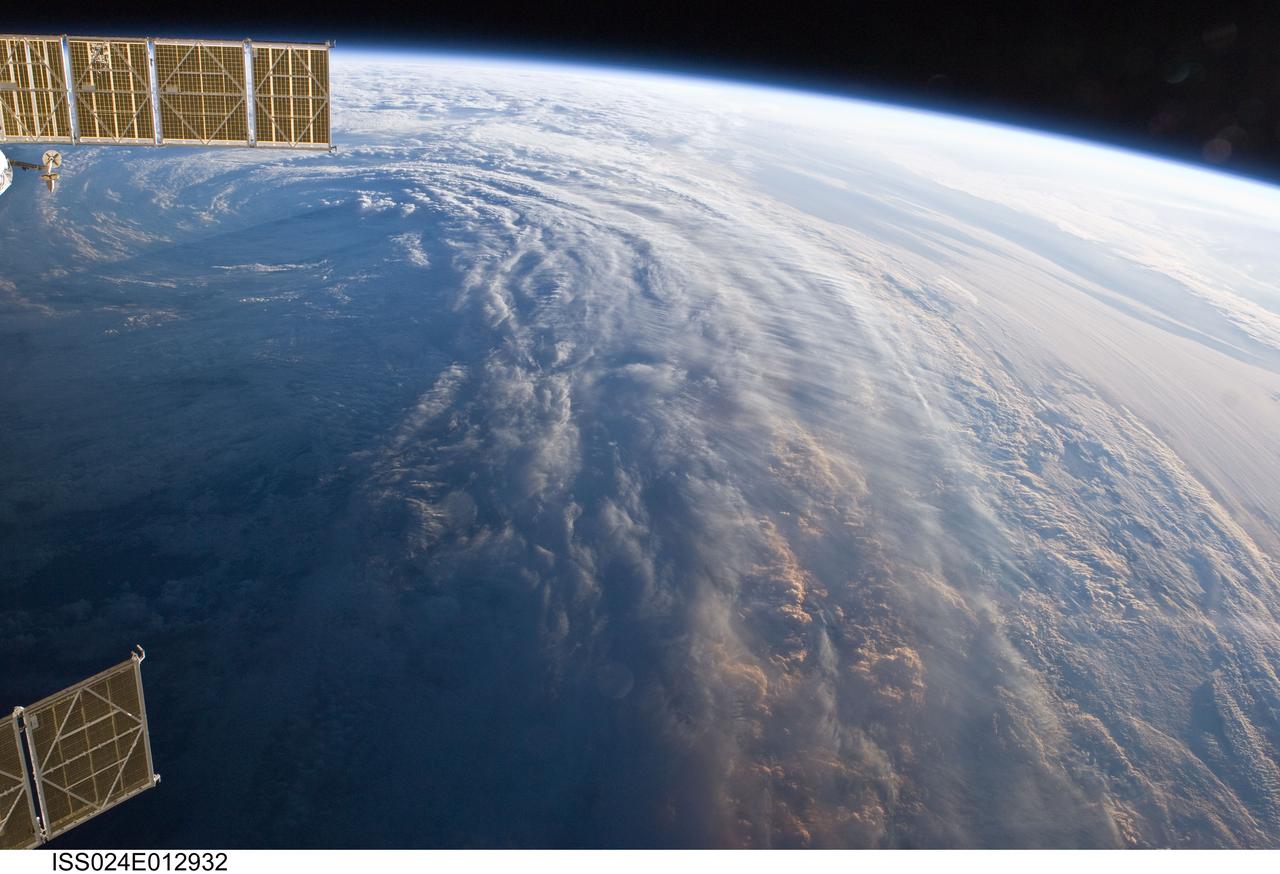
ISS024-E-012932 (30 Aug. 2010) --- Tropical Storm Danielle is featured in this Aug. 30 image photographed by an Expedition 24 crew member on the International Space Station.

ISS024-E-012930 (30 Aug. 2010) --- Tropical Storm Danielle is featured in this Aug. 30 image photographed by an Expedition 24 crew member on the International Space Station.
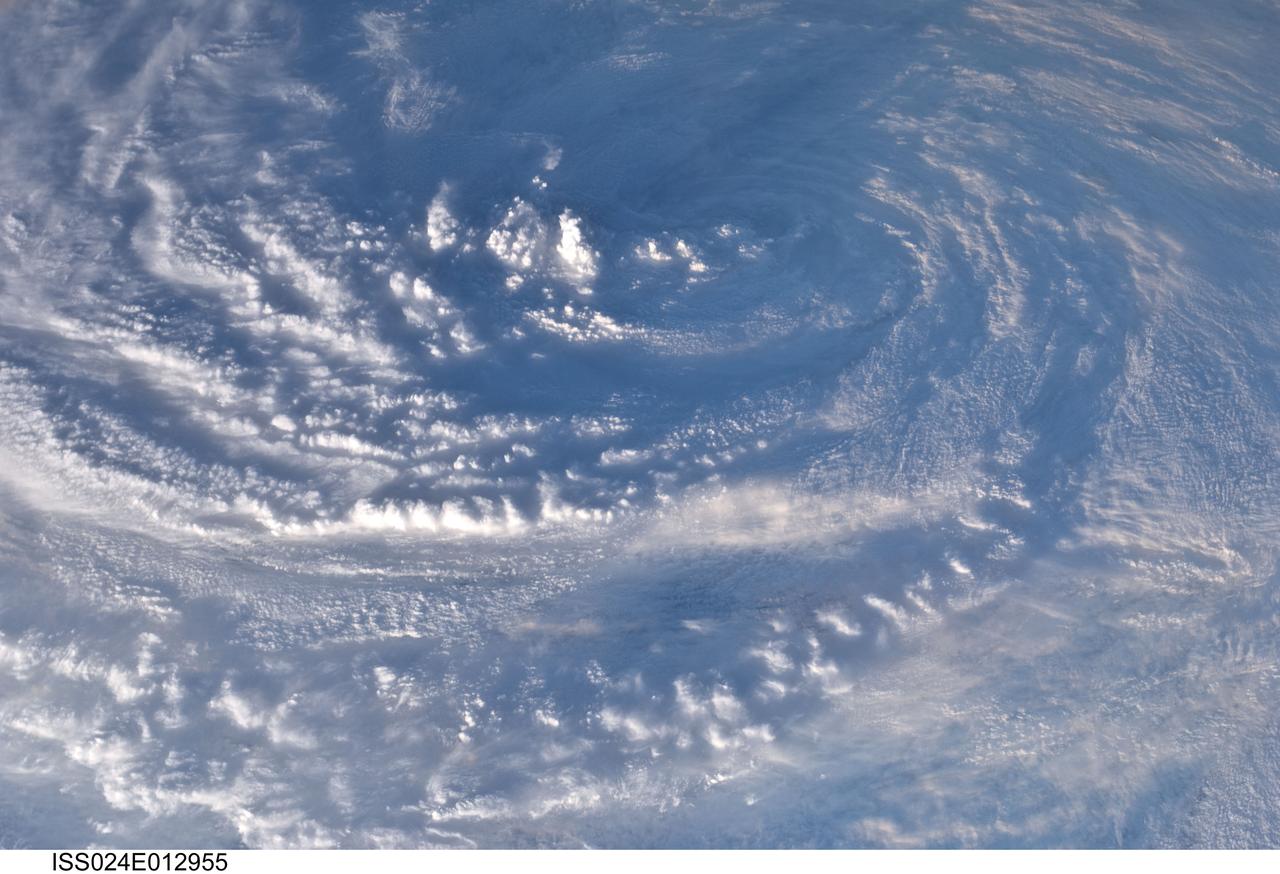
ISS024-E-012955 (30 Aug. 2010) --- Tropical Storm Danielle is featured in this Aug. 30 image photographed by an Expedition 24 crew member on the International Space Station.
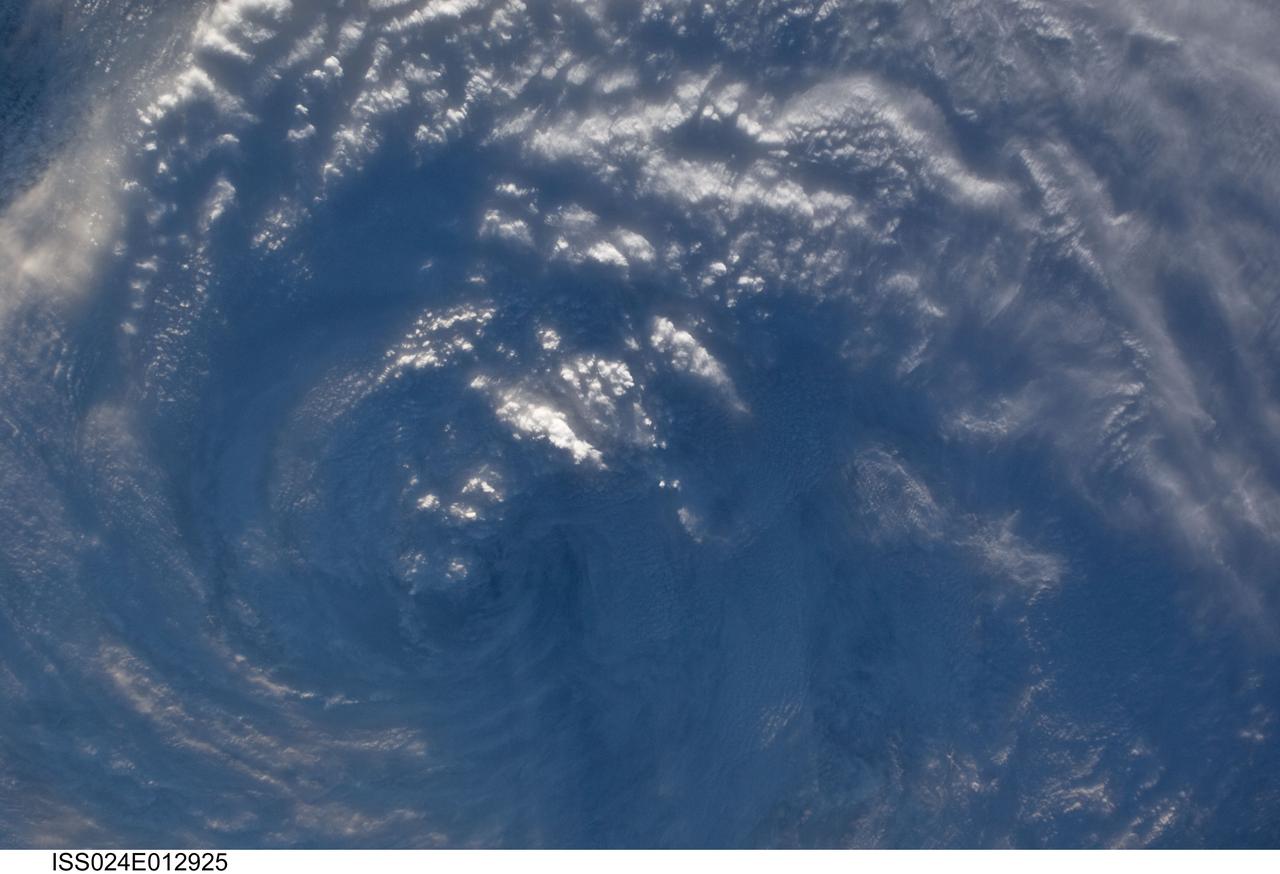
ISS024-E-012925 (30 Aug. 2010) --- Tropical Storm Danielle is featured in this Aug. 30 image photographed by an Expedition 24 crew member on the International Space Station.
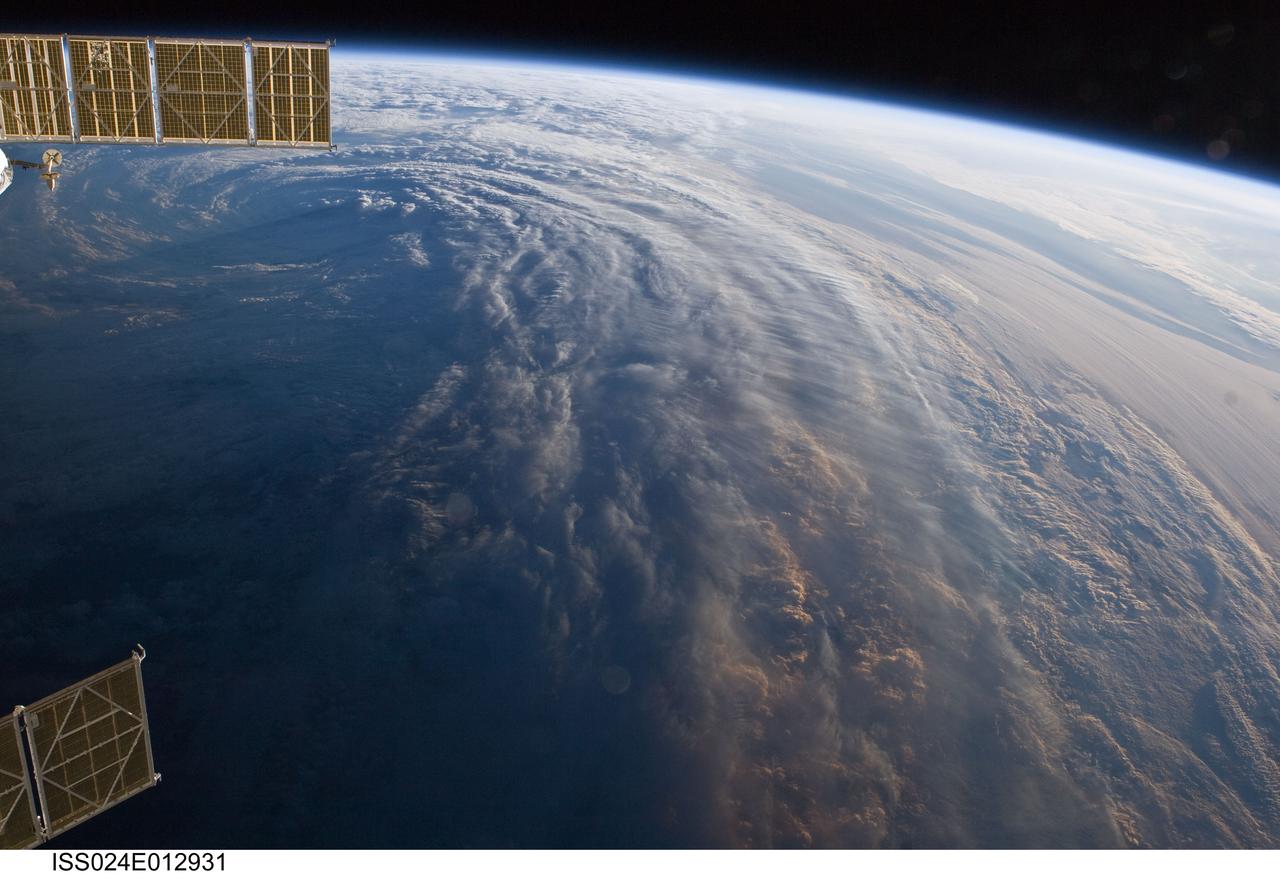
ISS024-E-012931 (30 Aug. 2010) --- Tropical Storm Danielle is featured in this Aug. 30 image photographed by an Expedition 24 crew member on the International Space Station.
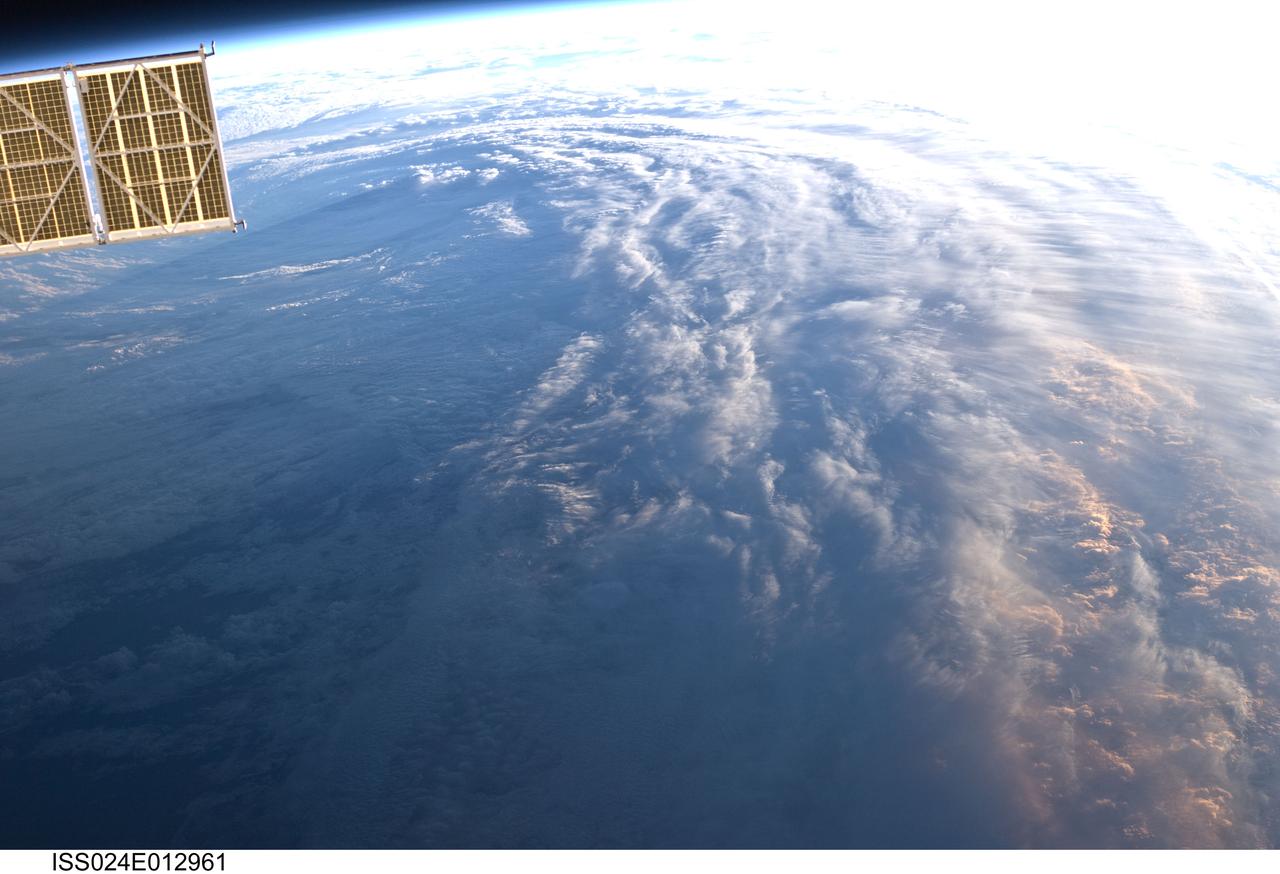
ISS024-E-012961 (30 Aug. 2010) --- Tropical Storm Danielle is featured in this Aug. 30 image photographed by an Expedition 24 crew member on the International Space Station.
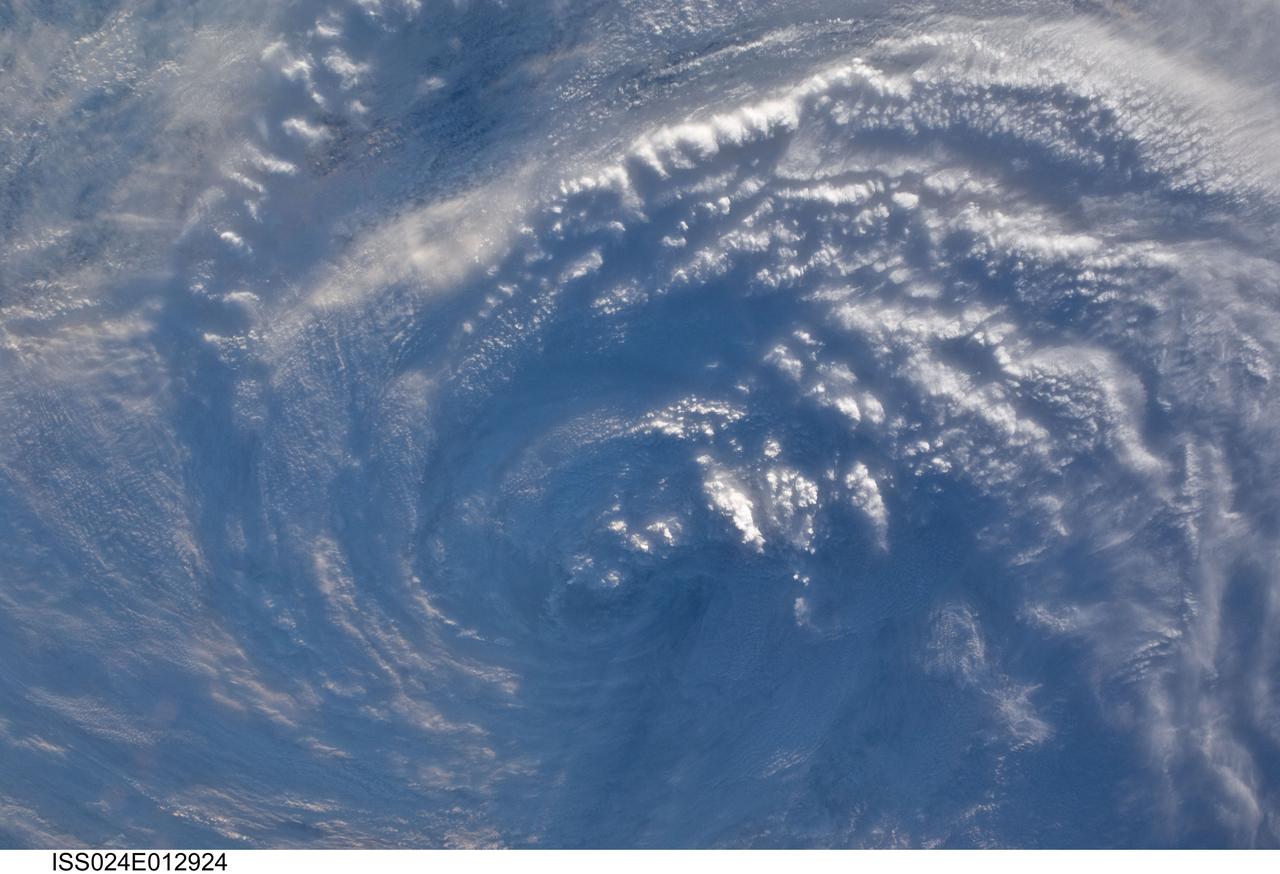
ISS024-E-012924 (30 Aug. 2010) --- Tropical Storm Danielle is featured in this Aug. 30 image photographed by an Expedition 24 crew member on the International Space Station.
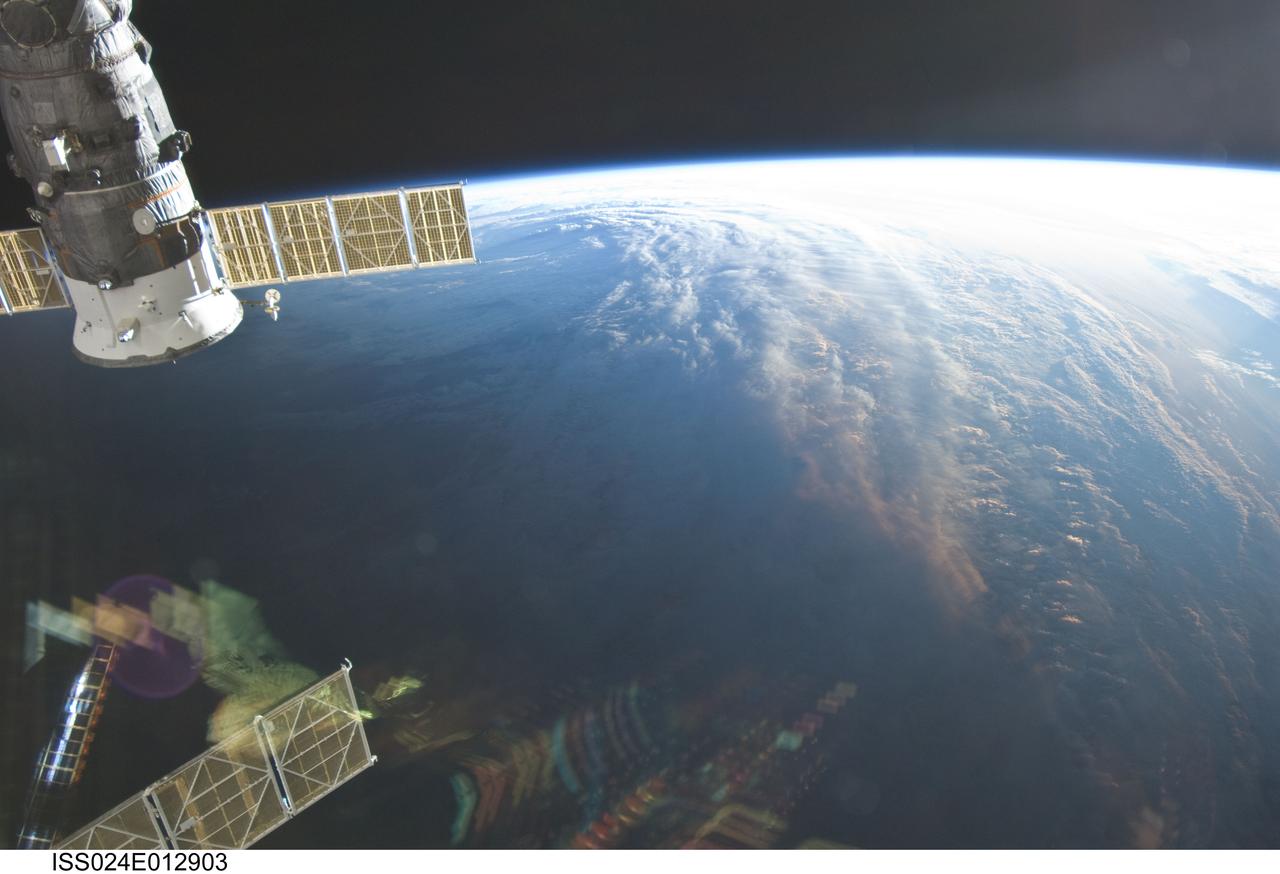
ISS024-E-012903 (30 Aug. 2010) --- Tropical Storm Danielle is featured in this Aug. 30 image photographed by an Expedition 24 crew member on the International Space Station.
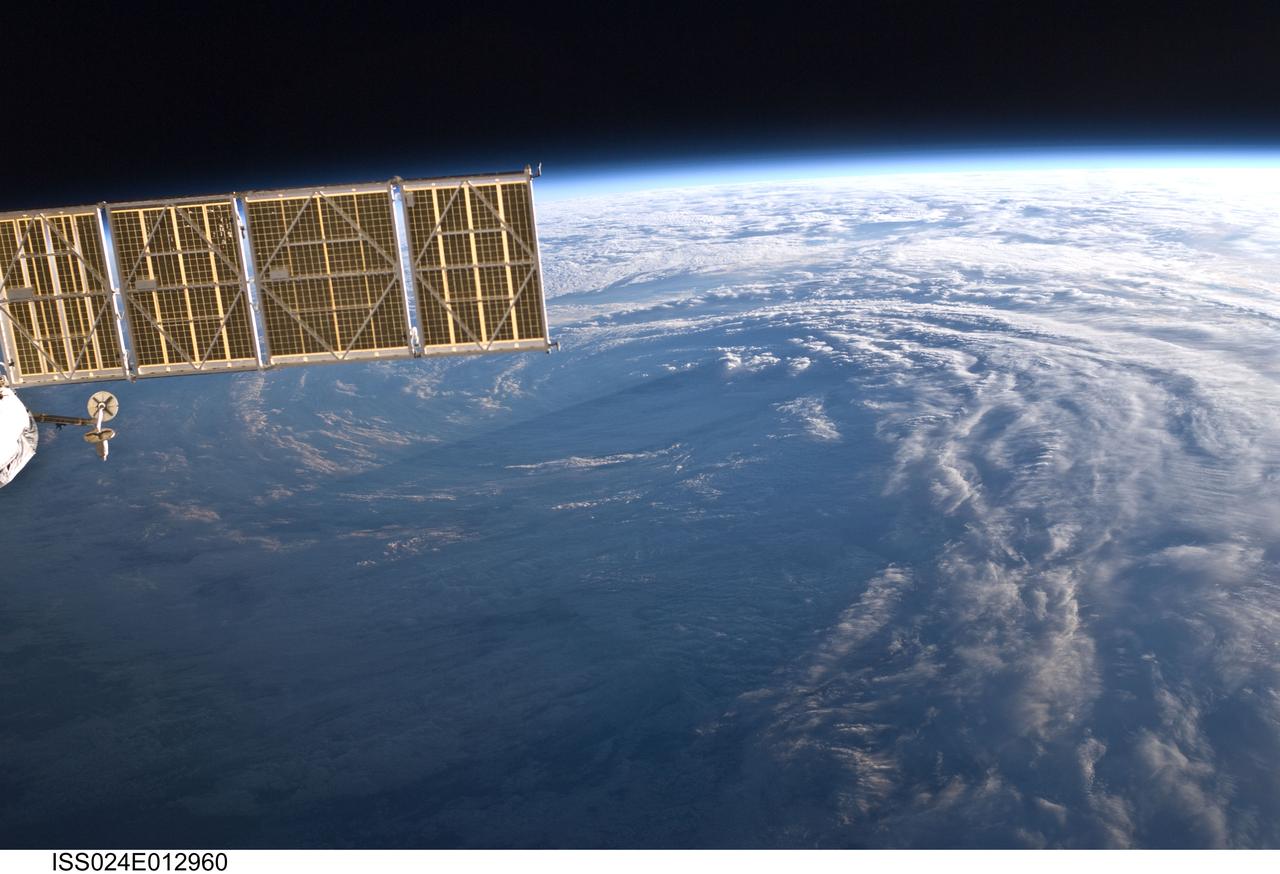
ISS024-E-012960 (30 Aug. 2010) --- Tropical Storm Danielle is featured in this Aug. 30 image photographed by an Expedition 24 crew member on the International Space Station.
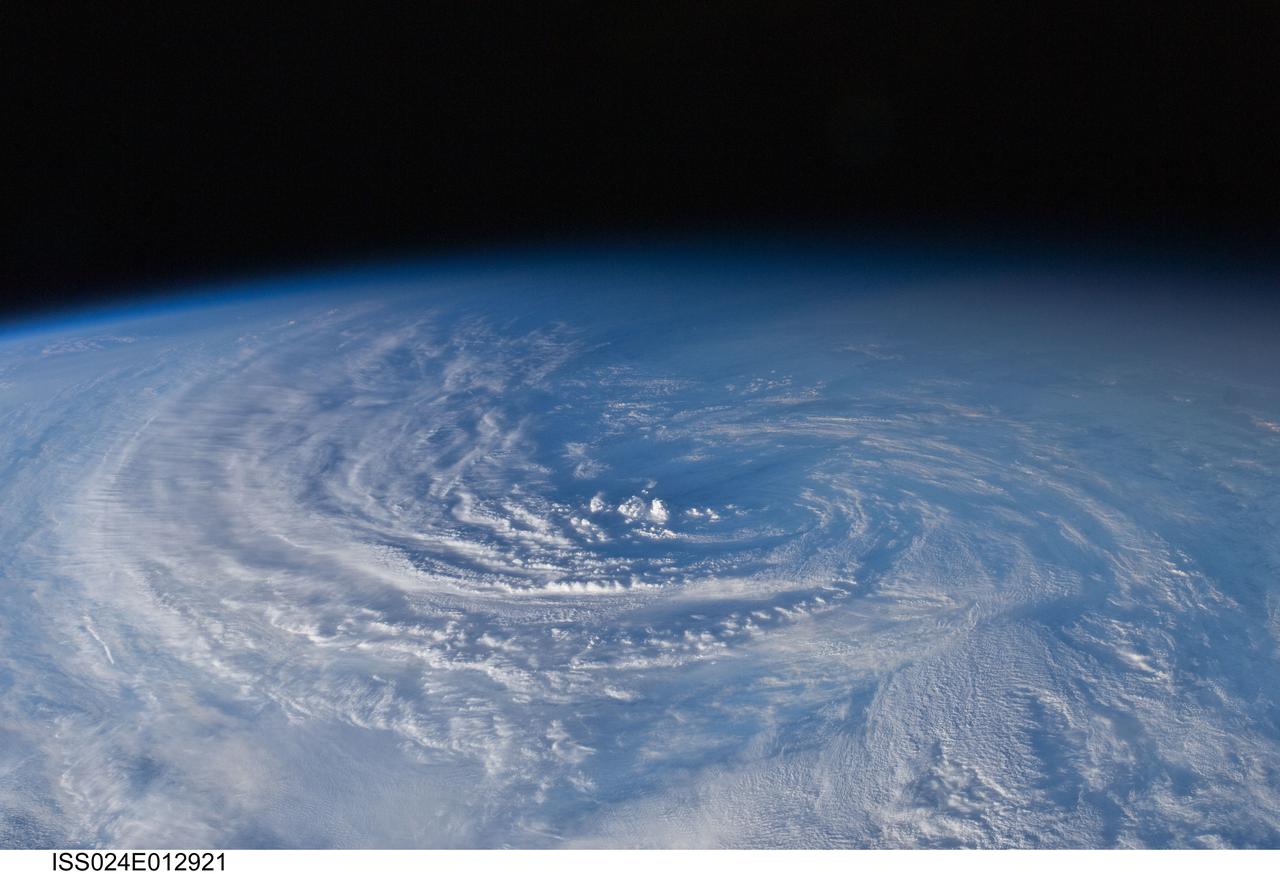
ISS024-E-012921 (30 Aug. 2010) --- Tropical Storm Danielle is featured in this Aug. 30 image photographed by an Expedition 24 crew member on the International Space Station.
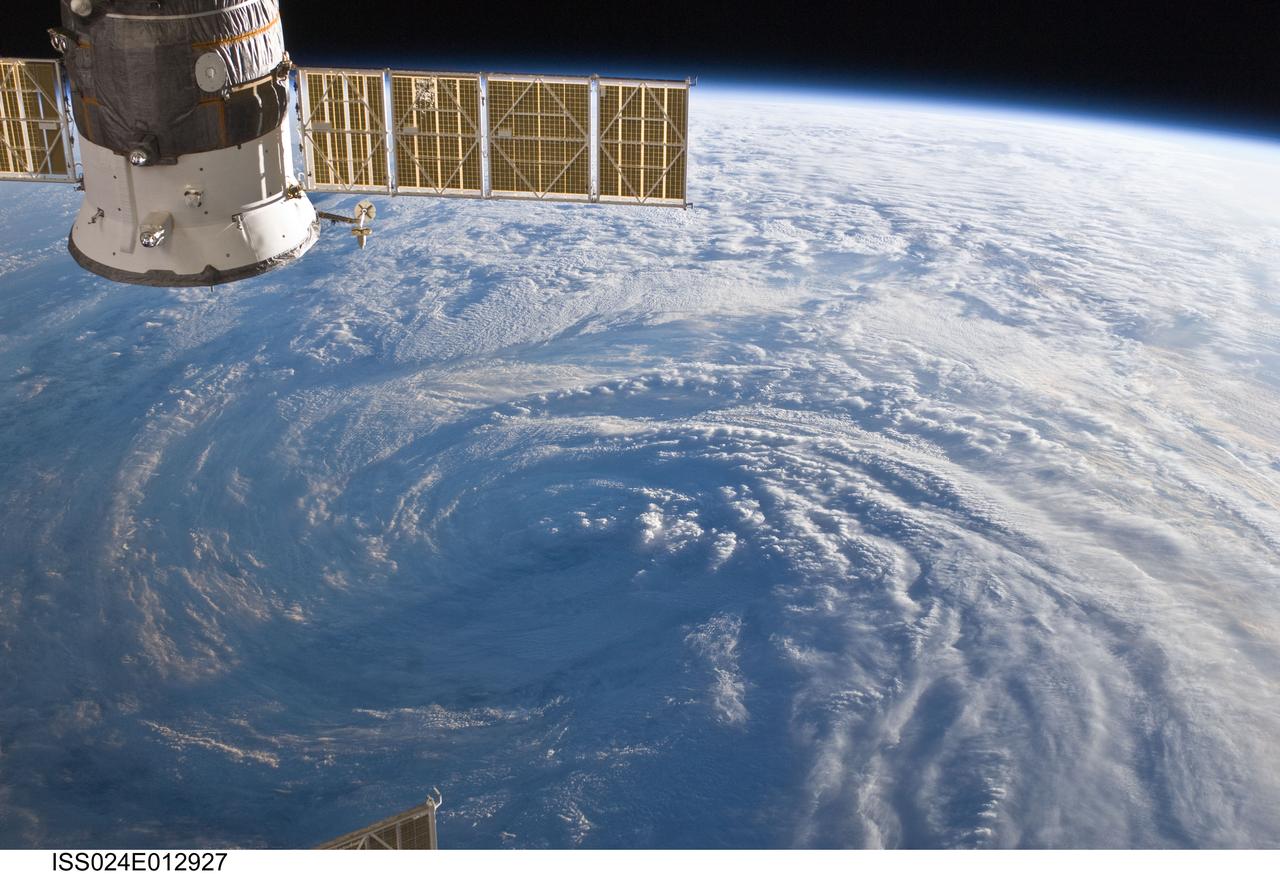
ISS024-E-012927 (30 Aug. 2010) --- Tropical Storm Danielle is featured in this Aug. 30 image photographed by an Expedition 24 crew member on the International Space Station.
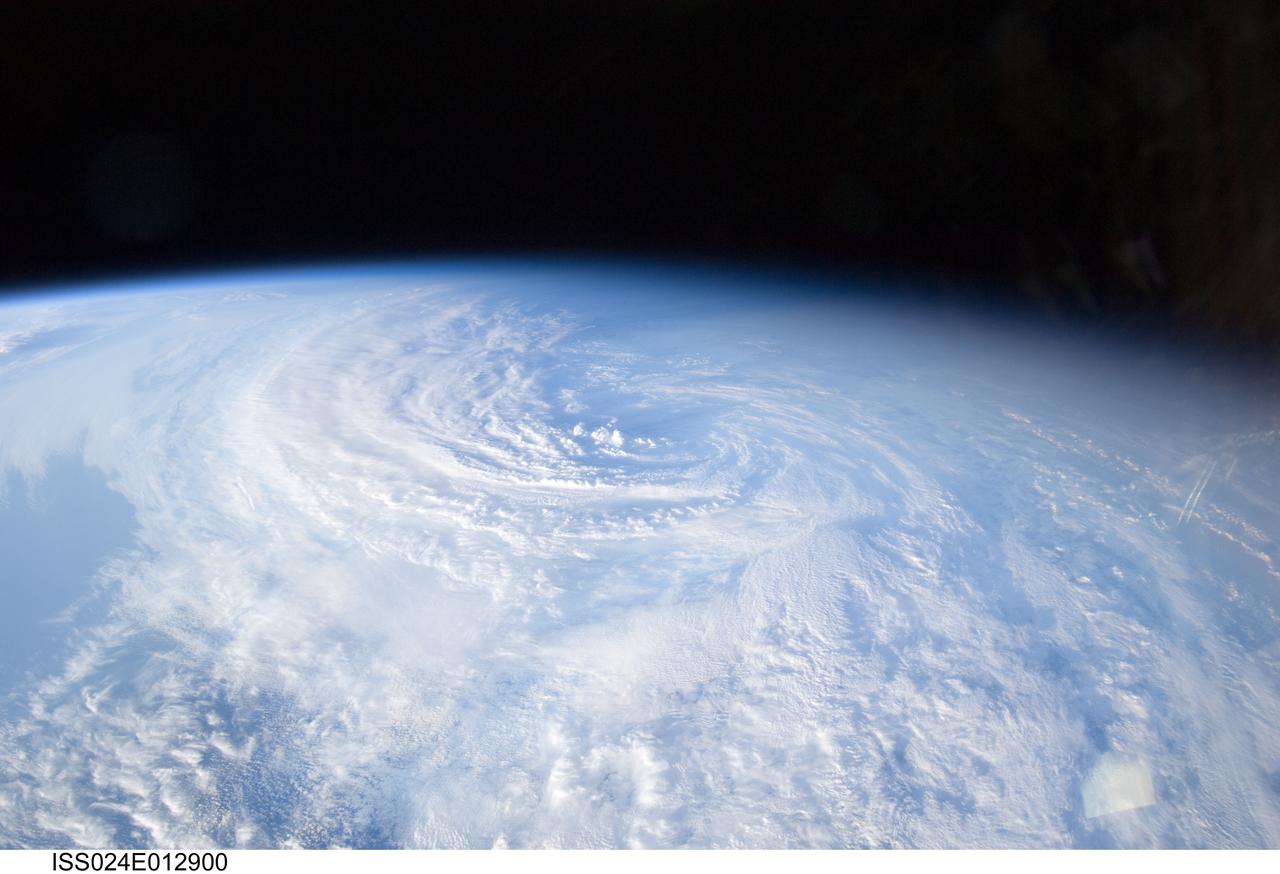
ISS024-E-012900 (30 Aug. 2010) --- Tropical Storm Danielle is featured in this Aug. 30 image photographed by an Expedition 24 crew member on the International Space Station.
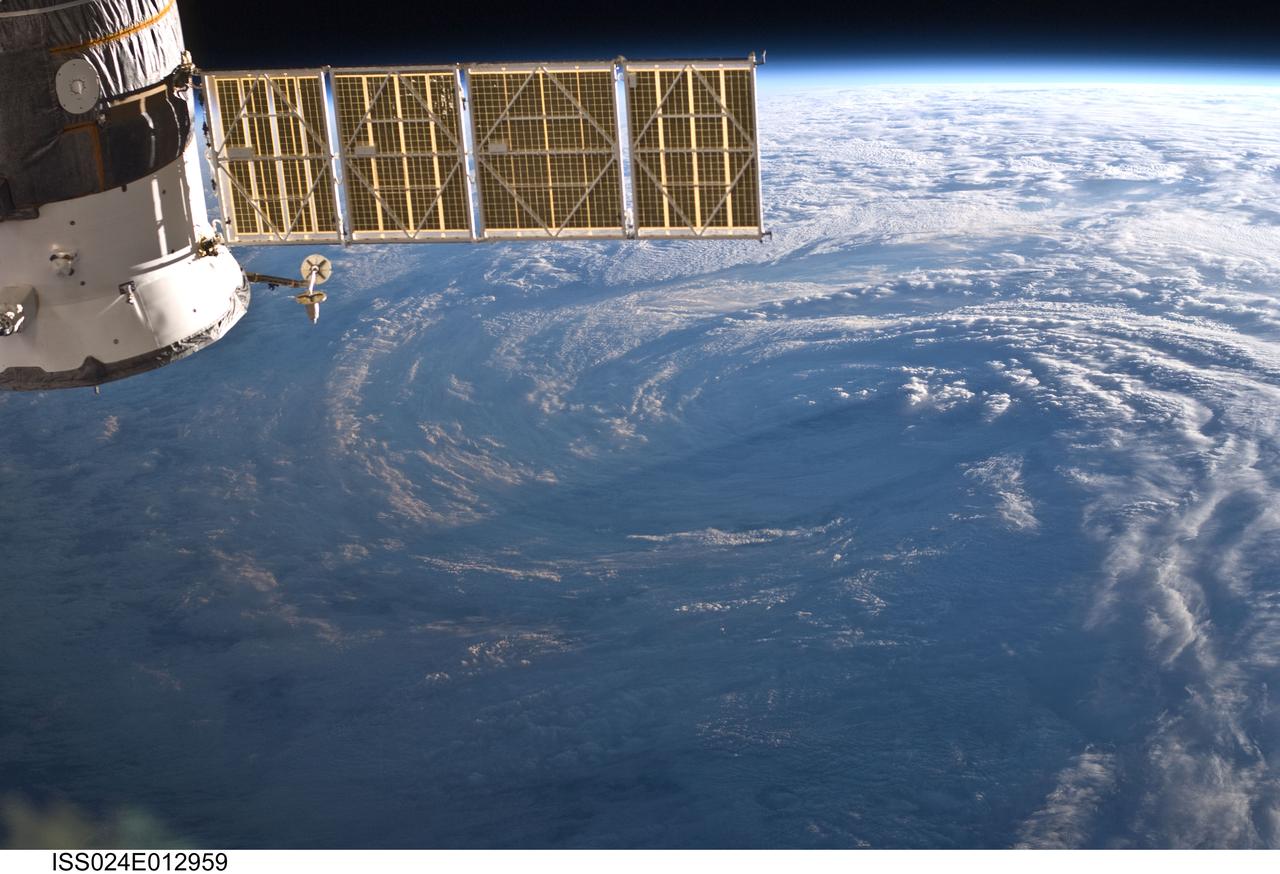
ISS024-E-012959 (30 Aug. 2010) --- Tropical Storm Danielle is featured in this Aug. 30 image photographed by an Expedition 24 crew member on the International Space Station.
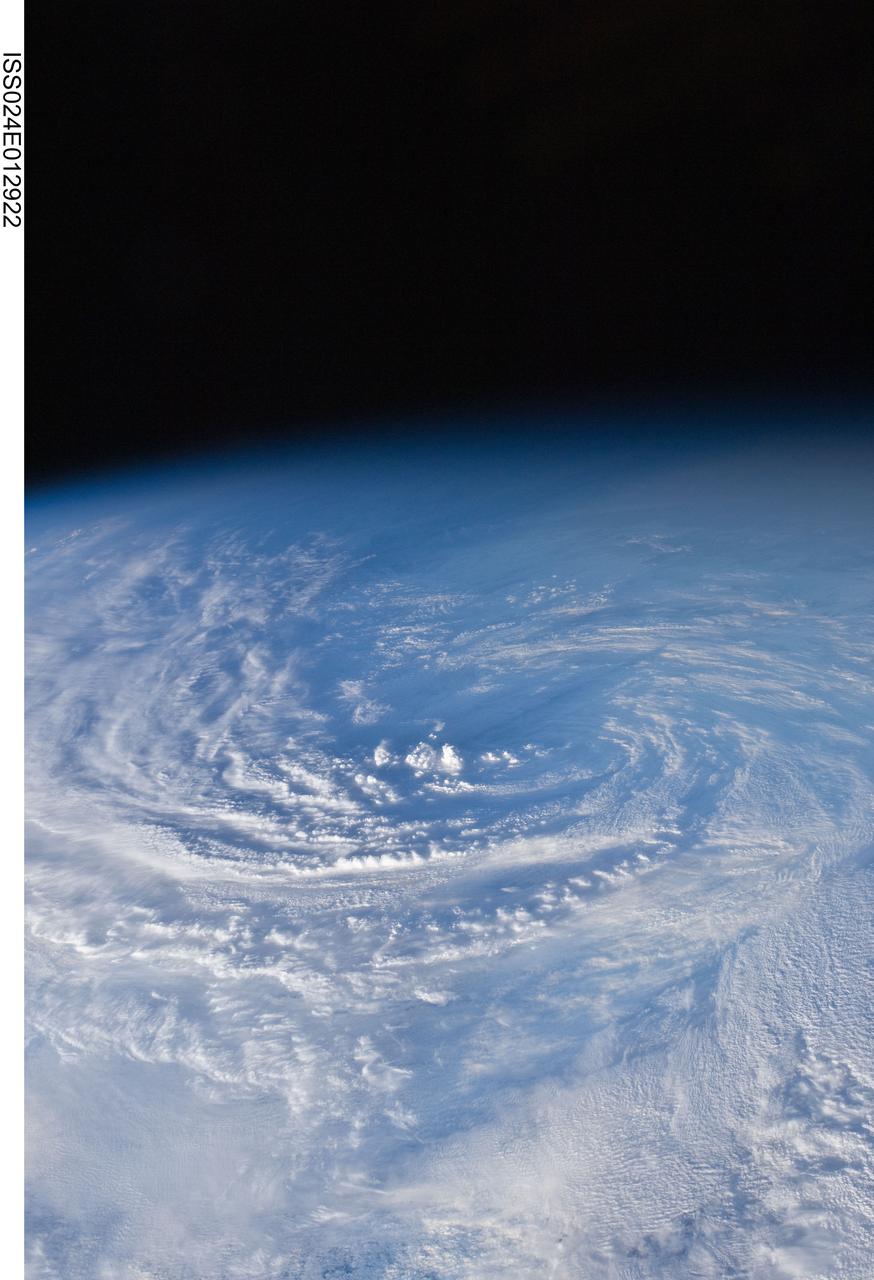
ISS024-E-012922 (30 Aug. 2010) --- Tropical Storm Danielle is featured in this Aug. 30 image photographed by an Expedition 24 crew member on the International Space Station.
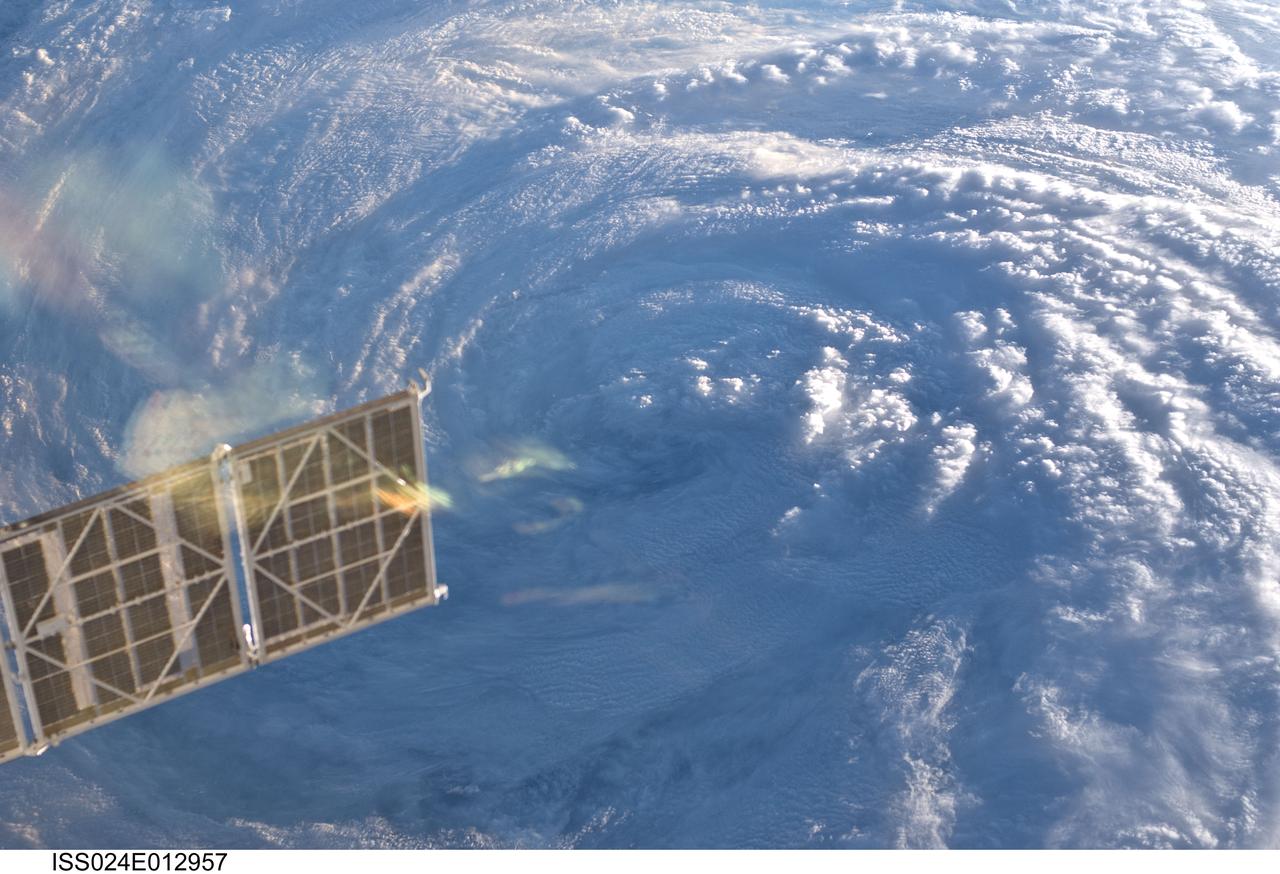
ISS024-E-012957 (30 Aug. 2010) --- Tropical Storm Danielle is featured in this Aug. 30 image photographed by an Expedition 24 crew member on the International Space Station.

ISS024-E-012899 (30 Aug. 2010) --- Tropical Storm Danielle is featured in this Aug. 30 image photographed by an Expedition 24 crew member on the International Space Station.
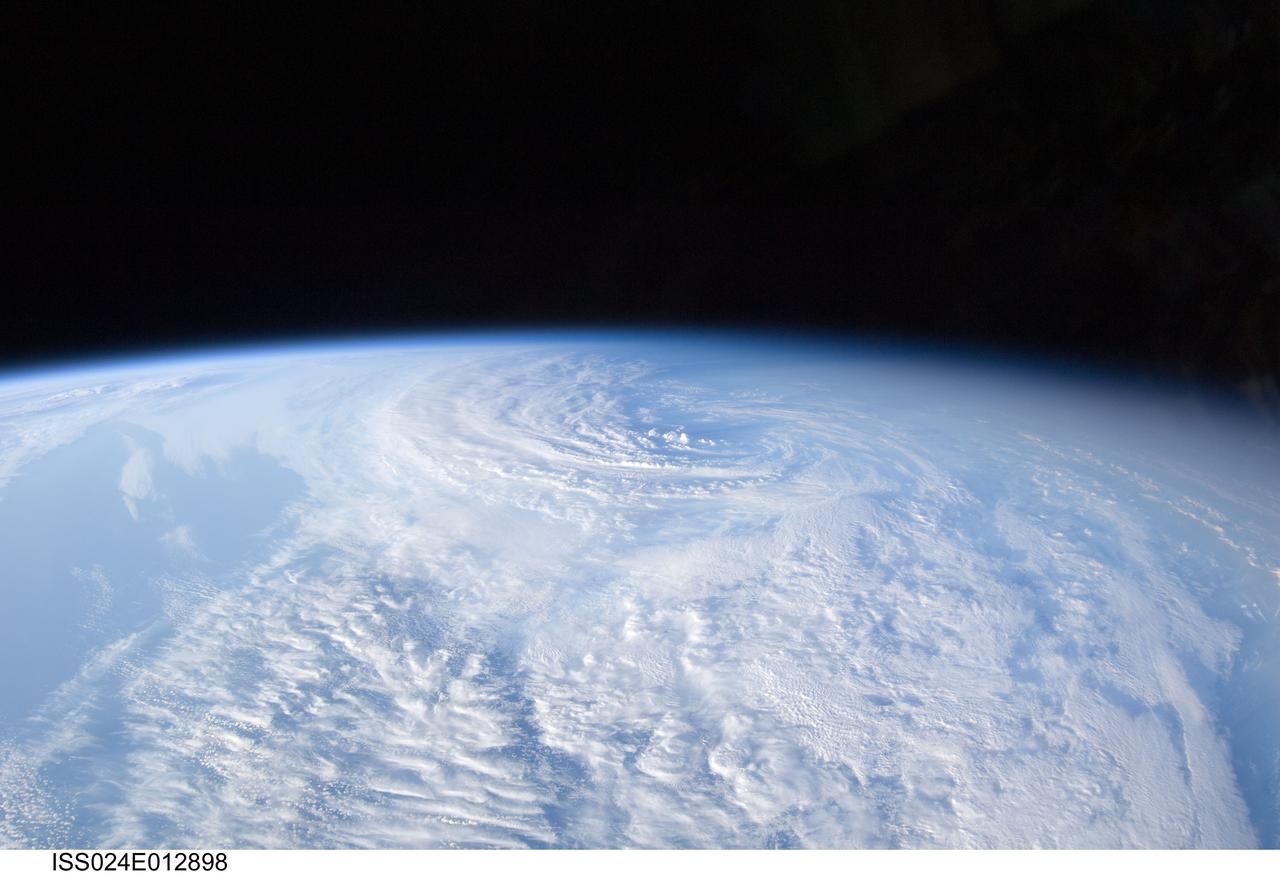
ISS024-E-012898 (30 Aug. 2010) --- Tropical Storm Danielle is featured in this Aug. 30 image photographed by an Expedition 24 crew member on the International Space Station.
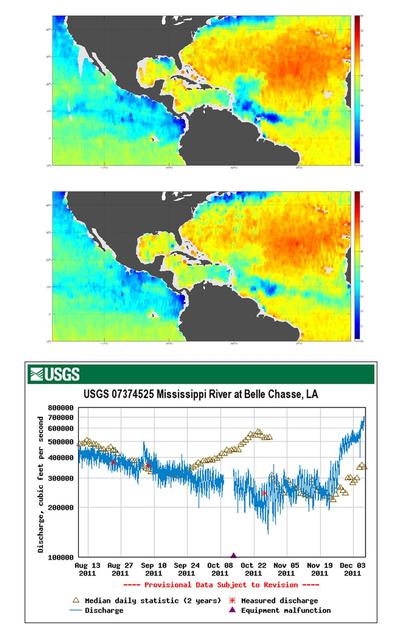
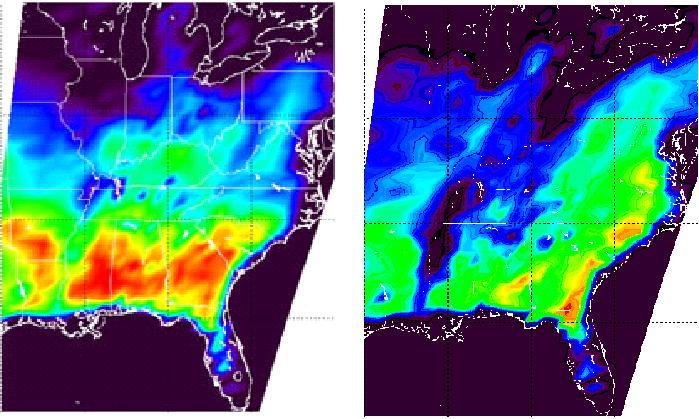
Tropical Storm Lee made landfall over New Orleans on Sept. 2-3, 2011, with predicted rainfall of 15 to 20 inches 38 to 51 centimeters over southern Louisiana. These charts are from NASA Aquarius spacecraft.
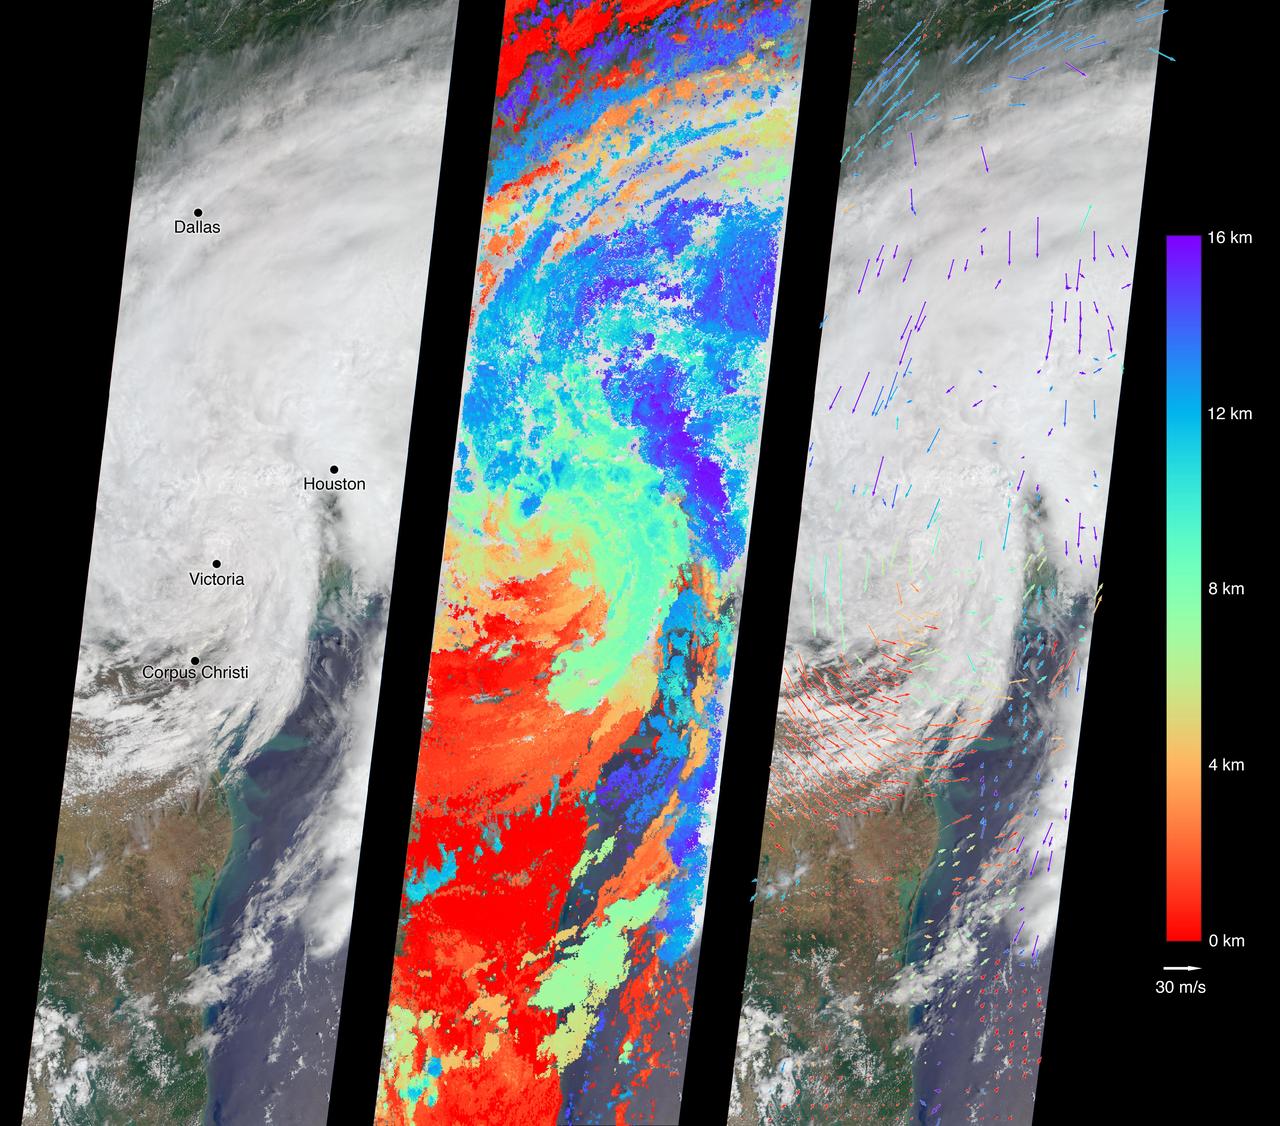
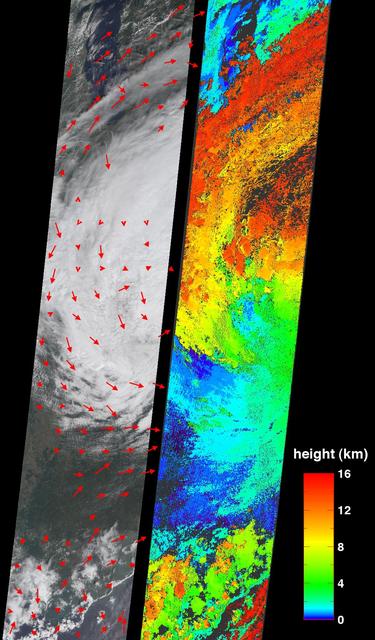
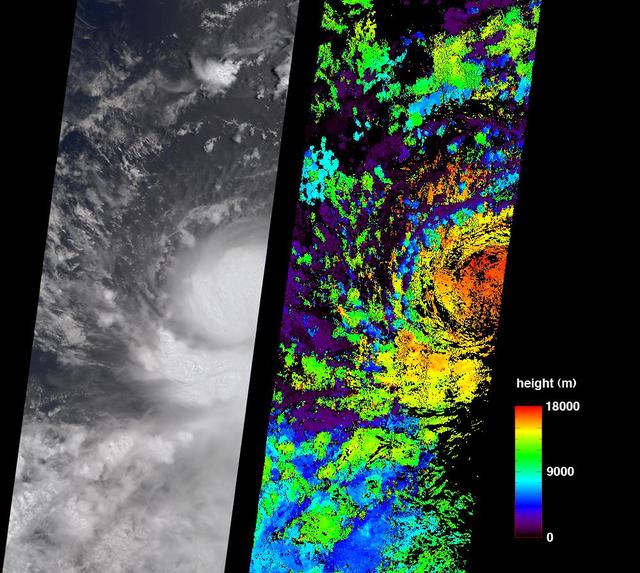
On Aug. 27, 2017, the Multi-angle Imaging SpectroRadiometer (MISR) instrument on NASA's Terra satellite passed over then-Tropical Storm Harvey about noon local time, the day after the storm first made landfall in Texas as a Category 4 hurricane. The MISR instrument is equipped with nine cameras that observe Earth at different angles over a time period of seven minutes. Geometric information from the multiple camera views is used to compute the cloud top heights, and motion of the clouds during the image sequence is used to calculate wind speed. This composite image shows the storm as viewed by the central, downward-looking camera (left), as well as the cloud top heights in kilometers (center) and the wind speeds (right) superimposed on the image. The length of the arrows is proportional to the wind speed, while their color shows the altitude at which the winds were calculated. Also included is an animation made by combining all nine images from the MISR cameras, showing the motion of the storm during the seven-minute period. At this time, the center of the tropical storm was located just northwest of the city of Victoria and maximum wind speeds on the ground were around 40 miles per hour (65 kilometers per hour) according to the National Oceanic and Atmospheric Administration (NOAA), which matches well with the near-surface winds calculated by MISR to the west of Corpus Christi. In the 36 hours or so since it had made landfall, Harvey had weakened considerably -- these images show that the eye had disappeared and much of the circular motion of storm had dissipated, as shown by the calculated wind directions. However, the area of very high clouds and strong winds near Houston shows that the storm was continuing to produce powerful rain bands. At this point, hydrographs managed by NOAA in downtown Houston were already recording flood stage at both the Buffalo Bayou (28 feet or 8.5 meters as of 12:15 p.m. CDT August 27) and the White Oak Bayou (40 feet or 12 meters at last record that morning). The MISR data show the storm clouds reaching an altitude of about 10 miles (16 kilometers). These data were captured during Terra orbit 94108. An animation is available at https://photojournal.jpl.nasa.gov/catalog/PIA21927
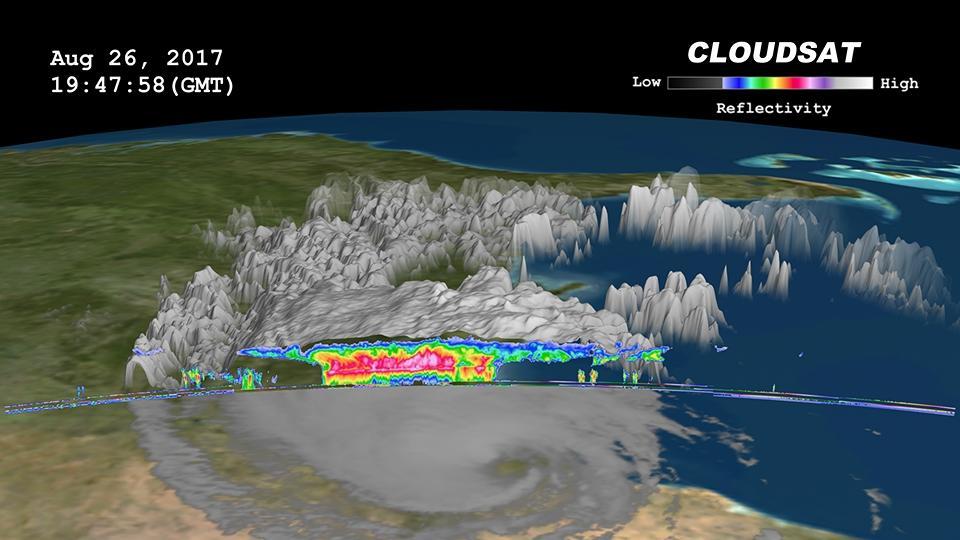
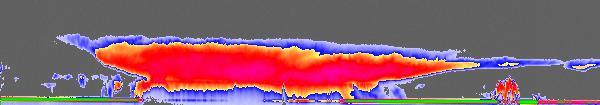
Click on the image for larger animation NASA's CloudSat satellite flew over then-Tropical Storm Harvey on Aug. 26, 2017, at 2:45 p.m. CDT (19:45 UTC) as the storm was nearly stationary over south Texas. At that time, Harvey contained estimated maximum sustained winds of 69 miles per hour (60 knots). CloudSat flew over Harvey northeast of the storm center through an area of moderate to heavy rainfall in the outer rainbands. As seen in the image and animation, large amounts of liquid and ice water (denoted by the red and pink colors) are visible beneath the cloud tops. The lack of a radar signal (attenuation) beneath the melting layer (located around 3 miles, or 5 kilometers, above ground) can be seen in the heavier areas of precipitation, since CloudSat's cloud profiling radar (CPR) signal dampens when precipitation particles are larger than 0.12 inches (3 millimeters) in size. Smaller cumulus and cumulonimbus clouds are seen north of the area of moderate to heavy precipitation. The cirrus canopy (anvil clouds) extends outward from the storm system (shown in blue and green colors). An animation is available at https://photojournal.jpl.nasa.gov/catalog/PIA17392
ISS044E001463 (06/16/2015) --- Tropical Storm Bill image coming ashore in Texas taken by the International Space Station on June 16, 2015.
ISS040-E-031651 (2 July 2014) --- One of the Expedition 40 crew members aboard the Earth-orbiting International Space Station, some 227 nautical miles above Earth, photographed this image of Tropical Storm Arthur moving northerly near the east coast of the USA late on July 2, 2014. The crew had photographed imagery which showed Arthur churning in Atlantic waters off of Florida some eight hours prior to this picture.
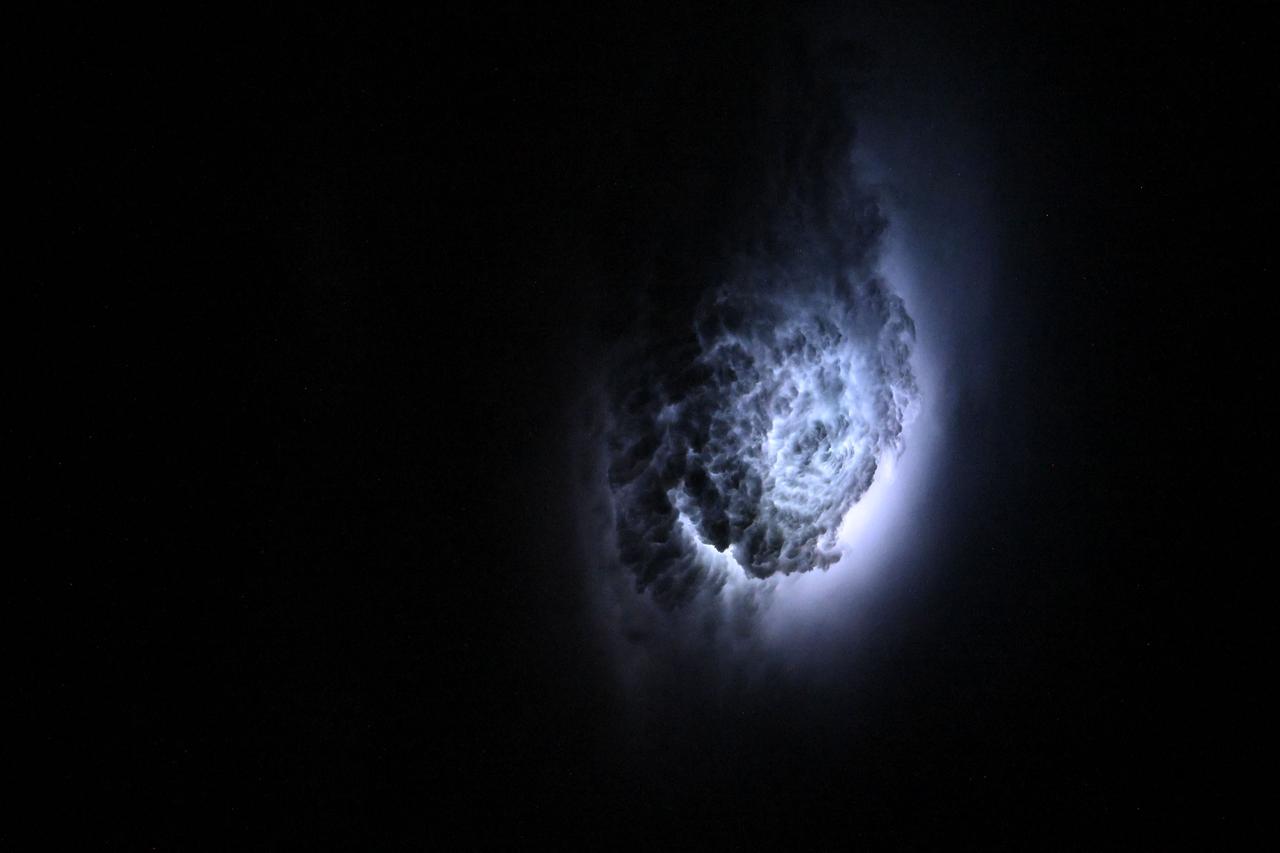
iss073e0332020 (June 20, 2025) --- Lightning illuminates the cloud tops of Tropical Storm Erick as it stormed across the Pacific coast of central Mexico at approximately 3:42 a.m. local time as the International Space Station orbited 258 miles above.
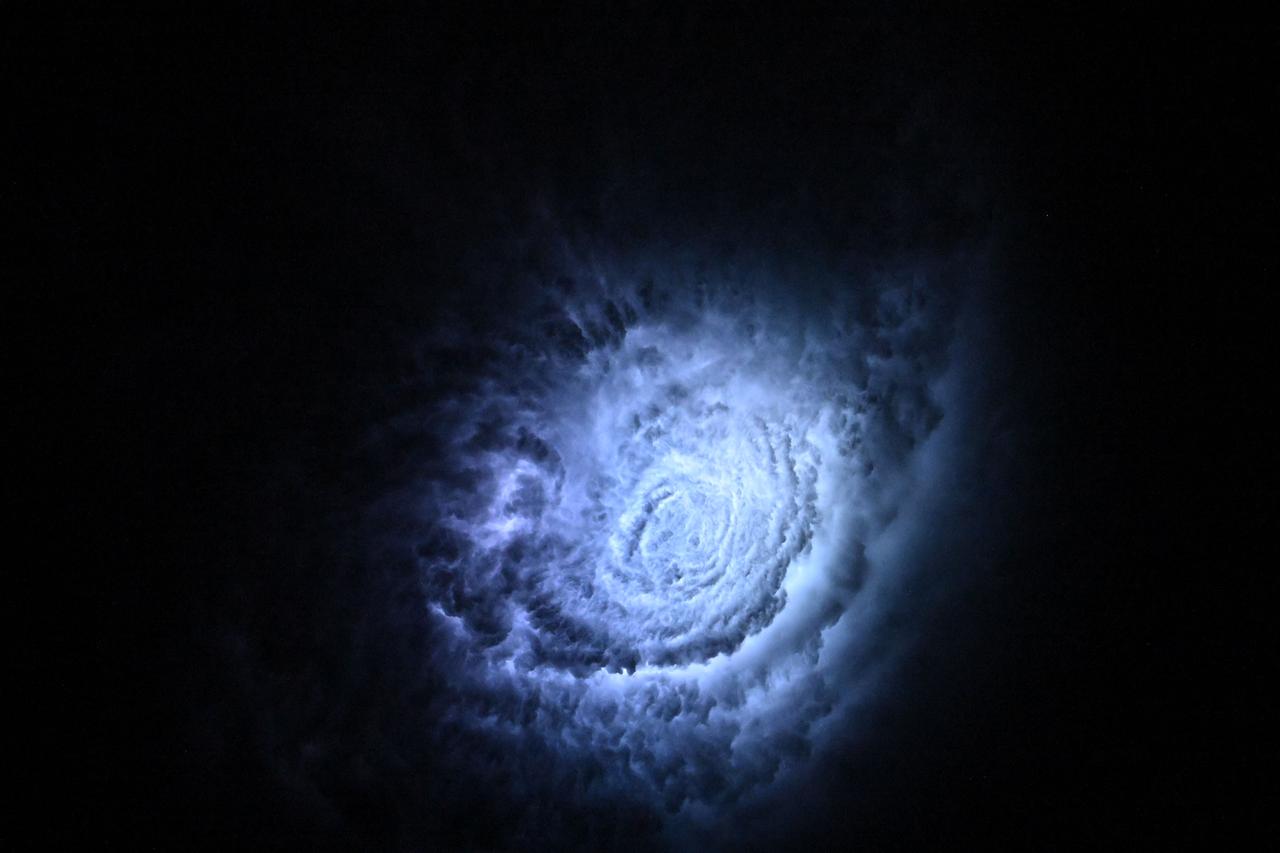
iss073e0330134 (June 20, 2025) --- Lightning illuminates the cloud tops of Tropical Storm Erick as it stormed across the Pacific coast of central Mexico at approximately 3:38 a.m. local time as the International Space Station orbited 258 miles above.
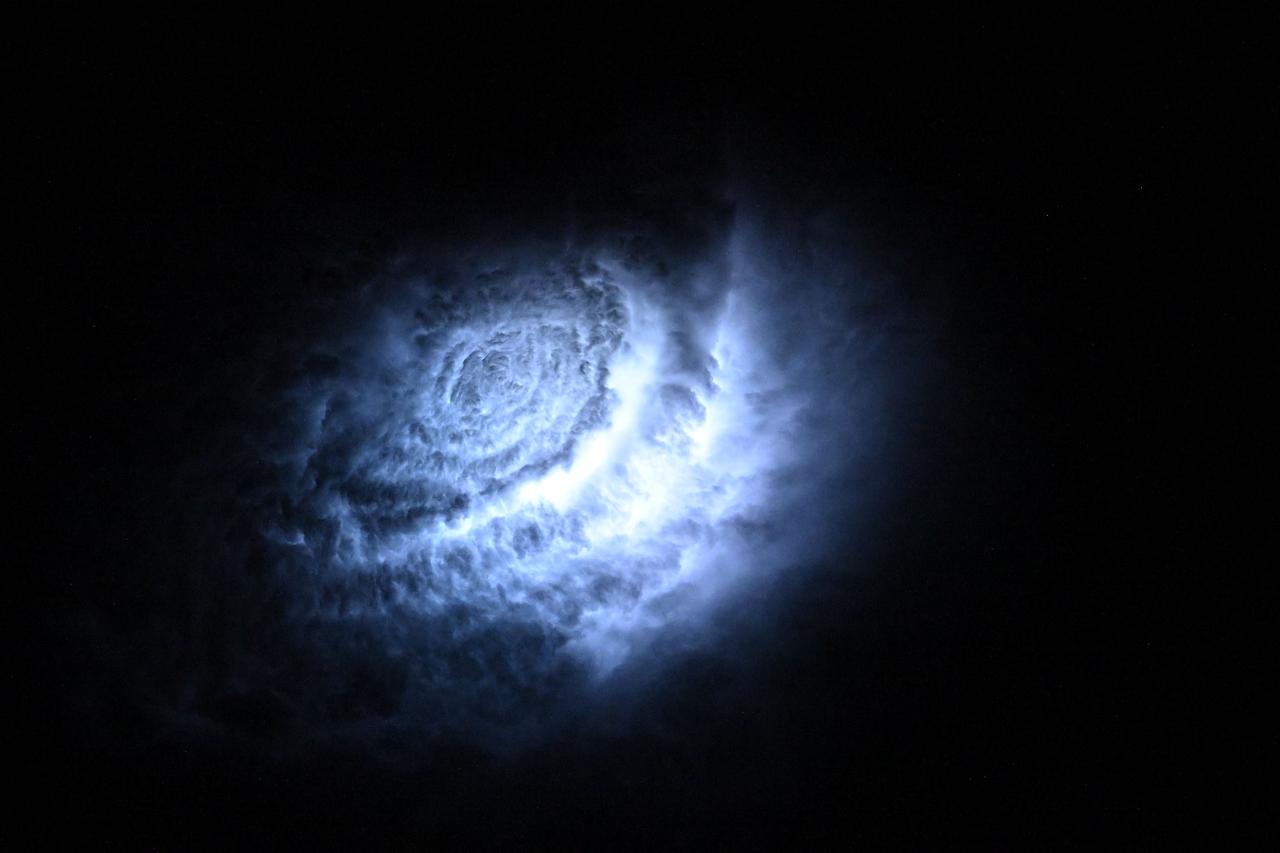
iss073e0330560 (June 20, 2025) --- Lightning illuminates the cloud tops of Tropical Storm Erick as it stormed across the Pacific coast of central Mexico at approximately 3:39 a.m. local time as the International Space Station orbited 258 miles above.
iss073e0422797 (Aug. 5, 2025) --- A tropical storm is pictured in the Pacific Ocean near Japan in his photograph from the International Space Station as it orbited 260 miles above.
iss073e0177272 (May 30, 2025) --- Tropical storm Alvin is pictured in the Pacific Ocean off the coast of Mexico from the International Space Station as it orbited 260 miles above.
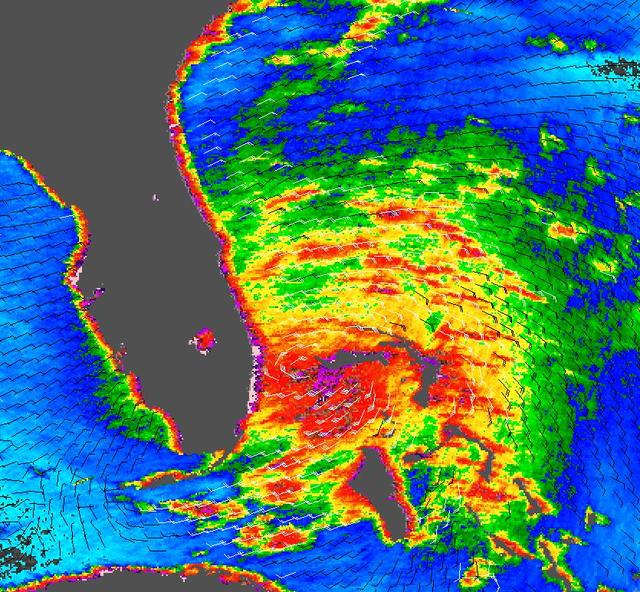
-- Joaquin became a tropical storm Monday evening (EDT) midway between the Bahamas and Bermuda and has now formed into a hurricane, the 3rd of the season--the difference is Joaquin could impact the US East Coast. GPM captured Joaquin Tuesday, September 29th at 21:39 UTC (5:39 pm EDT) as the hurricane moved slowly towards the west-southwest about 400 miles east of the northwestern Bahamas. At the time, Joaquin had been battling northerly wind shear, which was impeding the storm's ability to strengthen. However, compared to earlier in the day, the system was beginning to gain the upper hand as the shear began to relax its grip. At the time of this data visualization, Joaquin's low-level center of circulation was located further within the cloud shield, and the rain area was beginning to wrap farther around the center on the eastern side of the storm while showing signs of increased banding and curvature, a sure sign that Joaquin's circulation was intensifying. GPM shows a large area of very intense rain with rain rates ranging from around 50 to 132 mm/hr (~2 to 5 inches, shown in red and magenta) just to the right of the center. This is a strong indication that large amounts of heat are being released into the storm's center, fueling its circulation and providing the means for its intensification. Associated with the area of intense rain is an area of tall convective towers, known as a convective burst, with tops reaching up to 16.3 km (shown in orange). These towers when located near the storm's core are a strong indication that the storm is poised to strengthen as they too reveal the release of heat into the storm. At the time this data was taken, the National Hurricane Center reported that Joaquin's maximum sustained winds had increased to 65 mph from 40 mph earlier in the day, making Joaquin a strong tropical storm but poised to become a hurricane, which occurred this morning at 8:00 am EDT. With the inhibiting wind shear expected to continue to diminish and the system moving over warm waters, the National Hurricane Center is forecasting Joaquin to intensify further, possibly into a major hurricane within the next few days. Credit: NASA's Scientific Visualization Studio Data provided by the joint NASA/JAXA GPM mission <b><a href="http://www.nasa.gov/audience/formedia/features/MP_Photo_Guidelines.html" rel="nofollow">NASA image use policy.</a></b> <b><a href="http://www.nasa.gov/centers/goddard/home/index.html" rel="nofollow">NASA Goddard Space Flight Center</a></b> enables NASA’s mission through four scientific endeavors: Earth Science, Heliophysics, Solar System Exploration, and Astrophysics. Goddard plays a leading role in NASA’s accomplishments by contributing compelling scientific knowledge to advance the Agency’s mission. <b>Follow us on <a href="http://twitter.com/NASAGoddardPix" rel="nofollow">Twitter</a></b> <b>Like us on <a href="http://www.facebook.com/pages/Greenbelt-MD/NASA-Goddard/395013845897?ref=tsd" rel="nofollow">Facebook</a></b> <b>Find us on <a href="http://instagrid.me/nasagoddard/?vm=grid" rel="nofollow">Instagram</a></b>
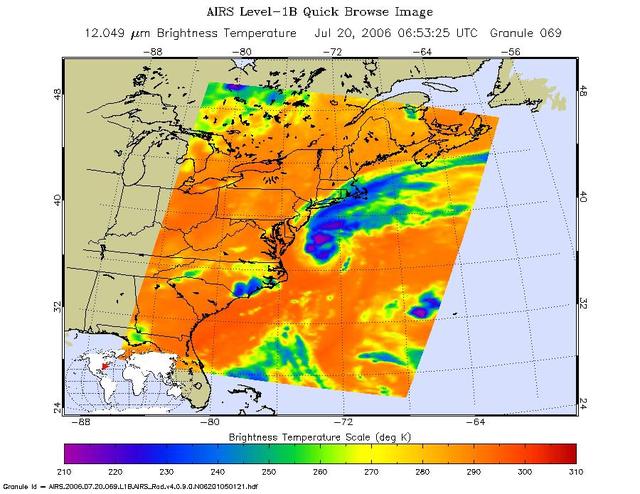
This is an AIRS infrared image of Tropical Storm Beryl in the western Atlantic, from the NASA Aqua satellite on July 20, 2006, 1:30 am local time. The image shows the temperature of the cloud tops or the surface of the Earth in cloud-free regions.
iss073e0880503 (Oct. 13, 2025) --- Severe Tropical Storm Nakri, pictured with maximum sustained winds of 70 miles per hour, is pictured in the Pacific Ocean east of Tokyo, Japan, from the International Space Station as it orbited 260 miles above Earth.
iss073e0880455 (Oct. 13, 2025) --- Severe Tropical Storm Nakri, pictured with maximum sustained winds of 70 miles per hour, is pictured in the Pacific Ocean east of Tokyo, Japan, from the International Space Station as it orbited 260 miles above Earth.
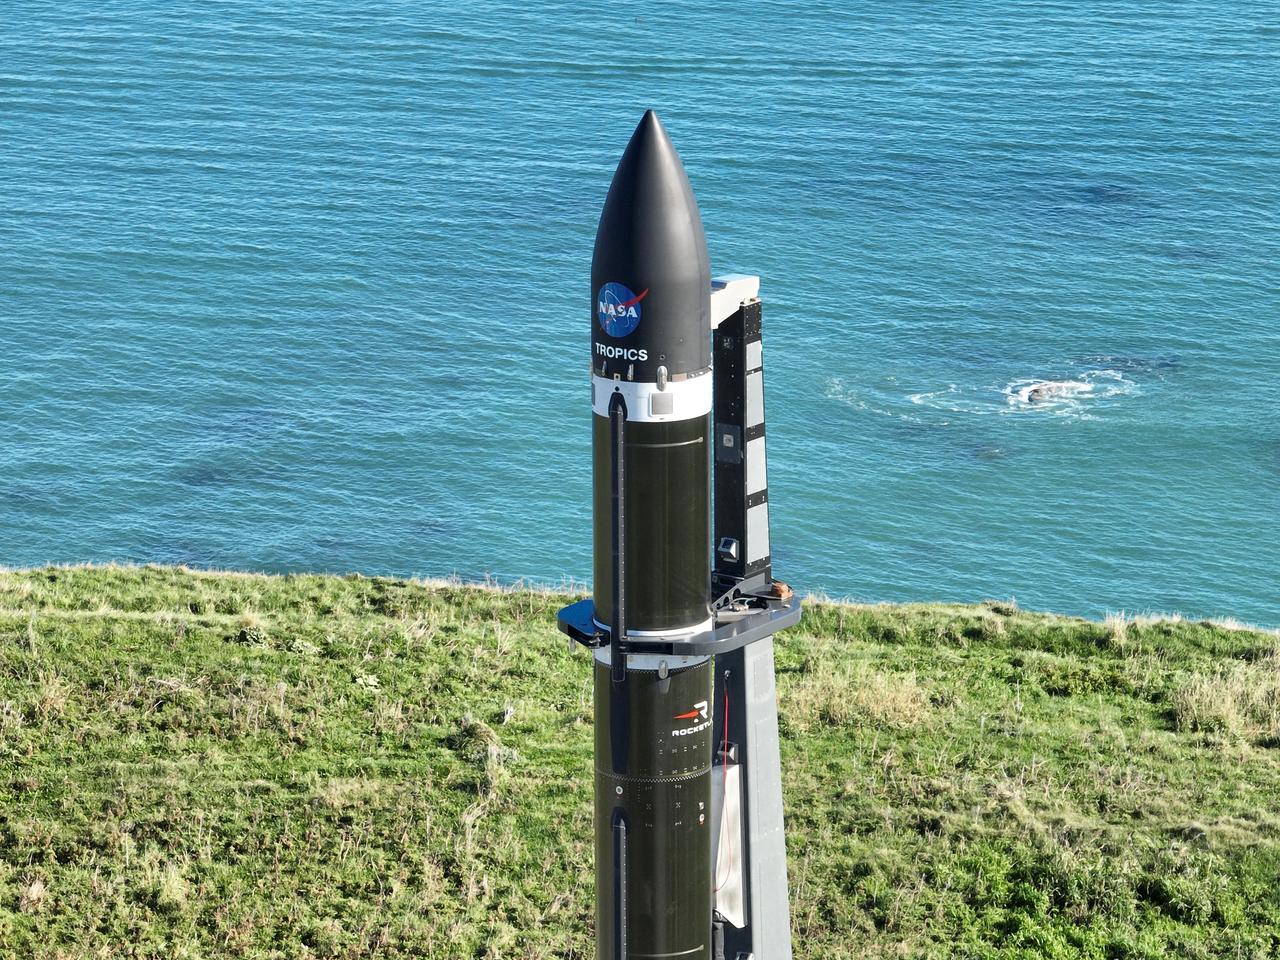
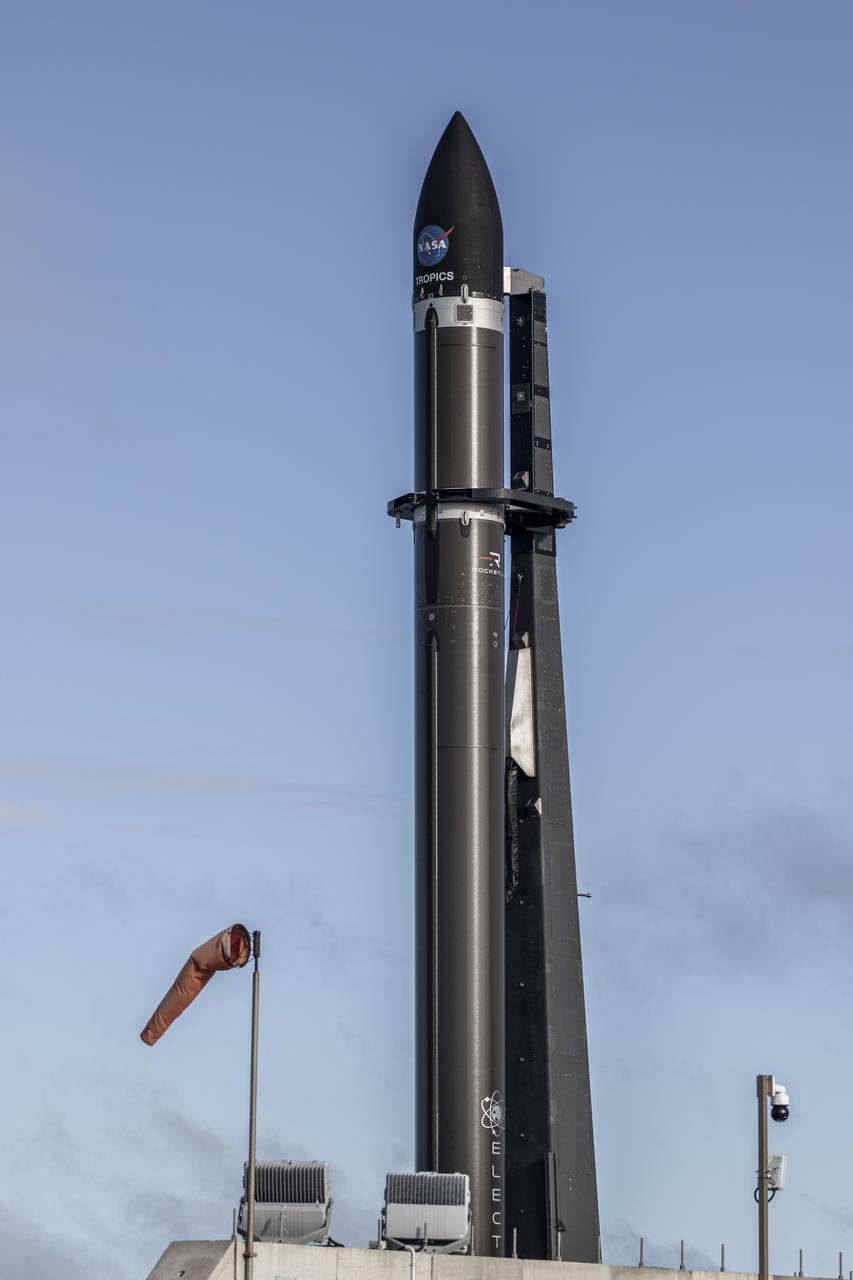
A Rocket Lab Electron rocket stands on Pad B, Launch Complex 1, in Māhia, New Zealand, just ahead of liftoff at 3:46 p.m. NZST Friday, May 26, with NASA’s Time-Resolved Observations of Precipitation structure and storm Intensity with a Constellation of Smallsats (TROPICS) CubeSats secured in the payload fairing atop the rocket. The successful launch placed the final pair of TROPICS CubeSats into orbit, completing the constellation. TROPICS will provide data on temperature, precipitation, water vapor, and clouds by measuring microwave frequencies, providing insight into storm formation and intensification.
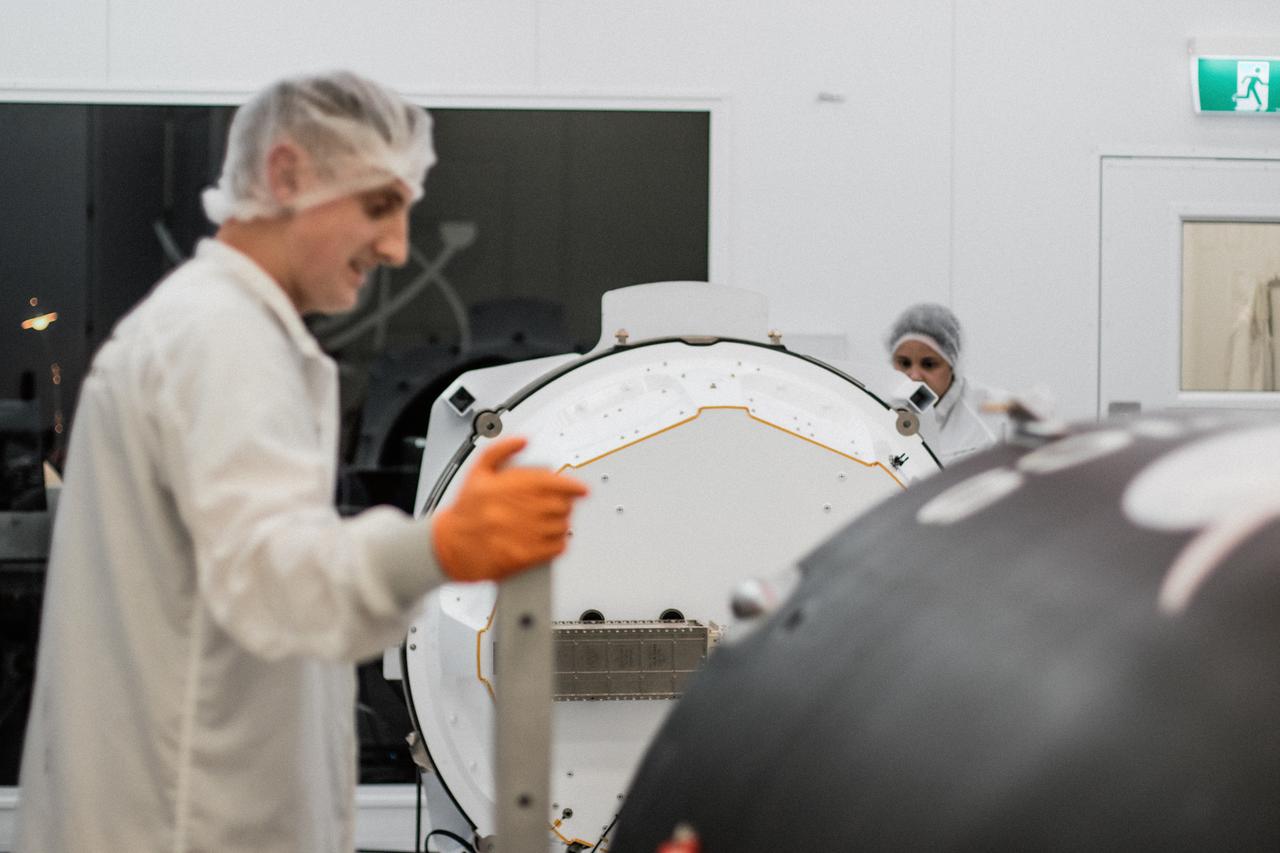
Two CubeSats are encapsulated at the Rocket Lab facility in Mahia, New Zealand, on April 24, 2023, in preparation for NASA’s second TROPICS (Time-Resolved Observations of Precipitation structure and storm Intensity with a Constellation of Smallsats) launch. After successfully launching the first pair of small satellites earlier this month from Launch Complex 1 in Mahia, New Zealand, NASA and Rocket Lab are targeting no earlier than 12 a.m. EDT Thursday, May 25 (4 p.m. NZST), for liftoff of the second pair of storm tracking CubeSats into orbit. NASA will use TROPICS to study tropical cyclones as part of the agency’s Earth Venture Class missions.

Two CubeSats are encapsulated at the Rocket Lab facility in Mahia, New Zealand, on April 24, 2023, in preparation for NASA’s second TROPICS (Time-Resolved Observations of Precipitation structure and storm Intensity with a Constellation of Smallsats) launch. After successfully launching the first pair of small satellites earlier this month from Launch Complex 1 in Mahia, New Zealand, NASA and Rocket Lab are targeting no earlier than 12 a.m. EDT Thursday, May 25 (4 p.m. NZST), for liftoff of the second pair of storm tracking CubeSats into orbit. NASA will use TROPICS to study tropical cyclones as part of the agency’s Earth Venture Class missions.
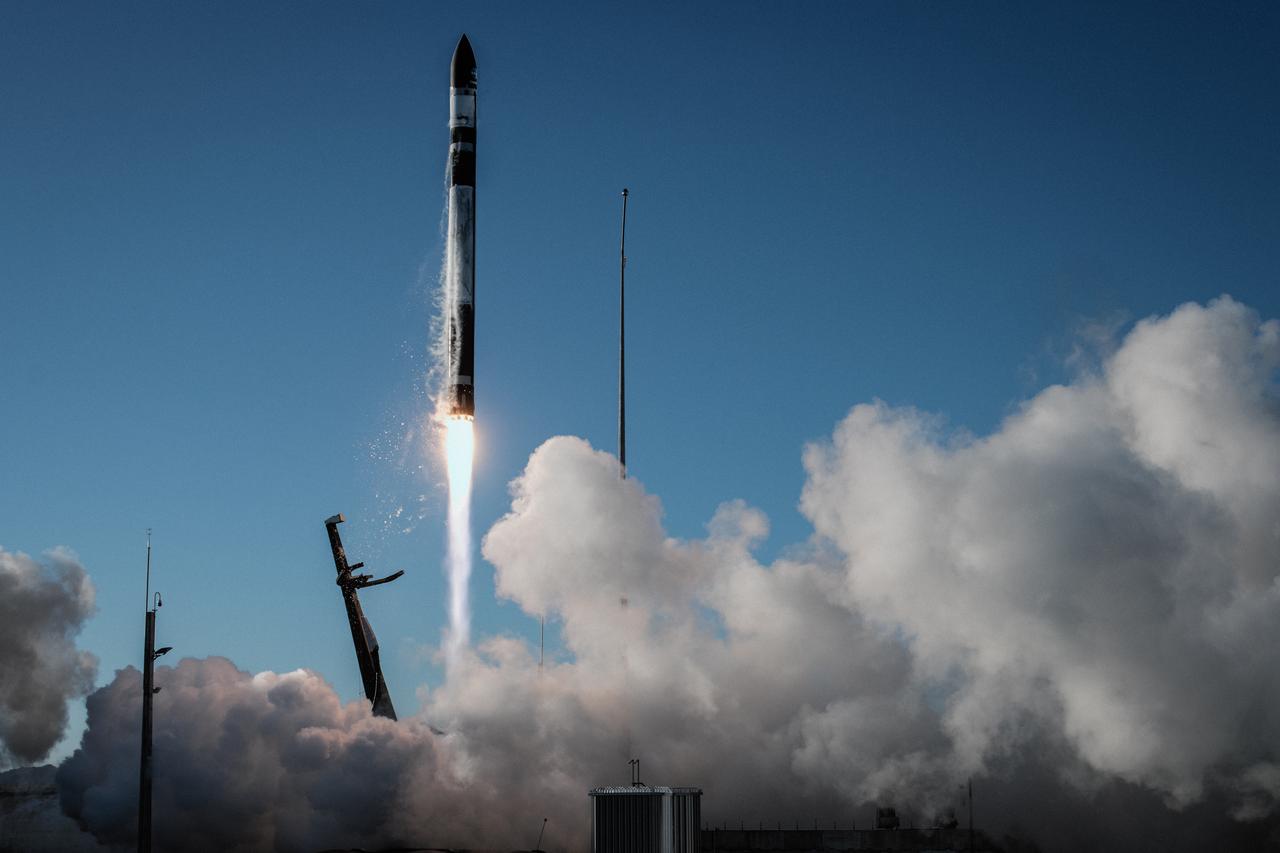
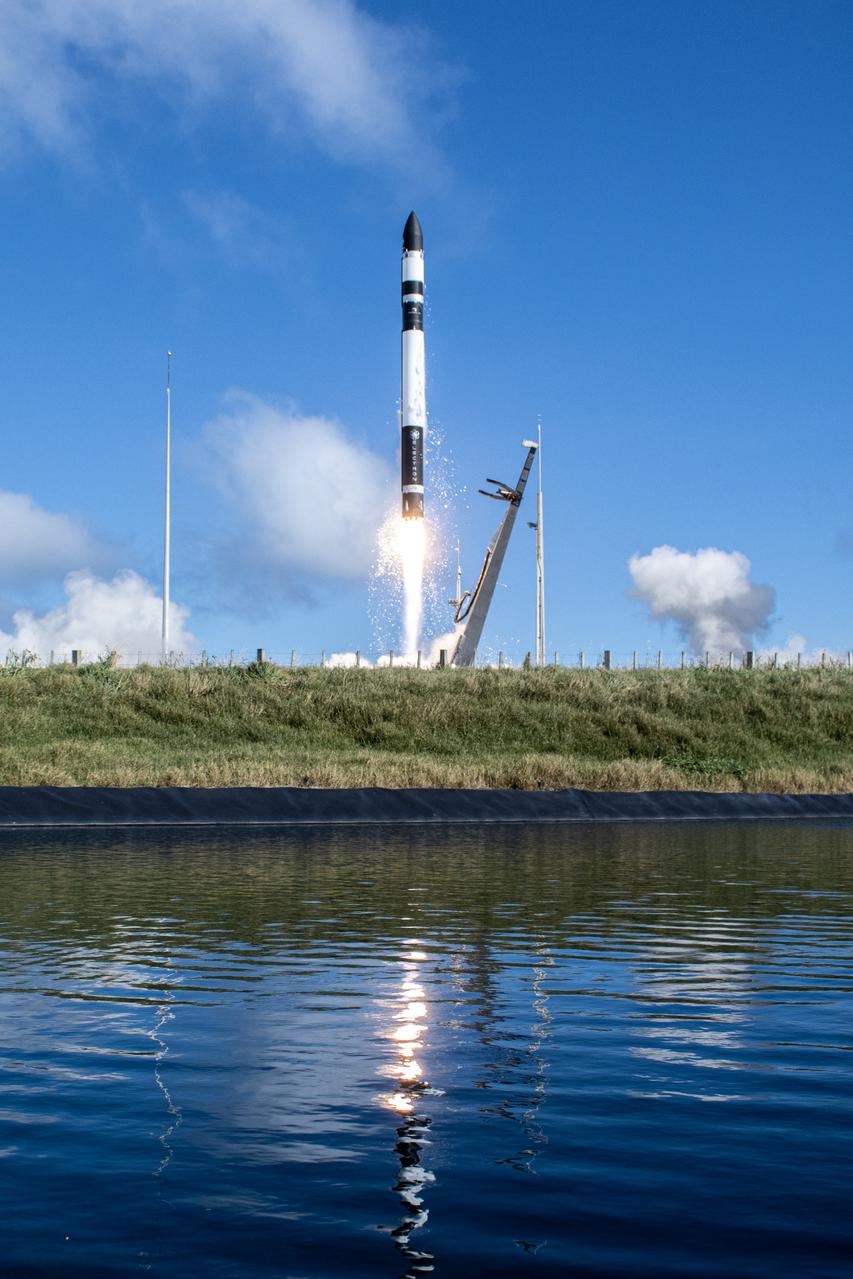
A Rocket Lab Electron rocket soars upward after liftoff from Pad B, Launch Complex 1, in Māhia, New Zealand, at 11:46 p.m. EDT on Thursday, May 25 (3:46 p.m. NZST Friday, May 26) carrying the final pair of NASA’s Time-Resolved Observations of Precipitation structure and storm Intensity with a Constellation of Smallsats (TROPICS) CubeSats secured in the payload fairing atop the rocket. The successful launch placed the final pair of TROPICS CubeSats into orbit, completing the constellation. TROPICS will provide data on temperature, precipitation, water vapor, and clouds by measuring microwave frequencies, providing insight into storm formation and intensification.
A Rocket Lab Electron rocket lifts off from Pad B, Launch Complex 1, in Māhia, New Zealand, at 11:46 p.m. EDT on Thursday, May 25 (3:46 p.m. NZST Friday, May 26) carrying the final pair of NASA’s Time-Resolved Observations of Precipitation structure and storm Intensity with a Constellation of Smallsats (TROPICS) CubeSats secured in the payload fairing atop the rocket. The successful launch placed the final pair of TROPICS CubeSats into orbit, completing the constellation. TROPICS will provide data on temperature, precipitation, water vapor, and clouds by measuring microwave frequencies, providing insight into storm formation and intensification.
A Rocket Lab Electron rocket lifts off from Pad B, Launch Complex 1, in Māhia, New Zealand, at 11:46 p.m. EDT on Thursday, May 25 (3:46 p.m. NZST Friday, May 26) carrying the final pair of NASA’s Time-Resolved Observations of Precipitation structure and storm Intensity with a Constellation of Smallsats (TROPICS) CubeSats secured in the payload fairing atop the rocket. The successful launch placed the final pair of TROPICS CubeSats into orbit, completing the constellation. TROPICS will provide data on temperature, precipitation, water vapor, and clouds by measuring microwave frequencies, providing insight into storm formation and intensification.
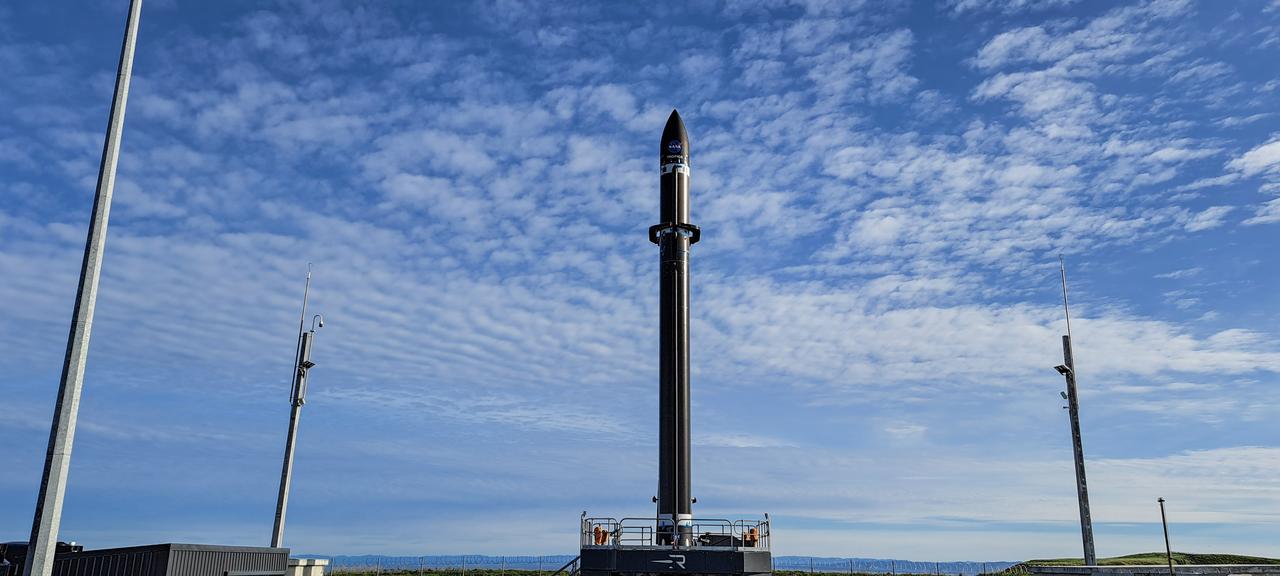
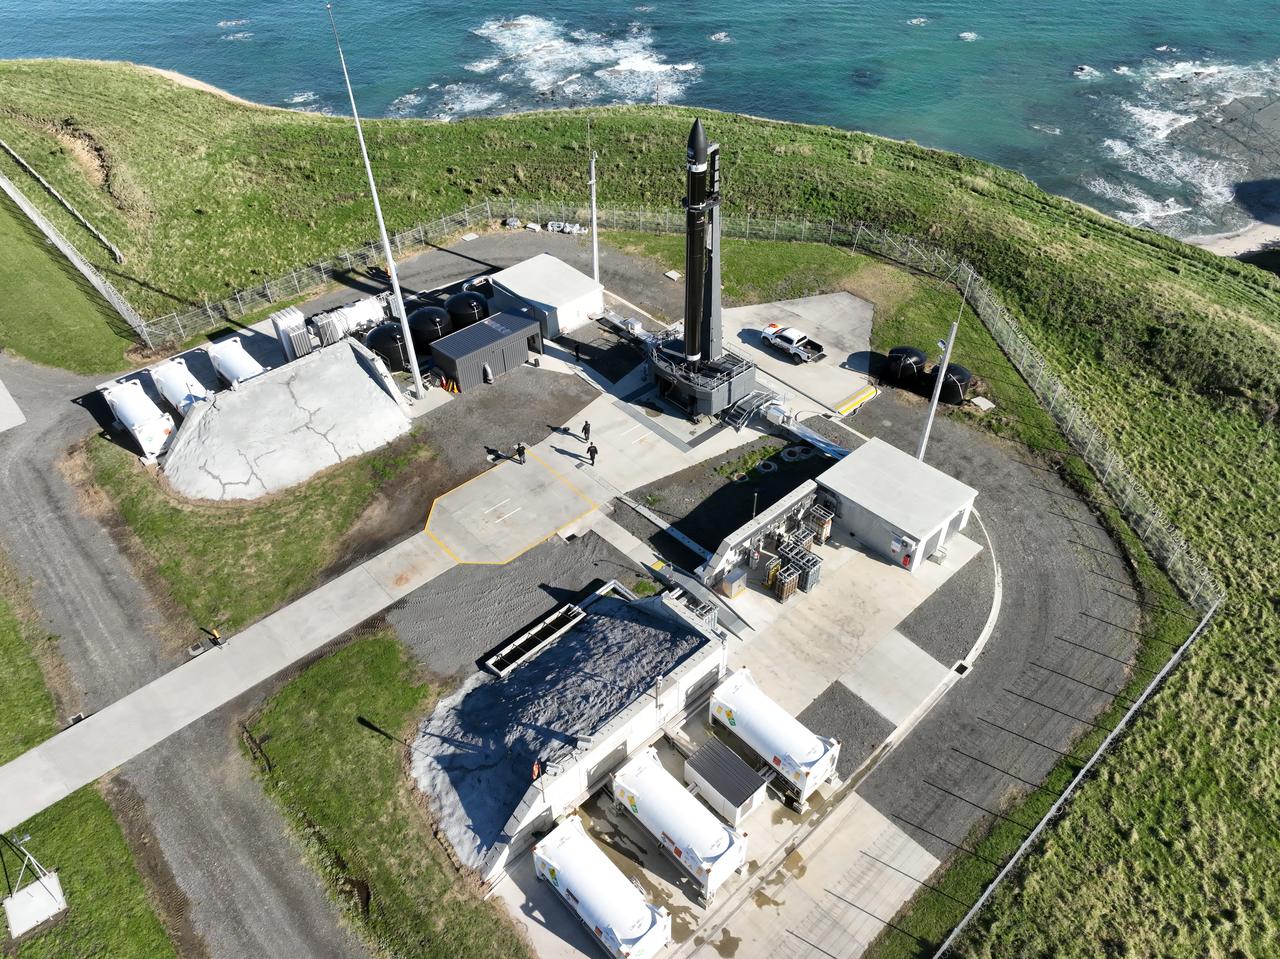
Rocket Lab’s Electron rocket is vertical on the pad at Launch Complex 1 in Mahia, New Zealand, during a May 18, 2023, wet dress rehearsal for NASA’s Time-Resolved Observations of Precipitation structure and storm Intensity with a Constellation of Smallsats (TROPICS) launch. After successfully launching the first pair of small satellites earlier this month from New Zealand, NASA and Rocket Lab are targeting no earlier than 12 a.m. EDT Thursday, May 25 (4 p.m. NZST), to launch the second pair of storm tracking CubeSats into orbit. NASA will use TROPICS to study tropical cyclones as part of the agency’s Earth Venture Class missions.

Two CubeSats are encapsulated at the Rocket Lab facility in Mahia, New Zealand, on April 24, 2023, in preparation for NASA’s second TROPICS (Time-Resolved Observations of Precipitation structure and storm Intensity with a Constellation of Smallsats) launch. After successfully launching the first pair of small satellites earlier this month from Launch Complex 1 in Mahia, New Zealand, NASA and Rocket Lab are targeting no earlier than 12 a.m. EDT Thursday, May 25 (4 p.m. NZST), for liftoff of the second pair of storm tracking CubeSats into orbit. NASA will use TROPICS to study tropical cyclones as part of the agency’s Earth Venture Class missions.
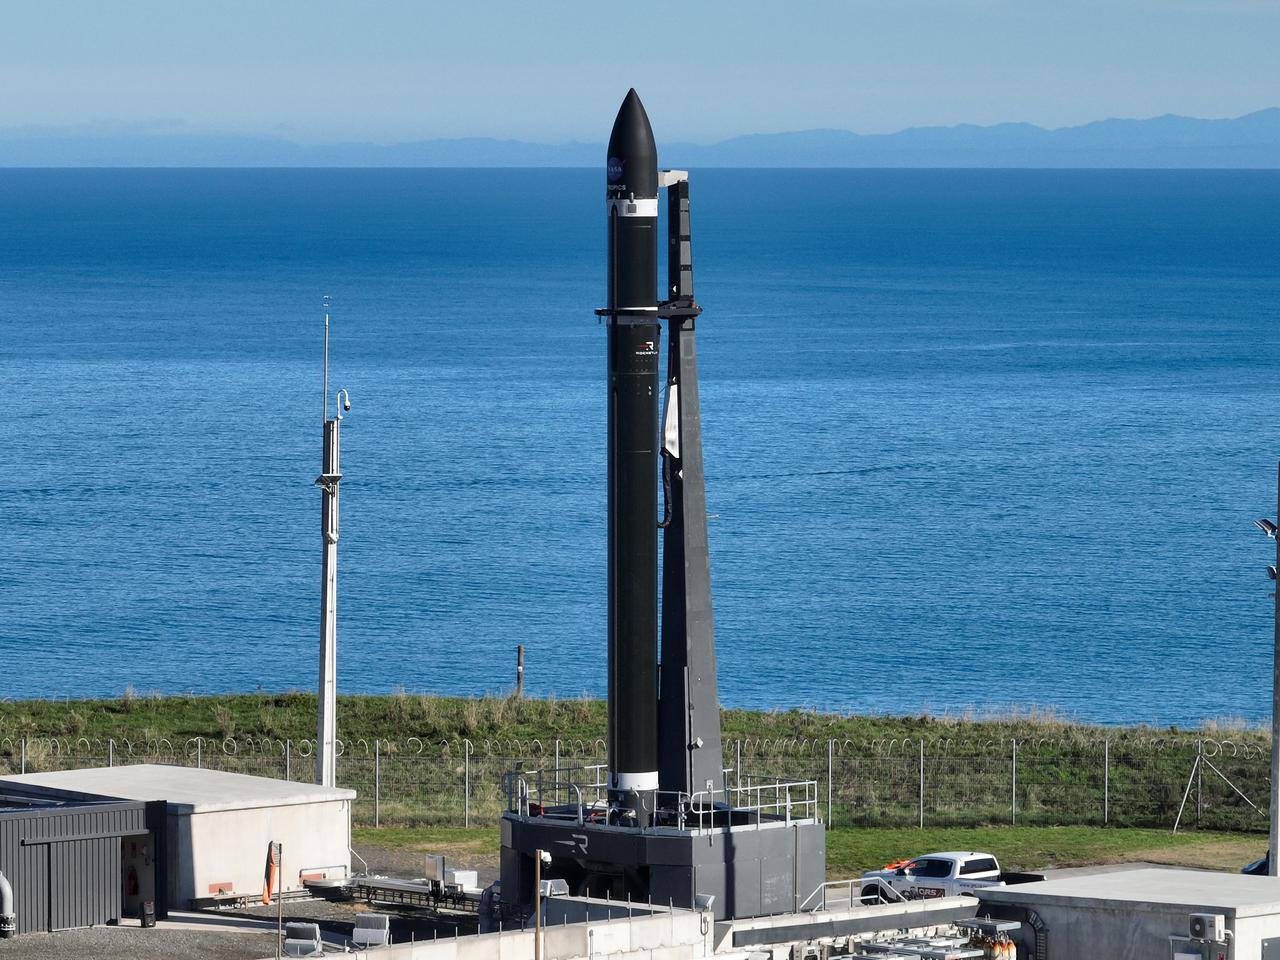
A Rocket Lab Electron rocket stands on Pad B, Launch Complex 1, in Māhia, New Zealand, just ahead of liftoff at 3:46 p.m. NZST Friday, May 26, with NASA’s Time-Resolved Observations of Precipitation structure and storm Intensity with a Constellation of Smallsats (TROPICS) CubeSats secured in the payload fairing atop the rocket. The successful launch placed the final pair of TROPICS CubeSats into orbit, completing the constellation. TROPICS will provide data on temperature, precipitation, water vapor, and clouds by measuring microwave frequencies, providing insight into storm formation and intensification.
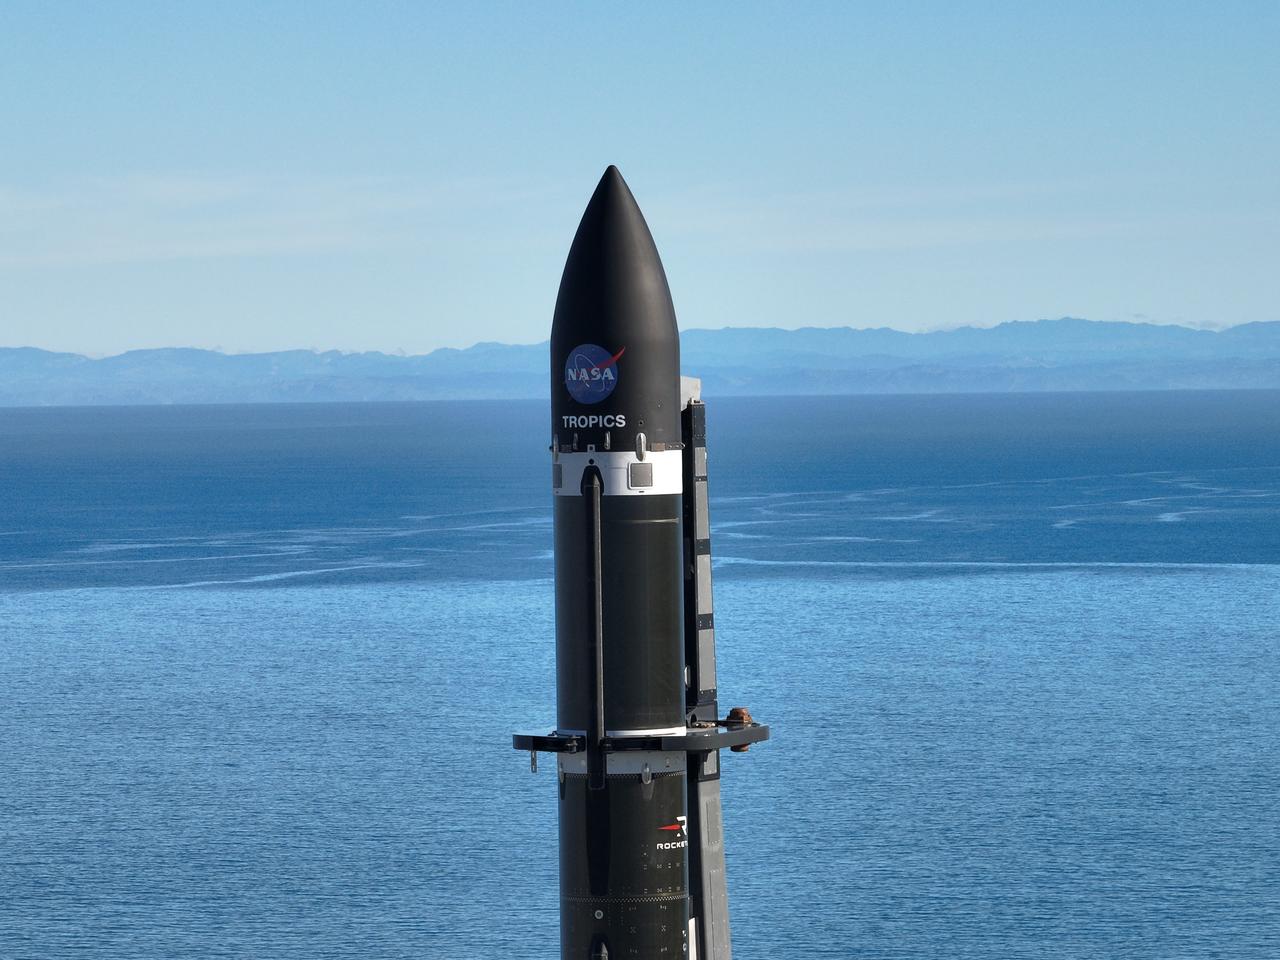
A Rocket Lab Electron rocket stands on Pad B, Launch Complex 1, in Māhia, New Zealand, just ahead of liftoff at 3:46 p.m. NZST Friday, May 26, with NASA’s Time-Resolved Observations of Precipitation structure and storm Intensity with a Constellation of Smallsats (TROPICS) CubeSats secured in the payload fairing atop the rocket. The successful launch placed the final pair of TROPICS CubeSats into orbit, completing the constellation. TROPICS will provide data on temperature, precipitation, water vapor, and clouds by measuring microwave frequencies, providing insight into storm formation and intensification.
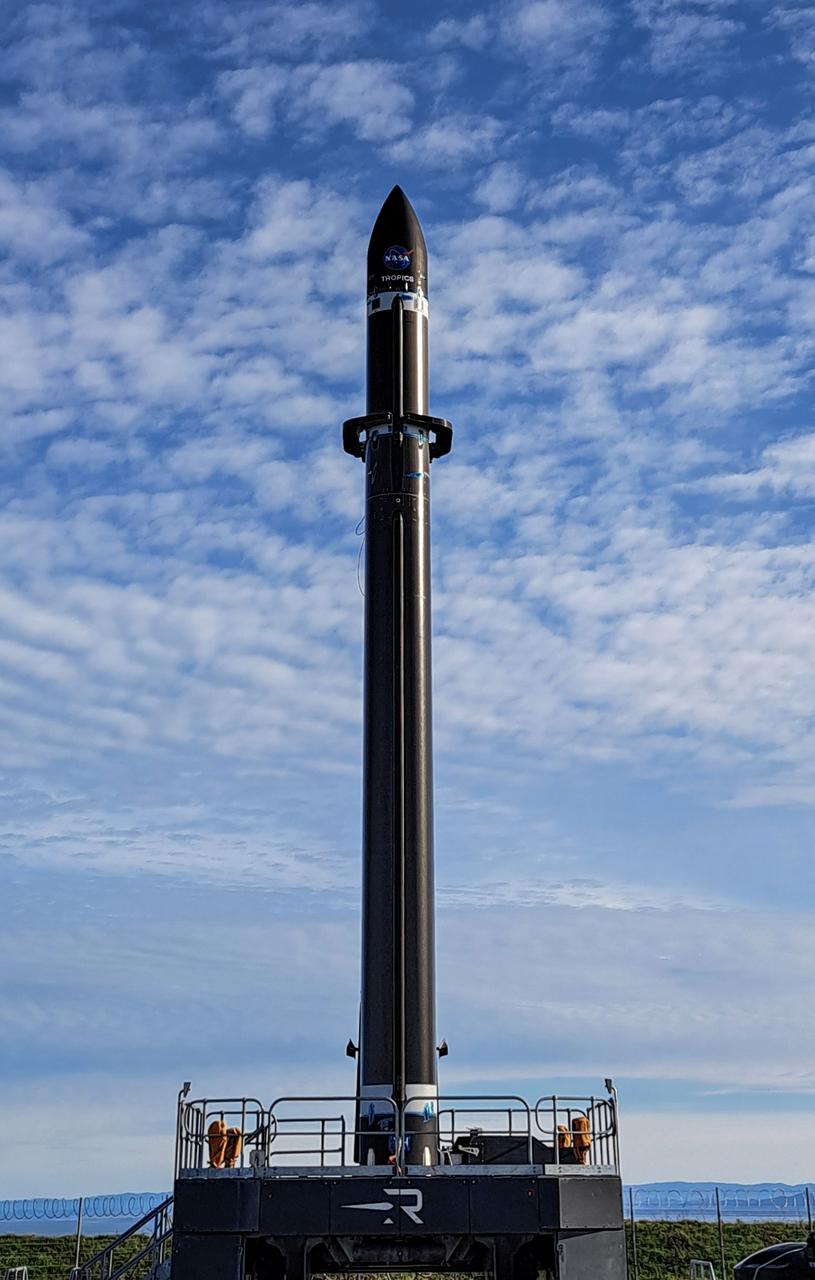
Rocket Lab’s Electron rocket is vertical on the pad at Launch Complex 1 in Mahia, New Zealand, during a May 18, 2023, wet dress rehearsal for NASA’s Time-Resolved Observations of Precipitation structure and storm Intensity with a Constellation of Smallsats (TROPICS) launch. After successfully launching the first pair of small satellites earlier this month from New Zealand, NASA and Rocket Lab are targeting no earlier than 12 a.m. EDT Thursday, May 25 (4 p.m. NZST), to launch the second pair of storm tracking CubeSats into orbit. NASA will use TROPICS to study tropical cyclones as part of the agency’s Earth Venture Class missions.
A Rocket Lab Electron rocket stands on Pad B, Launch Complex 1, in Māhia, New Zealand, just ahead of liftoff at 3:46 p.m. NZST Friday, May 26, with NASA’s Time-Resolved Observations of Precipitation structure and storm Intensity with a Constellation of Smallsats (TROPICS) CubeSats secured in the payload fairing atop the rocket. The successful launch placed the final pair of TROPICS CubeSats into orbit, completing the constellation. TROPICS will provide data on temperature, precipitation, water vapor, and clouds by measuring microwave frequencies, providing insight into storm formation and intensification.
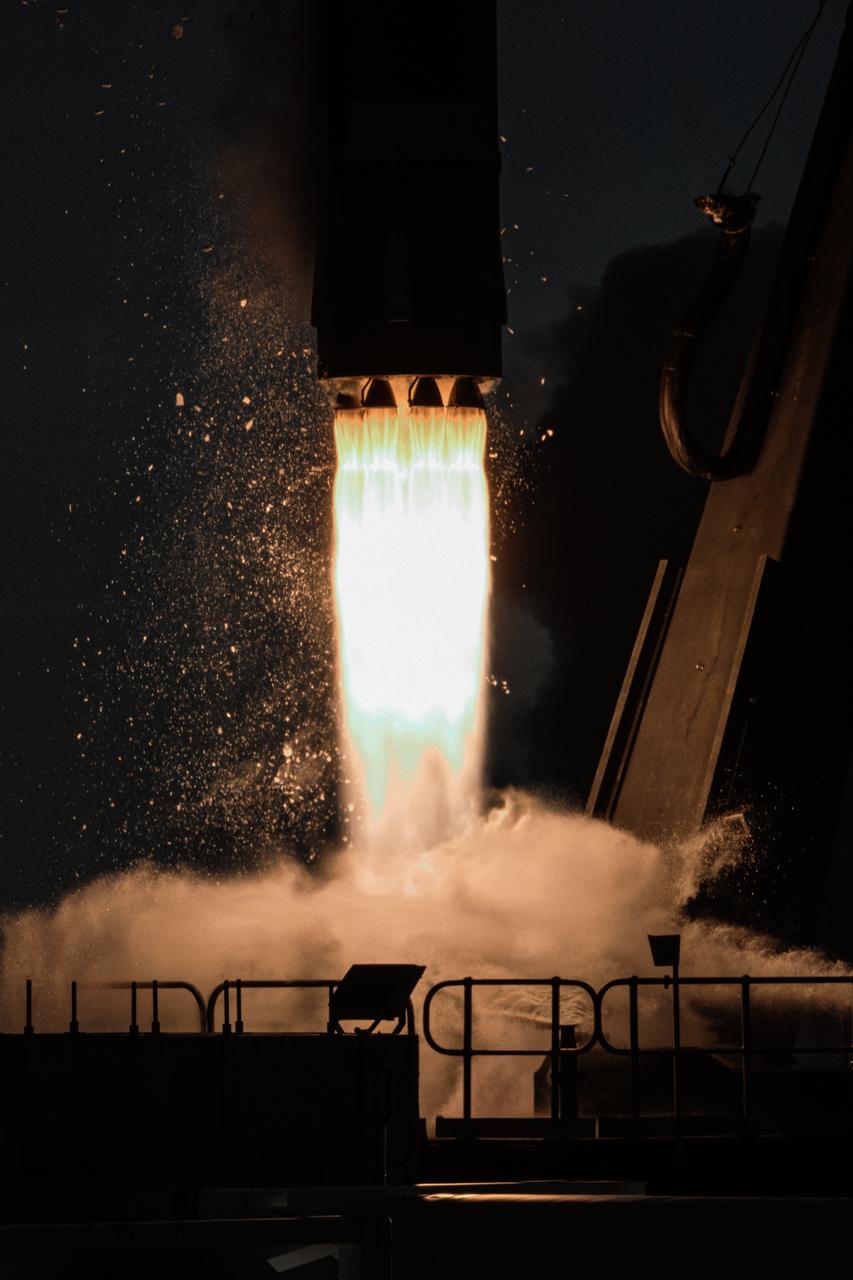
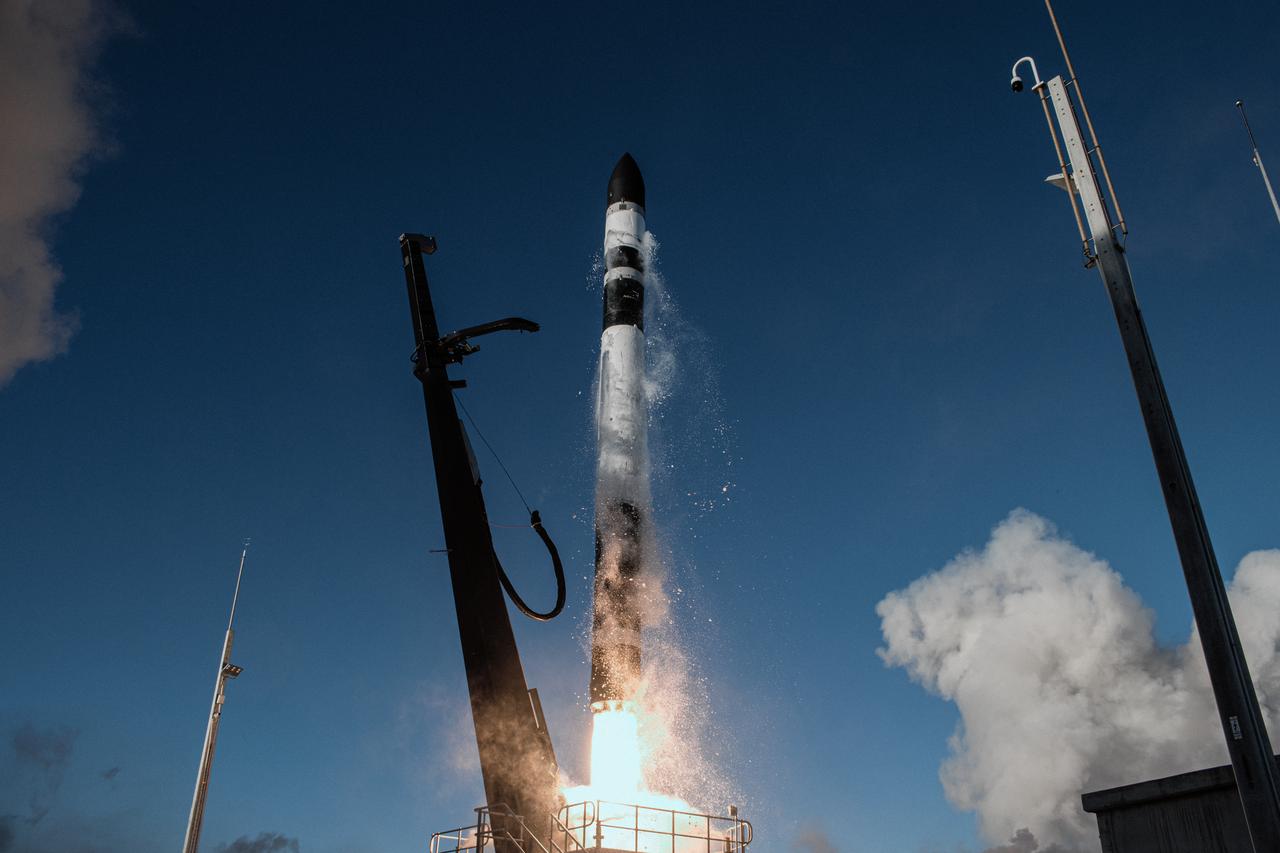
The first stage of a Rocket Lab Electron rocket ignites at liftoff from Pad B, Launch Complex 1, in Māhia, New Zealand, at 11:46 p.m. EDT on Thursday, May 25 (3:46 p.m. NZST Friday, May 26) carrying the final pair of NASA’s Time-Resolved Observations of Precipitation structure and storm Intensity with a Constellation of Smallsats (TROPICS) CubeSats secured in the payload fairing atop the rocket. The successful launch placed the final pair of TROPICS CubeSats into orbit, completing the constellation. TROPICS will provide data on temperature, precipitation, water vapor, and clouds by measuring microwave frequencies, providing insight into storm formation and intensification.

A Rocket Lab Electron rocket lifts off Launch Complex 1, Pad B, in Māhia, New Zealand on May 8 at 1 p.m. New Zealand time (May 7 at 9 p.m. EDT), carrying two NASA CubeSats designed to study tropical cyclones, including hurricanes and typhoons. NASA’s Time-Resolved Observations of Precipitation structure and storm Intensity with a Constellation of Smallsats (TROPICS) CubeSats will provide data on temperature, precipitation, water vapor, and clouds by measuring microwave frequencies, providing insight into storm formation and intensification.
A Rocket Lab Electron rocket lifts off Launch Complex 1, Pad B, in Māhia, New Zealand on May 8 at 1 p.m. New Zealand time (May 7 at 9 p.m. EDT), carrying two NASA CubeSats designed to study tropical cyclones, including hurricanes and typhoons. NASA’s Time-Resolved Observations of Precipitation structure and storm Intensity with a Constellation of Smallsats (TROPICS) CubeSats will provide data on temperature, precipitation, water vapor, and clouds by measuring microwave frequencies, providing insight into storm formation and intensification.
A Rocket Lab Electron rocket is poised for launch atop Pad B, Launch Complex 1, in Māhia, New Zealand. Launch time is May 8 at 1 p.m. New Zealand time (May 7 at 9 p.m. EDT). The Electron rocket is carrying two NASA CubeSats designed to study tropical cyclones, including hurricanes and typhoons. NASA’s Time-Resolved Observations of Precipitation structure and storm Intensity with a Constellation of Smallsats (TROPICS) CubeSats will provide data on temperature, precipitation, water vapor, and clouds by measuring microwave frequencies, providing insight into storm formation and intensification.

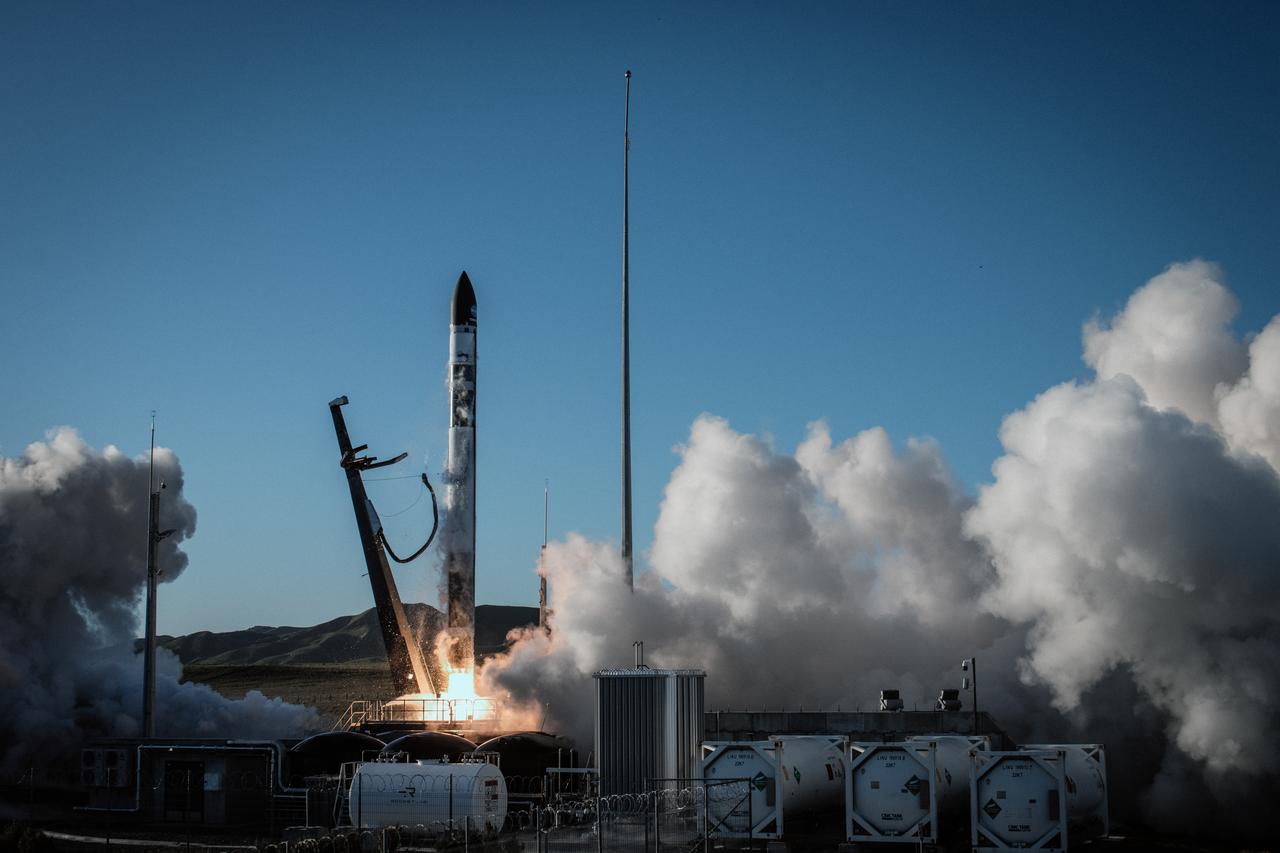
The engines of the first stage of a Rocket Lab Electron rocket ignite as the rocket lifts off Launch Complex 1, Pad B, in Māhia, New Zealand on May 8 at 1 p.m. New Zealand time (May 7 at 9 p.m. EDT), carrying two NASA CubeSats designed to study tropical cyclones, including hurricanes and typhoons. NASA’s Time-Resolved Observations of Precipitation structure and storm Intensity with a Constellation of Smallsats (TROPICS) CubeSats will provide data on temperature, precipitation, water vapor, and clouds by measuring microwave frequencies, providing insight into storm formation and intensification.

A Rocket Lab Electron rocket soars upward after liftoff from Launch Complex 1, Pad B, in Māhia, New Zealand on May 8 at 1 p.m. New Zealand time (May 7 at 9 p.m. EDT), carrying two NASA CubeSats designed to study tropical cyclones, including hurricanes and typhoons. NASA’s Time-Resolved Observations of Precipitation structure and storm Intensity with a Constellation of Smallsats (TROPICS) CubeSats will provide data on temperature, precipitation, water vapor, and clouds by measuring microwave frequencies, providing insight into storm formation and intensification.

The engines of the first stage of a Rocket Lab Electron rocket ignite as the rocket lifts off Launch Complex 1, Pad B, in Māhia, New Zealand on May 8 at 1 p.m. New Zealand time (May 7 at 9 p.m. EDT), carrying two NASA CubeSats designed to study tropical cyclones, including hurricanes and typhoons. NASA’s Time-Resolved Observations of Precipitation structure and storm Intensity with a Constellation of Smallsats (TROPICS) CubeSats will provide data on temperature, precipitation, water vapor, and clouds by measuring microwave frequencies, providing insight into storm formation and intensification.
As the remains of Tropical Storm Lee passed over Louisiana on Monday, Sept. 5, 2011, strong, gusty winds on the western side of the storm stoked fires throughout eastern Texas as seen in this image from NASA Terra spacecraft.
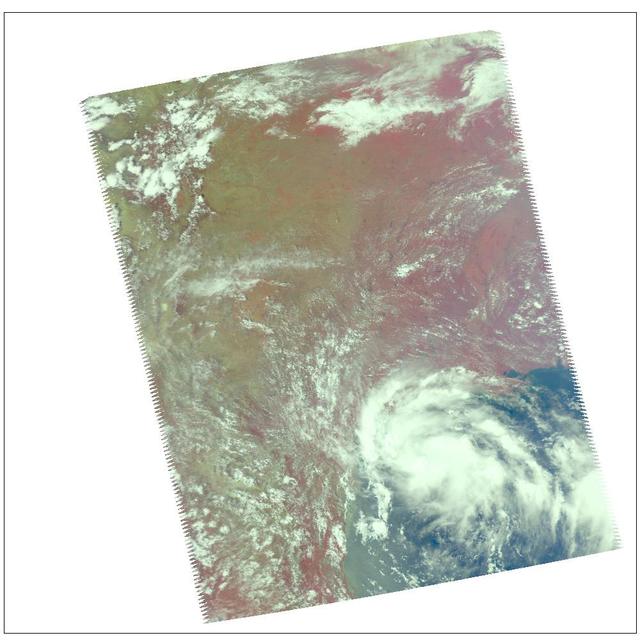
These July 11, 2006 images from NASA Terra Satellite show then Tropical Storm Bud as it was intensifying into a hurricane, which it became later that day.
Tropical Storm Isidore was born in mid-September, 2000 north of Venezuela. This images is from Atmospheric Infrared Sounding System AIRS on NASA Aqua. http://photojournal.jpl.nasa.gov/catalog/PIA00365
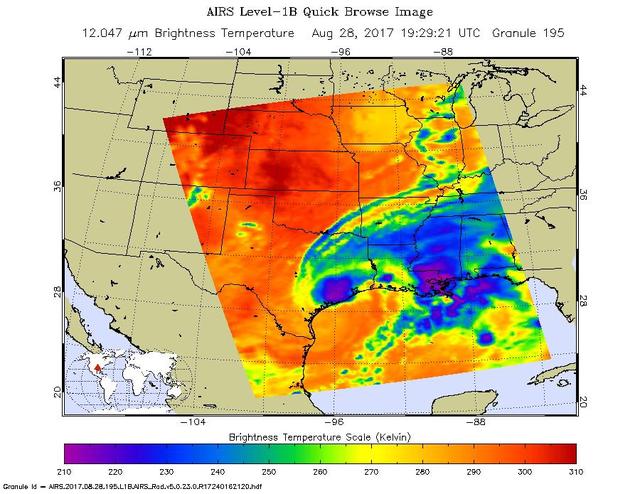
The latest infrared image from NASA's Atmospheric Infrared Sounder (AIRS) instrument aboard NASA's Aqua satellite illustrates the growing flood threat from now Tropical Storm Harvey. In the false-color image, acquired at 2:29 p.m. CDT (19:29 UTC) on Aug. 28, 2017, a large area of dark blue and purple centered along the southeastern Texas coast denotes the coldest cloud top temperatures and strongest thunderstorms. A second area of intense precipitation is visible over southeastern Louisiana. Harvey has reemerged over the Gulf of Mexico, but the National Hurricane Center forecasts only a small amount of strengthening before the storm moves slowly north and inland again. https://photojournal.jpl.nasa.gov/catalog/PIA21885
NASA Aqua spacecraft continues to track the gradual organization of Tropical Storm Emily, as seen in this image taken Aug. 2, 2011 at 1:05 p.m. EDT. At that time, the storm was located about 270 miles southeast of San Juan, Puerto Rico.
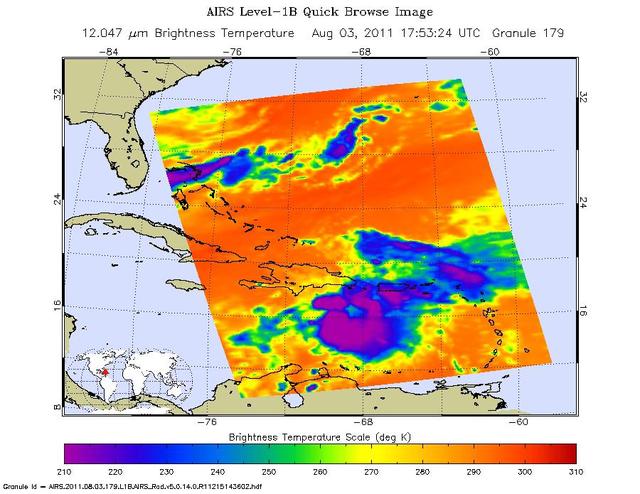
Tropical Storm Emily continues its march toward Hispaniola, which it is expected to reach later on Aug. 3. NASA Aqua spacecraft captured this infrared image 1:53 p.m. EDT on Aug. 3, with the storm located south of Santo Domingo, Dominican Republic.