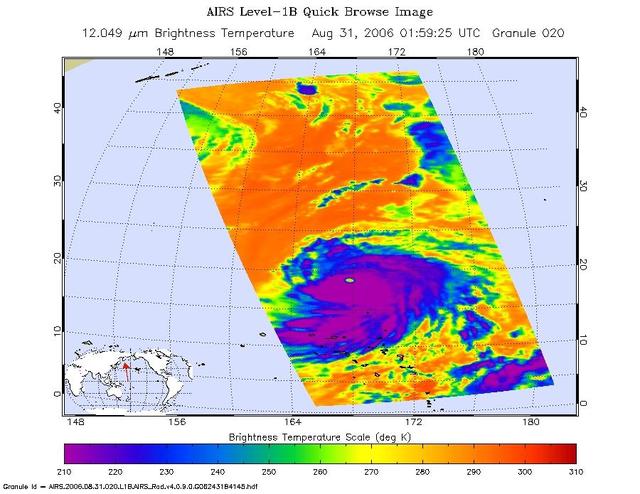
This infrared image shows Typhoon Ioke in the Western Pacific, from the Atmospheric Infrared Sounder AIRS on NASA Aqua satellite in August, 2006. Because infrared radiation does not penetrate through clouds, AIRS infrared images show either the temperature of the cloud tops or the surface of the Earth in cloud-free regions. The lowest temperatures (in purple) are associated with high, cold cloud tops that make up the top of the storm. In cloud-free areas the AIRS instrument will receive the infrared radiation from the surface of the Earth, resulting in the warmest temperatures (orange/red). http://photojournal.jpl.nasa.gov/catalog/PIA00511
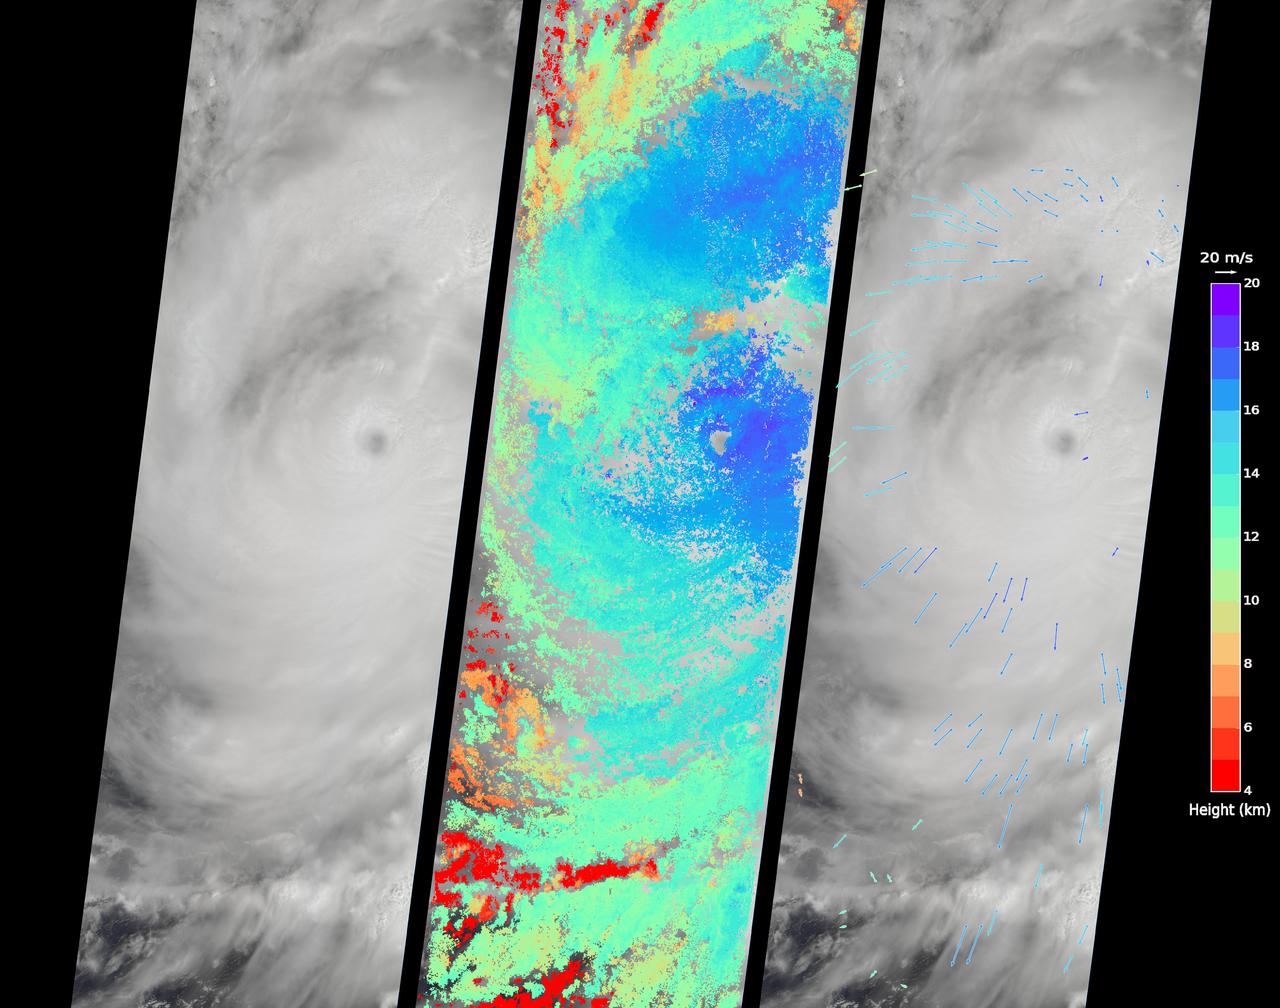
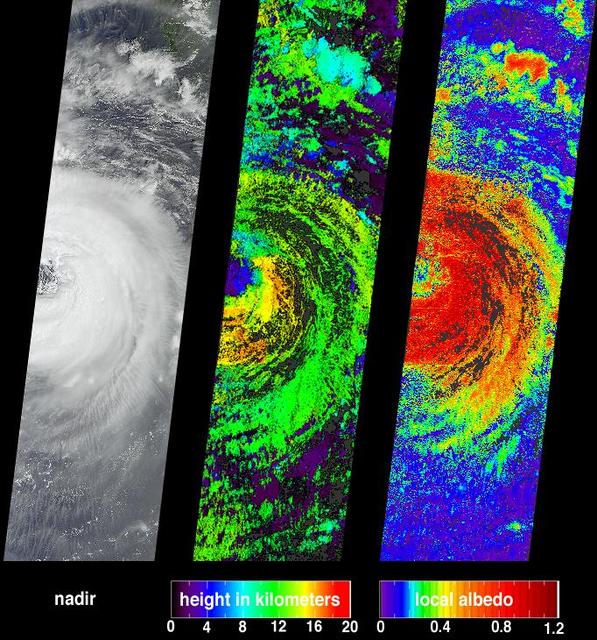
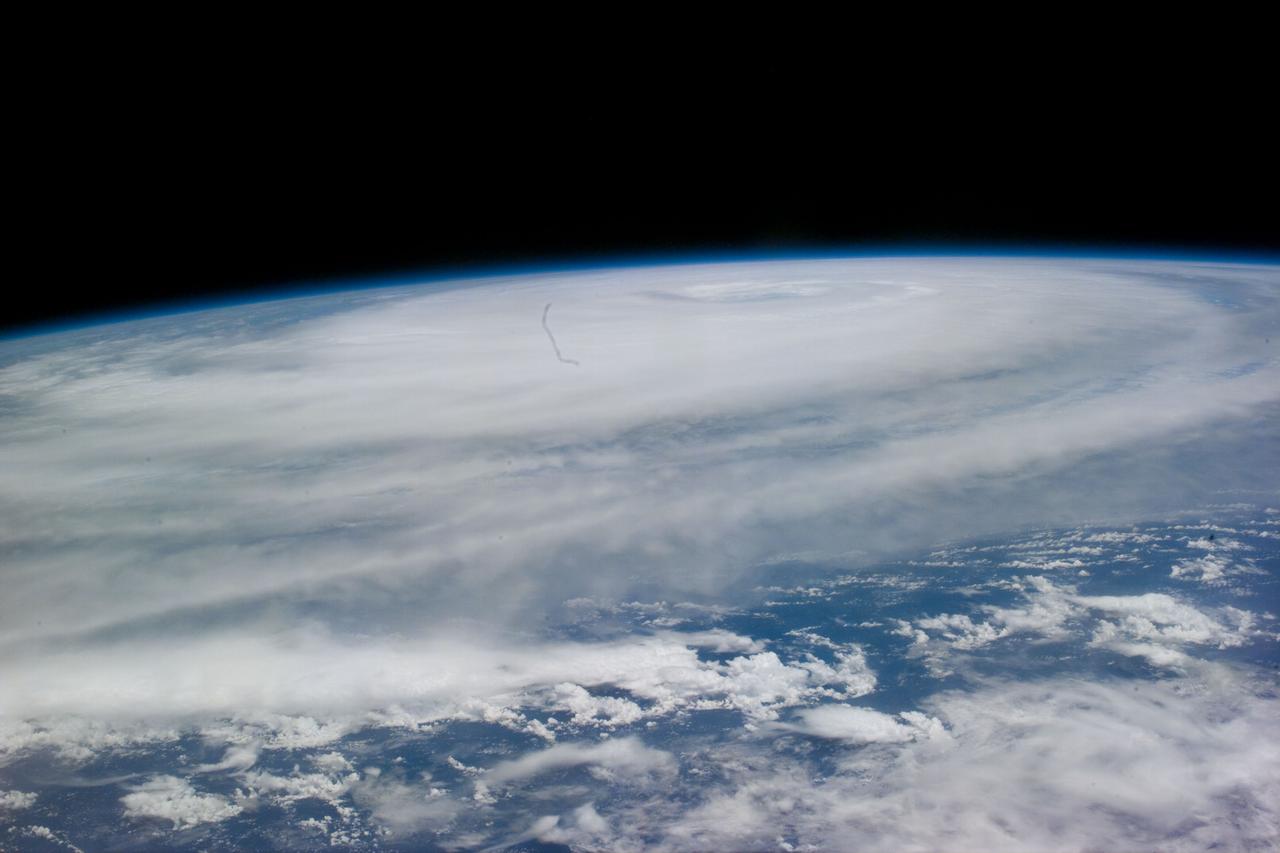
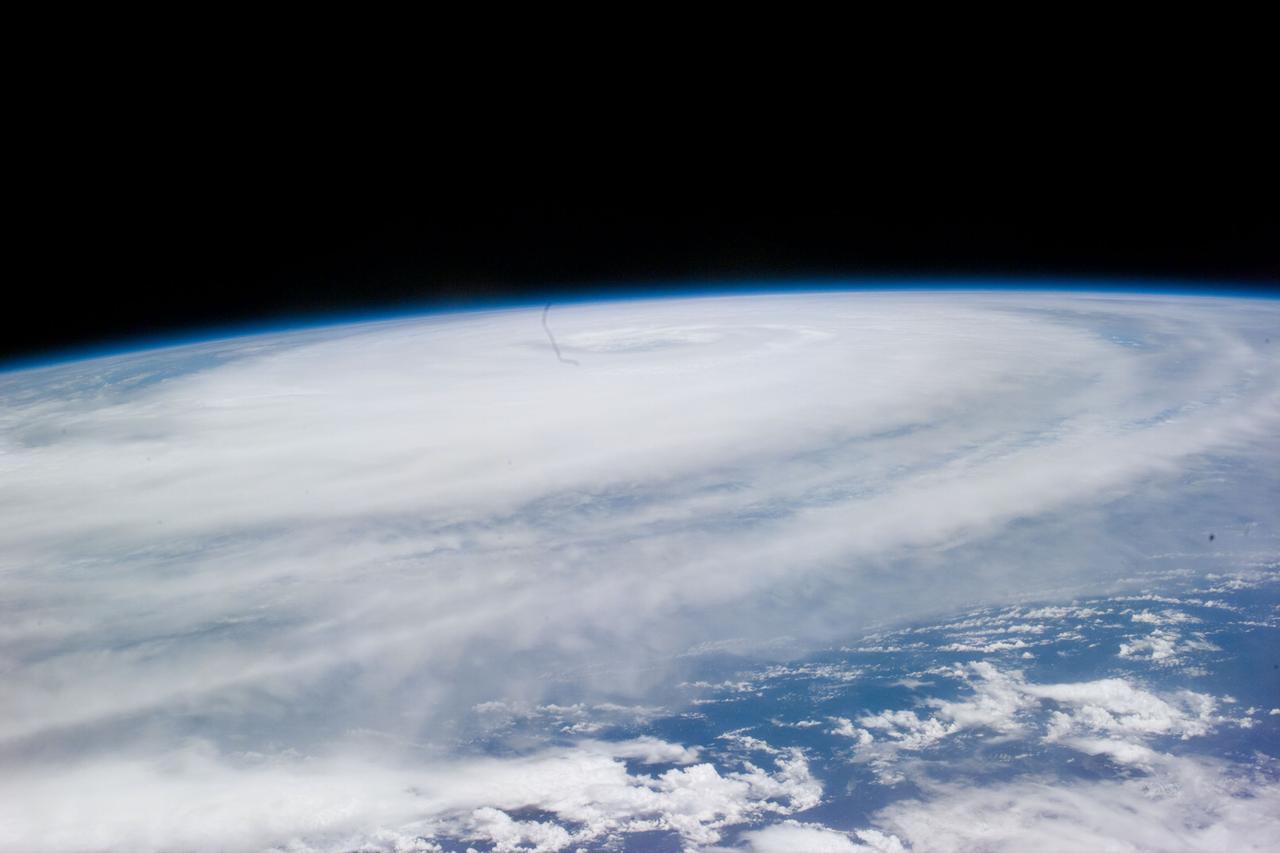
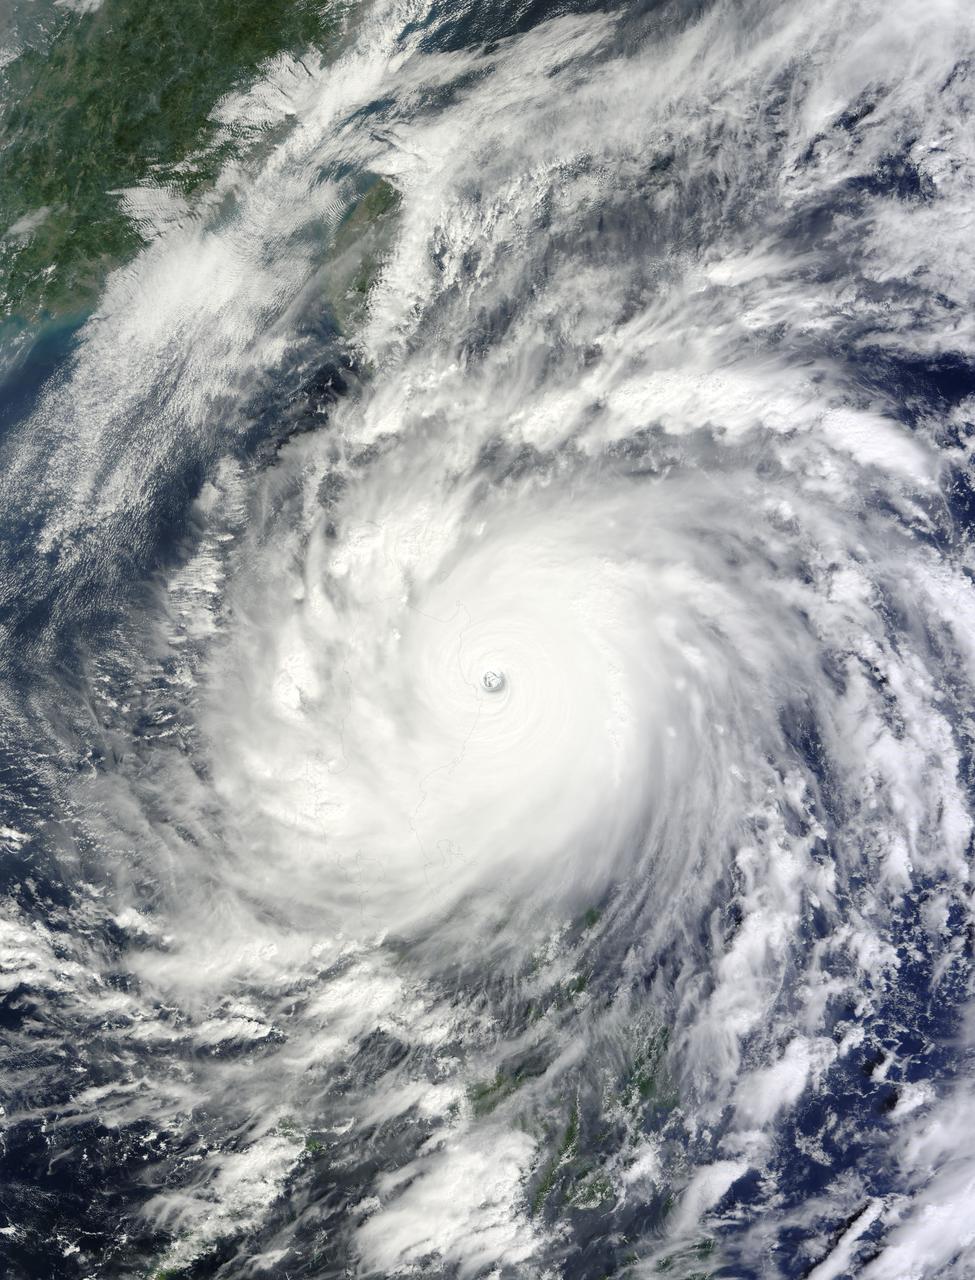
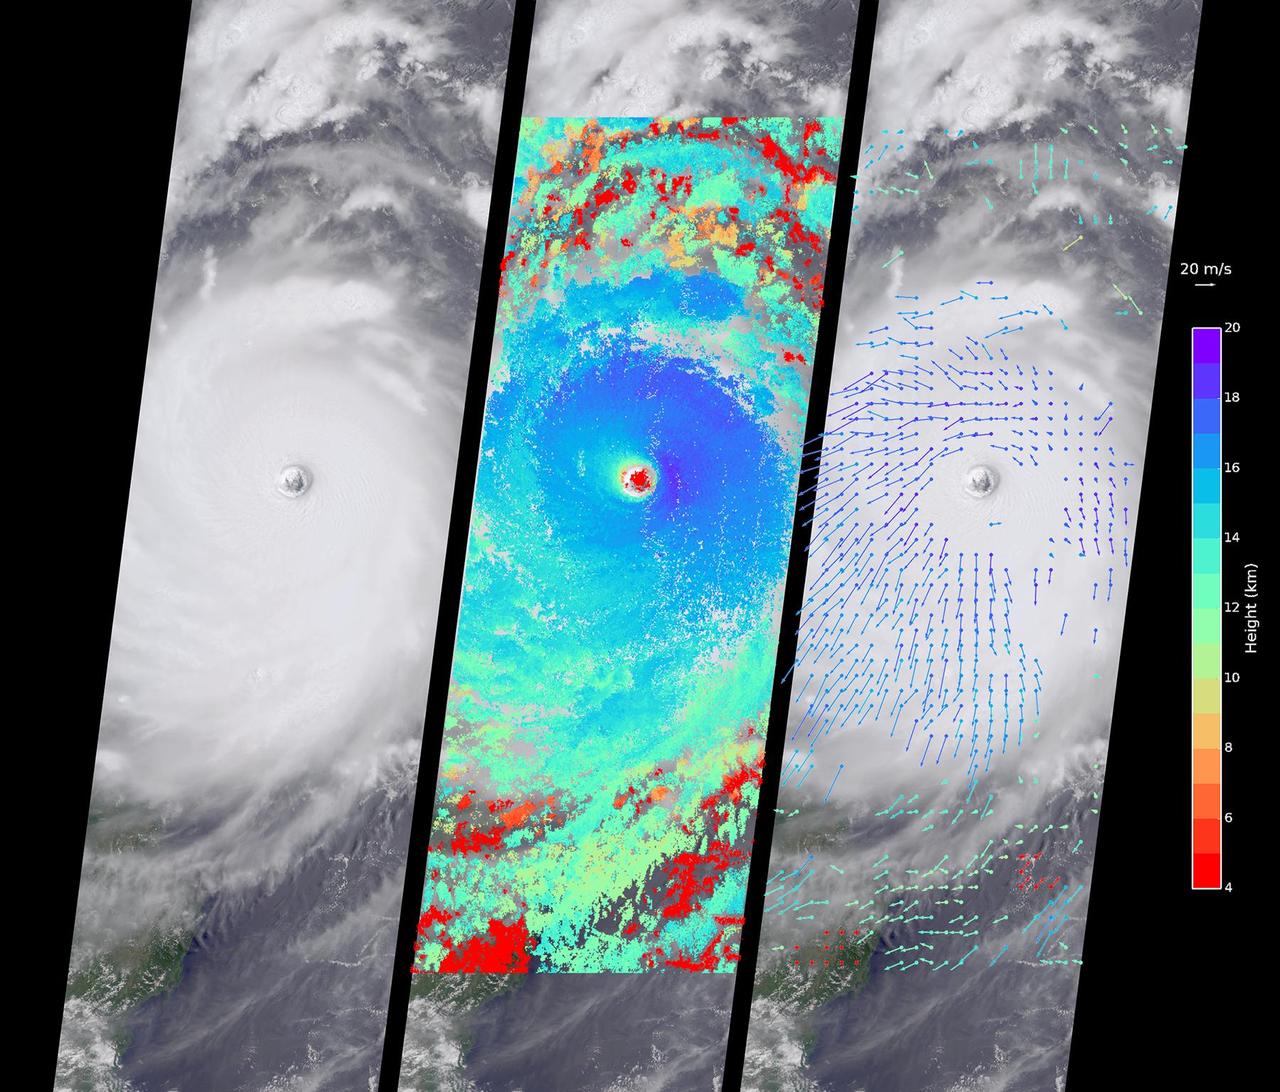
On Sept. 14, 2016, the eye of Super Typhoon Meranti passed just south of Taiwan. The enormous storm, classified as a Category 5 typhoon at the time, still caused much disruption on the island. Nearly 500,000 homes lost power, schools were closed, and most flights were cancelled. Maximum wind speeds were 180 miles per hour (290 kilometers per hour) as the storm passed, and more than 25 inches (64 centimeters) of rain fell on some areas of the country. However, the storm did not pass over Taiwan's mountainous landscape, which would have weakened it. That means it will remain strong as it heads toward mainland China, unlike Super Typhoon Nepartak in July, which weakened from a Category 5 typhoon to a tropical storm after crossing Taiwan. Meranti is currently maintaining Category 4 strength and is expected to make landfall near Shantou, Guangdong province, on Thursday, September 15. The coast of China is more vulnerable to storm surges than Taiwan due to shallower coastal waters and recent rainfall. There is risk of substantial flooding. On Sept. 14, at 10:45 AM local time, the Multi-angle Imaging SpectroRadiometer (MISR) instrument aboard NASA's Terra satellite passed directly over the eye of Meranti. On the left is a natural-color image from MISR's nadir-pointing camera. At this time the eye of Meranti was just off the southern tip of Taiwan, which is invisible under the clouds. The coast of China is barely visible through the clouds in the upper left portion of the image. The small eye and dense high clouds are both markers of the storm's power. MISR's nine cameras, each pointed at a different angle, can be used to determine the heights of clouds based on geometric shifts among the nine images. The middle panel shows these stereo-derived cloud top heights superimposed on the natural color image. The clouds of the central core of Typhoon Meranti have heights ranging between 16 and 20 kilometers (10 and 12.5 miles). It takes about seven minutes for all nine cameras to image the same location on the ground, and wind velocity can be calculated from the motion of the clouds over this seven-minute period. The right panel plots these wind velocities as vectors which indicate both direction and speed. The length of the arrow corresponds to the wind speed, which can be compared to the reference 20 meters per second (45 miles per hour) arrow in the key. Hurricanes and typhoons in the Northern Hemisphere rotate counterclockwise due to the Earth's rotation, but these wind vectors mainly show motion outward from the eye at the storm tops. This is due to the fact that hurricanes draw in moist air at low altitudes, which then flows upwards and outwards around the eye reversing direction. These data were acquired during Terra orbit 88865. http://photojournal.jpl.nasa.gov/catalog/PIA17309

The MODIS instrument on NASA's Terra satellite captured Typhoon Neoguri in the Pacific Ocean at 02:05 UTC (10:05 PM EDT) on July 6, 2014. Typhoon Neoguri is expected to reach Okinawa early Tuesday, bringing sustained winds of 198 kilometers (123 miles) per hour and gusts up to 270 kph (168 mph), according to the Japan Meteorological Agency. The storm could be one of the strongest to hit Japan in decades, generating waves up to 14 meters (46 feet) high. Credit: NASA/GSFC/Jeff Schmaltz/MODIS Land Rapid Response <b><a href="http://www.nasa.gov/audience/formedia/features/MP_Photo_Guidelines.html" rel="nofollow">NASA image use policy.</a></b> <b><a href="http://www.nasa.gov/centers/goddard/home/index.html" rel="nofollow">NASA Goddard Space Flight Center</a></b> enables NASA’s mission through four scientific endeavors: Earth Science, Heliophysics, Solar System Exploration, and Astrophysics. Goddard plays a leading role in NASA’s accomplishments by contributing compelling scientific knowledge to advance the Agency’s mission. <b>Follow us on <a href="http://twitter.com/NASAGoddardPix" rel="nofollow">Twitter</a></b> <b>Like us on <a href="http://www.facebook.com/pages/Greenbelt-MD/NASA-Goddard/395013845897?ref=tsd" rel="nofollow">Facebook</a></b> <b>Find us on <a href="http://instagram.com/nasagoddard?vm=grid" rel="nofollow">Instagram</a></b>

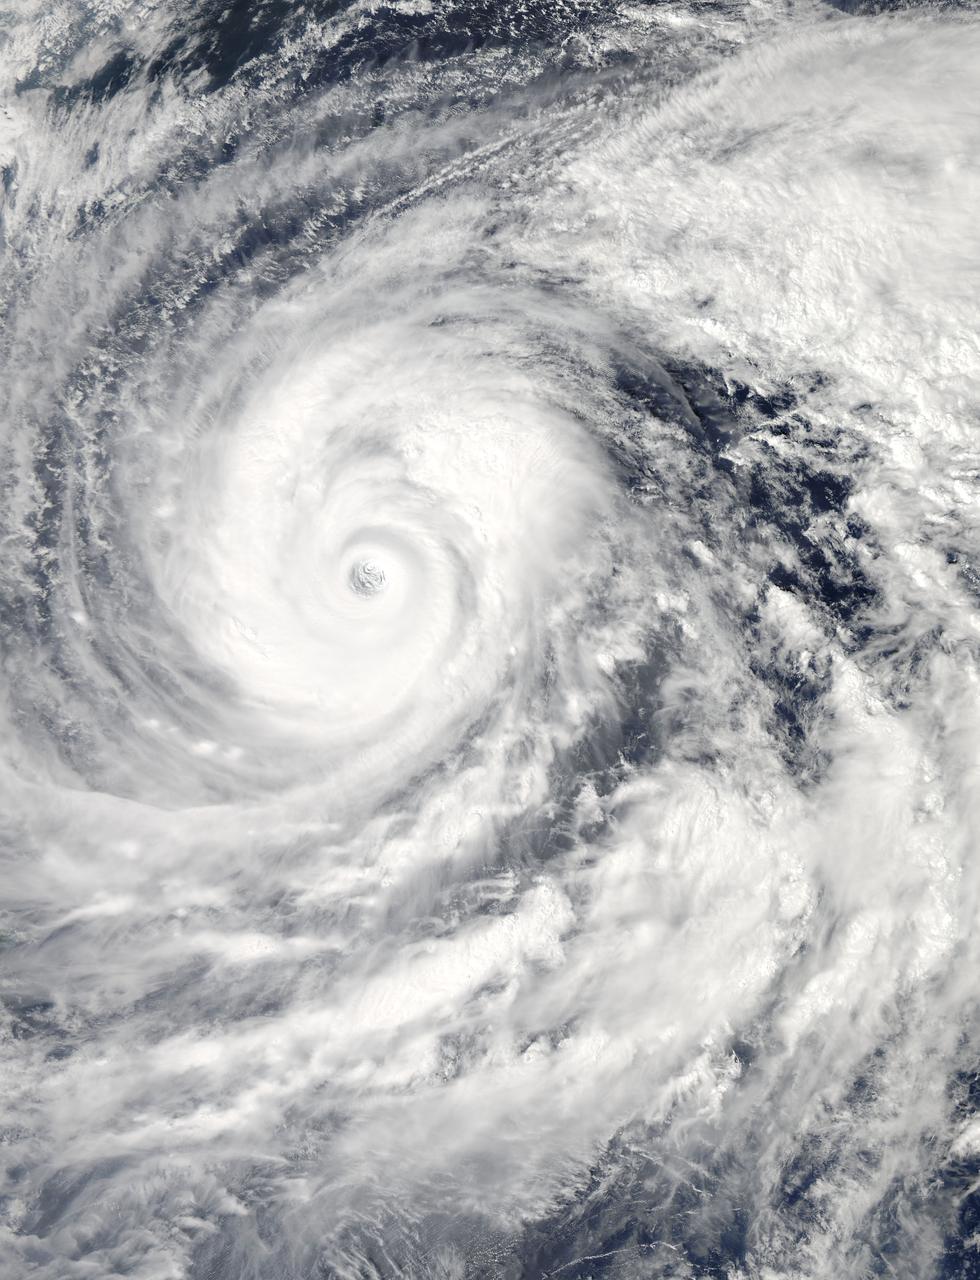
Taken on October 22, 2015 at 0400 UTC by the Suomi NPP satellite's VIIRS sensor, this colorized infrared image shows the extremely large eye of Typhoon Champi. With a diameter of 60 nautical miles, the eye of the storm is larger than the state of Rhode Island. Typhoon Champi is currently 700 nautical miles south of Tokyo, Japan with 110mph sustained winds, and is moving northeast with no threat to land. Credit: NASA/NOAA via <b><a href="www.nnvl.noaa.gov/" rel="nofollow"> NOAA Environmental Visualization Laboratory</a></b> <b><a href="http://www.nasa.gov/audience/formedia/features/MP_Photo_Guidelines.html" rel="nofollow">NASA image use policy.</a></b> <b><a href="http://www.nasa.gov/centers/goddard/home/index.html" rel="nofollow">NASA Goddard Space Flight Center</a></b> enables NASA’s mission through four scientific endeavors: Earth Science, Heliophysics, Solar System Exploration, and Astrophysics. Goddard plays a leading role in NASA’s accomplishments by contributing compelling scientific knowledge to advance the Agency’s mission. <b>Follow us on <a href="http://twitter.com/NASAGoddardPix" rel="nofollow">Twitter</a></b> <b>Like us on <a href="http://www.facebook.com/pages/Greenbelt-MD/NASA-Goddard/395013845897?ref=tsd" rel="nofollow">Facebook</a></b> <b>Find us on <a href="http://instagrid.me/nasagoddard/?vm=grid" rel="nofollow">Instagram</a></b>
NASA's Aqua satellite and RapidScat instrument analyzed Super typhoon Soudelor's extent and winds as it reached Category Five typhoon status on the Saffir-Simpson Wind Scale. On Aug. 4, 2015, at 4:10 UTC (12:10 a.m. EDT) the MODIS instrument aboard NASA's Aqua satellite captured this visible-light image of Super typhoon Soudelor. Read more: <a href="http://www.nasa.gov/feature/goddard/2015/soudelor-northwestern-pacific-ocean" rel="nofollow">www.nasa.gov/feature/goddard/2015/soudelor-northwestern-p...</a> Credits: NASA Goddard's MODIS Rapid Response Team

NASA's Terra satellite captured this image of Typhoon Phanfone and its large eye in the western Pacific Ocean on Friday, Oct. 3 at 1:55 UTC. On Oct. 3 at 0900 UTC (5 a.m. EDT), Typhoon Phanfone's maximum sustained winds were near 110 knots (126.6 mph/203.7 kph). It was centered near 23.6 north longitude and 134.4 east latitude, about 374 nautical miles west-southwest of the island of Iwo To. Phanfone has tracked northwestward at 12 knots (13.8 mph/22.2 kph). Read more: <a href="http://1.usa.gov/1vjS1vs" rel="nofollow">1.usa.gov/1vjS1vs</a> Credit: NASA Goddard MODIS Rapid Response Team <b><a href="http://www.nasa.gov/audience/formedia/features/MP_Photo_Guidelines.html" rel="nofollow">NASA image use policy.</a></b> <b><a href="http://www.nasa.gov/centers/goddard/home/index.html" rel="nofollow">NASA Goddard Space Flight Center</a></b> enables NASA’s mission through four scientific endeavors: Earth Science, Heliophysics, Solar System Exploration, and Astrophysics. Goddard plays a leading role in NASA’s accomplishments by contributing compelling scientific knowledge to advance the Agency’s mission. <b>Follow us on <a href="http://twitter.com/NASAGoddardPix" rel="nofollow">Twitter</a></b> <b>Like us on <a href="http://www.facebook.com/pages/Greenbelt-MD/NASA-Goddard/395013845897?ref=tsd" rel="nofollow">Facebook</a></b> <b>Find us on <a href="http://instagram.com/nasagoddard?vm=grid" rel="nofollow">Instagram</a></b>

NASA's Terra satellite captured this visible image on July 9 at 02:30 UTC (July 8 at 10:30 p.m. EDT) as Typhoon Neoguri was approaching Kyushu, Japan. The visible image revealed that Neoguri's eye had disappeared and the center has become somewhat elongated as the storm weakened into a tropical storm. The Joint Typhoon Warning Center or JTWC noted that an upper level analysis revealed that Neoguri is now in a more harsh environment as northerly vertical wind shear increased to as much as 30 knots. Credit: NASA/GSFC/Jeff Schmaltz/MODIS Land Rapid Response Credit: NASA/GSFC/Jeff Schmaltz/MODIS Land Rapid Response <b><a href="http://www.nasa.gov/audience/formedia/features/MP_Photo_Guidelines.html" rel="nofollow">NASA image use policy.</a></b> <b><a href="http://www.nasa.gov/centers/goddard/home/index.html" rel="nofollow">NASA Goddard Space Flight Center</a></b> enables NASA’s mission through four scientific endeavors: Earth Science, Heliophysics, Solar System Exploration, and Astrophysics. Goddard plays a leading role in NASA’s accomplishments by contributing compelling scientific knowledge to advance the Agency’s mission. <b>Follow us on <a href="http://twitter.com/NASAGoddardPix" rel="nofollow">Twitter</a></b> <b>Like us on <a href="http://www.facebook.com/pages/Greenbelt-MD/NASA-Goddard/395013845897?ref=tsd" rel="nofollow">Facebook</a></b> <b>Find us on <a href="http://instagram.com/nasagoddard?vm=grid" rel="nofollow">Instagram</a></b>

With maximum sustained wind speeds of 140 mph, Super Typhoon Utor made landfall in the Philippines on August 11, 2013 around 18:00z. The storm crossed over the island of Luzon and into the South China Sea. The Joint Typhoon Warning Center predicts Utor will head for the Chinese mainland and make landfall again around 12:00z on the 14th about 200 miles southwest of Hong Kong. This colorized infrared image from the Suomi NPP satellite shows the storm on August 11th at 4:30z. NASA/NOAA <b><a href="http://www.nasa.gov/audience/formedia/features/MP_Photo_Guidelines.html" rel="nofollow">NASA image use policy.</a></b> <b><a href="http://www.nasa.gov/centers/goddard/home/index.html" rel="nofollow">NASA Goddard Space Flight Center</a></b> enables NASA’s mission through four scientific endeavors: Earth Science, Heliophysics, Solar System Exploration, and Astrophysics. Goddard plays a leading role in NASA’s accomplishments by contributing compelling scientific knowledge to advance the Agency’s mission. <b>Follow us on <a href="http://twitter.com/NASA_GoddardPix" rel="nofollow">Twitter</a></b> <b>Like us on <a href="http://www.facebook.com/pages/Greenbelt-MD/NASA-Goddard/395013845897?ref=tsd" rel="nofollow">Facebook</a></b> <b>Find us on <a href="http://instagram.com/nasagoddard?vm=grid" rel="nofollow">Instagram</a></b>

It’s usually the big, sprawling storms that attract the attention of meteorologists, but occasionally tiny storms can make news as well. The most recent example is a suspected mini-typhoon that drifted across the western Pacific Ocean in mid-July 2013. The storm system emerged on July 16 and dissipated by July 19 without making landfall or causing any significant damage. The Moderate Resolution Imaging Spectroradiometer (MODIS) on NASA’s Terra satellite captured this true-color image of the storm on July 17, 2013. It had the spiral shape of a tropical cyclone, but the cloud field was less than 100 kilometers (60 miles) across. For comparison, Super Typhoon Jelawat, the most intense storm of the 2012 season, had a cloud field that stretched nearly 1,000 kilometers (600 miles). Jelawat’s eye alone—with a diameter of 64 kilometers (40 miles)—was two-thirds the size of the entire July 2013 storm. Despite their small size, mini-cyclones are driven by the same forces that drive larger storms. Both small and large cyclonic storms are simply organized convection feeding off warm water in areas with low wind shear. According to the Joint Typhoon Warning Center, the low-pressure areas for these mini-typhoons must span less than two degrees of latitude (about 140 miles) and have sustained winds of 65 knots (74 miles per hour). The 2013 storm in the Pacific certainly meets the first criteria, but it is unlikely that the storm achieved typhoon-force winds. It’s also unlikely that the system had a “warm core,” which all true tropical cyclones have. While this storm did not cause damage, other mini storms certainly have. In 1974, the miniature cyclone Tracy hit Darwin, Australia, killing 71 people and destroying more than 70 percent of the city’s buildings. According to the National Hurricane Center, tropical cyclone Marco unseated Tracy as the smallest tropical cyclone on record in 2008. Marco had gale force winds that extended just 19 kilometers (12 miles). Typhoon Tip, with gale force winds extending 1,000 kilometers (675 miles) is the largest tropical cyclone on record. Credit: NASA/GSFC/Jeff Schmaltz/MODIS Land Rapid Response Team <b><a href="http://www.nasa.gov/audience/formedia/features/MP_Photo_Guidelines.html" rel="nofollow">NASA image use policy.</a></b> <b><a href="http://www.nasa.gov/centers/goddard/home/index.html" rel="nofollow">NASA Goddard Space Flight Center</a></b> enables NASA’s mission through four scientific endeavors: Earth Science, Heliophysics, Solar System Exploration, and Astrophysics. Goddard plays a leading role in NASA’s accomplishments by contributing compelling scientific knowledge to advance the Agency’s mission. <b>Follow us on <a href="http://twitter.com/NASA_GoddardPix" rel="nofollow">Twitter</a></b> <b>Like us on <a href="http://www.facebook.com/pages/Greenbelt-MD/NASA-Goddard/395013845897?ref=tsd" rel="nofollow">Facebook</a></b> <b>Find us on <a href="http://instagrid.me/nasagoddard/?vm=grid" rel="nofollow">Instagram</a></b>
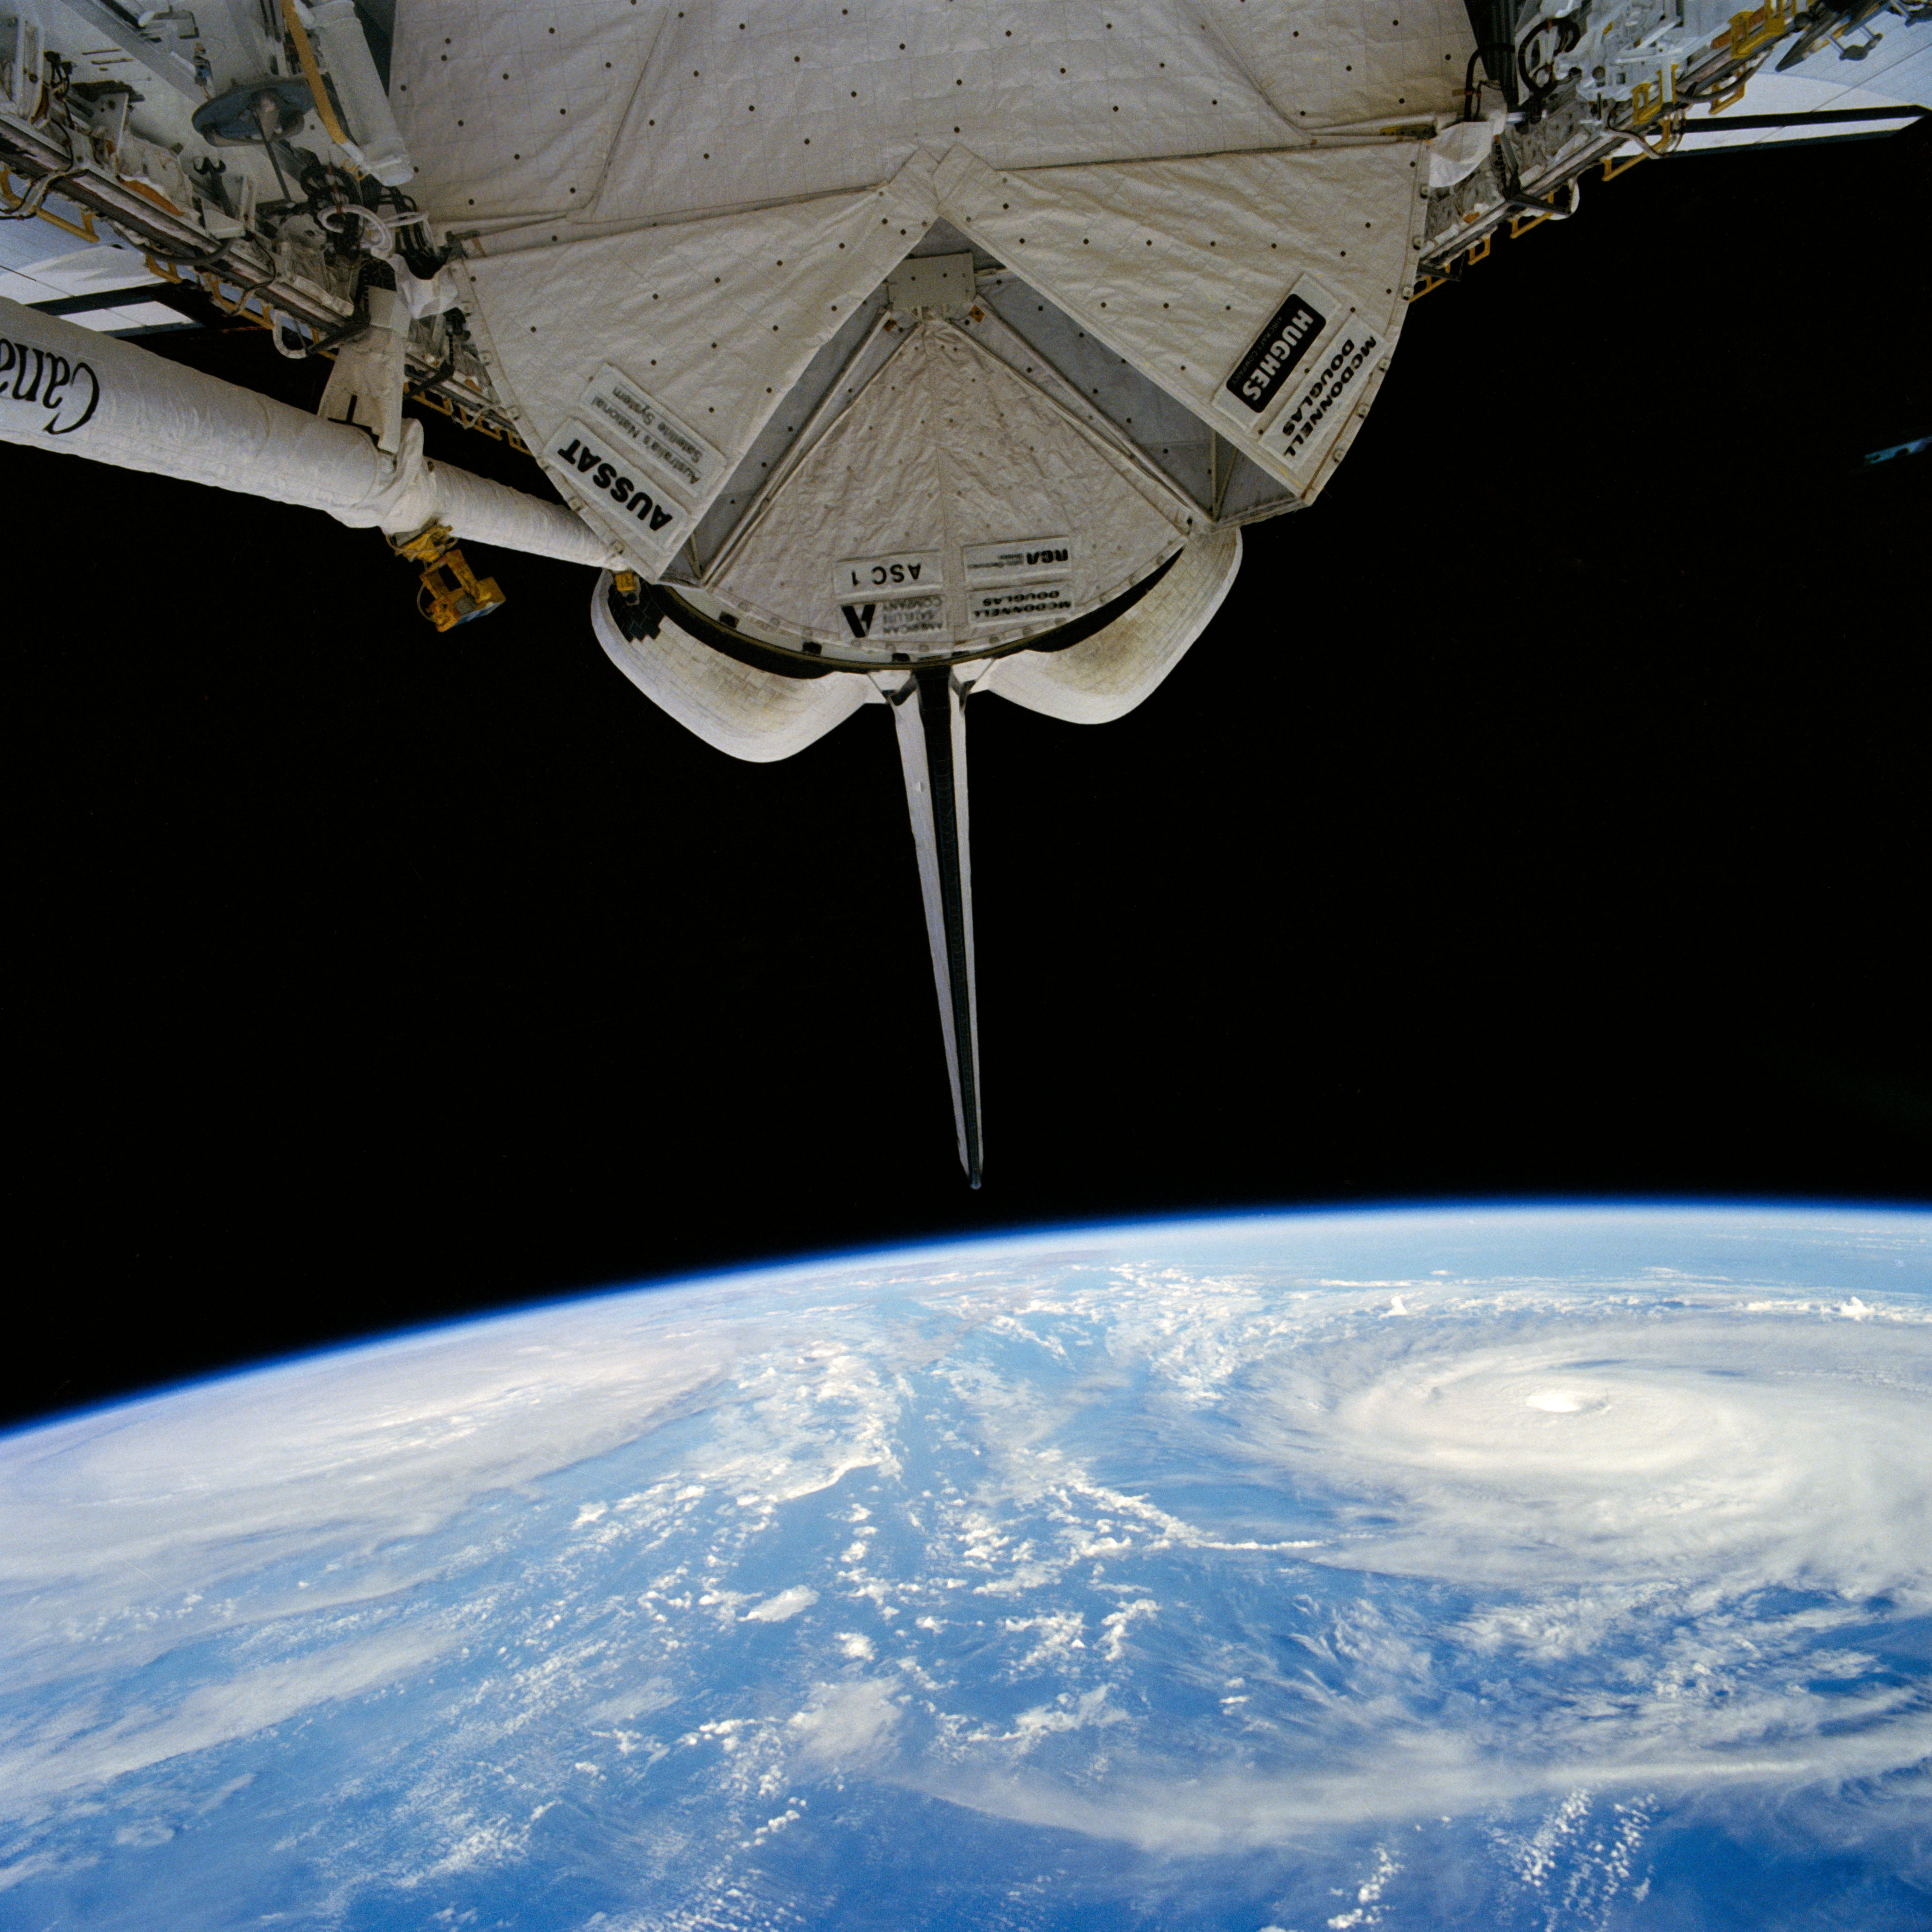
51I-35-078 (30 Aug 1985) --- Typhoons Pat (left) and Odessa in the western Pacific. Of the many tropical cyclones photographed by the STS 51-I crew, the dual typhoons of Pat and Odessa were the most unusual. The twin typhoons constitute a Fujiwara system of connected cyclones first described by the Japanese meteorologist after whom the phenomena has been named. Never before have such paired typhoons been photographed from orbit.
Over the weekend of Oct. 5 and 6, Typhoon Phanfone's center made landfall just south of Tokyo and passed over the city before exiting back into the Northwestern Pacific Ocean. NASA's Aqua satellite captured a picture of the typhoon as Tokyo braced for its large eye. On its way to mainland Japan, Phanfone struck Kadena Air Base on the island of Okinawa. According to the website for U.S. Air Force Kadena Air Base (<a href="http://www.kadena.af.mil" rel="nofollow">www.kadena.af.mil</a>), "One Airman is confirmed deceased and two more are missing after they were washed out to sea from the northwest coast of Okinawa at about 3:45 p.m. Oct. 5. An Airman that was found by the Japanese Coast Guard and pulled from the sea was later pronounced dead at a local hospital. HH-60s from Kadena Air Base and Japanese Coast Guard are continuing to search for the remaining two Airmen. Rough seas are complicating rescue efforts." Typhoon Phanfone's large eye made landfall near the city of Hamamatsu on Oct. 5 around 8 a.m. local time and then tracked north before turning eastward into the Pacific Ocean north of Tokyo. The MODIS instrument known as the Moderate Resolution Imaging Spectroradiometer captures amazing pictures from its orbit aboard NASA's Aqua satellite. MODIS snapped a picture of Typhoon Phanfone approaching Japan on Oct. 5 at 12:55 a.m. EDT. At that time, the Typhoon had already passed north of Okinawa, and was just south of the large island of Kyushu. The MODIS image revealed a large eye with powerful bands of thunderstorms spiraling into the center. On Oct. 6 by 0900 UTC (5 a.m. EDT), Phanfone had weakened from a typhoon to a tropical storm back over open waters of the Northwestern Pacific Ocean. Maximum sustained winds were near 60 knots (69.0 mph/111.1 kph). Phanfone was located near 38.0 north longitude and 145.0 east latitude. That's about 201 nautical miles (271 miles/372 km) south-southeast of Misawa Air Base, Japan. Phanfone was moving to the northeast at 40 knots (46 mph/74 kph). Forecasters at the Joint Typhoon Warning Center (JTWC) using animated multispectral satellite imagery noted that Phanfone is being affected by strong wind shear. The wind shear has stretched the tropical storm out, and pushed the bulk of thunderstorms northeast of the center. In addition, Phanfone has transitioned into an extra-tropical storm, which means that its core transitioned from warm to cold. JTWC called for Phanfone to continue accelerating northeastward and weaken as an extra-tropical cyclone over water. <b><a href="http://www.nasa.gov/audience/formedia/features/MP_Photo_Guidelines.html" rel="nofollow">NASA image use policy.</a></b> <b><a href="http://www.nasa.gov/centers/goddard/home/index.html" rel="nofollow">NASA Goddard Space Flight Center</a></b> enables NASA’s mission through four scientific endeavors: Earth Science, Heliophysics, Solar System Exploration, and Astrophysics. Goddard plays a leading role in NASA’s accomplishments by contributing compelling scientific knowledge to advance the Agency’s mission. <b>Follow us on <a href="http://twitter.com/NASAGoddardPix" rel="nofollow">Twitter</a></b> <b>Like us on <a href="http://www.facebook.com/pages/Greenbelt-MD/NASA-Goddard/395013845897?ref=tsd" rel="nofollow">Facebook</a></b> <b>Find us on <a href="http://instagram.com/nasagoddard?vm=grid" rel="nofollow">Instagram</a></b>
The MODIS instrument aboard NASA's Aqua satellite captured this visible image of Super Typhoon Vongfong on Oct. 9 at 04:25 UTC (12:25 a.m. EDT as it moved north through the Philippine Sea. Credit: NASA Goddard MODIS Rapid Response Team --- Vongfong weakened to a Category 4 typhoon on the Saffir-Simpson scale on Thursday, October 9, with maximum sustained winds near 130 knots (149.6 mph/240.8 kph), down from a Category 5 typhoon on Oct. 8. Forecasters at the Joint Typhoon Warning Center predict slow weakening over the next several days. Vongfong was centered near 20.6 north and 129.5 east, about 384 nautical miles south-southeast of Kadena Air Base, Okinawa, Japan. It is moving to the north-northwest at 7 knots (8 mph/12.9 kph) and generating 44 foot (13.4 meter) high seas. For warnings and watches, visit the Japan Meteorological Agency website at: <a href="http://www.jma.go.jp/en/typh/" rel="nofollow">www.jma.go.jp/en/typh/</a>. Vongfong is forecast to continue moving north through the Philippine Sea and is expected to pass just to the east of Kadena Air Base, then track over Amami Oshima before making landfall in Kyushu and moving over the other three big islands of Japan. Residents of all of these islands should prepare for typhoon conditions beginning on October 10. Read more: <a href="http://1.usa.gov/1s0CCQy" rel="nofollow">1.usa.gov/1s0CCQy</a> <b><a href="http://www.nasa.gov/audience/formedia/features/MP_Photo_Guidelines.html" rel="nofollow">NASA image use policy.</a></b> <b><a href="http://www.nasa.gov/centers/goddard/home/index.html" rel="nofollow">NASA Goddard Space Flight Center</a></b> enables NASA’s mission through four scientific endeavors: Earth Science, Heliophysics, Solar System Exploration, and Astrophysics. Goddard plays a leading role in NASA’s accomplishments by contributing compelling scientific knowledge to advance the Agency’s mission. <b>Follow us on <a href="http://twitter.com/NASAGoddardPix" rel="nofollow">Twitter</a></b> <b>Like us on <a href="http://www.facebook.com/pages/Greenbelt-MD/NASA-Goddard/395013845897?ref=tsd" rel="nofollow">Facebook</a></b> <b>Find us on <a href="http://instagram.com/nasagoddard?vm=grid" rel="nofollow">Instagram</a></b>
NASA image acquired December 3, 2012 As predicted, Typhoon Bopha made landfall on the Philippine island of Mindanao overnight December 3–4, 2012. Known in the Philippines as Pablo, the storm was blamed for 43 deaths and 25 injuries as of December 4, according to the Philippine Daily Inquirer. (To view the high res or to read more go to: <a href="http://1.usa.gov/XnYhVG" rel="nofollow">1.usa.gov/XnYhVG</a>) The Visible Infrared Imaging Radiometer Suite (VIIRS) on the Suomi NPP satellite acquired this image around 1:12 a.m. local time on December 4 (17:12 UTC on December 3). This image is from the VIIRS “day-night band,” which detects light in a range of wavelengths from green to near-infrared and uses filtering techniques to observe signals such as gas flares, auroras, wildfires, city lights, and reflected moonlight. Bopha remained a powerful typhoon as it made landfall on Mindanao, retaining a distinct eye and spiral shape as storm clouds stretched over the eastern part of the island. Unisys Weather reported that Bopha carried super-typhoon strength at the time it was coming ashore. William Straka, associate researcher at the Cooperative Institute for Meteorological Satellite Studies at the University of Wisconsin–Madison, estimated that the storm spanned at least 1,677 kilometers (1,042 miles). Bopha lost some strength after making landfall. On December 4 (late in the evening in the Philippines), the U.S. Navy’s Joint Typhoon Warning Center (JTWC) reported that the storm had maximum sustained winds of 95 knots (175 kilometers per hour) and gusts up to 115 knots (215 kilometers per hour)—still a fierce storm, but weakened since the previous day. The JTWC projected storm track showed Bopha continuing its movement toward the west-northwest, passing over the southern Philippines toward the South China Sea. NASA Earth Observatory image by Jesse Allen, using VIIRS day-night band data from the Suomi National Polar-orbiting Partnership. Suomi NPP is the result of a partnership between NASA, the National Oceanic and Atmospheric Administration, and the Department of Defense. Caption by Michon Scott. Instrument: Suomi NPP - VIIRS Credit: <b><a href="http://www.earthobservatory.nasa.gov/" rel="nofollow"> NASA Earth Observatory</a></b> <b><a href="http://www.nasa.gov/audience/formedia/features/MP_Photo_Guidelines.html" rel="nofollow">NASA image use policy.</a></b> <b><a href="http://www.nasa.gov/centers/goddard/home/index.html" rel="nofollow">NASA Goddard Space Flight Center</a></b> enables NASA’s mission through four scientific endeavors: Earth Science, Heliophysics, Solar System Exploration, and Astrophysics. Goddard plays a leading role in NASA’s accomplishments by contributing compelling scientific knowledge to advance the Agency’s mission. <b>Follow us on <a href="http://twitter.com/NASA_GoddardPix" rel="nofollow">Twitter</a></b> <b>Like us on <a href="http://www.facebook.com/pages/Greenbelt-MD/NASA-Goddard/395013845897?ref=tsd" rel="nofollow">Facebook</a></b> <b>Find us on <a href="http://instagrid.me/nasagoddard/?vm=grid" rel="nofollow">Instagram</a></b>

Typhoon Chan-Hom's eye was visible from space when NASA's Aqua satellite passed overhead early on July 8, 2015. The MODIS instrument, known as the Moderate Resolution Imaging Spectrometer, flies aboard NASA's Aqua satellite. When Aqua passed over Typhoon Chan-Hom on July 8 at 04:25 UTC (12:25 a.m. EDT), MODIS captured a visible-light image of the storm that clearly showed its eye. The MODIS image also a ring of powerful thunderstorms surrounding the eye of the storm, and the bulk of thunderstorms wrapping around the system from west to east, along the southern side. At 0900 UTC (5 a.m. EDT), Typhoon Chan-Hom's maximum sustained winds were near 85 knots (97.8 mph/157.4 kph). Tropical-storm-force winds extended 145 nautical miles (166.9 miles/268.5 km) from the center, making the storm almost 300 nautical miles (345 miles/555 km) in diameter. Typhoon-force winds extended out to 35 nautical miles (40 miles/64.8 km) from the center. Chan-Hom's eye was centered near 20.5 North latitude and 132.7 East longitude, about 450 nautical miles (517.9 miles/833.4 km) southeast of Kadena Air Base, Iwo To, Japan. Chan-Hom was moving to the northwest at 11 knots (12.6 mph/20.3 kph). The typhoon was generating very rough seas with wave heights to 28 feet (8.5 meters). The Joint Typhoon Warning Center expects Chan-Hom to continue tracking northwestward over the next three days under the steering influence of a sub-tropical ridge (elongated area of high pressure). Chan-Hom is expected to intensify steadily peaking at 120 knots (138.1 mph/222.2 kph) on July 10. The JTWC forecast predicts that Chan-Hom will make landfall near Wenzhou, Zhejiang, China and begin decaying due to land interaction. For updated warnings and watches from China's National Meteorological Centre, visit: <a href="http://www.cma.gov.cn/en/WeatherWarnings/" rel="nofollow">www.cma.gov.cn/en/WeatherWarnings/</a>. Credit: NASA/GSFC/Jeff Schmaltz/MODIS Land Rapid Response Team b><a href="http://www.nasa.gov/audience/formedia/features/MP_Photo_Guidelines.html" rel="nofollow">NASA image use policy.</a> <b><a href="http://www.nasa.gov/centers/goddard/home/index.html" rel="nofollow">NASA Goddard Space Flight Center</a></b> enables NASA’s mission through four scientific endeavors: Earth Science, Heliophysics, Solar System Exploration, and Astrophysics. Goddard plays a leading role in NASA’s accomplishments by contributing compelling scientific knowledge to advance the Agency’s mission. <b>Follow us on <a href="http://twitter.com/NASAGoddardPix" rel="nofollow">Twitter</a></b> <b>Like us on <a href="http://www.facebook.com/pages/Greenbelt-MD/NASA-Goddard/395013845897?ref=tsd" rel="nofollow">Facebook</a></b> <b>Find us on <a href="http://instagrid.me/nasagoddard/?vm=grid" rel="nofollow">Instagram</a></b>
Visible image of Typhoon Sepat, western Pacific Ocean, southeast coast of China, August, 2007, from the Atmospheric Infrared Sounder AIRS on NASA Aqua satellite.
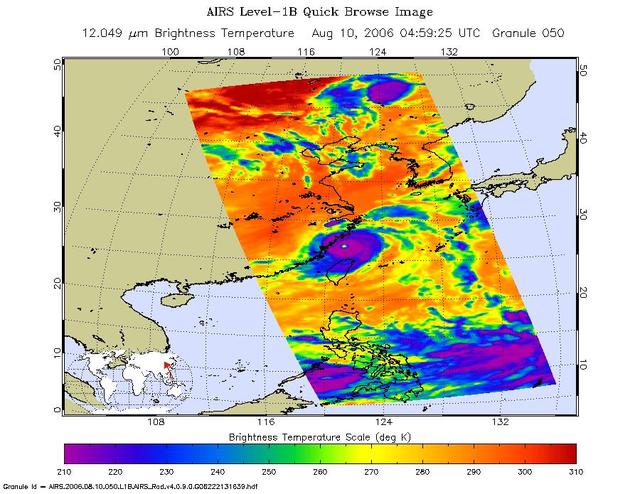
This is an infrared image of Typhoon Saomai from the Atmospheric Infrared Sounder AIRS on NASA Aqua satellite on August 10, 2006.
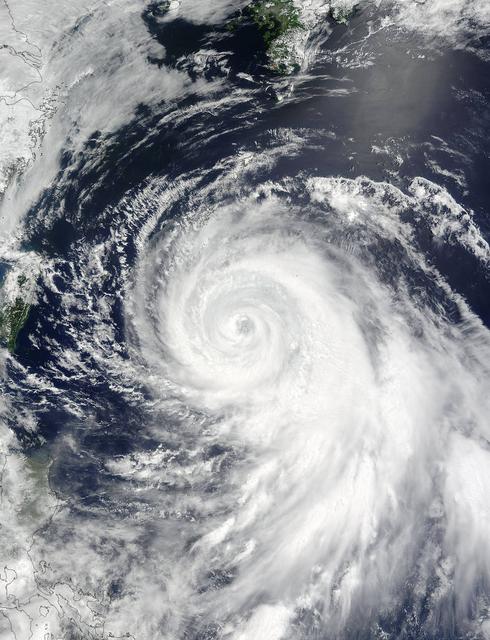
The MODIS instrument aboard NASA's Aqua satellite flew over Typhoon Soudelor on Aug. 7, 2015, at 4:40 UTC (12:40 a.m. EDT) as it was approaching Taiwan. Credits: NASA Goddard's MODIS Rapid Response Team Clouds in Typhoon Soudelor's western quadrant were already spreading over Taiwan early on August 7 when NASA's Aqua satellite passed overhead. Soudelor is expected to make landfall and cross central Taiwan today and make a second landfall in eastern China. NASA satellite imagery revealed that Soudelor's eye "opened" five more miles since August 4. On Aug. 7 at 4:40 UTC (12:40 a.m. EDT) the Moderate Resolution Imaging Spectroradiometer or MODIS instrument aboard NASA's Aqua satellite captured a visible-light image of Typhoon Soudelor as its western quadrant began brushing eastern Taiwan. The MODIS image showed Soudelor's 17-nautical-mile-wide eye and thick bands of powerful thunderstorms surrounded the storm and spiraled into the center. Just three days before, the eye was 5 nautical miles smaller when the storm was more intense. On Aug. 4 at 4:10 UTC (12:10 a.m. EDT) Aqua's MODIS image showed the eye was 12-nautical-mile-wide eye. At 1500 UTC (11 a.m. EDT) on August 7, 2015, the Joint Typhoon Warning Center (JTWC) noted that Typhoon Soudelor's maximum sustained winds increased from 90 knots (103.6 mph/166.7 kph) to 105 knots (120.8 mph / 194.5 kph). It was centered near 23.1 North latitude and 123.2 East longitude, about 183 nautical miles (210.6 miles/338.9 km) southeast of Taipei, Taiwan. It was moving to the west-northwest at 10 knots (11.5 mph/18.5 kph). For warnings and watches for Taiwan, visit the Central Weather Bureau website: <a href="http://www.cwb.gov.tw/eng/" rel="nofollow">www.cwb.gov.tw/eng/</a>. For warnings in China, visit the China Meteorological Administration website: <a href="http://www.cma.gov.cn/en" rel="nofollow">www.cma.gov.cn/en</a>. Soudelor's final landfall is expected in eastern China on Saturday, August 8. Clouds in Typhoon Soudelor's western quadrant were already spreading over Taiwan early on August 7 when NASA's Aqua satellite passed overhead. Soudelor is expected to make landfall and cross central Taiwan today and make a second landfall in eastern China. NASA satellite imagery revealed that Soudelor's eye "opened" five more miles since August 4. On Aug. 7 at 4:40 UTC (12:40 a.m. EDT) the Moderate Resolution Imaging Spectroradiometer or MODIS instrument aboard NASA's Aqua satellite captured a visible-light image of Typhoon Soudelor as its western quadrant began brushing eastern Taiwan. The MODIS image showed Soudelor's 17-nautical-mile-wide eye and thick bands of powerful thunderstorms surrounded the storm and spiraled into the center. Just three days before, the eye was 5 nautical miles smaller when the storm was more intense. On Aug. 4 at 4:10 UTC (12:10 a.m. EDT) Aqua's MODIS image showed the eye was 12-nautical-mile-wide eye. At 1500 UTC (11 a.m. EDT) on August 7, 2015, the Joint Typhoon Warning Center (JTWC) noted that Typhoon Soudelor's maximum sustained winds increased from 90 knots (103.6 mph/166.7 kph) to 105 knots (120.8 mph / 194.5 kph). It was centered near 23.1 North latitude and 123.2 East longitude, about 183 nautical miles (210.6 miles/338.9 km) southeast of Taipei, Taiwan. It was moving to the west-northwest at 10 knots (11.5 mph/18.5 kph). For warnings and watches for Taiwan, visit the Central Weather Bureau website: <a href="http://www.cwb.gov.tw/eng/" rel="nofollow">www.cwb.gov.tw/eng/</a>. For warnings in China, visit the China Meteorological Administration website: <a href="http://www.cma.gov.cn/en" rel="nofollow">www.cma.gov.cn/en</a>. Soudelor's final landfall is expected in eastern China on Saturday, August 8.

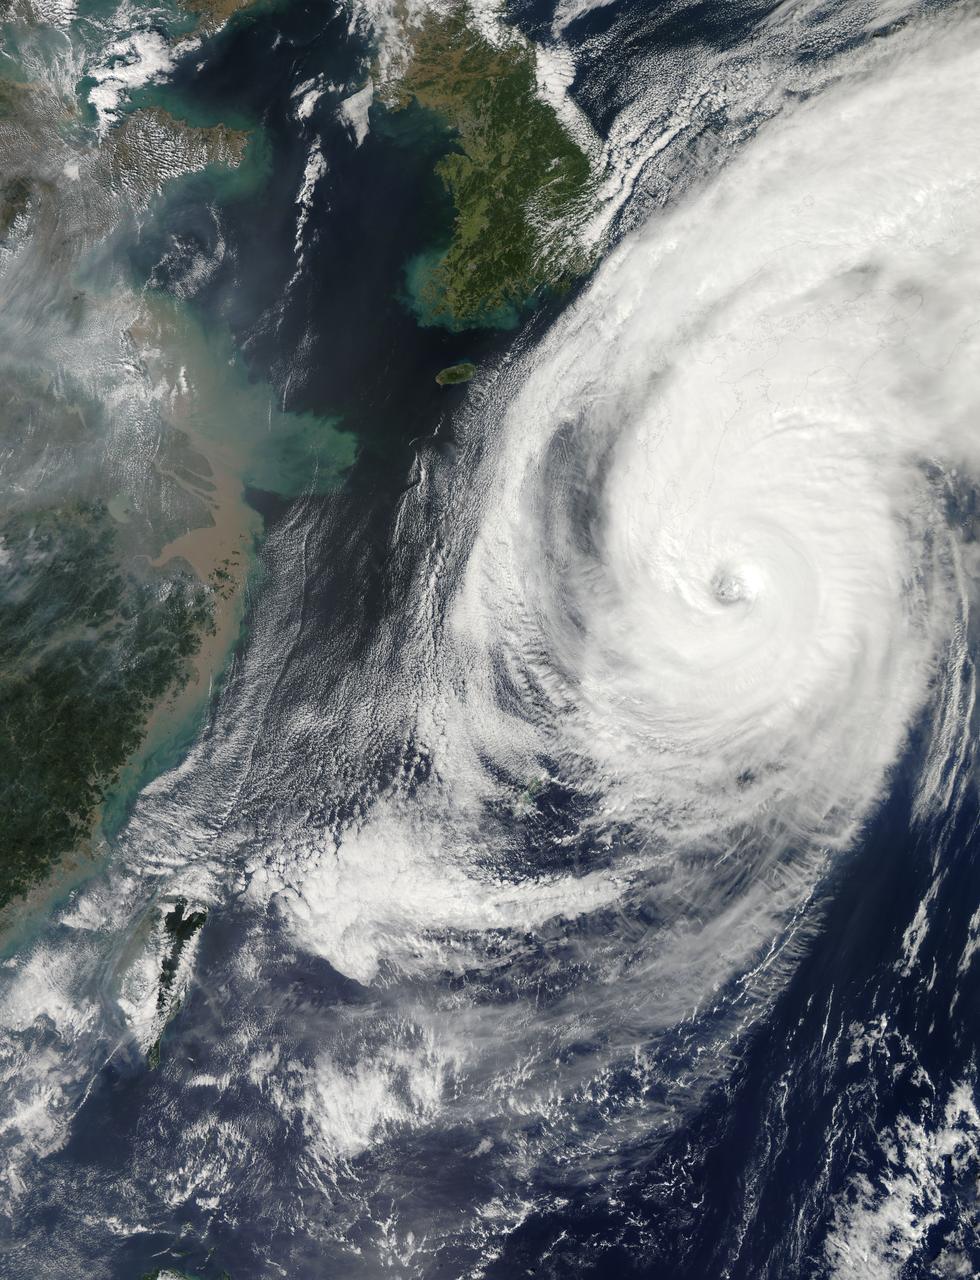
The MODIS instrument on NASA's Aqua satellite captured Typhoon Neoguri in the East China Sea at 05:00 UTC (1:00 AM EDT) on July 8, 2014. Typhoon Neoguri hit Japan’s Okinawa islands on Tuesday local time (July 8, 2014), bringing high winds, huge waves and storm surges. Neoguri packed sustained winds of 175 kilometers (108 miles) per hour with some gusts up to 250 kph (154 mph), according to the Japan Meteorological Agency. Credit: NASA/GSFC/Jeff Schmaltz/MODIS Land Rapid Response <b><a href="http://www.nasa.gov/audience/formedia/features/MP_Photo_Guidelines.html" rel="nofollow">NASA image use policy.</a></b> <b><a href="http://www.nasa.gov/centers/goddard/home/index.html" rel="nofollow">NASA Goddard Space Flight Center</a></b> enables NASA’s mission through four scientific endeavors: Earth Science, Heliophysics, Solar System Exploration, and Astrophysics. Goddard plays a leading role in NASA’s accomplishments by contributing compelling scientific knowledge to advance the Agency’s mission. <b>Follow us on <a href="http://twitter.com/NASAGoddardPix" rel="nofollow">Twitter</a></b> <b>Like us on <a href="http://www.facebook.com/pages/Greenbelt-MD/NASA-Goddard/395013845897?ref=tsd" rel="nofollow">Facebook</a></b> <b>Find us on <a href="http://instagram.com/nasagoddard?vm=grid" rel="nofollow">Instagram</a></b>
51I-35-075 (30 Aug 1985) --- Typhoon Pat was photographed on the morning of August 30th at a position of approximately 25 degrees N, 131 degrees E. Stereoscopically-overlapping photographs taken by the 51I crew provide much more detail of the three-dimensional structure of tropical cyclones than can be determined from data returned from meteorological satellites. The 51I shuttle mission was launched on August 27 and landed September 3. The mission was flown in the space shuttle orbiter Discovery.
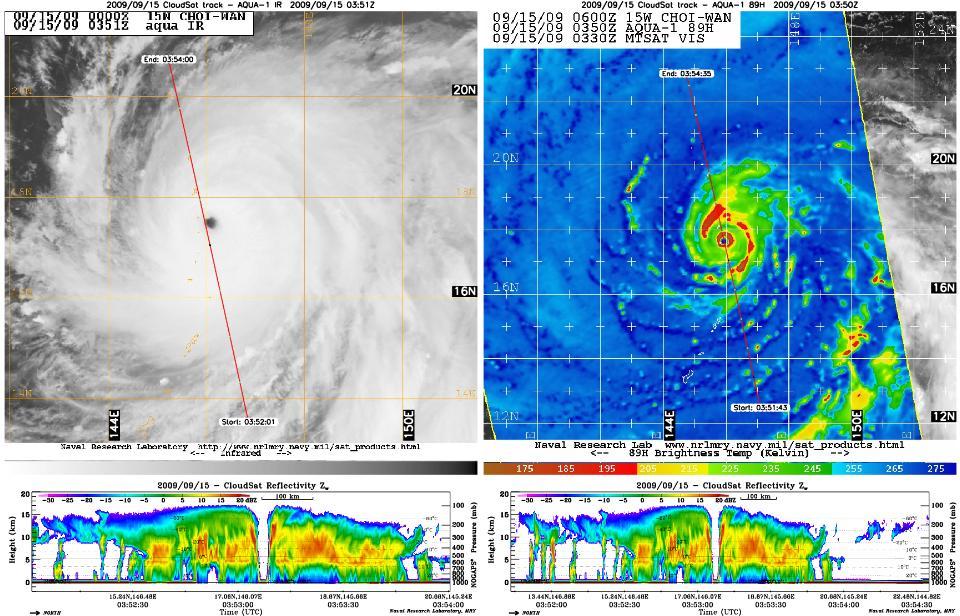
NASA CloudSat satellite captured an eye overpass of Super Typhoon Choi-Wan in the Western Pacific on September 15, 2009 at 0352Z.
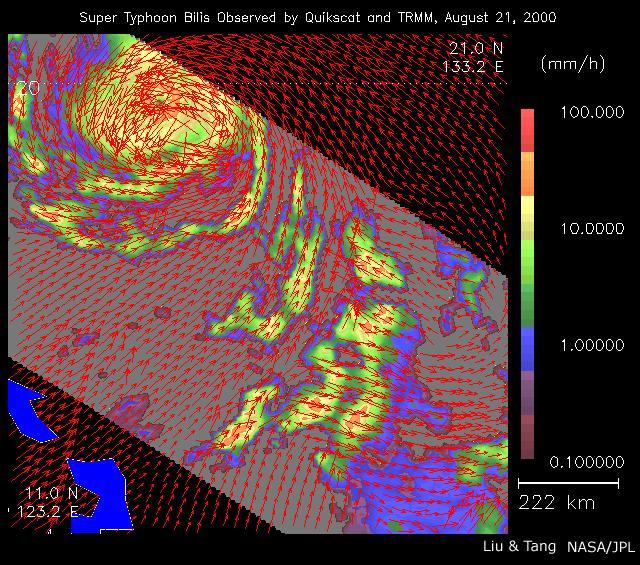
As super Typhoon Bilis, equal in strength to a category 5 hurricane, bore down on Taiwan, these images from August 21, 2000, show the massive storm most devastating components: rain and wind.
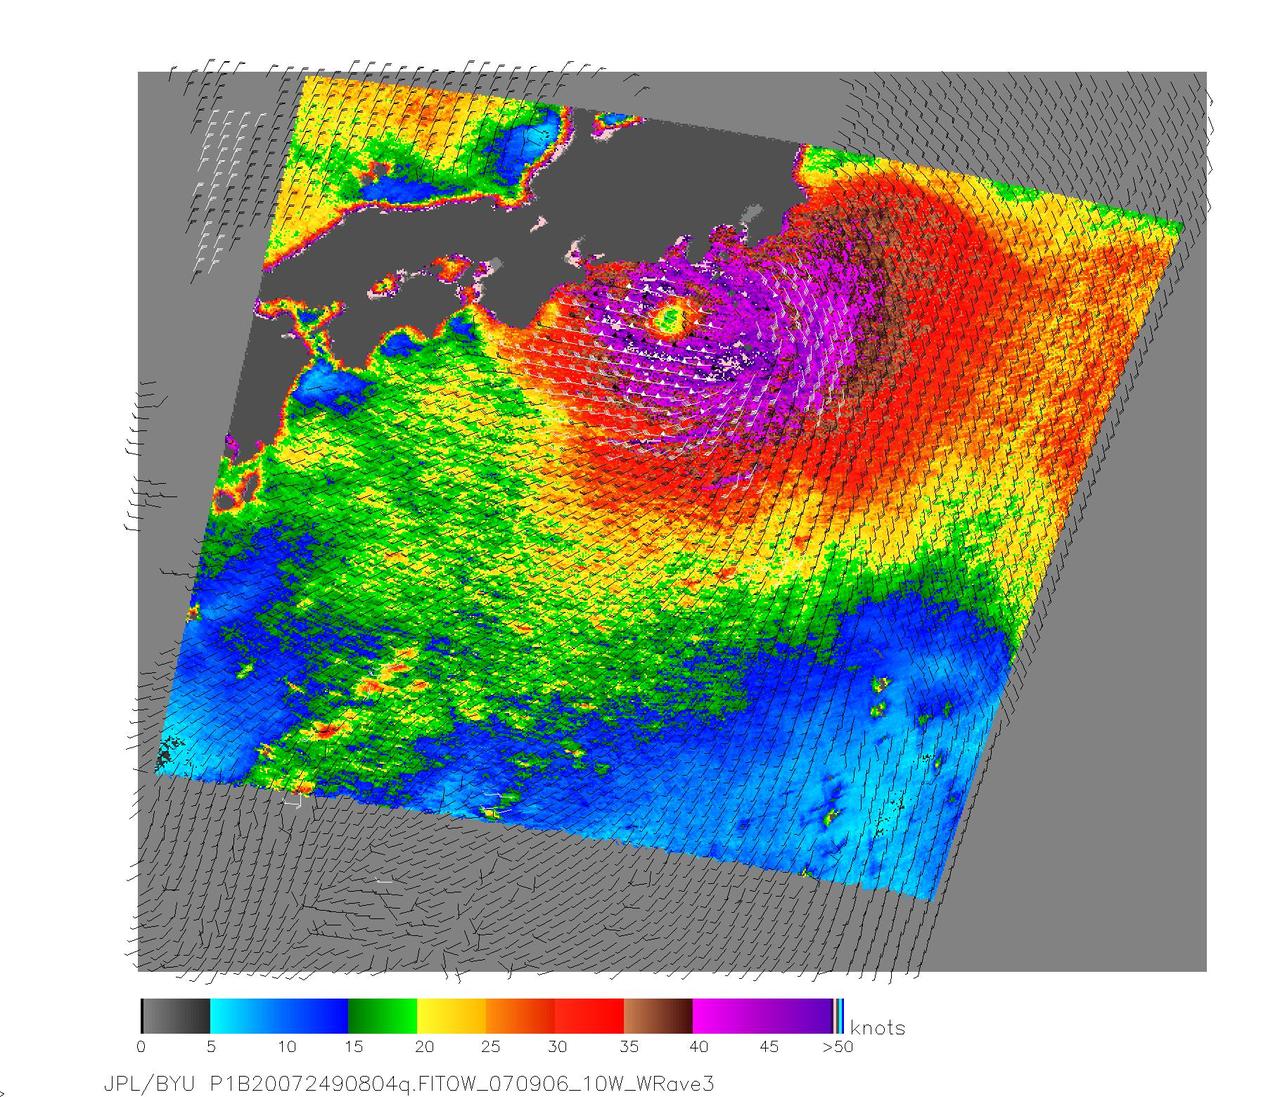
This image, produced from data collected by the SeaWinds scatterometer instrument onboard NASA QuikScat mission reveals the details of the surface winds and rain in Typhoon Nanmadol as it moves westward.
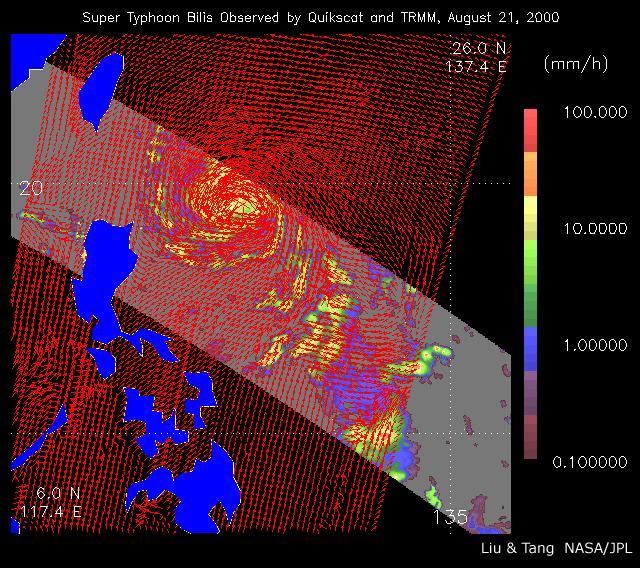
As super Typhoon Bilis, equal in strength to a category 5 hurricane, bore down on Taiwan, these images from August 21, 2000, show the massive storm most devastating components: rain and wind.
One of the more destructive cyclones to emerge from the northern hemisphere 2002 summer storm season was Typhoon Sinlaku. This image from NASA Terra satellite was acquired on September 5, 2002.
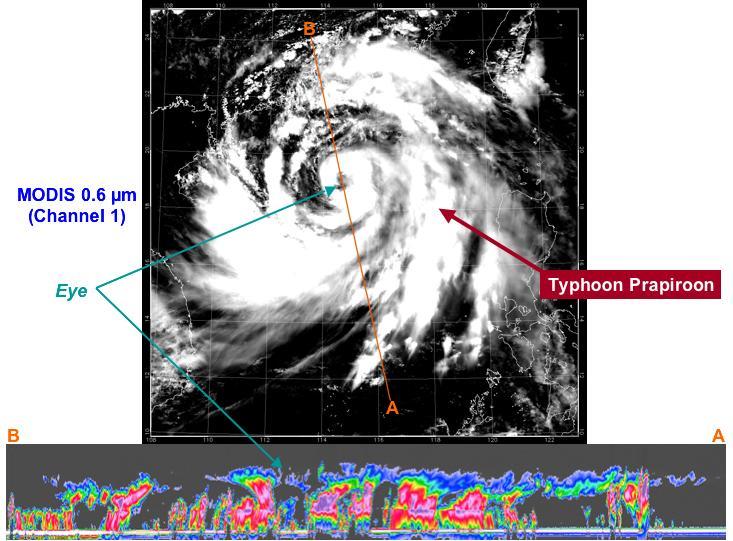
At approximately 0553 UTC 1:53 am EDT, on 2 Aug 2006, NASA CloudSat flew over the eye of Typhoon Prapiroon as it approached southern China.

Typhoon Kilo continues to thrive in the Northwestern Pacific and imagery from NASA's Terra satellite late on September 7 showed that the storm still maintained a clear eye. The MODIS or Moderate Resolution Imaging Spectroradiometer instrument that flies aboard Terra provided a visible-light image of Kilo on September 7 at 23:50 UTC (7:50 p.m. EDT). The image showed thick bands of thunderstorms wrapping around the eastern and northern quadrants of the visible eye. At 0900 UTC (5 a.m. EDT) on September 9, Typhoon Kilo had maximum sustained winds near 65 knots (74.8 mph/120.4 kph). Kilo is expected to strengthen to 75 knots (86.3 mph/ 138.9 kph) later in the day before weakening. It was centered near 26.8 North latitude and 158.5 East longitude, about 289 nautical miles northeast of Minami Tori Shima, Japan. Kilo was moving to the west-northwest at 18 knots (20.7 mph/33.3 kph). The Joint Typhoon Warning Center noted that Kilo is expected to take more of a northerly track by September 10. Thereafter, Kilo is expected to become extra-tropical and curve to the northeast near the Kuril Islands in Russia's Sakhalin Oblast region. The islands form an 808 mile (1,300 kilometer) volcanic archipelago that stretches northeast from Hokkaido, Japan, to Kamchatka, Russia. For updated watches and warnings from the Japan Meteorological Agency, visit: <a href="http://www.jma.go.jp/en/warn/" rel="nofollow">www.jma.go.jp/en/warn/</a> <b><a href="http://www.nasa.gov/audience/formedia/features/MP_Photo_Guidelines.html" rel="nofollow">NASA image use policy.</a></b> <b><a href="http://www.nasa.gov/centers/goddard/home/index.html" rel="nofollow">NASA Goddard Space Flight Center</a></b> enables NASA’s mission through four scientific endeavors: Earth Science, Heliophysics, Solar System Exploration, and Astrophysics. Goddard plays a leading role in NASA’s accomplishments by contributing compelling scientific knowledge to advance the Agency’s mission. <b>Follow us on <a href="http://twitter.com/NASAGoddardPix" rel="nofollow">Twitter</a></b> <b>Like us on <a href="http://www.facebook.com/pages/Greenbelt-MD/NASA-Goddard/395013845897?ref=tsd" rel="nofollow">Facebook</a></b> <b>Find us on <a href="http://instagrid.me/nasagoddard/?vm=grid" rel="nofollow">Instagram</a></b>
STS073-E-5313 (3 Nov. 1995) --- Typhoon Angela packed winds of 115 knots when this shot was taken with an Electronic Still Camera (ESC) from the Earth-orbiting space shuttle Columbia. It subsequently increased to speeds of 155 nautical miles, making it a super typhoon, heading due west toward Luzon in the Philippines.

In this MODIS image from NASA's Aqua satellite, the eye of Typhoon Soudelor is seen over northwestern Taiwan on August 8, 2015 at 05:25 UTC (1:25 a.m. EDT). At that time, Soudelor had maximum sustained winds near 90 knots. It was less than 100 miles southwest of Taipei, Taiwan. Typhoon-force winds were felt up to 35 miles from the center, covering a 70 mile-wide diameter. Image credit: NASA Goddard MODIS Rapid Response Team/Jeff Schmaltz..<b><a href="http://www.nasa.gov/audience/formedia/features/MP_Photo_Guidelines.html" rel="nofollow">NASA image use policy.</a></b> <b><a href="http://www.nasa.gov/centers/goddard/home/index.html" rel="nofollow">NASA Goddard Space Flight Center</a></b> enables NASA’s mission through four scientific endeavors: Earth Science, Heliophysics, Solar System Exploration, and Astrophysics. Goddard plays a leading role in NASA’s accomplishments by contributing compelling scientific knowledge to advance the Agency’s mission. <b>Follow us on <a href="http://twitter.com/NASAGoddardPix" rel="nofollow">Twitter</a></b> <b>Like us on <a href="http://www.facebook.com/pages/Greenbelt-MD/NASA-Goddard/395013845897?ref=tsd" rel="nofollow">Facebook</a></b> <b>Find us on <a href="http://instagrid.me/nasagoddard/?vm=grid" rel="nofollow">Instagram</a></b>

On Saturday, Sept. 21, TRMM captured rainfall data on Typhoon Usagi as it passed between the northern Philippines and southern Taiwan. TRMM found rain falling at a rate of over 134 mm/hr (~5.2 inches) in USAGI's eye wall. Credit: SSAI/NASA, Hal Pierce <b><a href="http://www.nasa.gov/audience/formedia/features/MP_Photo_Guidelines.html" rel="nofollow">NASA image use policy.</a></b> <b><a href="http://www.nasa.gov/centers/goddard/home/index.html" rel="nofollow">NASA Goddard Space Flight Center</a></b> enables NASA’s mission through four scientific endeavors: Earth Science, Heliophysics, Solar System Exploration, and Astrophysics. Goddard plays a leading role in NASA’s accomplishments by contributing compelling scientific knowledge to advance the Agency’s mission. <b>Follow us on <a href="http://twitter.com/NASA_GoddardPix" rel="nofollow">Twitter</a></b> <b>Like us on <a href="http://www.facebook.com/pages/Greenbelt-MD/NASA-Goddard/395013845897?ref=tsd" rel="nofollow">Facebook</a></b> <b>Find us on <a href="http://instagram.com/nasagoddard?vm=grid" rel="nofollow">Instagram</a></b>
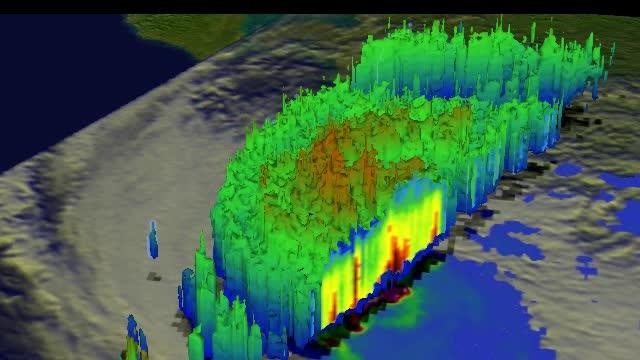
This simulated 3-D flyby animation over Typhoon Usagi on Sept. 22 at 0923 UT showed heavy rain south of the center a rate of over 169mm/~6.7 inches per hour along China's coast. Cloud heights of some thunderstorms were reaching only about 12 km /7.4 miles. Credit: SSAI/NASA, Hal Pierce <b><a href="http://www.nasa.gov/audience/formedia/features/MP_Photo_Guidelines.html" rel="nofollow">NASA image use policy.</a></b> <b><a href="http://www.nasa.gov/centers/goddard/home/index.html" rel="nofollow">NASA Goddard Space Flight Center</a></b> enables NASA’s mission through four scientific endeavors: Earth Science, Heliophysics, Solar System Exploration, and Astrophysics. Goddard plays a leading role in NASA’s accomplishments by contributing compelling scientific knowledge to advance the Agency’s mission. <b>Follow us on <a href="http://twitter.com/NASA_GoddardPix" rel="nofollow">Twitter</a></b> <b>Like us on <a href="http://www.facebook.com/pages/Greenbelt-MD/NASA-Goddard/395013845897?ref=tsd" rel="nofollow">Facebook</a></b> <b>Find us on <a href="http://instagram.com/nasagoddard?vm=grid" rel="nofollow">Instagram</a></b>
The Moderate Resolution Imaging Spectroradiometer or MODIS instrument that flies aboard NASA's Terra satellite captured this image of Typhoon Usagi on Sept. 22 at 02:45 UTC/Sept. 21 at 10:45 p.m. EDT on its approach to a landfall in China. Credit: NASA Goddard MODIS Rapid Response Team <b><a href="http://www.nasa.gov/audience/formedia/features/MP_Photo_Guidelines.html" rel="nofollow">NASA image use policy.</a></b> <b><a href="http://www.nasa.gov/centers/goddard/home/index.html" rel="nofollow">NASA Goddard Space Flight Center</a></b> enables NASA’s mission through four scientific endeavors: Earth Science, Heliophysics, Solar System Exploration, and Astrophysics. Goddard plays a leading role in NASA’s accomplishments by contributing compelling scientific knowledge to advance the Agency’s mission. <b>Follow us on <a href="http://twitter.com/NASA_GoddardPix" rel="nofollow">Twitter</a></b> <b>Like us on <a href="http://www.facebook.com/pages/Greenbelt-MD/NASA-Goddard/395013845897?ref=tsd" rel="nofollow">Facebook</a></b> <b>Find us on <a href="http://instagram.com/nasagoddard?vm=grid" rel="nofollow">Instagram</a></b>

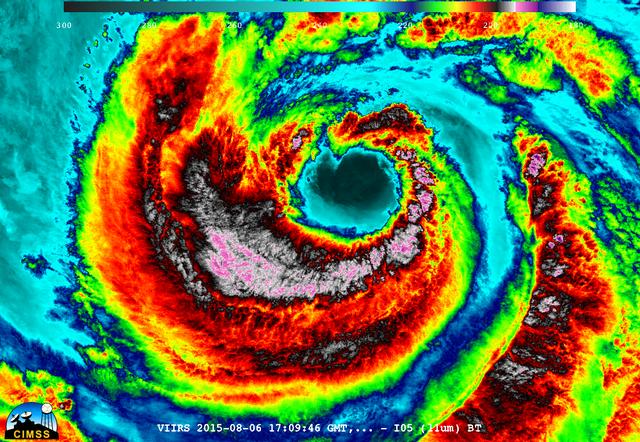
On August 6, 2015, NASA-NOAA's Suomi NPP satellite passed over powerful Typhoon Soudelor when it was headed toward Taiwan. The Visible Infrared Imaging Radiometer Suite (VIIRS) instrument aboard NASA-NOAA's Suomi satellite captured an infrared image of the typhoon. The infrared image that showed there were some thunderstorms within the typhoon with very cold cloud top temperatures, colder than -63F/-53C. Temperatures that cold stretch high into the troposphere and are capable of generating heavy rain. Credit: UWM/CIMSS/SSEC, William Straka III <b><a href="http://www.nasa.gov/audience/formedia/features/MP_Photo_Guidelines.html" rel="nofollow">NASA image use policy.</a></b> <b><a href="http://www.nasa.gov/centers/goddard/home/index.html" rel="nofollow">NASA Goddard Space Flight Center</a></b> enables NASA’s mission through four scientific endeavors: Earth Science, Heliophysics, Solar System Exploration, and Astrophysics. Goddard plays a leading role in NASA’s accomplishments by contributing compelling scientific knowledge to advance the Agency’s mission. <b>Follow us on <a href="http://twitter.com/NASAGoddardPix" rel="nofollow">Twitter</a></b> <b>Like us on <a href="http://www.facebook.com/pages/Greenbelt-MD/NASA-Goddard/395013845897?ref=tsd" rel="nofollow">Facebook</a></b> <b>Find us on <a href="http://instagrid.me/nasagoddard/?vm=grid" rel="nofollow">Instagram</a></b>
On August 6, 2015, NASA-NOAA's Suomi NPP satellite passed over powerful Typhoon Soudelor when it was headed toward Taiwan. The Visible Infrared Imaging Radiometer Suite (VIIRS) instrument aboard NASA-NOAA's Suomi satellite captured this night-time infrared close-up image of Soudelor's eye. The infrared image that showed there were some thunderstorms within the typhoon with very cold cloud top temperatures, colder than -63F/-53C. Temperatures that cold stretch high into the troposphere and are capable of generating heavy rain. At 1500 UTC (11 a.m. EDT) on August 6, 2015, Typhoon Soudelor had maximum sustained winds near 90 knots (103.6 mph/166.7 kph). It was centered near 21.3 North latitude and 127.5 East longitude, about 324 nautical miles (372.9 miles/600 km) south of Kadena Air Base, Okinawa, Japan. It was moving to the west at 10 knots (11.5 mph/18.5 kph). Credit: UWM/CIMSS/SSEC, William Straka III <b><a href="http://www.nasa.gov/audience/formedia/features/MP_Photo_Guidelines.html" rel="nofollow">NASA image use policy.</a></b> <b><a href="http://www.nasa.gov/centers/goddard/home/index.html" rel="nofollow">NASA Goddard Space Flight Center</a></b> enables NASA’s mission through four scientific endeavors: Earth Science, Heliophysics, Solar System Exploration, and Astrophysics. Goddard plays a leading role in NASA’s accomplishments by contributing compelling scientific knowledge to advance the Agency’s mission. <b>Follow us on <a href="http://twitter.com/NASAGoddardPix" rel="nofollow">Twitter</a></b> <b>Like us on <a href="http://www.facebook.com/pages/Greenbelt-MD/NASA-Goddard/395013845897?ref=tsd" rel="nofollow">Facebook</a></b> <b>Find us on <a href="http://instagrid.me/nasagoddard/?vm=grid" rel="nofollow">Instagram</a></b>

Satellite images obtained from NASA Atmospheric Infrared Sounder AIRS instrument aboard NASA Aqua spacecraft provide a glimpse into one of the most powerful storms ever recorded on Earth, Typhoon Haiyan.

On August 9 at 03:00 UTC (Aug. 8 at 11 p.m. EDT) the MODIS instrument aboard NASA's Terra satellite passed over the remnant clouds of Typhoon Soudelor when it was over eastern China. By 22:35 UTC (6:35 p.m. EDT) on August 8, 2015, Typhoon Soudelor had made landfall in eastern China and was rapidly dissipating. Maximum sustained winds had dropped to 45 knots (51.7 mph/83.3 kph) after landfall, making it a tropical storm. Image credit: NASA Goddard MODIS Rapid Response Team/Jeff Schmaltz..<b><a href="http://www.nasa.gov/audience/formedia/features/MP_Photo_Guidelines.html" rel="nofollow">NASA image use policy.</a></b> <b><a href="http://www.nasa.gov/centers/goddard/home/index.html" rel="nofollow">NASA Goddard Space Flight Center</a></b> enables NASA’s mission through four scientific endeavors: Earth Science, Heliophysics, Solar System Exploration, and Astrophysics. Goddard plays a leading role in NASA’s accomplishments by contributing compelling scientific knowledge to advance the Agency’s mission. <b>Follow us on <a href="http://twitter.com/NASAGoddardPix" rel="nofollow">Twitter</a></b> <b>Like us on <a href="http://www.facebook.com/pages/Greenbelt-MD/NASA-Goddard/395013845897?ref=tsd" rel="nofollow">Facebook</a></b> <b>Find us on <a href="http://instagrid.me/nasagoddard/?vm=grid" rel="nofollow">Instagram</a></b>
On July 9 at 02:05 UTC (July 8 at 10:05 p.m. EDT) the MODIS instrument aboard NASA's Terra satellite captured an image of Typhoon Chan-Hom east of Taiwan. The image clearly showed an eye with powerful bands of thunderstorms spiraling into the center of circulation. At 1500 UTC (11 a.m. EDT) on July 9, Typhoon Chan-Hom's maximum sustained winds were near 100 knots (115.1 mph/185.2 kph) and the storm continued to strengthen. Chan-Hom was centered near 24.2 North latitude and 127.6 East longitude, about 138 nautical miles (158.8 miles/255.6 km) southwest of Kadena Air Force Base, Iwo to, and has tracked westward at 13 knots (15 mph/24 kph). Read more: <a href="http://go.nasa.gov/1LYNdr0" rel="nofollow">go.nasa.gov/1LYNdr0</a> <b><a href="http://go.nasa.gov/1LYNZV6" rel="nofollow">NASA image use policy.</a></b> <b><a href="http://go.nasa.gov/1LYNXMW" rel="nofollow">NASA Goddard Space Flight Center</a></b> enables NASA’s mission through four scientific endeavors: Earth Science, Heliophysics, Solar System Exploration, and Astrophysics. Goddard plays a leading role in NASA’s accomplishments by contributing compelling scientific knowledge to advance the Agency’s mission. <b>Follow us on <a href="http://go.nasa.gov/1LYNZV9" rel="nofollow">Twitter</a></b> <b>Like us on <a href="http://go.nasa.gov/1LYNXN0" rel="nofollow">Facebook</a></b> <b>Find us on <a href="http://go.nasa.gov/1LYNZVc" rel="nofollow">Instagram</a></b>

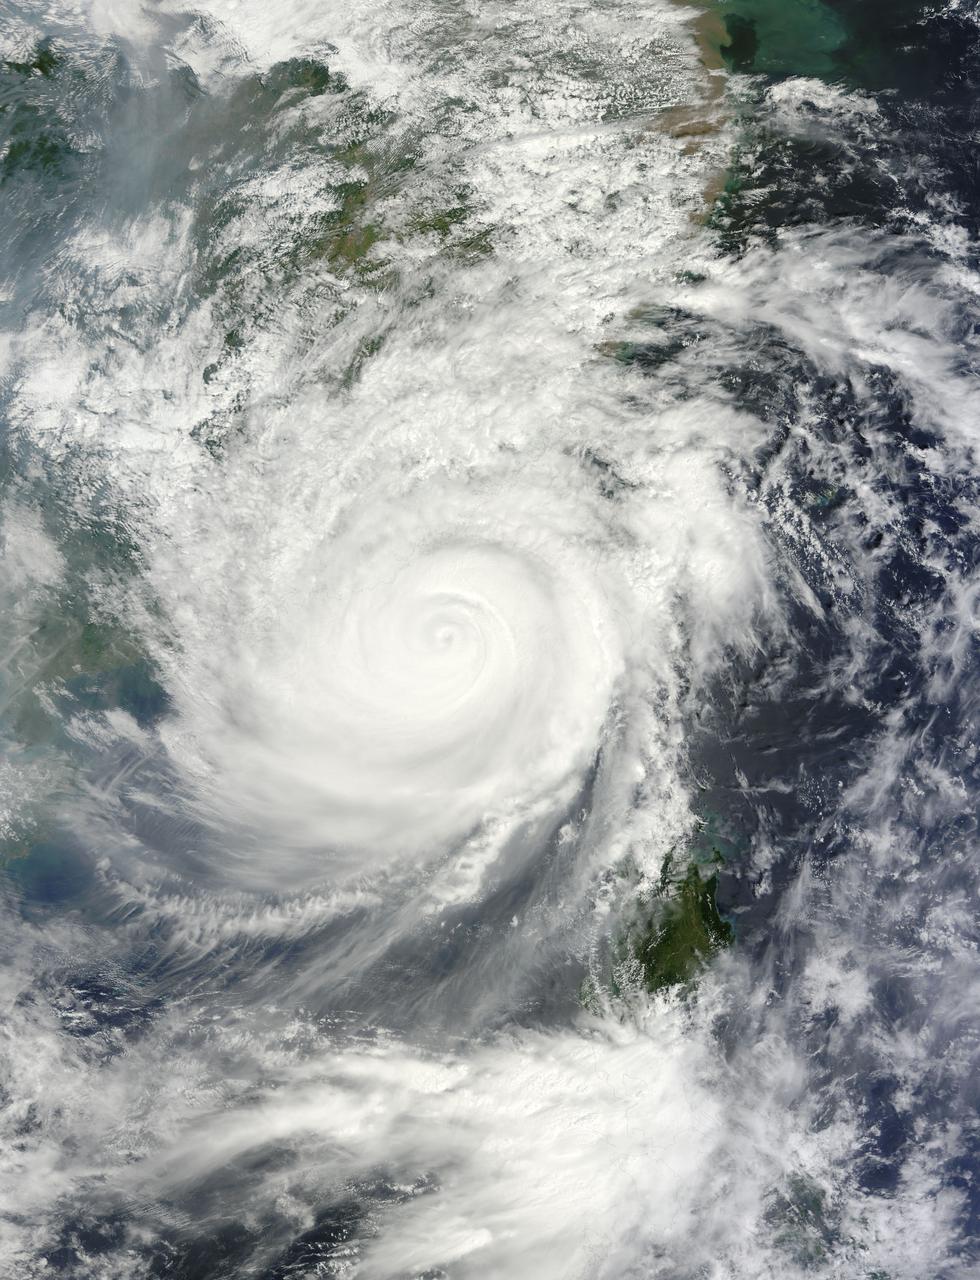
NASA satellite imagery from July 10 revealed a very clear and cloudless eye in the Northwestern Pacific’s Typhoon Soulik as it moves toward a landfall in China by the end of the week. The Moderate Resolution Imaging Spectroradiometer (MODIS) instrument aboard NASA’s Terra satellite captured a visible image of Typhoon Soulik and its clear eye on July 10, 2013 at 2:10 UTC as it continues to move through the northwestern Pacific Ocean. Soulik’s round eye is about 25 nautical miles (28.7 miles/46.3 km) wide. Typhoon Soulik’s maximum sustained winds have increased dramatically over the last 24 hours and at 1500 UTC (11 a.m. EDT) on July 10, were blowing at 120 knots (138 mph/222 kph). According to the Joint Typhoon Warning Center, Soulik’s powerful winds are creating seas over 40 feet (12.2 meters) high in the northwestern Pacific Ocean. Soulik’s center was near 21.9 north latitude and 132.9 east longitude, about 420 nautical miles (483.3 miles/777.7 km) southeast of Kadena Air Base, Japan. Soulik is moving to the west-northwest at 13 knots (15 mph/24 kph). Soulik is tracking west-northwest along the southern edge of a subtropical ridge (elongated area) of high pressure. The ridge of high pressure stretches from east to west and westward over the Ryukyu Islands and into the East China Sea along about 30 north latitude. Soulik is still expected to make a landfall in southeastern China on July 12 or 13 after passing north of Taiwan. Text credit: Rob Gutro More info about the storm: <a href="http://1.usa.gov/12mvQcC" rel="nofollow">1.usa.gov/12mvQcC</a> <b><a href="http://www.nasa.gov/audience/formedia/features/MP_Photo_Guidelines.html" rel="nofollow">NASA image use policy.</a></b> <b><a href="http://www.nasa.gov/centers/goddard/home/index.html" rel="nofollow">NASA Goddard Space Flight Center</a></b> enables NASA’s mission through four scientific endeavors: Earth Science, Heliophysics, Solar System Exploration, and Astrophysics. Goddard plays a leading role in NASA’s accomplishments by contributing compelling scientific knowledge to advance the Agency’s mission. <b>Follow us on <a href="http://twitter.com/NASA_GoddardPix" rel="nofollow">Twitter</a></b> <b>Like us on <a href="http://www.facebook.com/pages/Greenbelt-MD/NASA-Goddard/395013845897?ref=tsd" rel="nofollow">Facebook</a></b> <b>Find us on <a href="http://instagram.com/nasagoddard?vm=grid" rel="nofollow">Instagram</a></b>

NASA CloudSat satellite completed a stunning eye overpass of Typhoon Dolphin in the western Pacific Ocean on May 16, 2015, at 0407 UTC.

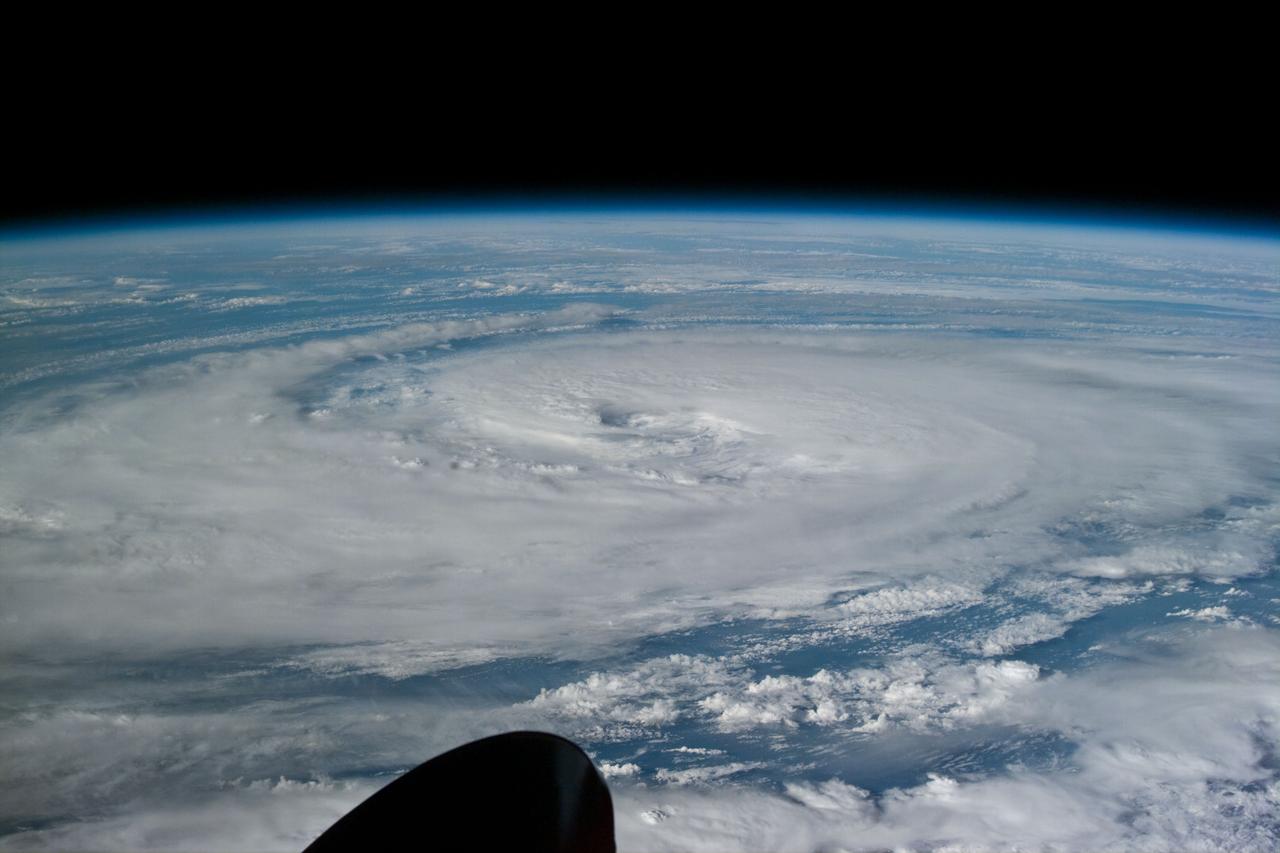
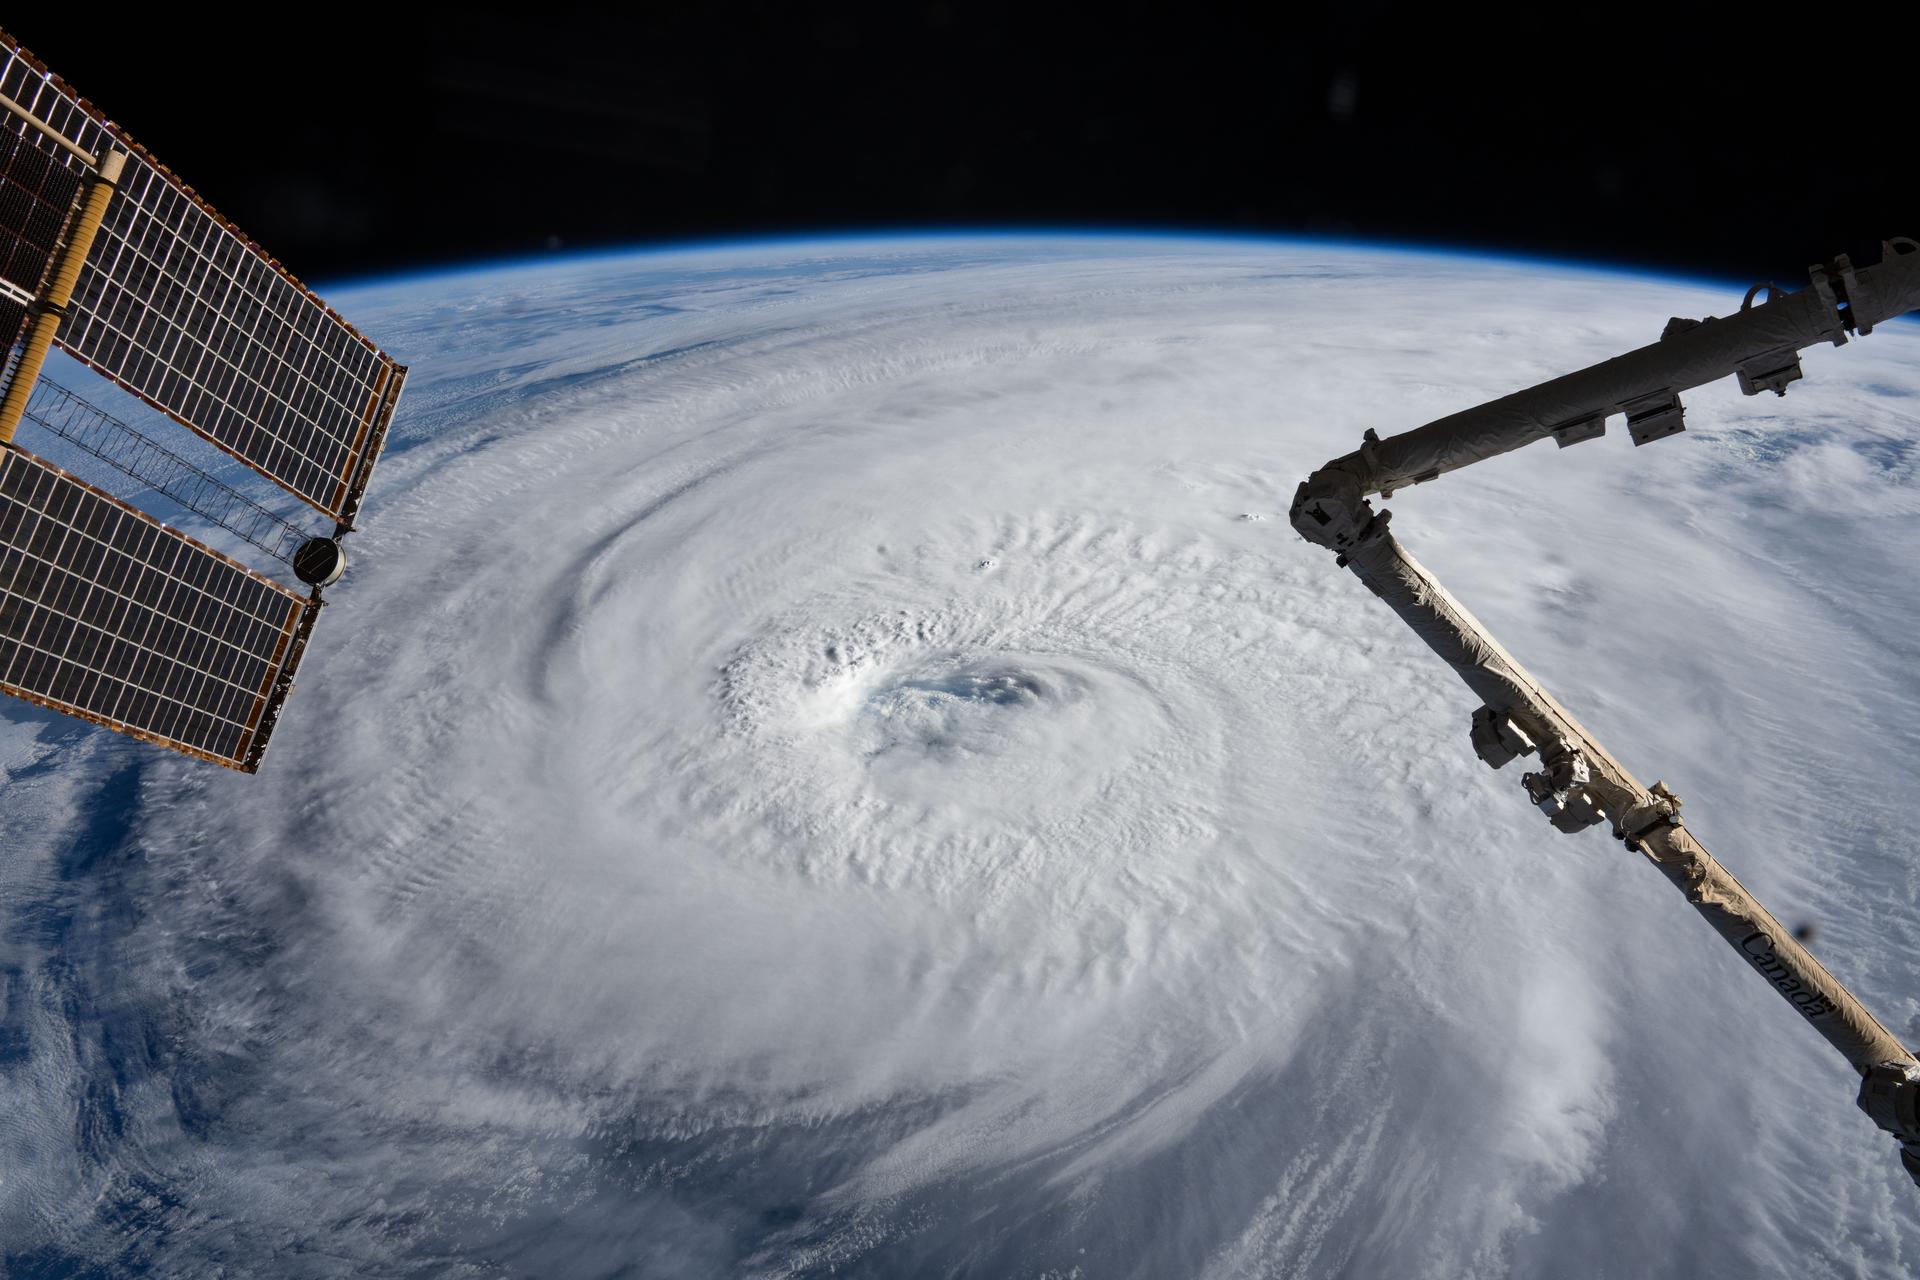
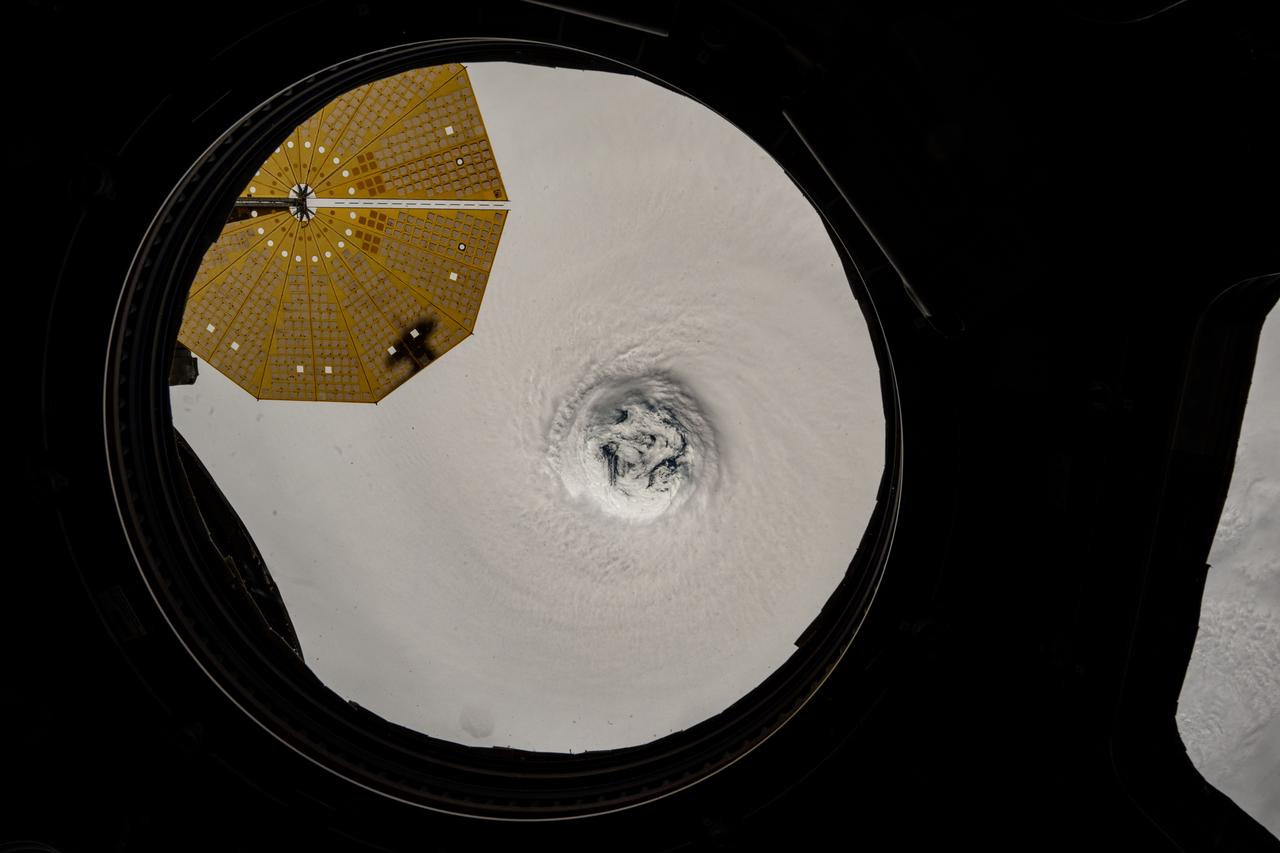
ISS043E078169 (03/31/2015) --- This close up of the huge Typhoon Maysak "eye" of the category 5 (hurricane status on the Saffir-Simpson Wind Scale) was captured by astronauts on board the International Space Station Mar. 31, 2015. The massive Typhoon is headed toward the Philippines and expected to land on the upcoming Easter weekend. The Tropical Rainfall Measuring Mission (TRMM) and Global Precipitation Measurement (GPM) satellites, both co-managed by NASA and the Japan Aerospace Exploration Agency, captured rainfall and cloud data that revealed very heavy rainfall and high thunderstorms in the still strengthening storm.
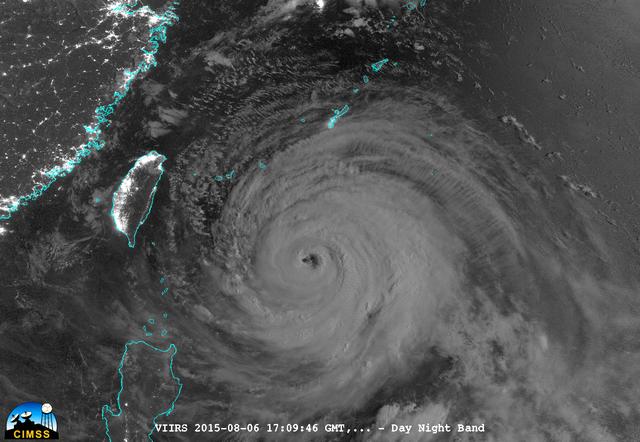
On August 6, 2015, NASA-NOAA's Suomi NPP satellite passed over powerful Typhoon Soudelor at night when it was headed toward Taiwan. The Visible Infrared Imaging Radiometer Suite (VIIRS) instrument aboard NASA-NOAA's Suomi satellite captured this night-time infrared image of the storm. At 1500 UTC (11 a.m. EDT) on August 6, 2015, Typhoon Soudelor had maximum sustained winds near 90 knots (103.6 mph/166.7 kph). It was centered near 21.3 North latitude and 127.5 East longitude, about 324 nautical miles (372.9 miles/600 km) south of Kadena Air Base, Okinawa, Japan. It was moving to the west at 10 knots (11.5 mph/18.5 kph). Taiwan is located west (left) of the powerful typhoon in this image. Credit: UWM/CIMSS/SSEC, William Straka III <b><a href="http://www.nasa.gov/audience/formedia/features/MP_Photo_Guidelines.html" rel="nofollow">NASA image use policy.</a></b> <b><a href="http://www.nasa.gov/centers/goddard/home/index.html" rel="nofollow">NASA Goddard Space Flight Center</a></b> enables NASA’s mission through four scientific endeavors: Earth Science, Heliophysics, Solar System Exploration, and Astrophysics. Goddard plays a leading role in NASA’s accomplishments by contributing compelling scientific knowledge to advance the Agency’s mission. <b>Follow us on <a href="http://twitter.com/NASAGoddardPix" rel="nofollow">Twitter</a></b> <b>Like us on <a href="http://www.facebook.com/pages/Greenbelt-MD/NASA-Goddard/395013845897?ref=tsd" rel="nofollow">Facebook</a></b> <b>Find us on <a href="http://instagrid.me/nasagoddard/?vm=grid" rel="nofollow">Instagram</a></b>
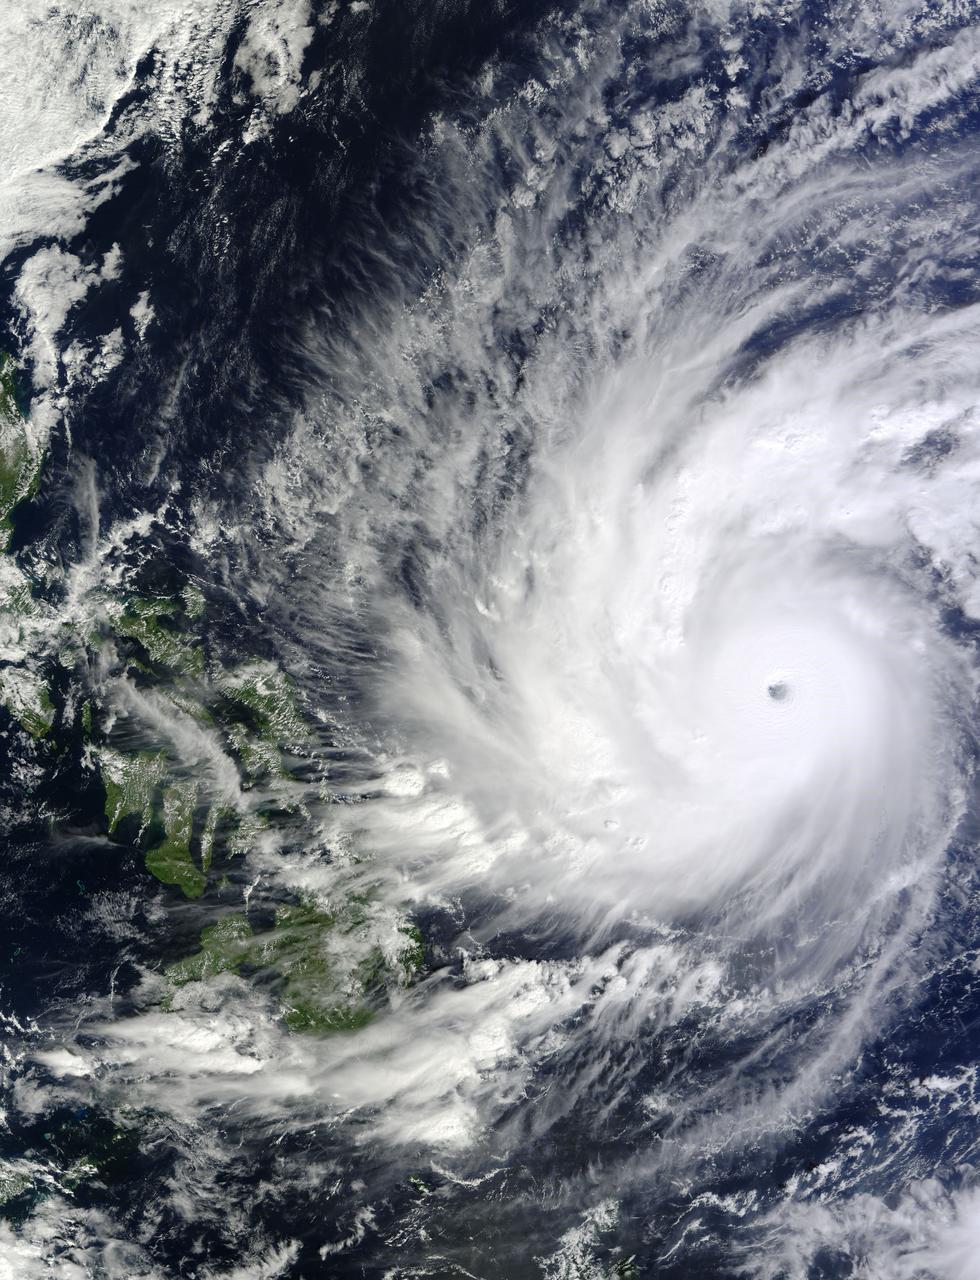
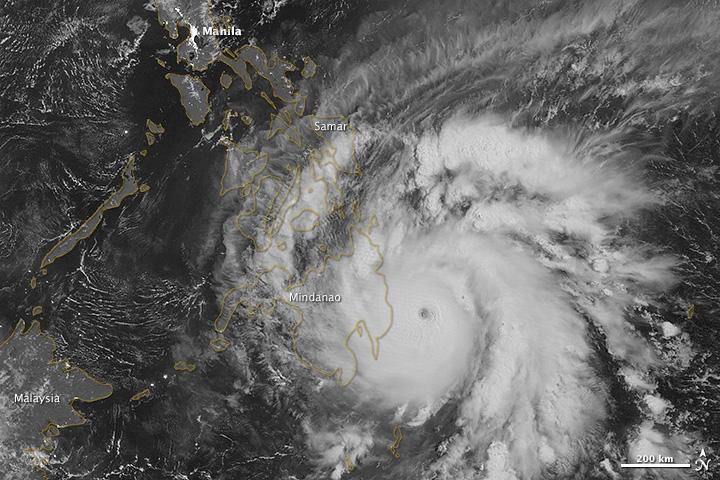
On Dec. 4 at 02:10 UTC, the MODIS instrument aboard NASA's Terra satellite took this visible image of Super Typhoon Hagupit approaching the Philippines. Image Credit: NASA Goddard's MODIS Rapid Response Team Read more: <a href="http://1.usa.gov/12q3ssK" rel="nofollow">1.usa.gov/12q3ssK</a> <b><a href="http://www.nasa.gov/audience/formedia/features/MP_Photo_Guidelines.html" rel="nofollow">NASA image use policy.</a></b> <b><a href="http://www.nasa.gov/centers/goddard/home/index.html" rel="nofollow">NASA Goddard Space Flight Center</a></b> enables NASA’s mission through four scientific endeavors: Earth Science, Heliophysics, Solar System Exploration, and Astrophysics. Goddard plays a leading role in NASA’s accomplishments by contributing compelling scientific knowledge to advance the Agency’s mission. <b>Follow us on <a href="http://twitter.com/NASAGoddardPix" rel="nofollow">Twitter</a></b> <b>Like us on <a href="http://www.facebook.com/pages/Greenbelt-MD/NASA-Goddard/395013845897?ref=tsd" rel="nofollow">Facebook</a></b> <b>Find us on <a href="http://instagram.com/nasagoddard?vm=grid" rel="nofollow">Instagram</a></b>

Typhoon Haitang is shown here churning steadily towards Taiwan and China. This image shows the storm swirling wind patterns as observed by NASA QuikScat satellite on July 14, 2005, at 19:19 UTC 14:19 Eastern Daylight Time.
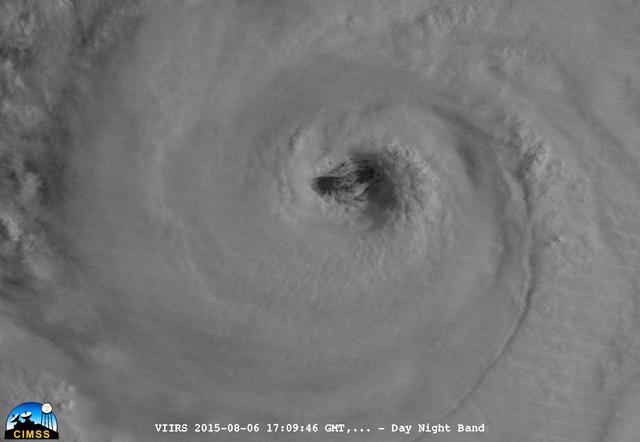
On August 6, 2015, NASA-NOAA's Suomi NPP satellite passed over powerful Typhoon Soudelor when it was headed toward Taiwan. The Visible Infrared Imaging Radiometer Suite (VIIRS) instrument aboard NASA-NOAA's Suomi satellite captured this night-time infrared close-up image of Soudelor's eye. At 1500 UTC (11 a.m. EDT) on August 6, 2015, Typhoon Soudelor had maximum sustained winds near 90 knots (103.6 mph/166.7 kph). It was centered near 21.3 North latitude and 127.5 East longitude, about 324 nautical miles (372.9 miles/600 km) south of Kadena Air Base, Okinawa, Japan. It was moving to the west at 10 knots (11.5 mph/18.5 kph). Credit: UWM/CIMSS/SSEC, William Straka III <b><a href="http://www.nasa.gov/audience/formedia/features/MP_Photo_Guidelines.html" rel="nofollow">NASA image use policy.</a></b> <b><a href="http://www.nasa.gov/centers/goddard/home/index.html" rel="nofollow">NASA Goddard Space Flight Center</a></b> enables NASA’s mission through four scientific endeavors: Earth Science, Heliophysics, Solar System Exploration, and Astrophysics. Goddard plays a leading role in NASA’s accomplishments by contributing compelling scientific knowledge to advance the Agency’s mission. <b>Follow us on <a href="http://twitter.com/NASAGoddardPix" rel="nofollow">Twitter</a></b> <b>Like us on <a href="http://www.facebook.com/pages/Greenbelt-MD/NASA-Goddard/395013845897?ref=tsd" rel="nofollow">Facebook</a></b> <b>Find us on <a href="http://instagrid.me/nasagoddard/?vm=grid" rel="nofollow">Instagram</a></b>
On Nov. 10 at 03:30 UTC/Nov. 9 at 10:30 p.m. EDT, the MODIS instrument aboard NASA's Terra satellite showed the center of Typhoon Haiyan just south of Hainan Island, China in the South China Sea. Credit: NASA Goddard MODIS Rapid Response Team <b><a href="http://www.nasa.gov/audience/formedia/features/MP_Photo_Guidelines.html" rel="nofollow">NASA image use policy.</a></b> <b><a href="http://www.nasa.gov/centers/goddard/home/index.html" rel="nofollow">NASA Goddard Space Flight Center</a></b> enables NASA’s mission through four scientific endeavors: Earth Science, Heliophysics, Solar System Exploration, and Astrophysics. Goddard plays a leading role in NASA’s accomplishments by contributing compelling scientific knowledge to advance the Agency’s mission. <b>Follow us on <a href="http://twitter.com/NASA_GoddardPix" rel="nofollow">Twitter</a></b> <b>Like us on <a href="http://www.facebook.com/pages/Greenbelt-MD/NASA-Goddard/395013845897?ref=tsd" rel="nofollow">Facebook</a></b> <b>Find us on <a href="http://instagrid.me/nasagoddard/?vm=grid" rel="nofollow">Instagram</a></b>

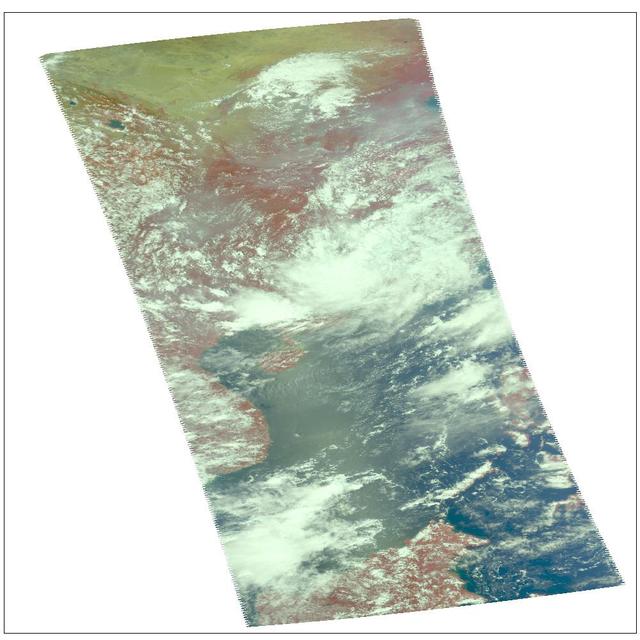
NASA's Atmospheric Infrared Sounder (AIRS) instrument aboard the Aqua satellite captured imagery of Typhoon Hinnamnor in the West Pacific Ocean just before 2 p.m. local time on Sept. 5, 2022. Typhoon Hinnamnor was one of the strongest in South Korea's recorded history, dropping some 40 inches (102 centimeters) of rain and unleashing record winds. In this infrared AIRS image, the typhoon is moving northward over the Korean Peninsula (center), with the coast of China to the west and the southernmost Japanese islands to the east. The large purple area indicates very cold clouds at about minus 90 degrees Fahrenheit (minus 67 degrees Celsius), carried high into the atmosphere by deep thunderstorms. These storm clouds are associated with very heavy rainfall. The extensive areas of red away from the storm indicate temperatures of around 80 F (26 C), typical of Earth's daytime surface during late summer. These red areas are mostly cloud-free, with the clear air caused by air motion outward from the cold clouds in the storm center then downward in the surrounding areas. U.S. Hurricane Hunter planes don't monitor the vast expanse of the Pacific Ocean, so AIRS and other satellite instruments are essential for tracking typhoons as they grow. AIRS, launched in 2002, was the first instrument to reveal the 3D distribution of rain within tropical storms like Hinnamnor. These 3D images have made a major contribution to our knowledge of how hurricanes and typhoons develop, improving forecasts and saving lives. AIRS senses infrared and microwave radiation emitted from Earth to provide a 3D look at the planet's weather and climate, making observations down to Earth's surface. With more than 2,000 channels sensing different regions of the atmosphere, the system creates a global, 3D map of atmospheric temperature and humidity, cloud amounts and heights, greenhouse gas concentrations and many other atmospheric phenomena. Launched in 2002, AIRS is managed by NASA's Jet Propulsion Laboratory in Southern California. JPL is a division of Caltech. https://photojournal.jpl.nasa.gov/catalog/PIA25521

This image, is of Super Typhoon Haiyan, one of the most powerful storms ever recorded on Earth, which struck the Philippines Nov. 8, 2013.

On Sept. 21, Typhoon Usagi was moving between the northern Philippines and Taiwan when NASA's Aqua satellite passed overhead. NASA's AIRS instrument that flies aboard the Aqua satellite captured this near-infrared image on Sept. 21 at 505 UTC/1:05 a.m. EDT as Usagi. The near-infrared image is similar to how the clouds of the typhoon would appear in the daylight. Image Credit: NASA JPL, Ed Olsen Caption: NASA Goddard, Rob Gutro <b><a href="http://www.nasa.gov/audience/formedia/features/MP_Photo_Guidelines.html" rel="nofollow">NASA image use policy.</a></b> <b><a href="http://www.nasa.gov/centers/goddard/home/index.html" rel="nofollow">NASA Goddard Space Flight Center</a></b> enables NASA’s mission through four scientific endeavors: Earth Science, Heliophysics, Solar System Exploration, and Astrophysics. Goddard plays a leading role in NASA’s accomplishments by contributing compelling scientific knowledge to advance the Agency’s mission. <b>Follow us on <a href="http://twitter.com/NASA_GoddardPix" rel="nofollow">Twitter</a></b> <b>Like us on <a href="http://www.facebook.com/pages/Greenbelt-MD/NASA-Goddard/395013845897?ref=tsd" rel="nofollow">Facebook</a></b> <b>Find us on <a href="http://instagram.com/nasagoddard?vm=grid" rel="nofollow">Instagram</a></b>

ISS043E078143 (03/31/2015) --- Astronauts on board the International Space Station captured this image on Mar. 31, 2015 of the category 5 super Typhoon Maysak which is headed toward the Philippines. The Tropical Rainfall Measuring Mission (TRMM) and Global Precipitation Measurement (GPM) satellites, both co-managed by NASA and the Japan Aerospace Exploration Agency, captured rainfall and cloud data that revealed heavy rainfall and high thunderstorms in the strengthening storm.

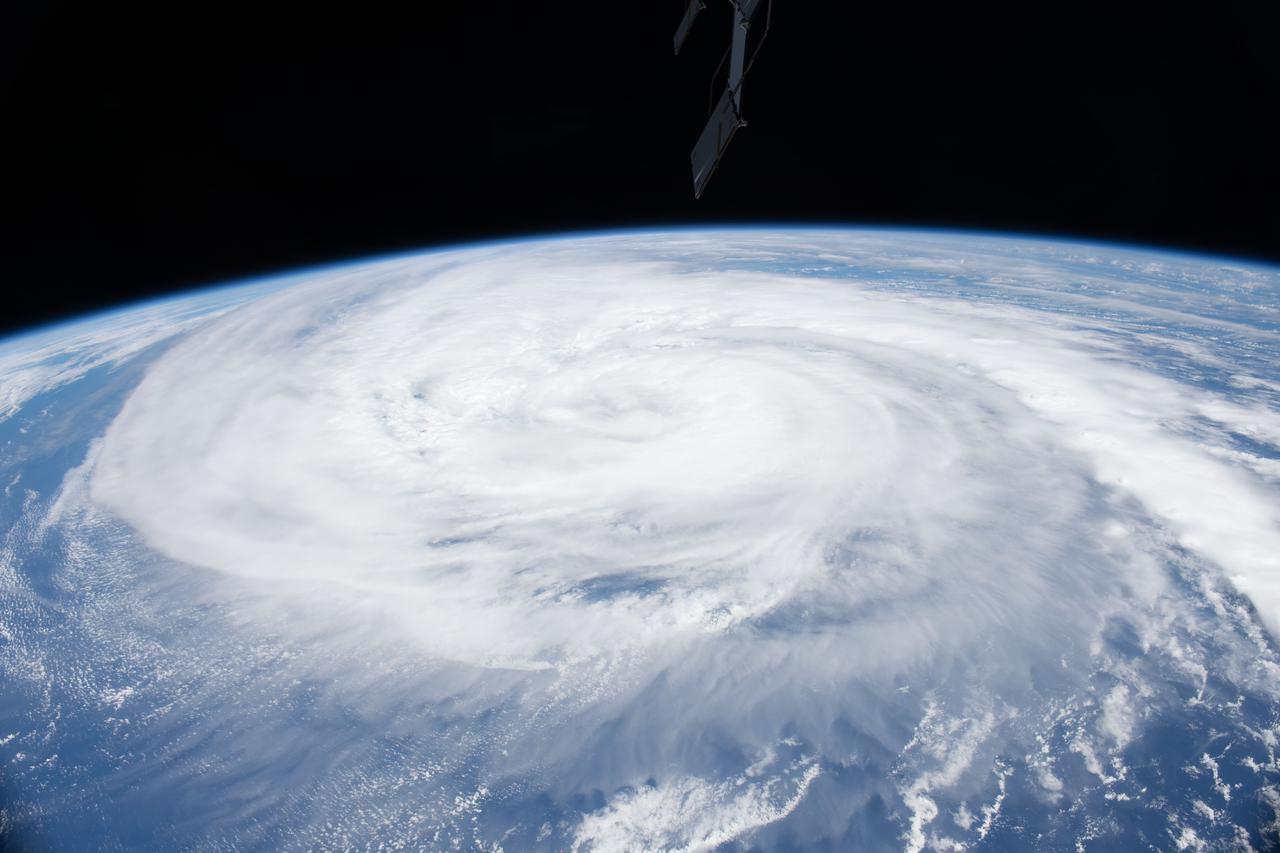
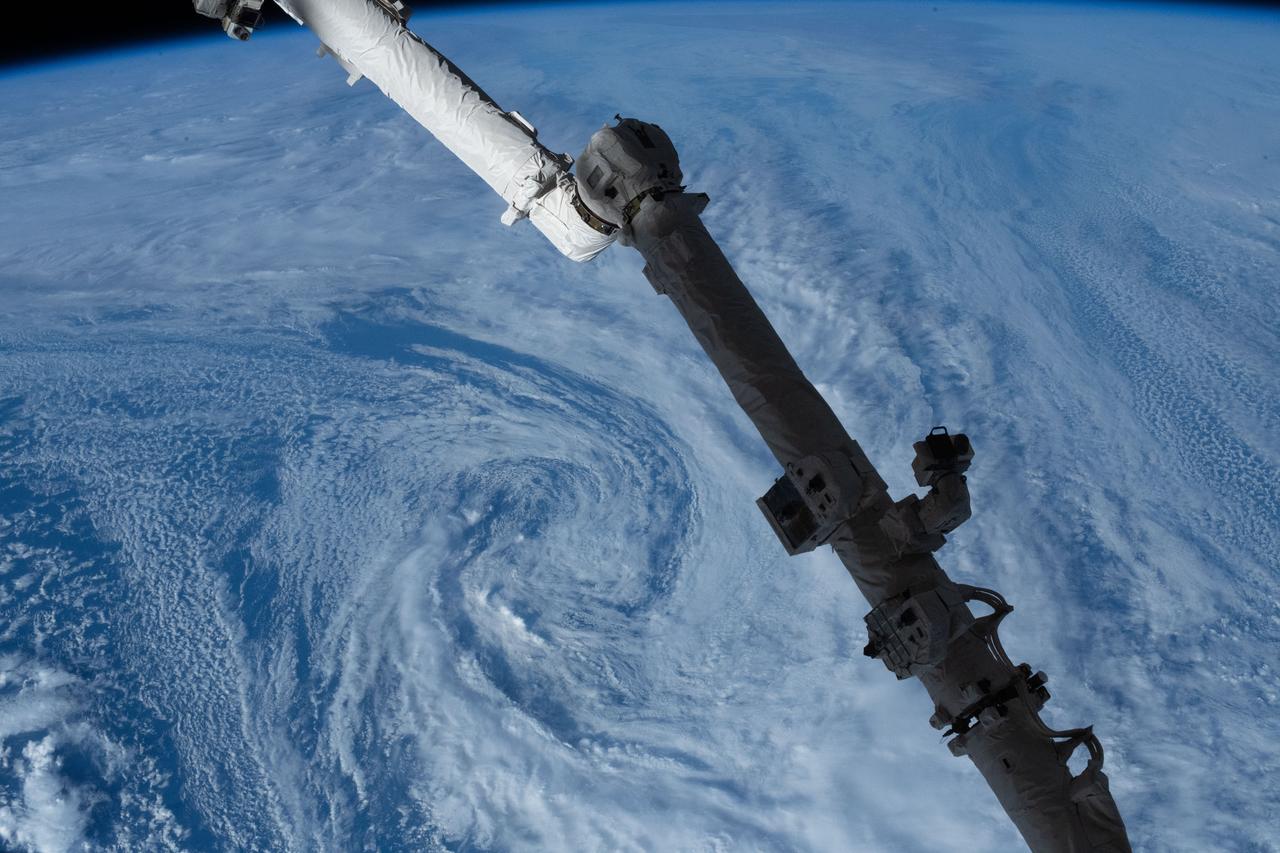
iss073e0767100 (Sept. 21, 2025) --- Typhoon Neoguri is pictured from the International Space Station as it orbited 257 miles above the Pacific Ocean southeast of Japan. In the center foreground, the Canadarm2 robotic arm extends from the orbital outpost.

iss073e0764904 (Sept. 21, 2025) --- Typhoon Neoguri is pictured in the Pacific Ocean from the International Space Station as it orbited 257 miles above. In the right foreground, is a portion of the Canadarm2 robotic arm with Dextre, its fine-tuned robotic hand, attached.

NASA CloudSat satellite flew over Typhoon Utor in the West Pacific on Aug. 11, 2013 at 0518 UTC, passing within about 6.2 miles 10 kilometers from the center of the storm, and revealing the structure of the storm eye and eyewall.

STS106-704-063 (9 September 2000) --- Typhoon Saomai swirls in the Pacific Ocean east of Taiwan and the Philippines. The typhoon was captured on film with a 70mm handheld camera by the STS-106 crew members aboard the Space Shuttle Atlantis on September. 9

Typhoon Hagibis, one of the most destructive storms to hit Japan in decades, made landfall on Saturday, Oct. 12, 2019 southwest of Tokyo with wind speeds equivalent to a Category 3 hurricane. The damage it left in its wake is visible from space. NASA's Advance Rapid Imaging and Analysis (ARIA) team, in collaboration with the Earth Observatory of Singapore (EOS), used satellite data to create this map showing areas in Japan that are likely damaged as a result of Typhoon Hagibis. The color variation from yellow to red indicates increasingly more significant ground surface change, or damage. The map was produced using synthetic aperture radar (SAR) data from the Copernicus Sentinel-1 satellites operated by the European Space Agency (ESA). The pre-event images were taken on Oct. 7, 2019, and the post-event image was acquired about 12 hours after the typhoon's landfall. The map covers an area of 155 miles by 220 miles (250 kilometers by 350 kilometers) indicated by the red polygon. The map was delivered to Sentinel Asia, a consortium that supports disaster management across the Asia-Pacific region using space-based technologies. Maps like this one can be used as guidance to help responders identify damaged areas and to allocate resources accordingly. The map may be less reliable over vegetated or badly flooded areas. https://photojournal.jpl.nasa.gov/catalog/PIA23424
iss073e1044643 (Oct. 8, 2025) --- Category 4 Typhoon Halong is pictured south of Japan from the International Space Station as it orbited 261 miles above the Pacific Ocean.
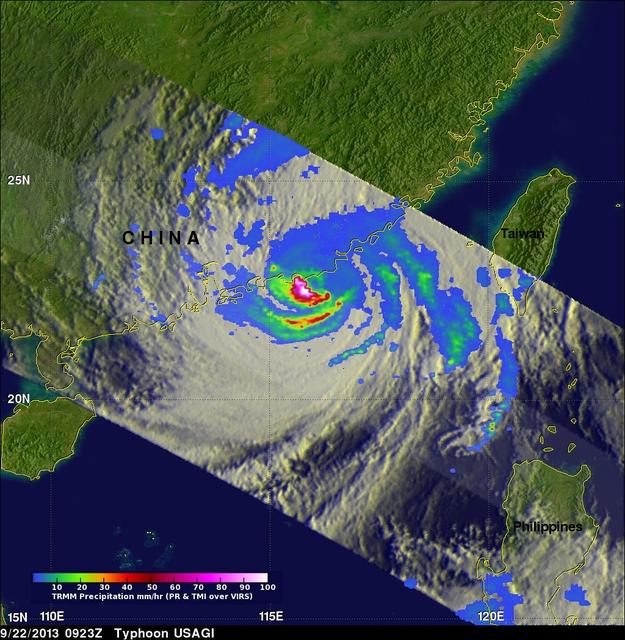
On Sept. 22 at 0923 UTC/5:23 a.m. EDT, just south of Usagi's eye where rain was falling at a rate of over 169mm/~6.7 inches per hour along China's coast. TRMM radar sliced through Usagi and found that heights of some thunderstorms were reaching only about 12 km /7.4 miles. Credit: NASA/SSAI, Hal Pierce <b><a href="http://www.nasa.gov/audience/formedia/features/MP_Photo_Guidelines.html" rel="nofollow">NASA image use policy.</a></b> <b><a href="http://www.nasa.gov/centers/goddard/home/index.html" rel="nofollow">NASA Goddard Space Flight Center</a></b> enables NASA’s mission through four scientific endeavors: Earth Science, Heliophysics, Solar System Exploration, and Astrophysics. Goddard plays a leading role in NASA’s accomplishments by contributing compelling scientific knowledge to advance the Agency’s mission. <b>Follow us on <a href="http://twitter.com/NASA_GoddardPix" rel="nofollow">Twitter</a></b> <b>Like us on <a href="http://www.facebook.com/pages/Greenbelt-MD/NASA-Goddard/395013845897?ref=tsd" rel="nofollow">Facebook</a></b> <b>Find us on <a href="http://instagram.com/nasagoddard?vm=grid" rel="nofollow">Instagram</a></b>

On Nov. 8, 2013, NASA Terra spacecraft acquired this image of Super Typhoon Haiyan as it tore across the central Philippines, leaving a trail of destruction in its path. Among the worst-hit areas is eastern Leyte island and the city of Tacloban.

S85-E-5069 (13 August 1997) --- Category five Super Typhoon Winnie as it was passing over the Marianas in the Pacific Ocean. It was moving at 160 miles per hour (mph) with gusts up to 195 mph. The photograph was taken with the Electronic Still Camera (ESC).

S85-E-5092 (14 August 1997) --- Flying directly over the eye just before 3 p.m. (EST), Aug. 15, the STS-85 crew members captured this image of Super Typhoon Winnie. The massive typhoon is located about half way between Japan and New Guinea in the Pacific Ocean. The Canadian-built robot arm of Discovery, being used in operations with CRISTA-SPAS on this mission, is partially visible in left foreground.

iss073e0764998 (Sept. 21, 2025) --- Typhoon Neoguri with its well-defined eye is pictured in the Pacific Ocean from the International Space Station as it orbited 258 miles above. In the right foreground, is the Soyuz MS-27 spacecraft docked to the Prichal module.

iss073e0764760 (Sept. 22, 2025) --- Typhoon Ragasa with its well-defined eye is pictured southeast of Taiwan in the Philippine Sea from the International Space Station as it orbited 257 miles above. Silhouetted in the foreground, is the Soyuz MS-27 spacecraft docked to the Prichal module.
STS079-E-5100 (20 September 1996) --- The crew aboard the Space Shuttle Atlantis was able to track the large Typhoon Violet in the western Pacific Ocean. At the beginning of the mission, Violet was south and west of Japan, and packed winds of 140 - 150 miles per hour. Four days into the flight, about the time this Electronic Still Camera (ESC) view was recorded and downlinked to Earth, Violet became extra-tropical, but she still had winds up to 90 knots (nautical miles per hour).
STS79-E-5099 (20 September 1996) --- The crew members have been able to spot two typhoons - the larger Violet, north of the Philippines, and a lesser one called Willie, near Vietnam - and a tropical depression from Earth-orbit, during Flight Day 5. They aimed the Electronic Still Camera (ESC) at this storm, believed to be Violet, during the early hours of September 20, 1996.

iss073e07645000 (Sept. 21, 2025) --- Typhoon Neoguri with its well-defined eye is pictured in the Pacific Ocean from the International Space Station as it orbited 258 miles above. In the right foreground, is the Soyuz MS-27 spacecraft docked to the Prichal module. At left, is a portion of the Northrop Grumman Cygnus XL cargo craft berthed to the Unity module.
iss073e0764640 (Sept. 22, 2025) --- This near overhead view from the main window on the International Space Station's cupola shows the well-defined eye of Typhoon Ragasa. The orbital outpost was soaring 256 miles above the South China Sea north of Malaysia's island of Luzon at the time of this photograph. At upper left, is one of two cymbal-shaped UltraFlex solar arrays that powers the Northrop Grumman Cygnus XL cargo craft.
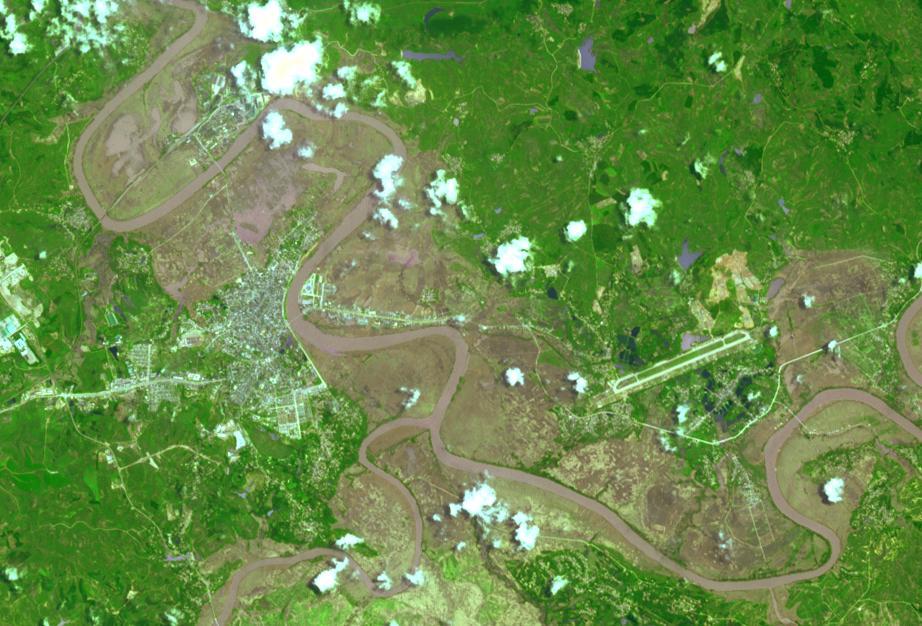
This image from the NASA Terra spacecraft shows extensive flooding resulting from Typhoon Rammasun in Ningming, China. This ASTER image was acquired on July 24, 2014.
NASA QuikScat satellite acquired this image of Category One Typhoon Fitow on Sept. 6, 2007, prior to the storm making landfall in Japan.
NASA image captured Oct. 18, 2010 at 02:35 UTC Typhoon Megi (15W) over the Philippines. The Moderate Resolution Imaging Spectroradiometer (MODIS) on NASA’s Terra satellite at 10:35 a.m. Philippine Time (02:35 UTC) on October 18, 2010. Megi was bearing down on Palanan Bay as a “super typhoon” with category 5 strength on the Saffir Simpson scale. Image Credit: NASA Goddard MODIS Rapid Response Team To learn more go to: <a href="http://www.nasa.gov/mission_pages/hurricanes/archives/2010/h2010_Megi.html" rel="nofollow">www.nasa.gov/mission_pages/hurricanes/archives/2010/h2010...</a> <b><a href="http://www.nasa.gov/centers/goddard/home/index.html" rel="nofollow">NASA Goddard Space Flight Center</a></b> enables NASA’s mission through four scientific endeavors: Earth Science, Heliophysics, Solar System Exploration, and Astrophysics. Goddard plays a leading role in NASA’s accomplishments by contributing compelling scientific knowledge to advance the Agency’s mission. <b>Follow us on <a href="http://twitter.com/NASA_GoddardPix" rel="nofollow">Twitter</a></b> <b>Join us on <a href="http://www.facebook.com/pages/Greenbelt-MD/NASA-Goddard/395013845897?ref=tsd" rel="nofollow">Facebook</a></b>
S85-E-5071 (13 August 1997) --- The STS-85 crew members aboard the Space Shuttle Discovery downlinked this oblique, Electronic Still Camera (ESC) view of the Super Typhoon Winnie about halfway between New Guinea and Japan in the Pacific Ocean late evening, August 13, 1997. Maximum sustained winds of 105 knots, gusts up to 130 knots. This photo was taken 14 1/2 hours after STS085-E-5069 was recorded with the same ESC.

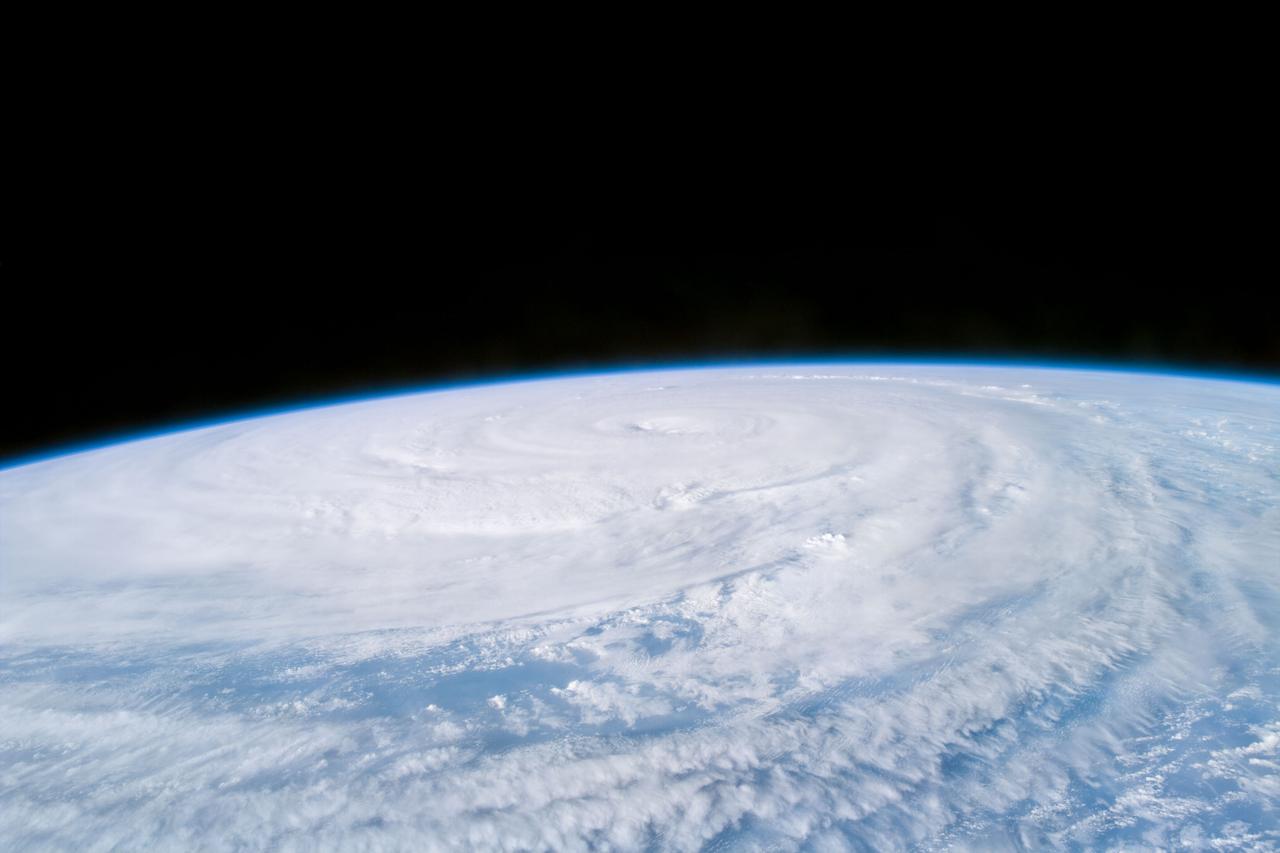
ISS011-E-12347 (3 September 2005) --- Typhoon Nabi is featured in this image photographed by an Expedition 11 crewmember on the International Space Station, as it swirls in the Pacific Ocean, heading toward southern Korea and Japan. At the time this image was taken Typhoon Nabi was ~23N 133E with sustained winds ~100 knots, gusting to 120 knots.
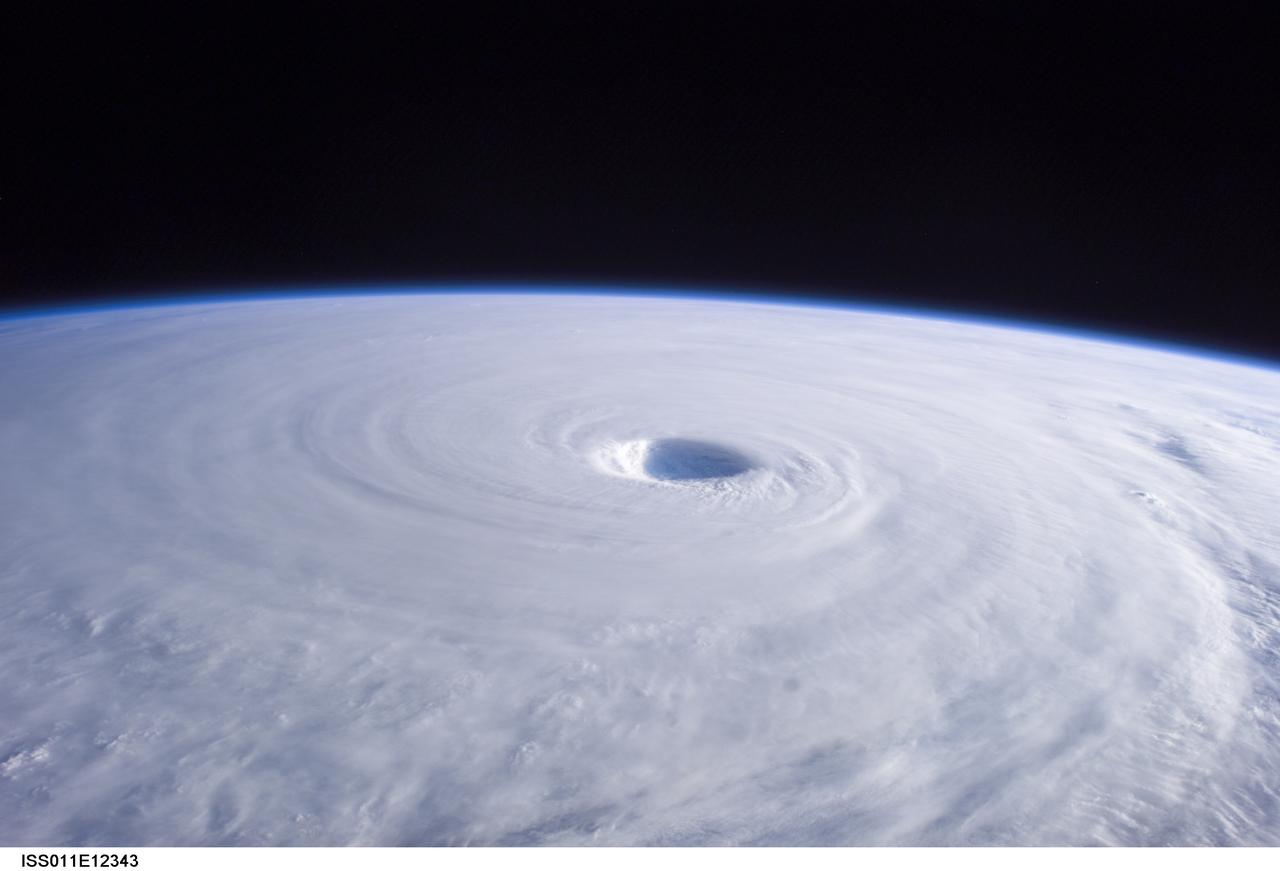
ISS011-E-12343 (3 September 2005) --- Typhoon Nabi is featured in this image photographed by an Expedition 11 crewmember on the International Space Station, as it swirls in the Pacific Ocean, heading toward southern Korea and Japan. At the time this image was taken Typhoon Nabi was ~23N 133E with sustained winds ~100 knots, gusting to 120 knots.
iss063e012660 (May 13, 2020) --- A typhoon is pictured from the International Space Station as it orbited above the South Pacific Ocean.

Earth observation taken by the Expedition 40 crew aboard the International Space Station (ISS). Folder lists this as: Jakarta and Typhoon Halong.

Earth observation taken by the Expedition 40 crew aboard the International Space Station (ISS). Folder lists this as: Jakarta and Typhoon Halong.

Super typhoon Mangkhut slammed into the northern Philippines on September 15 with wind speeds equivalent to a category 5 hurricane. South of where the eye made landfall, the storm's effects could be seen clearly five days later. The ASTER image of Dagupan and the Lingayen Gulf shows flooded and water-saturated areas in dark blue. Sediment-laden waters from swollen rivers enter the ocean and appear as blue-green plumes. The image was acquired September 22, 2018, covers an area of 51.4 by 61.2 kilometers, and is located at 16.2 degrees north, 120.3 degrees east. With its 14 spectral bands from the visible to the thermal infrared wavelength region and its high spatial resolution of about 50 to 300 feet (15 to 90 meters), ASTER images Earth to map and monitor the changing surface of our planet. ASTER is one of five Earth-observing instruments launched Dec. 18, 1999, on Terra. The instrument was built by Japan's Ministry of Economy, Trade and Industry. A joint U.S./Japan science team is responsible for validation and calibration of the instrument and data products. The broad spectral coverage and high spectral resolution of ASTER provides scientists in numerous disciplines with critical information for surface mapping and monitoring of dynamic conditions and temporal change. Example applications are monitoring glacial advances and retreats; monitoring potentially active volcanoes; identifying crop stress; determining cloud morphology and physical properties; wetlands evaluation; thermal pollution monitoring; coral reef degradation; surface temperature mapping of soils and geology; and measuring surface heat balance. https://photojournal.jpl.nasa.gov/catalog/PIA22705
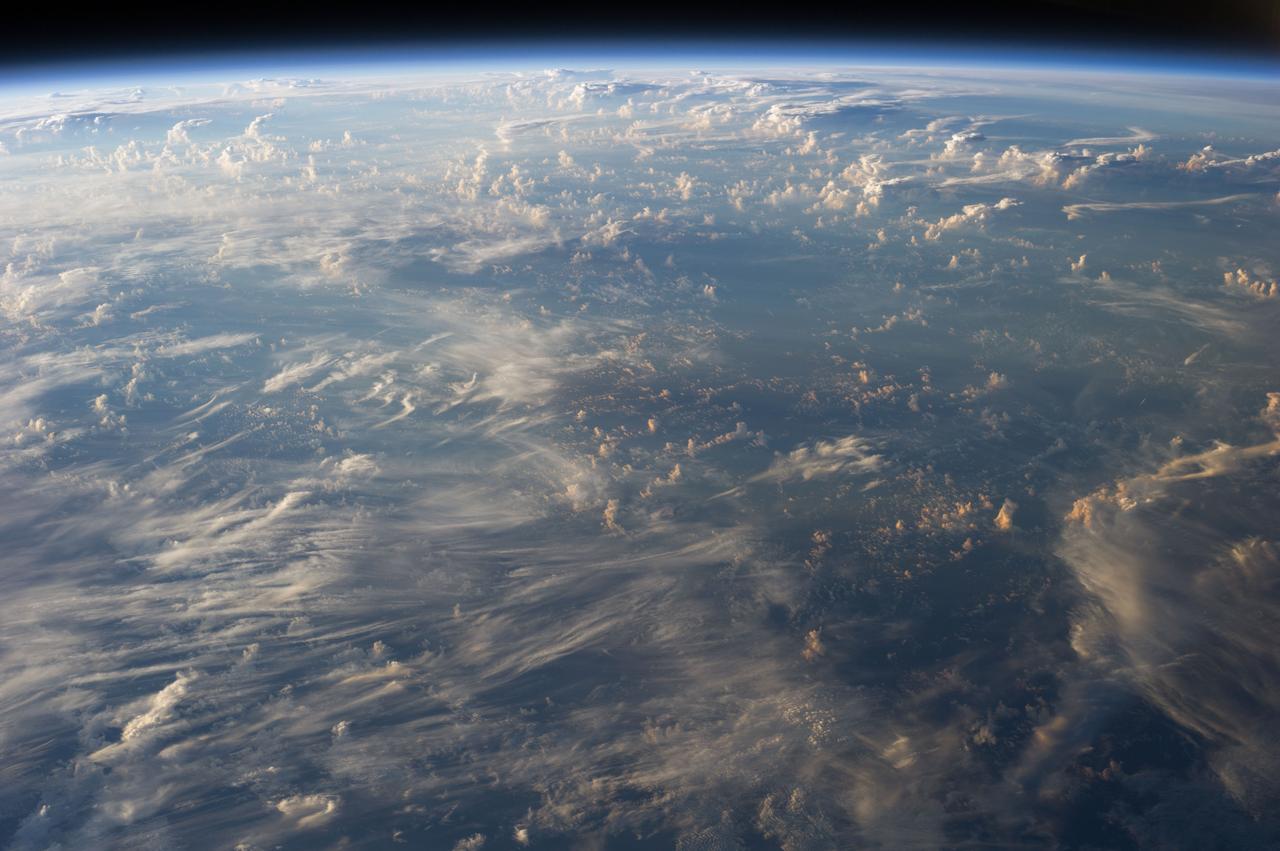
Earth Observation taken during a day pass by the Expedition 40 crew aboard the International Space Station (ISS). Folder lists this as: Periphery Clouds of Typhoon Halong.

Earth Observation taken during a day pass by the Expedition 40 crew aboard the International Space Station (ISS). Folder lists this as: Periphery Clouds of Typhoon Halong.

ISS011-E-13723 (29 September 2005) --- Typhoon Longwang is featured in this image photographed by an Expedition 11 crewmember on the international space station, as it swirls in the Pacific Ocean.

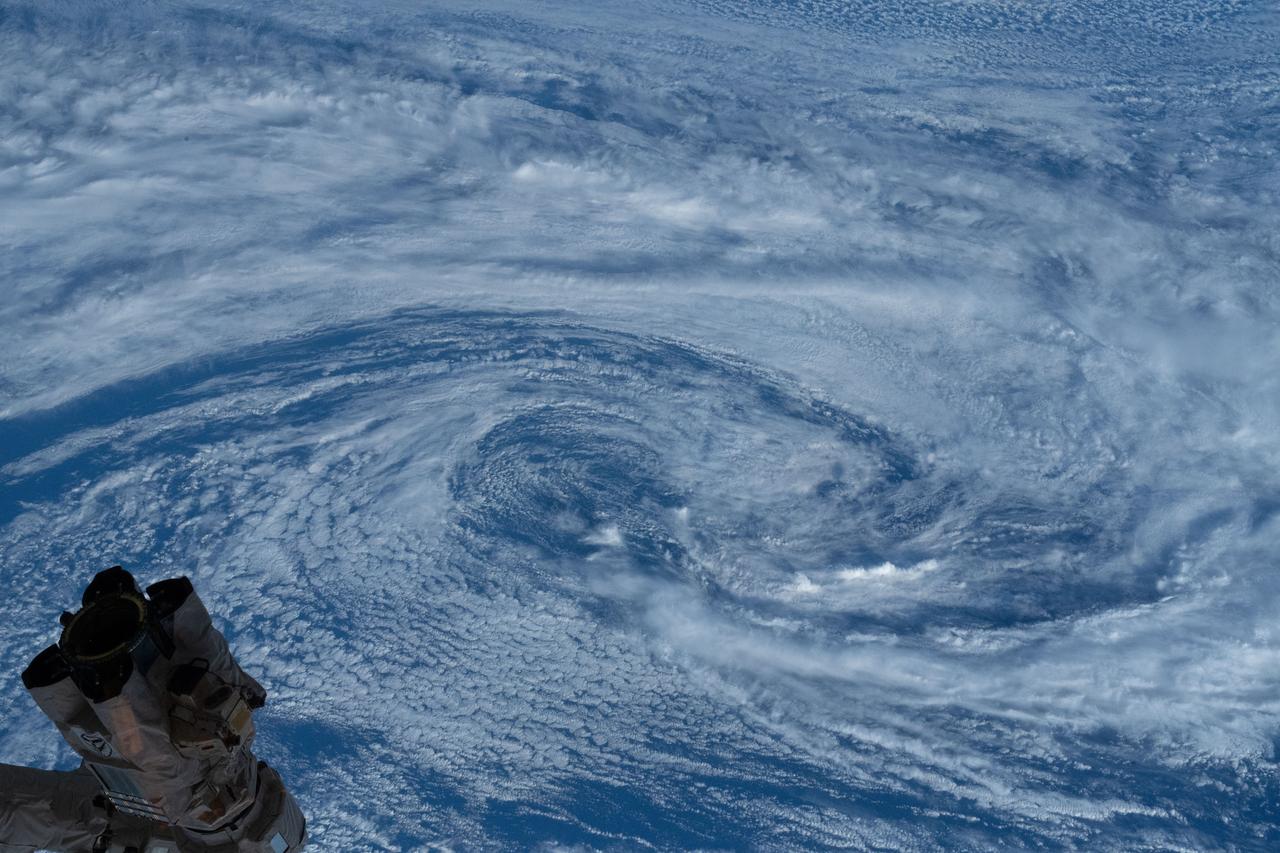
Earth observation taken during a day pass by the Expedition 40 crew aboard the International Space Station (ISS). Folder lists this as: Typhoon Neoguri.
iss066e013510 (Oct. 27, 2021) --- A typhoon is pictured from the International Space Station as it orbited 260 miles above the Philippine Sea in between Guam and the Philippines.

Earth Observation taken during a day pass by the Expedition 40 crew aboard the International Space Station (ISS). Folder lists this as: Periphery Clouds of Typhoon Halong.

iss069e056910 (Aug. 13, 2023) --- Typhoon Khanun is pictured south of Nagoya, Japan, from the International Space Station as it orbited 259 miles above the Pacific Ocean.

ISS011-E-13727 (29 September 2005) --- Typhoon Longwang is featured in this image photographed by an Expedition 11 crewmember on the international space station, as it swirls in the Pacific Ocean.
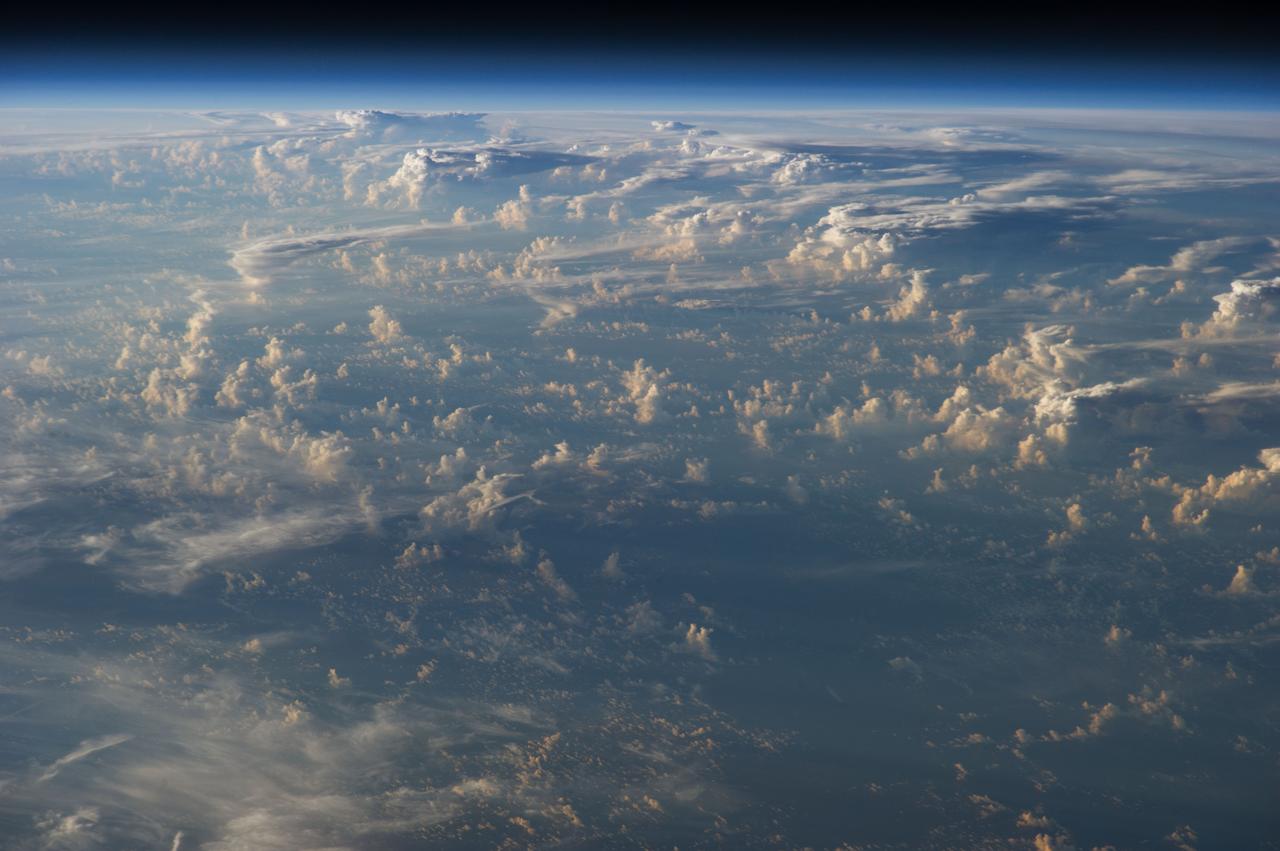
Earth Observation taken during a day pass by the Expedition 40 crew aboard the International Space Station (ISS). Folder lists this as: Periphery Clouds of Typhoon Halong.

iss069e057247 (Aug. 12, 2023) --- Typhoon Khanun is pictured south of Nagoya, Japan, from the International Space Station as it orbited 259 miles above the Pacific Ocean.
![ISS036-E-017957 (11 July 2013) --- One of the Expedition 36 crew members aboard the International Space Station photographed this image of Typhoon Soulik just east of northern Taiwan in the Pacific Ocean. [Editor?s update: Thousands of people were evacuated in Taiwan; and the entire island was declared an "alert zone," as Typhoon Soulik made landfall early on July 13 (local time), pounding the country with powerful winds and heavy rain].](https://images-assets.nasa.gov/image/iss036e017957/iss036e017957~medium.jpg)
ISS036-E-017957 (11 July 2013) --- One of the Expedition 36 crew members aboard the International Space Station photographed this image of Typhoon Soulik just east of northern Taiwan in the Pacific Ocean. [Editor?s update: Thousands of people were evacuated in Taiwan; and the entire island was declared an "alert zone," as Typhoon Soulik made landfall early on July 13 (local time), pounding the country with powerful winds and heavy rain].
![ISS036-E-017943 (11 July 2013) --- One of the Expedition 36 crew members aboard the International Space Station photographed this image of Typhoon Soulik just east of northern Taiwan The city of Guangzhou can be seen along the coast. [Editor?s update: Thousands of people were evacuated in Taiwan; and the entire island was declared an "alert zone," as Typhoon Soulik made landfall early on July 13 (local time), pounding the country with powerful winds and heavy rain].](https://images-assets.nasa.gov/image/iss036e017943/iss036e017943~medium.jpg)
ISS036-E-017943 (11 July 2013) --- One of the Expedition 36 crew members aboard the International Space Station photographed this image of Typhoon Soulik just east of northern Taiwan The city of Guangzhou can be seen along the coast. [Editor?s update: Thousands of people were evacuated in Taiwan; and the entire island was declared an "alert zone," as Typhoon Soulik made landfall early on July 13 (local time), pounding the country with powerful winds and heavy rain].

ISS043E183985 (05/08/2015) --- Typhoon Noul from a camera aboard the International Space Station taken by the Expedition 43 crew led by Commander Terry Virts, NASA astronaut. Noul originated in the tropical Western Pacific, brushing the island of Yap before strengthening rapidly and clipping the northern Philippines as a super typhoon, winding up on the Pacific coast of Japan reduced to a tropical storm.
![ISS036-E-017952 (11 July 2013) --- One of the Expedition 36 crew members aboard the International Space Station photographed this image of Typhoon Soulik just east of northern Taiwan in the Pacific Ocean. [Editor?s update: Thousands of people were evacuated in Taiwan; and the entire island was declared an "alert zone," as Typhoon Soulik made landfall early on July 13 (local time), pounding the country with powerful winds and heavy rain].](https://images-assets.nasa.gov/image/iss036e017952/iss036e017952~medium.jpg)
ISS036-E-017952 (11 July 2013) --- One of the Expedition 36 crew members aboard the International Space Station photographed this image of Typhoon Soulik just east of northern Taiwan in the Pacific Ocean. [Editor?s update: Thousands of people were evacuated in Taiwan; and the entire island was declared an "alert zone," as Typhoon Soulik made landfall early on July 13 (local time), pounding the country with powerful winds and heavy rain].

ISS040-E-033276 (4 July 2014) -- One of the Expedition 40 crew members aboard the international Space Station photographed this image of Typhoon Neoguri at 22:45:26 GMT on July 4, 2014. At the time this photograph was taken, the strongest typhoon of 2014 was forecast to hit Japan within 48 hours and bring destructive, high-speed winds over 150 miles per hour.
Typhoon Nepartak, the first large typhoon in the northwest Pacific this season, is currently taking aim at the east coast of Taiwan. Over the past few days, Nepartak has rapidly gained strength, growing from a tropical storm to the equivalent of a Category 5 hurricane with sustained wind speeds of more than 160 miles (258 kilometers) per hour. Taiwan's Central Weather Bureau has issued a torrential rain warning, bracing for likely flooding as 5 to 15 inches (13 to 38 centimeters) of rain are expected to fall over Taiwan during the storm's passage. Waves of up to 40 feet (12 meters) are predicted on the coast as the typhoon approaches, and air and train travel have been severely impacted. The typhoon is currently moving at about 10 miles per hour (16 kilometers) to the west-northwest, and is predicted to pass over Taiwan within the next day and then hit the coast of mainland China. Central and eastern China are poorly situated to absorb the rainfall from Nepartak after suffering the effects of severe monsoon flooding, which has killed at least 140 people in the past week. The Multi-angle Imaging SpectroRadiometer (MISR) instrument aboard NASA's Terra satellite captured this view of Typhoon Nepartak on July 7, 2016, at 10:30 a.m. local time (2:30 a.m. UTC). On the left is an image from the nadir (vertical pointing) camera, which shows the central portion of Nepartak and the storm's eye. The image is about 235 miles (378 kilometers) across. The island of Manila in the Philippines, about 250 miles (400 kilometers) south of Taiwan, is visible to the southwest of the eye. The image shows that Nepartak's center is extremely compact, rather than broken up into spiral bands as is more typical of typhoons. This means that the storm may retain more of its strength as it passes over land. MISR uses nine cameras to capture images of the typhoon from different angles. This provides a stereographic view, which can be used to determine the height of the storm's cloud tops. These heights are plotted in the middle panel, superimposed on the image. This shows that the cloud tops are relatively low, about 2.5 miles (4 kilometers), in the eye, but much higher, up to 12.5 miles (20 kilometers), just outside it. By tracking the motion of clouds as they are viewed by each of the nine cameras over about seven minutes, it is possible to also derive how fast the clouds are moving due to wind. These wind vectors are superimposed on the image in the right panel. The length of each arrow shows the wind speed at that location (compare to the 45 miles per hour or 20 meters per second arrow in the legend), and the color shows the height at which the wind is being computed. The motion of the low-level winds (red and yellow arrows) is counterclockwise, while the motion of the high winds (blue and purple arrows) is mostly clockwise. This is because hurricanes draw in warm, moist air at low altitudes, which then flows upward around the eye, releases its moisture as rain, and moves outward at high altitudes. As is typical of these types of storm systems, the inflowing low winds and the outflowing high winds spin in different directions. http://photojournal.jpl.nasa.gov/catalog/PIA20719
iss063e012659 (May 13, 2020) --- The International Space Station's robotic arm, the 57.7-foot-long Canadarm2, crosses the frame with a typhoon pictured below in the South Pacific Ocean.

ISS011-E-13551 (24 September 2005) --- Typhoon 18W Saola is featured in this image photographed by an Expedition 11 crewmember on the international space station, as it swirls in the Pacific Ocean, heading toward southern Japan.

Earth Observation taken during a day pass by the Expedition 40 crew aboard the International Space Station (ISS). Folder lists this as: Typhoon Halong wide angle shots.

Earth Obsevation taken during a day pass by the Expedition 40 crew aboard the International Space Station (ISS). Folder lists this as: Glancing shots of Super Typhoon Halong.
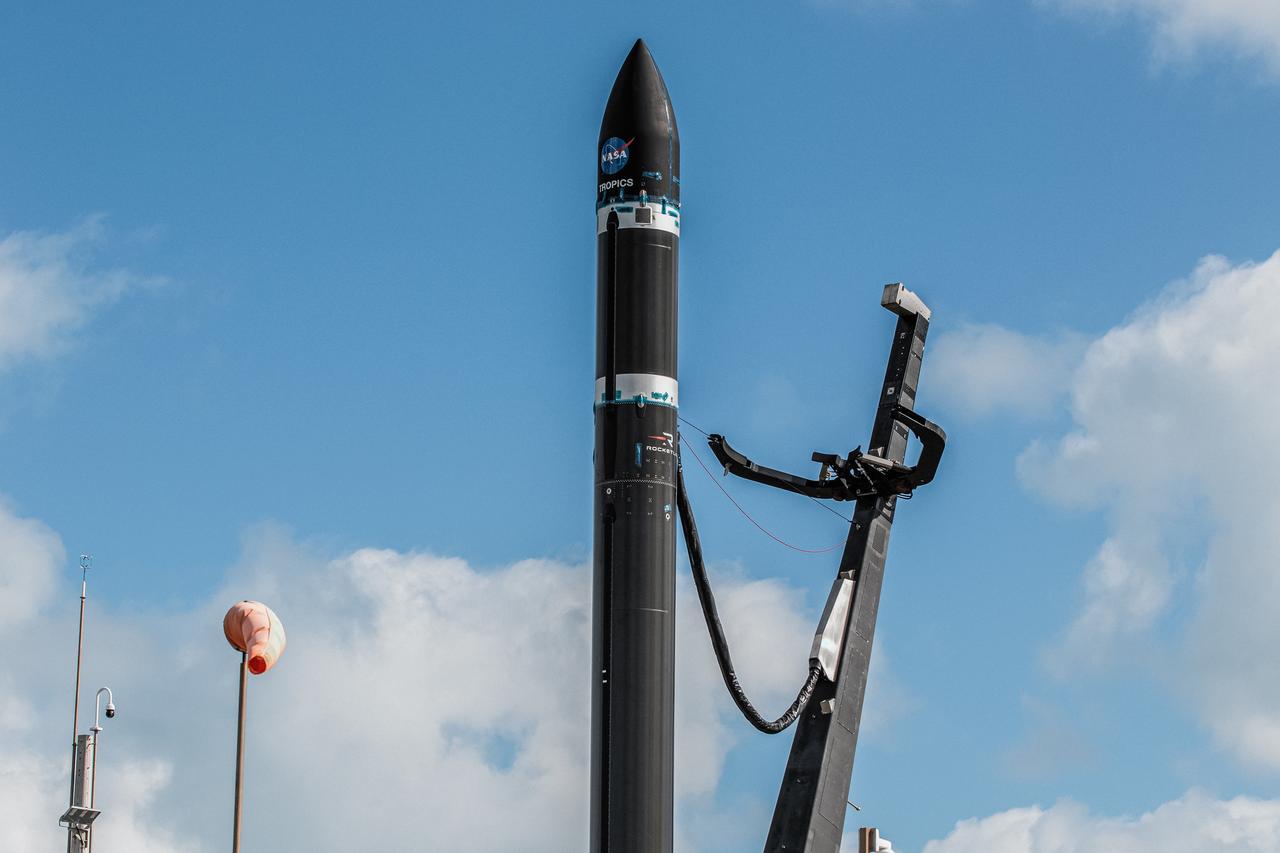
With the umbilical tower in view, Rocket Lab’s Electron rocket is vertical on the pad at Launch Complex 1 in Mahia, New Zealand. NASA’s Time-Resolved Observations of Precipitation structure and storm Intensity with a Constellation of Smallsats (TROPICS) CubeSats are secured in the payload fairing atop the rocket. TROPICS is scheduled to launch on Monday, May 1, at 1 a.m. New Zealand time from Launch Complex 1, Pad B. TROPICS will provide data on temperature, precipitation, water vapor, and clouds by measuring microwave frequencies, providing insight into storm formation and intensification.
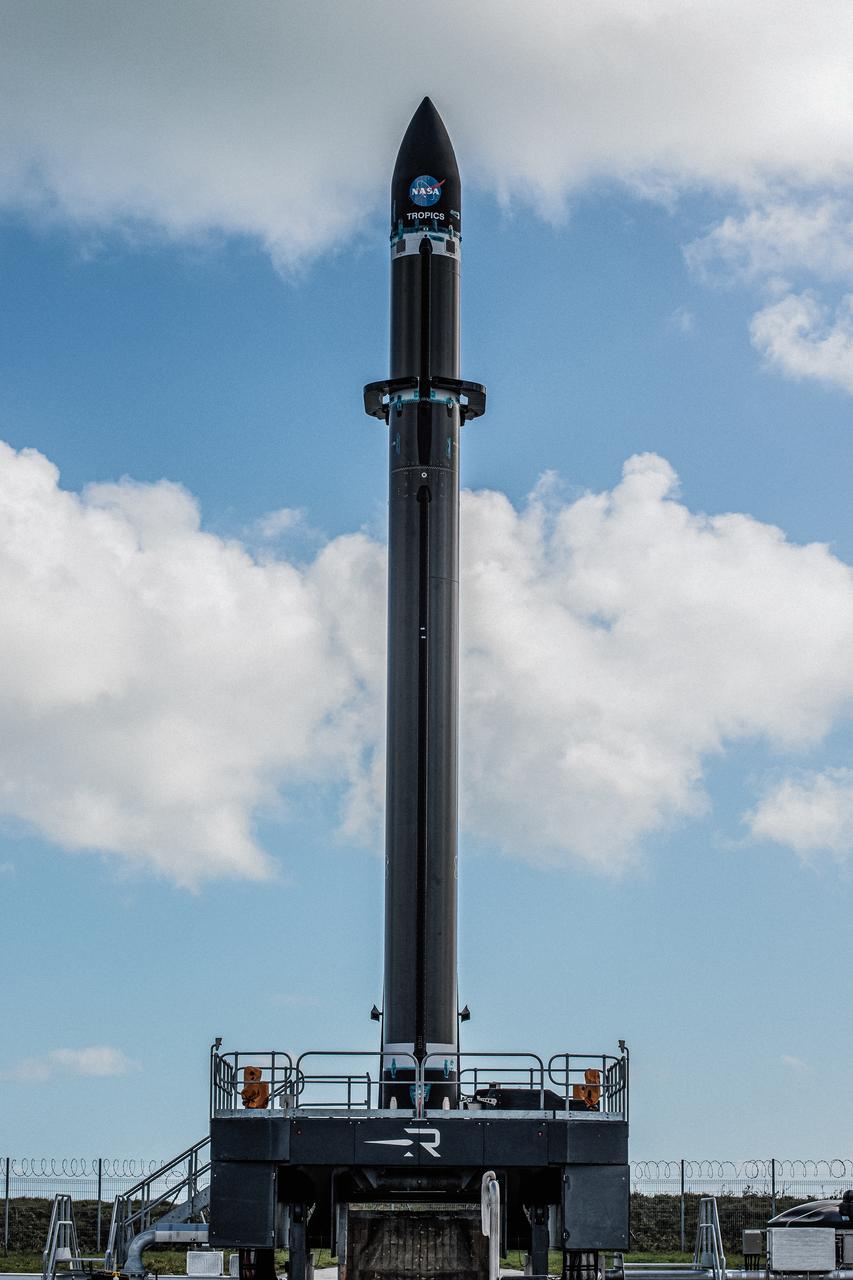
Rocket Lab’s Electron rocket is vertical on the pad at Launch Complex 1 in Mahia, New Zealand. NASA’s Time-Resolved Observations of Precipitation structure and storm Intensity with a Constellation of Smallsats (TROPICS) CubeSats are secured in the payload fairing atop the rocket. TROPICS is scheduled to launch on Monday, May 1, at 1 a.m. New Zealand time from Launch Complex 1, Pad B. TROPICS will provide data on temperature, precipitation, water vapor, and clouds by measuring microwave frequencies, providing insight into storm formation and intensification.
A wet dress rehearsal is underway for Rocket Lab’s Electron rocket at Launch Complex 1 in Mahia, New Zealand on April 28, 2023. NASA’s Time-Resolved Observations of Precipitation structure and storm Intensity with a Constellation of Smallsats (TROPICS) CubeSats are secured in the payload fairing atop the rocket. TROPICS is scheduled to launch from Launch Complex 1, Pad B. TROPICS will provide data on temperature, precipitation, water vapor, and clouds by measuring microwave frequencies, providing insight into storm formation and intensification.
A wet dress rehearsal is underway for Rocket Lab’s Electron rocket at Launch Complex 1 in Mahia, New Zealand on April 28, 2023. NASA’s Time-Resolved Observations of Precipitation structure and storm Intensity with a Constellation of Smallsats (TROPICS) CubeSats are secured in the payload fairing atop the rocket. TROPICS is scheduled to launch from Launch Complex 1, Pad B. TROPICS will provide data on temperature, precipitation, water vapor, and clouds by measuring microwave frequencies, providing insight into storm formation and intensification.
A wet dress rehearsal is underway for Rocket Lab’s Electron rocket at Launch Complex 1 in Mahia, New Zealand on April 28, 2023. NASA’s Time-Resolved Observations of Precipitation structure and storm Intensity with a Constellation of Smallsats (TROPICS) CubeSats are secured in the payload fairing atop the rocket. TROPICS is scheduled to launch from Launch Complex 1, Pad B. TROPICS will provide data on temperature, precipitation, water vapor, and clouds by measuring microwave frequencies, providing insight into storm formation and intensification.
With the umbilical tower in view, Rocket Lab’s Electron rocket is vertical on the pad at Launch Complex 1 in Mahia, New Zealand. NASA’s Time-Resolved Observations of Precipitation structure and storm Intensity with a Constellation of Smallsats (TROPICS) CubeSats are secured in the payload fairing atop the rocket. TROPICS is scheduled to launch on Monday, May 1, at 1 a.m. New Zealand time from Launch Complex 1, Pad B. TROPICS will provide data on temperature, precipitation, water vapor, and clouds by measuring microwave frequencies, providing insight into storm formation and intensification.