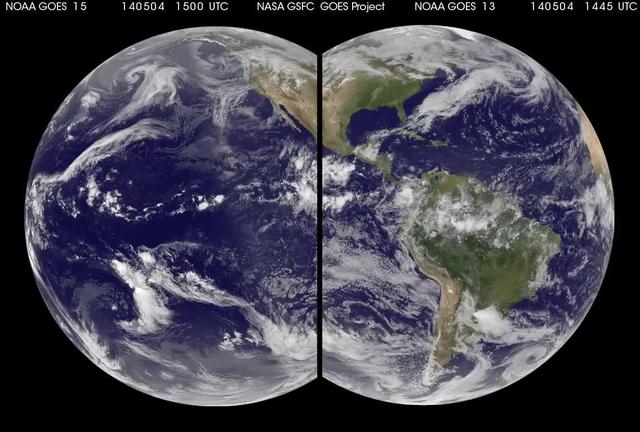
Tomorrow is the start of the Eastern Pacific Ocean hurricane season but the eastern Pacific is currently quiet. The Atlantic Ocean hurricane season begins on June 1. NASA/NOAA's GOES Project combined imagery from NOAA's GOES-13 and GOES-15 satellites to provide this animation of weather in the Atlantic and Eastern Pacific over the last 10 days. Credit: NASA/NOAA GOES Project <b><a href="http://www.nasa.gov/audience/formedia/features/MP_Photo_Guidelines.html" rel="nofollow">NASA image use policy.</a></b> <b><a href="http://www.nasa.gov/centers/goddard/home/index.html" rel="nofollow">NASA Goddard Space Flight Center</a></b> enables NASA’s mission through four scientific endeavors: Earth Science, Heliophysics, Solar System Exploration, and Astrophysics. Goddard plays a leading role in NASA’s accomplishments by contributing compelling scientific knowledge to advance the Agency’s mission. <b>Follow us on <a href="http://twitter.com/NASAGoddardPix" rel="nofollow">Twitter</a></b> <b>Like us on <a href="http://www.facebook.com/pages/Greenbelt-MD/NASA-Goddard/395013845897?ref=tsd" rel="nofollow">Facebook</a></b> <b>Find us on <a href="http://instagram.com/nasagoddard?vm=grid" rel="nofollow">Instagram</a></b>
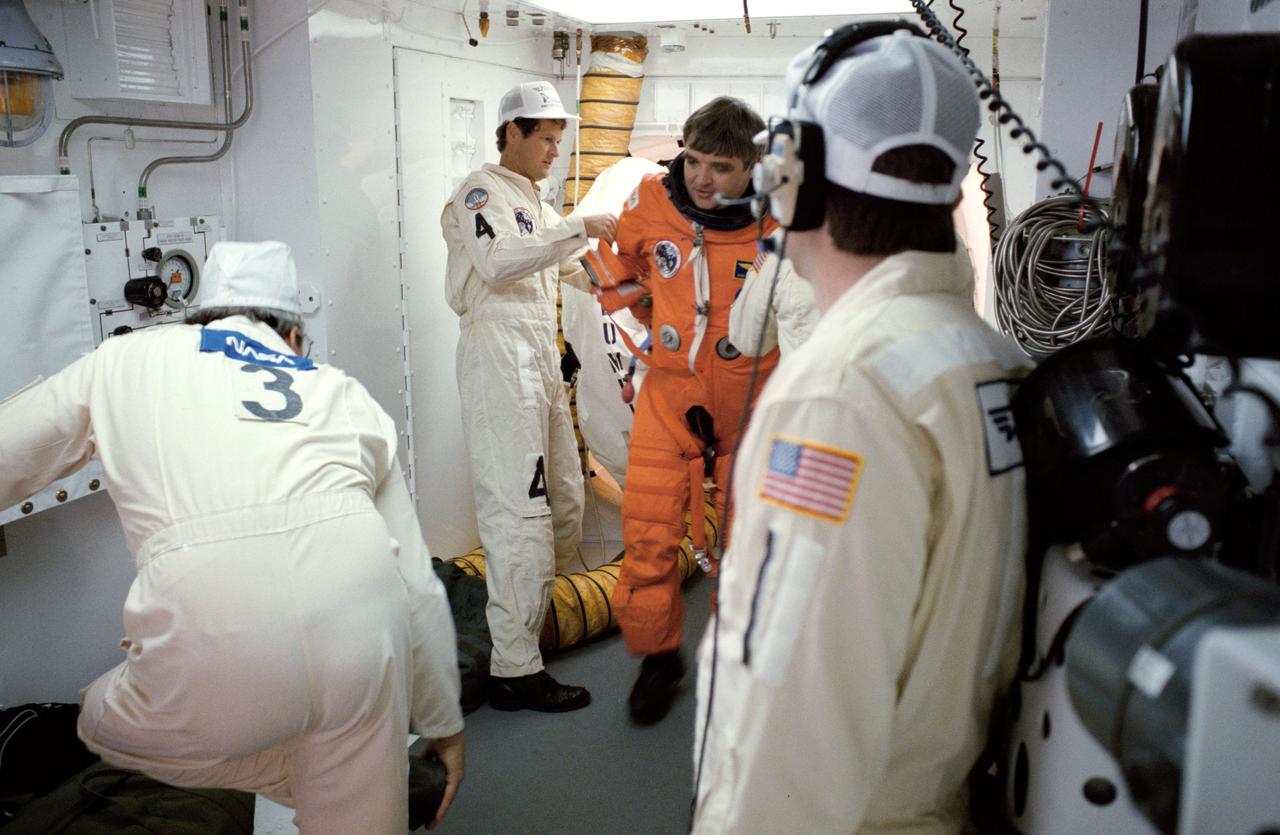
STS032-S-062 (9 Jan 1990) --- Inside the White Room at Launch Pad 39A, a suit technician helps astronaut Daniel C. Brandenstein, mission commander, suit up for the launch of the orbiter Columbia on Shuttle Mission STS-32. Dubious weather at the return-to-launch site (RTLS) caused postponement of yesterday's planned launch. During the ten day mission, the five member crew is scheduled to deploy the SYNCOM IV-5 military communications satellite and retrieve the Long Duration Exposure Facility.

The Space Shuttle Discovery, mated to NASA's 747 Shuttle Carrier Aircraft (SCA), takes to the air for its ferry flight back to the Kennedy Space Center in Florida. The spacecraft, with a crew of six, was launched into a 57-degree high inclination orbit from the Kennedy Space Center, Florida, at 3:23 p.m., 9 September 1994. The mission featured the study of clouds and the atmosphere with a laser beaming system called Lidar In-Space Technology Experiment (LITE), and the first untethered space walk in ten years. A Spartan satellite was also deployed and later retrieved in the study of the sun's corona and solar wind. The mission was scheduled to end Sunday, 18 September, but was extended one day to continue science work. Bad weather at the Kennedy Space Center on 19 September, forced a one-day delay to September 20, with a weather divert that day to Edwards. Mission commander was Richard Richards, the pilot Blaine Hammond, while mission specialists were Jerry Linenger, Susan Helms, Carl Meade, and Mark Lee.
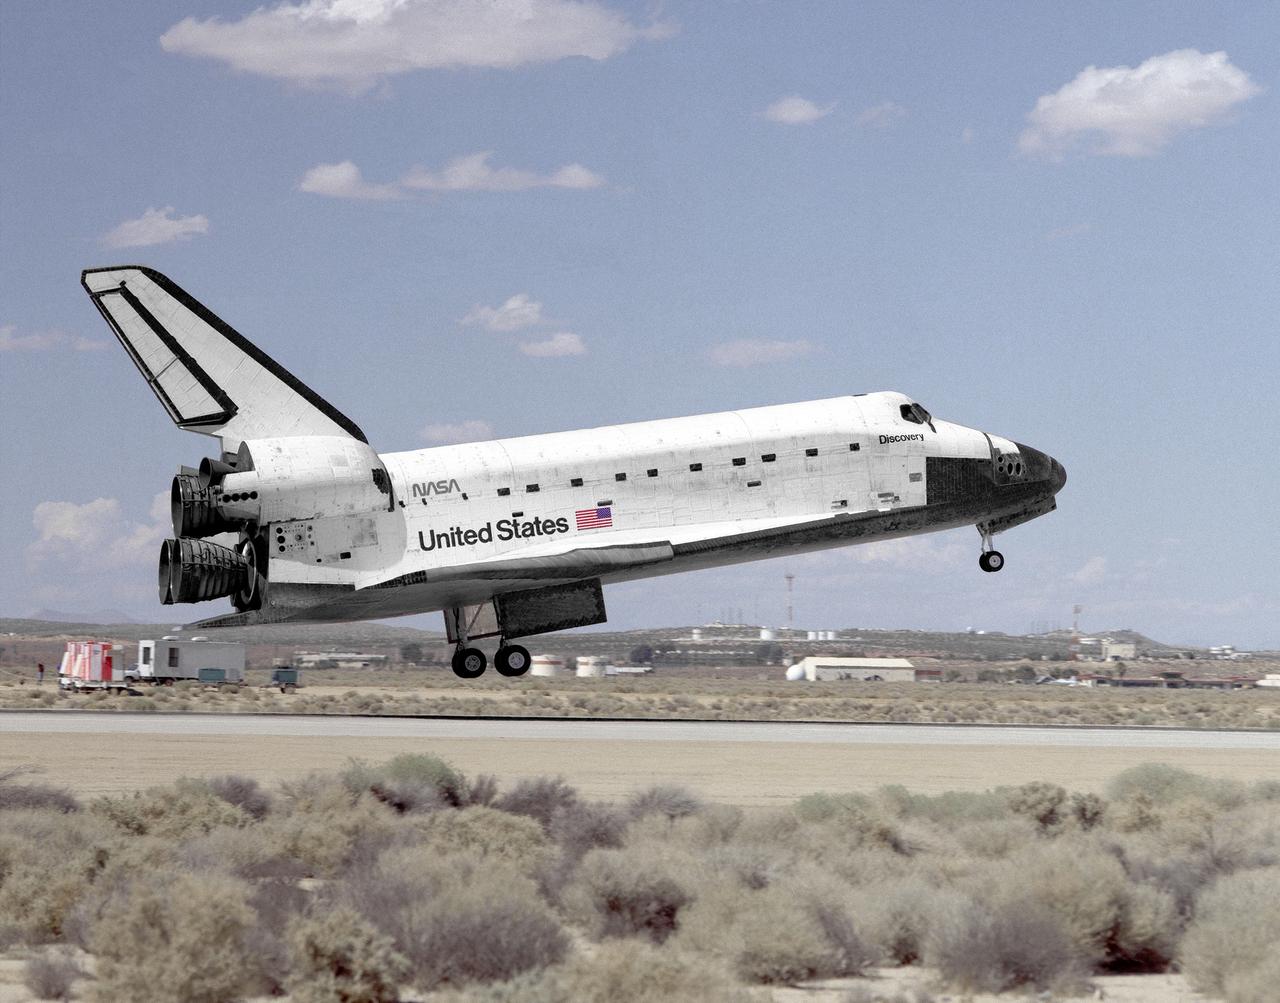
The Space Shuttle Discovery settles to the main runway at Edwards, California, at 2:13 p.m. (PDT) 20 September 1994, to conclude mission STS-64. The spacecraft, with a crew of six, was launched into a 57-degree high inclination orbit from the Kennedy Space Center, Florida, at 3:23 p.m. (PDT), 9 September 1994. The mission featured the study of clouds and the atmosphere with a laser beaming system called Lidar In-Space Technology Experiment (LITE), and the first untethered space walk in over ten years. A Spartan satellite was also deployed and later retrieved in the study of the sun's corona and the solar wind. The mission was scheduled to end Sunday, 18 September, but was extended one day to continue science work. Bad weather at the Kennedy Space Center on September 19, forced a one-day delay to September 20, with a weather divert that day to Edwards. Mission commander was Richard Richards, the pilot Blaine Hammond, while mission specialists were Jerry Linenger, Susan Helms, Carl Meade, and Mark Lee.
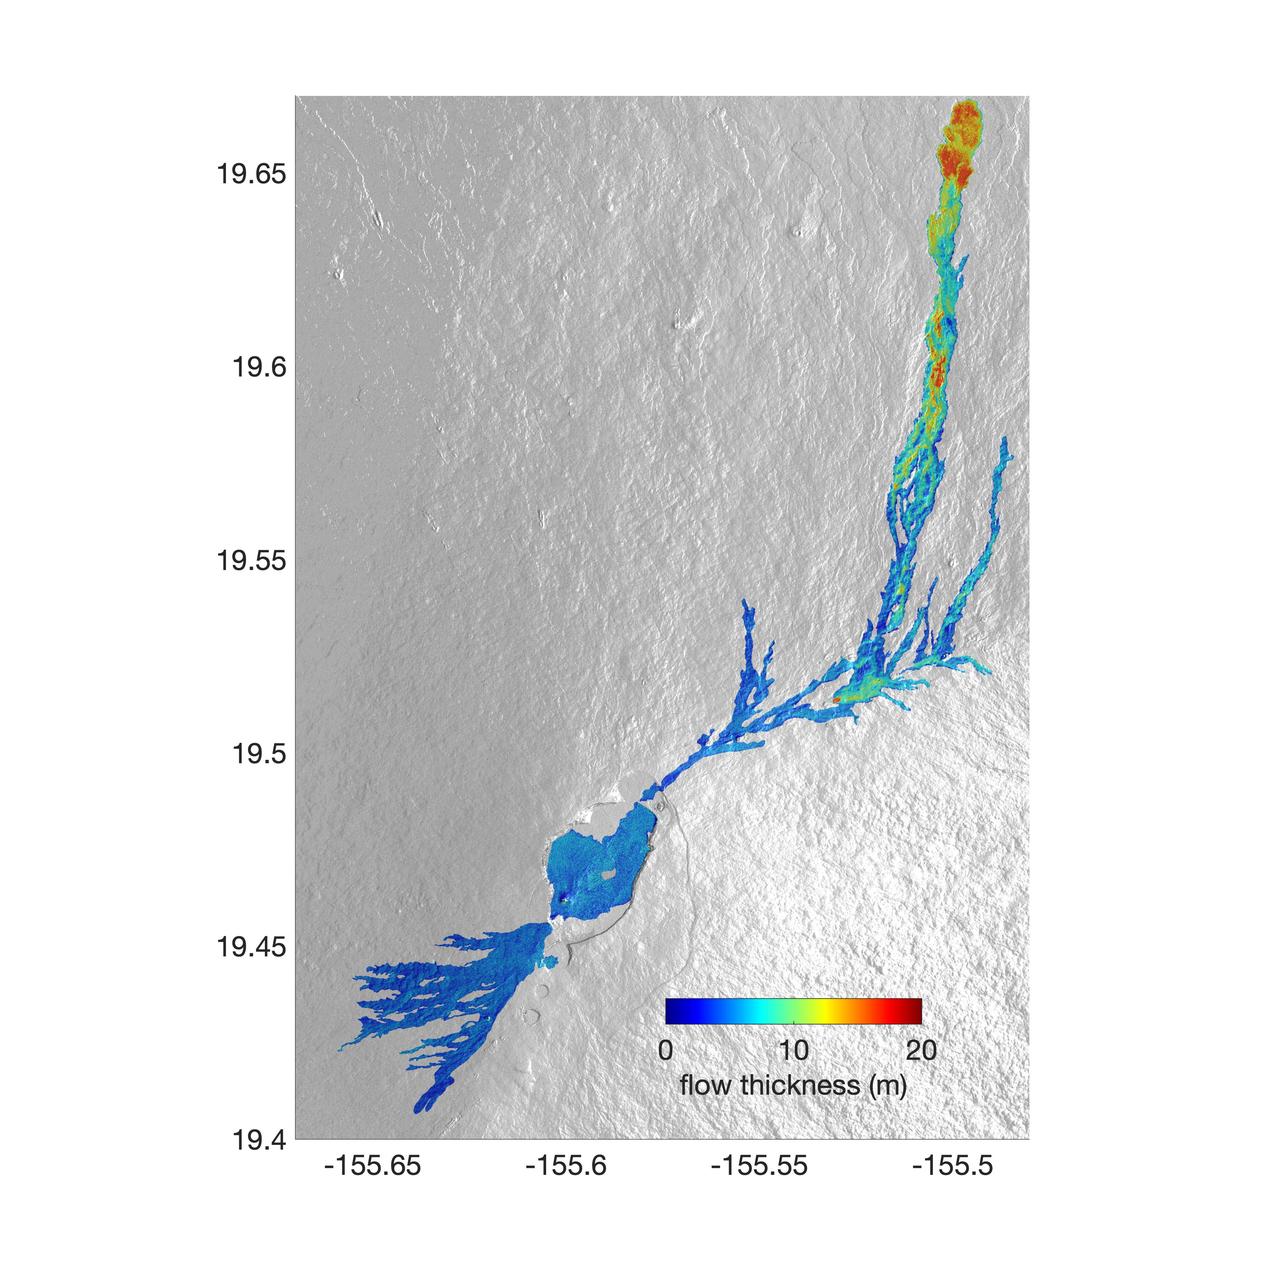
The world's largest active volcano – Hawaii's Mauna Loa – had been quiet for 38 years. But in 2022, the volcano began to stir, showing increased numbers of small earthquakes and subtle swelling of certain land surfaces in September. On November 27, fountains of lava began spurting from the mountain's Northeast Rift Zone and streams of molten rock flowed to the north. Ten days into the eruption, a NASA aircraft conducted its first flight over the erupting volcano. It carried NASA's Uninhabited Aerial Vehicle Synthetic Aperture Radar (UAVSAR) system, which was used to map the volcano's topography in fine detail with a Ka-band instrument called GLISTIN-A. Teams from NASA's Jet Propulsion Laboratory and the United States Geological Survey (USGS) used data from that sensor to map the thickness of those flows during a series of flights on December 7, 8, and 10. The map above shows the thickness of the lava flows during the flight on December 7, the day before USGS scientists noticed a significant decline in the pace of the eruption. A few days later, they declared the eruption had stopped. The map shows the thickness of the lava flows in the summit caldera, where the eruption began, and of lava flows on Mauna Loa's northeastern flank. The color variation from blue to orange indicates increasing lava flow thickness. A maximum thickness of roughly 25 meters (82 feet) is shown, though values exceeding 40 meters (131 feet) were observed in some areas. The thickening at the northern end of the flow is due to lava accumulating away from the vent, along with a flattening of the terrain at the saddle between the Mauna Loa and Mauna Kea volcanoes. By comparing to pre-eruption maps of this area's topography, including GLISTIN-A data collected in 2017, the USGS researchers were able to calculate the size and volume of the lava flow. Over the roughly 14-day eruption, Mauna Loa erupted more than 8.8 billion cubic feet (230 million cubic meters) along a lava flow that extended up to 16.5 miles (19.5 kilometers) from the vent, according to the USGS. The UAVSAR operates from a pod mounted beneath a crewed Gulfstream III jet from NASA's Armstrong Flight Research Center in California. Repeated topographic maps generated with each flight reveal the progression and thickening of lava with time – important information for scientific understanding of volcano processes and for emergency response. For the Mauna Loa science flights, the instrument suite featured an additional state-of-the-art imaging tool: the synthetic aperture radar-fusion optical short-wave infrared (SAR-Fusion Optical/SWIR) camera system. SAR-Fusion collects data over the same ground swath as GLISTIN-A to map land surface changes using optical/SWIR photogrammetry methods. GLISTIN-A was designed to provide all-weather, high-resolution surface topography not available through existing lidar or radar sensors. GLISTIN-A was originally demonstrated as a new radar technique for mapping ice surfaces. Science demonstration flights began in 2013 over alpine glaciers and sea ice in Alaska, and a floodplain in California. Its applications have since expanded to other areas, such as snow accumulation and volcano dynamics. The first time the instrument was deployed for volcano response was in 2018 during the three-month eruption of Kilauea. The success of that operation paved the way for deployment to Mauna Loa. https://photojournal.jpl.nasa.gov/catalog/PIA25526
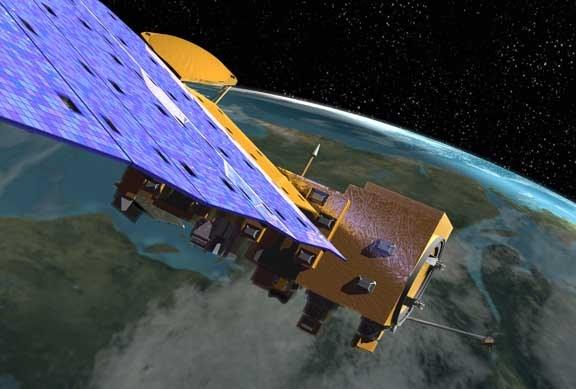
NASA's Aqua Satellite Celebrates 10th Anniversary The Aqua satellite mission has proved to be a major component of the Earth Observing System (EOS) for its ability to gather unprecedented amounts of information on Earth’s water cycle, including measurements on water vapor, clouds, precipitation, ice, and snow. Aqua data has helped improve weather prediction, detection of forest fires, volcanic ash, and sandstorms. In addition, Aqua data have been used to detect and monitor such greenhouse gases as carbon dioxide, water vapor, and methane, and to examine the energy imbalance at the top of the Earth's atmosphere and the various components of it. With these uses of Aqua data, scientists have been able to better understand our Earth over the course of the past ten years. Aqua is a major international Earth Science satellite mission centered at NASA. Launched on May 4, 2002, the satellite has six different Earth-observing instruments on board and is named for the large amount of information being obtained about water in the Earth system from its stream of approximately 89 Gigabytes of data a day. The water variables being measured include almost all elements of the water cycle and involve water in its liquid, solid, and vapor forms. Additional variables being measured include radiative energy fluxes, aerosols, vegetation cover on the land, phytoplankton and dissolved organic matter in the oceans, and air, land, and water temperatures. For more information about NASA's Aqua satellite, visit: aqua.nasa.gov ------------ Caption: Artist rendition of the NASA's Aqua satellite, which carries the MODIS and AIRS instruments. Credit: NASA <b><a href="http://www.nasa.gov/audience/formedia/features/MP_Photo_Guidelines.html" rel="nofollow">NASA image use policy.</a></b> <b><a href="http://www.nasa.gov/centers/goddard/home/index.html" rel="nofollow">NASA Goddard Space Flight Center</a></b> enables NASA’s mission through four scientific endeavors: Earth Science, Heliophysics, Solar System Exploration, and Astrophysics. Goddard plays a leading role in NASA’s accomplishments by contributing compelling scientific knowledge to advance the Agency’s mission. <b>Follow us on <a href="http://twitter.com/NASA_GoddardPix" rel="nofollow">Twitter</a></b> <b>Like us on <a href="http://www.facebook.com/pages/Greenbelt-MD/NASA-Goddard/395013845897?ref=tsd" rel="nofollow">Facebook</a></b> <b>Find us on <a href="http://instagrid.me/nasagoddard/?vm=grid" rel="nofollow">Instagram</a></b>
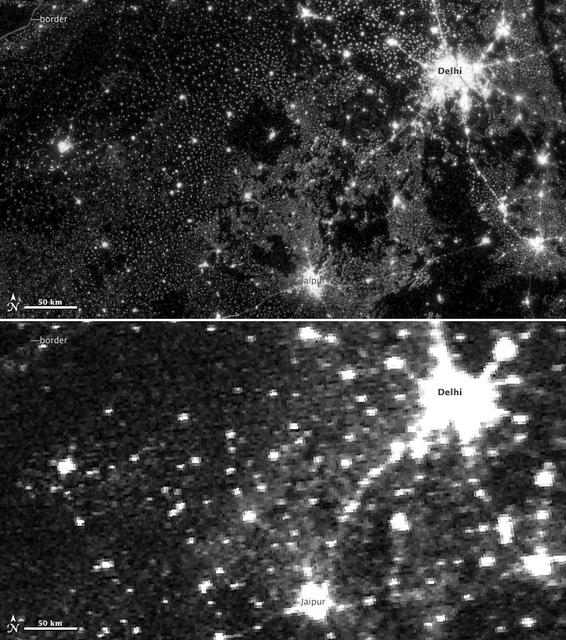
NASA image acquired November 11-12, 2012. On November 12, 2012, the Visible Infrared Imaging Radiometer Suite (VIIRS) on the Suomi NPP satellite captured the top nighttime image of city, village, and highway lights near Delhi, India. For comparison, the lower image shows the same area one night earlier, as observed by the Operational Line Scan (OLS) system on a Defense Meteorological Satellite Program (DMSP) spacecraft. Since the 1960s, the U.S. Air Force has operated DMSP in order to observe clouds and other weather variables in key wavelengths of infrared and visible light. Since 1972, the DMSP satellites have included the Operational Linescan System (OLS), which gives weather forecasters some ability to see in the dark. It has been a highly successful sensor, but it is dependent on older technology with lower resolution than most scientists would like. And for many years, DMSP data were classified. Through improved optics and “smart” sensing technology, the VIIRS “day-night band,” is ten to fifteen times better than the OLS system at resolving the relatively dim lights of human settlements and reflected moonlight. Each VIIRS pixel shows roughly 740 meters (0.46 miles) across, compared to the 3-kilometer footprint (1.86 miles) of DMSP. Beyond the resolution, the new sensor can detect dimmer light sources. And since the VIIRS measurements are fully calibrated (unlike DMSP), scientists now have the precision required to make quantitative measurements of clouds and other features. “In contrast to the Operational Line Scan system, the imagery from the new day-night band is almost like a nearsighted person putting on glasses for the first time and looking at the Earth anew,” says Steve Miller, an atmospheric scientist at Colorado State University. “VIIRS has allowed us to bring this coarse, blurry view of night lights into clearer focus. Now we can see things in such great detail and at such high precision that we’re really talking about a new kind of measurement.” Unlike a film camera that captures a photograph in one exposure, VIIRS produces an image by repeatedly scanning a scene and resolving it as millions of individual picture elements, or pixels. The day-night band goes a step further, determining on-the-fly whether to use its low, medium, or high-gain mode. If a pixel is very bright, a low-gain mode on the sensor prevents the pixel from over-saturating. If the pixel is dark, the signal will be amplified. “On a hand-held camera, there’s a nighttime setting where the shutter will stay open much longer than it would under daylight imaging conditions,” says Chris Elvidge, who leads the Earth Observation Group at NOAA’s National Geophysical Data Center. “The day-night band is similar. It increases the exposure time—the amount of time that it’s collecting photons for pixels.” NASA Earth Observatory image by Jesse Allen and Robert Simmon, using Suomi NPP VIIRS and DMSP OLS data provided courtesy of Chris Elvidge (NOAA National Geophysical Data Center). Suomi NPP is the result of a partnership between NASA, NOAA, and the Department of Defense. Caption by Mike Carlowicz. Instrument: Suomi NPP - VIIRS Credit: <b><a href="http://www.earthobservatory.nasa.gov/" rel="nofollow"> NASA Earth Observatory</a></b> <b>Click here to view all of the <a href="http://earthobservatory.nasa.gov/Features/NightLights/" rel="nofollow"> Earth at Night 2012 images </a></b> <b>Click here to <a href="http://earthobservatory.nasa.gov/NaturalHazards/view.php?id=79846" rel="nofollow"> read more </a> about this image </b> <b><a href="http://www.nasa.gov/audience/formedia/features/MP_Photo_Guidelines.html" rel="nofollow">NASA image use policy.</a></b> <b><a href="http://www.nasa.gov/centers/goddard/home/index.html" rel="nofollow">NASA Goddard Space Flight Center</a></b> enables NASA’s mission through four scientific endeavors: Earth Science, Heliophysics, Solar System Exploration, and Astrophysics. Goddard plays a leading role in NASA’s accomplishments by contributing compelling scientific