
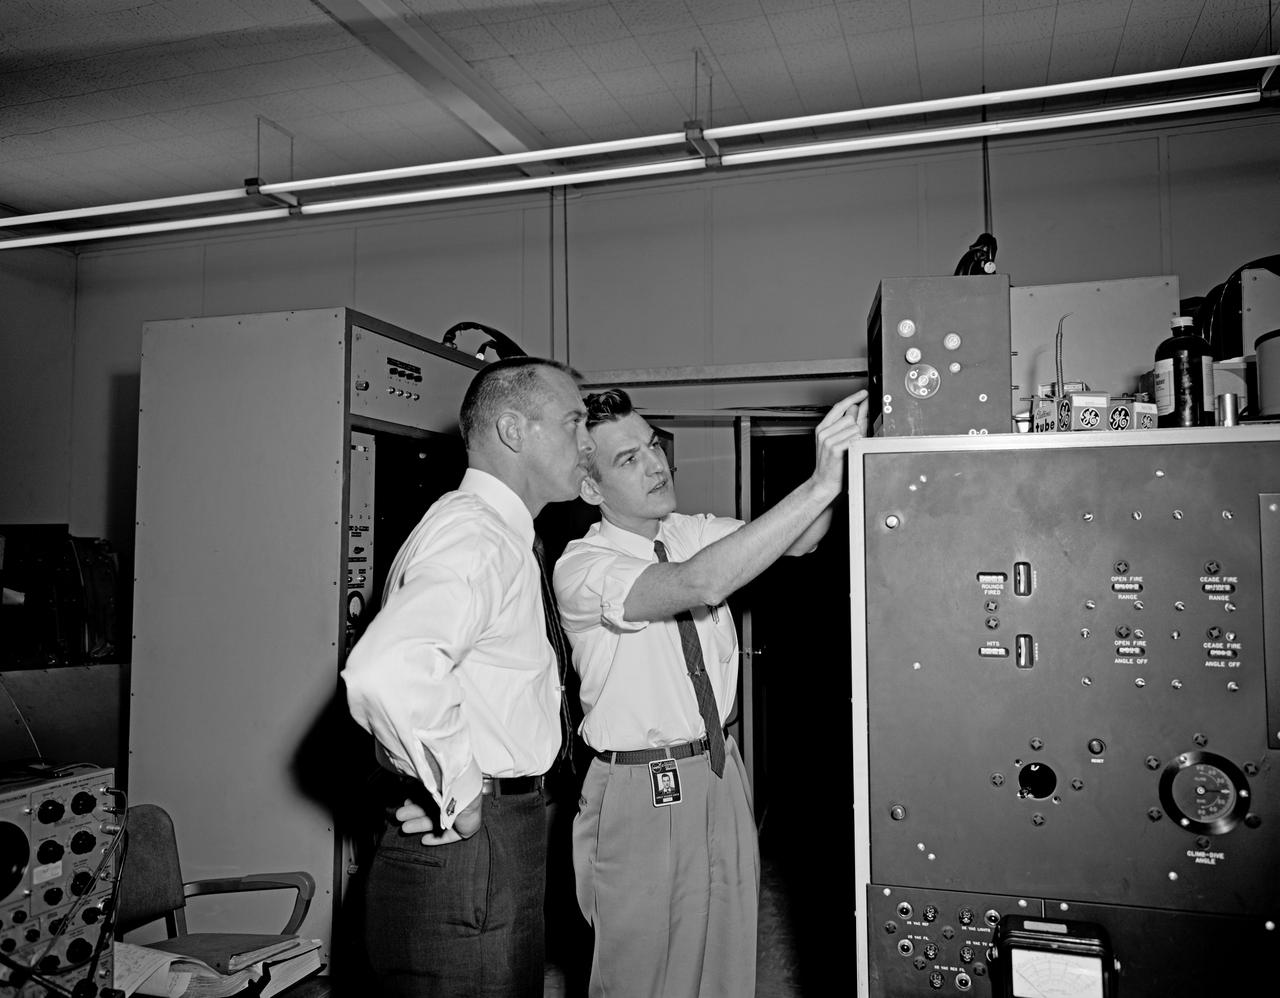
This 1970 photograph shows Skylab's Time and Motion experiment (M151) control unit, a medical study to measure performance differences between tasks undertaken on Earth and the same tasks performed by Skylab crew members in orbit. Data collected from this experiment evaluated crew members' zero-gravity behavior for designs and work programs for future space exploration. The Marshall Space Flight Center had program management responsibility for the development of Skylab hardware and experiments.
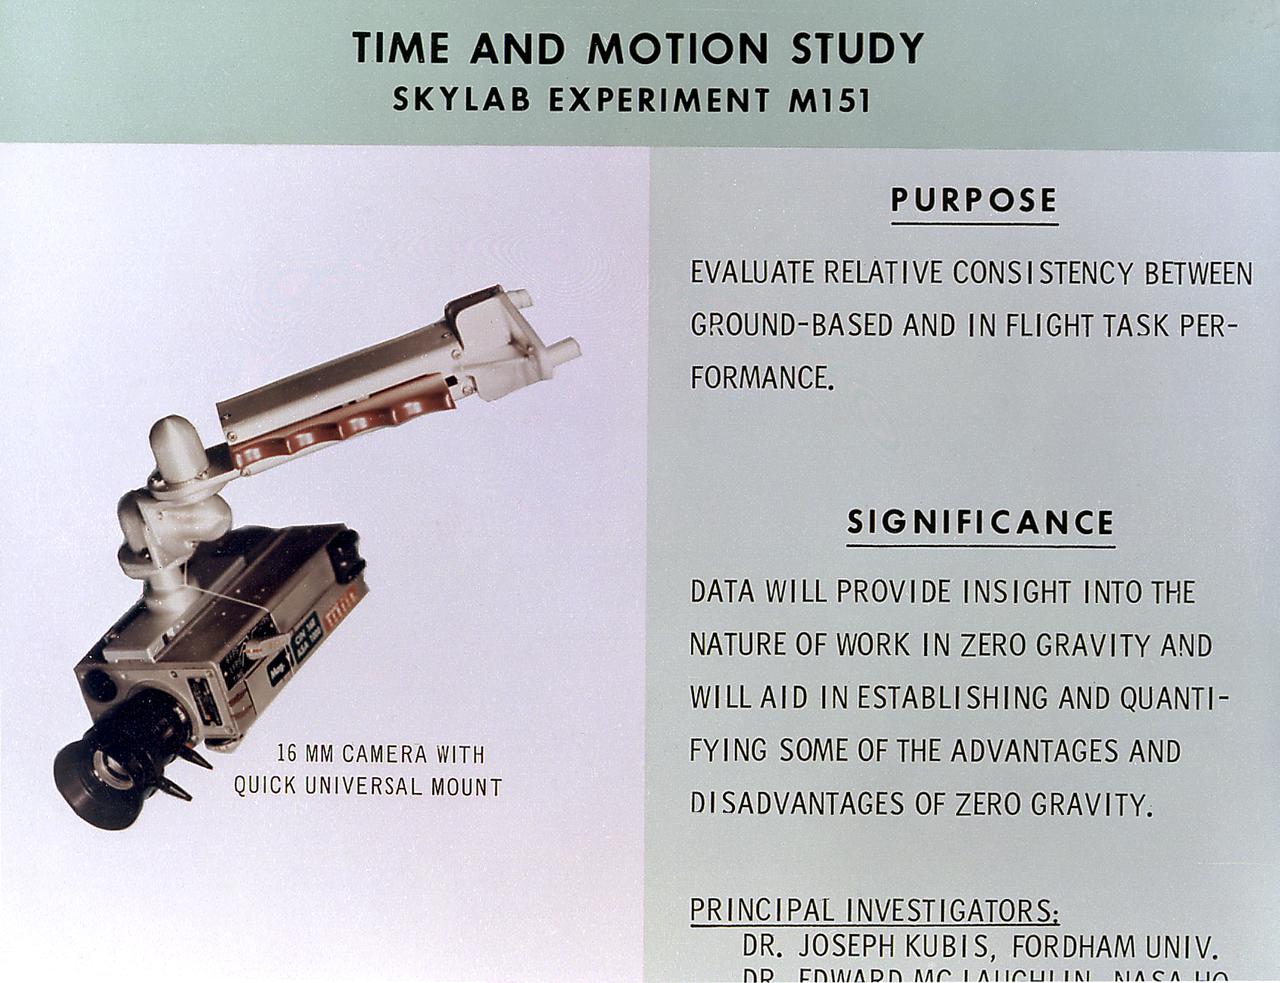
This chart details Skylab's Time and Motion experiment (M151), a medical study to measure performance differences between tasks undertaken on Earth and the same tasks performed by Skylab crew members in orbit. Data collected from this experiment evaluated crew members' zero-gravity behavior for designs and work programs for future space exploration. The Marshall Space Flight Center had program management responsibility for the development of Skylab hardware and experiments.
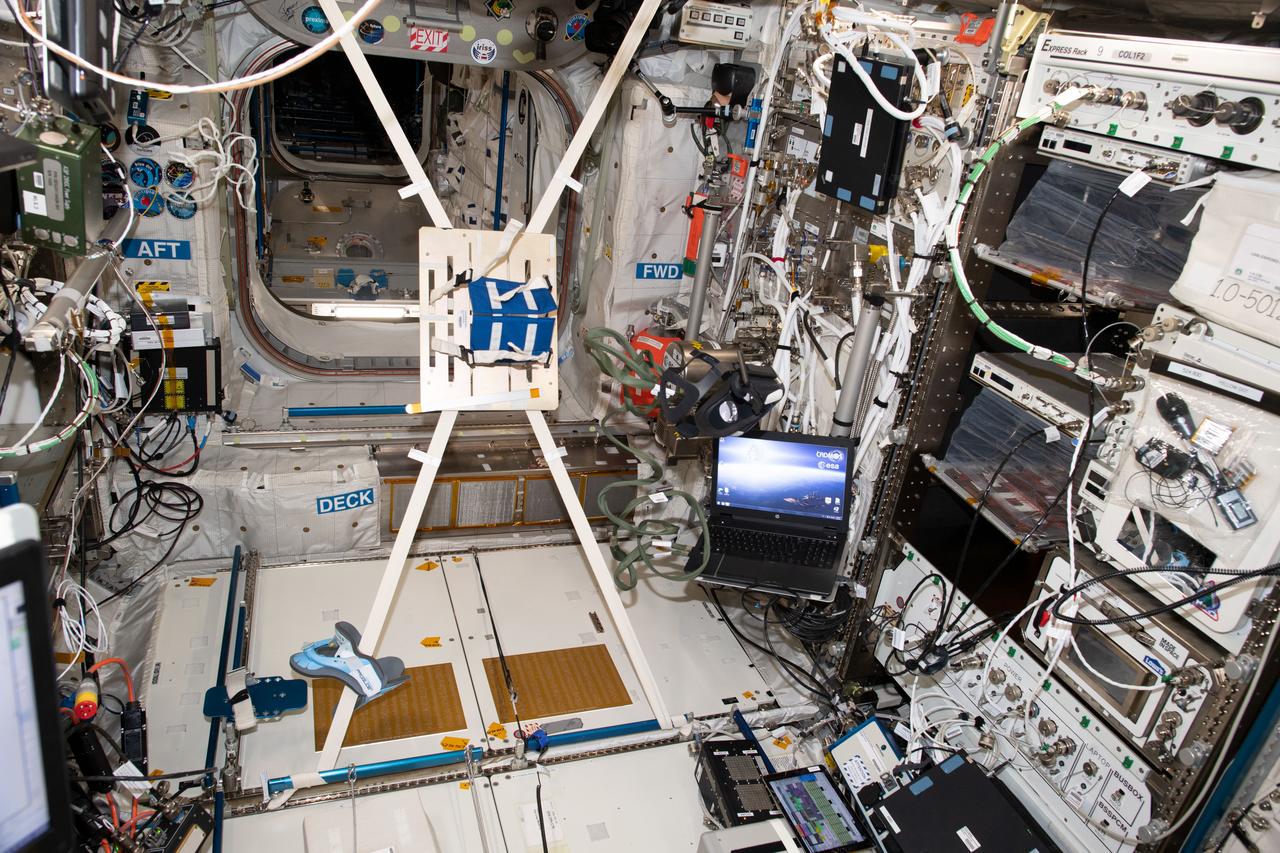
iss060e014594 (7/25/2019) ---Photo documentation during the preparation for the VECTION experiment in the Columbus module aboard the International Space Station (ISS). The objective of The Effect of Long Duration Hypogravity on the Perception of Self-Motion (VECTION) study is to determine to what extent an astronaut's ability to visually interpret motion, orientation, and distance may be disrupted in a microgravity environment, and how it may adapt, and how it may be changed upon return to Earth. Multiple experimental time points inflight and upon return to Earth allows for the adaptation and recovery process to be investigated.
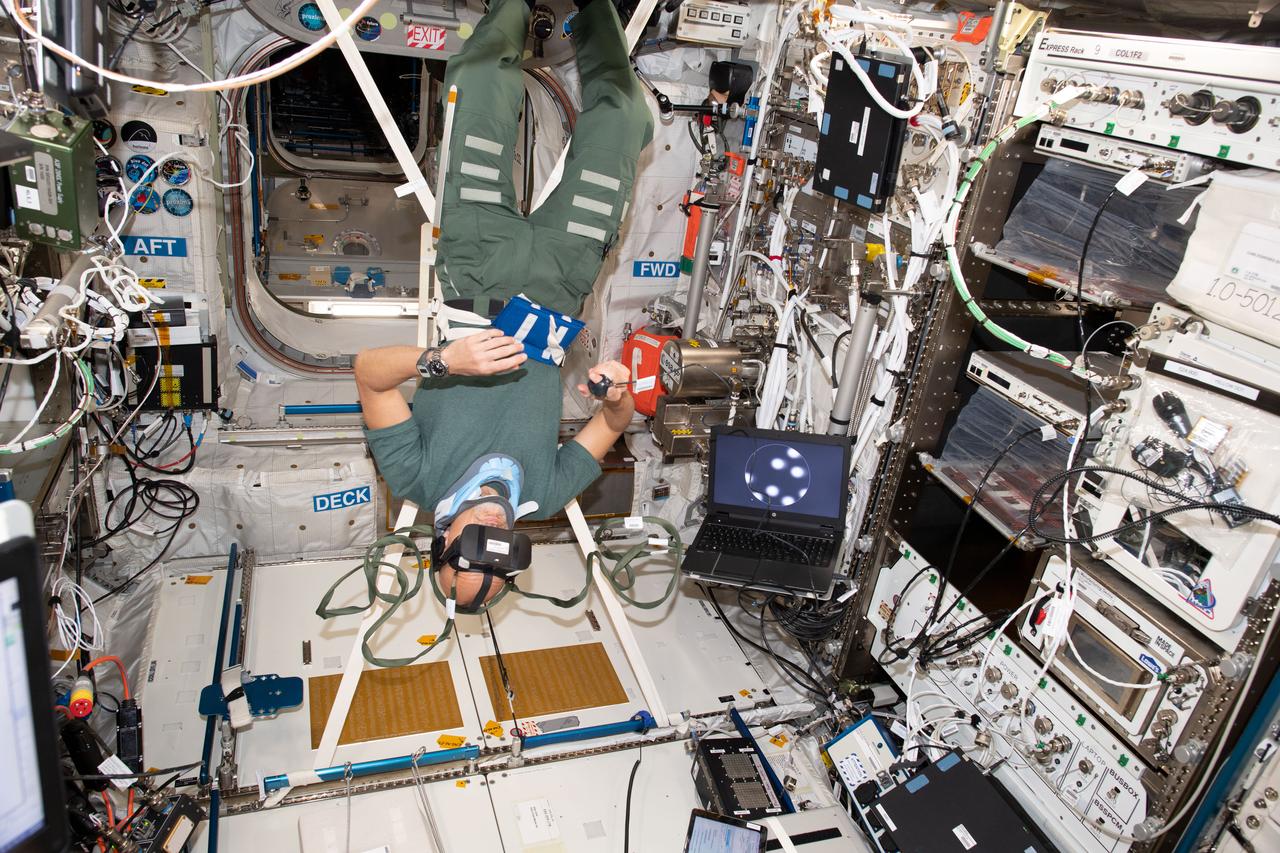
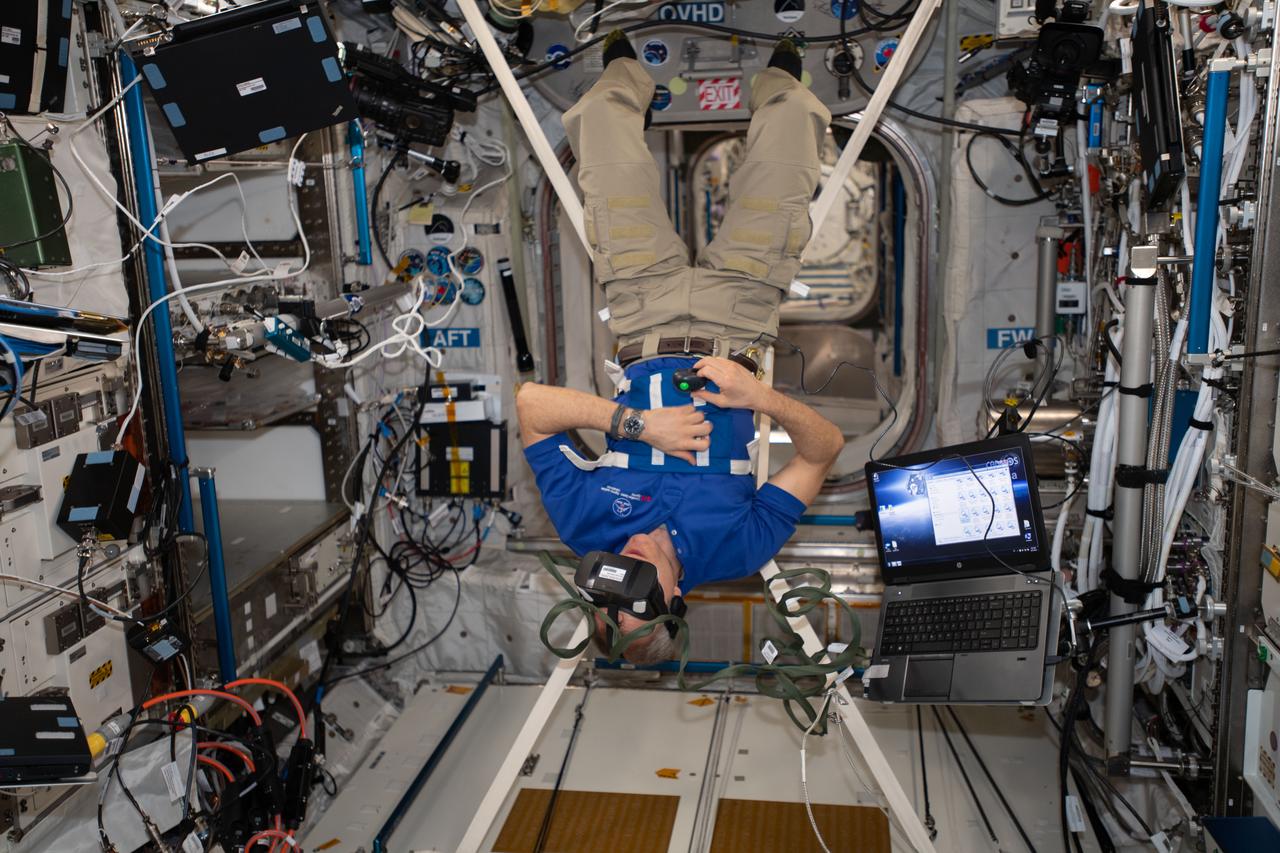
iss060e014613 (7/25/2019) --- European Space Agency (ESA) astronaut Luca Parmintano is shown in the Columbus module aboard the International Space Station (ISS) during the Vection experiment. The objective of The Effect of Long Duration Hypogravity on the Perception of Self-Motion (VECTION) study is to determine to what extent an astronaut's ability to visually interpret motion, orientation, and distance may be disrupted in a microgravity environment, and how it may adapt, and how it may be changed upon return to Earth. Multiple experimental time points inflight and upon return to Earth allows for the adaptation and recovery process to be investigated.
iss058e026479 (2/27/2019) --- NASA astronaut Anne McClain is shown in the Columbus module aboard the International Space Station (ISS) during the Vection experiment. The objective of The Effect of Long Duration Hypogravity on the Perception of Self-Motion (VECTION) study is to determine to what extent an astronaut's ability to visually interpret motion, orientation, and distance may be disrupted in a microgravity environment, and how it may adapt, and how it may be changed upon return to Earth. Multiple experimental time points inflight and upon return to Earth allows for the adaptation and recovery process to be investigated.
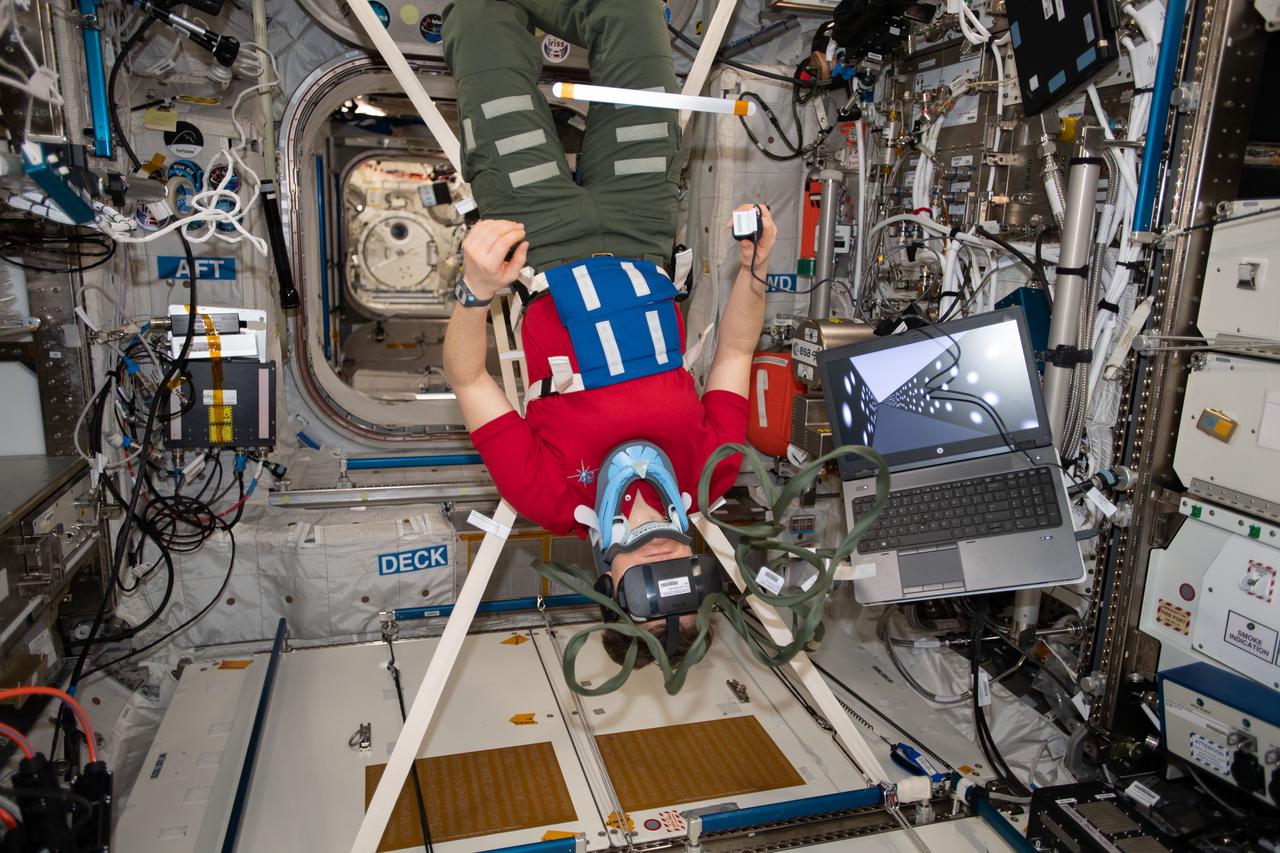
iss058e026473 (2/27/2019) --- Canadian Space Agency (CSA) astronaut David Saint-Jacques is shown in the Columbus module aboard the International Space Station (ISS) during the Vection experiment. The objective of The Effect of Long Duration Hypogravity on the Perception of Self-Motion (VECTION) study is to determine to what extent an astronaut's ability to visually interpret motion, orientation, and distance may be disrupted in a microgravity environment, and how it may adapt, and how it may be changed upon return to Earth. Multiple experimental time points inflight and upon return to Earth allows for the adaptation and recovery process to be investigated.
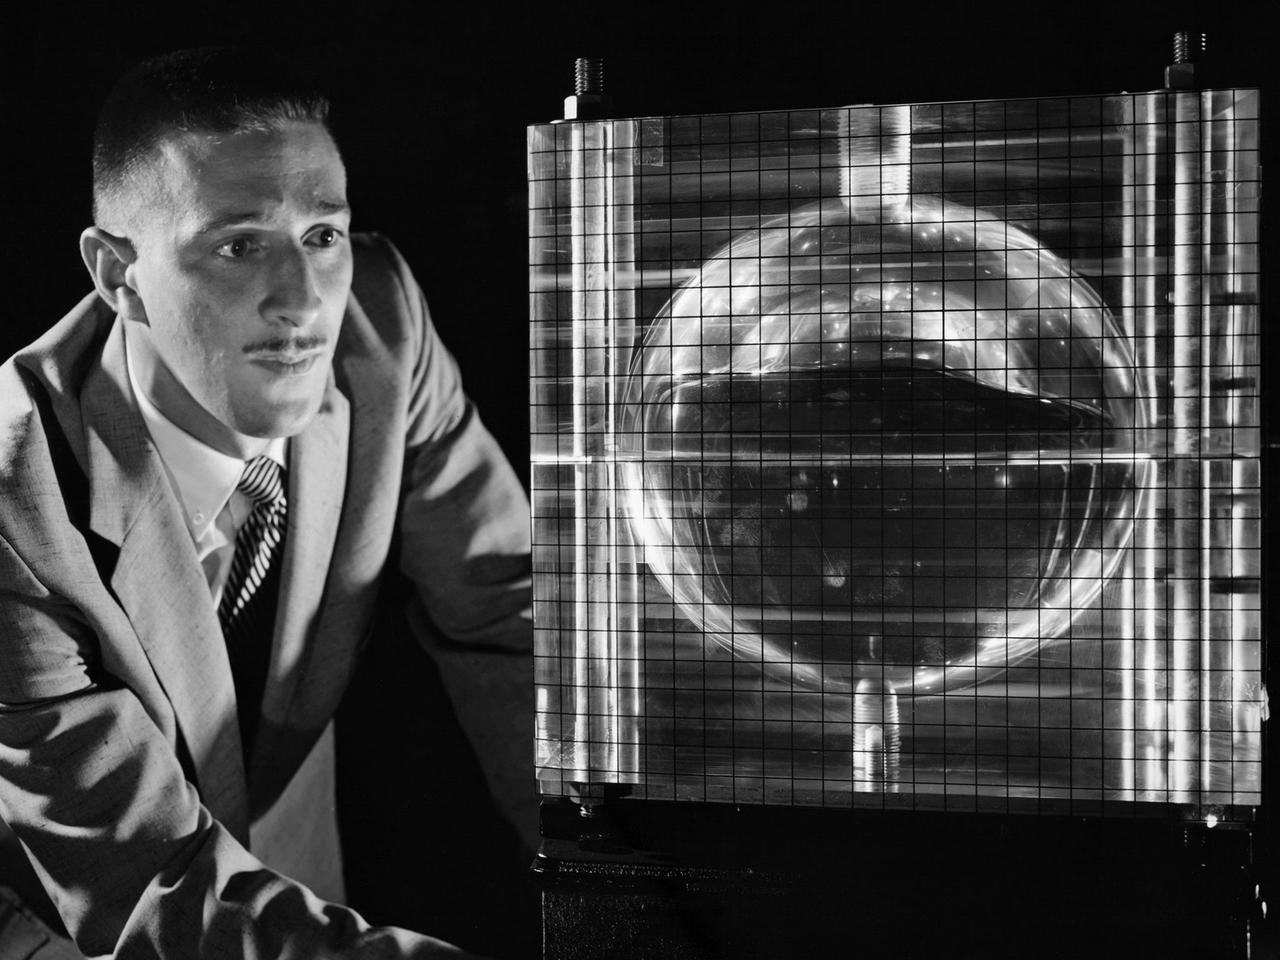
Andy Stofan views a small-scale tank built to study the sloshing characteristics of liquid hydrogen at the National Aeronautics and Space Administration (NASA) Lewis Research Center. Stofan was tasked with the study of propellant motion, or sloshing, in space vehicle propellant tanks. At the time, there was little knowledge of the behavior of fluids in microgravity or the effects of the launch on the propellant’s motion. Sloshing in the tank could alter a spacecraft’s trajectory or move the propellant away from the turbopump. Stofan became an expert and authored numerous technical reports on the subject. Stofan was assigned to the original Centaur Project Office in 1962 as a member of the Propellant Systems Section. Stofan was instrumental in solving a dynamic instability problem on the Centaur vehicle and served as the systems engineer for the development of the Centaur propellant utilization system. The solution was also applied to the upper-stages of Saturn. In 1966, Stofan was named Head of the Propellant Systems Section. Stofan continued rising through the managerial ranks at Lewis. In 1967 he became Project Manager of a test program that successfully demonstrated the use of a pressurization system for the Centaur vehicle; in 1969 the Assistant Project Manager on the Improved Centaur project; in 1970 Manager of the Titan/Centaur Project Office; in 1974 Director of the Launch Vehicles Division. In 1978, Stofan was appointed Deputy Associate Administrator for the Headquarters Office of Space Science. In 1982, he was named Director of Lewis Research Center.
![Astronaut Charles Conrad at the controls of the Visual Docking Simulator. From A.W. Vogeley, "Piloted Space-Flight Simulation at Langley Research Center," paper presented at the American Society of Mechanical Engineers 1966 Winter Meeting, New York, NY, November 27-December 1, 1966. "This facility was [later known as the Visual-Optical Simulator.] It presents to the pilot an out-the-window view of his target in correct 6 degrees of freedom motion. The scene is obtained by a television camera pick-up viewing a small-scale gimbaled model of the target." "For docking studies, the docking target picture was projected onto the surface of a 20-foot-diameter sphere and the pilot could, effectively, maneuver into contract. this facility was used in a comparison study with the Rendezvous Docking Simulator - one of the few comparison experiments in which conditions were carefully controlled and a reasonable sample of pilots used. All pilots preferred the more realistic RDS visual scene. The pilots generally liked the RDS angular motion cues although some objected to the false gravity cues that these motions introduced. Training time was shorter on the RDS, but final performance on both simulators was essentially equal. " "For station-keeping studies, since close approach is not required, the target was presented to the pilot through a virtual-image system which projects his view to infinity, providing a more realistic effect. In addition to the target, the system also projects a star and horizon background. "](https://images-assets.nasa.gov/image/LRC-1963-B701_P-09519/LRC-1963-B701_P-09519~medium.jpg)
Astronaut Charles Conrad at the controls of the Visual Docking Simulator. From A.W. Vogeley, "Piloted Space-Flight Simulation at Langley Research Center," paper presented at the American Society of Mechanical Engineers 1966 Winter Meeting, New York, NY, November 27-December 1, 1966. "This facility was [later known as the Visual-Optical Simulator.] It presents to the pilot an out-the-window view of his target in correct 6 degrees of freedom motion. The scene is obtained by a television camera pick-up viewing a small-scale gimbaled model of the target." "For docking studies, the docking target picture was projected onto the surface of a 20-foot-diameter sphere and the pilot could, effectively, maneuver into contract. this facility was used in a comparison study with the Rendezvous Docking Simulator - one of the few comparison experiments in which conditions were carefully controlled and a reasonable sample of pilots used. All pilots preferred the more realistic RDS visual scene. The pilots generally liked the RDS angular motion cues although some objected to the false gravity cues that these motions introduced. Training time was shorter on the RDS, but final performance on both simulators was essentially equal. " "For station-keeping studies, since close approach is not required, the target was presented to the pilot through a virtual-image system which projects his view to infinity, providing a more realistic effect. In addition to the target, the system also projects a star and horizon background. "
Walter (Wally) M. Schirra in Visual Docking Simulator From A.W. Vogeley, "Piloted Space-Flight Simulation at Langley Research Center," Paper presented at the American Society of Mechanical Engineers 1966 Winter Meeting, New York, NY, November 27-December 1, 1966. "This facility was [later known as the Visual-Optical Simulator. It presents to the pilot an out-the-window view of his target in correct 6 degrees of freedom motion. The scene is obtained by a television camera pick-up viewing a small-scale gimbaled model of the target. "For docking studies, the docking target picture was projected onto the surface of a 20-foot-diameter sphere and the pilot could, effectively, maneuver into contract. this facility was used in a comparison study with the Rendezvous Docking Simulator - one of the few comparison experiments in which conditions were carefully controlled and a reasonable sample of pilots used. All pilots preferred the more realistic RDS visual scene. The pilots generally liked the RDS angular motion cues although some objected to the false gravity cues that these motions introduced. Training time was shorter on the RDS, but final performance on both simulators was essentially equal. " "For station-keeping studies, since close approach is not required, the target was presented to the pilot through a virtual-image system which projects his view to infinity, providing a more realistic effect. In addition to the target, the system also projects a star and horizon background. "
![Astronauts Charles Conrad (left) and John W. Young (right) at the controls of the Visual Docking Simulator. From A.W. Vogeley, "Piloted Space-Flight Simulation at Langley Research Center," Paper presented at the American Society of Mechanical Engineers 1966 Winter Meeting, New York, NY, November 27-December 1, 1966. "This facility was [later known as the Visual-Optical Simulator.] It presents to the pilot an out-the-window view of his target in correct 6 degrees of freedom motion. The scene is obtained by a television camera pick-up viewing a small-scale gimbaled model of the target." "For docking studies, the docking target picture was projected onto the surface of a 20-foot-diameter sphere and the pilot could, effectively, maneuver into contract. this facility was used in a comparison study with the Rendezvous Docking Simulator - one of the few comparison experiments in which conditions were carefully controlled and a reasonable sample of pilots used. All pilots preferred the more realistic RDS visual scene. The pilots generally liked the RDS angular motion cues although some objected to the false gravity cues that these motions introduced. Training time was shorter on the RDS, but final performance on both simulators was essentially equal. " "For station-keeping studies, since close approach is not required, the target was presented to the pilot through a virtual-image system which projects his view to infinity, providing a more realistic effect. In addition to the target, the system also projects a star and horizon background. "](https://images-assets.nasa.gov/image/LRC-1963-B701_P-09520/LRC-1963-B701_P-09520~medium.jpg)
Astronauts Charles Conrad (left) and John W. Young (right) at the controls of the Visual Docking Simulator. From A.W. Vogeley, "Piloted Space-Flight Simulation at Langley Research Center," Paper presented at the American Society of Mechanical Engineers 1966 Winter Meeting, New York, NY, November 27-December 1, 1966. "This facility was [later known as the Visual-Optical Simulator.] It presents to the pilot an out-the-window view of his target in correct 6 degrees of freedom motion. The scene is obtained by a television camera pick-up viewing a small-scale gimbaled model of the target." "For docking studies, the docking target picture was projected onto the surface of a 20-foot-diameter sphere and the pilot could, effectively, maneuver into contract. this facility was used in a comparison study with the Rendezvous Docking Simulator - one of the few comparison experiments in which conditions were carefully controlled and a reasonable sample of pilots used. All pilots preferred the more realistic RDS visual scene. The pilots generally liked the RDS angular motion cues although some objected to the false gravity cues that these motions introduced. Training time was shorter on the RDS, but final performance on both simulators was essentially equal. " "For station-keeping studies, since close approach is not required, the target was presented to the pilot through a virtual-image system which projects his view to infinity, providing a more realistic effect. In addition to the target, the system also projects a star and horizon background. "
![Astronaut James Lovell at the controls of the Visual Docking Simulator. From A.W. Vogeley, "Piloted Space-Flight Simulation at Langley Research Center," Paper presented at the American Society of Mechanical Engineers 1966 Winter Meeting, New York, NY, November 27-December 1, 1966. "This facility was [later known as the Visual-Optical Simulator.] It presents to the pilot an out-the-window view of his target in correct 6 degrees of freedom motion. The scene is obtained by a television camera pick-up viewing a small-scale gimbaled model of the target." "For docking studies, the docking target picture was projected onto the surface of a 20-foot-diameter sphere and the pilot could, effectively, maneuver into contract. this facility was used in a comparison study with the Rendezvous Docking Simulator - one of the few comparison experiments in which conditions were carefully controlled and a reasonable sample of pilots used. All pilots preferred the more realistic RDS visual scene. The pilots generally liked the RDS angular motion cues although some objected to the false gravity cues that these motions introduced. Training time was shorter on the RDS, but final performance on both simulators was essentially equal. " "For station-keeping studies, since close approach is not required, the target was presented to the pilot through a virtual-image system which projects his view to infinity, providing a more realistic effect. In addition to the target, the system also projects a star and horizon background. "](https://images-assets.nasa.gov/image/LRC-1963-B701_P-09093/LRC-1963-B701_P-09093~medium.jpg)
Astronaut James Lovell at the controls of the Visual Docking Simulator. From A.W. Vogeley, "Piloted Space-Flight Simulation at Langley Research Center," Paper presented at the American Society of Mechanical Engineers 1966 Winter Meeting, New York, NY, November 27-December 1, 1966. "This facility was [later known as the Visual-Optical Simulator.] It presents to the pilot an out-the-window view of his target in correct 6 degrees of freedom motion. The scene is obtained by a television camera pick-up viewing a small-scale gimbaled model of the target." "For docking studies, the docking target picture was projected onto the surface of a 20-foot-diameter sphere and the pilot could, effectively, maneuver into contract. this facility was used in a comparison study with the Rendezvous Docking Simulator - one of the few comparison experiments in which conditions were carefully controlled and a reasonable sample of pilots used. All pilots preferred the more realistic RDS visual scene. The pilots generally liked the RDS angular motion cues although some objected to the false gravity cues that these motions introduced. Training time was shorter on the RDS, but final performance on both simulators was essentially equal. " "For station-keeping studies, since close approach is not required, the target was presented to the pilot through a virtual-image system which projects his view to infinity, providing a more realistic effect. In addition to the target, the system also projects a star and horizon background. "
![Astronaut James Lovell at the controls of the Visual Docking Simulator. From A.W. Vogeley, "Piloted Space-Flight Simulation at Langley Research Center," Paper presented at the American Society of Mechanical Engineers 1966 Winter Meeting, New York, NY, November 27-December 1, 1966. "This facility was [later known as the Visual-Optical Simulator.] It presents to the pilot an out-the-window view of his target in correct 6 degrees of freedom motion. The scene is obtained by a television camera pick-up viewing a small-scale gimbaled model of the target." "For docking studies, the docking target picture was projected onto the surface of a 20-foot-diameter sphere and the pilot could, effectively, maneuver into contract. this facility was used in a comparison study with the Rendezvous Docking Simulator - one of the few comparison experiments in which conditions were carefully controlled and a reasonable sample of pilots used. All pilots preferred the more realistic RDS visual scene. The pilots generally liked the RDS angular motion cues although some objected to the false gravity cues that these motions introduced. Training time was shorter on the RDS, but final performance on both simulators was essentially equal. " "For station-keeping studies, since close approach is not required, the target was presented to the pilot through a virtual-image system which projects his view to infinity, providing a more realistic effect. In addition to the target, the system also projects a star and horizon background. "](https://images-assets.nasa.gov/image/LRC-1963-B701_P-09094/LRC-1963-B701_P-09094~medium.jpg)
Astronaut James Lovell at the controls of the Visual Docking Simulator. From A.W. Vogeley, "Piloted Space-Flight Simulation at Langley Research Center," Paper presented at the American Society of Mechanical Engineers 1966 Winter Meeting, New York, NY, November 27-December 1, 1966. "This facility was [later known as the Visual-Optical Simulator.] It presents to the pilot an out-the-window view of his target in correct 6 degrees of freedom motion. The scene is obtained by a television camera pick-up viewing a small-scale gimbaled model of the target." "For docking studies, the docking target picture was projected onto the surface of a 20-foot-diameter sphere and the pilot could, effectively, maneuver into contract. this facility was used in a comparison study with the Rendezvous Docking Simulator - one of the few comparison experiments in which conditions were carefully controlled and a reasonable sample of pilots used. All pilots preferred the more realistic RDS visual scene. The pilots generally liked the RDS angular motion cues although some objected to the false gravity cues that these motions introduced. Training time was shorter on the RDS, but final performance on both simulators was essentially equal. " "For station-keeping studies, since close approach is not required, the target was presented to the pilot through a virtual-image system which projects his view to infinity, providing a more realistic effect. In addition to the target, the system also projects a star and horizon background. "
![Astronaut Virgil "Gus" Grissom at the controls of the Visual Docking Simulator. From A.W. Vogeley, "Piloted Space-Flight Simulation at Langley Research Center," Paper presented at the American Society of Mechanical Engineers 1966 Winter Meeting, New York, NY, November 27-December 1, 1966. "This facility was [later known as the Visual-Optical Simulator.] It presents to the pilot an out-the-window view of his target in correct 6 degrees of freedom motion. The scene is obtained by a television camera pick-up viewing a small-scale gimbaled model of the target." "For docking studies, the docking target picture was projected onto the surface of a 20-foot-diameter sphere and the pilot could, effectively, maneuver into contract. this facility was used in a comparison study with the Rendezvous Docking Simulator - one of the few comparison experiments in which conditions were carefully controlled and a reasonable sample of pilots used. All pilots preferred the more realistic RDS visual scene. The pilots generally liked the RDS angular motion cues although some objected to the false gravity cues that these motions introduced. Training time was shorter on the RDS, but final performance on both simulators was essentially equal. " "For station-keeping studies, since close approach is not required, the target was presented to the pilot through a virtual-image system which projects his view to infinity, providing a more realistic effect. In addition to the target, the system also projects a star and horizon background. "](https://images-assets.nasa.gov/image/LRC-1963-B701_P-01515/LRC-1963-B701_P-01515~medium.jpg)
Astronaut Virgil "Gus" Grissom at the controls of the Visual Docking Simulator. From A.W. Vogeley, "Piloted Space-Flight Simulation at Langley Research Center," Paper presented at the American Society of Mechanical Engineers 1966 Winter Meeting, New York, NY, November 27-December 1, 1966. "This facility was [later known as the Visual-Optical Simulator.] It presents to the pilot an out-the-window view of his target in correct 6 degrees of freedom motion. The scene is obtained by a television camera pick-up viewing a small-scale gimbaled model of the target." "For docking studies, the docking target picture was projected onto the surface of a 20-foot-diameter sphere and the pilot could, effectively, maneuver into contract. this facility was used in a comparison study with the Rendezvous Docking Simulator - one of the few comparison experiments in which conditions were carefully controlled and a reasonable sample of pilots used. All pilots preferred the more realistic RDS visual scene. The pilots generally liked the RDS angular motion cues although some objected to the false gravity cues that these motions introduced. Training time was shorter on the RDS, but final performance on both simulators was essentially equal. " "For station-keeping studies, since close approach is not required, the target was presented to the pilot through a virtual-image system which projects his view to infinity, providing a more realistic effect. In addition to the target, the system also projects a star and horizon background. "

The diagram – based on data used in a July 2024 NASA-funded study – shows polar motion, a phenomenon that results from the combined action of several physical processes that broadly shift the distribution of mass around the globe or create forces in its mantle and core that cause the planet to wobble as it rotates. These changes cause the spin axis to meander over time. The blue line starts at the position of the spin axis near the North Pole in 1900, the first year polar motion data was collected, and tracks it until 2023. The spin axis now sits about 30 feet (10 meters) from where it was in 1900, in the direction of Canada's Baffin Bay. Around 2000, the axis took a sudden eastward turn, which researchers at NASA's Jet Propulsion Laboratory in Southern California in a 2016 study attributed to faster melting of the Greenland and Antarctic ice sheets and groundwater depletion in Eurasia. Surendra Adhikari, a JPL geophysicist who co-authored that study, used measurements from the International Earth Rotation and Reference Systems Service to create the animation. Adhikari and collaborators from Switzerland, Canada, and Germany found in a July 2024 paper in Nature Geoscience that about 90% of repeated oscillations in polar motion between 1900 and 2018 could be explained by large-scale mass redistribution at Earth's surface due to the melting of ice sheets and glaciers and the depletion of aquifers. It also found that nearly all of the long-term, non-repeating drift of the axis was due to dynamics in the mantle. Animation available at https://photojournal.jpl.nasa.gov/catalog/PIA26120
![Astronaut Virgil "Gus" Grissom at the controls of the Visual Docking Simulator. From A.W. Vogeley, "Piloted Space-Flight Simulation at Langley Research Center," Paper presented at the American Society of Mechanical Engineers 1966 Winter Meeting, New York, NY, November 27-December 1, 1966. "This facility was [later known as the Visual-Optical Simulator.] It presents to the pilot an out-the-window view of his target in correct 6 degrees of freedom motion. The scene is obtained by a television camera pick-up viewing a small-scale gimbaled model of the target." "For docking studies, the docking target picture was projected onto the surface of a 20-foot-diameter sphere and the pilot could, effectively, maneuver into contract. this facility was used in a comparison study with the Rendezvous Docking Simulator - one of the few comparison experiments in which conditions were carefully controlled and a reasonable sample of pilots used. All pilots preferred the more realistic RDS visual scene. The pilots generally liked the RDS angular motion cues although some objected to the false gravity cues that these motions introduced. Training time was shorter on the RDS, but final performance on both simulators was essentially equal. " "For station-keeping studies, since close approach is not required, the target was presented to the pilot through a virtual-image system which projects his view to infinity, providing a more realistic effect. In addition to the target, the system also projects a star and horizon background. "](https://images-assets.nasa.gov/image/LRC-1963-B701_P-01516/LRC-1963-B701_P-01516~medium.jpg)
Astronaut Virgil "Gus" Grissom at the controls of the Visual Docking Simulator. From A.W. Vogeley, "Piloted Space-Flight Simulation at Langley Research Center," Paper presented at the American Society of Mechanical Engineers 1966 Winter Meeting, New York, NY, November 27-December 1, 1966. "This facility was [later known as the Visual-Optical Simulator.] It presents to the pilot an out-the-window view of his target in correct 6 degrees of freedom motion. The scene is obtained by a television camera pick-up viewing a small-scale gimbaled model of the target." "For docking studies, the docking target picture was projected onto the surface of a 20-foot-diameter sphere and the pilot could, effectively, maneuver into contract. this facility was used in a comparison study with the Rendezvous Docking Simulator - one of the few comparison experiments in which conditions were carefully controlled and a reasonable sample of pilots used. All pilots preferred the more realistic RDS visual scene. The pilots generally liked the RDS angular motion cues although some objected to the false gravity cues that these motions introduced. Training time was shorter on the RDS, but final performance on both simulators was essentially equal. " "For station-keeping studies, since close approach is not required, the target was presented to the pilot through a virtual-image system which projects his view to infinity, providing a more realistic effect. In addition to the target, the system also projects a star and horizon background. "
![Astronaut Frank Borman at the controls of the Visual Docking Simulator. From A.W. Vogeley, "Piloted Space-Flight Simulation at Langley Research Center," Paper presented at the American Society of Mechanical Engineers 1966 Winter Meeting, New York, NY, November 27-December 1, 1966. "This facility was [later known as the Visual-Optical Simulator.] It presents to the pilot an out-the-window view of his target in correct 6 degrees of freedom motion. The scene is obtained by a television camera pick-up viewing a small-scale gimbaled model of the target." "For docking studies, the docking target picture was projected onto the surface of a 20-foot-diameter sphere and the pilot could, effectively, maneuver into contract. this facility was used in a comparison study with the Rendezvous Docking Simulator - one of the few comparison experiments in which conditions were carefully controlled and a reasonable sample of pilots used. All pilots preferred the more realistic RDS visual scene. The pilots generally liked the RDS angular motion cues although some objected to the false gravity cues that these motions introduced. Training time was shorter on the RDS, but final performance on both simulators was essentially equal. " "For station-keeping studies, since close approach is not required, the target was presented to the pilot through a virtual-image system which projects his view to infinity, providing a more realistic effect. In addition to the target, the system also projects a star and horizon background. "](https://images-assets.nasa.gov/image/LRC-1963-B701_P-09368/LRC-1963-B701_P-09368~medium.jpg)
Astronaut Frank Borman at the controls of the Visual Docking Simulator. From A.W. Vogeley, "Piloted Space-Flight Simulation at Langley Research Center," Paper presented at the American Society of Mechanical Engineers 1966 Winter Meeting, New York, NY, November 27-December 1, 1966. "This facility was [later known as the Visual-Optical Simulator.] It presents to the pilot an out-the-window view of his target in correct 6 degrees of freedom motion. The scene is obtained by a television camera pick-up viewing a small-scale gimbaled model of the target." "For docking studies, the docking target picture was projected onto the surface of a 20-foot-diameter sphere and the pilot could, effectively, maneuver into contract. this facility was used in a comparison study with the Rendezvous Docking Simulator - one of the few comparison experiments in which conditions were carefully controlled and a reasonable sample of pilots used. All pilots preferred the more realistic RDS visual scene. The pilots generally liked the RDS angular motion cues although some objected to the false gravity cues that these motions introduced. Training time was shorter on the RDS, but final performance on both simulators was essentially equal. " "For station-keeping studies, since close approach is not required, the target was presented to the pilot through a virtual-image system which projects his view to infinity, providing a more realistic effect. In addition to the target, the system also projects a star and horizon background. "
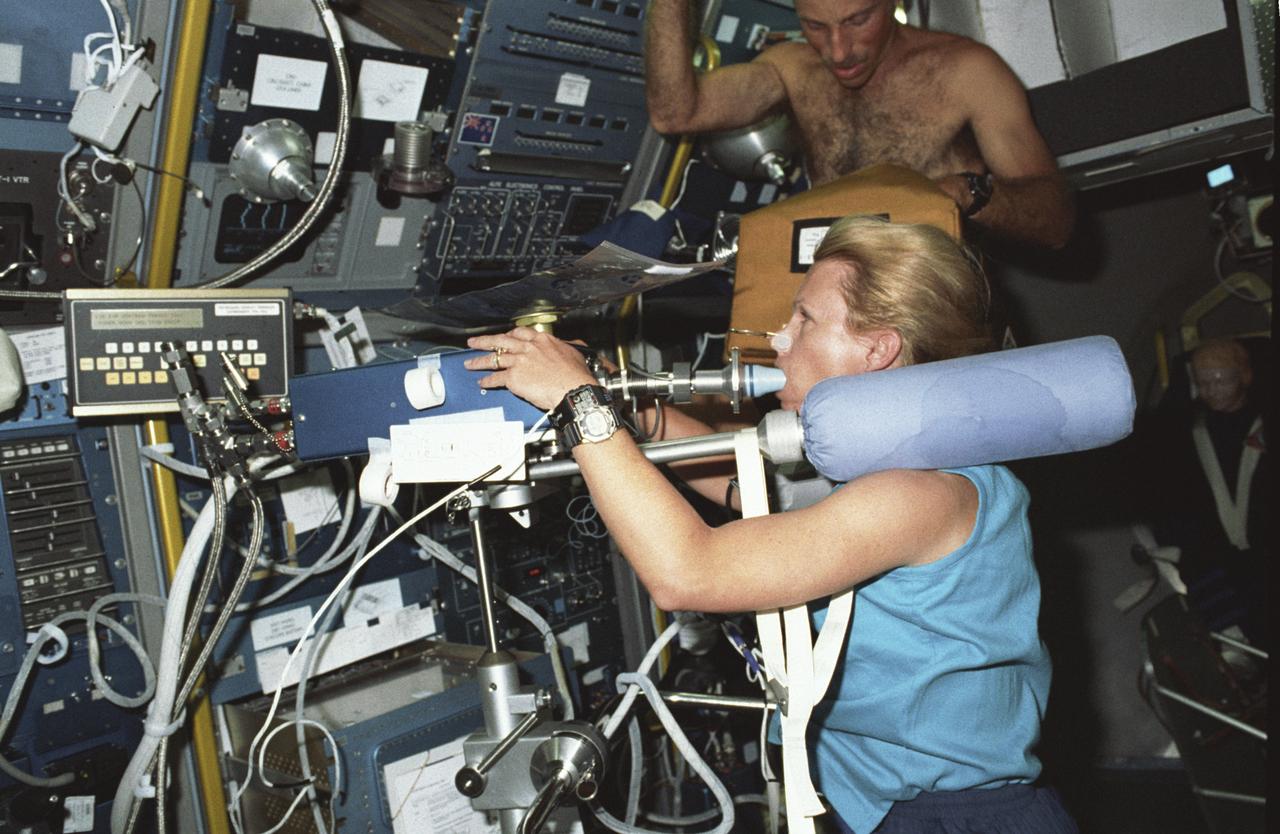
Spacelab Life Science -1 (SLS-1) was the first Spacelab mission dedicated solely to life sciences. The main purpose of the SLS-1 mission was to study the mechanisms, magnitudes, and time courses of certain physiological changes that occur during space flight, to investigate the consequences of the body's adaptation to microgravity and readjustment to Earth's gravity, and bring the benefits back home to Earth. The mission was designed to explore the responses of the heart, lungs, blood vessels, kidneys, and hormone-secreting glands to microgravity and related body fluid shifts; examine the causes of space motion sickness; and study changes in the muscles, bones, and cells. This photograph shows astronaut Rhea Seddon conducting an inflight study of the Cardiovascular Deconditioning experiment by breathing into the cardiovascular rebreathing unit. This experiment focused on the deconditioning of the heart and lungs and changes in cardiopulmonary function that occur upon return to Earth. By using noninvasive techniques of prolonged expiration and rebreathing, investigators can determine the amount of blood pumped out of the heart (cardiac output), the ease with which blood flows through all the vessels (total peripheral resistance), oxygen used and carbon dioxide released by the body, and lung function and volume changes. SLS-1 was launched aboard the Space Shuttle Orbiter Columbia (STS-40) on June 5, 1995.
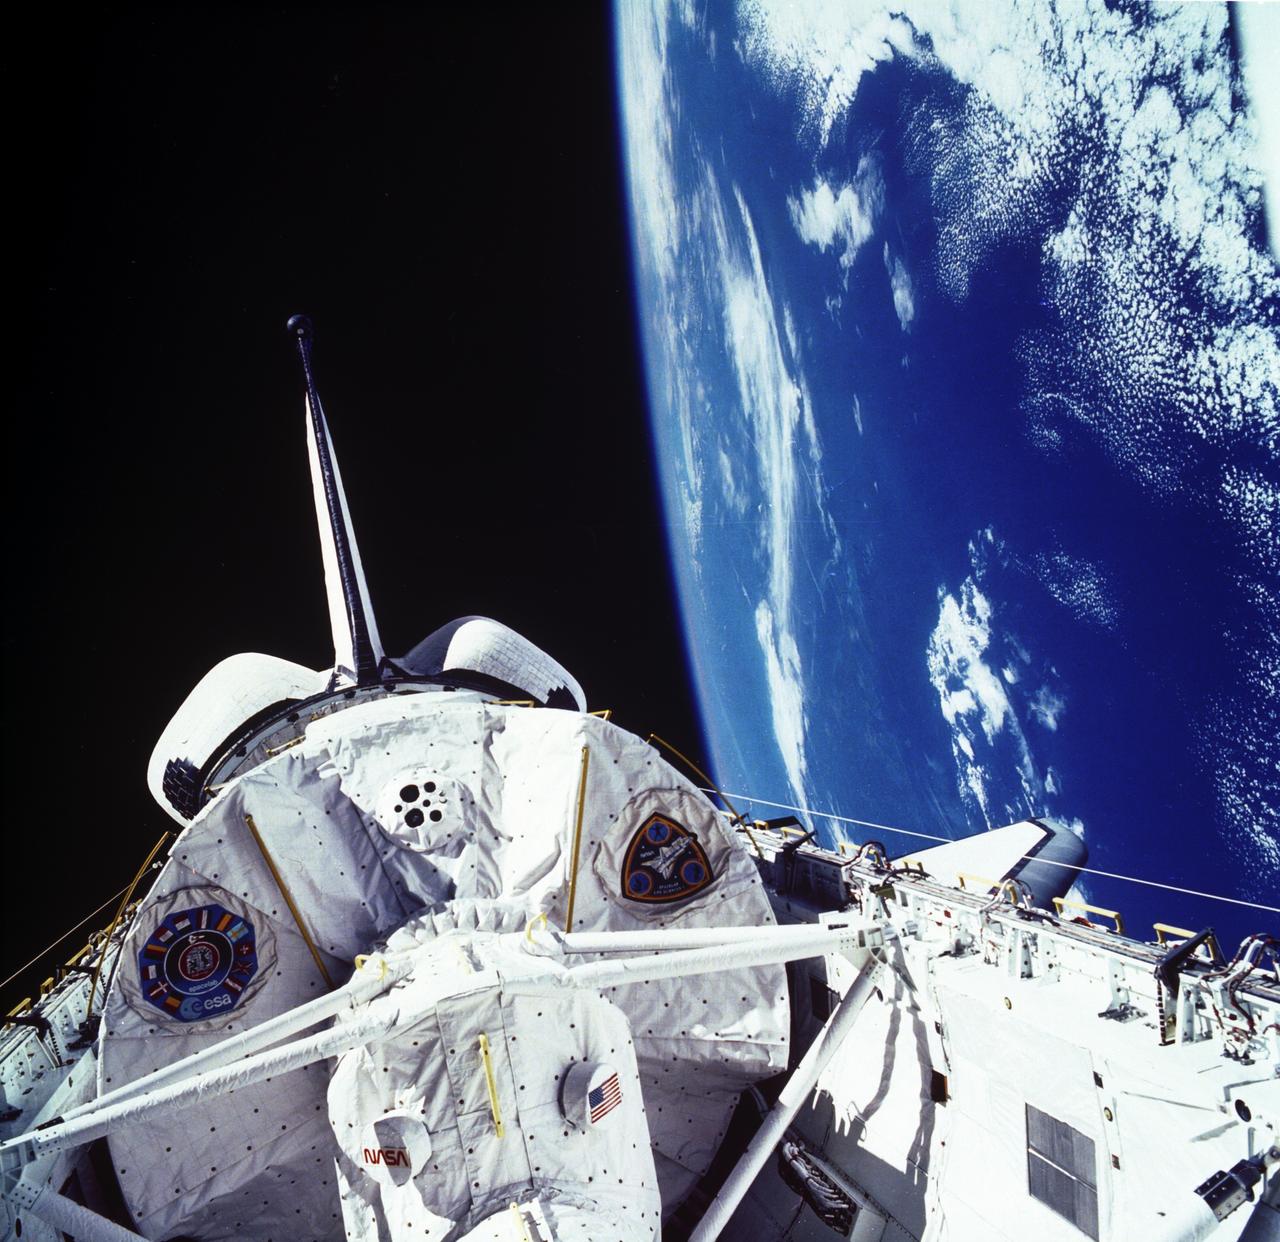
The laboratory module in the cargo bay of the Space Shuttle Orbiter Columbia was photographed during the Spacelab Life Science-1 (SLS-1) mission. SLS-1 was the first Spacelab mission dedicated solely to life sciences. The main purpose of the SLS-1 mission was to study the mechanisms, magnitudes, and time courses of certain physiological changes that occur during space flight, to investigate the consequences of the body's adaptation to microgravity and readjustment to Earth's gravity, and to bring the benefits back home to Earth. The mission was designed to explore the responses of the heart, lungs, blood vessels, kidneys, and hormone-secreting glands to microgravity and related body fluid shifts; examine the causes of space motion sickness; and study changes in the muscles, bones and cells. The five body systems being studied were: The Cardiovascular/Cardiopulmonary System (heart, lungs, and blood vessels), the Renal/Endocrine System (kidney and hormone-secreting organs), the Immune System (white blood cells), the Musculoskeletal System (muscles and bones), and the Neurovestibular System (brain and nerves, eyes, and irner ear). The SLS-1 was launched aboard the Space Shuttle Orbiter Columbia (STS-40) on June 5, 1995.
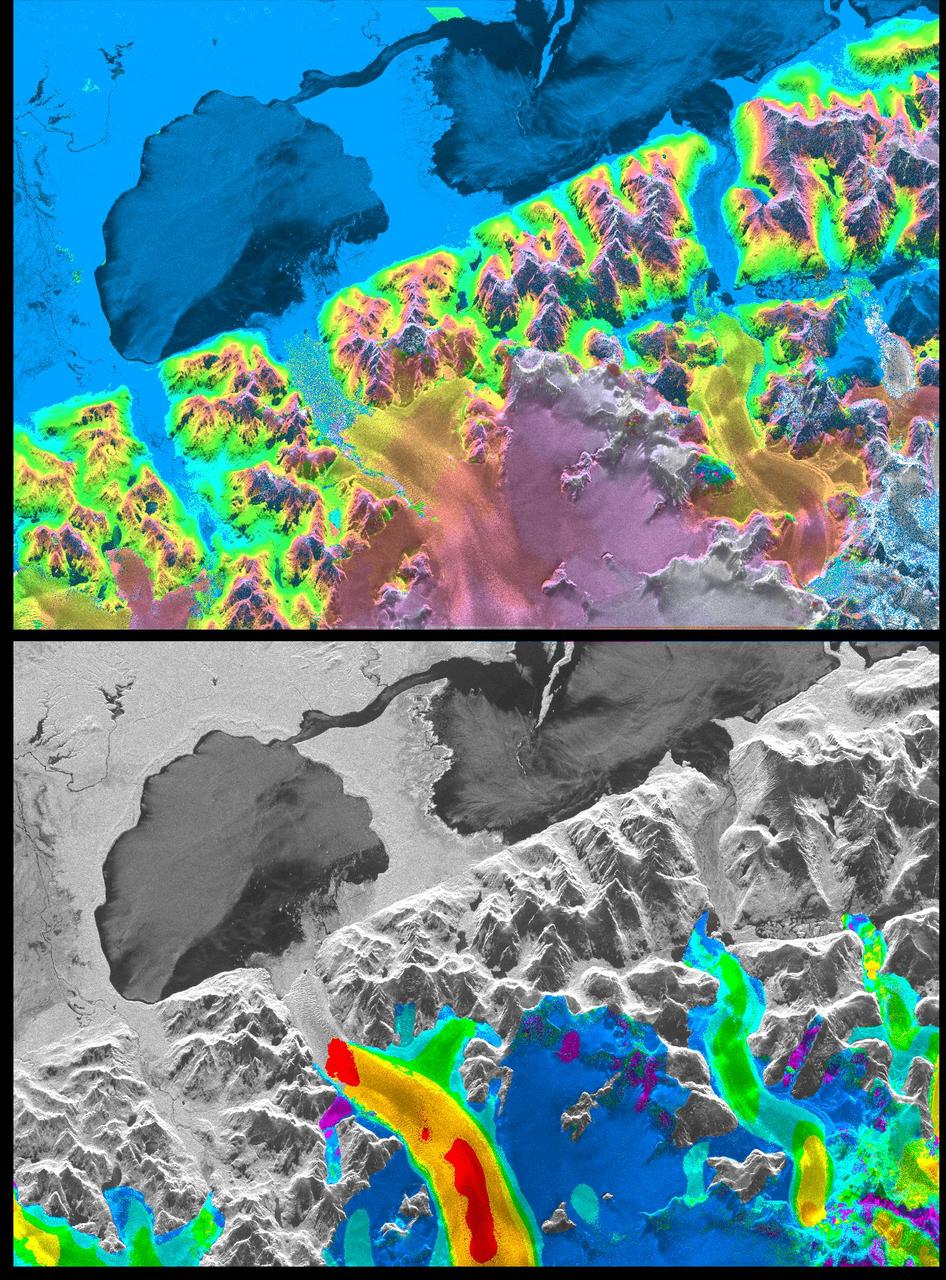
A NASA radar instrument has been successfully used to measure some of the fastest moving and most inaccessible glaciers in the world -- in Chile's huge, remote Patagonia ice fields -- demonstrating a technique that could produce more accurate predictions of glacial response to climate change and corresponding sea level changes. This image, produced with interferometric measurements made by the Spaceborne Imaging Radar-C and X-band Synthetic Aperture Radar (SIR-C/X-SAR) flown on the Space Shuttle last fall, has provided the first detailed measurements of the mass and motion of the San Rafael Glacier. Very few measurements have been made of the Patagonian ice fields, which are the world's largest mid-latitude ice masses and account for more than 60 percent of the Southern Hemisphere's glacial area outside of Antarctica. These features make the area essential for climatologists attempting to understand the response of glaciers on a global scale to changes in climate, but the region's inaccessibility and inhospitable climate have made it nearly impossible for scientists to study its glacial topography, meteorology and changes over time. Currently, topographic data exist for only a few glaciers while no data exist for the vast interior of the ice fields. Velocity has been measured on only five of the more than 100 glaciers, and the data consist of only a few single-point measurements. The interferometry performed by the SIR-C/X-SAR was used to generate both a digital elevation model of the glaciers and a map of their ice motion on a pixel-per-pixel basis at very high resolution for the first time. The data were acquired from nearly the same position in space on October 9, 10 and 11, 1994, at L-band frequency (24-cm wavelength), vertically transmitted and received polarization, as the Space Shuttle Endeavor flew over several Patagonian outlet glaciers of the San Rafael Laguna. The area shown in these two images is 50 kilometers by 30 kilometers (30 miles by 18 miles) in size and is centered at 46.6 degrees south latitude, 73.8 degrees west longitude. North is toward the upper right. The top image is a digital elevation model of the scene, where color and saturation represent terrain height (between 0 meters and 2,000 meters or up to 6,500 feet) and brightness represents radar backscatter. Low elevations are shown in blue and high elevations are shown in pink. The digital elevation map of the glacier surface has a horizontal resolution of 15 meters (50 feet) and a vertical resolution of 10 meters (30 feet). High-resolution maps like these acquired over several years would allow scientists to calculate directly long-term changes in the mass of the glacier. The bottom image is a map of ice motion parallel to the radar look direction only, which is from the top of the image. Purple indicates ice motion away from the radar at more than 6 centimeters per day; dark blue is ice motion toward or away at less than 6 cm per day; light blue is motion toward the radar of 6 cm to 20 cm (about 2 to 8 inches) per day; green is motion toward the radar of 20 cm to 45 cm (about 8 to 18 inches) per day; yellow is 45 cm to 85 cm (about 18 to 33 inches) per day; orange is 85 cm to 180 cm (about 33 to 71 inches) per day; red is greater than 180 cm (71 inches) per day. The velocity estimates are accurate to within 5 millimeters per day. The largest velocities are recorded on the San Rafael Glacier in agreement with previous work. Other outlet glaciers exhibit ice velocities of less than 1 meter per day. Several kilometers before its terminus, (left of center) the velocity of the San Rafael Glacier exceeds 10 meters (32 feet) per day, and ice motion cannot be estimated from the data. There, a revisit time interval of less than 12 hours would have been necessary to estimate ice motion from interferometry data. The results however demonstrate that the radar interferometry technique permits the monitoring of glacier characteristics unattainable by any other means. http://photojournal.jpl.nasa.gov/catalog/PIA01781
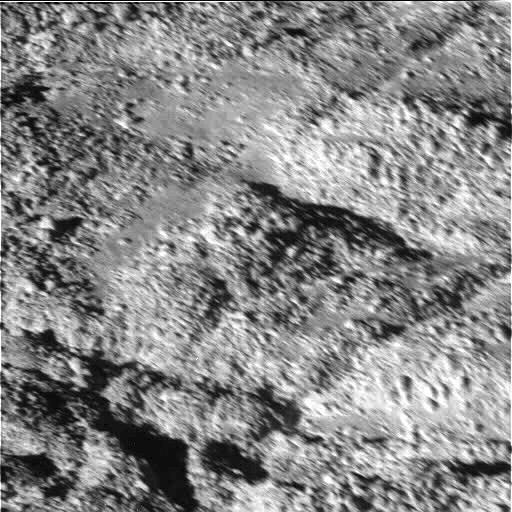
The tortured southern polar terrain of Enceladus appears strewn with great boulders of ice in this fantastic view, one of the highest resolution images obtained so far by Cassini of any world. Some smearing of the image due to spacecraft motion is apparent in this scene, which was acquired as Enceladus raced past Cassini's field of view near the time of closest approach. At the time, the imaging cameras were pointed close to the moon's limb (edge), rather than directly below the spacecraft. This allowed for less motion blur than would have been apparent had the cameras pointed straight down. Thus, the terrain imaged here was actually at a distance of 319 kilometers (198 miles) from Cassini. At this fine scale, the surface is dominated by ice blocks between 10 and 100 meters (33 and 330 feet) across. The origin of these icy boulders is enigmatic. Scientists are interested in studying the sizes and numbers of the blocks in this bizarre scene, and in understanding whether terrain covered with boulders is common on Enceladus. A wide-angle camera view centered on this location on Enceladus is available (see PIA06251), as well as a comparison view showing the position of this image within the wide-angle image (see PIA06250). The image was taken during Cassini's very close flyby of Enceladus on July 14, 2005, from a distance of approximately 208 kilometers (129 miles) above Enceladus. Resolution in the image is about 4 meters (13 feet) per pixel. The image has been contrast enhanced to improve the visibility of surface. http://photojournal.jpl.nasa.gov/catalog/PIA06252

KENNEDY SPACE CENTER, FLA. - STS-115 Commander Brent Jett studies the controls in the cockpit of the Shuttle Training Aircraft before a practice session of landing the shuttle. STA practice is part of launch preparations. The STA is a Grumman American Aviation-built Gulf Stream II jet that was modified to simulate an orbiter’s cockpit, motion and visual cues, and handling qualities. In flight, the STA duplicates the orbiter’s atmospheric descent trajectory from approximately 35,000 feet altitude to landing on a runway. Because the orbiter is unpowered during re-entry and landing, its high-speed glide must be perfectly executed the first time. Mission STS-115 is scheduled to lift off about 12:29 p.m. Sept. 6. Mission managers cancelled Atlantis' first launch campaign due to a lightning strike at the pad and the passage of Tropical Storm Ernesto along Florida's east coast. The mission will deliver and install the 17-and-a-half-ton P3/P4 truss segment to the port side of the integrated truss system on the orbital outpost. The truss includes a new set of photovoltaic solar arrays. When unfurled to their full length of 240 feet, the arrays will provide additional power for the station in preparation for the delivery of international science modules over the next two years. STS-115 is expected to last 11 days and includes three scheduled spacewalks. Photo credit: NASA/Kim Shiflett
Astronaut Alan Shepard (right) was one of 14 astronauts, 8 NASA test pilots, and 2 McDonnell test pilots who took part in simulator studies. Shepard flew the simulator on November 14, 1963. A.W. Vogeley wrote: "Many of the astronauts have flown this simulator in support of the Gemini studies and they, without exception, appreciated the realism of the visual scene. The simulator has also been used in the development of pilot techniques to handle certain jet malfunctions in order that aborts could be avoided. In these situations large attitude changes are sometimes necessary and the false motion cues that were generated due to earth gravity were somewhat objectionable; however, the pilots were readily able to overlook these false motion cues in favor of the visual realism." Roy F. Brissenden noted that: "The basic Gemini control studies developed the necessary techniques and demonstrated the ability of human pilots to perform final space docking with the specified Gemini-Agena systems using only visual references. ... Results... showed that trained astronauts can effect the docking with direct acceleration control and even with jet malfunctions as long as good visual conditions exist.... Probably more important than data results was the early confidence that the astronauts themselves gained in their ability to perform the maneuver in the ultimate flight mission." Shepard commented: "I had the feeling tonight - a couple of times - that I was actually doing the space mission instead of the simulation. As I said before, I think it is a very good simulation." Shepard also commented on piloting techniques. Most astronauts arrived at this same preferred technique: Shepard: "I believe I have developed the preferred technique for these conditions and the technique appeared to me to be best was to come in slightly above the target so that I was able to use the longitudinal marks on the body of the target as a reference, particularly for a lateral translation and, of course, I used the foreshortening effect for a vertical translation, and this appeared to give me the best results. By that I mean the least number of control motions and the lowest fuel usage and the best end techniques, or the best end conditions, I should say." Engineer: "When you started to run you didn't start thrusting immediately I don't believe. It looked like you started working on your attitudes, then started closing in." Shepard: "That is correct. I did that because I felt that I wanted to get the X-axis translation in the most effective vector and for minimum fuel usage that wouldn't introduce any other lateral or vertical offsets that did not already exist." -- Published in Barton C. Hacker and James M. Grimwood, On the Shoulders of Titans: A History of Project Gemini, NASA SP-4203; A.W. Vogeley, "Discussion of Existing and Planned Simulators For Space Research," Paper presented at the Conference on the Role of Simulation in Space Technology, August 17-21, 1964; Roy F. Brissenden, "Initial Operations with Langley's Rendezvous Docking Facility," Langley Working Paper, LWP-21, 1964.
Astronaut Alan Shepard (right) was one of 14 astronauts, 8 NASA test pilots, and 2 McDonnell test pilots who took part in simulator studies. Shepard flew the simulator on November 14, 1963. A.W. Vogeley wrote: "Many of the astronauts have flown this simulator in support of the Gemini studies and they, without exception, appreciated the realism of the visual scene. The simulator has also been used in the development of pilot techniques to handle certain jet malfunctions in order that aborts could be avoided. In these situations large attitude changes are sometimes necessary and the false motion cues that were generated due to earth gravity were somewhat objectionable; however, the pilots were readily able to overlook these false motion cues in favor of the visual realism." Roy F. Brissenden noted that: "The basic Gemini control studies developed the necessary techniques and demonstrated the ability of human pilots to perform final space docking with the specified Gemini-Agena systems using only visual references. ... Results... showed that trained astronauts can effect the docking with direct acceleration control and even with jet malfunctions as long as good visual conditions exist.... Probably more important than data results was the early confidence that the astronauts themselves gained in their ability to perform the maneuver in the ultimate flight mission." Shepard commented: "I had the feeling tonight - a couple of times - that I was actually doing the space mission instead of the simulation. As I said before, I think it is a very good simulation." Shepard also commented on piloting techniques. Most astronauts arrived at this same preferred technique: Shepard: "I believe I have developed the preferred technique for these conditions and the technique appeared to me to be best was to come in slightly above the target so that I was able to use the longitudinal marks on the body of the target as a reference, particularly for a lateral translation and, of course, I used the foreshortening effect for a vertical translation, and this appeared to give me the best results. By that I mean the least number of control motions and the lowest fuel usage and the best end techniques, or the best end conditions, I should say." Engineer: "When you started to run you didn't start thrusting immediately I don't believe. It looked like you started working on your attitudes, then started closing in." Shepard: "That is correct. I did that because I felt that I wanted to get the X-axis translation in the most effective vector and for minimum fuel usage that wouldn't introduce any other lateral or vertical offsets that did not already exist." -- Published in Barton C. Hacker and James M. Grimwood, On the Shoulders of Titans: A History of Project Gemini, NASA SP-4203; A.W. Vogeley, "Discussion of Existing and Planned Simulators For Space Research," Paper presented at the Conference on the Role of Simulation in Space Technology, August 17-21, 1964; Roy F. Brissenden, "Initial Operations with Langley's Rendezvous Docking Facility," Langley Working Paper, LWP-21, 1964.
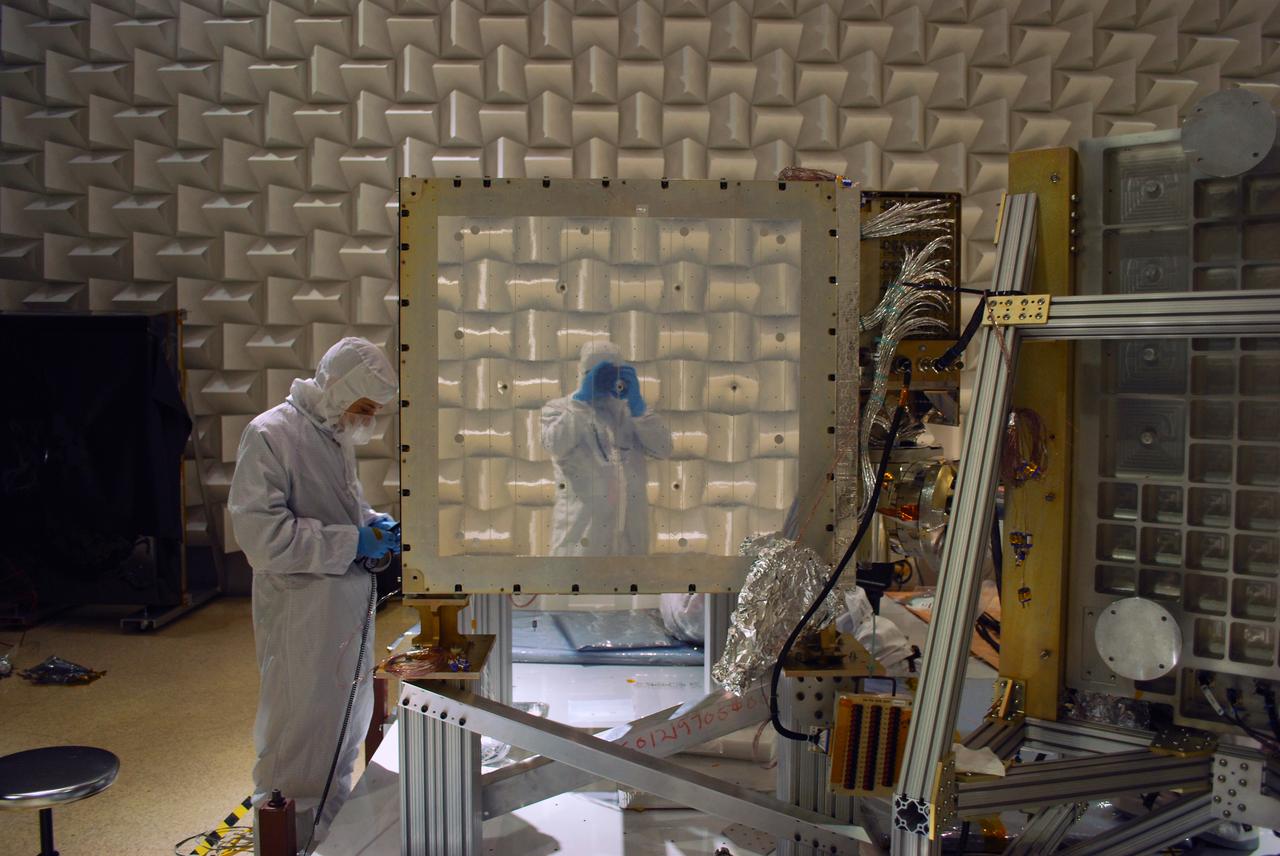
A photo taken during the NICER range-of-motion test at NASA’s Goddard Space Flight Center shows the photographer’s reflection in the mirror-like radiator surface of the detector plate. Teflon-coated silver tape is used to keep NICER’s detectors cool. The Neutron star Interior Composition Explorer (NICER) is a NASA Explorer Mission of Opportunity dedicated to studying the extraordinary environments — strong gravity, ultra-dense matter, and the most powerful magnetic fields in the universe — embodied by neutron stars. An attached payload aboard the International Space Station, NICER will deploy an instrument with unique capabilities for timing and spectroscopy of fast X-ray brightness fluctuations. The embedded Station Explorer for X-ray Timing and Navigation Technology demonstration (SEXTANT) will use NICER data to validate, for the first time in space, technology that exploits pulsars as natural navigation beacons. Credit: NASA/Goddard/ Keith Gendreau <b><a href="http://www.nasa.gov/audience/formedia/features/MP_Photo_Guidelines.html" rel="nofollow">NASA image use policy.</a></b> <b><a href="http://www.nasa.gov/centers/goddard/home/index.html" rel="nofollow">NASA Goddard Space Flight Center</a></b> enables NASA’s mission through four scientific endeavors: Earth Science, Heliophysics, Solar System Exploration, and Astrophysics. Goddard plays a leading role in NASA’s accomplishments by contributing compelling scientific knowledge to advance the Agency’s mission. <b>Follow us on <a href="http://twitter.com/NASAGoddardPix" rel="nofollow">Twitter</a></b> <b>Like us on <a href="http://www.facebook.com/pages/Greenbelt-MD/NASA-Goddard/395013845897?ref=tsd" rel="nofollow">Facebook</a></b> <b>Find us on <a href="http://instagrid.me/nasagoddard/?vm=grid" rel="nofollow">Instagram</a></b>
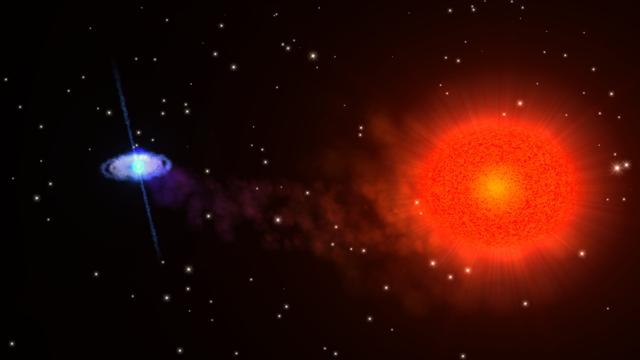
NASA image release August 17, 2010 Astronomers using NASA's Rossi X-ray Timing Explorer (RXTE) have found the first fast X-ray pulsar to be eclipsed by its companion star. Further studies of this unique stellar system will shed light on some of the most compressed matter in the universe and test a key prediction of Einstein's relativity theory. Known as Swift J1749.4-2807 -- J1749 for short -- the system erupted with an X-ray outburst on April 10. During the event, RXTE observed three eclipses, detected X-ray pulses that identified the neutron star as a pulsar, and even recorded pulse variations that indicated the neutron star's orbital motion. To view a video of this pulsar go here: <a href="http://www.flickr.com/photos/gsfc/4901238111">www.flickr.com/photos/gsfc/4901238111</a> To read more <b><a href="http://www.nasa.gov/topics/universe/features/eclipsing-pulsar.html" rel="nofollow">click here</a></b> Credit: NASA/GSFC <b><a href="http://www.nasa.gov/centers/goddard/home/index.html" rel="nofollow">NASA Goddard Space Flight Center</a></b> is home to the nation's largest organization of combined scientists, engineers and technologists that build spacecraft, instruments and new technology to study the Earth, the sun, our solar system, and the universe. <b>Follow us on <a href="http://twitter.com/NASA_GoddardPix" rel="nofollow">Twitter</a></b> <b>Join us on <a href="http://www.facebook.com/pages/Greenbelt-MD/NASA-Goddard/395013845897?ref=tsd" rel="nofollow">Facebook</a><b></b></b>
![On June 26, 2016, the Moderate Resolution Imaging Spectroradiometer (MODIS) on NASA’s Terra satellite acquired this natural-color image of cloud gravity waves off the coast of Angola and Namibia. “I [regularly] look at this area on Worldview because you quite often have these gravity waves,” said Bastiaan Van Diedenhoven, a researcher for Columbia University and NASA's Goddard Institute for Space Studies interested in cloud formations. “On this day, there was so much going on—so many different waves from different directions—that they really started interfering.” A distinctive criss-cross pattern formed in unbroken stretches hundreds of kilometers long. Similar to a boat’s wake, which forms as the water is pushed upward by the boat and pulled downward again by gravity, these clouds are formed by the rise and fall of colliding air columns. Off of west Africa, dry air coming off the Namib desert—after being cooled by the night—moves out under the balmy, moist air over the ocean and bumps it upwards. As the humid air rises to a higher altitude, the moisture condenses into droplets, forming clouds. Gravity rolls these newly formed clouds into a wave-like shape. When moist air goes up, it cools, and then gravity pushes it down again. As it plummets toward the earth, the moist air is pushed up again by the dry air. Repeated again and again, this process creates gravity waves. Clouds occur at the upward wave motions, while they evaporate at the downward motions. Such waves will often propagate in the morning and early afternoon, said Van Diedenhoven. During the course of the day, the clouds move out to sea and stretch out, as the dry air flowing off the land pushes the moist ocean air westward. NASA Earth Observatory image by Jesse Allen, using data from the Land Atmosphere Near real-time Capability for EOS (LANCE). via @NASAEarth <a href="http://go.nasa.gov/29Btxcy" rel="nofollow">go.nasa.gov/29Btxcy</a> <b><a href="http://go.nasa.gov/29BtHR6" rel="nofollow">NASA image use policy.</a></b> <b><a href="http://go.nasa.gov/29BtDku" rel="nofollow">NASA Goddard Space Flight Center</a></b> enables NASA’s mission through four scientific endeavors: Earth Science, Heliophysics, Solar System Exploration, and Astrophysics. Goddard plays a leading role in NASA’s accomplishments by contributing compelling scientific knowledge to advance the Agency’s mission. <b>Follow us on <a href="http://go.nasa.gov/29BtVrn" rel="nofollow">Twitter</a></b> <b>Like us on <a href="http://go.nasa.gov/29BtygK" rel="nofollow">Facebook</a></b> <b>Find us on <a href="http://go.nasa.gov/29Bu0vu" rel="nofollow">Instagram</a></b>](https://images-assets.nasa.gov/image/GSFC_20171208_Archive_e000269/GSFC_20171208_Archive_e000269~medium.jpg)
On June 26, 2016, the Moderate Resolution Imaging Spectroradiometer (MODIS) on NASA’s Terra satellite acquired this natural-color image of cloud gravity waves off the coast of Angola and Namibia. “I [regularly] look at this area on Worldview because you quite often have these gravity waves,” said Bastiaan Van Diedenhoven, a researcher for Columbia University and NASA's Goddard Institute for Space Studies interested in cloud formations. “On this day, there was so much going on—so many different waves from different directions—that they really started interfering.” A distinctive criss-cross pattern formed in unbroken stretches hundreds of kilometers long. Similar to a boat’s wake, which forms as the water is pushed upward by the boat and pulled downward again by gravity, these clouds are formed by the rise and fall of colliding air columns. Off of west Africa, dry air coming off the Namib desert—after being cooled by the night—moves out under the balmy, moist air over the ocean and bumps it upwards. As the humid air rises to a higher altitude, the moisture condenses into droplets, forming clouds. Gravity rolls these newly formed clouds into a wave-like shape. When moist air goes up, it cools, and then gravity pushes it down again. As it plummets toward the earth, the moist air is pushed up again by the dry air. Repeated again and again, this process creates gravity waves. Clouds occur at the upward wave motions, while they evaporate at the downward motions. Such waves will often propagate in the morning and early afternoon, said Van Diedenhoven. During the course of the day, the clouds move out to sea and stretch out, as the dry air flowing off the land pushes the moist ocean air westward. NASA Earth Observatory image by Jesse Allen, using data from the Land Atmosphere Near real-time Capability for EOS (LANCE). via @NASAEarth <a href="http://go.nasa.gov/29Btxcy" rel="nofollow">go.nasa.gov/29Btxcy</a> <b><a href="http://go.nasa.gov/29BtHR6" rel="nofollow">NASA image use policy.</a></b> <b><a href="http://go.nasa.gov/29BtDku" rel="nofollow">NASA Goddard Space Flight Center</a></b> enables NASA’s mission through four scientific endeavors: Earth Science, Heliophysics, Solar System Exploration, and Astrophysics. Goddard plays a leading role in NASA’s accomplishments by contributing compelling scientific knowledge to advance the Agency’s mission. <b>Follow us on <a href="http://go.nasa.gov/29BtVrn" rel="nofollow">Twitter</a></b> <b>Like us on <a href="http://go.nasa.gov/29BtygK" rel="nofollow">Facebook</a></b> <b>Find us on <a href="http://go.nasa.gov/29Bu0vu" rel="nofollow">Instagram</a></b>
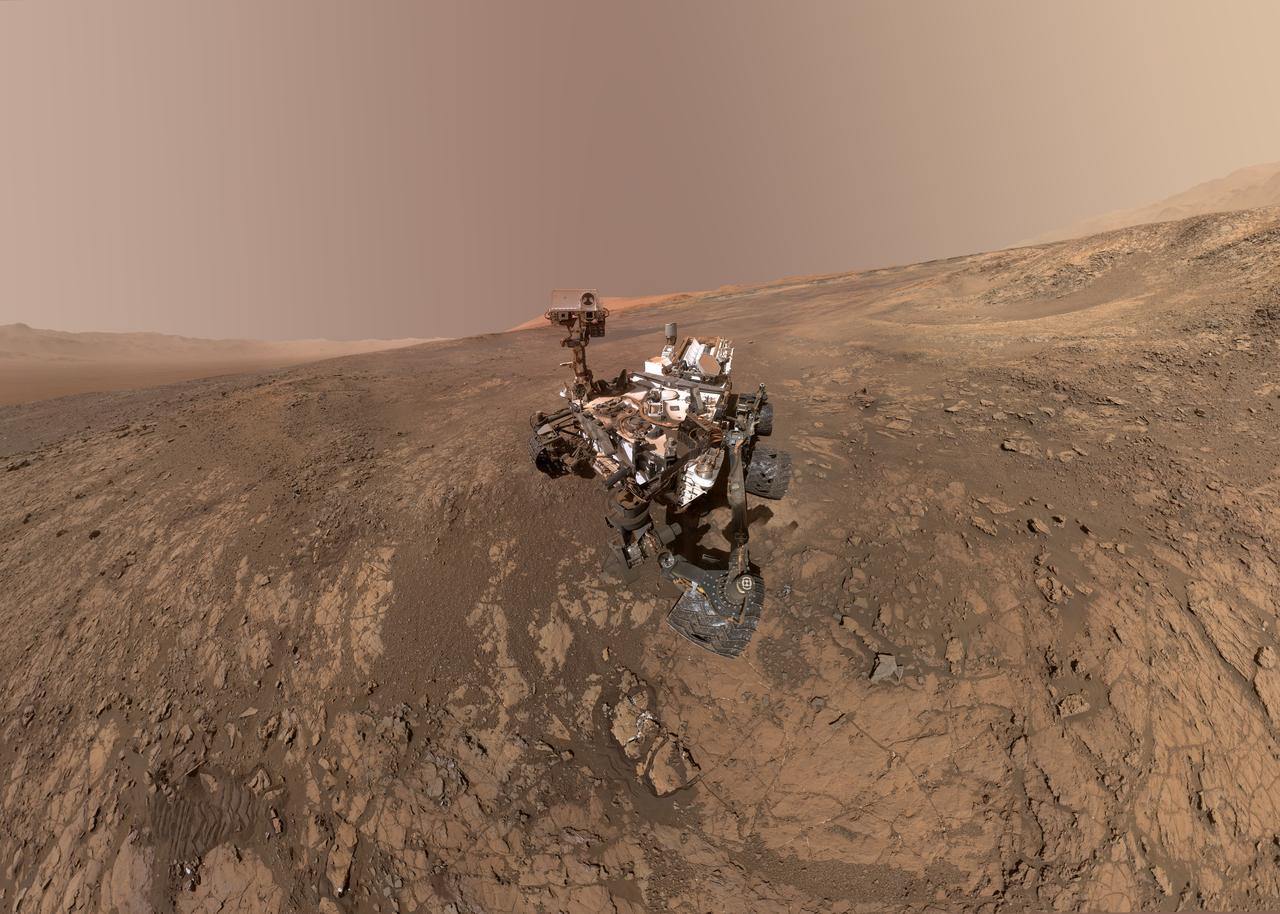
This self-portrait of NASA's Curiosity Mars rover shows the vehicle on Vera Rubin Ridge, which it's been investigating for the past several months. Directly behind the rover is the start of a clay-rich slope scientists are eager to begin exploring. In the coming week, Curiosity will begin to climb this slope. North is on the left and west is on the right, with Gale Crater's rim on the horizon of both edges. Poking up just behind Curiosity's mast is Mount Sharp, photobombing the robot's selfie. Curiosity landed on Mars five years ago with the intention of studying lower Mount Sharp, where it will remain for all of its time on Mars. The mountain's base provides access to layers formed over millions of years. These layers formed in the presence of water -- likely due to a lake or lakes that sat at the bottom of the mountain, which sits inside of Gale Crater. This mosaic was assembled from dozens of images taken by Curiosity's Mars Hands Lens Imager (MAHLI). They were all taken on Jan. 23, 2018, during Sol 1943. The view does not include the rover's arm nor the MAHLI camera itself, except in the miniature scene reflected upside down in the parabolic mirror at the top of the mast. That mirror is part of Curiosity's Chemistry and Camera (ChemCam) instrument. MAHLI appears in the center of the mirror. Wrist motions and turret rotations on the arm allowed MAHLI to acquire the mosaic's component images. The arm was positioned out of the shot in the images, or portions of images, that were used in this mosaic. A full-resolution image is available at https://photojournal.jpl.nasa.gov/catalog/PIA22207
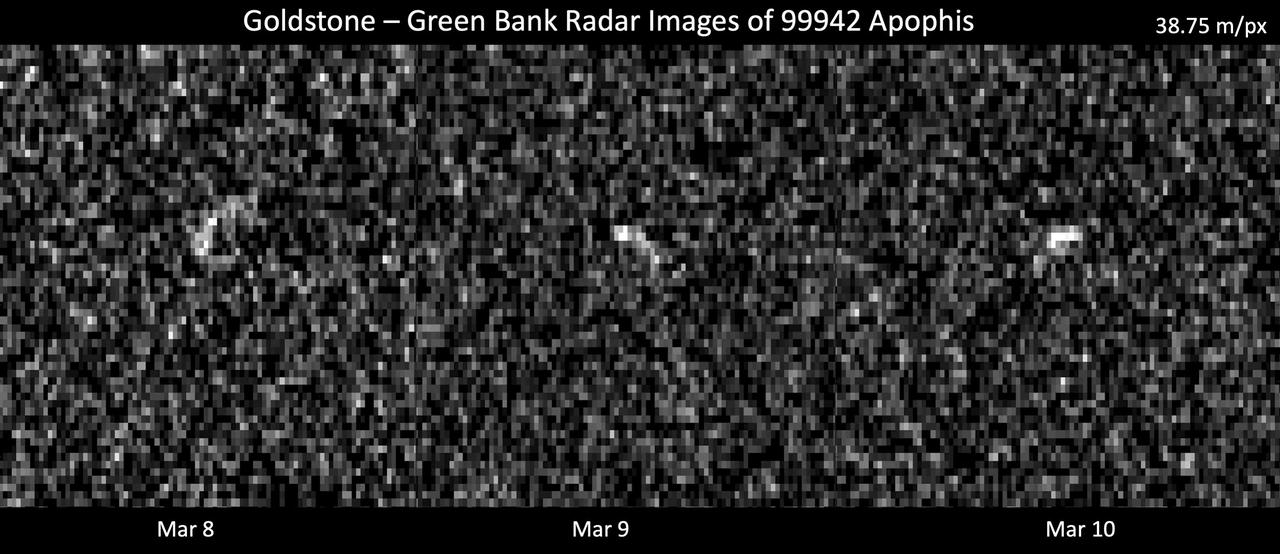
These images represent radar observations of asteroid 99942 Apophis on March 8, 9, and 10, 2021, as it made its last close approach before its 2029 Earth encounter that will see the object pass our planet by less than 20,000 miles (32,000 kilometers). The 70-meter radio antenna at the Deep Space Network's Goldstone Deep Space Communications Complex near Barstow, California, and the 100-meter Green Bank Telescope in West Virginia used radar to precisely track Apophis' motion. At the time of these observations, Apophis was about 10.6 million miles (17 million kilometers) from Earth, and each pixel has a resolution of 127 feet (38.75 meters). These observations helped scientists of the Center for Near Earth Object Studies (CNEOS), managed by NASA's Jet Propulsion Laboratory, precisely determine the 1,100-feet-wide (340-meter-wide) asteroid's orbit around the Sun, ruling out any Earth impact threat for the next hundred years or more. As a result of these observations, Apophis was removed from the Sentry Impact Risk Table. The radar team will continue to analyze these observations to determine more information about Apophis' size, shape, and rate of spin. Relying on optical telescopes and ground-based radar to help characterize every near-Earth object's orbit to improve long-term hazard assessments, CNEOS computes high-precision orbits in support of NASA's Planetary Defense Coordination Office. https://photojournal.jpl.nasa.gov/catalog/PIA24168
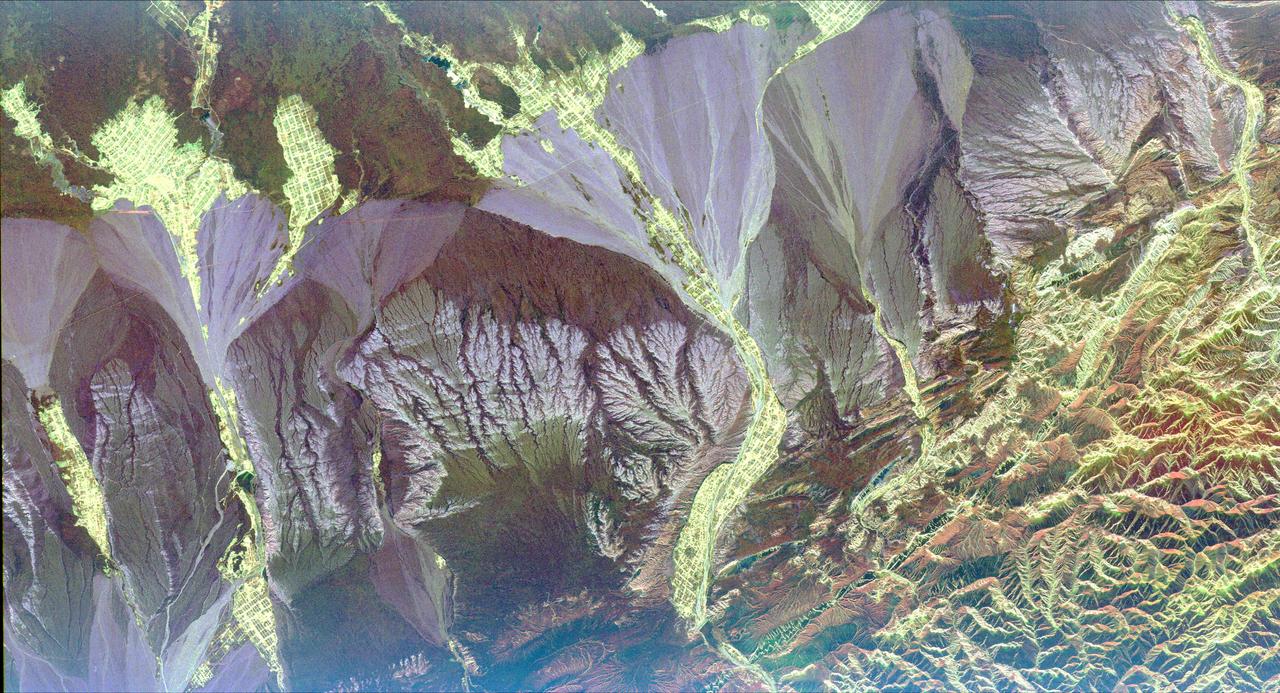
This radar image is centered near the small town of Pishan in northwest China, about 280 km (174 miles) southeast of the city of Kashgar along the ancient Silk Route in the Taklamakan desert of the Xinjiang Province. Geologists are using this radar image as a map to study past climate changes and tectonics of the area. The irregular lavender branching patterns in the center of the image are the remains of ancient alluvial fans, gravel deposits that have accumulated at the base of the mountains during times of wetter climate. The subtle striped pattern cutting across the ancient fans are caused by thrusting of the Kun Lun Mountains north. This motion is caused by the continuing plate-tectonic collision of India with Asia. Modern fans show up as large lavender triangles above the ancient fan deposits. Yellow areas on the modern fans are vegetated oases. The gridded pattern results from the alignment of poplar trees that have been planted as wind breaks. The reservoir at the top of the image is part of a sophisticated irrigation system that supplies water to the oases. This image was acquired by the Spaceborne Imaging Radar-C/X-band Synthetic Aperture Radar (SIR-C/X-SAR) aboard the space shuttle Endeavour in April 1994. This image is centered at 37.4 degrees north latitude, 78.3 degrees east longitude and shows an area approximately 50 km by 100 km (31 miles by 62 miles). The colors are assigned to different frequencies and polarizations of the radar as follows: Red is L-band horizontally transmitted, horizontally received; green is L-band horizontally transmitted, vertically received; and blue is C-band horizontally transmitted and vertically received. SIR-C/X-SAR, a joint mission of the German, Italian, and the United States space agencies, is part of NASA's Mission to Planet Earth. http://photojournal.jpl.nasa.gov/catalog/PIA01796
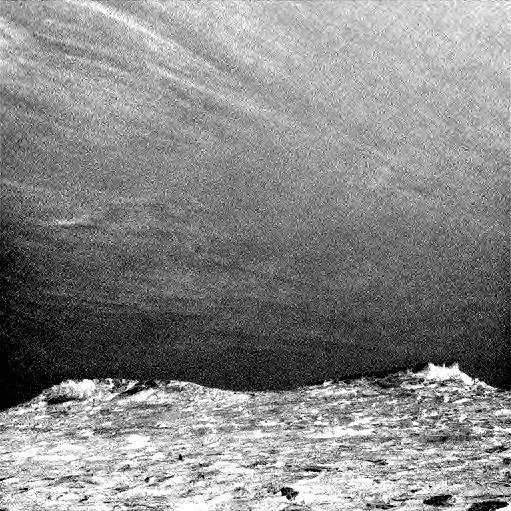
Clouds drift across the sky above a Martian horizon in this accelerated sequence of enhanced images from NASA's Curiosity Mars rover. The rover's Navigation Camera (Navcam) took these eight images over a span of four minutes early in the morning of the mission's 1,758th Martian day, or sol (July 17, 2017), aiming toward the south horizon. They have been processed by first making a "flat field' adjustment for known differences in sensitivity among pixels and correcting for camera artifacts due to light reflecting within the camera, and then generating an "average" of all the frames and subtracting that average from each frame. This subtraction emphasizes changes whether due to movement -- such as the clouds' motion -- or due to lighting -- such as changing shadows on the ground as the morning sunlight angle changed. On the same Martian morning, Curiosity also observed clouds nearly straight overhead. The clouds resemble Earth's cirrus clouds, which are ice crystals at high altitudes. These Martian clouds are likely composed of crystals of water ice that condense onto dust grains in the cold Martian atmosphere. Cirrus wisps appear as ice crystals fall and evaporate in patterns known as "fall streaks" or "mare's tails." Such patterns have been seen before at high latitudes on Mars, for instance by the Phoenix Mars Lander in 2008, and seasonally nearer the equator, for instance by the Opportunity rover. However, Curiosity has not previously observed such clouds so clearly visible from the rover's study area about five degrees south of the equator. The Hubble Space Telescope and spacecraft orbiting Mars have observed a band of clouds to appear near the Martian equator around the time of the Martian year when the planet is farthest from the Sun. With a more elliptical orbit than Earth's, Mars experiences more annual variation than Earth in its distance from the Sun. The most distant point in an orbit around the Sun is called the aphelion. The near-equatorial Martian cloud pattern observed at that time of year is called the "aphelion cloud belt." These new images from Curiosity were taken about two months before aphelion, but the morning clouds observed may be an early stage of the aphelion cloud belt. An animation is available at https://photojournal.jpl.nasa.gov/catalog/PIA21840

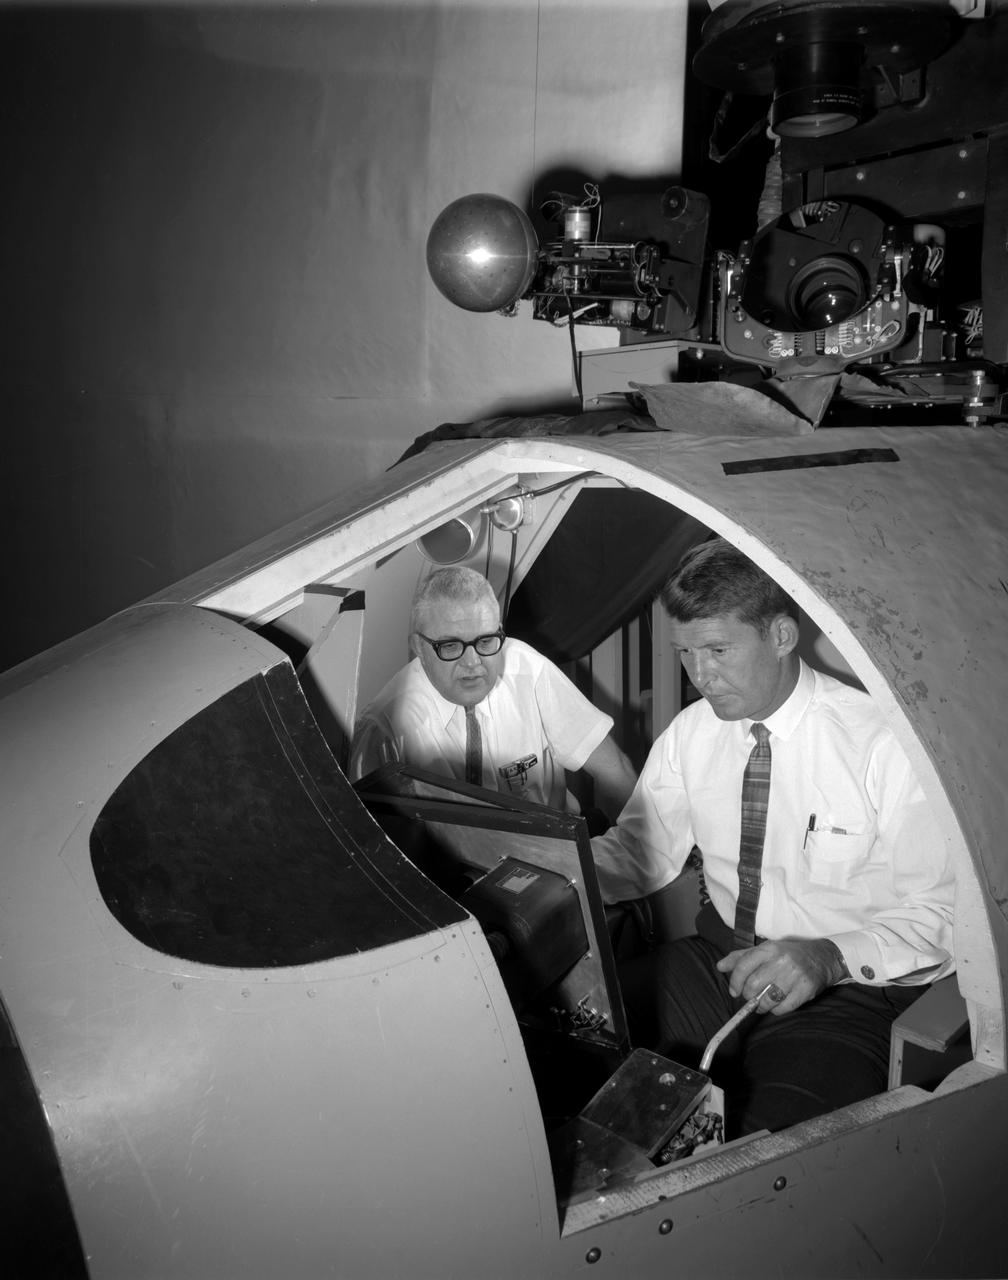
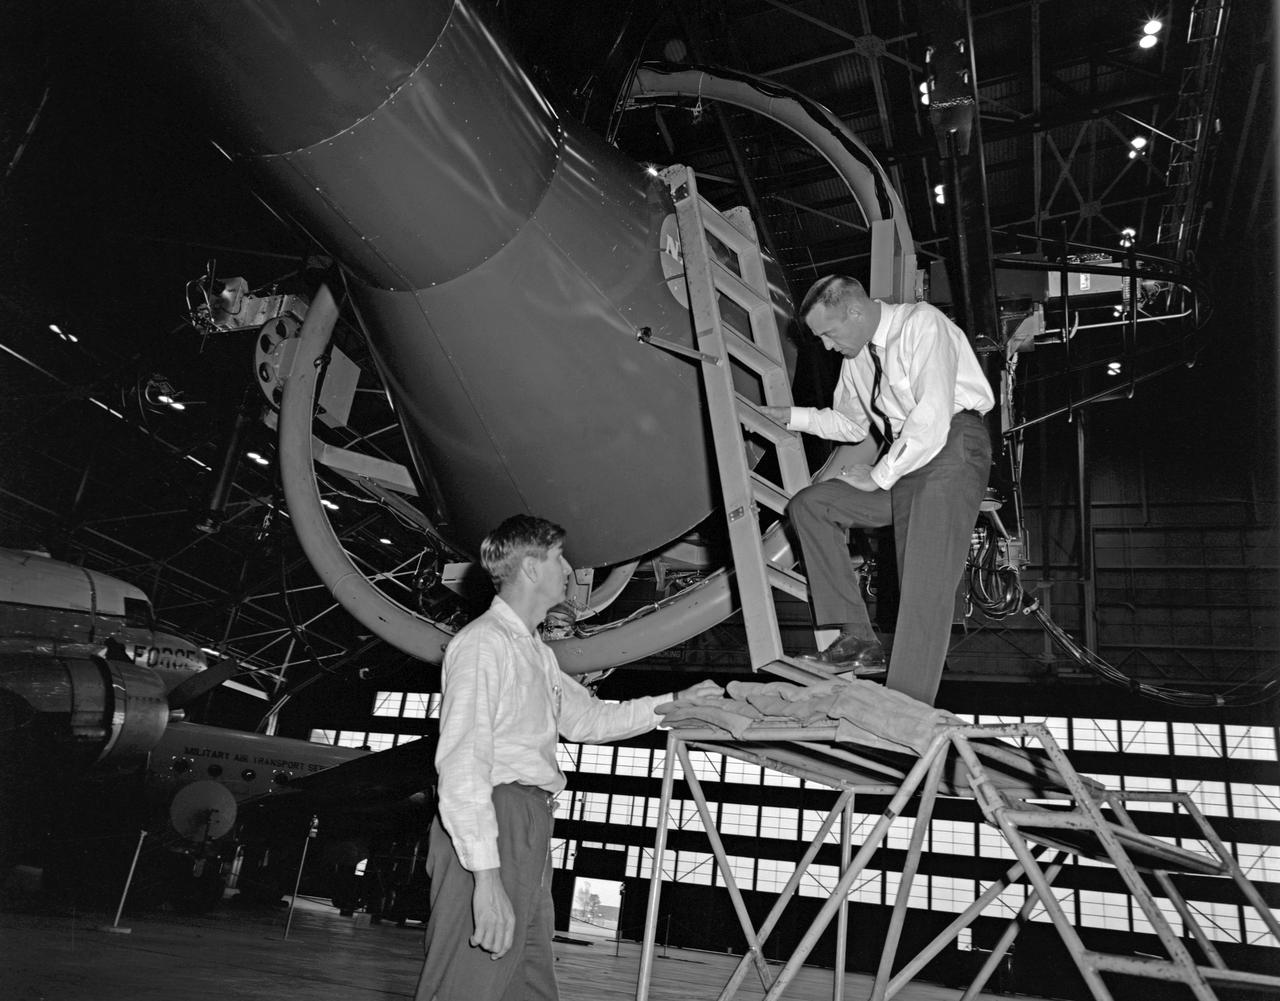
Project LOLA. Test subject sitting at the controls: Project LOLA or Lunar Orbit and Landing Approach was a simulator built at Langley to study problems related to landing on the lunar surface. It was a complex project that cost nearly 2 million dollars. James Hansen wrote: This simulator was designed to provide a pilot with a detailed visual encounter with the lunar surface the machine consisted primarily of a cockpit, a closed-circuit TV system, and four large murals or scale models representing portions of the lunar surface as seen from various altitudes. The pilot in the cockpit moved along a track past these murals which would accustom him to the visual cues for controlling a spacecraft in the vicinity of the moon. Unfortunately, such a simulation--although great fun and quite aesthetic--was not helpful because flight in lunar orbit posed no special problems other than the rendezvous with the LEM, which the device did not simulate. Not long after the end of Apollo, the expensive machine was dismantled. (p. 379) Ellis J. White wrote in his paper, Discussion of Three Typical Langley Research Center Simulation Programs : A typical mission would start with the first cart positioned on model 1 for the translunar approach and orbit establishment. After starting the descent, the second cart is readied on model 2 and, at the proper time, when superposition occurs, the pilot s scene is switched from model 1 to model 2. then cart 1 is moved to and readied on model 3. The procedure continues until an altitude of 150 feet is obtained. The cabin of the LM vehicle has four windows which represent a 45 degree field of view. The projection screens in front of each window represent 65 degrees which allows limited head motion before the edges of the display can be seen. The lunar scene is presented to the pilot by rear projection on the screens with four Schmidt television projectors. The attitude orientation of the vehicle is represented by changing the lunar scene through the portholes determined by the scan pattern of four orthicons. The stars are front projected onto the upper three screens with a four-axis starfield generation (starball) mounted over the cabin and there is a separate starball for the low window. -- Published in James R. Hansen, Spaceflight Revolution: NASA Langley Research Center From Sputnik to Apollo, (Washington: NASA, 1995), p. 379 Ellis J. White, Discussion of Three Typical Langley Research Center Simulation Programs, Paper presented at the Eastern Simulation Council (EAI s Princeton Computation Center), Princeton, NJ, October 20, 1966.
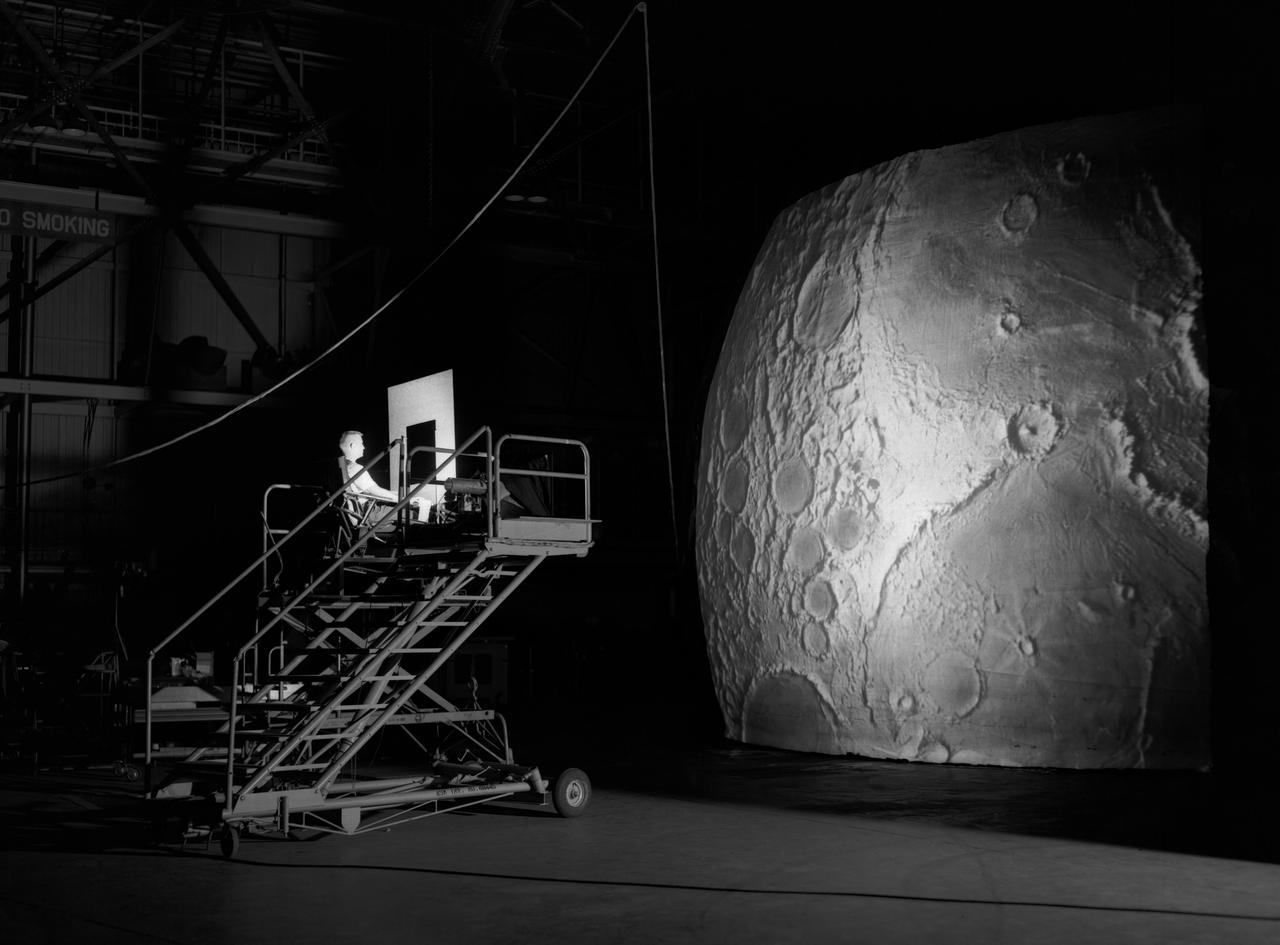
Test subject sitting at the controls: Project LOLA or Lunar Orbit and Landing Approach was a simulator built at Langley to study problems related to landing on the lunar surface. It was a complex project that cost nearly $2 million dollars. James Hansen wrote: "This simulator was designed to provide a pilot with a detailed visual encounter with the lunar surface; the machine consisted primarily of a cockpit, a closed-circuit TV system, and four large murals or scale models representing portions of the lunar surface as seen from various altitudes. The pilot in the cockpit moved along a track past these murals which would accustom him to the visual cues for controlling a spacecraft in the vicinity of the moon. Unfortunately, such a simulation--although great fun and quite aesthetic--was not helpful because flight in lunar orbit posed no special problems other than the rendezvous with the LEM, which the device did not simulate. Not long after the end of Apollo, the expensive machine was dismantled." (p. 379) Ellis J. White further described this simulator in his paper , "Discussion of Three Typical Langley Research Center Simulation Programs," (Paper presented at the Eastern Simulation Council (EAI's Princeton Computation Center), Princeton, NJ, October 20, 1966.) "A typical mission would start with the first cart positioned on model 1 for the translunar approach and orbit establishment. After starting the descent, the second cart is readied on model 2 and, at the proper time, when superposition occurs, the pilot's scene is switched from model 1 to model 2. then cart 1 is moved to and readied on model 3. The procedure continues until an altitude of 150 feet is obtained. The cabin of the LM vehicle has four windows which represent a 45 degree field of view. The projection screens in front of each window represent 65 degrees which allows limited head motion before the edges of the display can be seen. The lunar scene is presented to the pilot by rear projection on the screens with four Schmidt television projectors. The attitude orientation of the vehicle is represented by changing the lunar scene through the portholes determined by the scan pattern of four orthicons. The stars are front projected onto the upper three screens with a four-axis starfield generation (starball) mounted over the cabin and there is a separate starball for the low window." -- Published in James R. Hansen, Spaceflight Revolution: NASA Langley Research Center From Sputnik to Apollo, (Washington: NASA, 1995), p. 379.
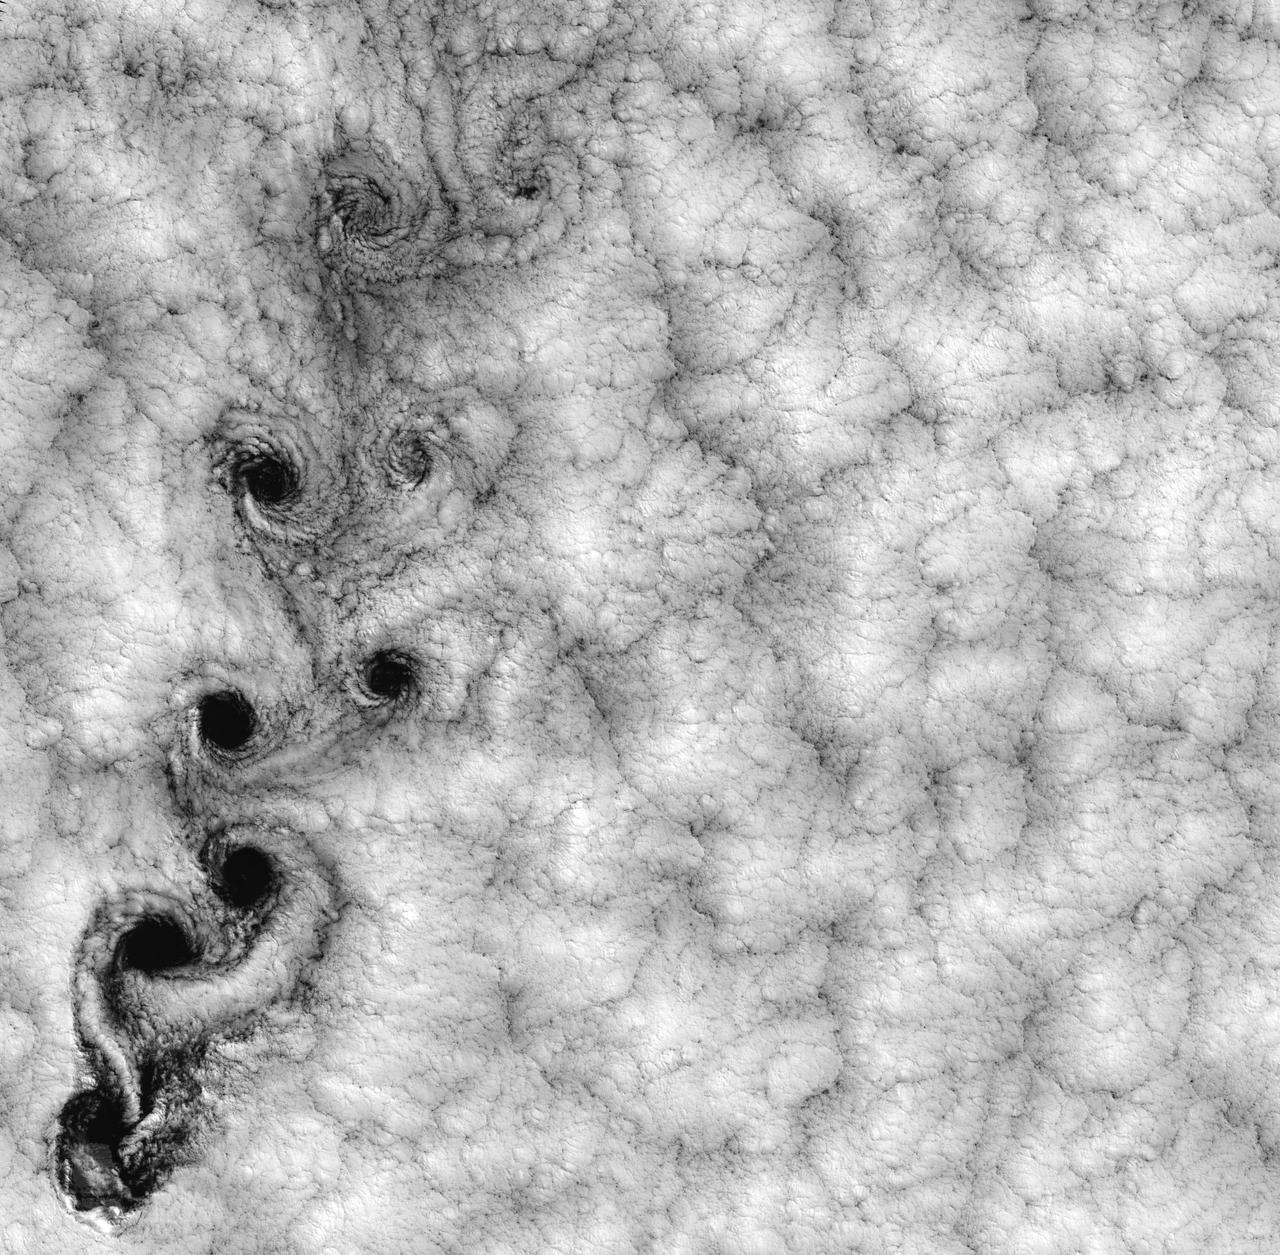
NASA image acquired September 15, 1999 This Landsat 7 image of clouds off the Chilean coast near the Juan Fernandez Islands (also known as the Robinson Crusoe Islands) on September 15, 1999, shows a unique pattern called a “von Karman vortex street.” This pattern has long been studied in the laboratory, where the vortices are created by oil flowing past a cylindrical obstacle, making a string of vortices only several tens of centimeters long. Study of this classic “flow past a circular cylinder” has been very important in the understanding of laminar and turbulent fluid flow that controls a wide variety of phenomena, from the lift under an aircraft wing to Earth’s weather. Here, the cylinder is replaced by Alejandro Selkirk Island (named after the true “Robinson Crusoe,” who was stranded here for many months in the early 1700s). The island is about 1.5 km in diameter, and rises 1.6 km into a layer of marine stratocumulus clouds. This type of cloud is important for its strong cooling of the Earth’s surface, partially counteracting the Greenhouse warming. An extended, steady equatorward wind creates vortices with clockwise flow off the eastern edge and counterclockwise flow off the western edge of the island. The vortices grow as they advect hundreds of kilometers downwind, making a street 10,000 times longer than those made in the laboratory. Observing the same phenomenon extended over such a wide range of sizes dramatizes the “fractal” nature of atmospheric convection and clouds. Fractals are characteristic of fluid flow and other dynamic systems that exhibit “chaotic” motions. Both clockwise and counter-clockwise vortices are generated by flow around the island. As the flow separates from the island’s leeward (away from the source of the wind) side, the vortices “swallow” some of the clear air over the island. (Much of the island air is cloudless due to a local “land breeze” circulation set up by the larger heat capacity of the waters surrounding the island.) The “swallowed” gulps of clear island air get carried along within the vortices, but these are soon mixed into the surrounding clouds. Landsat is unique in its ability to image both the small-scale eddies that mix clear and cloudy air, down to the 30 meter pixel size of Landsat, but also having a wide enough field-of-view, 180 km, to reveal the connection of the turbulence to large-scale flows such as the subtropical oceanic gyres. Landsat 7, with its new onboard digital recorder, has extended this capability away from the few Landsat ground stations to remote areas such as Alejandro Island, and thus is gradually providing a global dynamic picture of evolving human-scale phenomena. For more details on von Karman vortices, refer to <a href="http://climate.gsfc.nasa.gov/~cahalan" rel="nofollow">climate.gsfc.nasa.gov/~cahalan</a>. Image and caption courtesy Bob Cahalan, NASA GSFC Instrument: Landsat 7 - ETM+ Credit: NASA/GSFC/Landsat <b><a href="http://www.nasa.gov/centers/goddard/home/index.html" rel="nofollow">NASA Goddard Space Flight Center</a></b> enables NASA’s mission through four scientific endeavors: Earth Science, Heliophysics, Solar System Exploration, and Astrophysics. Goddard plays a leading role in NASA’s accomplishments by contributing compelling scientific knowledge to advance the Agency’s mission. <b>Follow us on <a href="http://twitter.com/NASA_GoddardPix" rel="nofollow">Twitter</a></b> <b>Join us on <a href="http://www.facebook.com/pages/Greenbelt-MD/NASA-Goddard/395013845897?ref=tsd" rel="nofollow">Facebook</a></b>
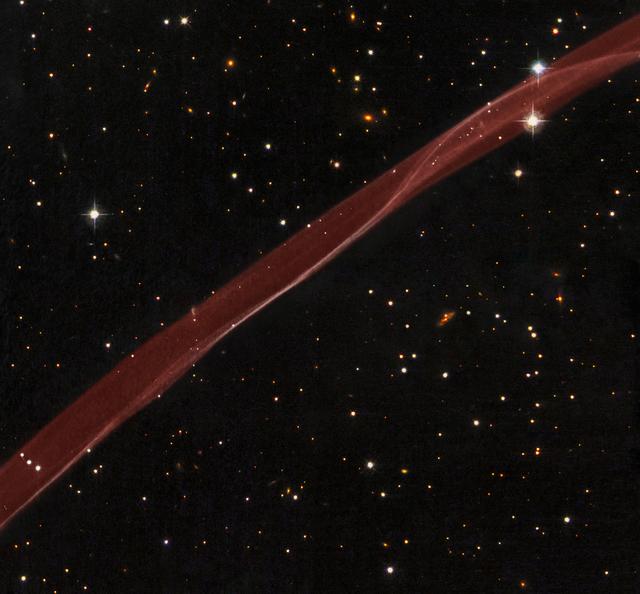
Release date: July 1, 2008 SN 1006 Supernova Remnant (Hubble) A delicate ribbon of gas floats eerily in our galaxy. A contrail from an alien spaceship? A jet from a black-hole? Actually this image, taken by NASA's Hubble Space Telescope, is a very thin section of a supernova remnant caused by a stellar explosion that occurred more than 1,000 years ago. On or around May 1, 1006 A.D., observers from Africa to Europe to the Far East witnessed and recorded the arrival of light from what is now called SN 1006, a tremendous supernova explosion caused by the final death throes of a white dwarf star nearly 7,000 light-years away. The supernova was probably the brightest star ever seen by humans, and surpassed Venus as the brightest object in the night time sky, only to be surpassed by the moon. It was visible even during the day for weeks, and remained visible to the naked eye for at least two and a half years before fading away. It wasn't until the mid-1960s that radio astronomers first detected a nearly circular ring of material at the recorded position of the supernova. The ring was almost 30 arcminutes across, the same angular diameter as the full moon. The size of the remnant implied that the blast wave from the supernova had expanded at nearly 20 million miles per hour over the nearly 1,000 years since the explosion occurred. In 1976, the first detection of exceedingly faint optical emission of the supernova remnant was reported, but only for a filament located on the northwest edge of the radio ring. A tiny portion of this filament is revealed in detail by the Hubble observation. The twisting ribbon of light seen by Hubble corresponds to locations where the expanding blast wave from the supernova is now sweeping into very tenuous surrounding gas. The hydrogen gas heated by this fast shock wave emits radiation in visible light. Hence, the optical emission provides astronomers with a detailed "snapshot" of the actual position and geometry of the shock front at any given time. Bright edges within the ribbon correspond to places where the shock wave is seen exactly edge on to our line of sight. Today we know that SN 1006 has a diameter of nearly 60 light-years, and it is still expanding at roughly 6 million miles per hour. Even at this tremendous speed, however, it takes observations typically separated by years to see significant outward motion of the shock wave against the grid of background stars. In the Hubble image as displayed, the supernova would have occurred far off the lower right corner of the image, and the motion would be toward the upper left. SN 1006 resides within our Milky Way Galaxy. Located more than 14 degrees off the plane of the galaxy's disk, there is relatively little confusion with other foreground and background objects in the field when trying to study this object. In the Hubble image, many background galaxies (orange extended objects) far off in the distant universe can be seen dotting the image. Most of the white dots are foreground or background stars in our Milky Way galaxy. This image is a composite of hydrogen-light observations taken with Hubble's Advanced Camera for Surveys in February 2006 and Wide Field Planetary Camera 2 observations in blue, yellow-green, and near-infrared light taken in April 2008. The supernova remnant, visible only in the hydrogen-light filter was assigned a red hue in the Heritage color image. Credit: NASA, ESA, and the Hubble Heritage Team (STScI/AURA) Acknowledgment: W. Blair (Johns Hopkins University) To learn more about the Hubble Space Telescope go here: <a href="http://www.nasa.gov/mission_pages/hubble/main/index.html" rel="nofollow">www.nasa.gov/mission_pages/hubble/main/index.html</a> <b><a href="http://www.nasa.gov/audience/formedia/features/MP_Photo_Guidelines.html" rel="nofollow">NASA image use policy.</a></b> <b><a href="http://www.nasa.gov/centers/goddard/home/index.html" rel="nofollow">NASA Goddard Space Flight Center</a></b> enables NASA’s mission through four scientific endeavors: Earth Science, Heliophysics, Solar System Exploration, and Astrophysics. Goddard plays a leading role in NASA’s accomplishments by contributing compelling scientific knowledge to advance the Agency’s mission. <b>Follow us on <a href="http://twitter.com/NASAGoddardPix" rel="nofollow">Twitter</a></b> <b>Like us on <a href="http://www.facebook.com/pages/Greenbelt-MD/NASA-Goddard/395013845897?ref=tsd" rel="nofollow">Facebook</a></b> <b>Find us on <a href="http://instagram.com/nasagoddard?vm=grid" rel="nofollow">Instagram</a></b>

This is an illustration of a supermassive black hole, weighing as much as 21 million suns, located in the middle of the ultradense galaxy M60-UCD1. The dwarf galaxy is so dense that millions of stars fill the sky as seen by an imaginary visitor. Because no light can escape from the black hole, it appears simply in silhouette against the starry background. The black hole's intense gravitational field warps the light of the background stars to form ring-like images just outside the dark edges of the black hole's event horizon. Combined observations by the Hubble Space Telescope and Gemini North telescope determined the presence of the black hole inside such a small and dense galaxy. More info: Astronomers using data from NASA’s Hubble Space Telescope and ground observation have found an unlikely object in an improbable place -- a monster black hole lurking inside one of the tiniest galaxies ever known. The black hole is five times the mass of the one at the center of our Milky Way galaxy. It is inside one of the densest galaxies known to date -- the M60-UCD1 dwarf galaxy that crams 140 million stars within a diameter of about 300 light-years, which is only 1/500th of our galaxy’s diameter. If you lived inside this dwarf galaxy, the night sky would dazzle with at least 1 million stars visible to the naked eye. Our nighttime sky as seen from Earth’s surface shows 4,000 stars. The finding implies there are many other compact galaxies in the universe that contain supermassive black holes. The observation also suggests dwarf galaxies may actually be the stripped remnants of larger galaxies that were torn apart during collisions with other galaxies rather than small islands of stars born in isolation. “We don’t know of any other way you could make a black hole so big in an object this small,” said University of Utah astronomer Anil Seth, lead author of an international study of the dwarf galaxy published in Thursday’s issue of the journal Nature. Seth’s team of astronomers used the Hubble Space Telescope and the Gemini North 8-meter optical and infrared telescope on Hawaii’s Mauna Kea to observe M60-UCD1 and measure the black hole’s mass. The sharp Hubble images provide information about the galaxy’s diameter and stellar density. Gemini measures the stellar motions as affected by the black hole’s pull. These data are used to calculate the mass of the black hole. Black holes are gravitationally collapsed, ultra-compact objects that have a gravitational pull so strong that even light cannot escape. Supermassive black holes -- those with the mass of at least one million stars like our sun -- are thought to be at the centers of many galaxies. The black hole at the center of our Milky Way galaxy has the mass of four million suns. As heavy as that is, it is less than 0.01 percent of the Milky Way’s total mass. By comparison, the supermassive black hole at the center of M60-UCD1, which has the mass of 21 million suns, is a stunning 15 percent of the small galaxy’s total mass. “That is pretty amazing, given that the Milky Way is 500 times larger and more than 1,000 times heavier than the dwarf galaxy M60-UCD1,” Seth said. One explanation is that M60-UCD1 was once a large galaxy containing 10 billion stars, but then it passed very close to the center of an even larger galaxy, M60, and in that process all the stars and dark matter in the outer part of the galaxy were torn away and became part of M60. The team believes that M60-UCD1 may eventually be pulled to fully merge with M60, which has its own monster black hole that weighs a whopping 4.5 billion solar masses, or more than 1,000 times bigger than the black hole in our galaxy. When that happens, the black holes in both galaxies also likely will merge. Both galaxies are 50 million light-years away. The Hubble Space Telescope is a project of international cooperation between NASA and the European Space Agency. NASA's Goddard Space Flight Center in Greenbelt, Maryland, manages the telescope. The Space Telescope Science Institute (STScI) in Baltimore conducts Hubble science operations. STScI is operated for NASA by the Association of Universities for Research in Astronomy, Inc., in Washington. For images and more information about Hubble, visit: <a href="http://www.nasa.gov/hubble" rel="nofollow">www.nasa.gov/hubble</a> <b><a href="http://www.nasa.gov/audience/formedia/features/MP_Photo_Guidelines.html" rel="nofollow">NASA image use policy.</a></b> <b><a href="http://www.nasa.gov/centers/goddard/home/index.html" rel="nofollow">NASA Goddard Space Flight Center</a></b> enables NASA’s mission through four scientific endeavors: Earth Science, Heliophysics, Solar System Exploration, and Astrophysics. Goddard plays a leading role in NASA’s accomplishments by contributing compelling scientific knowledge to advance the Agency’s mission. <b>Follow us on <a href="http://twitter.com/NASAGoddardPix" rel="nofollow">Twitter</a></b> <b>Like us on <a href="http://www.facebook.com/pages/Greenbelt-MD/NASA-Goddard/395013845897?ref=tsd" rel="nofollow">Facebook</a></b> <b>Find us on <a href="http://instagram.com/nasagoddard?vm=grid" rel="nofollow">Instagram</a></b>
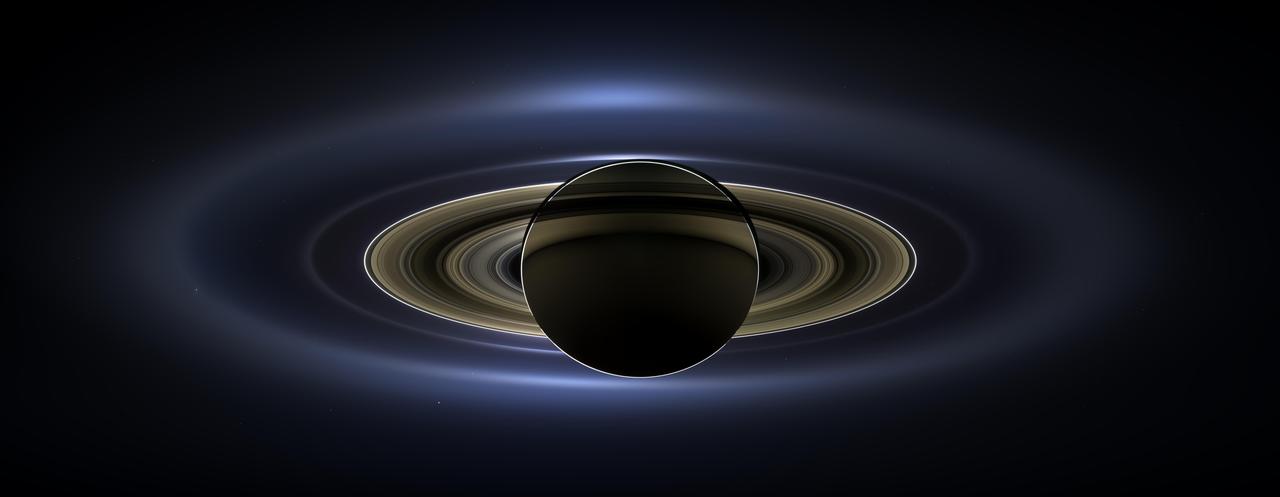
On July 19, 2013, in an event celebrated the world over, NASA's Cassini spacecraft slipped into Saturn's shadow and turned to image the planet, seven of its moons, its inner rings -- and, in the background, our home planet, Earth. With the sun's powerful and potentially damaging rays eclipsed by Saturn itself, Cassini's onboard cameras were able to take advantage of this unique viewing geometry. They acquired a panoramic mosaic of the Saturn system that allows scientists to see details in the rings and throughout the system as they are backlit by the sun. This mosaic is special as it marks the third time our home planet was imaged from the outer solar system; the second time it was imaged by Cassini from Saturn's orbit; and the first time ever that inhabitants of Earth were made aware in advance that their photo would be taken from such a great distance. With both Cassini's wide-angle and narrow-angle cameras aimed at Saturn, Cassini was able to capture 323 images in just over four hours. This final mosaic uses 141 of those wide-angle images. Images taken using the red, green and blue spectral filters of the wide-angle camera were combined and mosaicked together to create this natural-color view. A brightened version with contrast and color enhanced (Figure 1), a version with just the planets annotated (Figure 2), and an annotated version (Figure 3) are shown above. This image spans about 404,880 miles (651,591 kilometers) across. The outermost ring shown here is Saturn's E ring, the core of which is situated about 149,000 miles (240,000 kilometers) from Saturn. The geysers erupting from the south polar terrain of the moon Enceladus supply the fine icy particles that comprise the E ring; diffraction by sunlight gives the ring its blue color. Enceladus (313 miles, or 504 kilometers, across) and the extended plume formed by its jets are visible, embedded in the E ring on the left side of the mosaic. At the 12 o'clock position and a bit inward from the E ring lies the barely discernible ring created by the tiny, Cassini-discovered moon, Pallene (3 miles, or 4 kilometers, across). (For more on structures like Pallene's ring, see PIA08328). The next narrow and easily seen ring inward is the G ring. Interior to the G ring, near the 11 o'clock position, one can barely see the more diffuse ring created by the co-orbital moons, Janus (111 miles, or 179 kilometers, across) and Epimetheus (70 miles, or 113 kilometers, across). Farther inward, we see the very bright F ring closely encircling the main rings of Saturn. Following the outermost E ring counter-clockwise from Enceladus, the moon Tethys (662 miles, or 1,066 kilometers, across) appears as a large yellow orb just outside of the E ring. Tethys is positioned on the illuminated side of Saturn; its icy surface is shining brightly from yellow sunlight reflected by Saturn. Continuing to about the 2 o'clock position is a dark pixel just outside of the G ring; this dark pixel is Saturn's Death Star moon, Mimas (246 miles, or 396 kilometers, across). Mimas appears, upon close inspection, as a very thin crescent because Cassini is looking mostly at its non-illuminated face. The moons Prometheus, Pandora, Janus and Epimetheus are also visible in the mosaic near Saturn's bright narrow F ring. Prometheus (53 miles, or 86 kilometers, across) is visible as a faint black dot just inside the F ring and at the 9 o'clock position. On the opposite side of the rings, just outside the F ring, Pandora (50 miles, or 81 kilometers, across) can be seen as a bright white dot. Pandora and Prometheus are shepherd moons and gravitational interactions between the ring and the moons keep the F ring narrowly confined. At the 11 o'clock position in between the F ring and the G ring, Janus (111 miles, or 179 kilometers, across) appears as a faint black dot. Janus and Prometheus are dark for the same reason Mimas is mostly dark: we are looking at their non-illuminated sides in this mosaic. Midway between the F ring and the G ring, at about the 8 o'clock position, is a single bright pixel, Epimetheus. Looking more closely at Enceladus, Mimas and Tethys, especially in the brightened version of the mosaic, one can see these moons casting shadows through the E ring like a telephone pole might cast a shadow through a fog. In the non-brightened version of the mosaic, one can see bright clumps of ring material orbiting within the Encke gap near the outer edge of the main rings and immediately to the lower left of the globe of Saturn. Also, in the dark B ring within the main rings, at the 9 o'clock position, one can see the faint outlines of two spoke features, first sighted by NASA's Voyager spacecraft in the early 1980s and extensively studied by Cassini. Finally, in the lower right of the mosaic, in between the bright blue E ring and the faint but defined G ring, is the pale blue dot of our planet, Earth. Look closely and you can see the moon protruding from the Earth's lower right. (For a higher resolution view of the Earth and moon taken during this campaign, see PIA14949.) Earth's twin, Venus, appears as a bright white dot in the upper left quadrant of the mosaic, also between the G and E rings. Mars also appears as a faint red dot embedded in the outer edge of the E ring, above and to the left of Venus. For ease of visibility, Earth, Venus, Mars, Enceladus, Epimetheus and Pandora were all brightened by a factor of eight and a half relative to Saturn. Tethys was brightened by a factor of four. In total, 809 background stars are visible and were brightened by a factor ranging from six, for the brightest stars, to 16, for the faintest. The faint outer rings (from the G ring to the E ring) were also brightened relative to the already bright main rings by factors ranging from two to eight, with the lower-phase-angle (and therefore fainter) regions of these rings brightened the most. The brightened version of the mosaic was further brightened and contrast-enhanced all over to accommodate print applications and a wide range of computer-screen viewing conditions. Some ring features -- such as full rings traced out by tiny moons -- do not appear in this version of the mosaic because they require extreme computer enhancement, which would adversely affect the rest of the mosaic. This version was processed for balance and beauty. This view looks toward the unlit side of the rings from about 17 degrees below the ring plane. Cassini was approximately 746,000 miles (1.2 million kilometers) from Saturn when the images in this mosaic were taken. Image scale on Saturn is about 45 miles (72 kilometers) per pixel. This mosaic was made from pictures taken over a span of more than four hours while the planets, moons and stars were all moving relative to Cassini. Thus, due to spacecraft motion, these objects in the locations shown here were not in these specific places over the entire duration of the imaging campaign. Note also that Venus appears far from Earth, as does Mars, because they were on the opposite side of the sun from Earth. http://photojournal.jpl.nasa.gov/catalog/PIA17172