
A NASA T-38 training jet is seen as it flies at 1500 feet over Washington, DC, Thursday, April 5, 2012. NASA, in cooperation with the Federal Aviation Administration, conducted training and photographic flights over the DC metropolitan area. T-38 aircraft have been used for astronaut training for more than 30 years as they allow pilots and mission specialists to think quickly in changing situations, mental experiences the astronauts say are critical to practicing for the rigors of spaceflight. Photo Credit: (NASA/Carla Cioffi)
The towns of Santa Claus, Ga., (top) and Santa Claus, Ind. (bottom), are shown in these two images from the Advanced Spaceborne Thermal Emission and Reflection Radiometer (ASTER) instrument on NASA's Terra satellite. They are the only two Santa Claus towns in the United States with post offices and zip codes, although there are 11 towns with this name in the United States. Santa Claus, Ga. is located in Toombs County, and has a population of 237. Santa Claus, Ind. is located in Spencer County, and has a population of 2,041. Its name was accepted by the United States Postal Service in 1856. The images were acquired on July 3, 2000 (top) and June 16, 2001 (bottom), respectively. http://photojournal.jpl.nasa.gov/catalog/PIA03891

Space shuttle Discovery, mounted atop a NASA 747 Shuttle Carrier Aircraft (SCA) is seen from Top of the Town in Arlington, Virginia as it flies near the U.S. Capitol, Tuesday, April 17, 2012, in Washington. Discovery, the first orbiter retired from NASA’s shuttle fleet, completed 39 missions, spent 365 days in space, orbited the Earth 5,830 times, and traveled 148,221,675 miles. NASA will transfer Discovery to the National Air and Space Museum to begin its new mission to commemorate past achievements in space and to educate and inspire future generations of explorers. Photo Credit: (NASA/Chris Gunn)
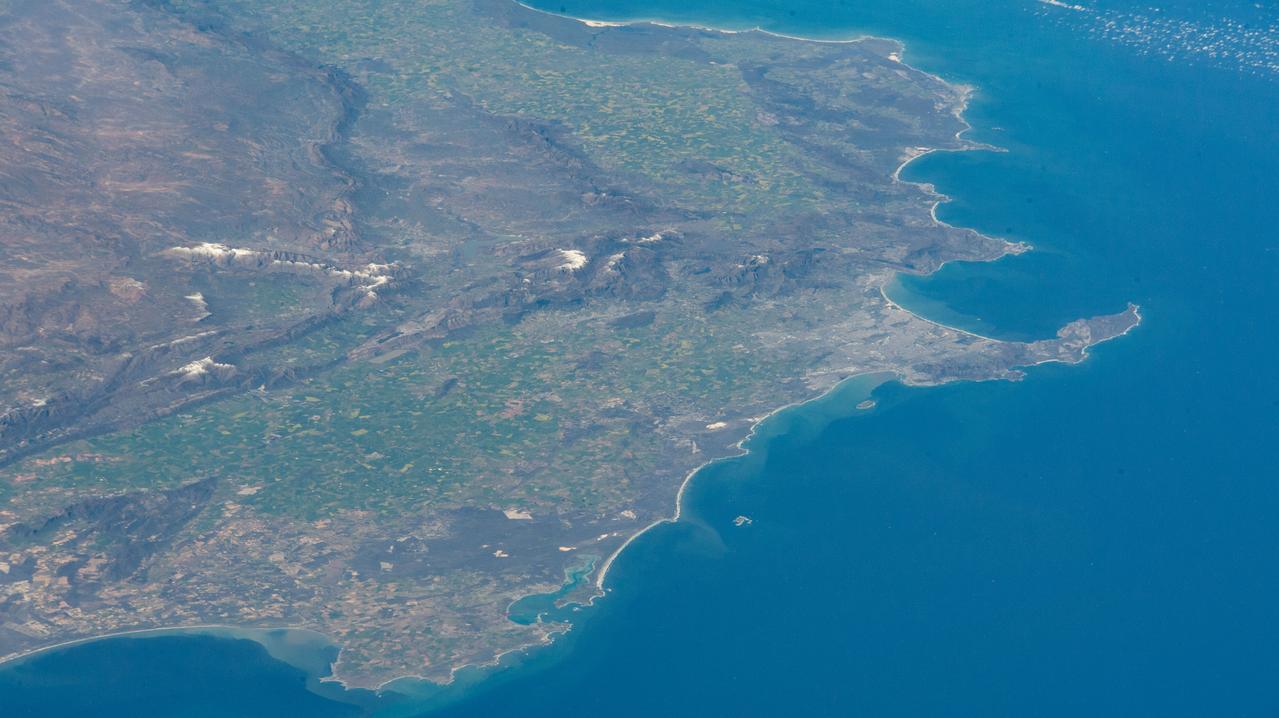
iss071e580719 (Aug. 30, 2024) -- The coastline of South Africa, with Cape Town and the False Bay situated at the top right of the image, is pictured from the International Space Station as it orbited 265 miles above.
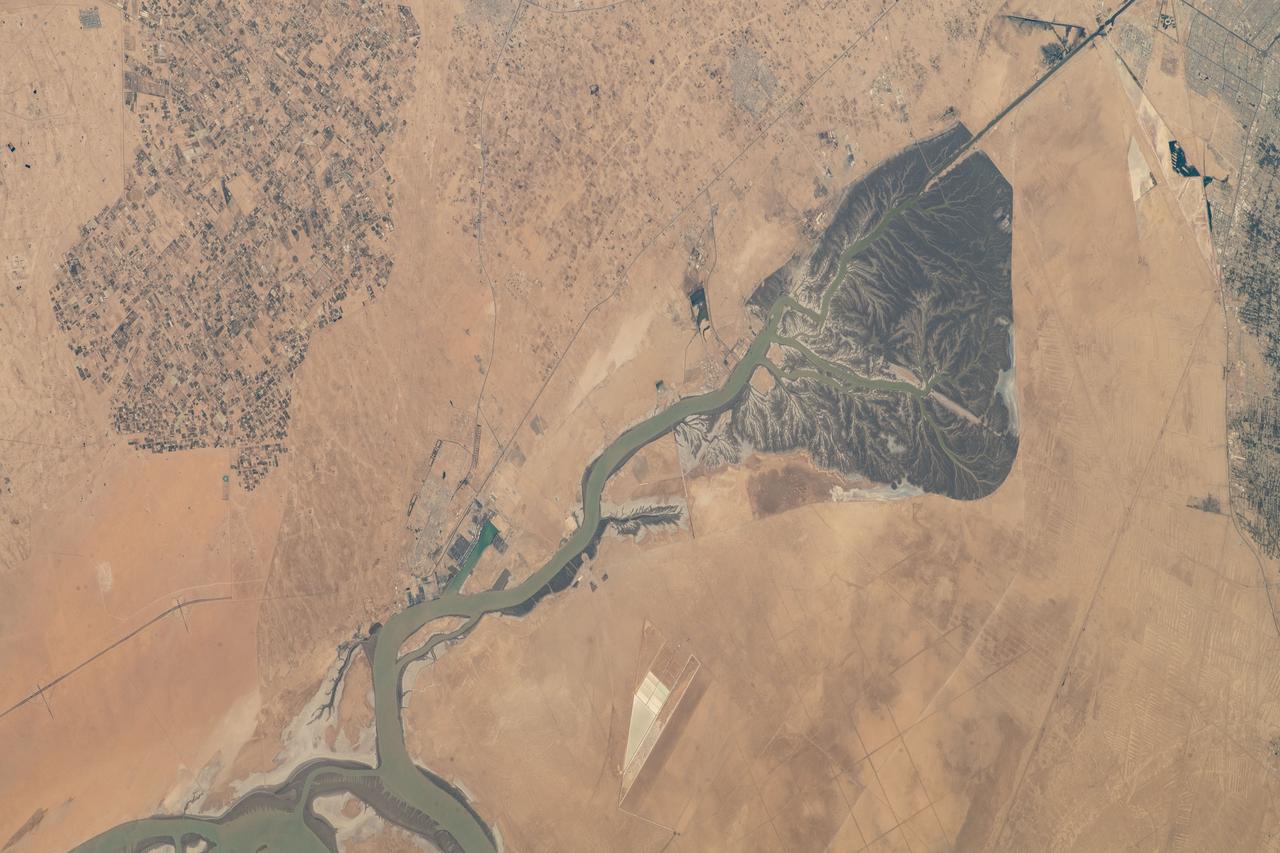
iss067e169965 (July 1, 2022) --- The Khawr az-Zubayr Waterway (at bottom) separates the Middle Eastern nations of Kuwait and Iraq on the Persian Gulf coast. At top left, is the desert town of Abdali, Kuwait. At right, is the fertile, agricultural town of Abu Al-Khaseeb, Iraq. The International Space Station was orbiting 262 miles above Saudi Arabia near the island nation of Bahrain at the time this photograph was taken.
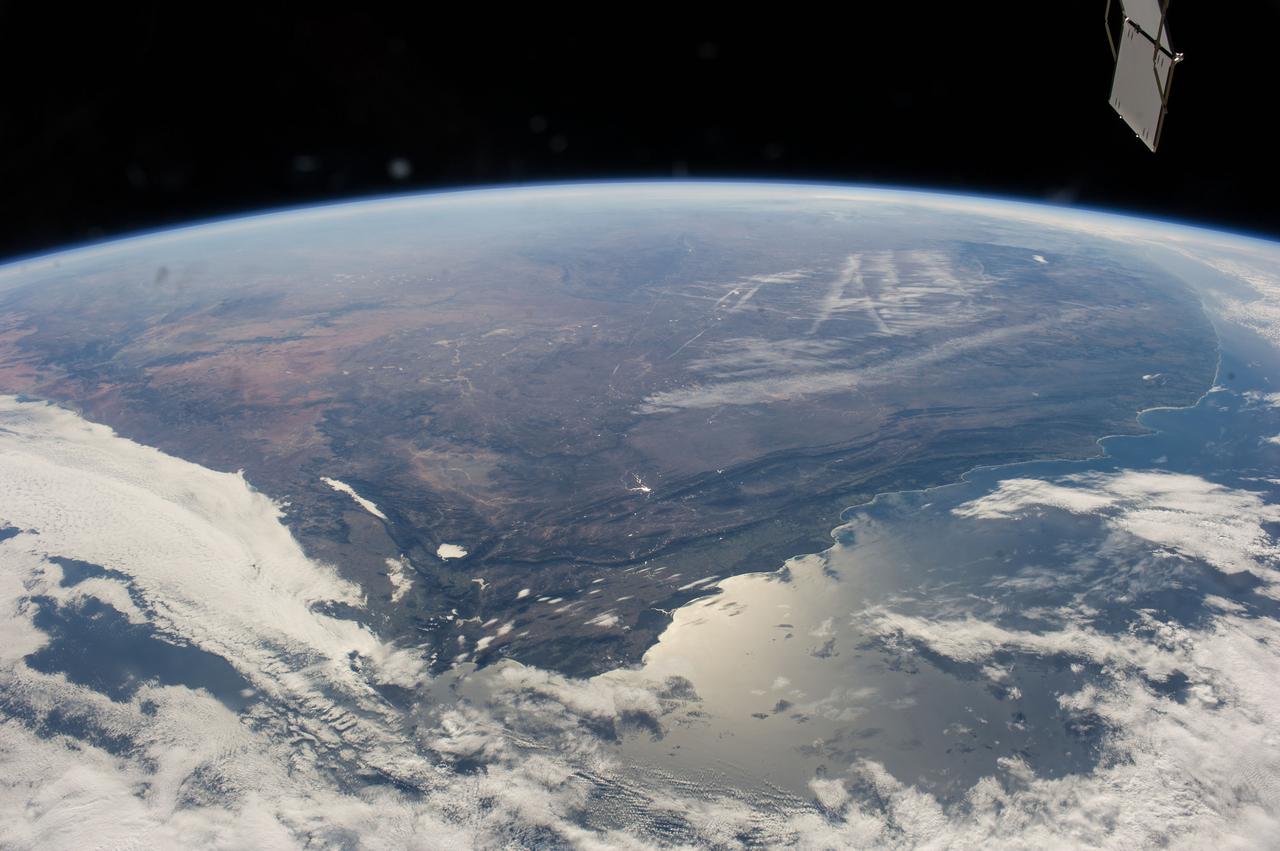
ISS040-E-006271 (31 May 2014) --- One of the Expedition 40 crew members aboard the Earth-orbiting International Space Station captured this panoramic image of South Africa on May 31, 2014. A combination of contrails and a bit of winter mist appears to have formed alphabetic and/or numeric characters in the upper right near the horizon. Sun glint off the south coast is slightly confusing as it is similar in brightness to the west-coast cloud cover, where an Atlantic storm rolls in. The Cape Fold Mountains cross the center of the view, going east from the Cape Town region (clouds obscure the Cape peninsula which normally serves as an icon for this part of Africa). A popular winegrowing region attributable to the Mediterranean climate is the area around Cape Town near lower left. Witwatersrand lies at the top of the picture obscured by the seemingly ever-present winter smoke and smog. The Orange River valley appears as a dark, nearly horizontal line at left.
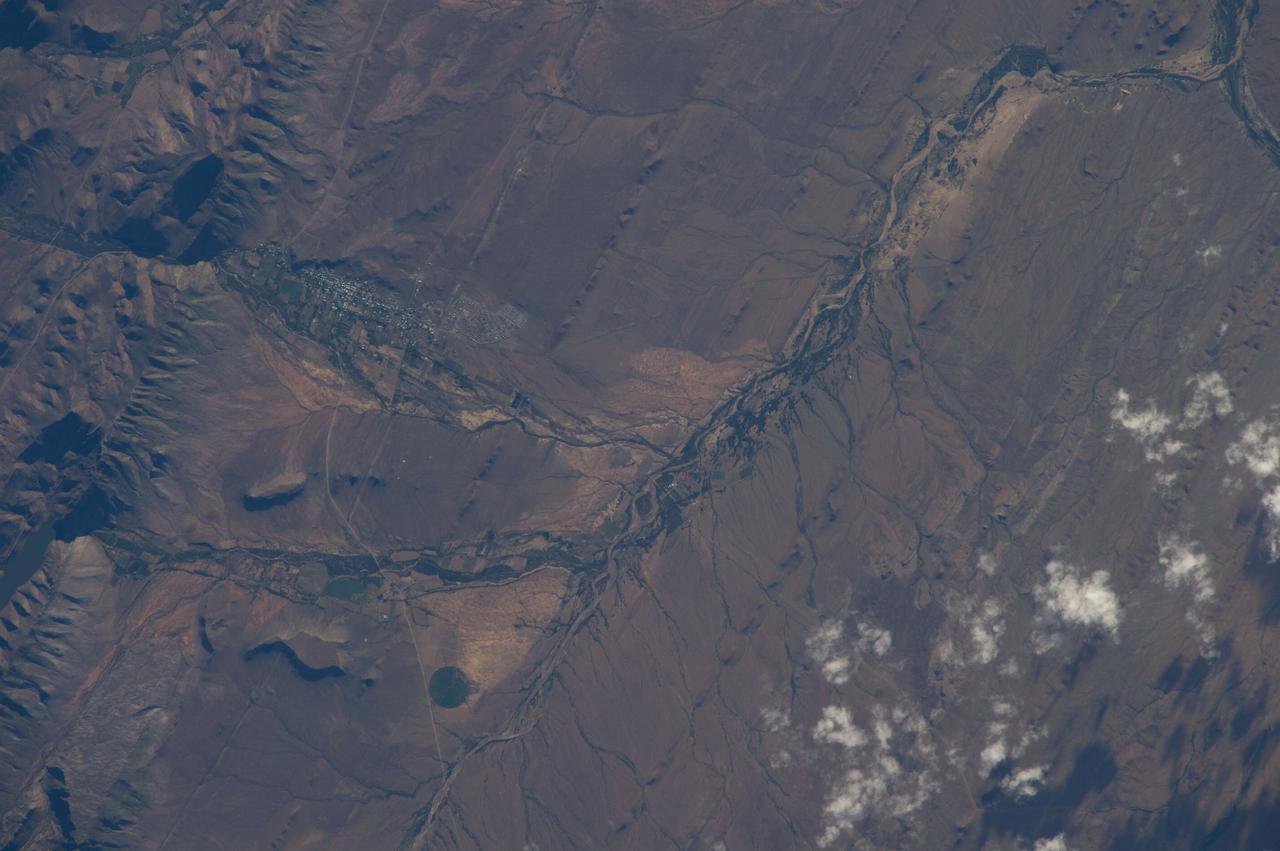
ISS038-E-039032 (30 Jan. 2014) --- Prince Albert, South Africa is featured in this image photographed by an Expedition 38 crew member on the International Space Station. Space station crews sometimes take detailed images with an 800mm lens, such as this view of the small town of Prince Albert (population just more than 7,000). The town lies at the foot of the mountains known as the Great Swartberg in southern South Africa, about 220 miles (355 kilometers) east of Cape Town. Prince Albert, named after Queen Victoria's husband, appears as a cluster of whitewashed buildings (left) at the foot of the mountains, larger dwellings nearer the steep mountain front and smaller dwellings further away. Despite its small size, the dry climate and the water supply from gorges immediately upstream (a small reservoir appears extreme left) have made it well-known as a productive point in the Karroo semidesert. Olive groves especially, with other crops, flourish on the valleys floors, surrounded by sheep and ostrich ranches. Founded 250 years ago, this small town retains more than a dozen registered historic buildings in the Victorian and Cape Dutch styles. Based on this and other small Karroo towns as get-aways from South Africa's large, crowded cities, tourism has developed significantly in the last 20 years. Swartberg means Black Mountain in Afrikaans, and winter snow (not visible in this image) along the mountain tops (4,500-6,500 feet; 1,370-1,980 meters, above the town) makes for spectacular scenery. The mountains are part of the ancient Cape Fold Mountain Belt. Gorges through the mountains provide impressive side-on views of tightly folded and broken rock layers associated with the mountain-building episode.

jsc2023e038731 (6/22/2023) --- Two types of Hoshi-Tomo badges were designed by students. “Hoshi” implies star(s), planet(s), or the Earth in Japanese. “Tomo” means friend(s) in Japanese. Top: The Design Team (five students) at Mizuho Junior High School (Japan, Tokyo). Bottom: The Designer (one student) at Mizuho Dai-Ni Junior High School (Japan, Tokyo). I-Space Essay provides students and teachers the online opportunity to create wishes, which are delivered to the International Space Station's Japanese Experimental Module Kibo. Image courtesy of Mizuho Town Education Board and IHI Corporation.
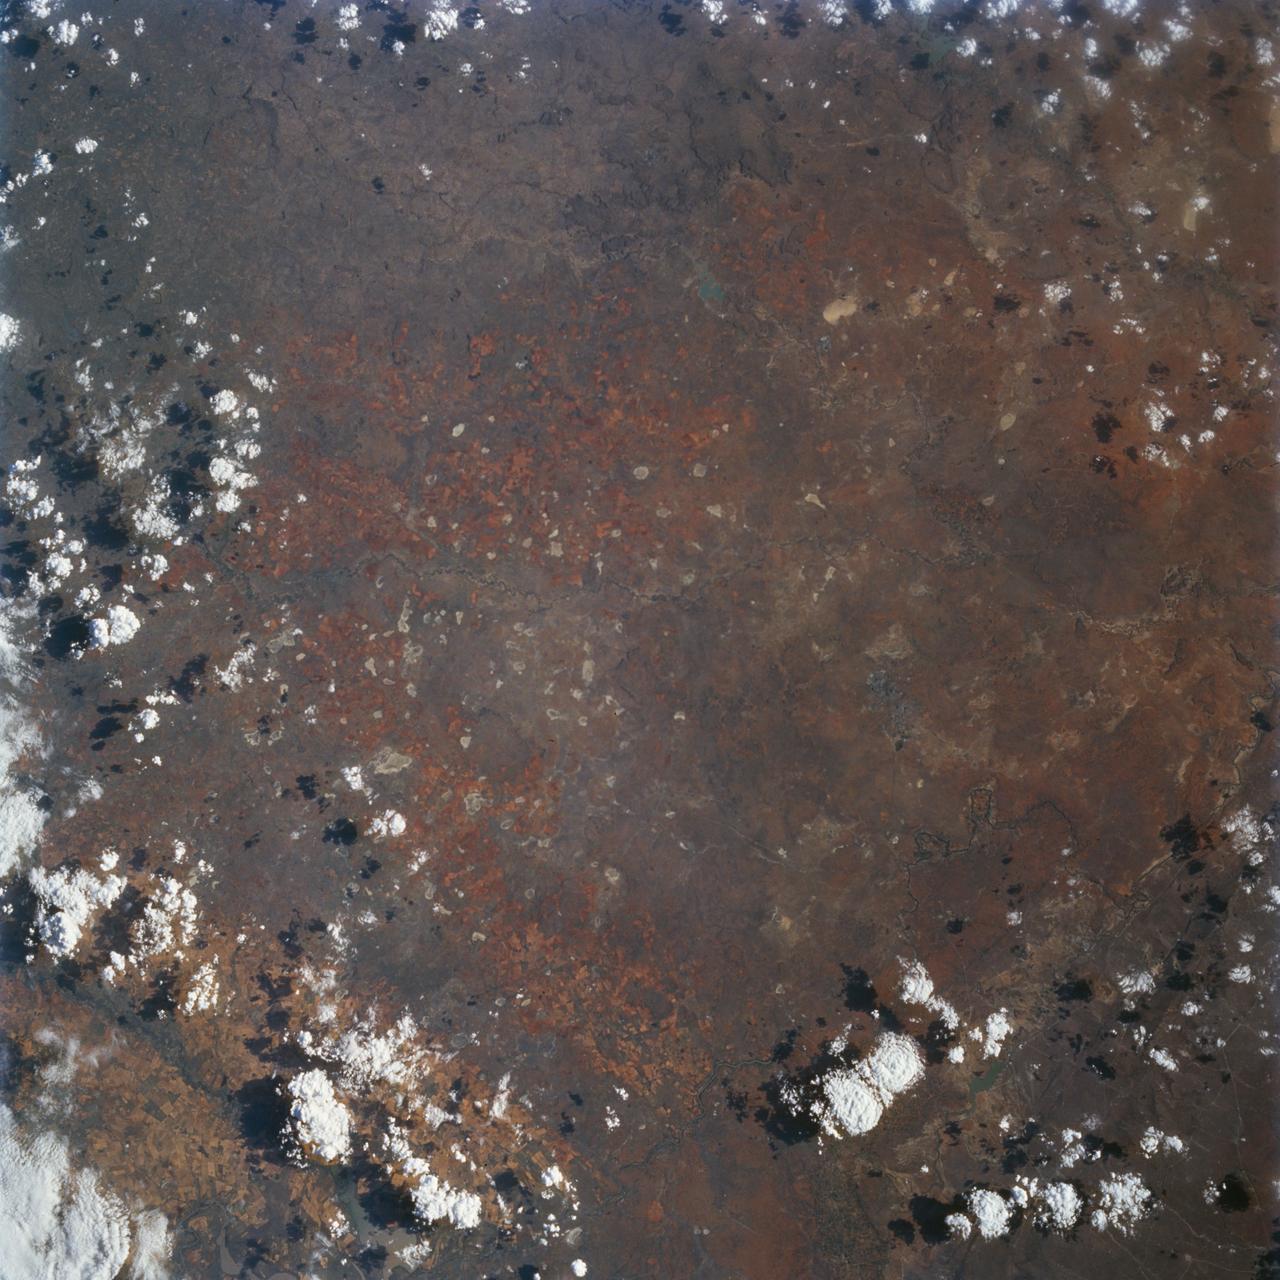
STS072-727-059 (11-20 Jan. 1996) --- Plains of the Orange Free State, South Africa are featured in this 70mm frame exposed from the Space Shuttle Endeavour. If the photograph is oriented with the largest clouds at the top edge, so that the cloud shadows fall to the upper right of each cloud, then north is to the top. The Vaal River flows along the top and through the upper left of the photograph; the reservoir of the Bloemhofdam on the Sand River can be seen between clouds at the upper right of the photograph. Kimberley can be seen as a gray smudge southeast of a contorted set of bends in the Vaal river (upper left center). With high magnification four dark dots, large open-pit mine shafts, can be seen within the gray smudge of the city. Kimberley, the capital of Northern Cape Province, was founded in 1878 after the discovery of diamonds in 1969 - 71, and reached by railway in 1885. Diamond mining and gem cutting remain prominent in the economy. The reddish soil and scattered salt pans (playa lakes) across the plateau suggest the semi-arid climate, suitable for cattle ranching. Reservoirs on most streams now provide water for the towns as well as irrigation for agriculture.
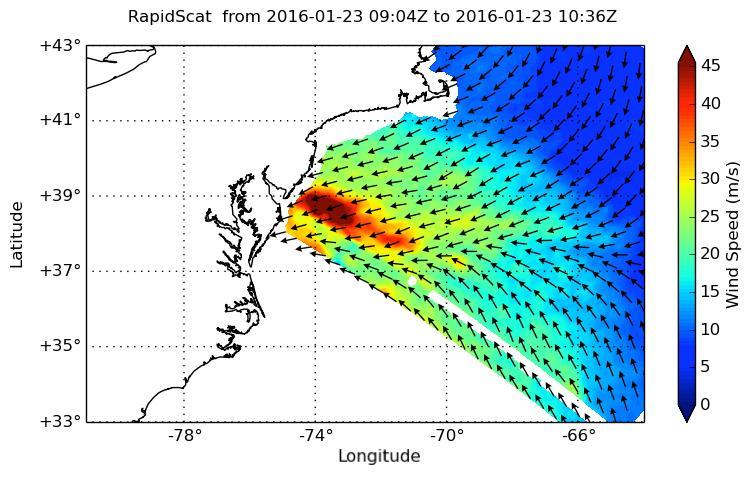
NASA's ISS-RapidScat instrument on the International Space Station provided a look at the strong winds that led to coastal flooding in southern New Jersey during the historic winter storm that blanketed much of the U.S. East Coast, starting Jan. 23, 2016. At 2 a.m. PST on Jan. 23, RapidScat showed sustained winds as strong as 45 meters per second (100 mph/162 kilometers per hour) along the coast of southern New Jersey. Many beachfront towns in this region were flooded as winds pushed ocean waters inland. The town of Cape May, New Jersey, reported a flood level of 8.98 feet (2.74 meters) -- the highest on record. This image shows ocean winds near the surface off the U.S. East Coast, from the hook of Cape Cod at top center to the South Carolina coastline at bottom left. Southern New Jersey and the northern edge of Delaware are directly in the path of the highest wind speeds. http://photojournal.jpl.nasa.gov/catalog/PIA20366
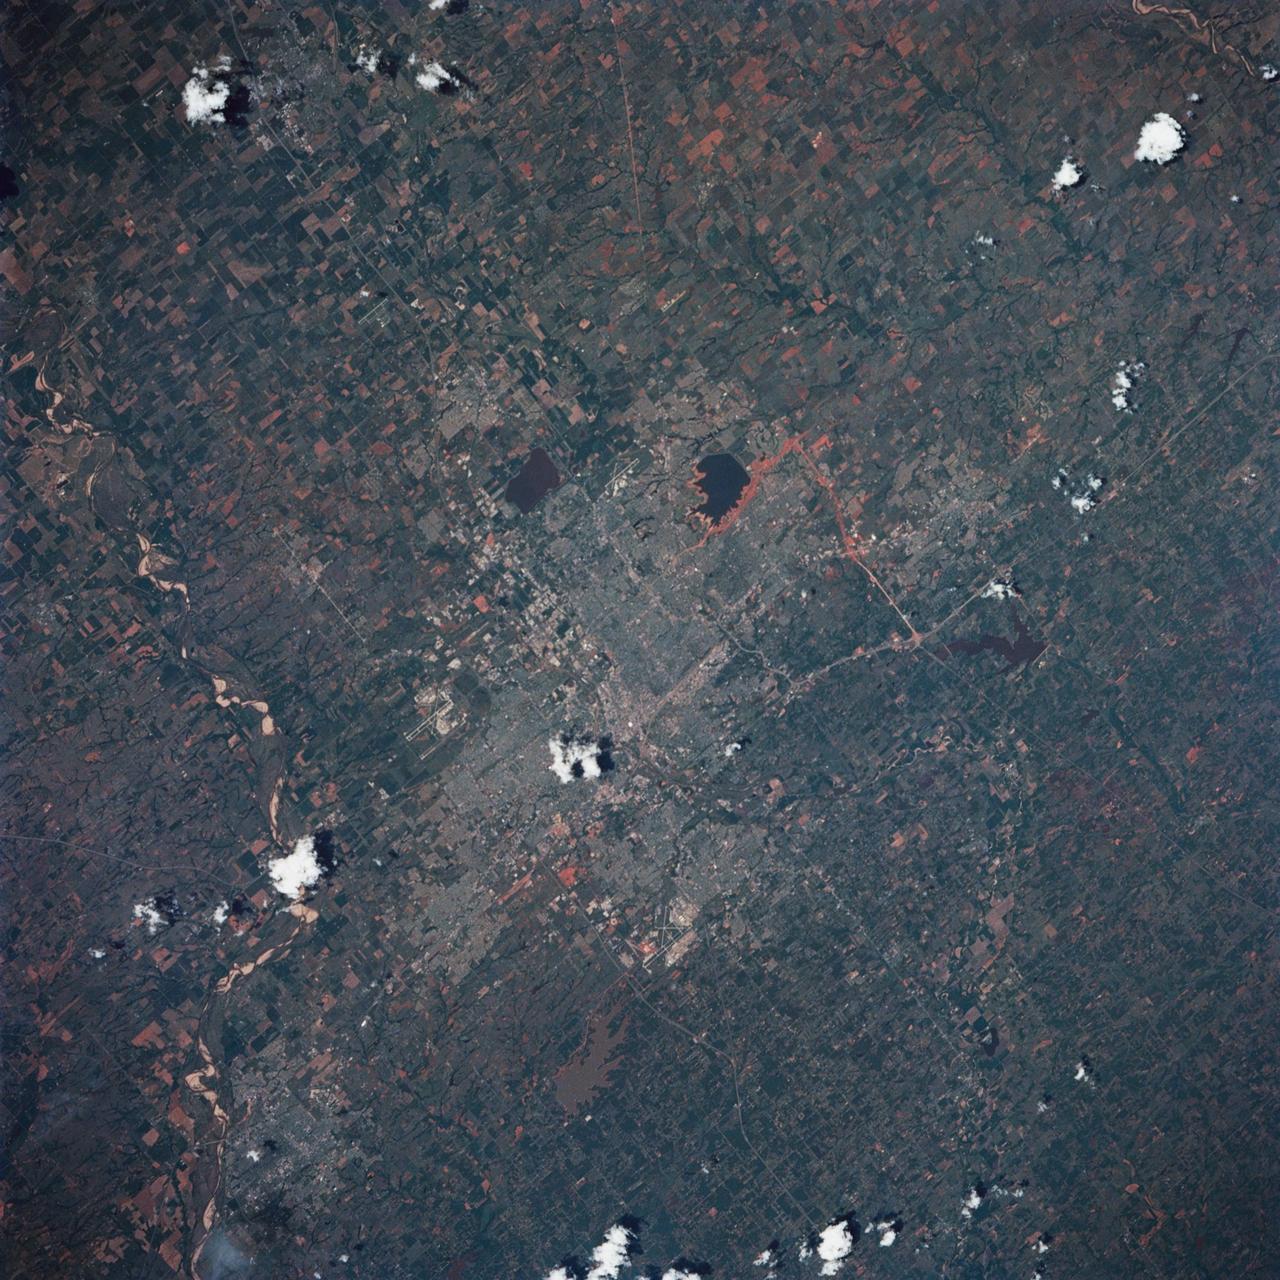
STS039-85-029 (28 April-6 May 1991) --- This 70mm frame is one of the best pictures of the Oklahoma City area from the manned space program, according to NASA photo experts studying STS-39 onboard photography. The central business district is near the center. Several municipalities are visible, along with thousands of acres of farmland. The towns of Norman and Moore and the South Canadian River are in the bottom (south). El Reno and Wiley Post Field off I-40W are just below center in lower left quadrant. Edmond is seen at the top (north). Tinker Field can be seen north of I-40E at right center. Lake Overholser shows recent spring rainfall northwest of the central business district.
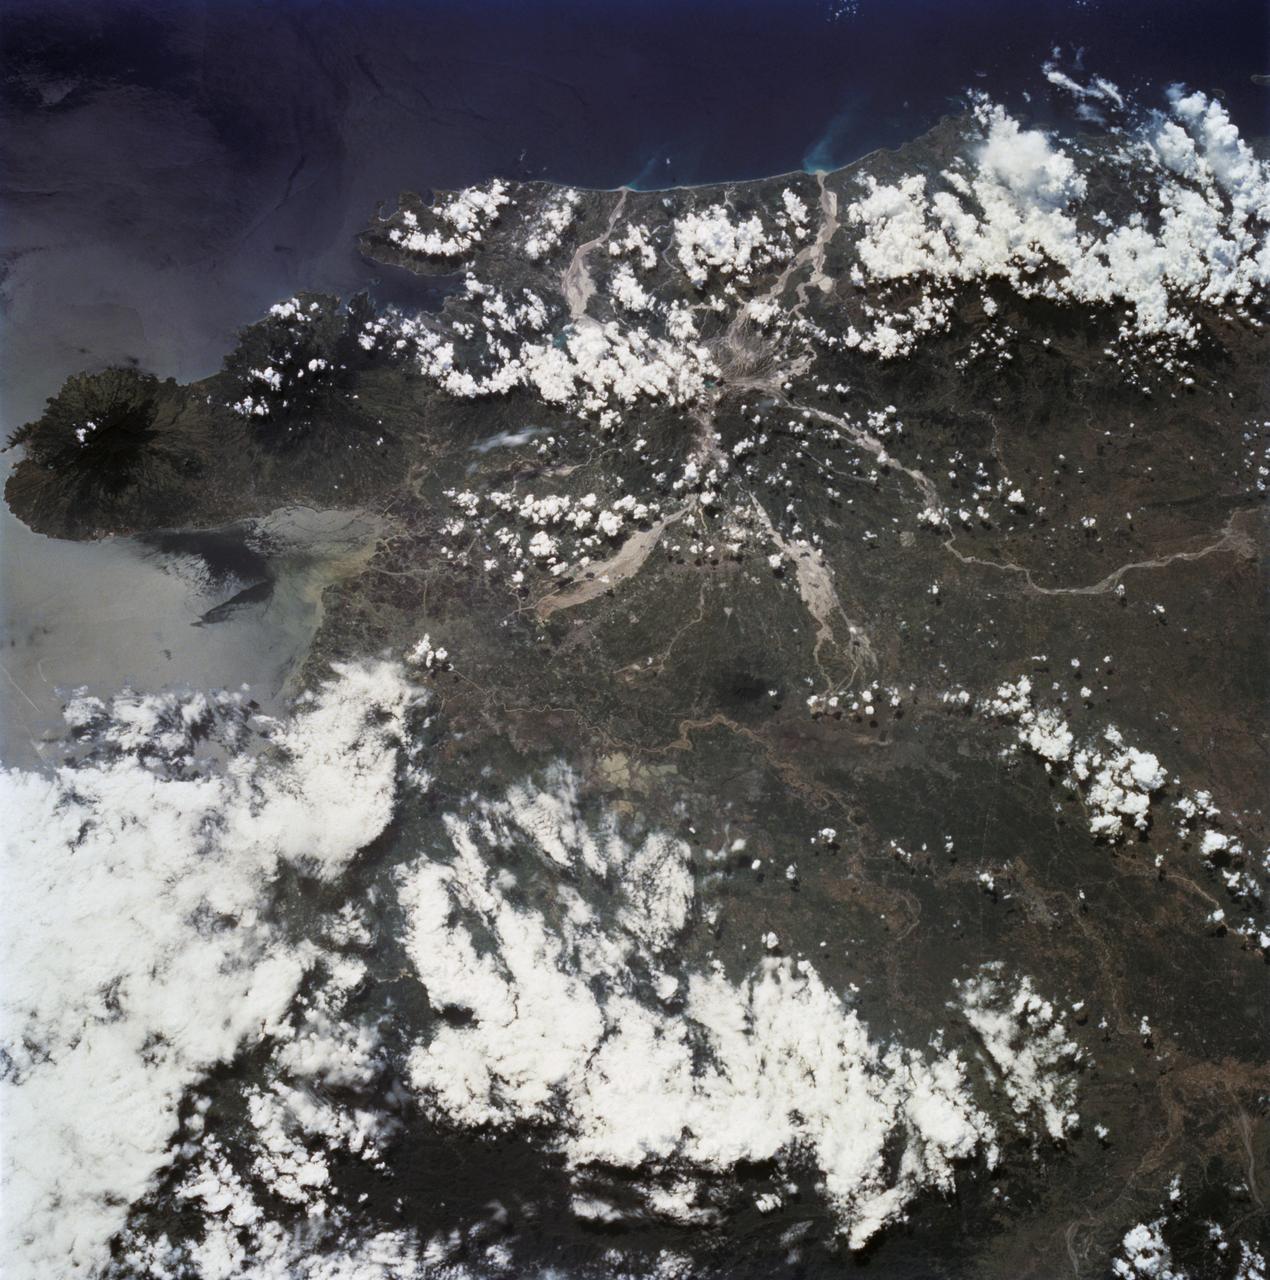
STS068-232-083 (30 September-11 October 1994) --- This is a view of Mount Pinatubo, Philippine Islands, orient with the coast to the top. View westward across central Luzon and Mount Pinatubo. Manilla Bay is in partial sunglint along the left edge of the frame. The extensive flows of volcanic ash (lahars) extending from the mountain are readily seen despite partial cloud cover. The ash is mobilized with every rain in this typhoon-ridden region, flowing down valleys, filling drainage channels, and covering fields and towns. The STS-68 crew obtained excellent photographs of the region, for comparison to the radar data also obtained on the mission. Photographs in sunglint have proven particularly helpful because they show the exact outlines of surface water, which provides a datum point for the radar returns.

STS058-77-083 (18 Oct-1 Nov 1993) --- In this scene of the south coast of Africa, Cape Agulhas, the southernmost point on the continent, appears as the leftmost cape. Viewed with the Earth's limb top left, clouds at bottom, the view direction is west and north top right. The Cape of Good Hope, with Cape Town nearby, is the thin spike beyond. The great bay in the foreground is Algoa Bay with the city of Port Elizabeth. This was the first time European voyagers are known to have rounded the Cape of Good Hope in their quest to reach India by sea. The entire fold mountain belt of southern Africa is visible: these mountains appear as green (forested) wavy structures stretching west form the foreground, to the Cape of Good Hope, and then northwards some distance. One theory about their origin is that the Falkland Plateau, now an undersea extension of South America, was jostled up against Africa more than 150 million years ago, in times before the Atlantic Ocean existed, before Africa and South America drifted apart from one another. The jostling caused the evolution of the fold mountain belt.
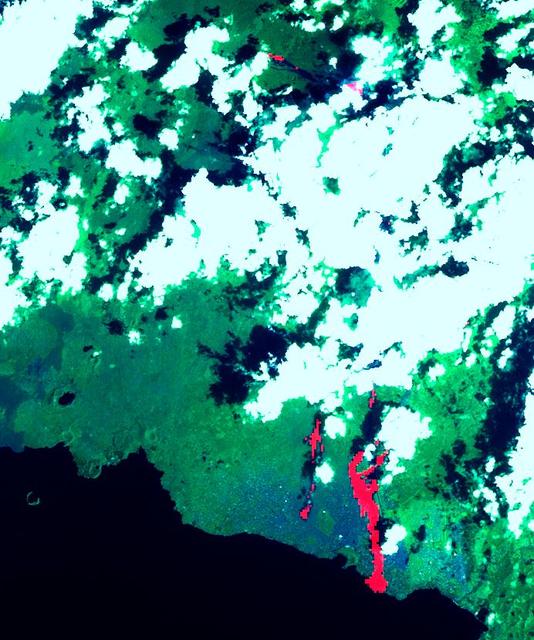
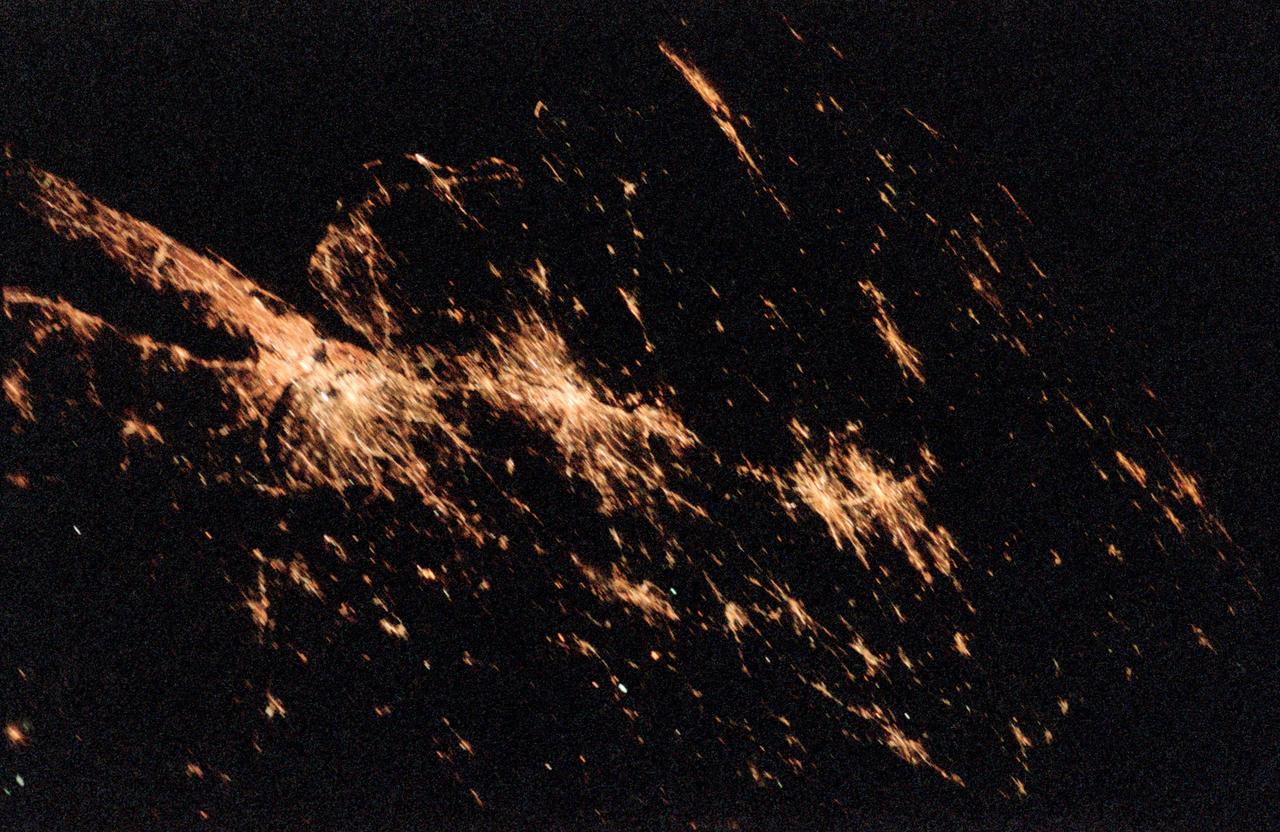
This image of the Nyiragonga volcano eruption in the Congo was acquired on January 28, 2002 by the Advanced Spaceborne Thermal Emission and Reflection Radiometer (ASTER) on NASA's Terra satellite. With its 14spectral bands from the visible to the thermal infrared wavelength region, and its high spatial resolution of 15 to 90 meters about 50 to 300 feet ), ASTER will image Earth for the next 6 years to map and monitor the changing surface of our planet. Image: A river of molten rock poured from the Nyiragongo volcano in the Congo on January 18, 2002, a day after it erupted, killing dozens, swallowing buildings and forcing hundreds of thousands to flee the town of Goma. The flow continued into Lake Kivu. The lave flows are depicted in red on the image indicating they are still hot. Two of them flowed south form the volcano's summit and went through the town of Goma. Another flow can be seen at the top of the image, flowing towards the northwest. One of Africa's most notable volcanoes, Nyiragongo contained an active lava lake in its deep summit crater that drained catastrophically through its outer flanks in 1977. Extremely fluid, fast-moving lava flows draining from the summit lava lake in 1977 killed 50 to 100 people, and several villages were destroyed. The image covers an area of 21 x 24 km and combines a thermal band in red, and two infrared bands in green and blue. http://photojournal.jpl.nasa.gov/catalog/PIA03462
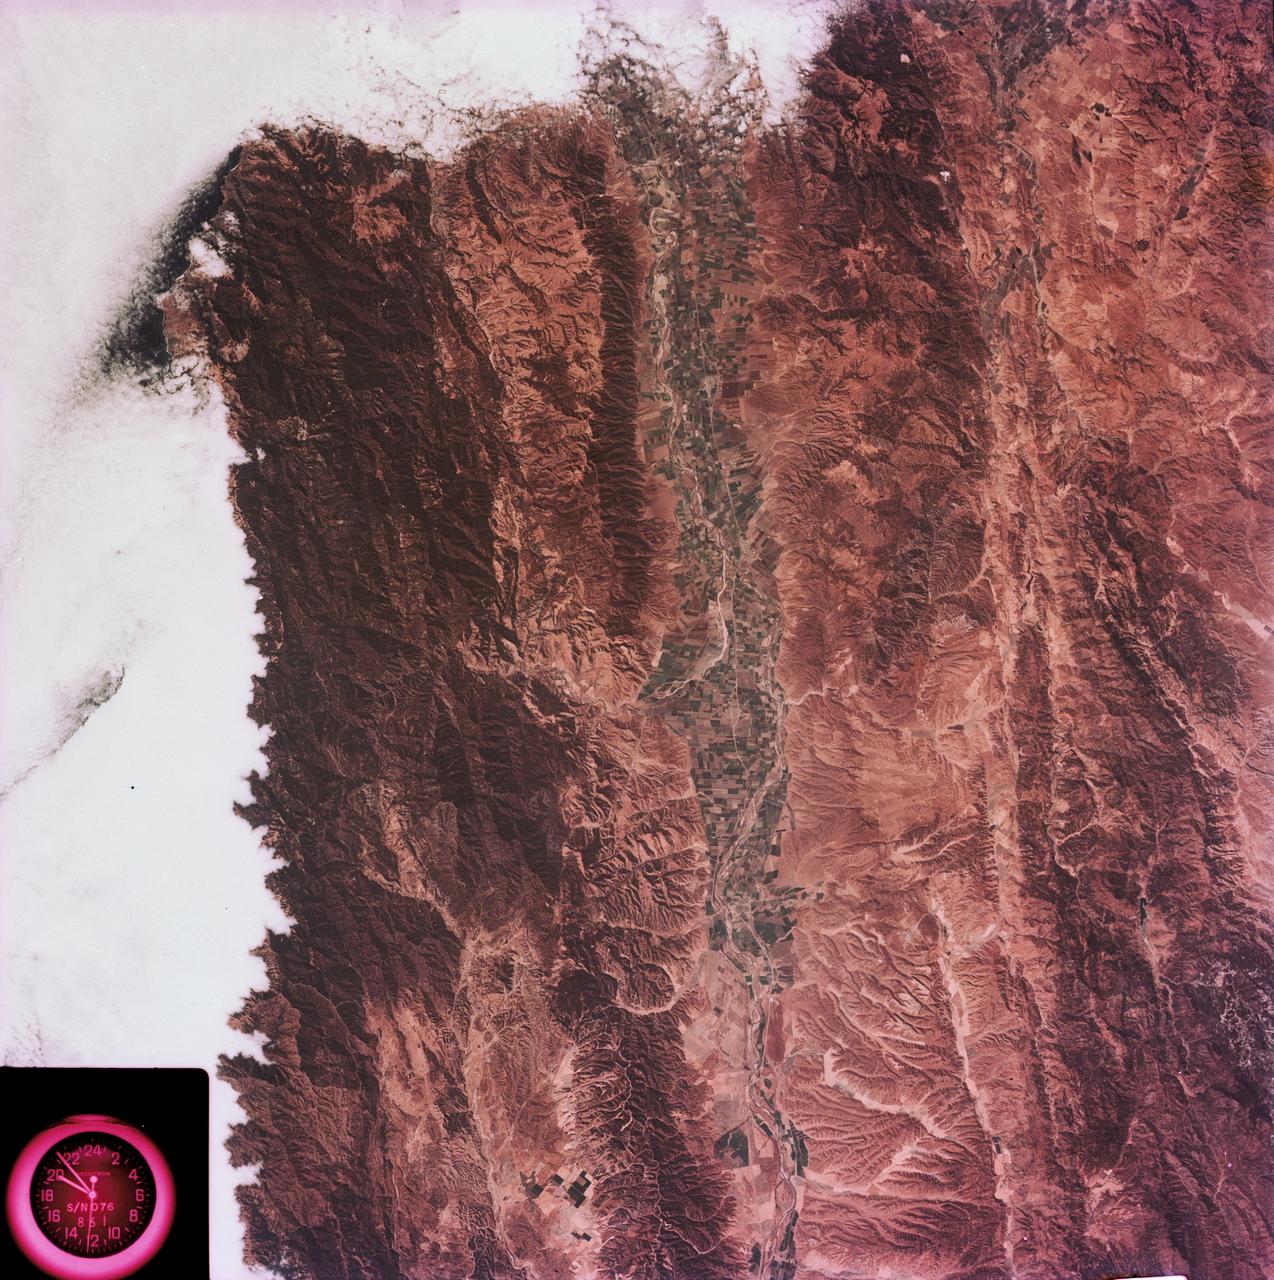
SL3-88-004 (July-September 1973) --- A vertical view of the Salinas River Valley area south of Monterey Bay, California area is seen in this Skylab 3 Earth Resources Experiments Package S190-B (five-inch Earth terrain camera) photograph taken from the Skylab space station in Earth orbit. The valley is an irrigated agricultural area, and is indicated by the dark-green and light-gray rectangular patterns in the centre of the picture. The city of Salinas is barely visible under the cloud cover at the top (north) end of the valley. The dark mass on the left (west) side of the valley is the Santa Lucia mountain range. The Big Sur area is on the left and partly covered by clouds. The Diablo Range forms the dark mass in the lower right (southeast) corner of the photograph. The town of Hollister is the gray area in the dark-green rectangular farm tracts which occupy the floor of the San Benito Valley in the upper right (northeast) corner of the photograph. The Salinas River flows northwestward toward Monterey Bay. The towns of Soledad, Greenfield and King City appear as gray areas along U.S. 101 in the Salinas Valley. The geology of the area is complex, and has been racked by several earthquakes resulting from movement along the San Andreas and subsidiary faults. Here, the surface expression of the San Andreas Fault can be traced from a point just west of Hollister at the contrast of dark brown and tan to a point about one inch left of the lower right (southeast) corner of the picture. Subsidiary faults are indicated by the curving trend of the rocks along the right side. The photograph will provide detailed information on land use patterns (Dr. R. Colwell, University of California, Berkeley) and fault tectonics (Dr. P. Merifield, Earth Science Res., Inc. and Dr. M. Abdel-Gawad, Rockwell International). Federal agencies participating with NASA on the EREP project are the Departments of Agriculture, Commerce, Interior, the Environmental Protection Agency and the Corps of Engineers. All EREP photography is available to the public through the Department of Interior’s Earth Resources Observations Systems Data Center, Sioux Falls, South Dakota, 57198. Photo credit: NASA
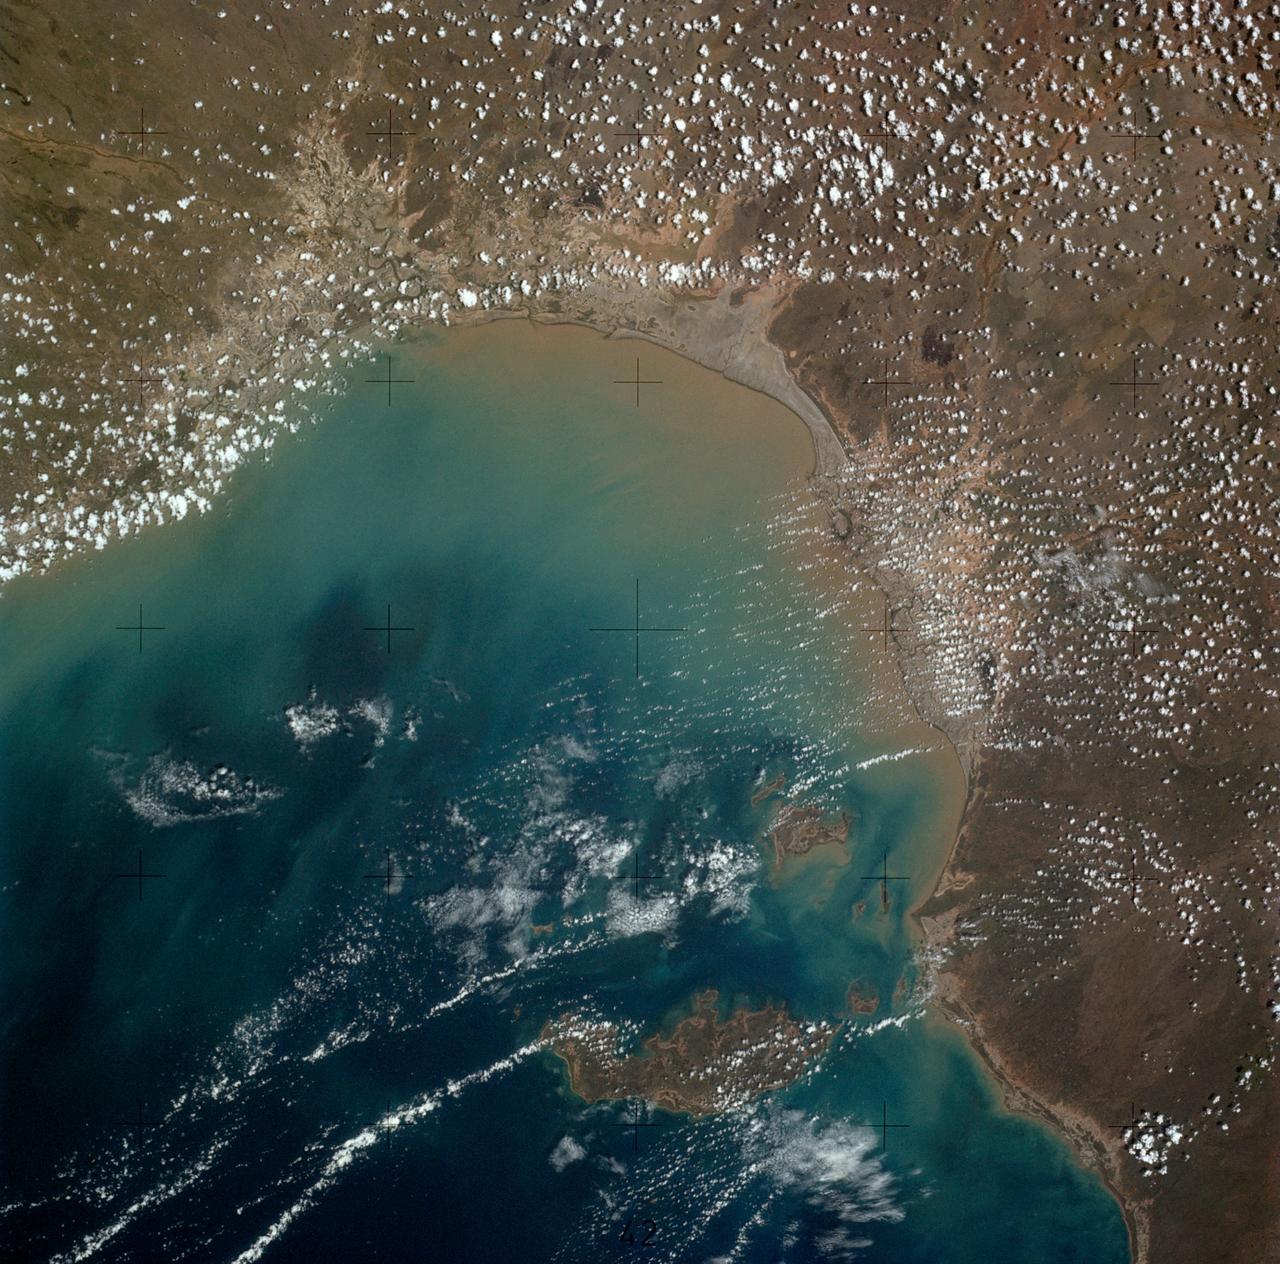
SL4-136-3501 (6 Dec. 1973) --- A vertical view of a portion of the State of Queensland, Australia, as photographed from the Skylab space station in Earth orbit by one of the Skylab 4 crewmen. The camera used was a hand-held 70mm Hasselblad, with SO-368 medium speed Ektachrome film. The body of water is the southeastern part of the Gulf of Carpentaria. This picture was taken in support studies of the north Australian drought region. The largest island seen is Mornington. The town of Normanton can also be seen. Of interest here is the sediment-laden waters at the perimeter of the Gulf showing how rains at the end of the drought are washing the top soil into the sea after the drought killed the covering vegetation. Also noted is that the vegetation patterns tend more toward those of other arid regions (i.e. they follow topographic and hydrographic patterns) rather than those in other parts of Australia (i.e. more convenient and easier to see, rectilinear patterns which are prevalent in less arid areas). Photo credit: NASA
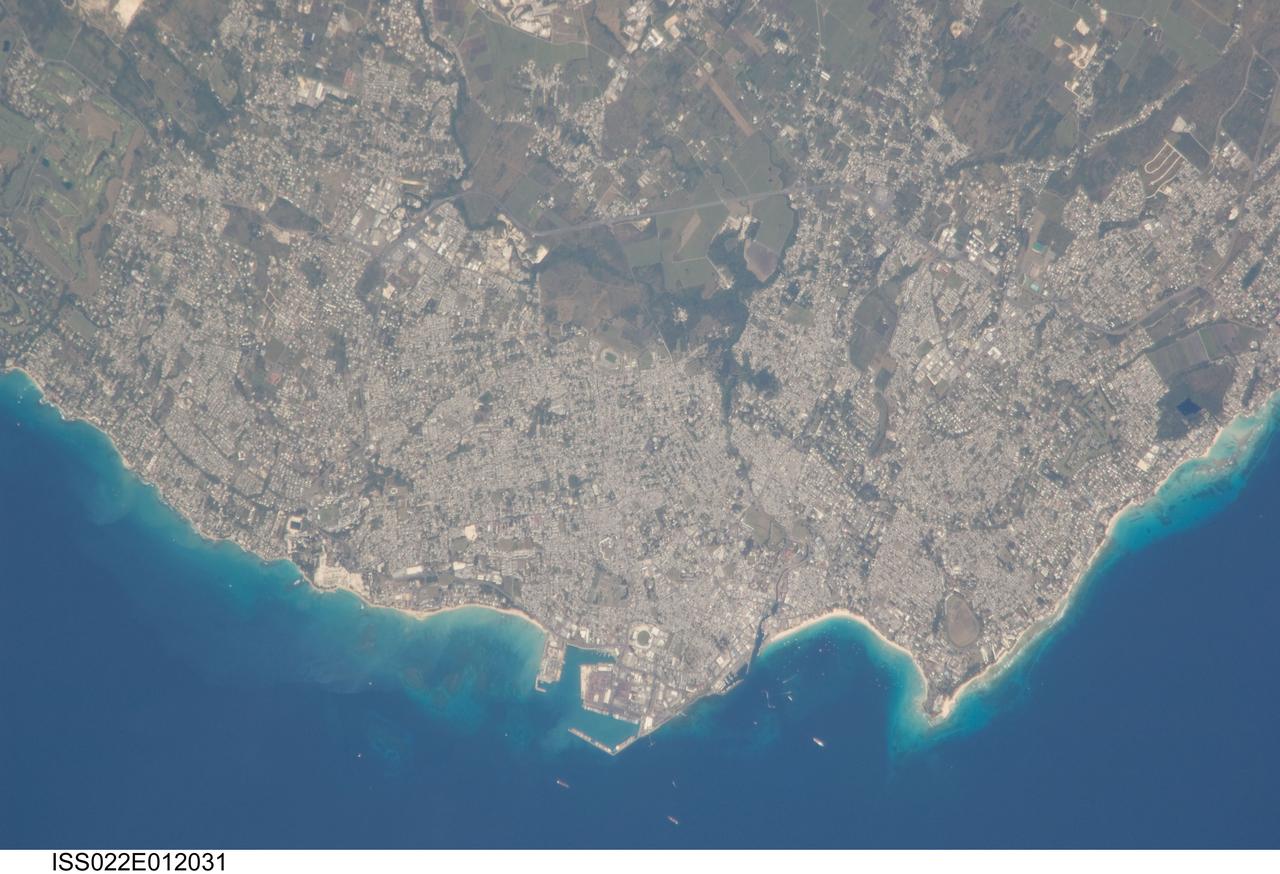
ISS022-E-012031 (16 Dec. 2009) --- Greater Bridgetown area, Barbados is featured in this image photographed by an Expedition 22 crew member on the International Space Station. Bridgetown is the capital city of the island nation of Barbados, located to the east of the Lesser Antilles Island chain. While Barbados is considered to be part of the Lesser Antilles, it is located within the western Atlantic Ocean rather than the Caribbean Sea region. Bridgetown is the largest city in Barbados in addition to being the seat of government. Barbados is a member of the British Commonwealth, and considers Queen Elizabeth II to be its constitutional monarch. Bridgetown, and the surrounding towns that make up the Greater Bridgetown area, is located along the southwestern coastline of the island. The metropolitan area is readily recognized in this image due to the gray and white rooftops and street grids (center) that contrast with green vegetated fields and riparian areas of the island?s interior to the northeast (top center). Bridgetown is a major port destination for both commercial and cruise ships serving the eastern Caribbean ? several ships are visible within Carlisle Bay. Water color in the image changes from light blue along the coastline ? indicating shallow water ? to the dark blue of deeper water away from the island.
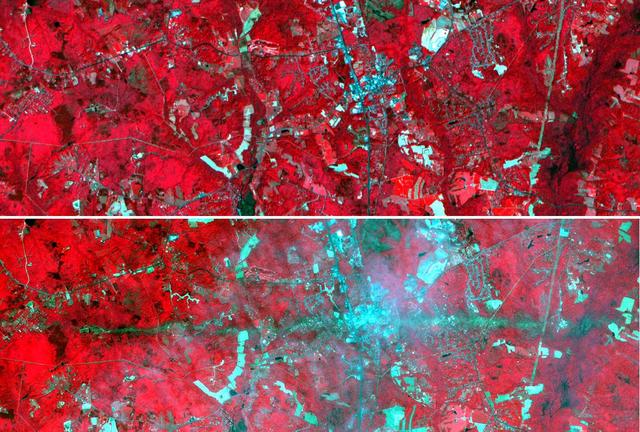
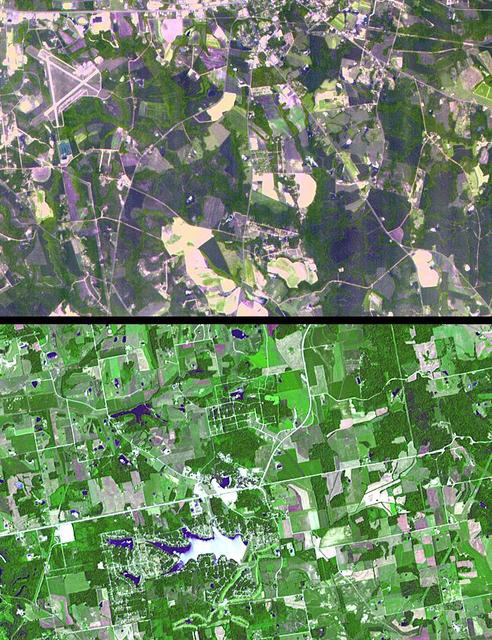
On Sunday, April 28, a category F5 tornado cut an East-West path through La Plata, Maryland, killing 5 and injuring more than 100. These two images acquired by NASA's Terra satellite Advanced Spaceborne Thermal Emission and Reflection Radiometer (ASTER) show a 6-by-17.8-kilometer (3.7-by-11.1-mile) area centered on the town. The top image was acquired on May 12, 2001, and the bottom on May 3, 2002. The bands used for the image portray vegetation in red, and bare fields and urban areas in blue-green. The dark turquoise swath cutting across the 2002 image is the track of the tornado, where the vegetation was ripped up and removed. With its 14 spectral bands from the visible to the thermal infrared wavelength region, and its high spatial resolution of 15 to 90 meters(about 50 to 300 feet), ASTER will image Earth for the next six years to map and monitor the changing surface of our planet. http://photojournal.jpl.nasa.gov/catalog/PIA03494
STS098-382-0014 (7-20 February 2001) City Lights of the Northeastern Seaboard of the U.S. were captured with a 35mm camera by one of the STS-98 astronauts aboard the Space Shuttle Atlantis. The nighttime scene shows the bright lights of several major cities that span a distance from Connecticut (left middle) to states south of Virginia (right middle). Lights from both very large urban areas as well as smaller towns and cities are visible. The largest cluster of brightness emanates from the greater New York metropolitan area (left center) and then a series of bright spots progress southwesterly to include Philadelphia (PA), Baltimore (MD), Washington (D.C.), Richmond (VA), and finally ending with the Newport News/ Norfolk (VA) lights (top center). Many of the major ground transportation arteries can be seen as radial, linear features that radiate outward from the central business districts of the cities. Even the lights of smaller cities such as Allentown, Reading, Lancaster, York, and Harrisburg (PA) are visible (bottom center).
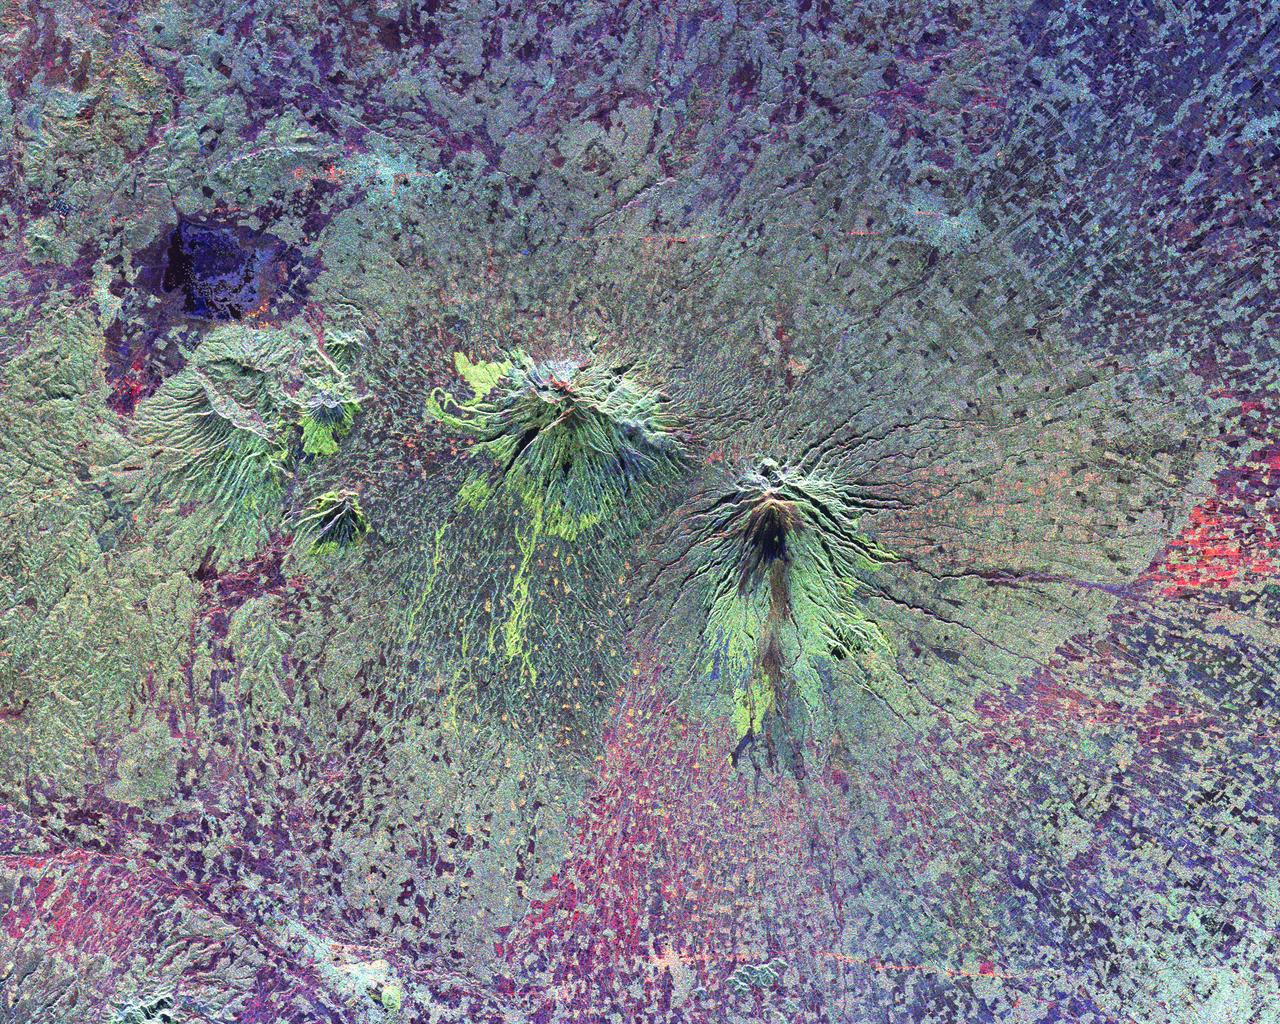
The summits of two large volcanoes in Central Java, Indonesia are shown in the center of this radar image. Lava flows of different ages and surface roughness appear in shades of green and yellow surrounding the summit of Mt. Merbabu (mid-center) and Mt. Merapi (lower center). Mt. Merapi erupted on November 28, 1994 about six weeks after this image was taken. The eruption killed more than 60 people and forced the evacuation of more than 6,000 others. Thousands of other residents were put on alert due to the possibility of volcanic debris mudflows, called lahars, that threatened nearby towns. Mt. Merapi is located approximately 40 kilometers (25 miles) north of Yogyakarta, the capital of Central Java. The older volcano at the top of the image is unnamed. Lake Rawapening is the dark blue feature in the upper right. The light blue area southeast of the lake is the city of Salatiga. Directly south of Salatiga and southeast of Mt. Merapi is the city of Boyolali. Scientists are studying Mt. Merapi as part of the international "Decade Volcanoes" project, because of its recent activity and potential threat to local populations. The radar data are being used to identify and distinguish a variety of volcanic features. http://photojournal.jpl.nasa.gov/catalog/PIA01782
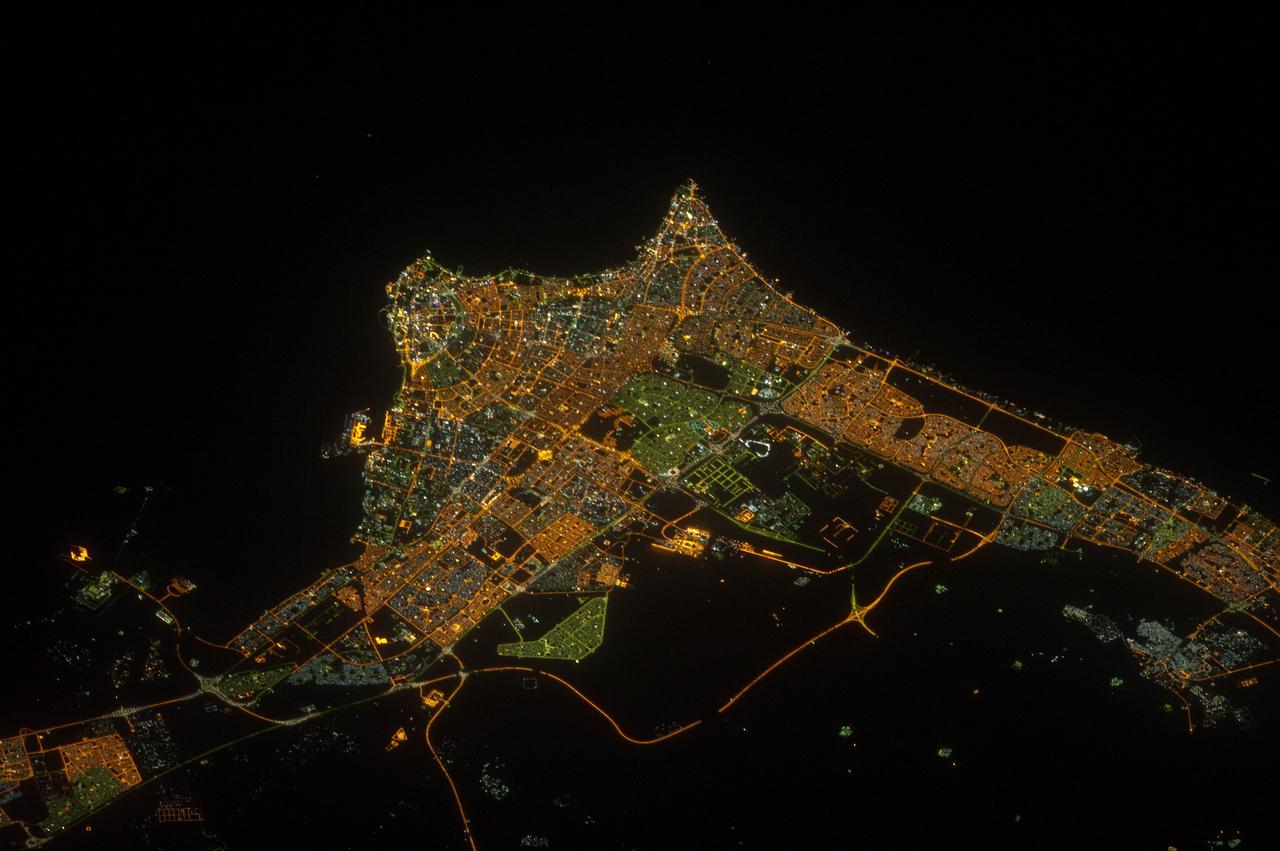
ISS032-E-017635 (9 Aug. 2012) --- A nighttime view of Kuwait City is featured in this image photographed by an Expedition 32 crew member on the International Space Station. Seen at night Kuwait City, the capital of the small Persian Gulf state of Kuwait, contrasts dramatically with the dark surface of the Persian Gulf (top) and the very sparsely populated desert area (bottom). Night views also show at a glance some aspects of urban geography that are difficult to perceive in daylight images. Here the focus of radial traffic arteries and ?ring roads? guide the eye to the financial center of the city?on the cape extending into Kuwait Bay north of the First Ring Road. The numbering of the ring roads shows the progressive southward development of the city, towards the Seventh Ring Road which still lies outside the built-up area at lower right. The striking differences in color of city lighting also provide information on the urban geography. Areas with lighting of a green tinge are, in each case, newer residential districts. The town of Al Ahmadi (lower right), known for its verdant vegetation, was built in 1946 when oil was struck and stands out with its characteristic blue night lights. Kuwait International Airport, like most major airports around the globe, is particularly bright due to the high concentration of lights.
ISS040-E-080921 (26 June 2014) --- Dominican Republic and Haiti, Hispaniola, Caribbean are featured in this image photographed by an Expedition 40 crew member on the International Space Station. Looking east into a rising sun, the crew took this panorama of Hispaniola with the sun’s glint point illuminating the long western peninsula of Haiti. Several thunderheads throw shadows towards the camera (left). The plume from a very large wildfire stretches west (center). The Constanza Fire started in a national forest on the Dominican Republic growing to the extent that it threatened surrounding towns and prompting an International Disaster Charter activation, whereby requests for imagery were uplinked to the station crew as possible assistance to help firefighters on the ground. Hurricane Bertha tracked over the island a week later helping to douse the flames. The view looks hazy probably because of dust in the atmosphere. Dust blows across the Atlantic Ocean from Africa reaching the western hemisphere every month of the year. Despite the austere tone of the image, touches of color are blue waters of the Turks and Caicos Islands extending from under a large thundercloud (left) and the edge of a space station solar panel (top right).
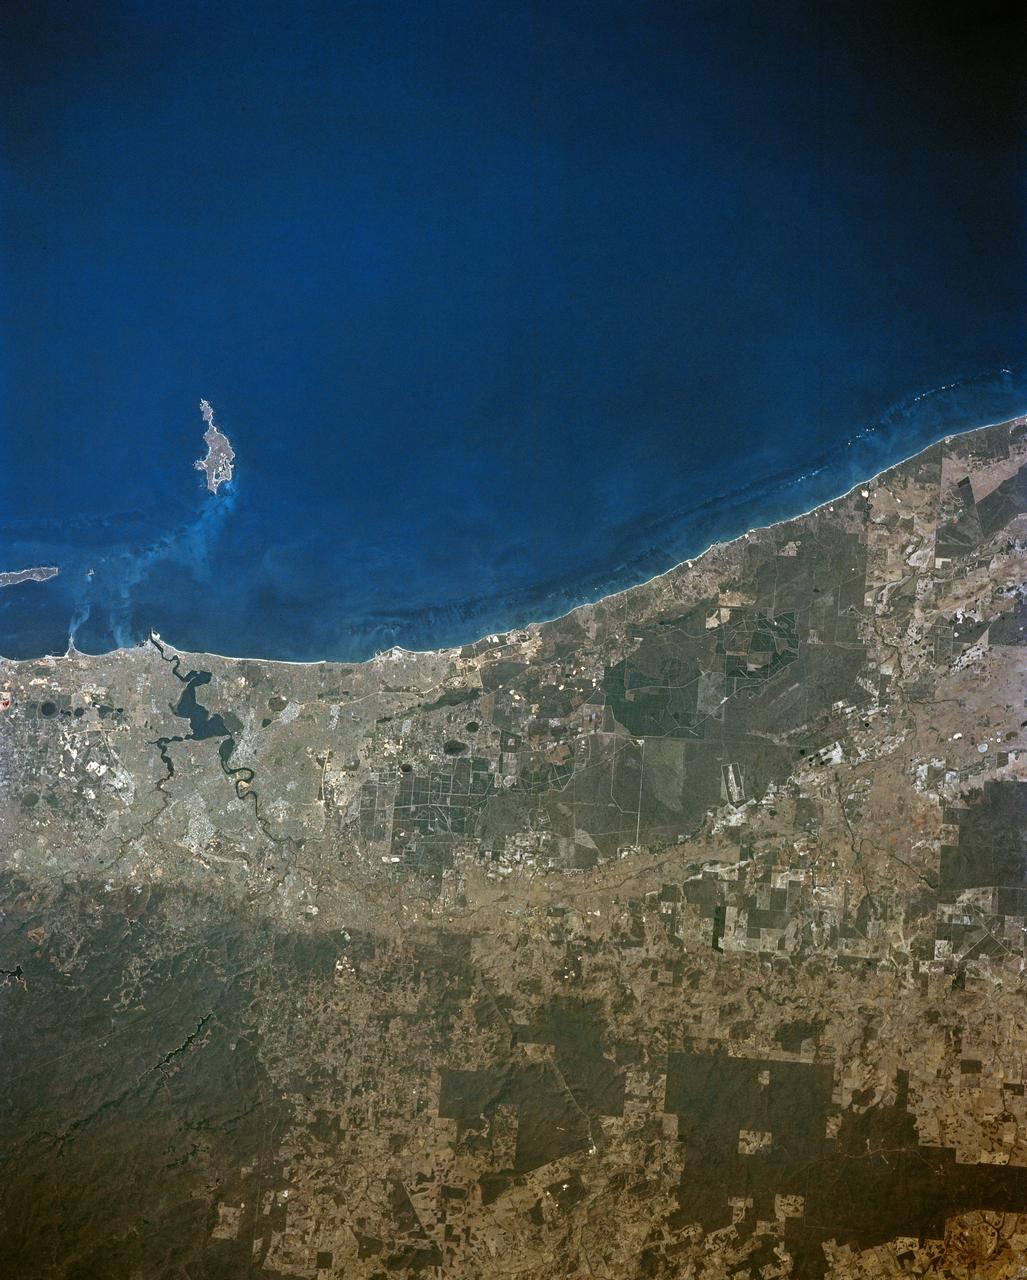
STS-56 Earth observation taken aboard Discovery, Orbiter Vehicle (OV) 103, is probably the best view of Perth in Western Australia. (For orientation purposes, note that the coastline runs north and south). The major feature on the coast is the large estuary of the Swan River. The large port city of Perth is situated on the north bank and the smaller city of Freemantle on the south bank by the sea. Smaller seaside towns trail off north and south of this center of urban life. Inland lies a prominent escarpment, more than 600 feet high, seen running down the middle of the view and dividing the lighter-colored coastal lowlands from the highlands where dark-colored tree savanna and desert scrub dominates the land. The Moore River can be seen entering the sea at the top of the frame. Rottnest Island is visible in the sea and Garden Island near bottom edge of the frame. Perth is the largest economic center in Western Australia. It receives natural gas from an offshore field hundreds of miles to the north. It lies 3,400 kilometers west of Sydney on the opposite side of this island continent.
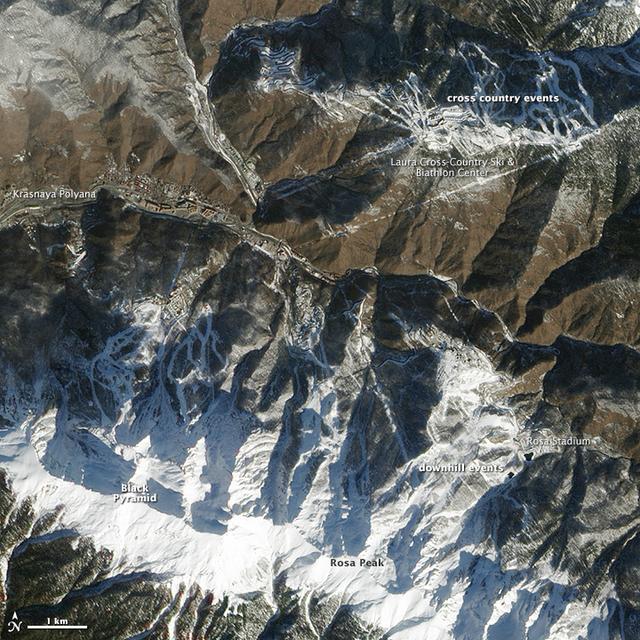
High res here: <a href="http://www.flickr.com/photos/gsfc/12640339235/in/photostream/">www.flickr.com/photos/gsfc/12640339235/in/photostream/</a> While Sochi is a coastal town on the Black Sea, the skiing events for the XXII Olympic Games are taking place about 40 kilometers (25 miles) inland. The venues are clustered around Krasnaya Polyana, a small town tucked between the Aibiga and Psekhako Ridges in the western Caucasus. This image—acquired by the Advanced Land Imager (ALI) on NASA’s Earth Observing-1 (EO-1) satellite on February 8, 2014—offers a view of the town and the ski facilities. The Rosa Khutor Alpine Center is the home to the downhill, snowboard, and freestyle events. The combined downhill skiing area measures about 20 kilometers (12 miles) in total, with the men’s downhill course stretching 3,500 meters (11,482 feet) and featuring a 1,075-meter (3,526 foot) change in elevation. The highest lift climbs to the summit of Rosa Peak, which rises 2,320 meters (7,612 feet). While not being used for the Olympics, the nearby Black Pyramid mountain has downhill skiing trails as well. The same steep slopes that make Rosa Peak good for skiing also elevate the risk of avalanches. To protect against falling snow, planners installed a series of gas pipes along the top of the ridge. The pipes emit bursts of oxygen and propane that create small, controlled avalanches. Event organizers also installed a series of earthen dams to steer snow away from infrastructure, and they have deployed two backhoes to the top of Aibiga Ridge to knock cornices away before they pose a risk. The Laura Cross-country Ski and Biathalon Center is located to the north on Psekhako Ridge. It includes two stadiums, each with their own start and finish zones, two track systems for skiing and biathlon, as well as shooting areas and warm-up zones. The center is named for the Laura River, a turbulent river that flows nearby. NASA Earth Observatory image by Jesse Allen and Robert Simmon, using EO-1 ALI data provided courtesy of the NASA EO-1 team. Caption by Adam Voiland. Instrument: EO-1 - ALI Read more: <a href="http://earthobservatory.nasa.gov/IOTD/view.php?id=83131&eocn=home&eoci=iotd_grid" rel="nofollow">earthobservatory.nasa.gov/IOTD/view.php?id=83131&eocn...</a> Credit: <b><a href="http://www.earthobservatory.nasa.gov/" rel="nofollow"> NASA Earth Observatory</a></b> <b><a href="http://www.nasa.gov/audience/formedia/features/MP_Photo_Guidelines.html" rel="nofollow">NASA image use policy.</a></b> <b><a href="http://www.nasa.gov/centers/goddard/home/index.html" rel="nofollow">NASA Goddard Space Flight Center</a></b> enables NASA’s mission through four scientific endeavors: Earth Science, Heliophysics, Solar System Exploration, and Astrophysics. Goddard plays a leading role in NASA’s accomplishments by contributing compelling scientific knowledge to advance the Agency’s mission. <b>Follow us on <a href="http://twitter.com/NASAGoddardPix" rel="nofollow">Twitter</a></b> <b>Like us on <a href="http://www.facebook.com/pages/Greenbelt-MD/NASA-Goddard/395013845897?ref=tsd" rel="nofollow">Facebook</a></b> <b>Find us on <a href="http://instagram.com/nasagoddard?vm=grid" rel="nofollow">Instagram</a></b>
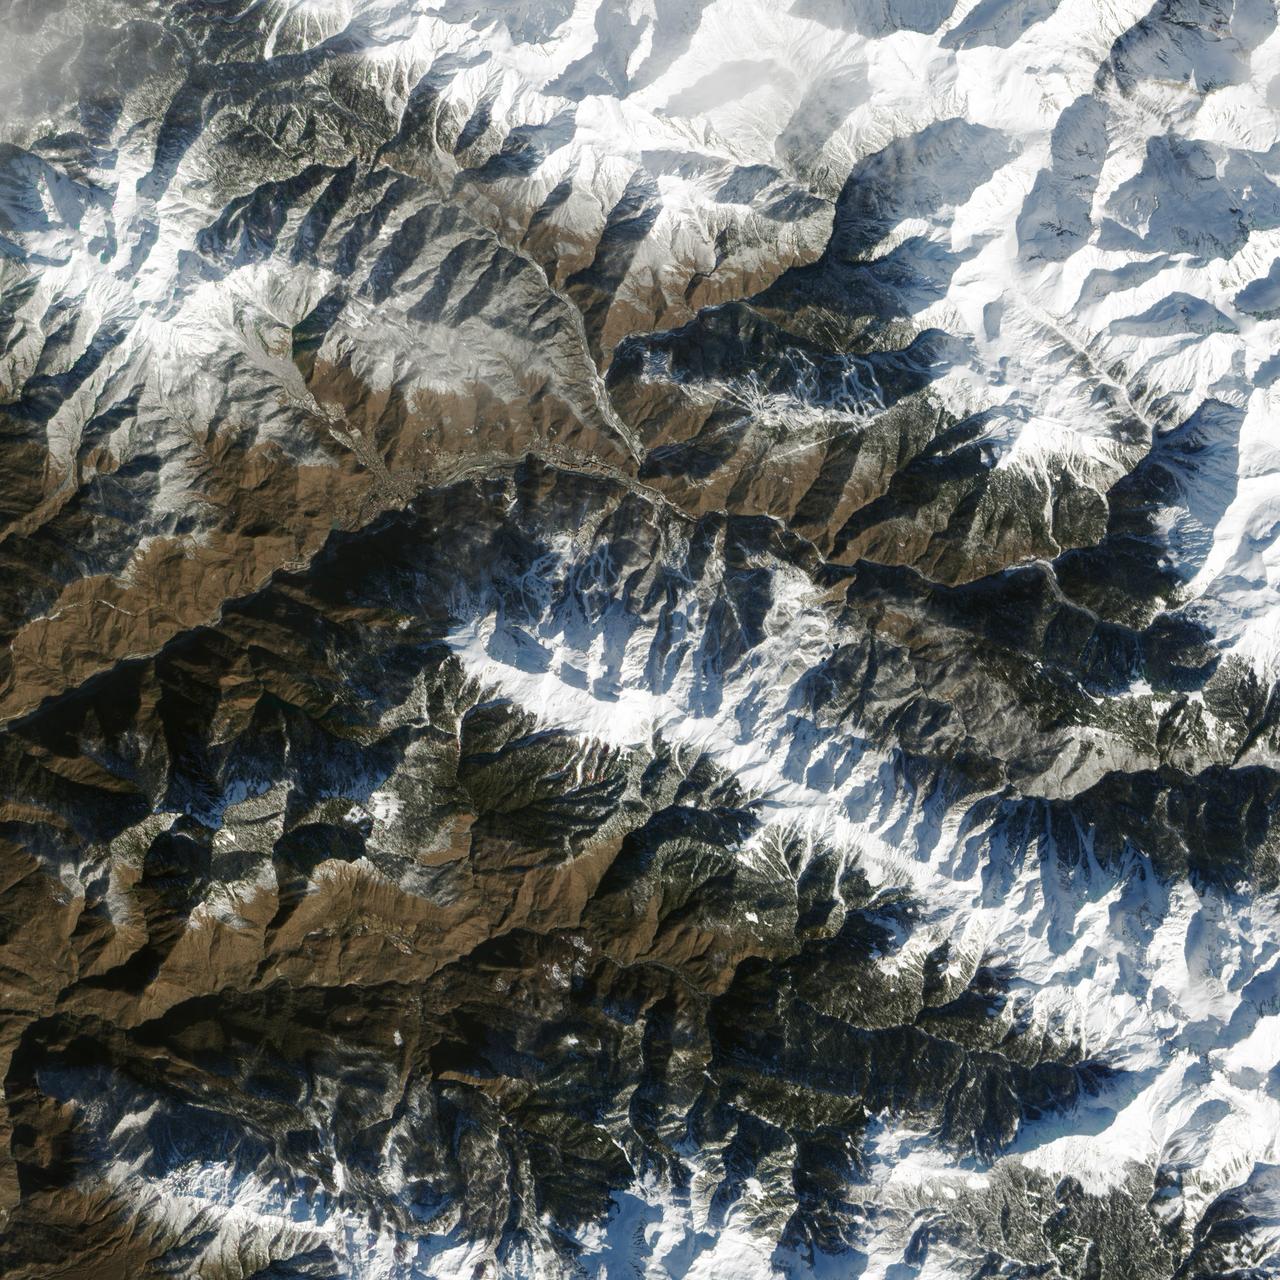
While Sochi is a coastal town on the Black Sea, the skiing events for the XXII Olympic Games are taking place about 40 kilometers (25 miles) inland. The venues are clustered around Krasnaya Polyana, a small town tucked between the Aibiga and Psekhako Ridges in the western Caucasus. This image—acquired by the Advanced Land Imager (ALI) on NASA’s Earth Observing-1 (EO-1) satellite on February 8, 2014—offers a view of the town and the ski facilities. The Rosa Khutor Alpine Center is the home to the downhill, snowboard, and freestyle events. The combined downhill skiing area measures about 20 kilometers (12 miles) in total, with the men’s downhill course stretching 3,500 meters (11,482 feet) and featuring a 1,075-meter (3,526 foot) change in elevation. The highest lift climbs to the summit of Rosa Peak, which rises 2,320 meters (7,612 feet). While not being used for the Olympics, the nearby Black Pyramid mountain has downhill skiing trails as well. The same steep slopes that make Rosa Peak good for skiing also elevate the risk of avalanches. To protect against falling snow, planners installed a series of gas pipes along the top of the ridge. The pipes emit bursts of oxygen and propane that create small, controlled avalanches. Event organizers also installed a series of earthen dams to steer snow away from infrastructure, and they have deployed two backhoes to the top of Aibiga Ridge to knock cornices away before they pose a risk. The Laura Cross-country Ski and Biathalon Center is located to the north on Psekhako Ridge. It includes two stadiums, each with their own start and finish zones, two track systems for skiing and biathlon, as well as shooting areas and warm-up zones. The center is named for the Laura River, a turbulent river that flows nearby. NASA Earth Observatory image by Jesse Allen and Robert Simmon, using EO-1 ALI data provided courtesy of the NASA EO-1 team. Caption by Adam Voiland. Instrument: EO-1 - ALI Read more: <a href="http://earthobservatory.nasa.gov/IOTD/view.php?id=83131&eocn=home&eoci=iotd_grid" rel="nofollow">earthobservatory.nasa.gov/IOTD/view.php?id=83131&eocn...</a> Credit: <b><a href="http://www.earthobservatory.nasa.gov/" rel="nofollow"> NASA Earth Observatory</a></b> <b><a href="http://www.nasa.gov/audience/formedia/features/MP_Photo_Guidelines.html" rel="nofollow">NASA image use policy.</a></b> <b><a href="http://www.nasa.gov/centers/goddard/home/index.html" rel="nofollow">NASA Goddard Space Flight Center</a></b> enables NASA’s mission through four scientific endeavors: Earth Science, Heliophysics, Solar System Exploration, and Astrophysics. Goddard plays a leading role in NASA’s accomplishments by contributing compelling scientific knowledge to advance the Agency’s mission. <b>Follow us on <a href="http://twitter.com/NASAGoddardPix" rel="nofollow">Twitter</a></b> <b>Like us on <a href="http://www.facebook.com/pages/Greenbelt-MD/NASA-Goddard/395013845897?ref=tsd" rel="nofollow">Facebook</a></b> <b>Find us on <a href="http://instagram.com/nasagoddard?vm=grid" rel="nofollow">Instagram</a></b>
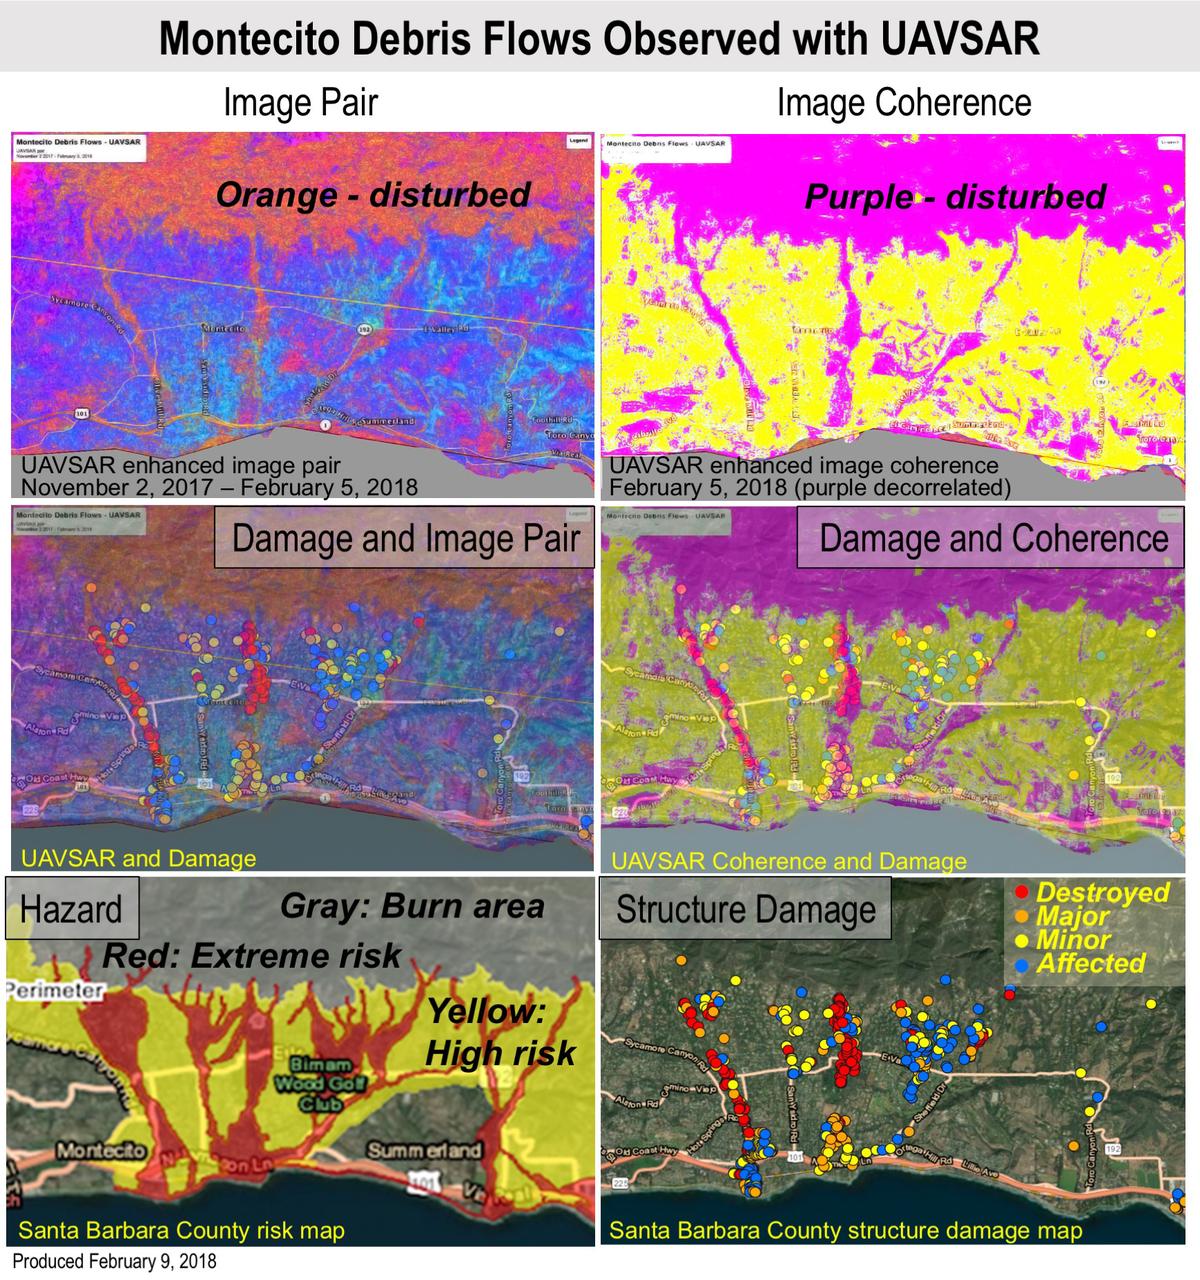
Extreme winter rains in January 2018 following the Thomas Fire in Ventura and Santa Barbara Counties caused severe debris flows, resulting in significant loss of life and considerable property damage in the town on Montecito, just east of Santa Barbara. NASA's Uninhabited Aerial Vehicle Synthetic Aperture Radar (UAVSAR) airborne radar platform detected changes caused by the debris flows between two images acquired on Nov. 2, 2017, and Feb. 5, 2018. An enhanced image pair (top left) shows disturbed areas in orange. In areas of severe surface disruption from the fire scar and debris flows the two image pairs can't be matched and decorrelate (top right). In the middle panels, the radar images are overlaid on the structure damage map produced by the County of Santa Barbara. The fire scars and damage correspond well with the risk map (lower left) and damage map (lower right). With an operational system, products such as these have the potential to augment information available for search and rescue, and for damage assessment for government agencies or the insurance industry. Radar has the advantage of being available in all weather conditions, as it can image through clouds. NASA's Uninhabited Aerial Vehicle Synthetic Aperture Radar (UAVSAR), developed and managed by the Jet Propulsion Laboratory, Pasadena, California, can record changes on the ground beneath the aircraft that occur between multiple flights, which take exactly the same flight path. The instrument is used to monitor how volcanoes, earthquakes, and other natural hazards are changing Earth. The JPL UAVSAR team collected and processed the imagery for Principal Investigator Andrea Donnellan who performed the analysis. She has been conducting ground change research using UAVSAR in this and other regions of California since 2009. https://photojournal.jpl.nasa.gov/catalog/PIA22243
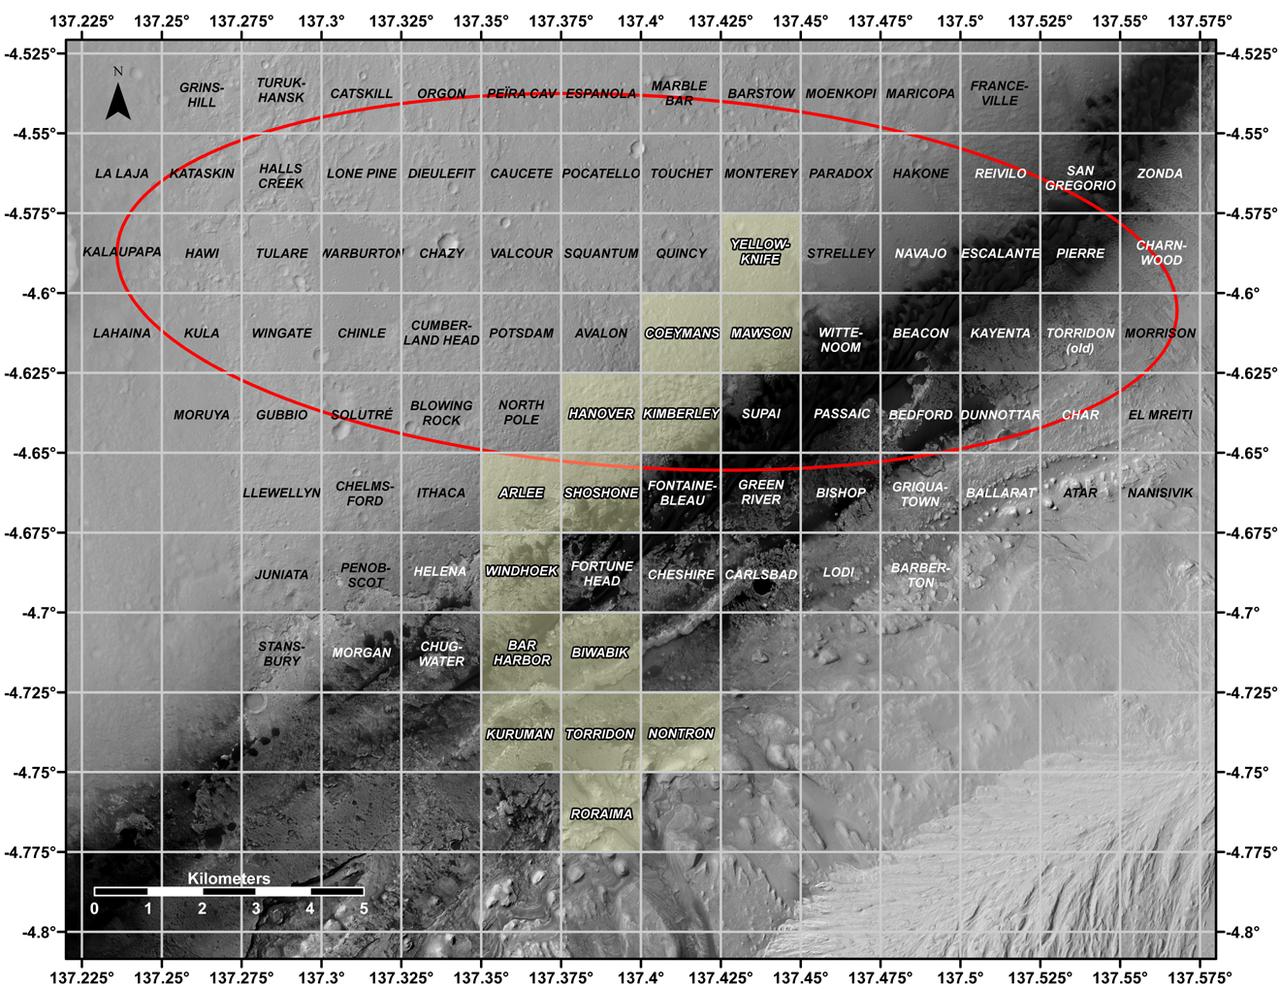
This map shows all the quadrant themes for NASA's Curiosity Mars rover, which is currently in the Roraima quadrant seen at the bottom. The red oval indicates the landing ellipse where the rover was targeted to touch down in 2012. The yellow-tinted quadrants are areas the rover has driven through since then. Themes are chosen in advance of the rover's arrival in a new quadrant; the rover's path couldn't be planned until after the team knew where it landed. Martian latitude and longitude is provided around the outside of the map. With the Curiosity mission, scientists began using quadrant themes to organize the long lists of unofficial nicknames needed to catalog its observations, whether hills, craters, boulders, rocks, and even tiny features on rock surfaces. Scientist deplete these lists of names quickly – especially with Curiosity, which has used more than 10,000 names over nearly 11 years of exploring Mars. Different science "targets" all require names – including targets for the rover's cameras, the rocks on which it places its arm instruments and drill, and the surfaces it zaps with its laser instrument. Curiosity's team chooses quadrant themes based on sites of geological interest on Earth. Its current quadrant, Roraima, is named for the northernmost state of Brazil, and for Mount Roraima, the highest peak in the Pacaraima mountains, located near the border of Venezuela, Brazil, and Guyana. The sulfate-enriched region Curiosity is currently exploring, with its flat-topped hills and steep slopes, reminded the rover team of the "table-top" mountains in the Pacaraima range. This is the first quadrant theme the team has chosen related to South America. Previously explored quadrants include Torridon, based on sites in Scotland, and Nontron, based on the French region where the town of Nontron can be found. While in the Nontron quadrant, which was located in a clay-enriched region, Curiosity drilled a rock sample that included a notable amount of nontronite – a clay mineral that was first discovered on Earth near Nontron. Each quadrant is 0.025 degrees of latitude and longitude, or approximately 0.7 miles (1.2 kilometers) on each side. https://photojournal.jpl.nasa.gov/catalog/PIA25914
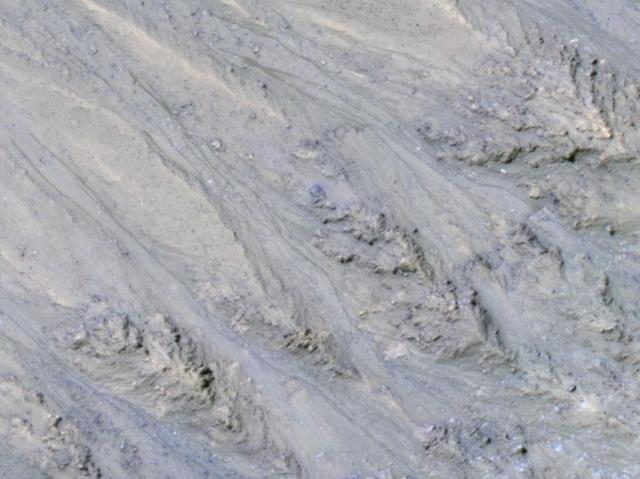
This inner slope of a crater on southern Mars has several of the seasonal dark streaks called "recurrent slope lineae," or RSL, that a November 2017 report interprets as granular flows, rather than darkening due to flowing water. This 2011 view near the top of the southern rim of Tivat Crater comes from the High Resolution Imaging Science Experiment (HiRISE) camera on NASA's Mars Reconnaissance Orbiter. North is toward the top and the slope descends toward the northwest. The view spans an area about 1,000 feet (300 meters) wide. Figure 1 includes a scale bar of 50 meters (164 feet). HiRISE began viewing Mars in 2006. Multiple observations of some sites resulted in discovery of RSL in 2011 and has confirmed many thousands of them at more than 50 sites, from equatorial to mid-latitude north and south. These narrow, dark features appear in warm seasons, gradually extend downslope, fade away in winter and reappear the next year. On Earth, only seeping water is known to have these behaviors. Hydrated salts have been identified at RSL sites and RSL have previously been considered possible evidence of liquid water seeping down the slopes and darkening the ground. The Nov. 20, 2017, report in Nature Geosciences uses analysis of the steepness of slopes where RSL appear, including these RSL at Tivat Crater. The RSL all end, downhill, at approximately the same slope, which is similar to the angle of repose for sand. That is, the flows do not extend to slopes shallower than where dry grains of sand or dust could slip downhill, as on the face of a dune. Seeping water should readily extend to shallower slopes. This image is an excerpt from HiRISE observation ESP_023184_1335, taken on July 8, 2011, during Martian mid-afternoon at this site, at latitude 45.9 degrees south and longitude 9.5 degrees east. Tivat Crater is about 2.2 miles (3.6 kilometers) in diameter, and was named in 2011 for a town in Montenegro. https://photojournal.jpl.nasa.gov/catalog/PIA22070
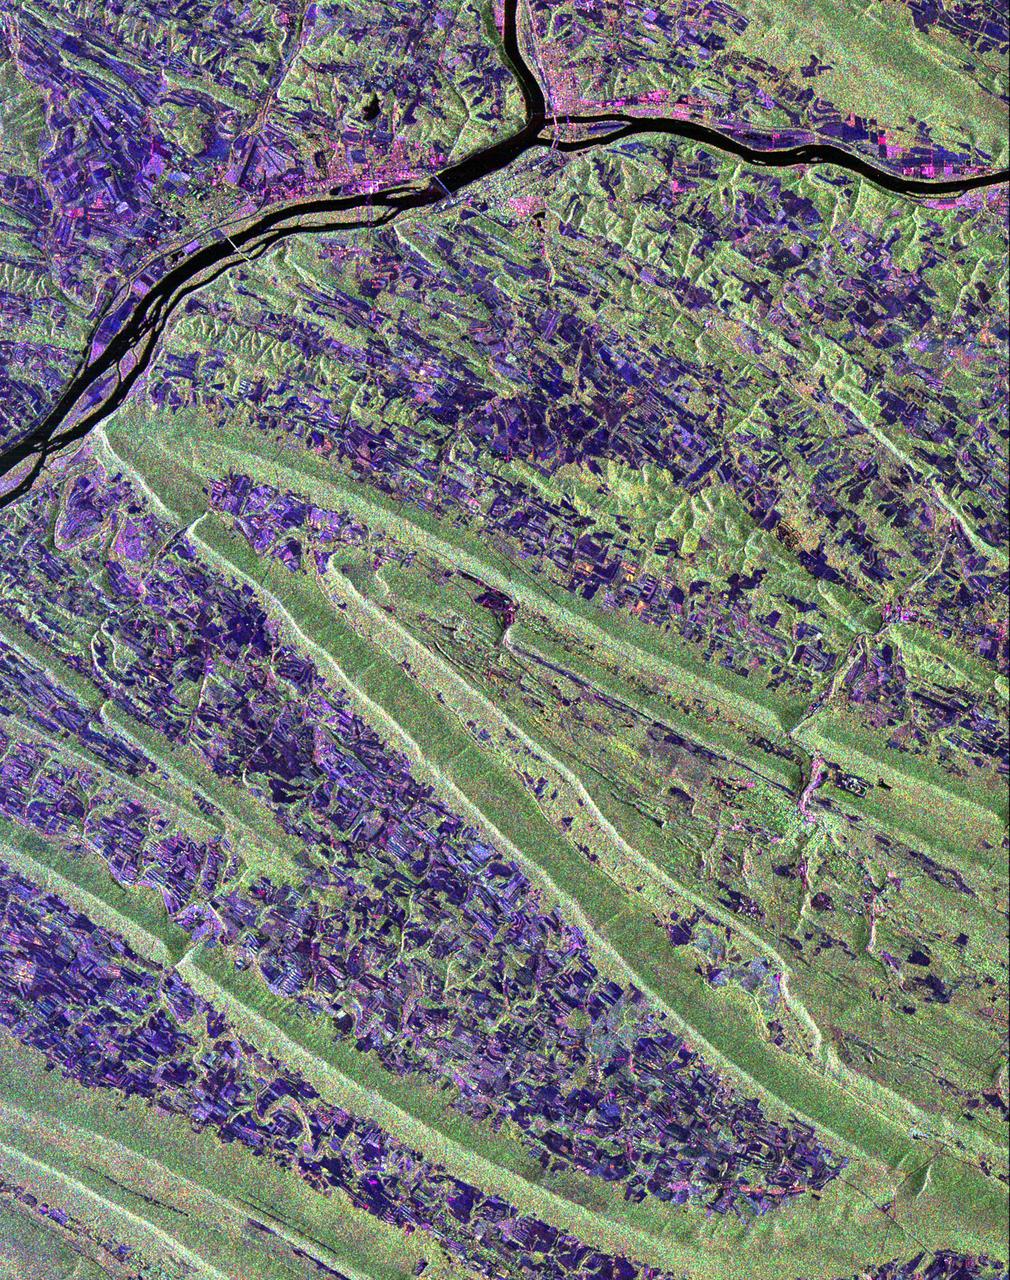
Scientists are using this radar image of the area surrounding Sunbury, Pennsylvania to study the geologic structure and land use patterns in the Appalachian Valley and Ridge province. This image was collected on October 6, 1994 by the Spaceborne Imaging Radar-C/ X-Band Synthetic Aperture Radar (SIR-C/X-SAR) on orbit 102 of the space shuttle Endeavour. The image is centered on latitude 40.85 degrees North latitude and 76.79 degrees West longitude. The area shown is approximately 30.5 km by 38 km. (19 miles by 24 miles). North is towards the upper right of the image. The Valley and Ridge province occurs in the north-central Appalachians, primarily in Pennsylvania, Maryland, and Virginia. It is an area of adjacent valleys and ridges that formed when the Appalachian mountain were created some 370 to 390 million years ago. During the continental collision that formed the Appalachians, the rocks in this area were pushed from the side and buckled much like a rug when pushed from one end. Subsequent erosion has produced the landscape we see in this image. The more resistant rocks, such as sandstone, form the tops of the ridges which appear as forested greenish areas on this image. The less resistant rocks, such as limestone, form the lower valleys which are cleared land and farm fields and are purple in this image. Smaller rivers and streams in the area flow along the valleys and in places cut across the ridges in "water gaps." In addition to defining the geography of this region, the Valley and Ridge province also provides this area with natural resources. The valleys provide fertile farmland and the folded mountains form natural traps for oil and gas accumulation; coal deposits are also found in the mountains. The colors in the image are assigned to different frequencies and polarizations of the SIR-C radar as follows: red is L-band horizontally transmitted, horizontally received; green is L-band horizontally transmitted, vertically received; blue is C-band horizontally transmitted, horizontally received. The river junction near the top of the image is where the West Branch River flows into the Susquehanna River, which then flows to the south-southwest past the state capitol of Harrisburg, 70 km (43 miles) to the south and not visible in this image. The town of Sunbury is shown along the Susquehanna on the east just to the southeast of the junction with West Branch. Three structures that cross the Susquehanna; the northern and southern of these structures are bridges and middle structure is the Shamokin Dam which confines the Susquehanna just south of the junction with West Branch. The prominent S-shaped mountain ridge in the center of the image is, from north to south, Little Mountain (the top of the S), Line Mountain (the middle of the S), and Mahantango Mountain (the bottom of the S). http://photojournal.jpl.nasa.gov/catalog/PIA01306
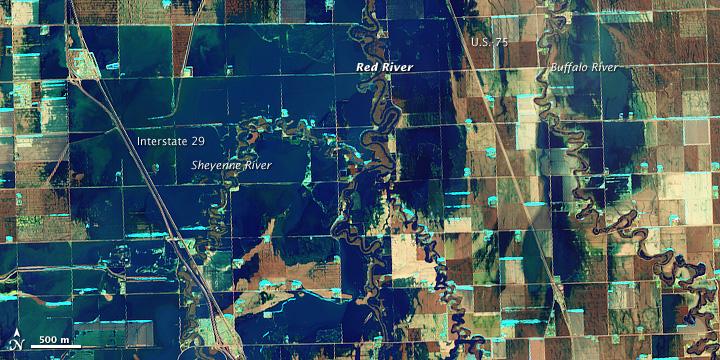
NASA Satellite image acquired March 21, 2010. To see a high res of this image go here: <a href="http://www.flickr.com/photos/gsfc/4455124807/in/photostream/">www.flickr.com/photos/gsfc/4455124807/in/photostream/</a> On March 21, 2010, the Red River crested at 36.99 feet (11.27 meters), according to the National Weather Service. The New York Times reported that the river’s crest was 1 foot (0.3 meters) below predictions and 4 feet (1 meter) below 2009’s record crest. A cold front passing through the area on March 19, 2010, slowed the rate of snowmelt feeding local rivers. That, combined with sandbags and dykes, spared the metropolitan area of Fargo, North Dakota, from serious flooding. North of town, however, agricultural fields and roads flooded. The Advanced Land Imager (ALI) on NASA’s Earth Observing-1 (EO-1) satellite captured these images of fields north of Fargo on March 21, 2010. The top image uses shortwave infrared light, and the bottom image uses visible light. Muddy waters and fallow fields blend together in the true-color image (bottom), but the false-color image (top) distinguishes better between water and land. Blue indicates water and green indicates vegetation. Fallow fields, bare ground, and paved surfaces appear in shades of brown. Cyan suggests pale water and/or sediment. Wide swaths of blue show large areas of standing water. The Sheyenne, Red, and Buffalo Rivers all flow through the area pictured here. According to The New York Times, flooding in rural areas around Fargo resulted primarily from the Red River’s failure to absorb water from the tributaries feeding it. Much of the standing water apparent in this image occurs around the Sheyenne and Buffalo Rivers. Overflowing tributaries left several inches of standing water in agricultural fields and on highways. About 10 miles (16 kilometers) north of Fargo, flooding forced the closure of Interstate 29. NASA image created by Jesse Allen, using EO-1 ALI data provided courtesy of the NASA EO-1 team and the United States Geological Survey. Caption by Michon Scott.. Instrument: EO-1 - ALI. To learn more about this image go here: <a href="http://earthobservatory.nasa.gov/NaturalHazards/view.php?id=43211" rel="nofollow">earthobservatory.nasa.gov/NaturalHazards/view.php?id=43211</a> To learn more about NASA's Goddard Space Flight Center go here: <a href="http://www.nasa.gov/centers/goddard/home/index.html" rel="nofollow">www.nasa.gov/centers/goddard/home/index.html</a>
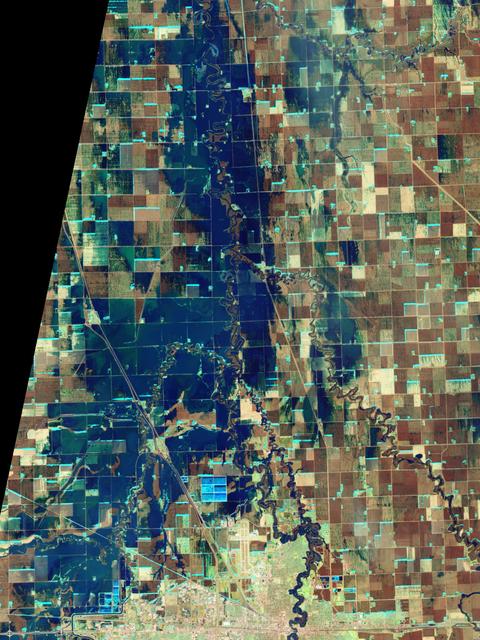
NASA Satellite image acquired March 21, 2010. To see a high res more detail of this image go here: <a href="http://www.flickr.com/photos/gsfc/4455125023/in/photostream/">www.flickr.com/photos/gsfc/4455125023/in/photostream/</a> On March 21, 2010, the Red River crested at 36.99 feet (11.27 meters), according to the National Weather Service. The New York Times reported that the river’s crest was 1 foot (0.3 meters) below predictions and 4 feet (1 meter) below 2009’s record crest. A cold front passing through the area on March 19, 2010, slowed the rate of snowmelt feeding local rivers. That, combined with sandbags and dykes, spared the metropolitan area of Fargo, North Dakota, from serious flooding. North of town, however, agricultural fields and roads flooded. The Advanced Land Imager (ALI) on NASA’s Earth Observing-1 (EO-1) satellite captured these images of fields north of Fargo on March 21, 2010. The top image uses shortwave infrared light, and the bottom image uses visible light. Muddy waters and fallow fields blend together in the true-color image (bottom), but the false-color image (top) distinguishes better between water and land. Blue indicates water and green indicates vegetation. Fallow fields, bare ground, and paved surfaces appear in shades of brown. Cyan suggests pale water and/or sediment. Wide swaths of blue show large areas of standing water. The Sheyenne, Red, and Buffalo Rivers all flow through the area pictured here. According to The New York Times, flooding in rural areas around Fargo resulted primarily from the Red River’s failure to absorb water from the tributaries feeding it. Much of the standing water apparent in this image occurs around the Sheyenne and Buffalo Rivers. Overflowing tributaries left several inches of standing water in agricultural fields and on highways. About 10 miles (16 kilometers) north of Fargo, flooding forced the closure of Interstate 29. NASA image created by Jesse Allen, using EO-1 ALI data provided courtesy of the NASA EO-1 team and the United States Geological Survey. Caption by Michon Scott. Instrument: EO-1 - ALI. To learn more about this image go here: <a href="http://earthobservatory.nasa.gov/NaturalHazards/view.php?id=43211" rel="nofollow">earthobservatory.nasa.gov/NaturalHazards/view.php?id=43211</a> To learn more about NASA's Goddard Space Flight Center go here: <a href="http://www.nasa.gov/centers/goddard/home/index.html" rel="nofollow">www.nasa.gov/centers/goddard/home/index.html</a>
ISS028-E-024146 (2 Aug. 2011) --- Kaliningrad and Baltic Sea, Russia are featured in this image photographed by an Expedition 28 crew member on the International Space Station. This striking photograph reveals detail of the two great lagoons to the north and south of Kaliningrad, each protected from the open waters of the Baltic Sea by the thin perfect curves of current-generated sand spits. A broad arm of agricultural country separates the freshwater lagoons?known as Kurshsky Bay (or the Curonian Lagoon further north in Lithuania, just outside the top of the image) and the Vistula Lagoon. From the crew member perspective in low Earth orbit, land surfaces usually appear brighter than water, which normally appears darker and often black. Reflected sunlight, or sunglint, inverts this pattern. The reflected light in this image is a pink or coppery hue, indicating the likely existence of smog in the air since smog particles enhance the red part of the light spectrum. Camera settings used to acquire sunglint images result in high contrast that reveals excellent detail of coastlines and surface features of waterbodies, but masks land surface detail. The thin, 50 kilometer-long barge canal leading from the Baltic Sea to Kaliningrad is visible but the great port of Kaliningrad itself is not. Other human patterns on this intensively developed landscape such as towns, highways and farm boundaries are likewise masked in the image. The area has a long human history. The growth of the Vistula spit finally cut off the north Polish city of Elblag (just outside the bottom of the image) from the Baltic Sea in the 13th century. To reconnect Elblag directly with the Baltic Sea, the EU is considering funding the digging of another canal through the spit at lower right, despite ecological concerns. Kaliningrad was heavily damaged during WWII and then annexed by Russia and cleared of its German population. As the only Russian port on the Baltic Sea to be ice-free year-round, Kaliningrad then gained importance strategically as home of the Baltic Fleet.
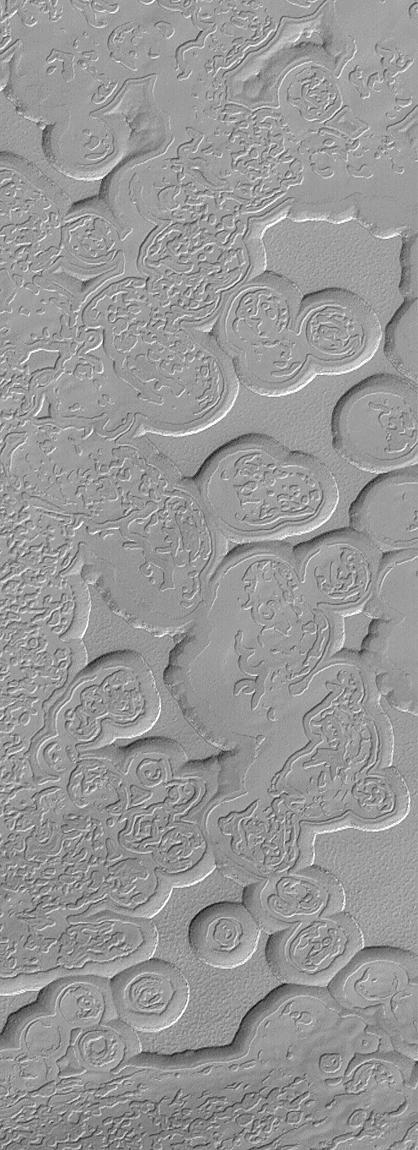
This image is illuminated by sunlight from the upper left. Looking like pieces of sliced and broken swiss cheese, the upper layer of the martian south polar residual cap has been eroded, leaving flat-topped mesas into which are set circular depressions such as those shown here. The circular features are depressions, not hills. The largest mesas here stand about 4 meters (13 feet) high and may be composed of frozen carbon dioxide and/or water. Nothing like this has ever been seen anywhere on Mars except within the south polar cap, leading to some speculation that these landforms may have something to do with the carbon dioxide thought to be frozen in the south polar region. On Earth, we know frozen carbon dioxide as "dry ice." On Mars, as this picture might be suggesting, there may be entire landforms larger than a small town and taller than 2 to 3 men and women that consist, in part, of dry ice. No one knows for certain whether frozen carbon dioxide has played a role in the creation of the "swiss cheese" and other bizarre landforms seen in this picture. The picture covers an area 3 x 9 kilometers (1.9 x 5.6 miles) near 85.6°S, 74.4°W at a resolution of 7.3 meters (24 feet) per pixel. This picture was taken by the Mars Global Surveyor (MGS) Mars Orbiter Camera (MOC) during early southern spring on August 3, 1999. http://photojournal.jpl.nasa.gov/catalog/PIA02367

ISS030-E-010008 (4 Dec. 2011) --- One of the Expedition 30 crew members aboard the Earth-orbiting International Space Station photographed this night time scene of the Iberian Peninsula on Dec. 4, 2011. The city lights of Spain and Portugal define the peninsula. Several large metropolitan areas are visible, marked by their relatively large and brightly lit areas, such as two capital cities -- Madrid, Spain, located near the center of the peninsula?s interior, and Lisbon, Portugal, located along the southwestern coastline. Ancient Seville, visible at image right to the north of the approximately 14 kilometer-wide Strait of Gibraltar, is one of the largest cities in Spain. All together, the Principality of Andorra, the Kingdom of Spain and the Portuguese Republic total approximately 590,000 square kilometers of landmass. The peninsula is bounded by the Atlantic Ocean to the northwest, west, and southwest and the Mediterranean Sea to the east. Its northeastern boundary with the rest of continental Europe is marked by the Pyrenees mountain range. The view is looking outwards from the orbital outpost toward the east. The network of smaller cities and towns in the interior and along the coastline attest to the large extent of human presence on the Iberian landscape. Blurring of the city lights is caused by thin cloud cover (image left and center), while the cloud tops are dimly illuminated by moonlight. Though obscured, the lights of France are visible near the horizon line at image upper left, while the lights of northern Africa are more clearly discernable at image right. The gold to green line of airglow, caused by excitation of upper atmosphere gas molecules by ultraviolet radiation, parallels the horizon line (or Earth limb).
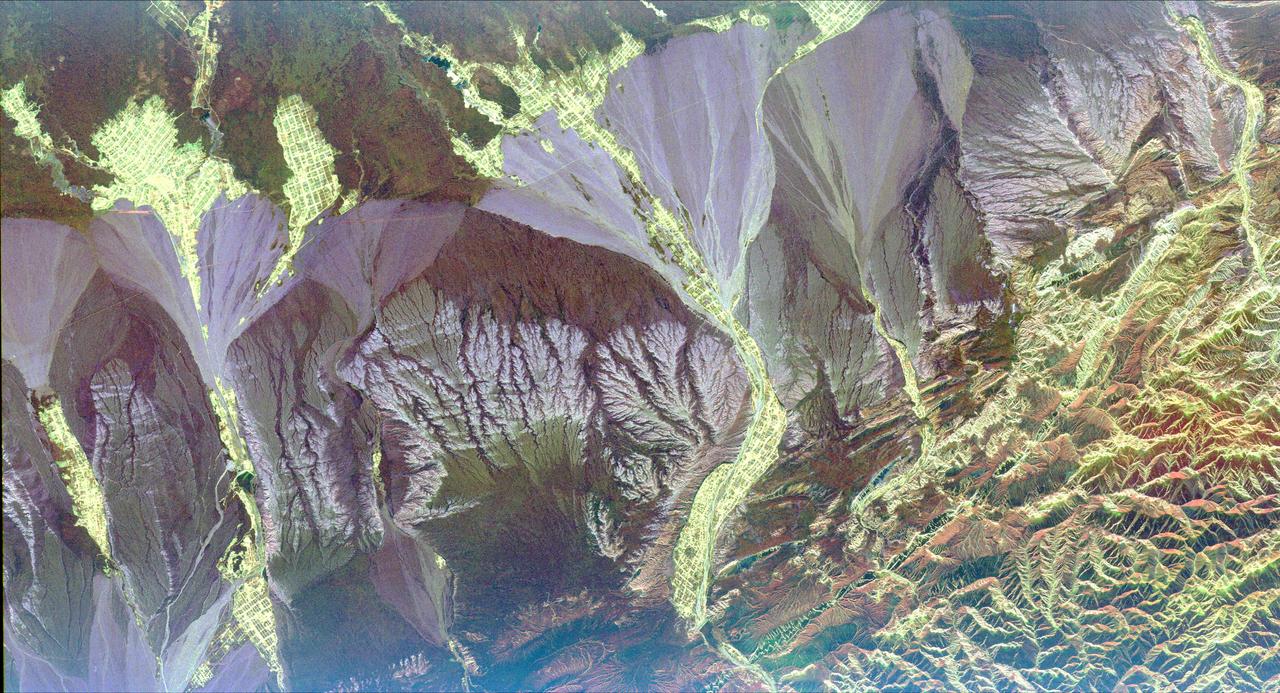
This radar image is centered near the small town of Pishan in northwest China, about 280 km (174 miles) southeast of the city of Kashgar along the ancient Silk Route in the Taklamakan desert of the Xinjiang Province. Geologists are using this radar image as a map to study past climate changes and tectonics of the area. The irregular lavender branching patterns in the center of the image are the remains of ancient alluvial fans, gravel deposits that have accumulated at the base of the mountains during times of wetter climate. The subtle striped pattern cutting across the ancient fans are caused by thrusting of the Kun Lun Mountains north. This motion is caused by the continuing plate-tectonic collision of India with Asia. Modern fans show up as large lavender triangles above the ancient fan deposits. Yellow areas on the modern fans are vegetated oases. The gridded pattern results from the alignment of poplar trees that have been planted as wind breaks. The reservoir at the top of the image is part of a sophisticated irrigation system that supplies water to the oases. This image was acquired by the Spaceborne Imaging Radar-C/X-band Synthetic Aperture Radar (SIR-C/X-SAR) aboard the space shuttle Endeavour in April 1994. This image is centered at 37.4 degrees north latitude, 78.3 degrees east longitude and shows an area approximately 50 km by 100 km (31 miles by 62 miles). The colors are assigned to different frequencies and polarizations of the radar as follows: Red is L-band horizontally transmitted, horizontally received; green is L-band horizontally transmitted, vertically received; and blue is C-band horizontally transmitted and vertically received. SIR-C/X-SAR, a joint mission of the German, Italian, and the United States space agencies, is part of NASA's Mission to Planet Earth. http://photojournal.jpl.nasa.gov/catalog/PIA01796
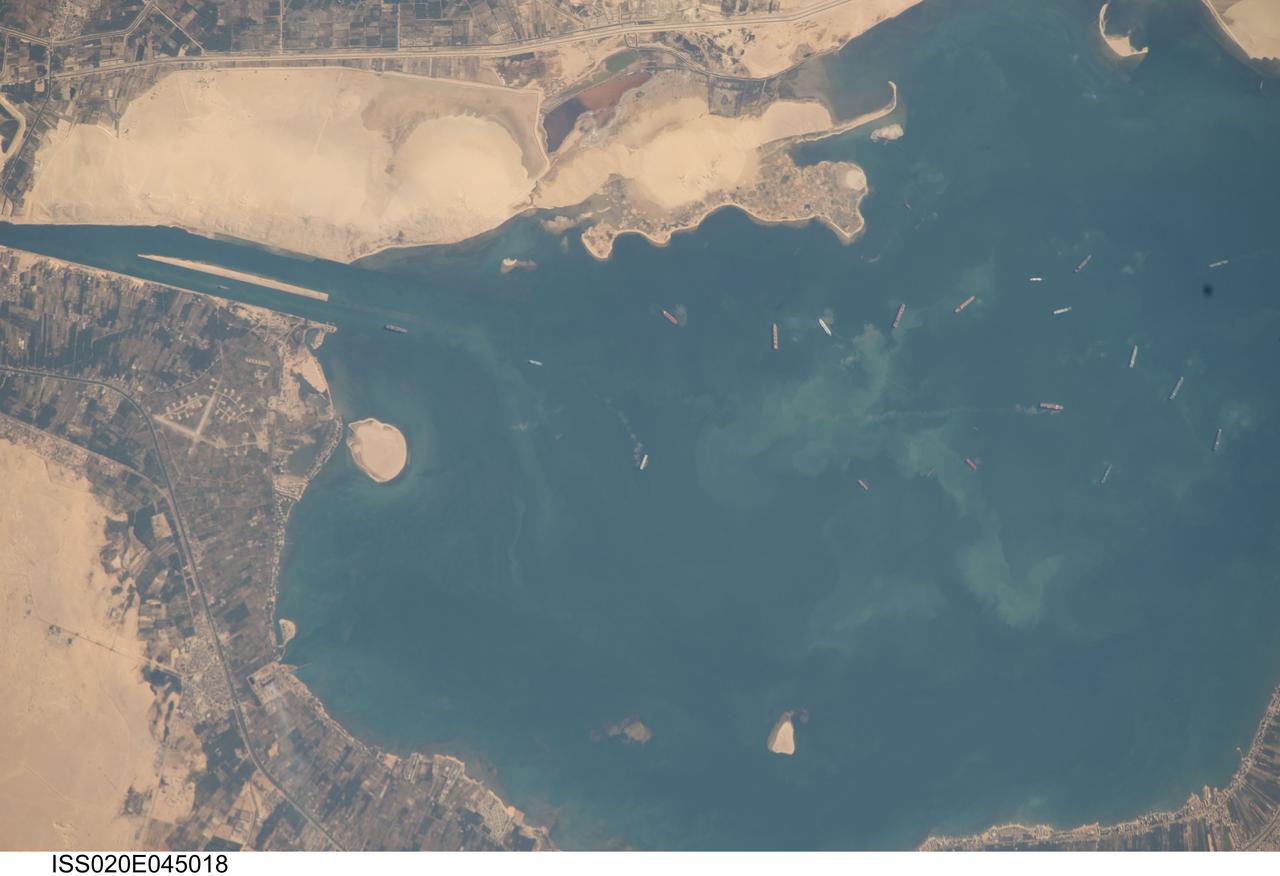
ISS020-E-045018 (2 Oct. 2009) --- Great Bitter Lake, Egypt is featured in this image photographed by an Expedition 20 crew member on the International Space Station. The Great Bitter Lake is one of several lakes located along the Suez Canal that connects the eastern Mediterranean and Red Seas. As the Canal is built only to allow ships to travel in a single lane, the Great Bitter Lake is a location where ships can change their position in line - much like a motor highway passing lane - before proceeding to either Port Said to the north, or the port of Suez to the south. The lake also provides an intermediate harborage for ships traversing the Canal ? a journey that typically takes 14 hours end-to-end. Several ships - some under power and some anchored ? are visible at right. Prior to the opening of the Suez Canal in 1869, Great Bitter Lake was a large salt flat, the typical geomorphic expression of basins in the arid Egyptian climate. Large expanses of white to tan sandy sediments at left and top attest to the desert conditions surrounding the Lake. Located at the approximate midpoint of the Suez Canal, Great Bitter Lake is now filled with water derived from both the Red and Mediterranean Seas and this steady influx of water balances the water lost to evaporation. The town of Fayid (also spelled as Fayed), visible along the western shore of the Lake (bottom) is a tourist destination frequented, particularly in the summer months, by residents of Cairo.
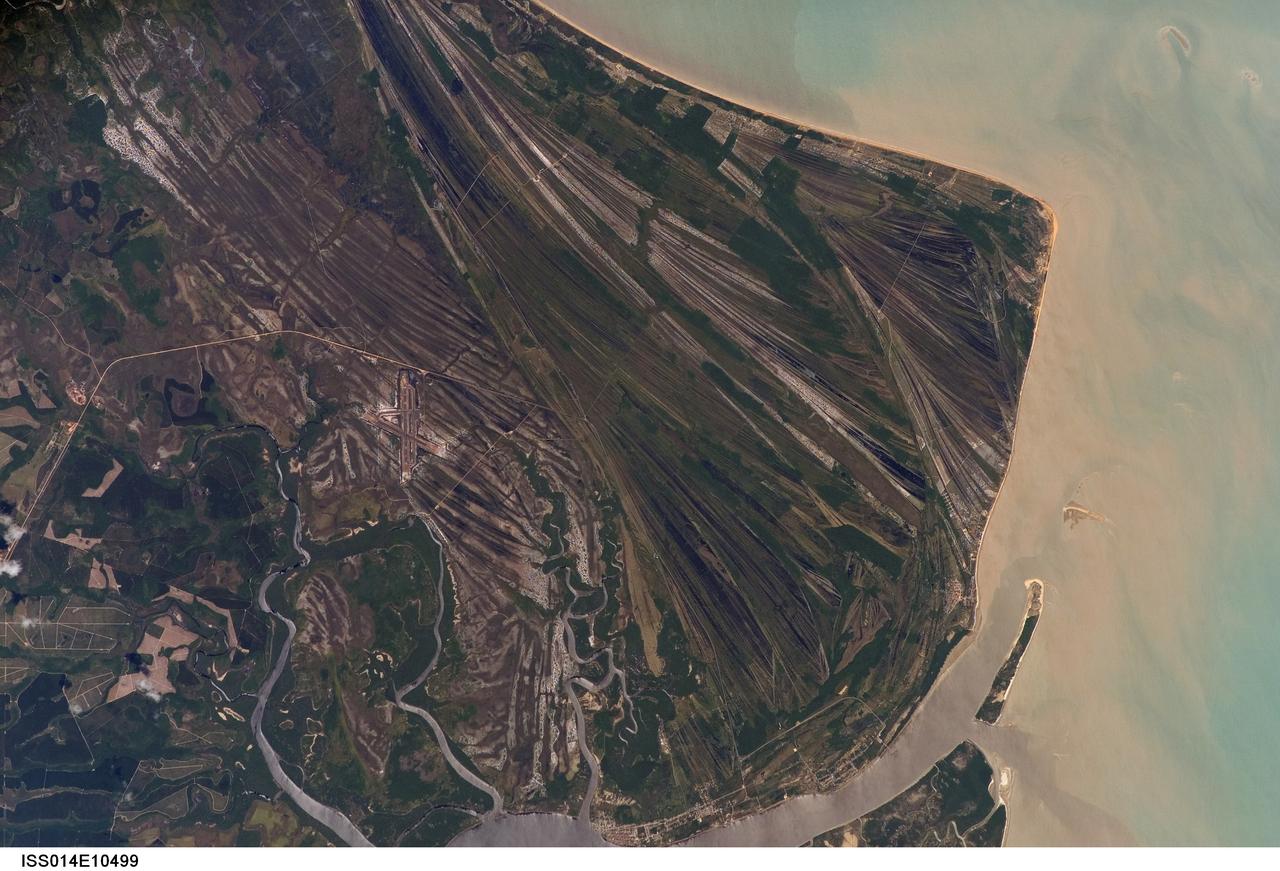
ISS014-E-10499 (23 Dec. 2006) --- Caravelas strandplain, Bahia Province, Brazil is featured in this image photographed by an Expedition 14 crewmember on the International Space Station. This view highlights a flat coastal landform known as a strandplain, or ancient shoreline. The image is dominated by numerous, fine parallel lines (trending diagonally from upper left to lower right), each of which is an ancient shoreline made up of sand transported from rivers to the north. The strandplain has been generated by these narrow shorelines accumulating against one another, line by line in their dozens or even hundreds, over thousands of years. The shorelines can be grouped into at least four packets depending on the crosscutting relationships - younger packets will cut into or stratigraphically overlay older packets. These relationships indicate that the youngest packet lies nearest the coast (furthest right) and the oldest packet lies north of the city of Caravelas (bottom). The Caravelas River flows into the Atlantic Ocean at the bottom of the view. Sediment from this river, and from the current shoreline, produces the light browns and dun colors visible offshore. On the day this image was taken the river water was relatively clear; clear water (gray) is visible flowing out of the main river mouth, and also off to one side to the south over a levee. The Caravelas airport appears near the middle of the view, and is built on one of the ancient shoreline packets. Caravelas itself, a fishing town of about 20,000 inhabitants, lies on an estuary and was once a flourishing whaling center--the prominent cape at top right is known as Ponta da Baleia (Whale Point).
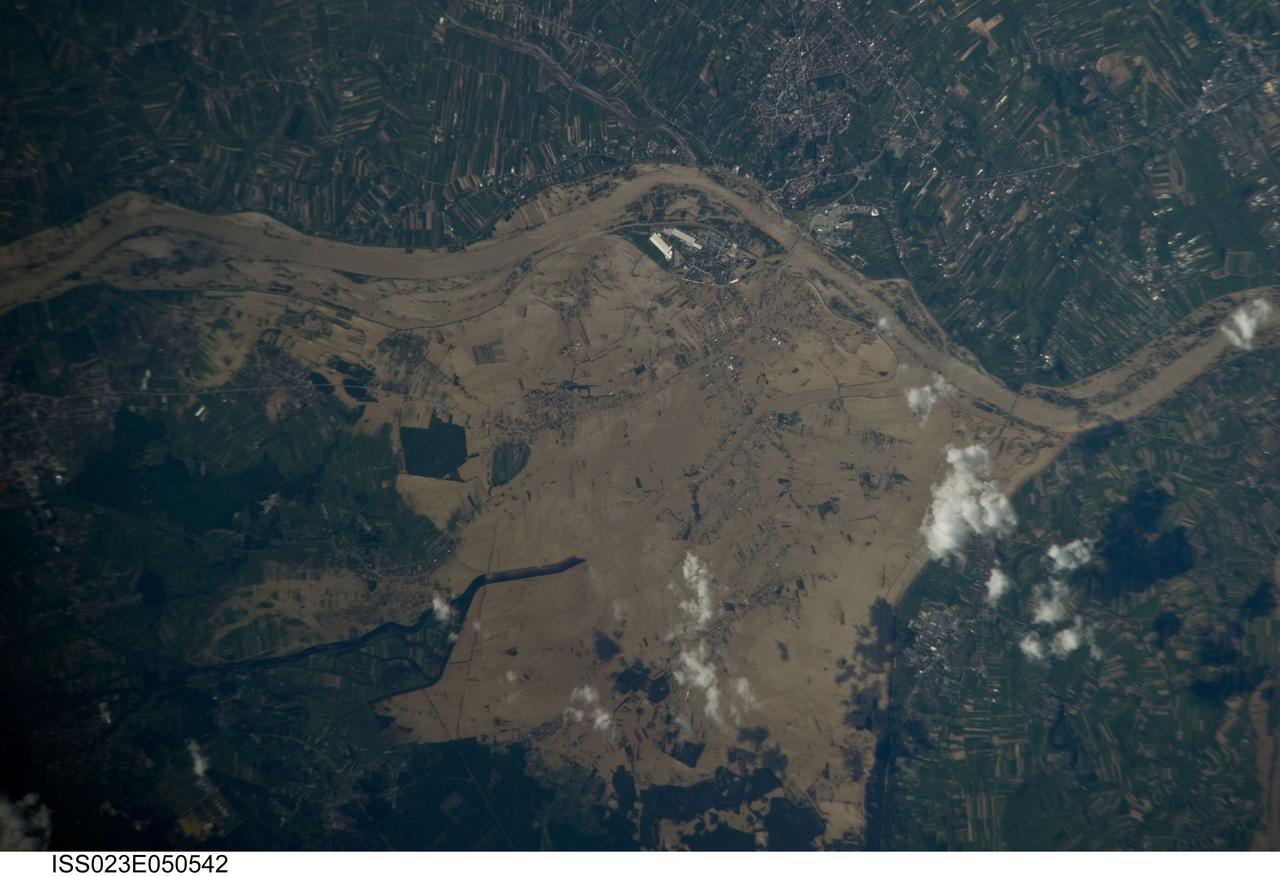
ISS023-E-050542 (22 May 2010) --- Widespread flooding along the Vistula River in southeastern Poland is featured in this image photographed by an Expedition 23 crew member on the International Space Station. The Vistula River is a major river in Poland that originates in the western part of the Carpathian Mountains (specifically the western slopes of the mountain Barania Gora) in southern Poland. The river winds its way northward for 1,047 kilometers, through major cities such as Krakow and Warsaw, to Gdansk Bay on the Baltic Sea. Several towns have been completely or partially inundated including Gorzyce, Sokolniki and Trzesn in addition to large numbers of agricultural fields (normally green as visible at top and bottom right). While the flooding illustrated here is extensive, it represents but a small “snapshot” of conditions that have developed in Eastern Europe over the past two weeks. Spring flooding of rivers is not an uncommon occurrence in Poland but this event is being called the most serious flood in several decades. Severe floods were recorded in 1570, 1584, 1719, 1891, and 1997, with the first records of local embankments for flood control dating from the thirteenth century. By 1985, 370 rivers in Poland (including the Vistula) had been completely or partly embanked along a total length of 9,028 kilometers for some degree of flood mitigation. Heavy rains caused high waters in the Vistula River first in southern Poland. Hundreds of thousands of people were evacuated as the river level rose and broke through water-logged dikes and embankments. The flood surge then moved northward through Warsaw and continues towards the Baltic Sea.
STS059-S-079 (18 April 1994) --- This is a false-color, three frequency image of Prince Albert, Canada, centered at 53.91 north latitude and 104.69 west longitude. It was produced using data from the X-Band, C-Band and L-Band radars that comprise the Spaceborne Imaging Radar-C and X-Band Synthetic Aperture Radar (SIR-C/X-SAR). SIR-C/X-SAR acquired this image on the 20th orbit of the Space Shuttle Endeavour. The area is located 40 kilometers north and 30 kilometers east of the town of Prince Albert in the Saskatchewan province of Canada. The image covers the area east of the Candle Lake, between gravel surface Highways 120 and 106 and west of 106. The area in the middle of the image covers the entire Nipawin (Narrow Hills) provincial park. The look angle of the radar is 30 degrees and the size of the image is approximately 20 by 50 kilometers. The red, green, and blue colors represent L-Band total power, C-Band total power, and XVV respectively. The changes in the intensity of each color are related to various surface conditions such as frozen or thawed forest, fire, deforestation and areas of regrowth. Most of the dark blue areas in the image are the ice covered lakes. The dark area on the top right corner of the image is the White Gull Lake north of the intersection of Highway 120 and 913. The right middle part of the image shows Lake Ispuchaw and Lower Fishing Lake. The deforested areas are shown by light blue in the image. Since most of the logging practice at the Prince Albert area is around the major highways, the deforested areas can be easily detected as small geometrically shaped dark regions along the roads. At the time these data were taken, a major part of the forest was either frozen or undergoing the spring thaw. In such conditions, due to low volume of water in the vegetation, a deeper layer of the canopy is imaged by the radar, revealing valuable information about the type of trees, the amount of vegetation biomass and the condition of the surface. As the frequency increases, the penetration depth in the canopy decreases. Over forest canopies, the X-Band radar contains information about the top of the canopy. Whereas, C-Band and L-Band radar returns show contributions from the crown and trunk areas respectively. The bright areas in the image are dense mixed aspen and old jackpine forests where the return from all three bands is high. The reddish area corresponds to more sparse old jack pine (12 to 17 meters in height and 60 to 75 years old) where the L-Band signal penetrates deeper in the canopy and dominates C-Band and X-Band returns. Comparison of the image with the forest cover map of the area indicates that the three band radar can be used to classify various stands. SIR-C/X-SAR is part of NASA's Mission to Planet Earth (MTPE). SIR-C/X-SAR radars illuminate Earth with microwaves allowing detailed observations at any time, regardless of weather or sunlight conditions. SIR-C/X-SAR uses three microwave wavelengths: L-Band (24 cm), C-Band (6 cm), and X-Band (3 cm). The multi-frequency data will be used by the international scientific community to better understand the global environment and how it is changing. The SIR-C/X-SAR data, complemented by aircraft and ground studies, will give scientists clearer insights into those environmental changes which are caused by nature and those changes which are induced by human activity. SIR-C was developed by NASA's Jet Propulsion Laboratory (JPL). X-SAR was developed by the Dornire and Alenia Spazio Companies for the German Space Agency, Deutsche Agentur fuer Raumfahrtangelegenheiten (DARA), and the Italian Space Agency, Agenzia Spaziale Italiana (ASI). JPL Photo ID: P-43929
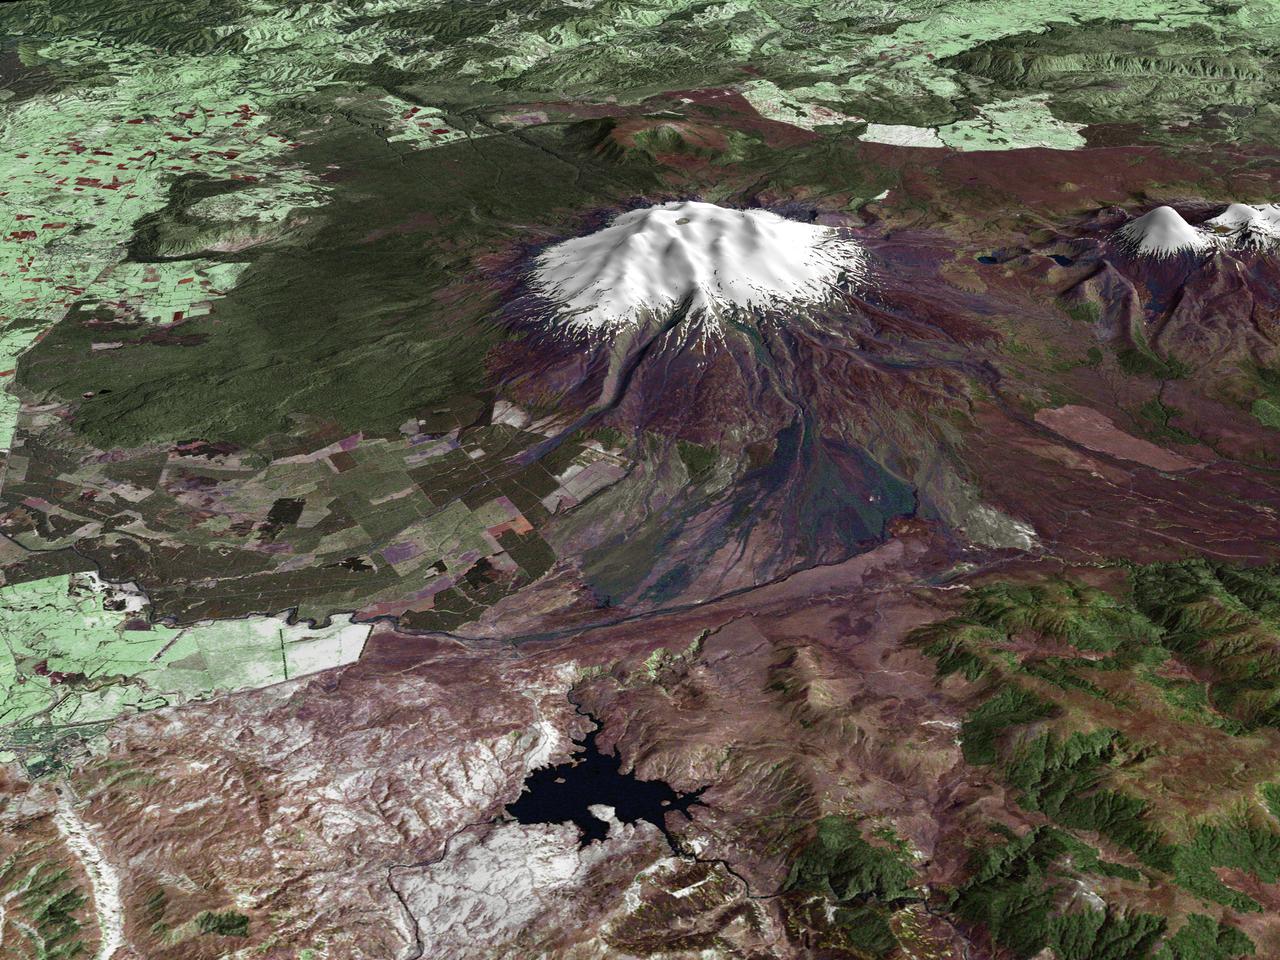
All around the world, people live in places where the threat of natural disaster is high. On the North Island of New Zealand, the Mount Ruapehu volcano is just such a threat. A towering, active stratovolcano (the classic cone-shaped volcano), snow-capped Ruapehu Volcano is pictured in this enhanced-color image. The image is made from topography data collected by the Shuttle Radar Topography Mission aboard the Space Shuttle Endeavour, launched on February 11, 2000, and imagery collected by the Landsat satellite on October 23, 2002. Ruapehu is one of New Zealand’s most active volcanoes, with ten eruptions since 1861. The eruptions aren’t the only threat from the volcano, however. Among the most serious threats is a volcanic mudflow called a lahar. In between eruptions, a lake forms in the volcano’s caldera from melting snow. If a previous eruption has deposited a dam of ash, rocks and mud in the lake’s natural overflow point, then the lake becomes dangerously full, held back only by the temporary dam. In this scene, the lake is nestled among the ridges at the top of the volcano. Eventually, the dam gives way and a massive flow of mud and debris churns down the mountain toward farmland and towns below. Scientists estimate that Ruapehu has experienced 60 lahars in the last 150 years. A devastating lahar in 1953 killed more than 150 people, who died when a passenger train plunged into a ravine when a railroad bridge was taken out by the lahar. The flank of the volcano below the lake is deeply carved by the path of previous lahars; the gouge can be seen just left of image center. Currently scientists in the region are predicting that the lake will overflow in a lahar sometime in the next year. There is great controversy about how to deal with the threat. News reports from the region indicate that the government is planning to invest in a high-tech warning system that will alert those who might be affected well in advance of any catastrophic release. Others feel that the government should combat the threat through engineering at the top of the mountain, for example, by undertaking a controlled release of the lake. Credit Landsat data provided courtesy of the University of Maryland Global Land Cover Facility Landsat processing by Laura Rocchio, Landsat Project Science Office SRTM 3-arcsecond elevation data courtesy of SRTM Team NASA/JPL/NIMA Visualization created by Earth Observatory staff. <b><a href="http://www.nasa.gov/centers/goddard/home/index.html" rel="nofollow">NASA Goddard Space Flight Center</a></b> enables NASA’s mission through four scientific endeavors: Earth Science, Heliophysics, Solar System Exploration, and Astrophysics. Goddard plays a leading role in NASA’s accomplishments by contributing compelling scientific knowledge to advance the Agency’s mission. <b>Follow us on <a href="http://twitter.com/NASA_GoddardPix" rel="nofollow">Twitter</a></b> <b>Join us on <a href="http://www.facebook.com/pages/Greenbelt-MD/NASA-Goddard/395013845897?ref=tsd" rel="nofollow">Facebook</a></b>

The U.S. National Weather Service called it a “a crippling and historic winter blizzard.” In late January 2015, transportation systems from Trenton to Portland were shut down, and more than 35 million people hunkered down for extreme snowfall and biting winds. For those in New England, it turned out to be a monstrous storm. For the Mid-Atlantic region, not so much. Vast swaths of Massachusetts, Connecticut, Rhode Island, New Hampshire, Maine, and Long Island (NY) were blanketed with 15 to 25 inches (40 to 60 centimeters) of snow as of midday on January 27, 2015, and snow was expected to continue into January 28. Sustained winds reached gale force, with hurricane-force gusts along the coastlines. Storm surges sent ice and water into the streets of Scituate and Nantucket, Massachusetts. Many New England towns, including the city of Boston, were expected to approach all-time snowfall records. The Visible Infrared Imaging Radiometer Suite on the Suomi NPP satellite acquired these nighttime images at 1:45 am US eastern standard time (06:45 Universal Time) on January 27, 2015. The top image, lit by moonlight and city lights, shows a nor'easter off the coast of the East Coast of the United States. City lights are blurred somewhat by the cloud cover. The second image shows the same scene in longwave infrared radiation, with brighter shades representing the colder temperatures of snow-producing clouds. NASA Earth Observatory image by Jesse Allen, using VIIRS data from the Suomi National Polar-orbiting Partnership. Read more: <a href="http://earthobservatory.nasa.gov/IOTD/view.php?id=85166&eocn=home&eoci=iotd_title" rel="nofollow">earthobservatory.nasa.gov/IOTD/view.php?id=85166&eocn...</a> Via: <b><a href="http://www.earthobservatory.nasa.gov/" rel="nofollow"> NASA Earth Observatory</a></b> <b><a href="http://www.nasa.gov/audience/formedia/features/MP_Photo_Guidelines.html" rel="nofollow">NASA image use policy.</a></b> <b><a href="http://www.nasa.gov/centers/goddard/home/index.html" rel="nofollow">NASA Goddard Space Flight Center</a></b> enables NASA’s mission through four scientific endeavors: Earth Science, Heliophysics, Solar System Exploration, and Astrophysics. Goddard plays a leading role in NASA’s accomplishments by contributing compelling scientific knowledge to advance the Agency’s mission. <b>Follow us on <a href="http://twitter.com/NASAGoddardPix" rel="nofollow">Twitter</a></b> <b>Like us on <a href="http://www.facebook.com/pages/Greenbelt-MD/NASA-Goddard/395013845897?ref=tsd" rel="nofollow">Facebook</a></b> <b>Find us on <a href="http://instagram.com/nasagoddard?vm=grid" rel="nofollow">Instagram</a></b>

The U.S. National Weather Service called it a “a crippling and historic winter blizzard.” In late January 2015, transportation systems from Trenton to Portland were shut down, and more than 35 million people hunkered down for extreme snowfall and biting winds. For those in New England, it turned out to be a monstrous storm. For the Mid-Atlantic region, not so much. Vast swaths of Massachusetts, Connecticut, Rhode Island, New Hampshire, Maine, and Long Island (NY) were blanketed with 15 to 25 inches (40 to 60 centimeters) of snow as of midday on January 27, 2015, and snow was expected to continue into January 28. Sustained winds reached gale force, with hurricane-force gusts along the coastlines. Storm surges sent ice and water into the streets of Scituate and Nantucket, Massachusetts. Many New England towns, including the city of Boston, were expected to approach all-time snowfall records. The Visible Infrared Imaging Radiometer Suite on the Suomi NPP satellite acquired these nighttime images at 1:45 am US eastern standard time (06:45 Universal Time) on January 27, 2015. The top image, lit by moonlight and city lights, shows a nor'easter off the coast of the East Coast of the United States. City lights are blurred somewhat by the cloud cover. The second image shows the same scene in longwave infrared radiation, with brighter shades representing the colder temperatures of snow-producing clouds. NASA Earth Observatory image by Jesse Allen, using VIIRS data from the Suomi National Polar-orbiting Partnership. Read more: <a href="http://earthobservatory.nasa.gov/IOTD/view.php?id=85166&eocn=home&eoci=iotd_title" rel="nofollow">earthobservatory.nasa.gov/IOTD/view.php?id=85166&eocn...</a> Via: <b><a href="http://www.earthobservatory.nasa.gov/" rel="nofollow"> NASA Earth Observatory</a></b> <b><a href="http://www.nasa.gov/audience/formedia/features/MP_Photo_Guidelines.html" rel="nofollow">NASA image use policy.</a></b> <b><a href="http://www.nasa.gov/centers/goddard/home/index.html" rel="nofollow">NASA Goddard Space Flight Center</a></b> enables NASA’s mission through four scientific endeavors: Earth Science, Heliophysics, Solar System Exploration, and Astrophysics. Goddard plays a leading role in NASA’s accomplishments by contributing compelling scientific knowledge to advance the Agency’s mission. <b>Follow us on <a href="http://twitter.com/NASAGoddardPix" rel="nofollow">Twitter</a></b> <b>Like us on <a href="http://www.facebook.com/pages/Greenbelt-MD/NASA-Goddard/395013845897?ref=tsd" rel="nofollow">Facebook</a></b> <b>Find us on <a href="http://instagram.com/nasagoddard?vm=grid" rel="nofollow">Instagram</a></b>
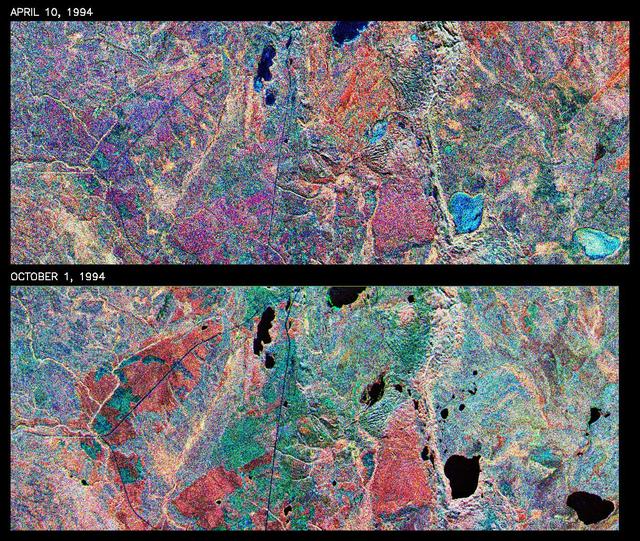
This is a comparison of images over Prince Albert, produced by NASA Spaceborne Imaging Radar-C and X-band Synthetic Aperture Radar aboard the space shuttle Endeavour on its 20th orbit on April 10, 1994. The area is centered at 53.91 degrees north latitude and 104.69 degrees west longitude and is located 40 kilometers (25 miles) north and 30 kilometers (18.5 miles) east of the town of Prince Albert in the Saskatchewan province of Canada. The image covers the area east of Candle Lake, between the gravel highway of 120 and west of highway 106. The area imaged is near the southern limit of the boreal forest. The boreal forest of North America is a continuous vegetation belt at high latitudes stretching across the continent from the Atlantic shoreline of central Labrador and then westward across Canada to the interior mountains and central coastal plains of Alaska. The forest is also part of a larger northern hemisphere circumpolar boreal forest belt. Coniferous trees dominate the entire forest but deciduous trees are also present. During the month of April, the forest experiences seasonal changes from a frozen condition to a thawed condition. The trees are completely frozen over the winter season and the forest floor is covered by snow. As the average temperature rises in the spring, the trees are thawed and the snow melts. This transition has an impact on the rate of moisture evaporation and release of carbon dioxide into the atmosphere. In late September and early October, the boreal forest experiences a relatively different seasonal change. At this time, the leaves on deciduous trees start changing color and dropping off. The soil and trees are quite often moist due to frequent rainfall and cloud cover. The evaporation of moisture and carbon dioxide into the atmosphere also diminishes at this time. SIR-C/X-SAR is sensitive to the moisture of soil and vegetation and can sense this freeze-thaw cycle and the summer-fall seasonal transition over forested areas in particular. Optical sensors, by contrast, are blind to these regions, which are perpetually obscured by thick cloud cover. These changes were detected by comparing the April and October color composite images of L-band data in red, C-band data in green and X-band (vertically received and transmitted) in blue. The changes in intensity of each color over lakes, various forest stands and clear cuts in the two images is striking. Lakes such as Lake Heiberg, Crabtree Lake and Williams Lake, in the right middle part of the image, are frozen in April (appearing in bright blue) and melted (appearing in black) in October. The higher intensity of blue over lakes in April is due to low penetration of the X-band (vertically received and transmitted) and the radar's high sensitivity to surface features. Forest stands also exhibit major changes between the two images. The red areas in the October image are old jack pine canopies that cause higher return at L-band because of their moist condition in late summer compared to their partially frozen condition in April (in purple). Similarly, in the areas near the middle of the image, where black spruce and mixed aspen and jack pine trees dominate, the contrast between blue in October and red and green in April is an indication that the top of the canopy (needles and branches) were frozen in April and moist in October. The changes due to deforestation by logging companies or natural fires can also be detected by comparing the images. For example, the small blue area near the intersection of Harding Road and Highway 120 is the result of logging which occurred after the April data was acquired. The surface area of clear cut is approximately 4 hectares, which is calculated from the high-resolution capability of the radar images and verified by scientists participating in field work during the mission. http://photojournal.jpl.nasa.gov/catalog/PIA01732
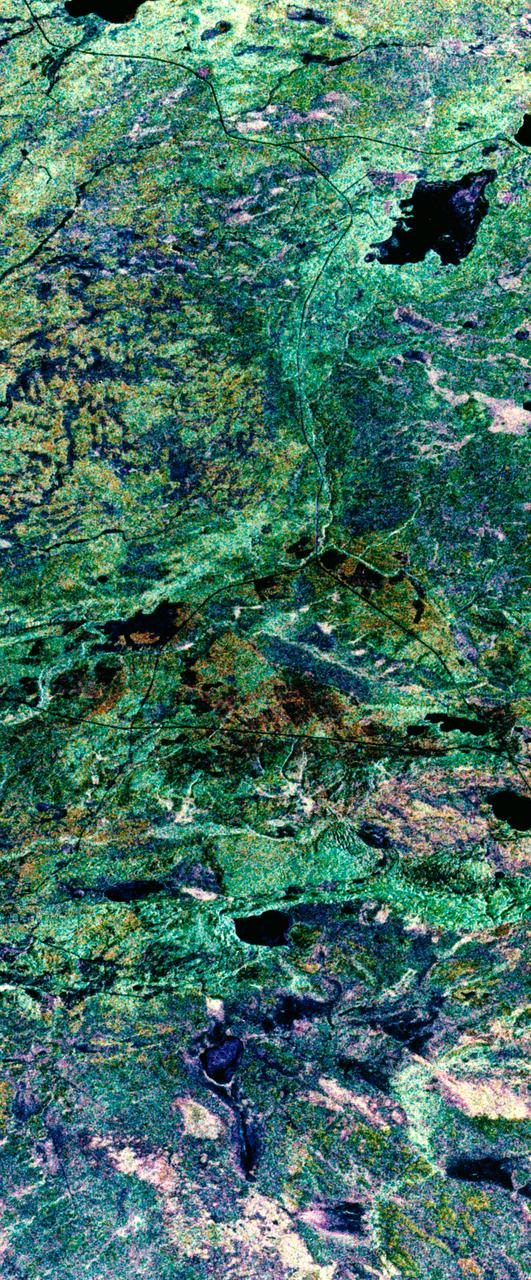
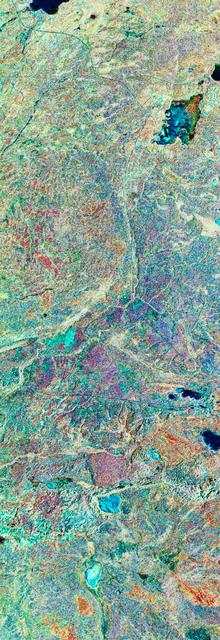
STS059-S-039 (11 April 1994) --- This is a false-color composite of Prince Albert, Canada, centered at 53.91 north latitude and 104.69 west longitude. This image was acquired by the Spaceborne Imaging Radar-C and X-Band Synthetic Aperture Radar (SIR-C/X-SAR) aboard the Space Shuttle Endeavour on its 20th orbit. The area is located 40 kilometers (25 miles) north and 30 kilometers (20 miles) east of the town of Prince Albert in the Saskatchewan province of Canada. The image covers the area east of the Candle Lake, between gravel surface Highways 120 and 106 and west of 106. The area in the middle of the image covers the entire Nipawin (Narrow Hills) provincial park. The look angle of the radar is 30 degrees and the size of the image is approximately 20 kilometers by 50 kilometers (12 by 30 miles). The image was produced by using only the L-Band. The three polarization channels HH, HV and VV are illustrated by red, green and blue respectively. The changes in the intensity of each color are related to various surface conditions such as variations in forest stands, frozen or thawed condition of the surface, disturbances (fire and deforestation), and areas of re-growth. Most of the dark areas in the image are the ice-covered lakes in the region. The dark area on the top right corner of the image is the White Gull Lake north of the intersection of Highway 120 and 913. The right middle part of the image shows Lake Ispuchaw and Lower Fishing Lake. The deforested areas are also shown by dark areas in the image. Since most of the logging practice at the Prince Albert area is around the major highways, the deforested areas can be easily detected as small geometrically shaped dark regions along the roads. At the time of the SIR-C/X-SAR overpass, a major part of the forest is either frozen or undergoing the spring thaw. The L-Band HH shows a high return in the jack pine forest. The reddish areas in the image are old jack pine forest, 12-17 meters (40-55 feet) in height and 60-75 years old. The orange-greenish areas are young jack pine trees, 3-5 meters (10-16 feet) in height and 11-16 years old. The green areas are due to the relative high intensity of the HV channel which is strongly correlated with the amount of biomass. L-Band HV channel shows the biomass variations over the entire region. Most of the green areas, when compared to the forest cover maps are identified as black spruce trees. The dark blue and dark purple colors show recently harvested or re-growth areas respectively. SIR-C/X-SAR is part of NASA's Mission to Planet Earth (MTPE). SIR-C/X-SAR radars illuminate Earth with microwaves allowing detailed observations at any time, regardless of weather or sunlight conditions. SIR-C/X-SAR uses three microwave wavelengths: L-Band (24 cm), C-Band (6 cm), and X-Band (3 cm). The multi-frequency data will be used by the international scientific community to better understand the global environment and how it is changing. The SIR-C/X-SAR data, complemented by aircraft and ground studies, will give scientists clearer insights into those environmental changes which are caused by nature and those changes which are induced by human activity. SIR-C was developed by NASA's Jet Propulsion Laboratory (JPL). X-SAR was developed by the Dornire and Alenia Spazio Companies for the German Space Agency, Deutsche Agentur fuer Raumfahrtangelegenheiten (DARA), and the Italian Space Agency, Agenzia Spaziale Italiana (ASI). JPL Photo ID: P-43886

Aerial view cityscape from airplane at summer