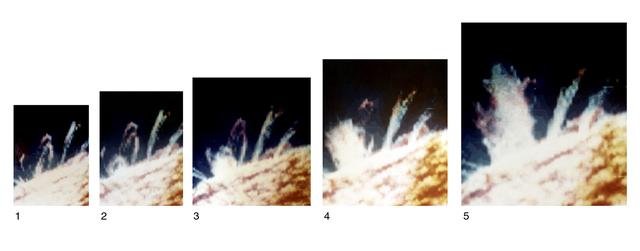
Breaking the grip of the closed magnetic loops that constrain other gases around it, a spray of chromospheric material surges upward, free of the Sun. Views 1 through 5 were recorded about 5 minutes apart by Skylab and comprise a composite of separate images made in chromospheric (red), transition region (green), and coronal (blue) temperatures of an ultraviolet sequence that depicts a solar eruption. Eruption begins (view 2) as material in or near a small, compact loop develops enough energy to overcome the Sun's magnetic bonds.
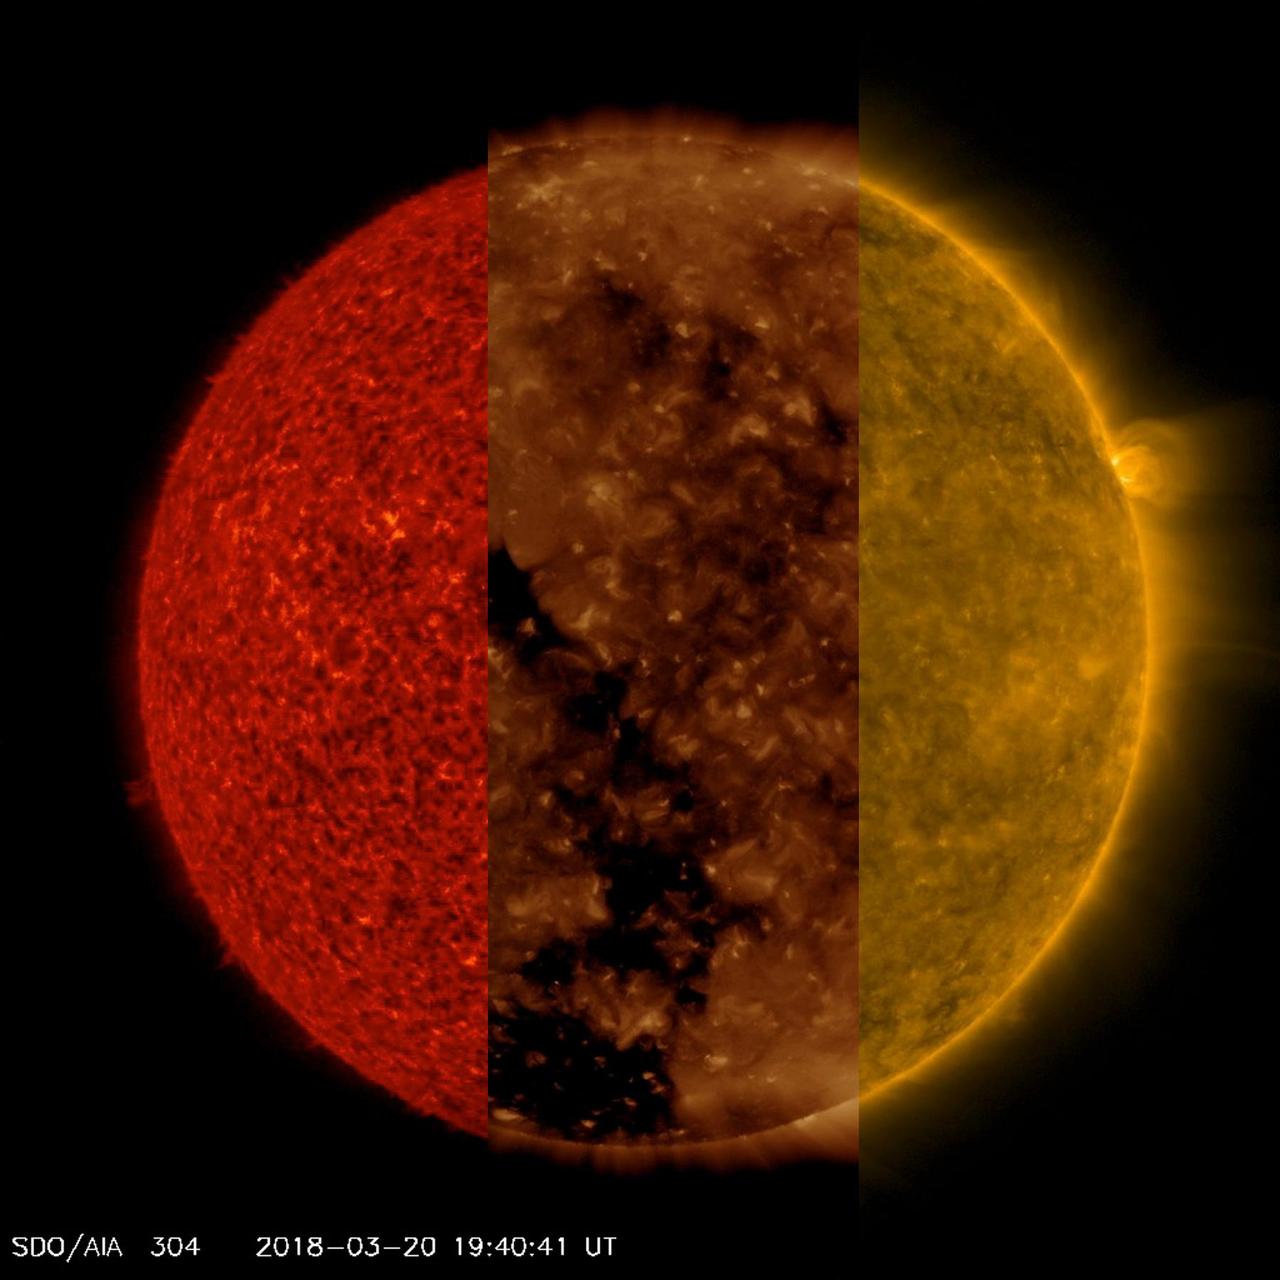
NASA's Solar Dynamics Observatory ran together three sequences of the sun taken in three different extreme ultraviolet wavelengths to better illustrate how different features that appear in one sequence are difficult if not impossible to see in the others (Mar. 20-21, 2018). In the red sequence (304 Angstroms), we can see very small spicules and some small prominences at the sun's edge, which are not easy to see in the other two sequences. In the second clip (193 Angstroms), we can readily observe the large and dark coronal hole, though it is difficult to make out in the others. In the third clip (171 wavelengths), we can see strands of plasma waving above the surface, especially above the one small, but bright, active region near the right edge. And these are just three of the 10 extreme ultraviolet wavelengths in which SDO images the sun every 12 seconds every day. That's a lot of data and a lot of science. Movies are available at https://photojournal.jpl.nasa.gov/catalog/PIA22360
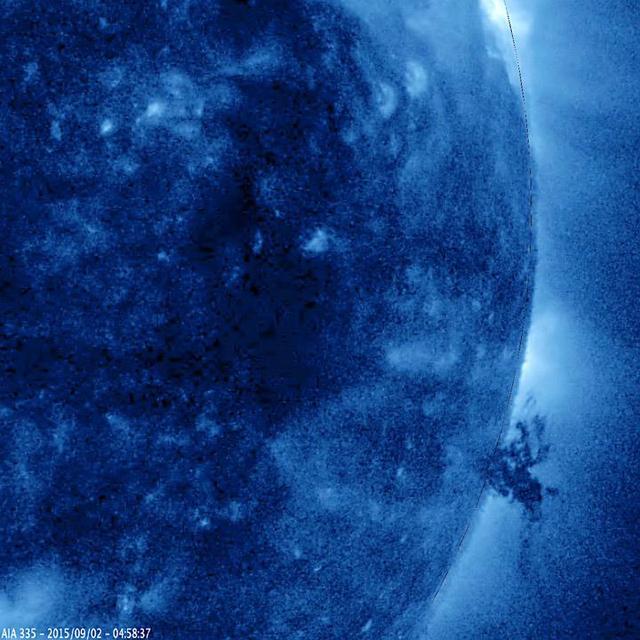
A small, but complex mass of plasma gyrated and spun about over the course of 40 hours above the surface of the Sun (Sept. 1-3, 2015). It was stretched and pulled back and forth by powerful magnetic forces but not ripped apart in this sequence. The temperature of the ionized iron particles observed in this extreme ultraviolet wavelength of light was about 2.8 million degrees C. (or 5 million degrees F.) http://photojournal.jpl.nasa.gov/catalog/PIA19878
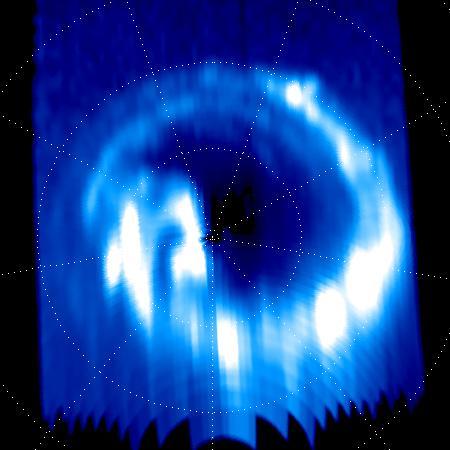
On Sept. 14, 2017, one day before making its final plunge into Saturn's atmosphere, NASA's Cassini spacecraft used its Ultraviolet Imaging Spectrograph, or UVIS, instrument to capture this final view of ultraviolet auroral emissions in the planet's north polar region. The view is centered on the north pole of Saturn, with lines of latitude visible for 80, 70 and 60 degrees. Lines of longitude are spaced 40 degrees apart. The planet's day side is at bottom, while the night side is at top. A sequence of images from this observation has also been assembled into a movie sequence. The last image in the movie was taken about an hour before the still image, which was the actual final UVIS auroral image. Auroral emissions are generated by charged particles traveling along the invisible lines of Saturn's magnetic field. These particles precipitate into the atmosphere, releasing light when they strike gas molecules there. Several individual auroral structures are visible here, despite that this UVIS view was acquired at a fairly large distance from the planet (about 424,000 miles or 683,000 kilometers). Each of these features is connected to a particular phenomenon in Saturn's magnetosphere. For instance, it is possible to identify auroral signatures here that are related to the injection of hot plasma from the dayside magnetosphere, as well as auroral features associated with a change in the magnetic field's shape on the magnetosphere's night side. Several possible scenarios have been postulated over the years to explain Saturn's changing auroral emissions, but researchers are still far from a complete understanding of this complicated puzzle. Researchers will continue to analyze the hundreds of image sequences UVIS obtained of Saturn's auroras during Cassini's 13-year mission, with many new discoveries likely to be made. This image and movie sequence were produced by the Laboratory for Planetary and Atmospheric Physics (LPAP) of the STAR Institute of the University of Liege in Belgium, in collaboration with the UVIS Team. The animation is available at https://photojournal.jpl.nasa.gov/catalog/PIA21899
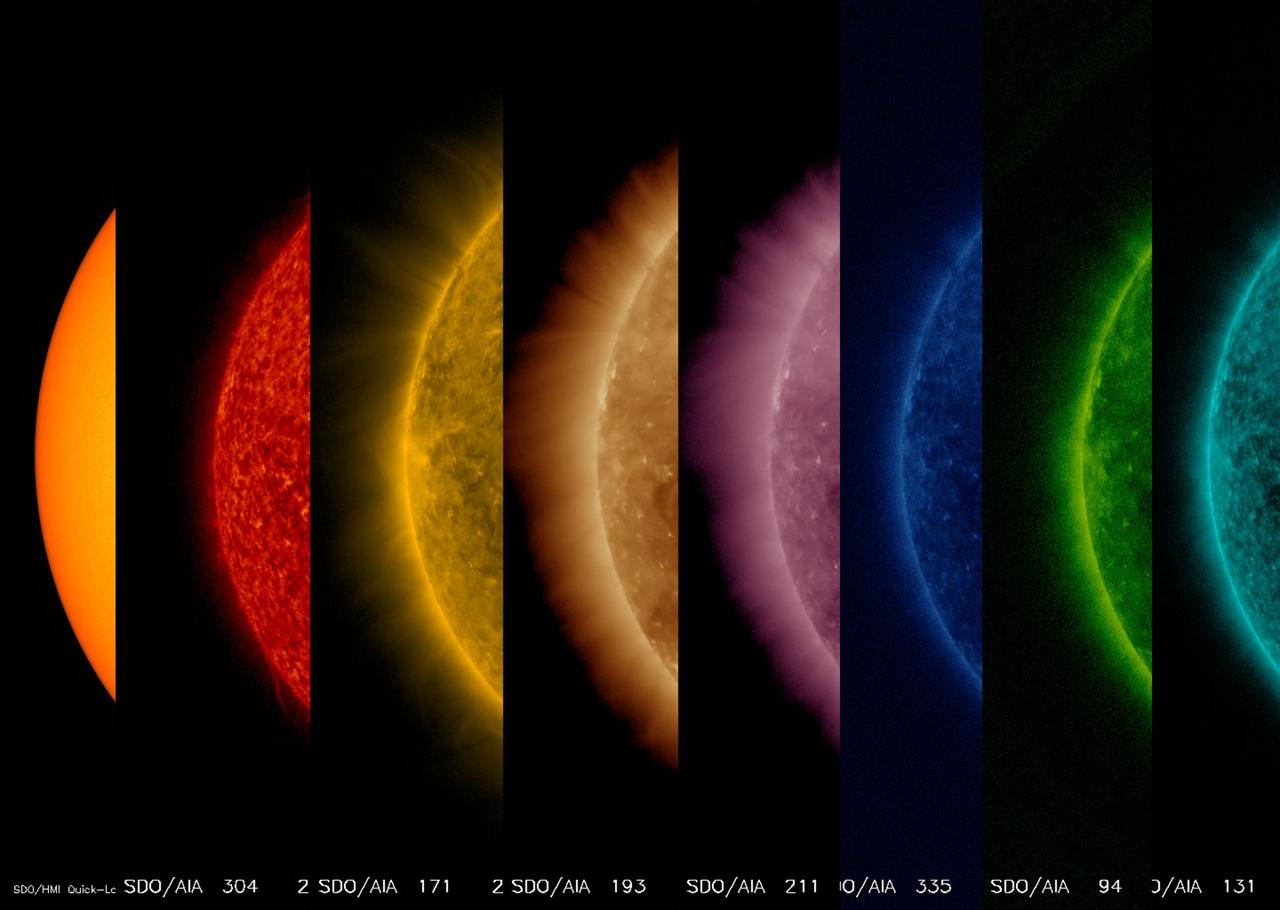
This sequence of images shows the sun from its surface to its upper atmosphere all taken at about the same time (Oct. 27, 2017). The first shows the surface of the sun in filtered white light; the other seven images were taken in different wavelengths of extreme ultraviolet light. Note that each wavelength reveals somewhat different features. They are shown in order of temperature from the first one at 6,000 degree C. surface out to about 10 million degrees C. in the upper atmosphere. Yes, the sun's outer atmosphere is much, much hotter than the surface. Scientists are getting closer to solving the processes that generate this phenomenon. https://photojournal.jpl.nasa.gov/catalog/PIA22055
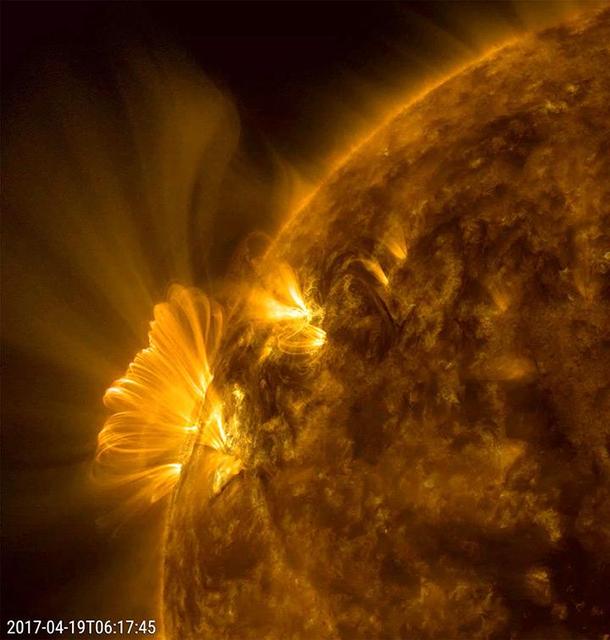
An active region that had just rotated into view blasted out a coronal mass ejection, which was immediately followed by a bright series of post-coronal loops seeking to reorganize that region's magnetic field (April 19, 2017). We have observed this phenomenon numerous times, but this one was one of the longest and clearest sequences we have seen in years. The bright loops are actually charged particles spinning along the magnetic field lines. The action was captured in a combination of two wavelengths of extreme ultraviolet light over a period of about 20 hours. Movies are available at https://photojournal.jpl.nasa.gov/catalog/PIA21598
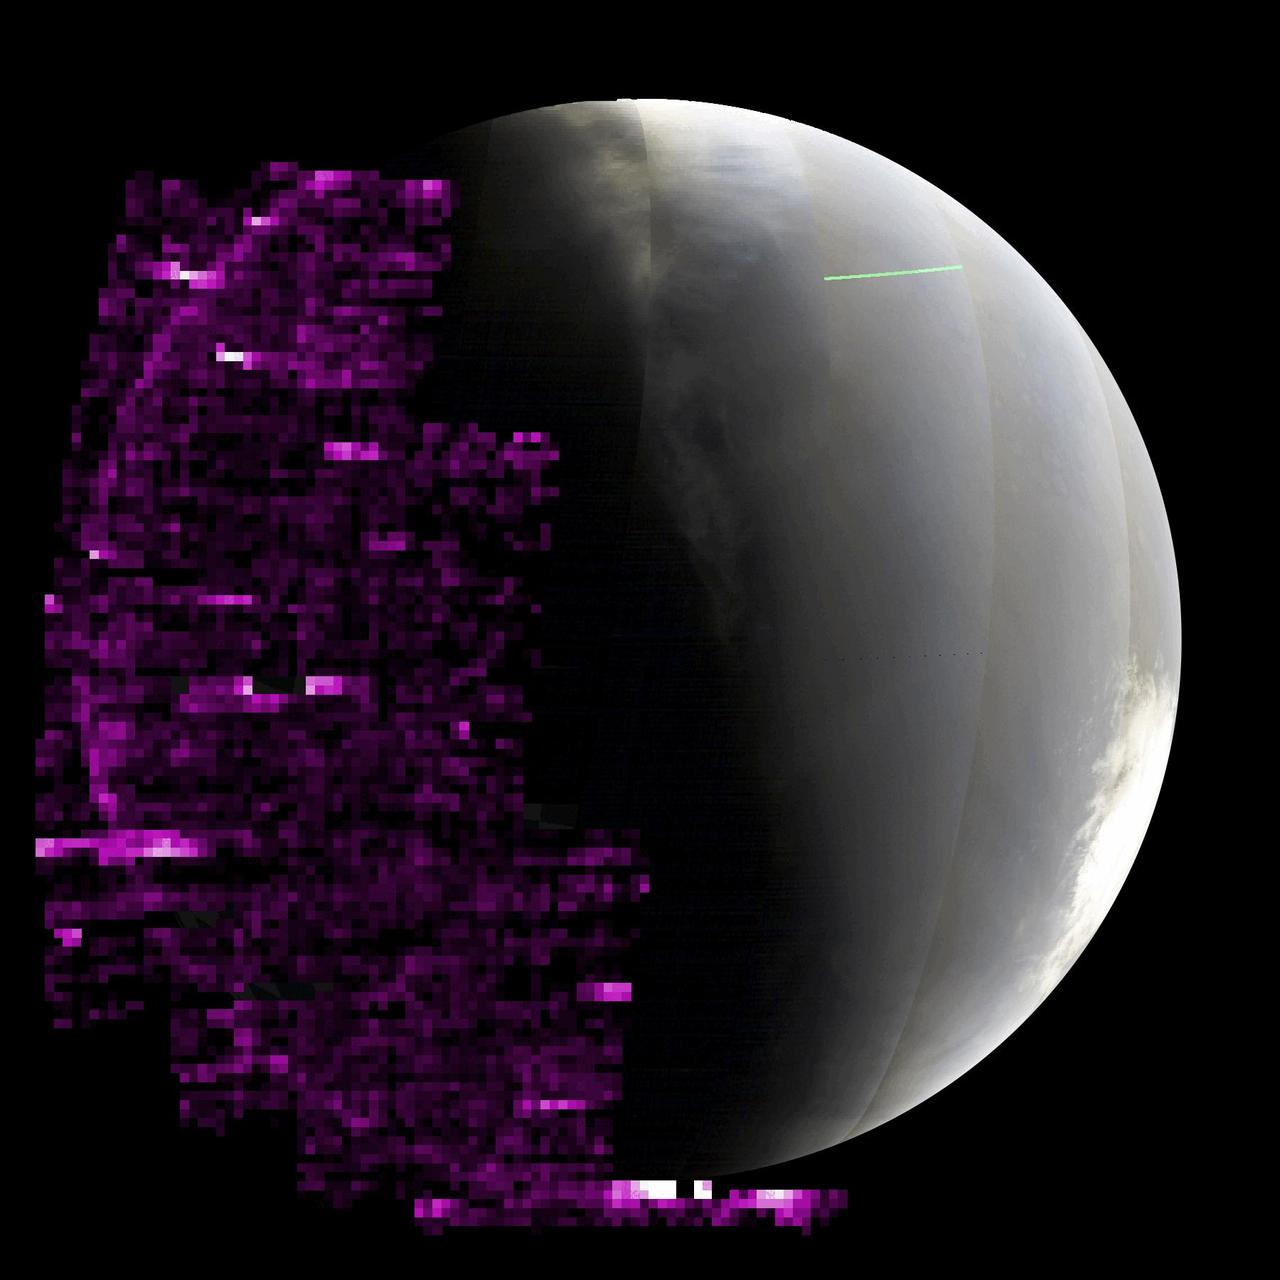
The purple color in this animated GIF shows auroras across Mars' nightside as detected by the Imaging Ultraviolet Spectrograph instrument aboard NASA's MAVEN (Mars Atmosphere and Volatile EvolutioN) orbiter. The brighter the purple, the more auroras were present. Taken as waves of energetic particles from a solar storm were arriving at Mars, the sequence pauses at the end, when the wave of the most energetic particles arrived and overwhelmed the instrument with noise. MAVEN took these images between May 14 and 20, 2024, as the spacecraft orbited below Mars, looking up at the nightside of the planet (Mars' south pole can be seen on the right, in full sunlight). Animation available at https://photojournal.jpl.nasa.gov/catalog/PIA26304
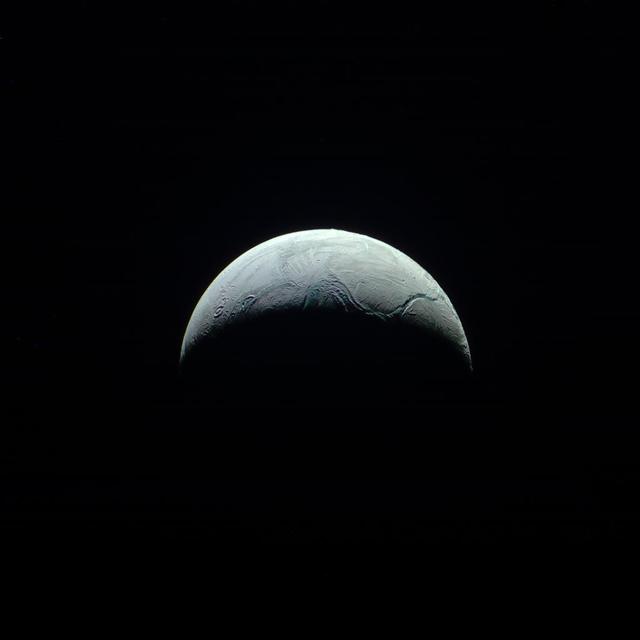
The heavens often seem vast and unchanging as seen from Earth, but movement in the skies is the norm. The relative motions of both Cassini and Enceladus over a 15-minute period create the movement seen in this movie sequence. Cassini has monitored Enceladus (313 miles or 504 kilometers across) with a particular interest in the plumes and the geology of the south polar region for many years. Different viewing geometries give scientists different information, and the resulting animation gives us a unique "spacecraft's eye" view of the flyby. The movie is a composite of six images taken with the Cassini spacecraft narrow-angle camera on Aug. 1, 2017 using filters that allow infrared, green, and ultraviolet light. The image filter centered on 930 nm (IR) is red in this image, the image filter centered on the green is green, and the image filter centered on 338 nm (UV) is blue. The view was obtained at a distance of approximately 112,000 miles (181,000 kilometers) from Enceladus. Image scale is about 0.6 mile (1 kilometer) per pixel. The animation is available at https://photojournal.jpl.nasa.gov/catalog/PIA21344
Cassini gazed toward high southern latitudes near Saturn's south pole to observe ghostly curtains of dancing light -- Saturn's southern auroras, or southern lights. These natural light displays at the planet's poles are created by charged particles raining down into the upper atmosphere, making gases there glow. The dark area at the top of this scene is Saturn's night side. The auroras rotate from left to right, curving around the planet as Saturn rotates over about 70 minutes, compressed here into a movie sequence of about five seconds. Background stars are seen sliding behind the planet. Cassini was moving around Saturn during the observation, keeping its gaze fixed on a particular spot on the planet, which causes a shift in the distant background over the course of the observation. Some of the stars seem to make a slight turn to the right just before disappearing. This effect is due to refraction -- the starlight gets bent as it passes through the atmosphere, which acts as a lens. Random bright specks and streaks appearing from frame to frame are due to charged particles and cosmic rays hitting the camera detector. The aim of this observation was to observe seasonal changes in the brightness of Saturn's auroras, and to compare with the simultaneous observations made by Cassini's infrared and ultraviolet imaging spectrometers. The original images in this movie sequence have a size of 256x256 pixels; both the original size and a version enlarged to 500x500 pixels are available here. The small image size is the result of a setting on the camera that allows for shorter exposure times than full-size (1024x1024 pixel) images. This enabled Cassini to take more frames in a short time and still capture enough photons from the auroras for them to be visible. The images were taken in visible light using the Cassini spacecraft narrow-angle camera on July 20, 2017, at a distance of about 620,000 miles (1 million kilometers) from Saturn. The views look toward 74 degrees south latitude on Saturn. Image scale is about 0.9 mile (1.4 kilometers) per pixel on Saturn. An animation is available at https://photojournal.jpl.nasa.gov/catalog/PIA21623
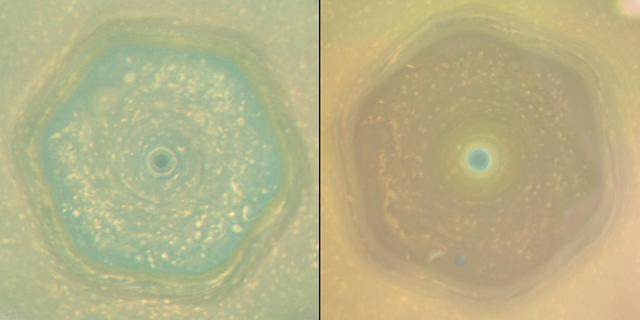
These natural color views from NASA's Cassini spacecraft compare the appearance of Saturn's north-polar region in June 2013 and April 2017. In both views, Saturn's polar hexagon dominates the scene. The comparison shows how clearly the color of the region changed in the interval between the two views, which represents the latter half of Saturn's northern hemisphere spring. In 2013, the entire interior of the hexagon appeared blue. By 2017, most of the hexagon's interior was covered in yellowish haze, and only the center of the polar vortex retained the blue color. The seasonal arrival of the sun's ultraviolet light triggers the formation of photochemical aerosols, leading to haze formation. The general yellowing of the polar region is believed to be caused by smog particles produced by increasing solar radiation shining on the polar region as Saturn approached the northern summer solstice on May 24, 2017. Scientists are considering several ideas to explain why the center of the polar vortex remains blue while the rest of the polar region has turned yellow. One idea is that, because the atmosphere in the vortex's interior is the last place in the northern hemisphere to be exposed to spring and summer sunlight, smog particles have not yet changed the color of the region. A second explanation hypothesizes that the polar vortex may have an internal circulation similar to hurricanes on Earth. If the Saturnian polar vortex indeed has an analogous structure to terrestrial hurricanes, the circulation should be downward in the eye of the vortex. The downward circulation should keep the atmosphere clear of the photochemical smog particles, and may explain the blue color. Images captured with Cassini's wide-angle camera using red, green and blue spectral filters were combined to create these natural-color views. The 2013 view (left in the combined view), was captured on June 25, 2013, when the spacecraft was about 430,000 miles (700,000 kilometers) away from Saturn. The original versions of these images, as sent by the spacecraft, have a size of 512 by 512 pixels and an image scale of about 52 miles (80 kilometers) per pixel; the images have been mapped in polar stereographic projection to the resolution of approximately 16 miles (25 kilometers) per pixel. The second and third frames in the animation were taken approximately 130 and 260 minutes after the first image. The 2017 sequence (right in the combined view) was captured on April 25, 2017, just before Cassini made its first dive between Saturn and its rings. During the imaging sequence, the spacecraft's distance from the center of the planet changed from 450,000 miles (725,000 kilometers) to 143,000 miles (230,000 kilometers). The original versions of these images, as sent by the spacecraft, have a size of 512 by 512 pixels. The resolution of the original images changed from about 52 miles (80 kilometers) per pixel at the beginning to about 9 miles (14 kilometers) per pixel at the end. The images have been mapped in polar stereographic projection to the resolution of approximately 16 miles (25 kilometers) per pixel. The average interval between the frames in the movie sequence is 230 minutes. Corresponding animated movie sequences are available at https://photojournal.jpl.nasa.gov/catalog/PIA21611 https://photojournal.jpl.nasa.gov/catalog/PIA21611
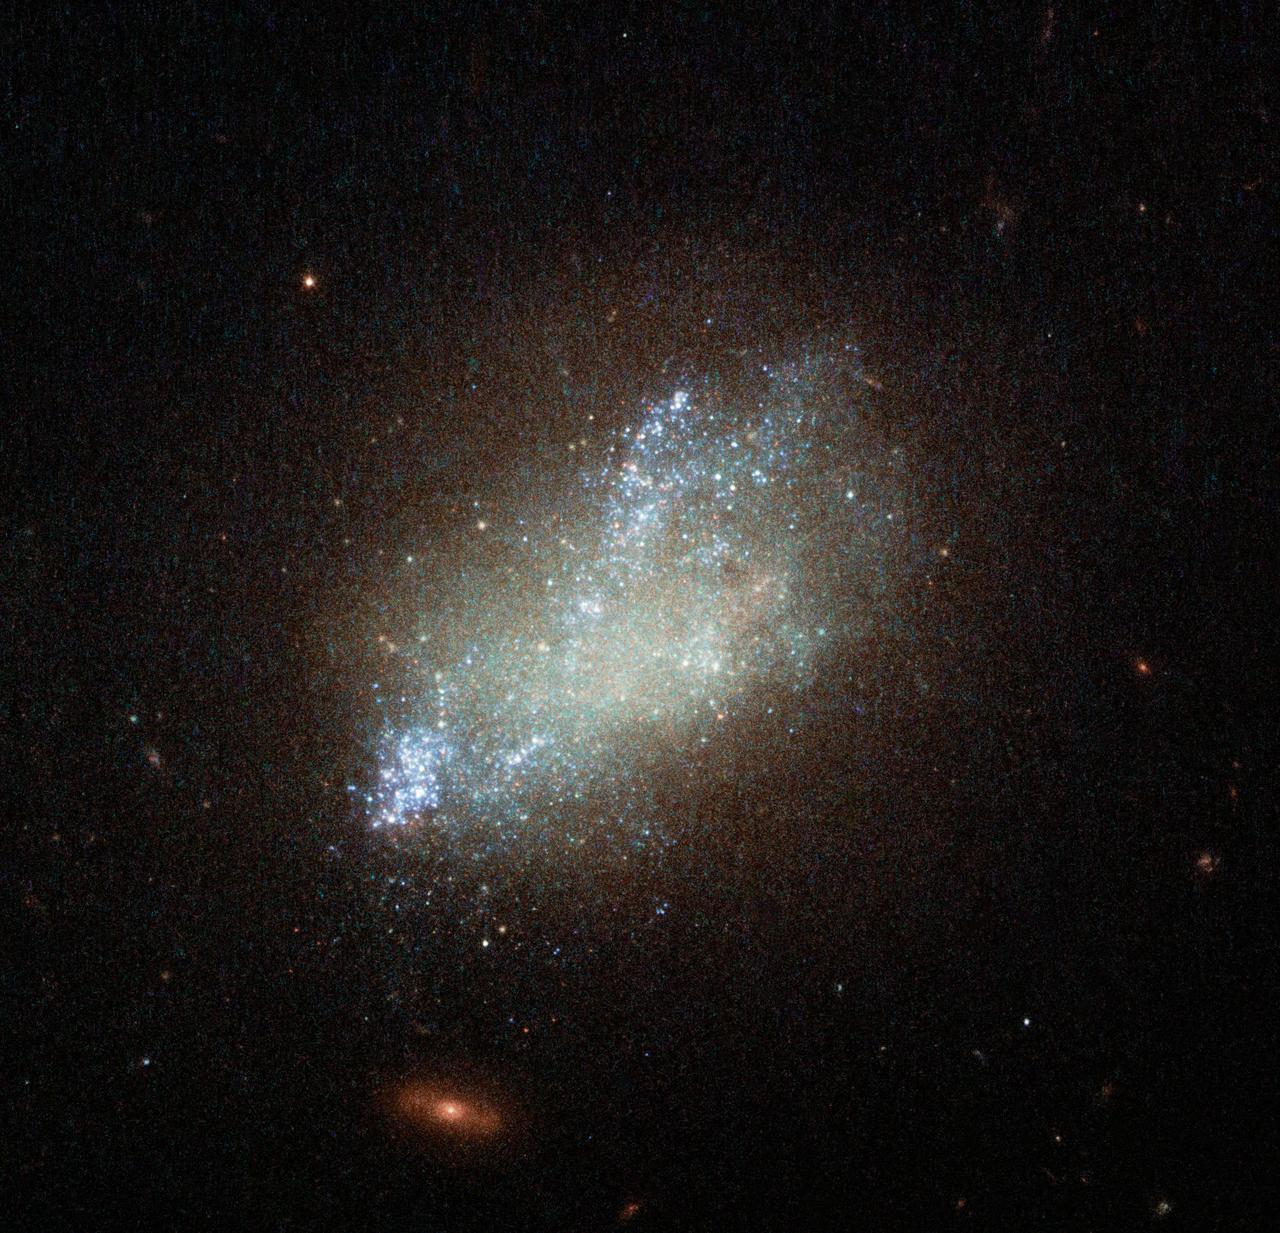
Far beyond the stars in the constellation of Leo (The Lion) is irregular galaxy IC 559. IC 559 is not your everyday galaxy. With its irregular shape and bright blue spattering of stars, it is a fascinating galactic anomaly. It may look like sparse cloud, but it is in fact full of gas and dust which is spawning new stars. Discovered in 1893, IC 559 lacks the symmetrical spiral appearance of some of its galactic peers and not does not conform to a regular shape. It is actually classified as a “type Sm” galaxy — an irregular galaxy with some evidence for a spiral structure. Irregular galaxies make up about a quarter of all known galaxies and do not fall into any of the regular classes of the Hubble sequence. Most of these uniquely shaped galaxies were not always so — IC 559 may have once been a conventional spiral galaxy that was then distorted and twisted by the gravity of a nearby cosmic companion. This image, captured by the NASA/ESA Hubble Space Telescope’s Wide Field Camera 3, combines a wide range of wavelengths spanning the ultraviolet, optical, and infrared parts of the spectrum. Image credit: ESA/Hubble, NASA, D. Calzetti (UMass) and the LEGUS Team <b><a href="http://www.nasa.gov/audience/formedia/features/MP_Photo_Guidelines.html" rel="nofollow">NASA image use policy.</a></b> <b><a href="http://www.nasa.gov/centers/goddard/home/index.html" rel="nofollow">NASA Goddard Space Flight Center</a></b> enables NASA’s mission through four scientific endeavors: Earth Science, Heliophysics, Solar System Exploration, and Astrophysics. Goddard plays a leading role in NASA’s accomplishments by contributing compelling scientific knowledge to advance the Agency’s mission. <b>Follow us on <a href="http://twitter.com/NASAGoddardPix" rel="nofollow">Twitter</a></b> <b>Like us on <a href="http://www.facebook.com/pages/Greenbelt-MD/NASA-Goddard/395013845897?ref=tsd" rel="nofollow">Facebook</a></b> <b>Find us on <a href="http://instagram.com/nasagoddard?vm=grid" rel="nofollow">Instagram</a></b>